Embed Size (px)
Citation preview

1
Reduction of income inequality and subjective well-being in Europe
Tamás Hajdu – Gábor Hajdu
Abstract
Using four waves of the European Social Survey (179,273 individuals from 29 countries), we
analyze the association of reduction of income inequality by governmental taxes and transfers
(redistribution) with subjective well-being. Our results provide evidence that people in Europe
are negatively affected by income inequality, whereas reduction of inequality has a positive
effect on well-being. Since we simultaneously estimate the effects of income inequality and
its reduction, our results might indicate that not only the outcome (inequality), but also the
procedure (redistribution) that leads to the outcome influences subjective well-being. We
propose four interpretations of the results. It is possible that living in a country where taxes
and transfers reduce income inequality to a greater extent, (1) the poor may feel more
protected, and (2) the rich may also feel more generous, which may result in an emotional
benefit for them. (3) The income inequality reduction variable might capture dimensions of
inequality other than income as well. (4) Well-being might be associated not only with actual,
but also with perceived inequality that is correlated with income inequality reduction. Our
results show that there is some heterogeneity in the effects. The positive effect of
redistribution seems to be stronger for less affluent members of the society and left-wing
oriented individuals. The effect of post-government inequality seems to be different in Eastern
and Western Europe: while income inequality has no significant effect in the West, its impact
negative and highly significant in the East.
JEL: D63, I31
Keywords: Subjective well-being; Satisfaction; Inequality; Redistribution; Inequality
reduction
Authors: Tamás Hajdu, Institute of Economics, Research Centre for Economic and Regional Studies of the Hungarian
Academy of Sciences, Hungary, [email protected]
Gábor Hajdu, Institute for Sociology, Centre for Social Sciences of the Hungarian Academy of Sciences,
Hungary; and HAS-ELTE Peripato Comparative Social Dynamics Research Group, Hungary,
Acknowledgement: We are grateful to Márton Medgyesi and Béla Janky for their detailed
comments. We thank Gábor Kézdi, as well as participants in the academic symposium of the
Institute for Sociology, Hungarian Academy of Sciences (Budapest, September 2013) for their
valuable suggestions. We also thank the comments of two anonymous reviewers and Jan
Fidrmuc, co-editor of the Economics. The remaining errors are solely ours.

2
1. Introduction
Inequality and redistribution are important topics in social sciences. Numerous studies have
examined the impact of income inequality on various adverse societal outcomes, and
concluded that inequality is positively associated with crime (Choe 2008; Fajnzylber et al.
2002; Scorzafave and Soares 2009) and working hours (Bowles and Park 2005), negatively
with health (Kaplan et al. 1996; Wilkinson and Pickett 2006), trust (Gustavsson and Jordahl
2008; Knack and Keefer 1997), political engagement (Horn 2011; Solt 2008, 2010) and
mobility (Corak 2013; Wilkinson and Pickett 2009).1 In the presence of upward social
comparison, greater inequality also means greater discrepancy between the aspirations and
actual incomes of less wealthy individuals, which imposes substantial psychological cost on
these people (Frank 2007).2
The relationship between these outcomes and subjective well-being (Dolan et al. 2008;
Frey and Stutzer 2002) predicts that income inequality should relate negatively to well-being.
Besides, inequality may also shape subjective well-being directly, not only through these
channels. Humans are social animals; we can empathize with other people’s misery, which
means that high inequality may reduce our happiness even without further societal effects.
Besides, the negative effect of inequality may result from the envy of the poor.3
Starting with Morawetz et al. (1977), inequality has been the topic of several empirical
papers. Studies using panel, time-series and within-country data document mostly negative
effects in Europe (Alesina et al. 2004; Ferrer-i-Carbonell and Ramos 2010; Grosfeld and
Senik 2010; Hagerty 2000; Schwarze and Härpfer 2007; Winkelmann and Winkelmann
2010), and in other non-European countries as well (Oishi et al. 2011; Oshio and Kobayashi
2010).4 Usually, people living in a more unequal environment seem to feel less happy.
5
Contrary to these results, using information from 85 countries between 1981 and 2008 Rözer
and Kraaykamp (2013) found that inequality increases well-being. However, the effect varies
with the sample: in Europe income inequality negatively affects well-being.
Determinants of preferences for redistribution are discussed in detail in the literature.
There are several factors that have been shown to play an important role: self-interest (income
and expected social mobility), risk-aversion (history of misfortune), altruism, culture and
ideology, social impact of inequality, acceptable level of inequality, and perception of fairness
(Alesina and Giuliano 2011; Alesina and La Ferrara 2005; Corneo and Grüner 2002; Fong
2001; Luttmer and Singhal 2011).
1 For a review, see Wilkinson and Pickett (2009, 2010).
2 In the social comparison literature range-frequency theory also predicts that increasing inequality affects well-
being negatively (Hagerty 2000) 3 However, a recent empirical paper found that the relationship between preference for a more equal society and
envy is very weak (Kemp and Bolle 2013). 4 Cross-sectional cross-country or pooled cross-sectional analyses without controlling for the cultural
background of countries are inconclusive. Berg and Veenhoven (2010) and Helliwell and Huang (2008) found a
positive association between income inequality and well-being, whereas in an analysis of European countries
Fahey and Smyth (2004) reported a negative relationship. 5 Note however, that the impact of income inequality may be different in some cases. In an unpredictable,
volatile environment inequality may be perceived as a signal of increased opportunities and may affect
satisfaction positively (Hirschman and Rotschild 1973). For empirical evidence from the Eastern European
transition, see Grossfeld and Senik (2010). They show that in the early transition period inequality was positively
associated with satisfaction in Poland, but after a couple of years the relationship became negative.

3
Although societal impacts of inequality, determinants of preferences for redistribution,
and the relationship between income inequality and subjective well-being are thoroughly
studied, there is little empirical evidence about the impact of inequality reduction
(redistribution)6 on well-being. Only one paper deals explicitly with the question whether the
reduction of inequality by taxes and transfers can undo this negative impact. Schwarze and
Härpfer (2007) studied how inequality and redistribution (reduction of inequality by the state)
is associated with subjective well-being in Germany. Using the German Socio-Economic
Panel they found that income inequality calculated on the regional-level has a negative effect
on individual life satisfaction, but redistribution is not a significant determinant of well-being.
Some redistribution-related issues were analyzed by other papers. Di Tella et al. (2003) and
Di Tella and MacCulloch (2008) estimate the effect of unemployment benefits (defined as the
income replacement rate) on subjective well-being. Although unemployment benefits are only
one component of redistribution, we can take it as a proxy variable of the reduction of
inequality. These papers show that a generous welfare state is positively correlated with
satisfaction. Oishi et al. (2012) using 54 countries from the Gallup World Poll have found that
progressive taxation is positively associated with a global-life-evaluation index.
In this paper we enrich the existing knowledge about the association of inequality
reduction by governmental taxes and transfers (redistribution) with subjective well-being. The
novelty of our paper is that it is the first to estimate the effect of inequality and the reduction
of inequality simultaneously, not limited to an individual country, but using data from several
European countries. The analysis is based on the first four waves of the European Social
Survey. We simultaneously analyze how inequality and redistribution affect life satisfaction.
Our results corroborate the findings of previous literature that – controlling for personal
characteristics of the respondents, GDP, unemployment and inflation rate, country fixed
effects and year fixed effects – people in Europe are negatively affected by income inequality,
whereas provide new evidence that inequality reduction has a positive impact on well-being.
Moreover, the simultaneously estimated effects of inequality and its reduction might indicate
that it is not only outcome (net income inequality) that influences subjective well-being but
also the procedure (redistribution) that leads to the outcome has a relevant impact. We
propose four theoretical interpretations of these empirical results. We suggest that the poor
may feel more protected, whereas the rich may feel more generous because of higher level of
inequality reduction by taxes and transfers, which may result in an emotional benefit for them.
It is also possible that not only actual but also perceived inequality is associated with well-
being. Another explanation might be that the reduction of income inequality correlates with
the generosity of the welfare services provided by the state, and the high level of our
redistribution variable might capture a low level of other dimensions of social inequality
possibly increasing life satisfaction.
However, according to our findings, there is some heterogeneity in the effects. In line
with the previous literature on determinants of preferences for redistribution, we find that the
positive effect of redistribution is stronger among less affluent members of the society, and
6 In this paper we regard ‘inequality reduction’ and ‘redistribution’ as identical. Unless noted otherwise,
‘redistribution’ and ‘inequality reduction’ refer to the reduction of income inequality by government tax and
transfer policies.

4
left-wingers. Income inequality has no significant effect in Western Europe, but its impact
negative and highly significant in Eastern Europe.
Our paper is structured as follows. The next section describes the data and the estimation
methods we used. Section 3 shows the estimation of regression models. Section 4 concludes.
2. Data and methods
Our main data source is the four waves of the European Social Survey (ESS). ESS is a
repeated cross-sectional survey from every other year. The first wave started in 2002, the
fourth wave was launched in 2008. We include in our analysis only those 29 countries that
participated in more than one round.7
Our analysis relies on a self-reported measure of well-being. In the ESS-questionnaire
everyone is asked the following single-item question: “All things considered, how satisfied
are you with your life as a whole nowadays?” They answer the question on an 11-point scale
(0 – extremely dissatisfied, 10 – extremely satisfied). This global life evaluation is our
dependent variable.
We estimate a linear relationship between inequality reduction and satisfaction, using the
following specification:
(1) icttcictct
N
ctctictPCIRS
3210
where ict
S is the life satisfaction of individual i, who lives in country c in time (wave) t. ct
R is
the measure of inequality reduction, N
ctI is post-government (net) income inequality,
ctC is the
vector of country-level variables, ict
P is the vector of personal characteristics of individual i.
We also include a country fixed effecti
and a wave fixed effectt
. Finally, the equation
includes the usual error term (ict
).
In line with the literature, this paper measures income inequality by the Gini coefficient.
The source of the inequality data is the Standardized World Income Inequality Database
(Version 3.0), which provides Gini indices of gross and net income inequality for more than
100 countries (Solt 2009). Data of gross and net income inequality allow us to calculate the
effect of government taxes and transfers on income inequality. This index of income
inequality reduction by governmental taxes and transfers is computed as the difference
between Gini indices based on gross and net incomes divided by gross income inequality:
(2) 100
G
ct
N
ct
G
ct
ctI
IIR
where ct
R is income inequality reduction by governmental taxes and transfers in country c in
time t (in percent), G
ctI is the pre-government (gross) income inequality and N
ctI is the post-
government (net) income inequality. The inequality reduction index shows the percentage
reduction in inequality by government tax and transfer policies. In other words, it measures
the extent of change in income distribution due to governmental taxes and money transfers. 7 The list of participating countries by ESS rounds is given in Table A1 in the Appendix.

5
This means that our inequality reduction variable captures policies that affect net income
distribution, but set aside redistribution related policies that do not change net income
inequality (e.g. in-kind transfers to the poor).
Since Gini indices are calculated on the basis of surveys, measurement error is inevitable.
If the variance of Gini indices and inequality reduction is mostly due to measurement errors
rather than actual change, then our estimates would be biased. We try to mitigate this bias by
calculating the trend values of the time series which capture long-term changes and set aside
short-term fluctuation (which is supposed to be primarily the result of the measurement
errors). Using inequality reduction and income inequality data for the last two decades, we
compute trend components of inequality and its reduction for every country with the Hodrick-
Prescott filter (Hodrick and Prescott 1997), and we merge these trend values to the country-
wave observations.8
The Gini index is highest in Russia, while lowest in Sweden and Denmark. The reduction
of inequality (redistribution) is high in the Scandinavian countries, Germany, and Austria and
low in Russia, Ukraine, and Bulgaria.9
Our other country-level right-hand side variables are the welfare of the states measured
by Gross Domestic Product, unemployment rate, and inflation. Data on GDP per capita come
from the World Bank (PPP, constant 2005 international $). In our analysis we use it in
logarithmic form because of the presumed declining marginal effect of income. Previous
research has highlighted that each doubling of GDP per capita is associated with a constant
increase in average well-being (Stevenson and Wolfers 2008, 2013). Data on unemployment
and inflation rate come from the World Bank as well.
The control variables in our baseline regression are the following: gender, age, age
squared, education (four categories), living with a partner, labor force status (seven
categories), subjective health status (five categories), domicile (four categories), household
size and equivalent household income. Since income comparison is an important determinant
of subjective well-being (Clark et al. 2008) and GDP per capita already captures the effect of
the society’s average income, we include equivalent household income as the percentage of
average equivalent household income in country c in time t. With this procedure we can
control for the relative income effect.
We exclude some countries from the fourth wave because of missing Gini indices10
, and
individuals with missing life satisfaction. The final sample contains 179,273 individuals and
94 country-time observations.
We estimate OLS regressions using ESS design weights for adjusting the unequal
inclusion probabilities within countries combined with another weight whose goal is to
transform every sample’s N equal. In this way each cross-sectional sample counts as the same
in the analysis. The standard error estimates are robust to heteroskedasticity and clustered at
the country-wave level.11
8 To extract the trend from the time series of inequality and redistribution, we used the Hodrick-Prescott filter
with a parameter value of 6.25 as proposed by Ravn and Uhlig (2002) for annual observations. 9 Table A2 in the Appendix provides descriptive statistics by country.
10 These countries are Austria, Switzerland and Ukraine.
11 Table A3 in the Appendix provides descriptive statistics of the main variables.

6
3. Results
Table 1 shows our baseline result. We find that redistribution and post-government income
inequality are significant determinants of satisfaction with life. As we expected, the
coefficient on inequality is negative: people in Europe dislike inequality. The coefficient on
inequality reduction has a positive sign: Inequality reducing governmental policies are
correlated positively with satisfaction. The size of the coefficients means that a 1 point
increase in inequality reduction is associated with a 0.051 point increase in well-being, while
a 1 percentage point increase in the Gini index results in a -0.036 point lower satisfaction. Or
in terms of per capita GDP change: a 1 percentage point increase in redistribution is
equivalent to a 2.7 percent increase in GDP, whereas a 1 point increase in the Gini index is
equivalent to a 3.8 percent decrease in GDP.12
Table 1: Income inequality, inequality reduction and life satisfaction
(1)
Inequality reduction 0.036***
(0.006)
Post-government income inequality -0.051***
(0.019)
Country-level controls yes
Individual-level controls yes
Country dummies yes
Wave dummies yes
Adjusted R2 0.281
N 179,273
Dependent variable: Life satisfaction. Robust standard errors adjusted for clustering by
country-wave are in parentheses. Country-level controls: ln(GDP), unemployment rate,
inflation. Individual-level controls: gender, age, age squared, education, marital status,
labor force status, health, domicile, household size, equivalent household income (as the
% of average income). Dummies are included for missing control variables. * p< 0.10,
** p < 0.05,
*** p < 0.01
It is worth emphasizing that inequality reduction (redistribution) has a significant
coefficient even controlling for income inequality. The first explanation for this result might
12
The estimated coefficient of income inequality in the previous literature is influenced by the well-being
measure and the sample as well, thus, most of these findings are not directly comparable with our result. Ferrer-i-
Carbonell and Ramos (2010) found that a 1 percentage point increase in the post-government Gini index results a
0.055 decrease in life satisfaction (on an 11-point scale) in Germany (1997-2007). Schwarze and Härpfer (2007)
found that a similar increase in the post-government Gini index is associated with a 0.036-0.048 lower life
satisfaction (on an 11-point scale) in West-Germany (1985-1998). According to Alesina et al. (2004) a 1
percentage point increase in the Gini index decreases the proportion of ‘‘very satisfied’’ people by 0.55
percentage point and increases the proportion ‘‘not very/at all satisfied’’ people by 0.53 percentage point in
Western Europe (1975-1992) (the third middle category was “fairly satisfied”). Oshio and Kobayashi (2011)
found that a one-standard-deviation (2.7 percentage points) increase in the Gini coefficient lower the odds of
being in the lowest happiness category (on a 3-point measure) by 8.4 percentage points, but does not influence
the odds of being in the highest happiness category in Japan (2000-2006).

7
be that it is not only the level of income inequality that matters, but also the process (the
extent of redistribution) may lead to the particular outcome (Frey et al. 2005; Frey and Stutzer
2004).13
As Frey and Stutzer (2005) state “people get utility from living and acting under
particular institutions over and above outcomes” (p. 92.). According to our results not only
post-government income inequality influences life satisfaction, but the difference between
pre- and post-government inequality (which is measured by our redistribution variable) also
matters. This variable might reflect the institutions and attitudes of the society. In accordance
with this, individuals (especially the poor) may feel more protected due to higher level of
inequality reduction by taxes and transfers; they may get the sense that the community will
help them in hardship, irrespective of the actual inequality. It is not necessary to recognize the
level of gross income inequality: probably solidarity and helping the poor is common talk in
such a society, which may generate these feelings. Moreover, envying the rich may be less
strong, thus trust among members of the society might be also higher.
Another possible explanation for the positive coefficient on redistribution is that it is not
– or not only – actual but also perceived income inequality is associated with well-being
(Oshio and Urakawa 2014). If perceived inequality is correlated negatively with the extent of
inequality reduction, then this relationship is reflected in the coefficient on redistribution.
Third, the higher the income inequality reduction the more generous the welfare services
provided by the state might be. Thus, high level of our redistribution variable might capture
low levels of other dimensions of social inequality or stronger safety net. If not only income
inequality but other dimensions of inequality are also associated with well-being, then this
effect is reflected by the positive coefficient on the redistribution variable.
Finally, another explanation relies on generosity and altruism. Recent studies
demonstrate that spending money on other people and charity is associated with higher well-
being (Aknin et al. 2013; Dunn et al. 2008). Even mandatory taxation for a good cause
activates reward-related brain regions (Harbaugh et al. 2007). These results suggest that
people may feel more generous because of a higher extent of redistribution, which may result
in an emotional benefit for them, even if the higher level of solidarity does not depend on
their decision.
Coefficients on individual control variables correspond with earlier findings.14
There is a
U-shaped relationship between age and satisfaction. Self-reported satisfaction is higher for
those with more education. The better people’s subjective health, the more likely they are to
be satisfied. Living in cities has a negative effect on satisfaction. Those who live with a
partner tend to feel more satisfied. We find the usual negative relationship between life
satisfaction and being unemployed, whereas students are more satisfied than people in paid
work. Women tend to report higher levels of well-being. Coefficients on equivalent household
income (as the percentage of average household income) and log GDP per capita are positive.
3.1. Robustness
In the next step we examine the robustness of the baseline result. Table 2 summarizes this
analysis. Column 1 and Column 2 check whether including less or more control variables
13
If the effect of inequality and redistribution is estimated separately, the size of the coefficients is only slightly
higher and their significance is unchanged. 14
The detailed baseline regression result is in Table A4 in the Appendix.

8
changes the coefficient on inequality reduction and inequality. In Column 1 we control only
for country and wave fixed effects. In Column 2 we add controls for disability status, social
capital (meeting with friends), feeling about household's income, religiousness, and minority
status. In Columns 3 we estimate ordered probit model rather than an OLS specification. In
Column 4 we restrict the sample to countries surveyed in at least three waves out of four (21
countries). Maybe redistribution and inequality need some time to have their full effect on
subjective well-being, because they do not work only directly but through many channels
(crime rate, trust, political engagement, etc.). To address this possibility, in Column 5
satisfaction in time t is regressed on inequality and its reduction in time t-1. Finally, we
weight the data using only design weights, which corrects for the different inclusion
probabilities of individuals, making the samples more representative (Column 6), and
combined design and population weights (Column 7). The latter weight ensures that every
country is represented in proportion to its population size. Both weights are provided in the
ESS dataset.
The overall conclusion of the models is that the association of inequality reduction with
life satisfaction is not altered by any of these sensitivity analyses. The coefficient on
inequality reduction is always positive and significant at the 1 percent level. On the other
hand, the estimated coefficient on income inequality is insignificant in one case and only
marginally significant in another one; nevertheless, its sign always remains negative.15
In
summary, robustness checks support the validity of our main results: we can conclude that
people in Europe are negatively affected by income inequality, while reduction of inequality
is associated with higher subjective well-being.
15
A composition effect may explain the insignificance of coefficient on inequality in Column 4: most Eastern
European countries are excluded from this sample because of participating in less than three waves. As we show
in the next section, inequality has a negative effect in Eastern but no effect in Western European countries.

9
Table 2: Income inequality, inequality reduction and life satisfaction, robustness analysis
(1) (2) (3) (4) (5) (6) (7)
Only wave and
country
dummies
More individual
controls Ordered probit
Only countries
participating at
least in three
waves
Lagged
inequality and
redistribution
Weighted by
design weights
Weighted by
design weights
× population
weights
Inequality reduction 0.045***
0.030***
0.018***
0.028***
0.031***
0.036***
0.037***
(0.011) (0.006) (0.003) (0.004) (0.005) (0.006) (0.008)
Post-government
income inequality -0.052
** -0.046
** -0.023
** -0.018 -0.036
*** -0.046
** -0.029
*
(0.026) (0.020) (0.009) (0.013) (0.012) (0.018) (0.016)
Adjusted R2 0.171 0.339 0.073
a 0.252 0.281 0.279 0.248
N 179,273 179,273 179,273 150,549 179,273 179,273 179,273
Dependent variable: Life satisfaction. Robust standard errors adjusted for clustering by country-wave are in parentheses. All regressions include the same control variables
(individual- and country-level controls, country dummies and wave dummies) as the baseline regression except Model 1 (only country dummies and wave dummies). More
controls: disability status, social capital, feeling about household's income, religiousness, minority status. Dummies are included for missing control variables. a Pseudo R
2
* p< 0.10,
** p < 0.05,
*** p < 0.01

10
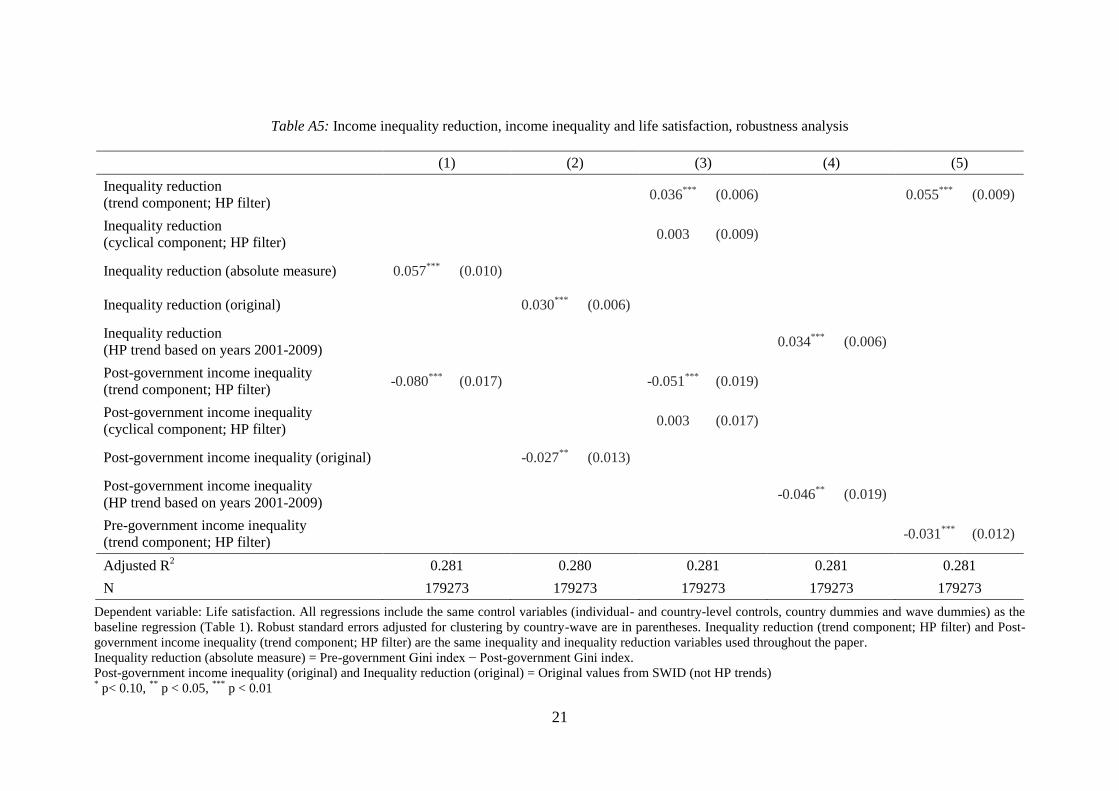
In the next step we examine the sensitivity of our results to the measures of income
inequality and income inequality reduction. Table A5 in the Appendix summarizes the results.
In Column 1 we use an absolute measure of income inequality reduction (the difference
between pre-government Gini index and post-government Gini index) instead of the
percentage change. We get the same qualitative results as in Table 1: inequality reduction is
associated positively, whereas income inequality is associated negatively with life
satisfaction. Column 2 shows the estimation where we use the original income inequality and
redistribution variables instead of the smoothed trend. Both variables are significant at the 5
percent level, but their size is somewhat lower than the coefficients in Table 1. This is
consistent with our expectations, since the “raw” variables are supposed to be measured with
considerable noise, thus, the estimated coefficients of these variables might be biased toward
zero. Column 3 includes not only the trend of income inequality and income inequality
reduction but the cyclical component (short term fluctuation) as well (computed with
Hodrick-Prescott filter). The result clearly shows that the effect of the cyclical component is
zero, but the effect of the trend variable remains unchanged. We think this finding indicate
that the cyclical component indeed contains the noise caused by the survey measurement of
Gini indices. Column 4 shows the result of the analysis where we compute trend component
of inequality and its reduction using data for the years 2001-2009 (instead of the years 1990-
2009). We can see that the estimated effects are slightly lower, but the main conclusion is not
altered. Finally, in Column 5 pre-government income inequality is included instead of post-
government income inequality. The coefficient of pre-government Gini index is negative and
significant.
In addition to the robustness tests above, we examine the inequality reduction –
satisfaction relationship on the country level (where observational units are countries, rather
than individuals). In the country-level analysis we are able to examine the relationship
between the change in average life satisfaction and the change in redistribution, income
inequality, log GDP per capita, unemployment rate, and inflation. We estimate first- and long-
differenced equations with OLS regression.16
Table 3 provides the regression results, where the effects of redistribution, income
inequality, and country-level controls are simultaneously taken into consideration. Column 1
shows the estimation of the first-difference regression without country dummies. Column 2
contains the estimation of the first-difference regression including country fixed effects to
allow for country-specific time trends. Column 3 presents the result of the long-difference
model. In the first-difference estimations, inequality seems negatively associated with life
satisfaction. The size of the coefficients is similar or higher (in absolute term) than the result
shown in Table 1, but some are statistically insignificant. Inequality reduction is associated
significantly positively with well-being in Column 1. In Column 2 the estimated coefficients
lost their significance, but the magnitude of the point estimates are noticeably higher than in
Column 1. They are insignificant due to the imprecise estimation (higher standard errors), but
it is not a surprise as the number of the estimated parameters are much higher than in Column
1 (because of inclusion of the country dummies).17
We interpret this result as suggesting that
16
In the long-differenced model the changes are calculated as the difference between the last and the first
observation of every country. 17
In this model we have 65 observations and 34 independent variables.

11
income inequality reduction has a positive and income inequality has a negative but
imprecisely estimated effect on life satisfaction. The estimations in Column 2 mean that a 1
percentage point increase in redistribution is equivalent to a 3.8 percent increase in GDP per
capita, while a 1 point increase in the Gini index is equivalent to a 6.1 percent decrease in
GDP per capita.18
In the long-difference model, inequality change has no effect on well-being,
but change in redistribution has a significant positive impact (Column 3).
Table 3: Income inequality, inequality reduction and life satisfaction, first and long differences
(1) (2) (3)
First diff. First diff. Long diff.
ΔInequality reduction 0.040***
0.068* 0.035
***
(0.010) (0.035) (0.008)
ΔPost-government income inequality -0.067**
-0.108 -0.032
(0.032) (0.102) (0.028)
Country-level controls yes yes yes
Country dummies yes
Adjusted R2 0.472 0.580 0.656
N 65 65 29
Dependent variable: ΔLife satisfaction. Robust standard errors are in parentheses. Country-level controls:
Δln(GDP), Δunemployment rate, Δinflation * p< 0.10,
** p < 0.05,
*** p < 0.01
3.2. Heterogeneity
Previous literature reports considerable heterogeneity in preference for redistribution and
inequality aversion. Inspired by these results, we are interested in the effect of inequality
reduction and income inequality among different subsamples and different types of
individuals. We presume that association between inequality reduction and satisfaction should
be stronger in some groups (Eastern Europe vs. other countries, richer vs. poorer individuals,
left-wingers vs. right-wingers, the formerly unemployed vs. the never unemployed). After
creating binary indicator variables for these groups, we analyze heterogeneity by regressing
life satisfaction on redistribution and income inequality interacted with the relevant indicator
variables. Each panel in Table 4 (from A to E) represents an OLS regression where the main
effects of inequality and inequality reduction are excluded, but their interaction terms with the
indicator variables are included.19
For example, in Panel A (Eastern Europe vs. other
countries) one set of interactions measures the effect of inequality and its reduction in post-
communist countries, and another set of interactions measures the effect of inequality and its
reduction in non-post-communist countries (four interactions altogether). In this way, we can
directly see the effect (and the significance) of redistribution and inequality among the
18
The estimated coefficient on the change of log GDP per capita is 1.809 in this specification (with country
dummies). 19
The regressions also include the baseline control variables and the relevant indicator variables.

12
examined groups of individuals. We also report the p-value on the test of equal
redistribution/inequality coefficients.20
Those living in post-communist countries are more likely to support the reduction of
income inequality (Alesina and Fuchs-Schündeln 2007; Corneo and Grüner 2002), so we can
conjecture that the effect of inequality and its reduction are stronger in former communist
countries. The dissimilar historical background might be able to explain these differences
(Alesina and Fuchs-Schündeln 2007). The decades of heavy state intervention might have a
long-lasting impact on preferences: people in Eastern Europe may consider redistribution as
more favorable and prefer a more equal society. An alternative explanation could rely on the
different perceptions of opportunities. If individuals in post-communist countries believe that
existing income inequalities are not caused by effort and hard work but rather by luck or
connections, then they “suffer” more from inequality. Panel A shows that income inequality is
not a significant determinant of well-being in Western European countries, whereas its effect
is strong in Eastern Europe. The coefficient on inequality reduction in post-communist
countries is almost twice as high as in other countries, but this difference just barely fails to be
significant at the 10 percent level.
Napier and Jost (2008) present evidence that conservatives are happier than liberals
partly because of their greater tolerance of inequality. Alesina et al. (2004) report that
inequality has a more negative effect on the happiness of European leftists. In line with these
papers, we find that the effect of redistribution is considerably weaker among individuals with
right-wing orientation. On the contrary, the estimated coefficient on income inequality is
statistically equal among individuals with left-wing and right-wing orientation (Panel B).21
20
The difference between the two coefficients is identical to the coefficient on the interaction term that would be
estimated if the main effect (e.g. inequality reduction) and an interaction term (e.g. inequality reduction
interacted with Eastern Europe in Panel A) would be included in the model. The p-value is identical to the p-
value on the interaction term in such a model. 21
We consider as a left-wing oriented individual who on an 11-point left-right scale denotes value 0-4, and as a
right-wing oriented individual who denotes value 6-10. Individuals choosing value 5 are coded as central
orientation. In the regression beside the reported interactions we also include the interaction of
inequality/inequality reduction with this central orientation dummy. It turns out that centrist individuals are
affected by inequality and redistribution more than right-wingers, but less than left-wingers.

13
Table 4: Income inequality, inequality reduction and life satisfaction, heterogeneity
Inequality
reduction
Post-gov. income
inequality
Adjusted
R2
N
A)
Eastern Europe 0.051***
-0.075***
0.281 179,273
(0.014) (0.024)
Western Europe 0.027***
-0.020
(0.006) (0.020)
p-value on test of equal coefficients 0.101 0.125
B)
Left-wing orientation 0.037***
-0.060***
0.285 179,273
(0.006) (0.021)
Right-wing orientation 0.030***
-0.049**
(0.006) (0.020)
p-value on test of equal coefficients 0.044 0.254
C)
Richer than country average 0.032***
-0.052**
0.282 179,273
(0.007) (0.021)
Poorer than country average 0.040***
-0.056***
(0.006) (0.018)
p-value on test of equal coefficients 0.018 0.627
D)
Lives comfortably 0.029***
-0.049**
0.293 179,273
(0.007) (0.020)
Does not live comfortably 0.037***
-0.052***
(0.006) (0.018)
p-value on test of equal coefficients 0.059 0.751
E)
Has experienced unemployment 0.040***
-0.053***
0.285 179,273
(0.007) (0.018)
Did not experience unemployment 0.037***
-0.053***
(0.007) (0.019)
p-value on test of equal coefficients 0.287 0.972
Dependent variable: Life satisfaction. Robust standard errors adjusted for clustering by country-wave are in
parentheses. All regressions include the same control variables (individual- and country-level controls, country
dummies and wave dummies) as the baseline regression, plus the relevant indicator variables and their
interactions with inequality and redistribution. * p< 0.10,
** p < 0.05,
*** p < 0.01

14
Self-interest naturally influences preference for redistribution: wealthier individuals
support less redistribution (Alesina and Giuliano 2011; Alesina and La Ferrara 2005; Molnár
and Kapitány 2006; Rainer and Siedler 2008) and are more likely to be unaffected by
inequality (Alesina et al. 2004; Oishi et al. 2011). In Panel C we see that those with above
average household incomes gain smaller satisfaction from inequality reduction than
individuals with below average household incomes, whereas the estimated coefficients on
inequality are not different statistically between the two groups. On the other hand, it is not
only actual income (or income rank) that influences how people react to inequality and
redistribution, but perceived income matters as well (Cruces et al. 2013). In Panel D we
measure individuals’ material welfare with a subjective indicator: Do they feel that their
family lives comfortably on their present income? These estimates show that inequality
reduction has a weaker effect on respondents who said that they live comfortably on their
present income than on those with lower standards of living, whereas we cannot reject the
hypothesis of equal income inequality coefficients. The positive coefficients on inequality
reduction in Panel C and Panel D are in line with the hypothesis that the poor might feel more
protected and the rich might feel more generous when inequality reduction happens to be
higher.
There is evidence that people with previous misfortune are more favorable to
redistribution (Alesina and Giuliano 2011; Alesina and La Ferrara 2005). As noted by e.g.
Alesina and La Ferrara (2005) the experience of unemployment may increase risk aversion or
lead to sympathizing with poorer members of society, which means that inequality and
redistribution should have a more considerable effect on individuals with such experiences.
Panel E shows, however, individuals who have ever been unemployed for a period of more
than three months are equally affected by inequality and inequality reduction, compared to
those without such unemployment experience.
4. Conclusion
The objective of this paper has been to examine the association of income inequality and its
reduction by government taxes and transfers (redistribution) with individual’s subjective well-
being. Using 1-4 waves of the European Social Survey (2002-2009), we have estimated the
association of inequality and inequality reduction with life satisfaction. Our results are in line
with the former evidence that income inequality is negatively related to well-being. The
novelty of our analysis is the clear evidence that income inequality reduction has a positive
effect on individual life satisfaction. This result contradicts the findings of Schwarze and
Härpfer (2007), who found no relationship between regional-level redistribution and
individual’s well-being in Germany. This discrepancy might be caused by the different
samples and the differences of the measurement-level of the Gini index and redistribution.
Previous papers on preference for redistribution and inequality aversion predict that the
effect of inequality and its reduction is different in post-communist and in non-post-
communist countries. Our results show that income inequality is not a significant determinant
of well-being in Western European countries, whereas its effect is strong in Eastern Europe.
Political orientation and self-interest seems to moderate the effect the inequality reduction:

15
poorer members of society and left-wing oriented individuals seem to be more affected by
inequality reduction.
Since we have simultaneously estimated the effects of inequality and its reduction, our
results suggest that subjective well-being is influenced not only by the outcome (income
inequality), but also by the procedure (redistribution) leading to the outcome. Individuals
(especially the poor) may feel more protected because of higher level of inequality reduction
by taxes and transfers; they may get the sense that the community will help them in hardship,
irrespective of the actual inequality. We have listed three other hypotheses to explain this
result. It is possible that it is not (or not only) actual but also perceived income inequality is
associated with well-being. If perceived inequality is negatively correlated with extent of
redistribution, then this relationship might be reflected in the positive coefficient on inequality
reduction. A positive correlation between inequality reduction and the generosity of the
welfare services provided by the state might mean that high level of our redistribution
variable might capture low level of other dimensions of social inequality. This could increase
life satisfaction. Finally, people may also feel themselves more generous because of a higher
extent of inequality reduction, which may result emotional benefit for them. Further
researches are needed to verify or falsify these explanations.

16
Appendix
Table A1: Countries in the analysis by ESS round
Country Round 1 Round 2 Round 3 Round 4
Austria x x x
Belgium x x x x
Bulgaria x x
Switzerland x x x
Cyprus x x
Czech Republic x x x
Germany x x x x
Denmark x x x x
Estonia x x x
Spain x x x x
Finland x x x x
France x x x x
United Kingdom x x x x
Greece x x x
Hungary x x x x
Ireland x x x x
Italy x x
Luxembourg x x
Latvia x x
Netherlands x x x x
Norway x x x x
Poland x x x x
Portugal x x x x
Romania x x
Russia x x
Sweden x x x x
Slovenia x x x x
Slovakia x x x
Ukraine x x

17
Table A2: Countries in the analysis by ESS round
Country Number of
waves Mean LSF Mean GINI
Mean
REDIST Min LSF Min GINI
Min
REDIST Max LSF Max GINI
Max
REDIST
Austria 3 7.59 26.67 45.44 7.50 26.57 44.97 7.64 26.73 45.71
Belgium 4 7.39 25.92 33.40 7.27 25.52 32.76 7.44 26.56 34.86
Bulgaria 2 4.56 31.12 13.04 4.41 29.30 12.88 4.70 32.95 13.21
Cyprus 2 7.27 29.00 38.38 7.08 28.82 38.38 7.46 29.18 38.38
Czech Republic 3 6.54 25.31 29.18 6.45 25.27 27.04 6.65 25.39 30.68
Denmark 4 8.47 23.66 50.31 8.44 22.62 50.17 8.52 24.95 50.67
Estonia 3 6.15 33.08 31.60 5.89 32.02 30.81 6.38 34.12 32.16
Finland 4 7.96 25.66 47.06 7.91 25.04 46.41 8.00 26.20 47.47
France 4 6.41 27.78 31.33 6.35 27.57 30.29 6.44 28.02 32.44
Germany 4 6.88 28.53 46.53 6.79 27.60 46.33 6.96 29.73 46.68
Greece 3 6.27 33.44 21.55 6.06 33.36 14.54 6.42 33.58 27.09
Hungary 4 5.50 28.03 36.25 5.29 27.52 30.93 5.69 28.30 41.07
Ireland 4 7.45 31.13 22.34 7.12 30.89 21.71 7.72 31.26 22.70
Italy 2 6.71 33.77 24.16 6.51 33.77 24.08 6.91 33.77 24.23
Latvia 2 5.97 37.67 28.41 5.88 37.49 28.04 6.06 37.84 28.78
Luxembourg 2 7.78 27.19 35.99 7.73 27.12 35.78 7.83 27.27 36.20
Netherlands 4 7.63 27.30 36.01 7.55 26.51 35.70 7.69 27.85 36.57
Norway 4 7.77 24.82 46.43 7.66 24.28 46.30 7.89 25.19 46.53
Poland 4 6.41 30.32 30.33 5.85 29.75 27.29 6.87 30.73 31.79
Portugal 4 5.71 36.44 38.55 5.52 36.17 36.76 5.91 36.71 39.92
Romania 2 6.00 31.96 33.44 5.85 30.83 33.28 6.14 33.09 33.60
Russian Federation 2 5.36 45.72 5.57 5.25 45.24 5.03 5.47 46.21 6.11
Slovak Republic 3 6.06 24.24 30.29 5.58 22.95 28.27 6.51 25.49 32.80

18
Country Number of
waves Mean LSF Mean GINI
Mean
REDIST Min LSF Min GINI
Min
REDIST Max LSF Max GINI
Max
REDIST
Slovenia 4 6.84 24.83 27.65 6.57 24.62 27.38 6.97 25.22 27.94
Spain 4 7.24 31.78 16.42 7.08 31.20 14.06 7.44 32.61 17.90
Sweden 4 7.83 23.46 48.34 7.80 23.30 47.85 7.86 23.62 48.63
Switzerland 3 8.06 28.48 37.02 8.01 27.60 35.59 8.10 29.35 38.17
Ukraine 2 4.41 34.34 11.08 4.39 33.98 10.27 4.44 34.70 11.89
United Kingdom 4 7.12 34.91 27.31 7.07 34.40 25.97 7.23 35.66 28.31
LSF: Life Satisfaction, GINI: Post-government income inequality, REDIST: Inequality reduction

19
Table A3: Summary statistics
Variable N Mean SD Min Max
Life satisfaction 179,273 6.9 2.3 0 10
Inequality reduction 179,273 33.2 10.9 5.0 50.7
Post-government income inequality 179,273 29.3 4.6 22.6 46.2
Ln(GDP) 179,273 10.1 0.4 8.6 11.1
Unemployment rate 179,273 7.26 3.38 2.60 19.90
Inflation 179,273 3.29 2.73 -4.48 14.11
Age 178,208 46.0 18.2 15 100
Female 179,044 0.47 0.50 0 1
Equivalent household income percentage of the
average income) 140,725 1.00 0.95 0.01 52.73
Household size 179,099 3.03 1.45 1 8
Education: ISCED 0-1 178,337 0.14 0.34 0 1
Education: ISCED 2 178,337 0.20 0.40 0 1
Education: ISCED 3-4 178,337 0.42 0.49 0 1
Education: ISCED 5-6 178,337 0.24 0.43 0 1
Main activity: paid work 178,094 0.51 0.50 0 1
Main activity: education 178,094 0.10 0.29 0 1
Main activity: unemployed, looking for a job 178,094 0.03 0.18 0 1
Main activity: unemployed, not looking for a job 178,094 0.02 0.13 0 1
Main activity: retired 178,094 0.21 0.41 0 1
Main activity: housework, looking after children 178,094 0.10 0.30 0 1
Main activity: other 178,094 0.04 0.19 0 1
Health: very good 179,079 0.22 0.42 0 1
Health: good 179,079 0.43 0.49 0 1
Health: fair 179,079 0.26 0.44 0 1
Health: bad 179,079 0.07 0.25 0 1
Health: very bad 179,079 0.01 0.12 0 1
Living with a partner 177,873 0.63 0.48 0 1
Big city 178,689 0.19 0.40 0 1
Suburbs or outskirts of big city 178,689 0.12 0.32 0 1
Town or small city 178,689 0.30 0.46 0 1
Village 178,689 0.39 0.49 0 1

20
Table A4: Income inequality, inequality reduction and life satisfaction, detailed results
Coefficient SE
Inequality reduction 0.036***
(0.006)
Post-government income inequality -0.051***
(0.019)
Ln(GDP per capita) 1.385***
(0.362)
Unemployment rate -0.020* (0.010)
Inflation -0.011 (0.008)
Age -0.066***
(0.004)
Age squared/100 0.072***
(0.004)
Female -0.136***
(0.013)
Education: ISCED 2 0.075**
(0.034)
Education: ISCED 3-4 0.116***
(0.036)
Education: ISCED 5-6 0.269***
(0.046)
Main activity: education 0.312***
(0.035)
Main activity: unemployed, looking for job -1.075***
(0.051)
Main activity: unemployed, not looking for job -0.778***
(0.066)
Main activity: retired 0.124***
(0.024)
Main activity: housework, looking after children -0.003 (0.025)
Main activity: other -0.190***
(0.034)
Living with partner 0.499***
(0.019)
Health: very good 3.172***
(0.078)
Health: good 2.681***
(0.072)
Health: fair 2.006***
(0.067)
Health: bad 1.034***
(0.070)
Big city -0.134***
(0.026)
Suburbs or outskirts of big city -0.151***
(0.022)
Town or small city -0.093***
(0.017)
Equivalent household income (% of the average
income) 0.170
*** (0.019)
Household size 0.027***
(0.007)
Country dummies Yes
Wave dummies Yes
Adjusted R2 0.281
N 179,273
Dependent variable: Life satisfaction. Robust standard errors adjusted for clustering by country-
wave are in parentheses. Dummies are included for missing control variables. Reference
categories: Education level: ISCED 0-1, Main activity: paid work, Health: very bad, Domicile:
village/farm or home in countryside. * p< 0.10,
** p < 0.05,
*** p < 0.01
21
Table A5: Income inequality reduction, income inequality and life satisfaction, robustness analysis
(1) (2) (3) (4) (5)
Inequality reduction
(trend component; HP filter) 0.036
*** (0.006) 0.055
*** (0.009)
Inequality reduction
(cyclical component; HP filter) 0.003 (0.009)
Inequality reduction (absolute measure) 0.057***
(0.010)
Inequality reduction (original) 0.030***
(0.006)
Inequality reduction
(HP trend based on years 2001-2009) 0.034
*** (0.006)
Post-government income inequality
(trend component; HP filter) -0.080
*** (0.017) -0.051
*** (0.019)
Post-government income inequality
(cyclical component; HP filter) 0.003 (0.017)
Post-government income inequality (original) -0.027**
(0.013)
Post-government income inequality
(HP trend based on years 2001-2009) -0.046
** (0.019)
Pre-government income inequality
(trend component; HP filter) -0.031
*** (0.012)
Adjusted R2 0.281 0.280 0.281 0.281 0.281
N 179273 179273 179273 179273 179273
Dependent variable: Life satisfaction. All regressions include the same control variables (individual- and country-level controls, country dummies and wave dummies) as the
baseline regression (Table 1). Robust standard errors adjusted for clustering by country-wave are in parentheses. Inequality reduction (trend component; HP filter) and Post-
government income inequality (trend component; HP filter) are the same inequality and inequality reduction variables used throughout the paper.
Inequality reduction (absolute measure) = Pre-government Gini index − Post-government Gini index.
Post-government income inequality (original) and Inequality reduction (original) = Original values from SWID (not HP trends) * p< 0.10,
** p < 0.05,
*** p < 0.01

22
References
Aknin, L. B., Barrington-Leigh, C. P., Dunn, E. W., Helliwell, J. F., Biswas-Diener, R.,
Kemeza, I., et al. (2013). Prosocial spending and well-being: Cross-cultural evidence
for a psychological universal. Journal of Personality and Social Psychology, 104(4),
635-652. http://psycnet.apa.org/psycinfo/2013-04859-001/
Alesina, A., Di Tella, R., & MacCulloch, R. (2004). Inequality and happiness: are Europeans
and Americans different? Journal of Public Economics, 88(9-10), 2009-2042.
http://www.sciencedirect.com/science/article/pii/S0047272703000756
Alesina, A., & Fuchs-Schündeln, N. (2007). Good-Bye Lenin (or not?): The effect of
communism on people’s preferences. American Economic Review, 97(4), 1507-1528.
http://www.aeaweb.org/articles.php?doi=10.1257/aer.97.4.1507
Alesina, A., & Giuliano, P. (2011). Preferences for Redistribution. In J. Benhabib, A. Bisin, &
M. O. Jackson (Eds.), Handbook of Social Economics (Vol. 1A, pp. 93-131): North-
Holland.
Alesina, A., & La Ferrara, E. (2005). Preferences for redistribution in the land of
opportunities. Journal of Public Economics, 89(5-6), 897-931.
http://www.sciencedirect.com/science/article/pii/S0047272704000866
Berg, M., & Veenhoven, R. (2010). Income inequality and happiness in 119 nations: In search
for an optimum that does not appear to exist. In B. Greve (Ed.), Happiness and Social
Policy in Europe (pp. 174-194). Cheltenham: Edward Elgar.
Bowles, S., & Park, Y. (2005). Emulation, inequality, and Work Hours: Was Thorsten Veblen
right? Economic Journal, 115(507), F397–F412.
http://onlinelibrary.wiley.com/doi/10.1111/j.1468-0297.2005.01042.x/abstract
Choe, J. (2008). Income inequality and crime in the United States. Economics Letters, 101(1),
31-33. http://www.sciencedirect.com/science/article/pii/S0165176508001110
Clark, A. E., Frijters, P., & Shields, M. A. (2008). Relative income, happiness, and utility: An
explanation for the Easterlin paradox and other puzzles. Journal of Economic
Literature, 46(1), 95-144.
http://www.aeaweb.org/articles.php?doi=10.1257/jel.46.1.95
Corak, M. (2013). Income Inequality, Equality of Opportunity, and Intergenerational
Mobility. Journal of Economic Perspectives, 27(3), 79-102.
http://www.ingentaconnect.com/content/aea/jep/2013/00000027/00000003/art00006
Corneo, G., & Grüner, H. P. (2002). Individual preferences for political redistribution.
Journal of Public Economics, 83(1), 83-107.
http://www.sciencedirect.com/science/article/pii/S0047272700001729
Cruces, G., Perez-Truglia, R., & Tetaz, M. (2013). Biased perceptions of income distribution
and preferences for redistribution: Evidence from a survey experiment. Journal of
Public Economics, 98, 100-112.
http://www.sciencedirect.com/science/article/pii/S004727271200117X
Di Tella, R., & MacCulloch, R. (2008). Gross national happiness as an answer to the Easterlin
Paradox? Journal of Development Economics, 86(1), 22-42.
http://www.sciencedirect.com/science/article/pii/S0304387807000600
Di Tella, R., MacCulloch, R. J., & Oswald, A. J. (2003). The Macroeconomics of Happiness.
Review of Economics and Statistics, 85(4), 809-827.
http://www.mitpressjournals.org/doi/abs/10.1162/003465303772815745

23
Dolan, P., Peasgood, T., & White, M. (2008). Do we really know what makes us happy? A
review of the economic literature on the factors associated with subjective well-being.
Journal of Economic Psychology, 29(1), 94-122.
http://www.sciencedirect.com/science/article/pii/S0167487007000694
Dunn, E. W., Aknin, L. B., & Norton, M. I. (2008). Spending money on others promotes
happiness. Science, 319(5870), 1687-1688.
http://www.sciencemag.org/content/319/5870/1687
Fahey, T., & Smyth, E. (2004). Do subjective indicators measure welfare? Evidence from 33
European societies. European Societies, 6(1), 5-27.
http://www.tandfonline.com/doi/abs/10.1080/1461669032000176297
Fajnzylber, P., Lederman, D., & Loayza, N. (2002). Inequality and Violent Crime. Journal of
Law and Economics, 45(1), 1-39. http://www.jstor.org/stable/10.1086/338347
Ferrer-i-Carbonell, A., & Ramos, X. (2010). Inequality Aversion and Risk Attitudes. IZA
Discussion Paper 4703. ftp://ftp.iza.org/RePEc/Discussionpaper/dp4703.pdf
Fong, C. (2001). Social preferences, self-interest, and the demand for redistribution. Journal
of Public Economics, 82(2), 225-246.
http://www.sciencedirect.com/science/article/pii/S0047272700001419
Frank, R. H. (2007). Falling Behind: How Rising Inequality Harms the Middle Class.
Berkeley and Los Angeles: University of California Press.
Frey, B. S., Benz, M., & Stutzer, A. (2005). Introducing procedural utility - Not only what,
but also how matters. Journal of Institutional and Theoretical Economics, 160(3),
377-401. http://dx.doi.org/10.1628/0932456041960560
Frey, B. S., & Stutzer, A. (2002). Happiness and Economics: How the economy and
institutions affect well-being. Princeton and Oxford: Princeton University Press.
Frey, B. S., & Stutzer, A. (2004). Beyond outcomes: measuring procedural utility. Oxford
Economic Papers, 57(1), 90-111. http://oep.oxfordjournals.org/content/57/1/90
Grosfeld, I., & Senik, C. (2010). The emerging aversion to inequality. Economics of
Transition, 18(1), 1-26.
http://onlinelibrary.wiley.com/doi/10.1111/j.1468-0351.2009.00376.x/abstract
Gustavsson, M., & Jordahl, H. (2008). Inequality and trust in Sweden: Some inequalities are
more harmful than others. Journal of Public Economics, 92(1-2), 348-365.
http://www.sciencedirect.com/science/article/pii/S0047272707001016
Hagerty, M. R. (2000). Social comparisons of income in one's community: Evidence from
national surveys of income and happiness. Journal of Personality and Social
Psychology, 78(4), 764-771.
http://psycnet.apa.org/index.cfm?fa=buy.optionToBuy&uid=2000-08135-011
Harbaugh, W. T., Mayr, U., & Burghart, D. R. (2007). Neural responses to taxation and
voluntary giving reveal motives for charitable donations. Science, 316(5831), 1622-
1625. http://www.sciencemag.org/content/316/5831/1622
Helliwell, J. F., & Huang, H. (2008). How’s your government? International evidence linking
good government and well-being. British Journal of Political Science, 38(4), 595-619.
http://journals.cambridge.org/action/displayAbstract?fromPage=online&aid=1887456
Hirschman, A. O., & Rotschild, M. (1973). The Changing Tolerance for Income Inequality in
the Course of Economic Development. Quarterly Journal of Economics, 87(4), 544-
566. http://qje.oxfordjournals.org/content/87/4/544.short
Hodrick, R. J., & Prescott, E. C. (1997). Postwar US business cycles: An empirical
investigation. Journal of Money, Credit and Banking, 29(1), 1-16.
doi:10.2307/2953682

24
Horn, D. (2011). Income inequality and voter turnout - evidence from European national
elections. Amsterdam, AIAS, GINI Discussion Paper 16.
http://www.uva-aias.net/uploaded_files/publications/DP16-Horn.pdf
Kaplan, G. A., Pamuk, E. R., WLynch, J., Cohen, R. D., & Balfour, J. L. (1996). Inequality in
income and mortality in the United States: analysis of mortality and potential
pathways. British Medical Journal, 312(7037), 999-1003.
http://www.bmj.com/content/312/7037/999
Kemp, S., & Bolle, F. (2013). Are egalitarian preferences based on envy? The Journal of
Socio-Economics, 45, 57-63, doi:10.1016/j.socec.2013.04.006.
Knack, S., & Keefer, P. (1997). Does Social Capital Have an Economic Payoff? A Cross-
Country Investigation. Quarterly Journal of Economics, 112(4), 1251-1288.
http://qje.oxfordjournals.org/content/112/4/1251.abstract
Luttmer, E. F. P., & Singhal, M. (2011). Culture, Context, and the Taste for Redistribution.
American Economic Journal: Economic Policy, 3(1), 157-179,
doi:10.1257/pol.3.1.157.
Molnár, Gy., & Kapitány, Zs. (2006). Uncertainty and the demand for redistribution. IEHAS
Discussion Papers 2006/8. http://econ.core.hu/doc/dp/dp/mtdp0608.pdf
Morawetz, D., Atia, E., Bin-Nun, G., Felous, L., Gariplerden, Y., Harris, E., et al. (1977).
Income Distribution and Self-Rated Happiness: Some Empirical Evidence. Economic
Journal, 87(347), 511-522. http://www.jstor.org/discover/10.2307/2231556
Napier, J. L., & Jost, J. T. (2008). Why are conservatives happier than liberals? Psychological
Science, 19(6), 565-572. http://pss.sagepub.com/content/19/6/565
Oishi, S., Kesebir, S., & Diener, E. (2011). Income Inequality and Happiness. Psychological
Science, 22(9), 1095-1100. http://pss.sagepub.com/content/22/9/1095
Oishi, S., Schimmack, U., & Diener, E. (2012). Progressive Taxation and the Subjective
Well-Being of Nations. Psychological Science, 23(1), 86-92.
http://pss.sagepub.com/content/23/1/86
Oshio, T., & Kobayashi, M. (2010). Area-Level Income Inequality and Individual Happiness:
Evidence from Japan. Journal of Happiness Studies, 12(4), 633-649,
doi:10.1007/s10902-010-9220-z.
Oshio, T., & Urakawa, K. (2014). The Association Between Perceived Income Inequality and
Subjective Well-being: Evidence from a Social Survey in Japan. Social Indicators
Research, 116(3), 755-770, doi:10.1007/s11205-013-0323-x.
Rainer, H., & Siedler, T. (2008). Subjective income and employment expectations and
preferences for redistribution. Economics Letters, 99(3), 449-453.
http://www.sciencedirect.com/science/article/pii/S0165176507003369
Ravn, M. O., & Uhlig, H. (2002). On adjusting the Hodrick–Prescott filter for the frequency
of observations. Review of Economics and Statistics, 84(2), 371-376.
doi:10.1162/003465302317411604
Rözer, J., & Kraaykamp, G. (2013). Income Inequality and Subjective Well-being: A Cross-
National Study on the Conditional Effects of Individual and National Characteristics.
Social Indicators Research, 113(3), 1009-1023.
http://link.springer.com/article/10.1007%2Fs11205-012-0124-7
Schwarze, J., & Härpfer, M. (2007). Are people inequality averse, and do they prefer
redistribution by the state?: Evidence from German longitudinal data on life
satisfaction. Journal of Socio-Economics, 36(2), 233-249.
http://www.sciencedirect.com/science/article/pii/S1053535705001812
Scorzafave, L. G., & Soares, M. K. (2009). Income inequality and pecuniary crimes.
Economics Letters, 104(1), 40-42.
http://www.sciencedirect.com/science/article/pii/S0165176509001049

25
Solt, F. (2008). Economic inequality and democratic political engagement. American Journal
of Political Science, 52(1), 48–60. http://onlinelibrary.wiley.com/doi/10.1111/j.1540-
5907.2007.00298.x/abstract
Solt, F. (2009). Standardizing the World Income Inequality Database. Social Science
Quarterly, 90(2), 231-242.
http://onlinelibrary.wiley.com/doi/10.1111/j.1540-6237.2009.00614.x/abstract
Solt, F. (2010). Does economic inequality depress electoral participation? Testing the
Schattschneider hypothesis. Political Behavior, 32(2), 285-301, doi:10.1007/s11109-
010-9106-0.
Stevenson, B., & Wolfers, J. (2008). Economic growth and subjective well-being:
Reassessing the Easterlin paradox. Brookings Papers on Economic Activity (Spirng
2008), 1-87. doi:10.1353/eca.0.0001
Stevenson, B., & Wolfers, J. (2013). Subjective Well-Being and Income: Is There Any
Evidence of Satiation? American Economic Review, 103(3), 598-604.
http://www.aeaweb.org/articles.php?doi=10.1257/aer.103.3.598
Wilkinson, R., & Pickett, K. (2006). Income inequality and population health: A review and
explanation of the evidence. Social Science & Medicine, 62(7), 1768-1784,
doi:10.1016/j.socscimed.2005.08.036.
Wilkinson, R., & Pickett, K. (2009). Income Inequality and Social Dysfunction. Annual
Review of Sociology, 35, 493-511.
http://www.annualreviews.org/doi/abs/10.1146/annurev-soc-070308-115926
Wilkinson, R., & Pickett, K. (2010). The Spirit Level: Why Greater Equality Makes Societies
Stronger. New York - Berlin - London: Bloomsbury Press.
Winkelmann, L., & Winkelmann, R. (2010). Does Inequality Harm the Middle Class? Kyklos,
63(2), 301-316, doi:10.1111/j.1467-6435.2010.00474.x.