Embed Size (px)
Citation preview

Inequality:Where are we?
OsloMay , 2011
Jaime SaavedraPoverty Reduction and Equity
THE WORLD BANK
Measuring and analyzing inequality of outcomes and opportunities.
What is the equity impact of policies, or…how to make policies more equity enhancing? The PSIA agenda.
What is the role of fiscal policy? Are taxes and transfers working in reducing inequality? Is the social contract effective?

Persistent and high across regions. Small reduction in some regions, some countries
Reductions in inequality of opportunities in some regions
Strong case for public policy to address inequalities
Where are we on inequality?

Inequality high and persistent in Latin America
Scatter plot log per capita GDP (PPP) and Gini coefficient. Most recent since 2002.
Argentina
Bolivia
Brazil
Chile
Colombia
Costa RicaDominican Republic
Ecuador
El Salvador
GuatemalaHonduras
Jamaica
MexicoNicaragua
Panama
Paraguay
Peru
Uruguay
Venezuela, R.B. de
2030
4050
60G
ini I
ndex
6 7 8 9 10Log GDP per capita (PPP)
Other Countries LAC Countries

Europe and Central Asia countries are more equal on average.
Albania
Armenia
Azerbaijan
Belarus
Bosnia and Herzegovina
Bulgaria Croatia
Estonia
Georgia
HungaryKazakhstan
Kyrgyz Republic
LatviaLithuania
Macedonia, FYR
Moldova Montenegro
Poland
Romania
Russian Federation
Serbia
Slovenia
Tajikistan
Turkey
Ukraine
Uzbekistan
2030
4050
60G
ini I
ndex
6 7 8 9 10Log GDP per capita (PPP)
Other Countries ECA Countries
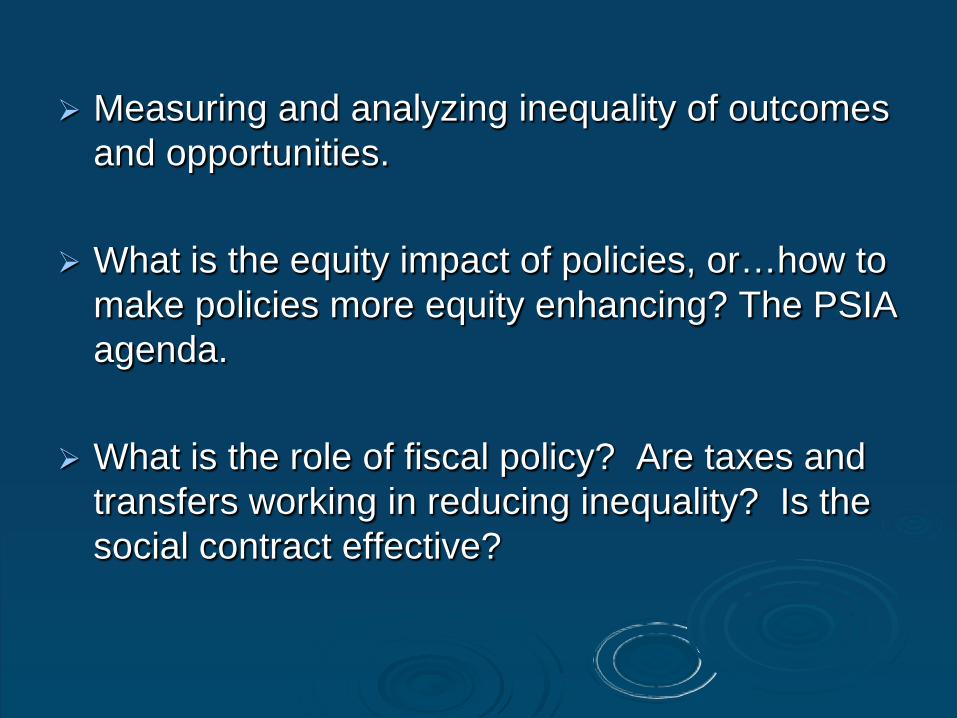
Also high in Africa
BeninBurkina Faso
Burundi
Central African Republic
Chad
Comoros
Congo, Dem. Rep. of
Congo, Rep.Cote d'Ivoire
Ethiopia
Gabon
Gambia, The
GhanaGuinea
GuineaBissau
Kenya
LesothoLiberia
Madagascar
Malawi Mali
Mozambique
NigerNigeria
Senegal
Sierra Leone
Togo
Uganda
Zambia
2030
4050
60G
ini I
ndex
6 7 8 9 10Log GDP per capita (PPP)
Other Countries SSA Countries

Small reduction in most Latin America countries
Changes in Inequality (Early 2000’s-Late 2000’s) have varied across countries
-6-4
-20
24
6G
ini A
nnua
l Cha
nge
(p.p
)
Ecu
ador
Ven
ezue
la, R
.B. d
e
Jam
aica
Par
agua
y
Arg
entin
a
El S
alva
dor
Bra
zil
Bol
ivia
Chi
le
Dom
inic
an R
epub
lic
Per
u
Pan
ama
Gua
tem
ala
Mex
ico
Col
ombi
a
Cos
ta R
ica
Uru
guay
Hon
dura
s
Nic
arag
ua
LAC
-6-4
-20
24
6G
ini A
nnua
l Cha
nge
(p.p
)
Azer
baija
n
Bulg
aria
Arm
enia
Turk
ey
Bela
rus
Ukra
ine
Kaza
khst
an
Mol
dova
Rom
ania
Kyrg
yz R
epub
lic
Geo
rgia
Russ
ian
Fede
ratio
n
Tajik
istan
Lith
uani
a
Bosn
ia a
nd H
erze
govin
a
Mac
edon
ia, F
YR
Alba
nia
Uzbe
kista
n
ECA
Mixed pattern in Eastern Europe and Central Asia
And also in East Asia and the pacific

Diverging patterns in Brazil and China

Manmohan Singh, : “Large scale poverty is the foremost challenge facing our country.. We have to be acutely conscious of regional disparities and imbalances within the country, and address the inequalities that exist.” (The Hindu, March 27, 2011)
Dilma Rouseff, "The most determined struggle will be to eradicate extreme poverty … we can be a more developed and fairer country... I will not rest while there are Brazilians without food on their table, homeless in the streets, and poor children abandoned to their luck." (Inauguration address, January 2011)
Jacob Zuma, "While many South Africans celebrate the delivery of houses, electricity or water, there are yet many others who are still waiting... " (2011 State of the Nation Address)
Min Zhu, IMF “The increase in inequality is the most serious challenge for the world ... I don’t think the world is paying enough attention.” (Davos, May 2011)
Premier Wen “…many had not seen the benefits of China’s dynamic growth” ...[we need to ]... “combat rising inequality and corruption” (Washington Post, 3/12/11)
Thai Democrat Party campaign statement "Need to address income inequality which (is) causing social problems in Thai society” (BKK Post, 2/28/20)

0
10
20
30
40
50
60
1988 1990 1992 1994 1996 1998 2000 2002 2004 2006 2008 2010
%
Underweight (0-3 years)
India Nigeria Peru
Another poverty indicator: malnutrition
Reduction in % of children underweight in India, Nigeria and Peru
Source: DHS, STATcompiler
0
10
20
30
40
50
60
70
80
90
100
1992
1998
2006
1990
2003
2008
1991
1996
2000
%
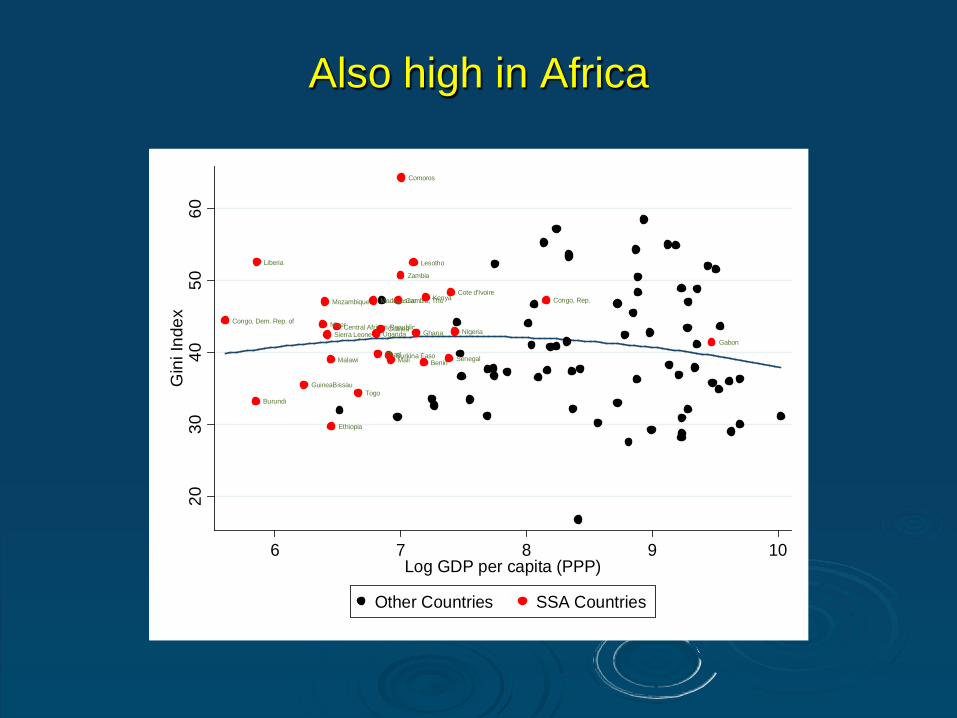
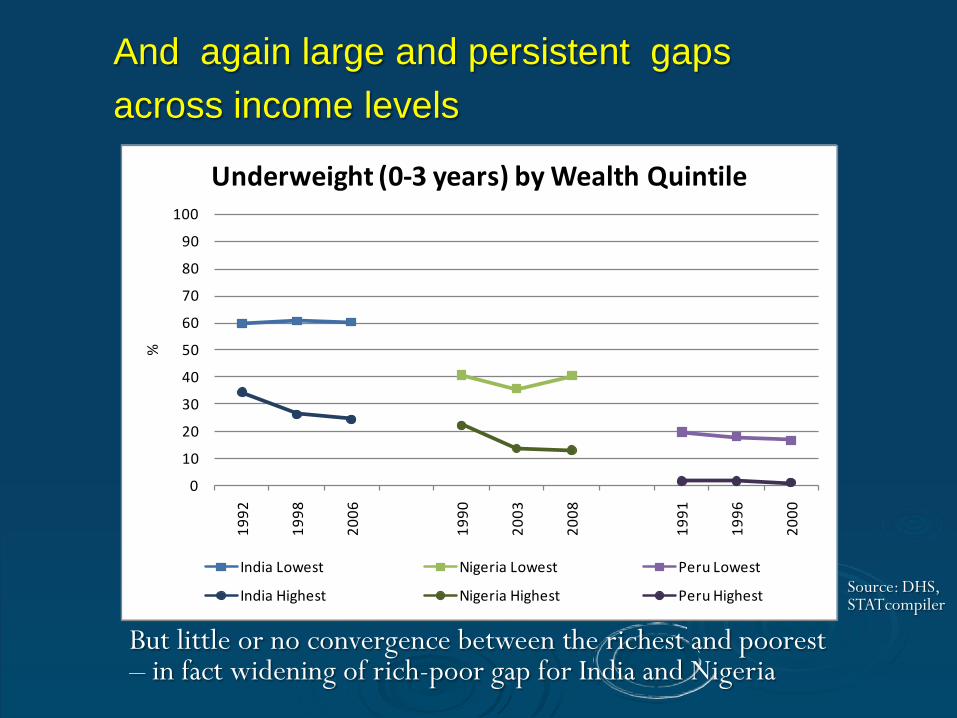
Underweight (0-3 years) by Wealth Quintile
India Lowest Nigeria Lowest Peru Lowest
India Highest Nigeria Highest Peru Highest
But little or no convergence between the richest and poorest – in fact widening of rich-poor gap for India and Nigeria
And again large and persistent gapsacross income levels
Source: DHS, STATcompiler

0.0 0.1 0.2 0.3 0.4 0.5 0.6 0.7 0.8 0.9 1.0Brasil
NicaraguaGuatemala
PerúColombia
R. DominicanaCosta Rica
EcuadorHonduras
UruguayParaguay
BoliviaPanamá
VenezuelaEl Salvador
ChileMéxico
ArgentinaJamaica
Boy with 4 siblings in a rural home , uneducated head of household and income at extreme poverty levels
Child with one sibling un an urban home, household head with secondaryeducation in family income per capita of US$25 a day.
Two Latin-american childrenProbability of finishing 6to grade on time

0 % 10 % 20 % 30 % 40 % 50 % 60 % 70 % 80 %
RwandaLiberia
TanzaniaMozambique
UgandaEthiopia
NigerCongo Dem Rep.
Sierra LeoneZambia
MaliMalawi
MadagascarCameroon
KenyaGhana
NamibiaZimbabwe
Nigeria
Poor child Rich child
Note: Rich child is a boy, living in a urban household where the head is a male with 12 years of education, with one additional child in the household and belong to the fifth quintile of wealth. Poor child is a boy, living in a rural household where the head is a male with 5 years of education, with four additional children in the household and belong to the first quintile of wealth.
Two African children: Probability of completing 6th grade on time

The equality of opportunity principle
Circumstances exogenous to theindividual, like birth place, gender,
ethnicity, income and education of parentsshould not determine the persons
wellbeing

“In Peru 4 out of 10 children less than 5 years do not have access to clean water”
Problem: access, coverage
“Those 4 children are indigenous”
Problem: circumstances affect children's chances. distribution
There are two problems here
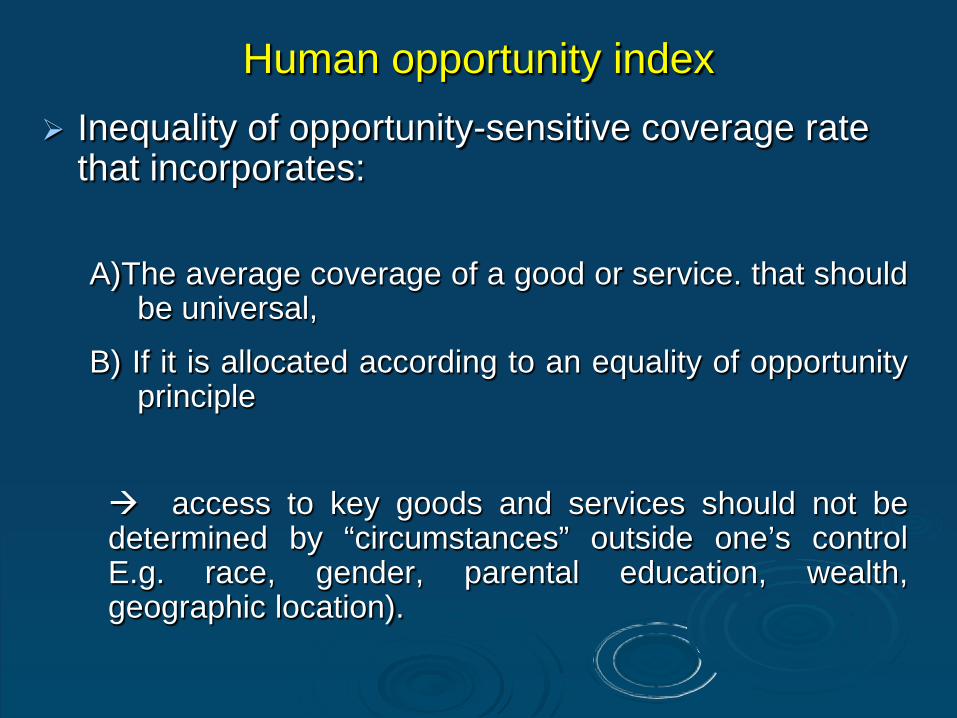
Human opportunity index Inequality of opportunity-sensitive coverage rate
that incorporates:
A)The average coverage of a good or service. that shouldbe universal,
B) If it is allocated according to an equality of opportunityprinciple
access to key goods and services should not bedetermined by “circumstances” outside one’s controlE.g. race, gender, parental education, wealth,geographic location).
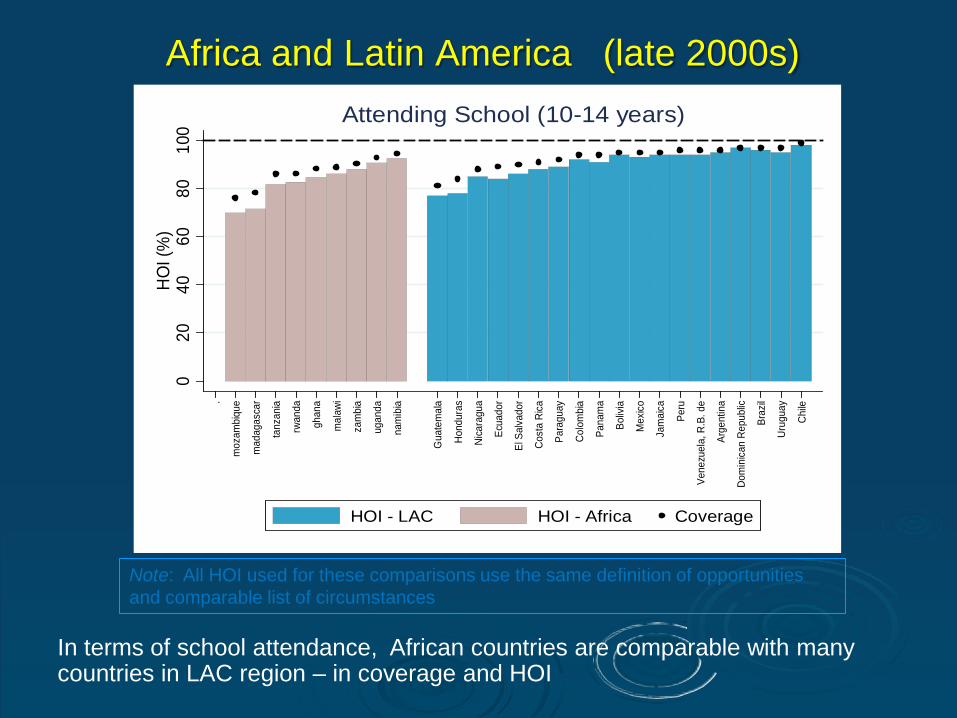
In terms of school attendance, African countries are comparable with many countries in LAC region – in coverage and HOI
Africa and Latin America (late 2000s)
020
4060
8010
0H
OI (
%)
.
moz
ambi
que
mad
agas
car
tanz
ania
rwan
da
ghan
a
mal
awi
zam
bia
ugan
da
nam
ibia
Gua
tem
ala
Hond
uras
Nica
ragu
a
Ecua
dor
El S
alva
dor
Cost
a Ri
ca
Para
guay
Colo
mbi
a
Pana
ma
Boliv
ia
Mex
ico
Jam
aica
Peru
Vene
zuel
a, R
.B. d
e
Arge
ntin
a
Dom
inica
n Re
publ
ic
Braz
il
Urug
uay
Chile
HOI - LAC HOI - Africa Coverage
Attending School (10-14 years)
Note: All HOI used for these comparisons use the same definition of opportunities and comparable list of circumstances

020
4060
8010
0H
OI (
%)
.
rwan
da
moz
ambi
que
tanz
ania
ugan
da
mad
agas
car
mal
awi
zam
bia
ghan
a
nam
ibia
Gua
tem
ala
Nic
arag
ua
Braz
il
El S
alva
dor
Hon
dura
s
Dom
inic
an R
epub
lic
Para
guay
Col
ombi
a
Cos
ta R
ica
Pana
ma
Vene
zuel
a, R
.B. d
e
Boliv
ia
Peru
Uru
guay
Ecua
dor
Chi
le
Arge
ntin
a
Jam
aica
Mex
ico
HOI - LAC HOI - Africa Coverage
Finished 6th Grade On Time (13 - 15 years)
Africa and Latin America (late 2000s)
African countries compare poorly with most LAC countries on completion of primary on time - Late entry is a major problem in Africa

Encouraging trends for Africa on school attendance (late 1990s – late 2000s)
• Large improvements in school attendance for most African countries• In almost all African countries change in HOI > change in coverage reduction in inequality in attendance
namibiamalawighana
zambiauganda
madagascarmozambique
rwandatanzania
JamaicaParaguay
ChileDominican RepublicVenezuela, R.B. de
PeruGuatemalaCosta Rica
PanamaEcuador
ColombiaMexico
BrazilEl Salvador
HondurasNicaragua
0 1 2 3Percentage Points
Change HOI Change Coverage
Annual Change - Attending School (10-14 years)

But mixed picture on trends for primary school completion in Africa
ghanarwanda
mozambiqueuganda
madagascartanzania
zambiamalawi
namibia
JamaicaPanama
ChileColombia
Venezuela, R.B. deEcuador
Dominican RepublicMexico
GuatemalaHondurasNicaragua
El SalvadorParaguay
Costa RicaPeru
Brazil
-1 0 1 2 3Percentage Points
Change HOI Change Coverage
Annual Change - Finished 6th Grade On Time (13 - 15 years)
• Little or no improvement in HOI for 4 out of 9 African countries • Increase in HOI much smaller than increase in coverage for the 6 African countries showing an improvement rise in inequality in primary school completion
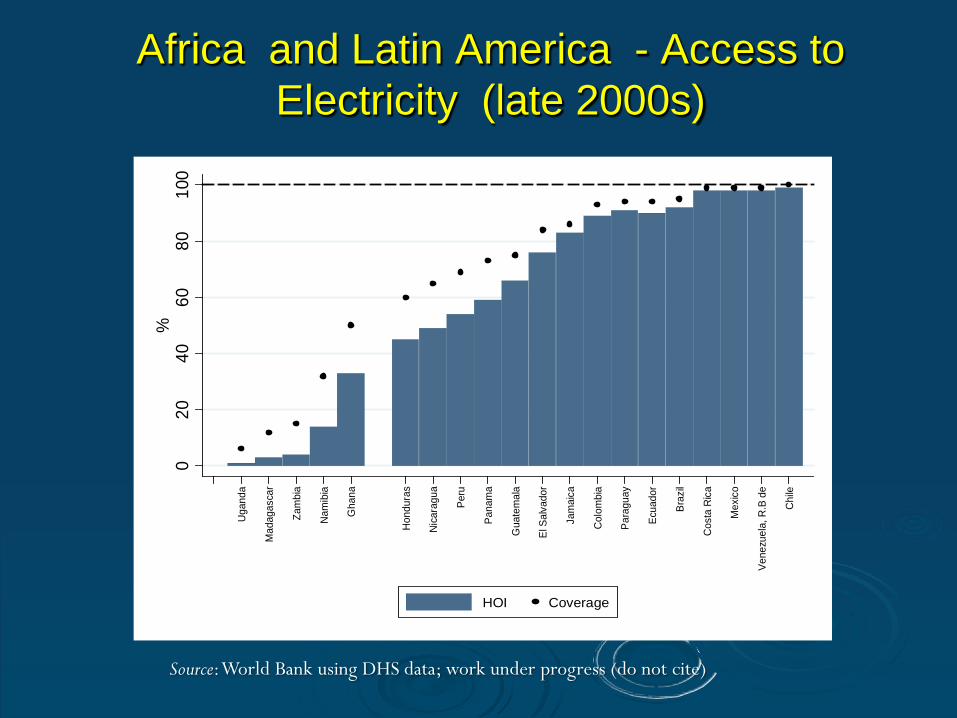
Africa and Latin America - Access to Electricity (late 2000s)
Source: World Bank using DHS data; work under progress (do not cite)
020
4060
8010
0%
Uga
nda
Mad
agas
car
Zam
bia
Nam
ibia
Gha
na
Hon
dura
s
Nic
arag
ua
Peru
Pana
ma
Gua
tem
ala
El S
alva
dor
Jam
aica
Col
ombi
a
Para
guay
Ecua
dor
Braz
il
Cos
ta R
ica
Mex
ico
Vene
zuel
a, R
.B d
e
Chi
le
HOI Coverage
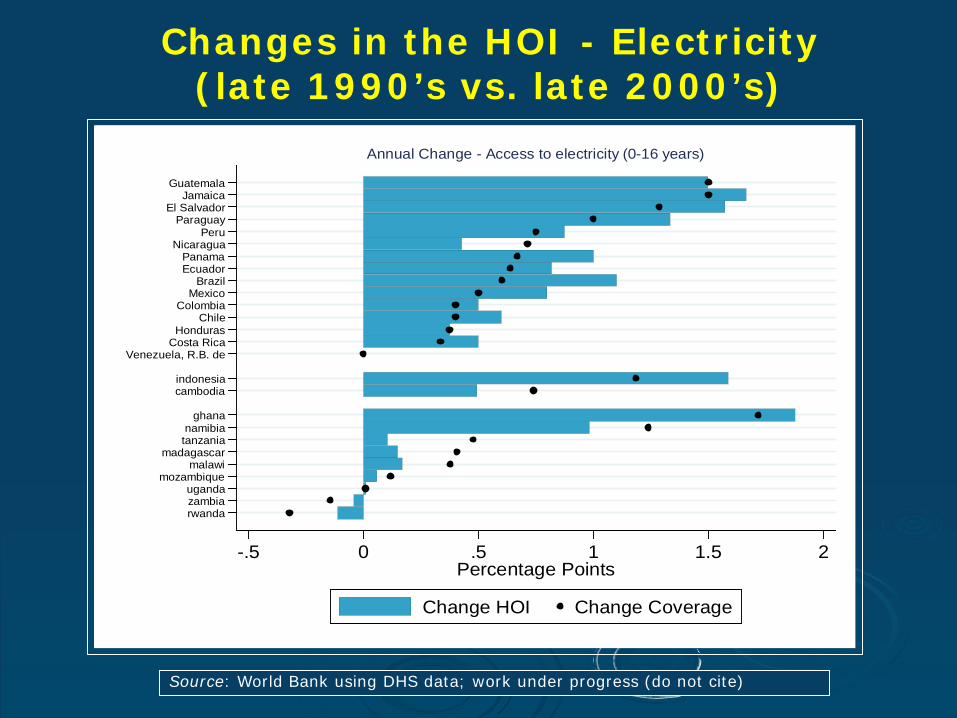
Source: World Bank using DHS data; work under progress (do not cite)
rwandazambiauganda
mozambiquemalawi
madagascartanzanianamibia
ghana
cambodiaindonesia
Venezuela, R.B. deCosta RicaHonduras
ChileColombia
MexicoBrazil
EcuadorPanama
NicaraguaPeru
ParaguayEl Salvador
JamaicaGuatemala
-.5 0 .5 1 1.5 2Percentage Points
Change HOI Change Coverage
Annual Change - Access to electricity (0-16 years)
Changes in the HOI - Electricity(late 1990’s vs. late 2000’s)
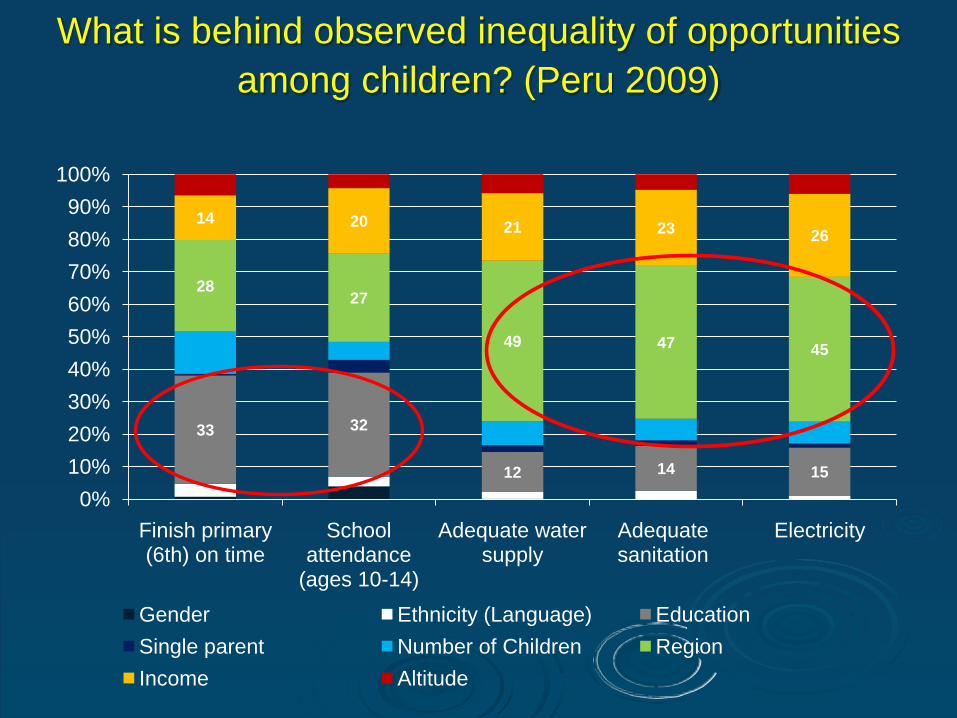
33 32
12 14 15
2827
49 47 45
14 20 21 23 26
0%10%20%30%40%50%60%70%80%90%
100%
Finish primary (6th) on time
School attendance
(ages 10-14)
Adequate water supply
Adequate sanitation
Electricity
Gender Ethnicity (Language) EducationSingle parent Number of Children RegionIncome Altitude
What is behind observed inequality of opportunities among children? (Peru 2009)

34
1427
5
23
30
49 5238
0%
10%
20%
30%
40%
50%
60%
70%
80%
90%
100%
Cambodia Peru Indonesia
Household composition Household head educationIncome GenderGeographical Location
What is behind observed inequality of opportunities among children? – the case of sanitation
The case for public policy to address the
equity challenge
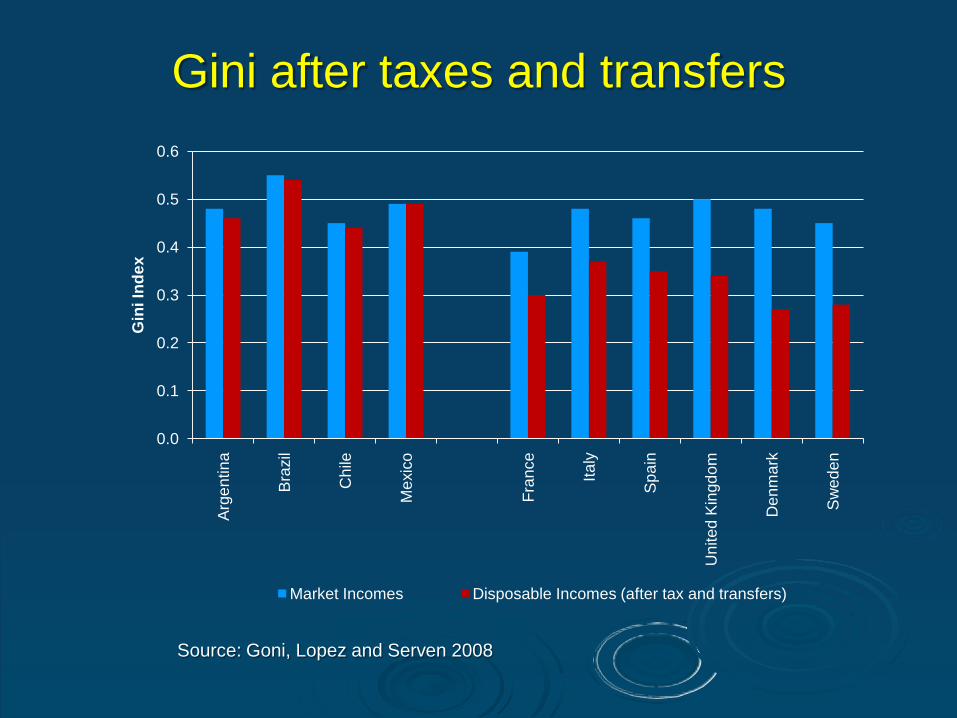
Gini after taxes and transfers
Source: Goni, Lopez and Serven 2008
0.0
0.1
0.2
0.3
0.4
0.5
0.6
Arg
entin
a
Bra
zil
Chi
le
Mex
ico
Fran
ce
Italy
Spa
in
Uni
ted
Kin
gdom
Den
mar
k
Sw
eden
Gin
i Ind
ex
Market Incomes Disposable Incomes (after tax and transfers)
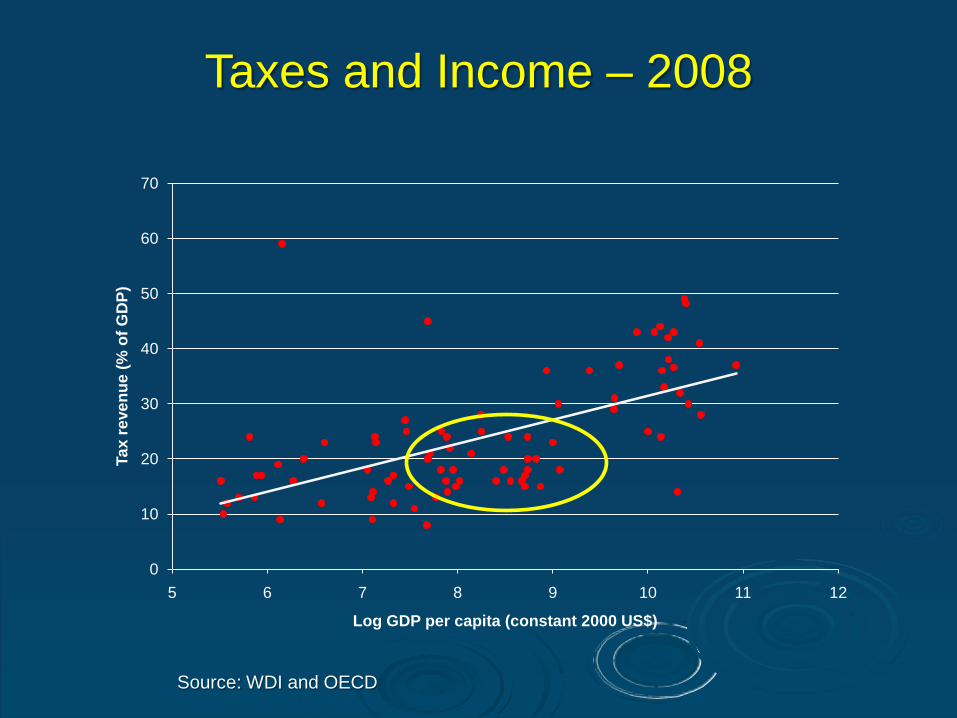
Taxes and Income – 2008
0
10
20
30
40
50
60
70
5 6 7 8 9 10 11 12
Tax
reve
nue
(% o
f GD
P)
Log GDP per capita (constant 2000 US$)
Source: WDI and OECD

Taxes as a % of GDP Latin America and OECD
Tax collection is low
- Not because of low rates
- Because exemptions andloopholes
- Progressive personal income taxes are barelycollected
- Very high informality

…and informality seems to relates to the (perceived) quality and fairness of state services
ECUARG
VENPERBOL
GUAHONMEXBRA
SAL
COLJAMCOSPAN
CHI
-.20
.2.4
e(S
hare
of S
elf-e
mpl
oyed
/ X
)
-1.5 -1 -.5 0 .5 1
e(Government Effectiveness / X)
coef = -.07803752, se = .02249611, t = -3.47
Parcial Correlations controling for the GDP pc at PPP
Government Effectiveness
VEN
ARGECU
PERGUA
BOL
PAN
HONBRAMEXSAL
COLCHI
COSJAM
-.20
.2.4
e(S
hare
of S
elf-e
mpl
oyed
/ X
)
-4 -2 0 2 4
e(Impartiality of Courts / X)
coef = -.02090103, se = .00903889, t = -2.31
Parcial Correlations controling for the GDP pc at PPP
Impartiality of Courts

Does the social contract work?
-60 %
-50 %
-40 %
-30 %
-20 %
-10 %
0 %
10 %
20 %
30 %
I II III IV V
HH
am
ount
as
% o
f GD
P p
er h
h
Transfers
-60 %
-50 %
-40 %
-30 %
-20 %
-10 %
0 %
10 %
20 %
30 %
I II III IV V
HH
am
ount
as
% o
f GD
P p
er h
h
United Kingdom Colombia
Taxes
From: Breceda, Rigolini and Saavedra, 2009)
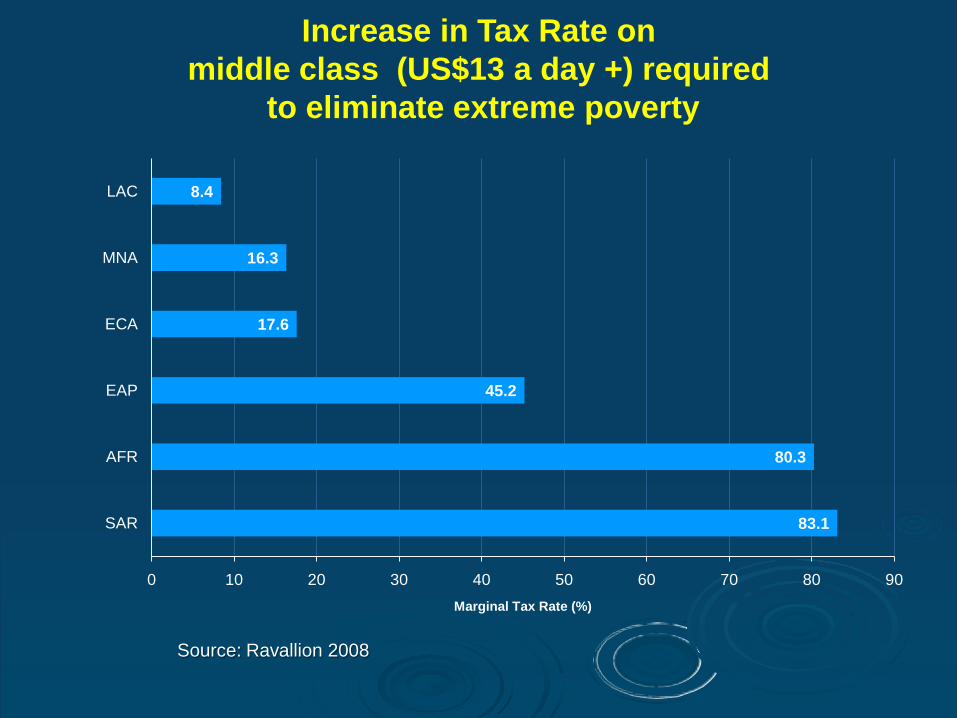
Increase in Tax Rate on middle class (US$13 a day +) required
to eliminate extreme poverty
Source: Ravallion 2008
83.1
80.3
45.2
17.6
16.3
8.4
0 10 20 30 40 50 60 70 80 90
SAR
AFR
EAP
ECA
MNA
LAC
Marginal Tax Rate (%)
The richer do not participate and opt out
The rich opting out into higher quality private provision (pension, security, private education, etc), leaving as demanders of public services those with less “voice”
...and the poor also feel disengaged.
Differential access to public goods that should be universal equal access to property rights, to protection under the law, to judiciary services, to basic services
Overall negative views about state services and the political system.
A system that gives me very little, and gives the others low quality services In some cases continued perception of patronage and corruption in social assistance
Implicit validation of widespread tax evasion Much more EXIT than VOICE in Hirschman´s terminology
Low taxation and informality reflect a social contract that does not work for all.
Bad equilibrium of low taxes, weak states, regulators with low enforcement capacity, insufficient provision of public goods, unequal opportunties

Redistribution through taxes or through transfers?
A Tax Reform in Mexico
Progressive on the tax side
Regressive on the tax side…matters?
(% reduction in household incomes due to tax reform)

Some hope on the expenditure sideBrazil : Contributions to changes in inequality
Source: Barros et al (2010).
Non-labor income has a more important role in explaining reduction in extreme poverty and inequality : mostly ruralpensions, less CCTs

Thank you