Embed Size (px)
Citation preview

RESEARCH ARTICLE
Reduction in total leukocytes in malaria
patients compared to febrile controls: A
systematic review and meta-analysis
Manas KotepuiID1*, Kwuntida Uthaisar Kotepui1, Giovanni D. MilanezID
2, Frederick
R. Masangkay2
1 Medical Technology, School of Allied Health Sciences, Walailak University, Thasala, Nakhon Si
Thammarat, Thailand, 2 Department of Medical Technology, Institute of Arts and Sciences, Far Eastern
University, Manila, Philippines
Abstract
Background
Leukocyte alterations are a common hematological alteration among malaria patients.
Objectives
This systematic review and meta-analysis aimed to provide data and evidence comparing
alterations in total leukocyte counts in malaria patients compared to febrile/healthy subjects
at baseline before treatment. A systematic review was conducted by following the Preferred
Reporting Items for Systematic Reviews and Meta-Analyses (PRISMA) statement for
reporting systematic reviews and meta-analyses.
Data sources
Web of Science (ISI), Scopus, and Medline.
Study eligibility criteria, participants, and interventions
All published articles reporting a total leukocyte count of patients infected with malaria, non-
malaria (febrile or healthy group) at baseline before treatment before August 27, 2019, were
retrieved, and data were extracted by two main reviewers independently.
Study appraisal and synthesis methods
We used a forest plot, heterogeneity test (Cochran’s Q), and the degree of heterogeneity
(I2) to test whether the included studies were heterogeneous. The quality of the included
studies was determined by a quality assessment guide based on the quality assessment
tool developed by the Newcastle-Ottawa Scale (NOS). Cochran’s Q (Chi-square) and Mor-
an’s I2 were used to evaluate heterogeneity. Meta-regression using STATA software was
conducted to find the source of heterogeneity. A funnel plot with Egger’s test was used to
examine the significance of publication bias among the included studies. The mean differ-
ences were estimated using a random-effects model.
PLOS ONE
PLOS ONE | https://doi.org/10.1371/journal.pone.0233913 June 23, 2020 1 / 28
a1111111111
a1111111111
a1111111111
a1111111111
a1111111111
OPEN ACCESS
Citation: Kotepui M, Kotepui KU, Milanez GD,
Masangkay FR (2020) Reduction in total
leukocytes in malaria patients compared to febrile
controls: A systematic review and meta-analysis.
PLoS ONE 15(6): e0233913. https://doi.org/
10.1371/journal.pone.0233913
Editor: Luzia Helena Carvalho, Instituto Rene
Rachou, BRAZIL
Received: February 18, 2020
Accepted: May 14, 2020
Published: June 23, 2020
Copyright: © 2020 Kotepui et al. This is an open
access article distributed under the terms of the
Creative Commons Attribution License, which
permits unrestricted use, distribution, and
reproduction in any medium, provided the original
author and source are credited.
Data Availability Statement: All relevant data are
within the paper and its Supporting Information
files.
Funding: This research was partially supported by
the new strategic research (P2P) project, Walailak
University, Thailand. The funders had a role in the
collection, analysis, and interpretation of the data.
There was no additional external funding received
for this study.
Competing interests: The authors have declared
that no competing interests exist.

Results
Out of the 2,261 articles screened, 29 articles were included in this systematic review and
meta-analysis. The heterogeneity test indicated that there was heterogeneity among the
included studies with no publication bias. The meta-analysis demonstrated that the total leu-
kocyte count was significantly lower in patients with malaria (n = 4,619) than in those without
malaria (n = 10,056) (Z = 4.0, P-value < 0.00001, mean difference = -1.38, 95% CI = -2.06-
(-0.71)). Leukocyte differential alterations, low lymphocyte counts (P-value <0.0001, mean
difference = -1.03, 95% CI = -1.53-(-0.53)) and a high NL ratio were found in the malaria
group (n = 1,579) compared to the non-malaria group (n = 4,991) (P-value <0.0001, mean
difference = 0.6, 95% CI = 0.32–0.88). The subgroup analysis indicated that there was a sig-
nificantly lower total leukocyte count in the malaria group (n = 3,545) than in the febrile
group (n = 8,947) (Z = 1.33, P-value < 0.0001, mean difference = -1.76, 95% CI = -2.56-
(-0.96)), but no significant difference was found between the malaria group (n = 1,232) and
the healthy group (n = 1,679) (P-value > 0.05).
Limitations
As the specific diagnoses in the febrile groups were not reported in the included studies so
that the results of the present study need to be carefully interpreted.
Conclusions and implications of key findings
This systematic review demonstrated that the total leukocyte count was affected by malarial
infection at baseline despite the heterogeneity of the included studies. Future work must aim
to understand the treatment-related total leukocyte reduction during follow-up or post-treat-
ment outcomes in malaria-endemic settings.
Introduction
Malaria is a major public health problem worldwide, especially in sub-Saharan Africa, with
estimated 228 million cases and 405,000 deaths worldwide in 2018 [1]. The clinical manifesta-
tions of malaria patients can be divided into uncomplicated malaria and severe malaria. Severe
malaria is characterized by the presence of one of the following: bleeding or disseminated
intravascular coagulation (DIC), metabolic acidosis, prostration, severe anemia, hypoglycemia,
shock, jaundice, impaired consciousness, multiple convulsions, acute kidney injury, or pulmo-
nary edema [2]. Uncomplicated malaria is characterized by nonspecific symptoms, with fever
as a hallmark and other nonspecific signs, such as malaise, anorexia, headache, myalgia, nau-
sea, vomiting or chills [3]. Laboratory findings of uncomplicated and severe malaria show
some degree of anemia and thrombocytopenia [4, 5–7, 8, 9], which are the two most recog-
nized laboratory findings among most literature reviews. However, the overall understanding
of leukocyte alterations in uncomplicated and severe malaria is still incomplete, and this is the
first gap addressed in the present study.
Leukocyte alterations are a common hematological alteration among malaria patients [7,
10–18]. Previous studies have described leukopenia during malarial infection [7, 11–15, 18].
However, some studies observed leukocytosis during malarial infection [10, 16, 17]. A previous
study by Zahorec et al. introduced the neutrophil-lymphocyte ratio (NLR) as a better indicator
PLOS ONE The leukocyte alteration in malaria
PLOS ONE | https://doi.org/10.1371/journal.pone.0233913 June 23, 2020 2 / 28

of systemic inflammation and stress than C-reactive protein (CRP) level [19]. Our previous
study also demonstrated that neutrophil and lymphocyte counts were the most important leu-
kocytic changes associated with malaria infection as NLR in malaria infected patients was
higher in comparison to non-malaria infected patients [13]. To date, there have been no sys-
tematic reviews or meta-analyses focusing on leukocyte alterations during malarial infection.
The association between leukocyte counts during malarial infection is limited. Previous studies
demonstrated that during early malarial infection, the leukocyte count decrease was related to
fever outcomes [20, 21]. The alteration of leukocyte counts in combination with routine
malaria diagnosis, such as microscopy techniques, in malaria-endemic areas may prove benefi-
cial for laboratory technicians or physicians, especially in patients with very low parasitemia.
Alterations of leukocyte counts might be used in combination with other markers to help diag-
nose malaria and could be useful for the management of malarial patients.
The second gap in previous studies is that most of the studies reported a significant differ-
ence in hematological parameters in febrile patients who were negative for the malaria parasite
as a non-malaria group. However, these patients might have other infections and therefore do
not represent a healthy population. These bacterial or viral infections might affect hematologi-
cal variables in different ways. This systematic review and meta-analysis aimed to provide data
and evidence comparing total leukocyte alterations among malaria patients and febrile/healthy
subjects at baseline before treatment.
Materials and methods
A systematic review was conducted by following the Preferred Reporting Items for Systematic
Reviews and Meta-Analyses (PRISMA) statement for reporting systematic reviews and meta-
analyses of studies that evaluate healthcare interventions [22] (see S1 Checklist).
Definitions
The malaria group included patients who were infected with at least one of five Plasmodiumspecies, which included P. falciparum, P. vivax, P. ovale, P. malariae, and P. knowlesi. The
febrile group included patients who were recruited for the assessment of malaria parasites, but
no malaria parasites were found. The healthy group was the group of patients who were
assessed as healthy in the same area of study.
Eligibility criteria
Searches for this study were limited to human studies but were not limited by year, country or
language. Only original research studies with quantitative analysis were considered, thereby
excluding animal studies, clinical drug trials, in vitro and in vivo studies, reviews, systematic
reviews, short reports, letters to the editor, quizzes, and articles for which the full text was
unavailable. Further, studies which involve the analysis of baseline leukocyte count for both
malaria groups and non-malaria groups, and. studies of enrolled patients with malarial infec-
tion and non-malaria patients (febrile or healthy) with a report on the total leukocyte count at
baseline before treatment were included. Studies involving patients with hematological dis-
eases (sickle cell anemia, thalassemia, and hemoglobinopathies), hematological malignancies
(lymphoma, leukemia, and multiple myeloma), chronic liver disease (hepatitis B and C), or
other diseases/conditions such as human immunodeficiency virus infection, acquired immune
deficiency syndrome (HIV/AIDS), organ transplantation, pregnant women, or were exhibiting
mixed infections were excluded from this study.
PLOS ONE The leukocyte alteration in malaria
PLOS ONE | https://doi.org/10.1371/journal.pone.0233913 June 23, 2020 3 / 28

Search strategy
Published studies were identified using keywords in combination with truncations. AND with
OR was used to combine terms “(malaria OR plasmodium) AND (leukocyte OR white blood
cell)” (see S1 Table). The searches for articles from all three databases started on 27 August
2019 and finished on 28 August 2019. The searches were conducted in the following three
main research databases: MEDLINE (1947–2019, 27 August), SCOPUS (1921–2019, 27
August), and ISI Web of Science (2002–2019, 27 August). The papers were imported into End-
Note X9 (Thomson Reuters, USA) for reference management. Two main reviewers (MK and
KK) independently examined all papers and performed the study selection. The first step of
reviewing the papers was the identification of relevant articles based on titles and abstracts. If a
paper was potentially related or if it was unclear if it was related, a full-text review of the paper
was performed before a decision was made to include or exclude it from this study. The second
step of reviewing the papers was reading the text of the articles, which was conducted by each
reviewer independently. For discordances between the two reviewers regarding full article
reviews, a third reviewer participated and decided whether the study should be included or
excluded.
Data extraction
Data extraction was conducted for each selected article, and the following data were extracted:
author, references, study area, year of study, mean age, age range, sex ratio, type of Plasmo-dium sp., and severe complications. The detection of malaria parasites were based on any of
these methods: rapid diagnostic test (RDT), microscopy, polymerase chain reaction (PCR), or
any test combination. The number of participants in malaria and non-malaria groups, charac-
teristics of controls, and diagnostic techniques were also extracted. Extracted data were entered
into an Excel sheet.
Quality of included studies
Quality assessment was performed with the quality assessment tool developed by the Newcas-
tle-Ottawa Scale (NOS) for assessing the quality of nonrandomized studies in meta-analyses
[23]. The quality assessment tool was used to evaluate the validity of the included studies,
which is also shown in Table 2.
Meta-analysis
A meta-analysis was conducted using Review Manager (RevMan) 5.3 software (Version 5.3,
London, UK). Heterogeneity was assessed using Cochran’s Q (Chi-square) and Moran’s I2. In
cases where heterogeneity existed, meta-regression was performed using STATA software
(StataCorp, USA), and subgroup analyses were conducted to explore the source(s) of heteroge-
neity. For studies that reported the median and range, we estimated the mean and standard
deviation according to the method devised by Hozo et al. [24]. Missing standard deviations
were calculated by the imputation of average standard deviations borrowed from other studies
according to the method devised by Furukawa et al. [25]. Mean differences and the 95% confi-
dence interval were the effect measures for the mean differences in the total leukocyte count
among malaria and non-malaria groups and were calculated by using the generic inverse vari-
ance method and random-effects model. Moreover, mean differences in leukocyte differential
count for neutrophils, lymphocytes and the neutrophil/lymphocyte ratio (NL ratio) were also
analyzed.
PLOS ONE The leukocyte alteration in malaria
PLOS ONE | https://doi.org/10.1371/journal.pone.0233913 June 23, 2020 4 / 28

Assessment of publication bias
Publication bias was evaluated using a funnel plot. Egger’s test was used to test for funnel plot
asymmetry.
Results
General characteristics of included studies
A total of 2,261 potentially relevant articles were identified for this systematic review after dupli-
cate citations were removed. After reviewing the title and abstract, 623 articles were selected for
the full text review. Among the 623 articles, 594 were removed because they did not report the
leukocyte count or because of any of the inclusion and exclusion criteria in this study. Out of
2,261 potentially relevant articles, 29 met the inclusion criteria and were subsequently included
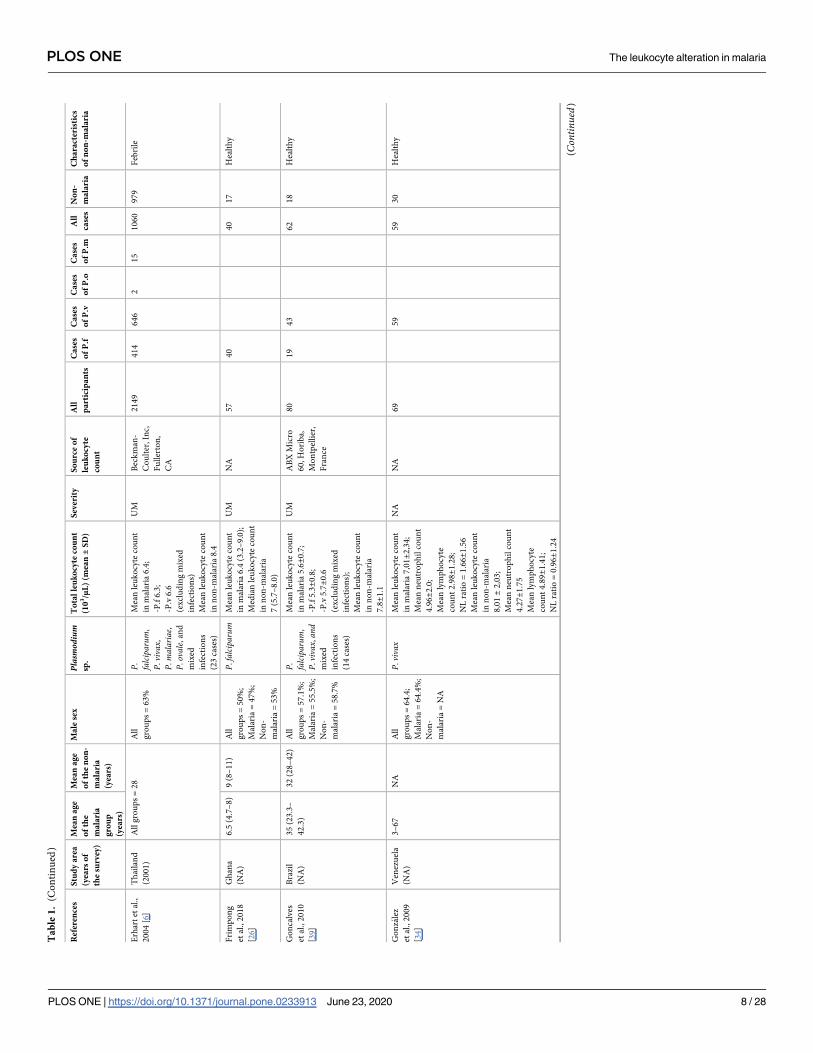
in this review (Table 1). The majority of the studies were conducted in African countries (15 of
29 studies). Seven studies were conducted in Asian countries, and six studies were conducted in
South America. Eight of the articles from five African countries–Ghana [26], Gabon [7, 27],
Nigeria [28, 29], Cameroon [9, 30], and Sudan [31]–reported only P. falciparum infection, while
seven of the articles in Brazil [15, 32, 33], Venezuela [34], Republic of Korea [4], Turkey [35],
and Ghana [36] reported only P. vivax infection. P. ovale infection was described only in three
studies conducted in France [37], Thailand [6], and South Africa [38]. P. malariae infection was
described only in two studies conducted in Thailand [6] and Nigeria [8]. Mixed infections of P.
falciparum and P. vivax were found only in Ethiopia [5], Thailand [6], Brazil [39], and India
[40], whereas mixed infections of P. vivax/P. malariae and P. falciparum/P. ovale were found in
Nigeria [8] and South Africa [38], respectively. The mean age of the participants was 23±13.1
years, while the sex ratio of males/females was 1.15:1. All articles were published between 1997
and 2019 (Fig 1). Six studies reported 224 cases of severe malaria in their publications [7, 27, 30,
31, 36, 38]. Most of the severe complications in the studies were severe anemia (21.9%, 49/224),
cerebral malaria (13.8%, 31/224), hyperparasitemia (9.8%, 22/224), repeated convulsions (8%,
18/224), more than one complication (3.6%, 8/224), hypotension (3.1%, 7/224), jaundice (2.7%,
6/224), hypoglycemia (1.8%, 4/224), and prostration (0.4%, 1/224). The non-malaria groups
were divided into febrile and healthy groups based on the descriptions by the authors. The
febrile group included patients who were suspected of having malaria, but blood parasitemia
was negative by any of these techniques, including microscopy, rapid diagnostic tests (RDTs),
and polymerase chain reaction (PCR). The healthy group included healthy individuals in the
same endemic area as the malarial patients in their studies.
Malaria indicators
Twenty included studies (20/29, 69%) used only the microscopic method for detection of
malaria parasites. Five studies used both microscopy and PCR [15, 32, 34, 39, 46]. Two studies
used both microscopy and RDT [35, 38]. Two studies used three methods for malaria detection
including microscopy, RDT, and PCR methods (S2 Table).
Leukocyte indicators
Most of the leukocyte counts in the 29 studies were obtained using hematology analyzers from
different manufacturers. Six studies used a Sysmex [15, 31, 36, 38, 41, 43]. Three studies used a
Cell-Dyn [4, 5, 7]. Three studies used an ABX [32, 39, 45]. Three studies used a Beckman-
Coulter [6, 9, 40]. Two studies used a Coulter STKS [27, 44]. Other studies used a Coulter
counter [8], BC-5200 Haematology Analyzer [13], and URIT-3300 [30]. Two studies used
PLOS ONE The leukocyte alteration in malaria
PLOS ONE | https://doi.org/10.1371/journal.pone.0233913 June 23, 2020 5 / 28

Turk’s method, which is a traditional protocol for leukocyte counting using a hemocytometer
[28, 29].
Quality of included studies
All 29 studies included in the present study were rated with a score according to the NOS
guidelines. Overall, twenty-eight studies were rated “good” with a maximum of 9 stars, and
one study was rated “medium” with 8 stars because there was no clear definition of the non-
malaria group reported by the authors. The rating details are provided in Table 2.
Meta-analysis
A meta-analysis of the leukocyte count in the malaria and non-malaria groups was conducted
to examine the statistical significance and mean difference across the 29 studies. The analysis
demonstrated that there were significantly lower leukocyte counts in patients in the malaria
group than in those in the non-malaria group (Z = 4.0, P-value < 0.00001, mean difference =
-1.38, 95% CI = -2.06-(-0.71)). Only 2 of the 29 included studies presented a significantly
higher total leukocyte count in the malaria group than in the non-malaria group [29, 33] (Fig
2). Five out of twenty-nine studies presented total leukocyte counts that were not significantly
different in the malaria group and the non-malaria group [7, 26, 28, 30, 42].
Data heterogeneity
The present study used a forest plot, heterogeneity test (Cochran’s Q), and the degree of het-
erogeneity (I2) to test whether the included studies had heterogeneity. The results from the for-
est plot indicated that the standard deviations overlapped among the included studies.
Cochran’s Q indicated that the results were significant (P-value < 0.000001, Chi2 = 4794.7,
df = 28, Tau2 = 3.23) with an I2 of 99%. A meta-regression with mean age as a covariate was
performed to determine if age was the source of heterogeneity or whether it modified the out-
come. Meta-regression using STATA software indicated that mean age was not the source of
heterogeneity and it did not modify the outcome (P-value = 0.48, percent of residual variation
(I2) = 97.9% (Table 3, Fig 3).
Meta-analysis of leukocyte differential counts
Meta-analysis of leukocyte differential counts was available in 11 studies and was also analyzed.
For neutrophil counts, the meta-analysis showed no difference in neutrophil counts between
the malaria and non-malaria groups (P value = 0.84, mean difference = -0.11, 95% CI = -1.15–
0.94) (Fig 4). For lymphocyte counts, the results showed that the malaria group had a signifi-
cantly lower lymphocyte count than the non-malaria group (P value <0.0001, mean difference
= -1.03, 95% CI = -1.53-(-0.53)) (Fig 5). For the NLR, the results showed that the NLR was
higher in the malaria group than in the non-malaria group (P value <0.0001, mean differ-
ence = 0.6, 95% CI = 0.32–0.88) (Fig 6). The difference of leukocyte count between severe and
non-severe malaria group was also analyzed. The results demonstrated no significant differ-
ence of the total leukocyte count between severe and non-severe group (P value = 0.37).
Subgroup analysis of the febrile and healthy groups
To determine whether using febrile and healthy controls impacts the differences in total
leukocyte counts, a subgroup analysis of the non-malaria groups was conducted (Fig 7). The
results showed that 13 studies using febrile controls demonstrated a significantly lower leuko-
cyte count in the malaria group than in the non-malaria group (Z = 1.33, P-value< 0.0001,
PLOS ONE The leukocyte alteration in malaria
PLOS ONE | https://doi.org/10.1371/journal.pone.0233913 June 23, 2020 6 / 28

Ta
ble
1.
Ch
ara
cter
isti
cso
fth
ein
clu
ded
stu
die
s.
Ref
eren
ces
Stu
dy
are
a
(yea
rso
f
the
surv
ey)
Mea
na
ge
of
the
ma
lari
a
gro
up
(yea
rs)
Mea
na
ge
of
the
no
n-
ma
lari
a
(yea
rs)
Ma
lese
xPlasmod
ium
sp.
To
tal
leu
ko
cyte
cou
nt
(10
3/μ
L)
(mea
n±
SD
)
Sev
erit
yS
ou
rce
of
leu
ko
cyte
cou
nt
All
pa
rtic
ipa
nts
Ca
ses
of
P.f
Ca
ses
of
P.v
Ca
ses
of
P.o
Ca
ses
of
P.m
All
case
s
No
n-
ma
lari
a
Ch
ara
cter
isti
cs
of
no
n-m
ala
ria
Ad
amet
al.,
20
17
[41
]
Su
dan
(20
14
–
20
15
)
20
.7±1
9.6
20±1
9A
ll
gro
up
s=
50
%;
Mal
aria
=5
0%
;
No
n-
mal
aria
=5
0%
P.falciparum
andP.
vivax
Mea
nle
uk
ocy
teco
un
t
inm
alar
ia6
.7±
0.9
;
-P.f
6.6±0
.9;
-P.v
6.9±1
.3;
Mea
nle
uk
ocy
teco
un
t
inn
on
-mal
aria
8.1±
1.4
UM
Sysm
exX
N-
90
00
;H
yo
go
,
Jap
an
32
41
07
55
16
21
62
Feb
rile
An
sart
etal
.,
20
10
[37
]
Fra
nce
(20
02
–
20
03
)
1.1
–5
51
.1–
42
All
gro
up
s=
57
%;
Mal
aria
=5
7%
;
No
n-
mal
aria
=5
7%
P. falciparum
,
P.vivax,
and
P.ovale
Mea
nle
uk
ocy
teco
un
t
inm
alar
ia9
.25
;
Mea
nle
uk
ocy
teco
un
t
inn
on
-mal
aria
11
.2
NA
NA
27
23
61
44
34
21
8F
ebri
le
An
war
etal
.,
20
16
[42
]
Pak
ista
n
(20
15
–
20
16
)
15
–2
02
1–
60
All
gro
up
s=
10
0%
;
Mal
aria
=1
00
%;
No
n-
mal
aria
=1
00
%
Did
no
t
def
ine
spec
ies
Mea
nle
uk
ocy
teco
un
t
inm
alar
ia5
.03±1
3.8
;
Mea
nle
uk
ocy
teco
un
t
inn
on
-mal
aria
9.5±1
3.8
NA
NA
65
Sp
ecie
sn
ot
def
ined
60
60
5H
ealt
hy
Aw
ok
eN
and
Aro
taA
,
20
19
[5]
Eth
iop
ia
(20
16
)
27
.62
7.6
All
gro
up
s=
70
%;
Mal
aria
=7
0%
;
No
n-
mal
aria
=7
0%
P. falciparum
,
P.vivax,an
dm
ixed
infe
ctio
n(4
case
s)
Mea
nle
uk
ocy
teco
un
t
inm
alar
ia5
.3±2
.2
(in
clu
din
gm
ixed
infe
ctio
ns)
;
Mea
nn
eutr
op
hil
cou
nt
3.5
2±1
.8;
Mea
nly
mp
ho
cyte
cou
nt
1.1
7±0
.65
;
NL
rati
o=
3±2
.77
Mea
nle
uk
ocy
teco
un
t
inn
on
-mal
aria
5.8±1
.8;
Mea
nn
eutr
op
hil
cou
nt
3.3
0±1
.4;
Mea
nly
mp
ho
cyte
cou
nt
1.7
8±0
.58
;
NL
rati
o=
1.8
5±2
.41
NA
CE
LL
-DY
N
18
00
34
01
05
61
-1
66
17
0F
ebri
le
Ch
aves
etal
.,
20
16
[15
]
Bra
zil
(NA
)
35
.4±1
4.3
27
.1±7
.4A
ll
gro
up
s=
54
.5%
Mal
aria
=4
5%
No
n-
mal
aria
=6
4%
P.vivax
Med
ian
leu
ko
cyte
cou
nt
inm
alar
ia5
.7(4
.0–
7.3
);
Mea
nn
eutr
op
hil
cou
nt
3.4
5±0
.89
;
Mea
nly
mp
ho
cyte
cou
nt
1.2
8±0
.38
;
NL
rati
o=
2.7±2
.34
Med
ian
leu
ko
cyte
cou
nt
inn
on
-mal
aria
6.7
(6.1
–
7.8
);
Mea
nn
eutr
op
hil
cou
nt
4.0
5±0
.53
;
Mea
nly
mp
ho
cyte
cou
nt
2.0
5±0
.35
;
NL
rati
o=
1.9
8±1
.51
UM
Sysm
exK
X-
21
N1
56
-3
6-
36
20
Hea
lth
y
(Con
tinued)
PLOS ONE The leukocyte alteration in malaria
PLOS ONE | https://doi.org/10.1371/journal.pone.0233913 June 23, 2020 7 / 28
Ta
ble
1.
(Co
nti
nu
ed)
Ref
eren
ces
Stu
dy
are
a
(yea
rso
f
the
surv
ey)
Mea
na
ge
of
the
ma
lari
a
gro
up
(yea
rs)
Mea
na
ge
of
the
no
n-
ma
lari
a
(yea
rs)
Ma
lese
xPlasmod
ium
sp.
To
tal
leu
ko
cyte
cou
nt
(10
3/μ
L)
(mea
n±
SD
)
Sev
erit
yS
ou
rce
of
leu
ko
cyte
cou
nt
All
pa
rtic
ipa
nts
Ca
ses
of
P.f
Ca
ses
of
P.v
Ca
ses
of
P.o
Ca
ses
of
P.m
All
case
s
No
n-
ma
lari
a
Ch
ara
cter
isti
cs
of
no
n-m
ala
ria
Erh
art
etal
.,
20
04
[6]
Th
aila
nd
(20
01
)
All
gro
up
s=
28
All
gro
up
s=
63
%
P. falciparum
,
P.vivax,
P.malariae,
P.ovale,
and
mix
ed
infe
ctio
ns
(23
case
s)
Mea
nle
uk
ocy
teco
un
t
inm
alar
ia6
.4;
-P.f
6.3
;
-P.v
6.6
(ex
clu
din
gm
ixed
infe
ctio
ns)
Mea
nle
uk
ocy
teco
un
t
inn
on
-mal
aria
8.4
UM
Bec
km
an-
Co
ult
er,
Inc,
Fu
ller
ton
,
CA
21
49
41
46
46
21
51
06
09
79
Feb
rile
Fri
mp
on
g
etal
.,2
01
8
[26
]
Gh
ana
(NA
)
6.5
(4.7
–8
)9
(8–
11
)A
ll
gro
up
s=
50
%;
Mal
aria
=4
7%
;
No
n-
mal
aria
=5
3%
P.falciparum
Mea
nle
uk
ocy
teco
un
t
inm
alar
ia6
.4(3
.2–
9.0
);
Med
ian
leu
ko
cyte
cou
nt
inn
on
-mal
aria
7(5
.7–
8.0
)
UM
NA
57
40
40
17
Hea
lth
y
Go
nca
lves
etal
.,2
01
0
[39
]
Bra
zil
(NA
)
35
(23
.3–
42
.3)
32
(28
–4
2)
All
gro
up
s=
57
.1%
;
Mal
aria
=5
5.5
%;
No
n-
mal
aria
=5
8.7
%
P. falciparum
,
P.vivax,an
dm
ixed
infe
ctio
ns
(14
case
s)
Mea
nle
uk
ocy
teco
un
t
inm
alar
ia5
.6±0
.7;
-P.f
5.3±0
.8;
-P.v
5.7±0
.6
(ex
clu
din
gm
ixed
infe
ctio
ns)
;
Mea
nle
uk
ocy
teco
un
t
inn
on
-mal
aria
7.8±1
.1
UM
AB
XM
icro
60
,H
ori
ba,
Mo
ntp
elli
er,
Fra
nce
80
19
43
62
18
Hea
lth
y
Go
nza
lez
etal
.,2
00
9
[34
]
Ven
ezu
ela
(NA
)
3–
67
NA
All
gro
up
s=
64
.4;
Mal
aria
=6
4.4
%;
No
n-
mal
aria
=N
A
P.vivax
Mea
nle
uk
ocy
teco
un
t
inm
alar
ia7
,01±2
,34
;
Mea
nn
eutr
op
hil
cou
nt
4.9
6±2
.0;
Mea
nly
mp
ho
cyte
cou
nt
2.9
8±1
.28
;
NL
rati
o=
1.6
6±1
.56
Mea
nle
uk
ocy
teco
un
t
inn
on
-mal
aria
8,0
1±
2,0
3;
Mea
nn
eutr
op
hil
cou
nt
4.2
7±1
.75
Mea
nly
mp
ho
cyte
cou
nt
4.8
9±1
.41
;
NL
rati
o=
0.9
6±1
.24
NA
NA
69
59
59
30
Hea
lth
y
(Con
tinued)
PLOS ONE The leukocyte alteration in malaria
PLOS ONE | https://doi.org/10.1371/journal.pone.0233913 June 23, 2020 8 / 28

Ta
ble
1.
(Co
nti
nu
ed)
Ref
eren
ces
Stu
dy
are
a
(yea
rso
f
the
surv
ey)
Mea
na
ge
of
the
ma
lari
a
gro
up
(yea
rs)
Mea
na
ge
of
the
no
n-
ma
lari
a
(yea
rs)
Ma
lese
xPlasmod
ium
sp.
To
tal
leu
ko
cyte
cou
nt
(10
3/μ
L)
(mea
n±
SD
)
Sev
erit
yS
ou
rce
of
leu
ko
cyte
cou
nt
All
pa
rtic
ipa
nts
Ca
ses
of
P.f
Ca
ses
of
P.v
Ca
ses
of
P.o
Ca
ses
of
P.m
All
case
s
No
n-
ma
lari
a
Ch
ara
cter
isti
cs
of
no
n-m
ala
ria
Han
sch
eid
etal
.,2
00
8
[7]
Gab
on
(20
03
–
20
04
)
3.7
0.6
All
case
s=
46
%P.
falciparum
Mea
nle
uk
ocy
teco
un
t
inm
alar
ia8
.7±9
.6;
Mea
nle
uk
ocy
teco
un
t
inse
ver
em
alar
ia1
0
±3.9
2;
Mea
nle
uk
ocy
teco
un
t
inu
nco
mp
lica
ted
mal
aria
8.1±2
.6;
Mea
nn
eutr
op
hil
cou
nt
3.8±1
.49
;
Mea
nly
mp
ho
cyte
cou
nt
3±1
.73
;
NL
rati
o=
1.2
7±1
.1;
Mea
nle
uk
ocy
teco
un
t
inn
on
-mal
aria
9.5±1
.2;
Mea
nn
eutr
op
hil
cou
nt
2.7±1
.11
;
Mea
nly
mp
ho
cyte
cou
nt
5.5±1
.42
;
NL
rati
o=
0.4
9±0
.78
UM
=1
04
SM
=4
8
SA
=1
5
HP
=1
3
HG
=3
CM
=1
7
Cel
l-
Dyn
30
001
(CD
30
00
)
inst
rum
ent
(Ab
bo
tt,
San
taC
lara
,
Cal
ifo
rnia
36
81
52
30
21
6F
ebri
le
Has
on
aet
al.,
20
16
[43
]
Sau
di
Ara
bia
(20
14
–
20
15
)
All
gro
up
s=
20
–6
0N
AP.
falciparum
andP.
vivax
Mea
nle
uk
ocy
teco
un
t
inm
alar
ia
-P
.f.4
.21±
0.3
5;
-P
.v.
3.4
5±
0.1
2;
Mea
nn
eutr
op
hil
cou
nt
2.9±0
.04
;
Mea
nly
mp
ho
cyte
cou
nt
2.6
3±0
.02
;
NL
rati
o=
1.1±2
.0;
Mea
nle
uk
ocy
teco
un
t
inn
on
-mal
aria
6.9
4±
0.1
3;
Mea
nn
eutr
op
hil
cou
nt
3.4
7±0
.03
;
Mea
nly
mp
ho
cyte
cou
nt
2.7
8±0
.02
;
NL
rati
o=
1.2
5±1
.5
NA
SY
SM
X.K
X-
21
n
12
06
24
20
90
Hea
lth
y
Ho
jo-S
ou
za
etal
.,2
01
5
[32
]
Bra
zil
(NA
)
38
.5(1
9–
61
)
34
.0(2
2–
37
)
All
gro
up
s=
48
.7;
Mal
aria
=2
7.3
%;
No
n-
mal
aria
=7
0%
P.vivax
Mea
nle
uk
ocy
teco
un
t
inm
alar
ia5
.5±
0.4
;
Mea
nn
eutr
op
hil
cou
nt
3.6
9±2
.58
;
Mea
nly
mp
ho
cyte
cou
nt
1.5
1±1
.23
;
NL
rati
o=
2.4
4±2
.1;
Mea
nle
uk
ocy
teco
un
t
inn
on
-mal
aria
8.1±
0.5
;
Mea
nn
eutr
op
hil
cou
nt
5.2
7±
3.9
7;
Mea
nly
mp
ho
cyte
cou
nt
2.6
5±2
.22
;
NL
rati
o=
1.9
9±1
.79
UM
AB
XP
entr
a
90
;H
ori
ba
Dia
gn
ost
ics,
Kyo
to,
Jap
an
31
20
15
21
1H
ealt
hy
(Con
tinued)
PLOS ONE The leukocyte alteration in malaria
PLOS ONE | https://doi.org/10.1371/journal.pone.0233913 June 23, 2020 9 / 28

Ta
ble
1.
(Co
nti
nu
ed)
Ref
eren
ces
Stu
dy
are
a
(yea
rso
f
the
surv
ey)
Mea
na
ge
of
the
ma
lari
a
gro
up
(yea
rs)
Mea
na
ge
of
the
no
n-
ma
lari
a
(yea
rs)
Ma
lese
xPlasmod
ium
sp.
To
tal
leu
ko
cyte
cou
nt
(10
3/μ
L)
(mea
n±
SD
)
Sev
erit
yS
ou
rce
of
leu
ko
cyte
cou
nt
All
pa
rtic
ipa
nts
Ca
ses
of
P.f
Ca
ses
of
P.v
Ca
ses
of
P.o
Ca
ses
of
P.m
All
case
s
No
n-
ma
lari
a
Ch
ara
cter
isti
cs
of
no
n-m
ala
ria
Igb
eneg
hu
etal
.,2
01
1
[8]
Nig
eria
(NA
)
31
.9±
11
.13
4.0±
12
.1A
ll
gro
up
s=
80
.9;
Mal
aria
=9
0.8
%;
No
n-
mal
aria
=7
0.7
%
P.vivax,P.
malariae,
and
mix
ed
infe
ctio
ns
(3
case
s)
Mea
nle
uk
ocy
teco
un
t
inm
alar
ia4
.68±1
.4;
Mea
nle
uk
ocy
teco
un
t
inn
on
-mal
aria
5.3
8±2
.1
UM
Co
ult
er
cou
nte
r
(ST
KS
mo
del
)
66
81
36
21
38
52
7H
ealt
hy
Jere
mia
h
etal
.,2
00
7
[28
]
Nig
eria
(20
05
–
20
06
)
All
gro
up
s=
1–
8A
ll
gro
up
s=
48
.8%
P.falciparum
Mea
nle
uk
ocy
teco
un
t
inm
alar
ia5
.4±2
.3;
Mea
nle
uk
ocy
teco
un
t
inn
on
-mal
aria
5.3±2
.3
UM
Tu
rk’s
met
ho
d
24
06
66
61
74
Hea
lth
y
Kay
od
eet
al.,
20
11
[29
]
Nig
eria
(20
10
–
20
11
)
All
gro
up
s=
14
–3
0N
AP.
falciparum
Mea
nle
uk
ocy
teco
un
t
inm
alar
ia6
.5±0
.1;
Mea
nn
eutr
op
hil
cou
nt
4.2
4±0
.02
;
Mea
nly
mp
ho
cyte
cou
nt
2.2
6±0
.02
;
NL
rati
o=
1.8
8±1
.0;
Mea
nle
uk
ocy
teco
un
t
inn
on
-mal
aria
5.1±0
.2;
Mea
nn
eutr
op
hil
cou
nt
1.7
6±0
.09
;
Mea
nly
mp
ho
cyte
cou
nt
3.9
3±0
.06
;
NL
rati
o=
0.4
5±1
.5
NA
WB
Cd
ilu
tin
g
flu
id
40
30
30
10
Hea
lth
y
Kim
etal
.,
20
08
[4]
Rep
ub
lic
of
Ko
rea
(20
00
–
20
06
)
26
.1±1
1.1
24
.5±3
.7A
ll
gro
up
s=
79
.4;
Mal
aria
=8
1.8
%;
No
n-
mal
aria
=7
6.9
%
P.vivax
Mea
nle
uk
ocy
teco
un
t
inm
alar
ia4
.9±1
.4;
Mea
nle
uk
ocy
teco
un
t
inn
on
-mal
aria
5.9±1
.4
UM
Cel
l-D
yn
40
00
,A
bb
ott
dia
gn
ost
ics,
US
A
14
15
55
55
2H
ealt
hy
Kim
bi
etal
.,
20
13
[9]
Cam
ero
on
(20
11
)
All
gro
up
s=
8.2
6±2
.2A
ll
gro
up
s=
47
.8%
P.falciparum
Mea
nle
uk
ocy
teco
un
t
inm
alar
ia5
.1±2
.5;
Mea
nle
uk
ocy
teco
un
t
inn
on
-mal
aria
6.3±
1.9
UM
Bec
km
an
Co
ult
er
cou
nte
r
(UR
IT3
00
0)
72
81
58
15
85
70
Feb
rile
and
hea
lth
y
Ko
ltas
etal
.,
20
07
[35
]
Tu
rkey
(20
02
–
20
04
)
33
.8±1
8.6
39±1
5A
ll
gro
up
s=
61
.5%
P.vivax
Mea
nle
uk
ocy
teco
un
t
inm
alar
ia6
.2±1
.9;
Mea
nle
uk
ocy
teco
un
t
inn
on
-mal
aria
7.6±
2.2
NA
NA
14
29
09
05
2H
ealt
hy
Ko
tep
ui
etal
.,2
01
4
[13
]
Th
aila
nd
(20
09
)
24
.5(1
7–
38
)
16
(7–
35
)A
ll
gro
up
s=
55
.7%
;
Mal
aria
=6
0.3
%;
No
n-
mal
aria
=5
1.1
%
P.falciparum
andP.
vivax
Mea
nle
uk
ocy
teco
un
t
inm
alar
ia5
.9±0
.9;
-P.f
6.0±1
.0;
-P.v
5.7±0
.8;
Mea
nn
eutr
op
hil
cou
nt
3.7
1±0
.66
;
Mea
nly
mp
ho
cyte
cou
nt
1.3
5±0
.37
;
NL
rati
o=
2.7
5±1
.78
;
Mea
nle
uk
ocy
teco
un
t
inn
on
-mal
aria
9.0±1
.8;
Mea
nn
eutr
op
hil
cou
nt
5.3
6±1
.41
;
Mea
nly
mp
ho
cyte
cou
nt
2.3
9±0
.57
;
NL
rati
o=
2.2
4±2
.47
NA
BC
-52
00
Hae
mat
olo
gy
An
alyze
r
(Min
dra
y,
Nan
shan
,
Sh
enzh
en,
Ch
ina
49
85
35
23
51
70
34
28
2F
ebri
le
(Con
tinued)
PLOS ONE The leukocyte alteration in malaria
PLOS ONE | https://doi.org/10.1371/journal.pone.0233913 June 23, 2020 10 / 28

Ta
ble
1.
(Co
nti
nu
ed)
Ref
eren
ces
Stu
dy
are
a
(yea
rso
f
the
surv
ey)
Mea
na
ge
of
the
ma
lari
a
gro
up
(yea
rs)
Mea
na
ge
of
the
no
n-
ma
lari
a
(yea
rs)
Ma
lese
xPlasmod
ium
sp.
To
tal
leu
ko
cyte
cou
nt
(10
3/μ
L)
(mea
n±
SD
)
Sev
erit
yS
ou
rce
of
leu
ko
cyte
cou
nt
All
pa
rtic
ipa
nts
Ca
ses
of
P.f
Ca
ses
of
P.v
Ca
ses
of
P.o
Ca
ses
of
P.m
All
case
s
No
n-
ma
lari
a
Ch
ara
cter
isti
cs
of
no
n-m
ala
ria
Mag
hen
dji
-
Nzo
nd
o
etal
.,2
01
6
[44
]
Gab
on
(20
13
–
20
14
)
51
.6±3
9.2
45
.2±3
9A
ll
gro
up
s=
52
.3%
;
Mal
aria
=5
0%
;
No
n-
mal
aria
=5
4.5
%
P.falciparum
Mea
nle
uk
ocy
teco
un
t
inm
alar
ia5
.6±4
.1;
Mea
nle
uk
ocy
teco
un
t
inn
on
-mal
aria
11
.4±
7.5
NA
Co
ult
erS
TK
S
(ST
KS1
,
Co
ult
erC
orp
,
US
A).
11
29
53
05
30
10
79
Feb
rile
Mag
hen
dji
-
Nzo
nd
o
etal
.,2
01
6
[27
]
Gab
on
(20
11
–
20
12
)
63
.4±
39
.44
0.3±
37
.1A
ll
gro
up
s=
47
%;
Mal
aria
=5
0%
;
No
n-
mal
aria
=4
4%
P.falciparum
and
P.malariae
Mea
nle
uk
ocy
teco
un
t
inm
alar
ia8
.6±
6.4
Mea
nle
uk
ocy
teco
un
t
inn
on
-mal
aria
10
.8±
6.3
UM
=1
45
SM
=1
7
SA
=1
2
CM
=4
PT
=1
Co
ult
erS
TK
S
(ST
KS1
,
Co
ult
erC
orp
,
US
A).
94
01
58
41
62
77
8F
ebri
le
Ok
afo
ret
al.,
20
16
[38
]
So
uth
Afr
ica
(20
12
–
20
13
)
NA
All
gro
up
s=
=
61
.8%
P.falciparum
and
mix
ed
infe
ctio
ns
(6
case
s)
Mea
nle
uk
ocy
teco
un
t
inm
alar
ia4
.1±
0.4
6
(in
clu
din
gm
ixed
infe
ctio
ns)
;
Mea
nle
uk
ocy
teco
un
t
inn
on
-mal
aria
5.6±
1.8
9
UM
=8
2
SM
=1
0
SA
=1
0
Sysm
exX
E
50
00
Au
tom
ated
Hae
mat
olo
gy
An
alyse
r,
(Sysm
ex,
Can
ada)
92
66
86
Feb
rile
Ou
rives
etal
.,2
01
5
[33
]
Bra
zil
(NA
)
>1
83
5–
55
All
gro
up
s=
=
44
%;
Mal
aria
=N
A;
No
n-
mal
aria
=4
4%
P.vivax
Mea
nle
uk
ocy
teco
un
t
inm
alar
ia7
.6;
Mea
nle
uk
ocy
teco
un
t
inco
ntr
ol
6.0
NA
AB
X
PE
NT
RA
90
,
(Ho
rib
a
Dia
gn
ost
ic,
Kyo
to,
Jap
an)
17
31
48
14
82
5H
ealt
hy
Ph
ilip
ose
CS
and
Um
ash
ank
ar
T,
20
16
[40
]
Ind
ia
(20
14
)
36
.1±1
7.1
48
.3±1
9.2
NA
P. falciparum
,
P.vivaxan
dm
ixed
infe
ctio
ns
(18
case
s)
Mea
nle
uk
ocy
teco
un
t
inm
alar
ia6
.3±3
.1
(in
clu
din
gm
ixed
infe
ctio
ns)
;
Mea
nn
eutr
op
hil
cou
nt
3.9
6±2
.98
;
Mea
nly
mp
ho
cyte
cou
nt
1.5
9±1
.23
;
NL
rati
o=
2.4
9±2
.42
;
Mea
nle
uk
ocy
teco
un
t
inco
ntr
ol
9.5±5
.7;
Mea
nn
eutr
op
hil
cou
nt
6.5
6±5
.52
;
Mea
nly
mp
ho
cyte
cou
nt
1.9
8±1
.26
;
NL
rati
o=
3.3
3±4
.38
NA
Bec
km
ann
Co
ult
er1
hem
ato
log
ical
anal
yze
r
30
01
80
21
82
10
0F
ebri
le
(Con
tinued)
PLOS ONE The leukocyte alteration in malaria
PLOS ONE | https://doi.org/10.1371/journal.pone.0233913 June 23, 2020 11 / 28

Ta
ble
1.
(Co
nti
nu
ed)
Ref
eren
ces
Stu
dy
are
a
(yea
rso
f
the
surv
ey)
Mea
na
ge
of
the
ma
lari
a
gro
up
(yea
rs)
Mea
na
ge
of
the
no
n-
ma
lari
a
(yea
rs)
Ma
lese
xPlasmod
ium
sp.
To
tal
leu
ko
cyte
cou
nt
(10
3/μ
L)
(mea
n±
SD
)
Sev
erit
yS
ou
rce
of
leu
ko
cyte
cou
nt
All
pa
rtic
ipa
nts
Ca
ses
of
P.f
Ca
ses
of
P.v
Ca
ses
of
P.o
Ca
ses
of
P.m
All
case
s
No
n-
ma
lari
a
Ch
ara
cter
isti
cs
of
no
n-m
ala
ria
Ro
dri
gu
es-
da-
Sil
va
etal
.,2
01
4
[45
]
Bra
zil
(20
10
)
All
gro
up
s=
28
.3(2
2.5
–
40
)
All
gro
up
s=
=
27
%;
Mal
aria
=2
7%
;
No
n-
mal
aria
=N
A
P.falciparum
andP.
vivax
Mea
nle
uk
ocy
teco
un
t
inm
alar
ia5
.1±0
.8;
-P
.f=
4.9±0
.8;
-P
.v=
5.2±0
.8;
Mea
nn
eutr
op
hil
cou
nt
3.3
5±0
.63
;
Mea
nly
mp
ho
cyte
cou
nt
2.1±0
.31
;
NL
rati
o=
1.6±2
.2;
Mea
nle
uk
ocy
teco
un
t
inco
ntr
ols
;
6.5±0
.6
Mea
nn
eutr
op
hil
cou
nt
3.8
5±0
.5;
Mea
nly
mp
ho
cyte
cou
nt
2.2
4±0
.29
;
NL
rati
o=
1.7
2±1
.72
UM
AB
X
PE
NT
RA
90
,
(Ho
rib
a
Dia
gn
ost
ic,
Kyo
to,
Jap
an)
83
24
47
71
12
Hea
lth
y
Sal
ihet
al.,
20
18
[31
]
Su
dan
(20
15
)
5.3±3
.95
.7±3
All
gro
up
s=
59
.4%
P.falciparum
Med
ian
leu
ko
cyte
cou
nt
inm
alar
ia
7.4
(5.2−9
.5);
Mea
nle
uk
ocy
teco
un
t
inse
ver
em
alar
ia8
.98
±2.0
6;
Mea
nle
uk
ocy
teco
un
t
inu
nco
mp
lica
ted
mal
aria
7.3
3±1
.09
;
Mea
nn
eutr
op
hil
cou
nt
4.6
3±1
.17
;
Mea
nly
mp
ho
cyte
cou
nt
2.4
5±0
.72
NL
rati
o=
1.8
9±1
.63
;
Med
ian
leu
ko
cyte
cou
nt
inco
ntr
ol
9.1
(5.3
−12
.4);
Mea
nn
eutr
op
hil
cou
nt
3.4
5±1
.15
;
Mea
nly
mp
ho
cyte
cou
nt
3.8±0
.89
;
NL
rati
o=
0.9
1±1
.29
UM
=6
3
SM
=6
7
CM
=1
0
CV
=1
8
SA
=9
HG
=1
HT
=7
JD=
6
HP
=9
MT
1=
8
Sysm
exX
N-
90
00
;H
yo
go
,
Jap
an
18
01
30
13
05
0H
ealt
hy
Sq
uir
eet
al.,
20
16
[36
]
Gh
ana
(20
12
–
20
13
)
4.9
(3.7
–
6.4
)
3.9
6(3
.0–
4.9
)
All
gro
up
s=
57
.7%
;
Mal
aria
=6
4%
;
No
n-
mal
aria
=5
1.4
%
P.vivax
Mea
nle
uk
ocy
teco
un
t
inm
alar
ia
9.5±1
.6;
Mea
nle
uk
ocy
teco
un
t
inse
ver
em
alar
ia8
.91
±0.8
;
Mea
nle
uk
ocy
teco
un
t
inu
nco
mp
lica
ted
mal
aria
10
.1±2
.8;
Mea
nle
uk
ocy
teco
un
t
inco
ntr
ol
8.9±0
.9
UM
=2
4
SM
=8
1
SA
=2
Sysm
exK
X-
21
N,
Jap
an
15
01
05
10
54
5F
ebri
le
(Con
tinued)
PLOS ONE The leukocyte alteration in malaria
PLOS ONE | https://doi.org/10.1371/journal.pone.0233913 June 23, 2020 12 / 28

Ta
ble
1.
(Co
nti
nu
ed)
Ref
eren
ces
Stu
dy
are
a
(yea
rso
f
the
surv
ey)
Mea
na
ge
of
the
ma
lari
a
gro
up
(yea
rs)
Mea
na
ge
of
the
no
n-
ma
lari
a
(yea
rs)
Ma
lese
xPlasmod
ium
sp.
To
tal
leu
ko
cyte
cou
nt
(10
3/μ
L)
(mea
n±
SD
)
Sev
erit
yS
ou
rce
of
leu
ko
cyte
cou
nt
All
pa
rtic
ipa
nts
Ca
ses
of
P.f
Ca
ses
of
P.v
Ca
ses
of
P.o
Ca
ses
of
P.m
All
case
s
No
n-
ma
lari
a
Ch
ara
cter
isti
cs
of
no
n-m
ala
ria
Su
mb
ele
etal
.,2
01
7
[30
]
Cam
ero
on
(20
14
)
All
gro
up
s=
25
.5A
ll
gro
up
s=
49
.6%
P.falciparum
Mea
nle
uk
ocy
teco
un
t
inm
alar
ia
8.9±3
.3;
Mea
nle
uk
ocy
teco
un
t
inco
ntr
ol
8.4±3
.4
UM
=1
24
SM
=1
SA
=1
UR
IT-3
30
0
Au
tom
ated
Hem
ato
log
y
An
alyze
r
(Gu
ilin
Bo
test
Med
ical
Ele
ctro
nic
Co
.L
td,
PR
Ch
ina)
38
71
25
12
52
62
Feb
rile
Wo
rku
etal
.,
19
97
[46
]
Eth
iop
ia
(NA
)
All
gro
up
s=
27
(22
–3
2)
All
gro
up
s=
79
.5%
P.falciparum
andP.
vivax
Mea
nle
uk
ocy
teco
un
t
inm
alar
ia5
.5±0
.7;
-P
.f.=
4.9±0
.6;
-P
.v.
=6
.0±0
.8;
Mea
nle
uk
ocy
teco
un
t
inco
ntr
ol
-7.4±1
.3
NA
NA
55
19
20
39
16
Hea
lth
y
UM
=u
nco
mp
lica
ted
mal
aria
,S
M=
sever
em
alar
ia,S
A=
sever
ean
emia
,H
P=
hyp
erp
aras
item
ia,H
G=
hyp
og
lyce
mia
,C
M=
cere
bra
lm
alar
ia,
PT
=p
rost
rati
on
,H
T=
hyp
ote
nsi
on
,
CV
=co
nvu
lsio
n,JD
=ja
un
dic
e,M
T1
=m
ore
than
1co
mp
lica
tio
n.
htt
ps:
//doi.o
rg/1
0.1
371/jo
urn
al.p
one.
0233913.t001
PLOS ONE The leukocyte alteration in malaria
PLOS ONE | https://doi.org/10.1371/journal.pone.0233913 June 23, 2020 13 / 28

Table 2. Quality of the included studies.
No. Reference Selection Compatibility Exposure Quality of
included
studiesIs the Case
Definition
Adequate?
Representativeness
of the Cases
Selection
of Non-
malaria
Definition
of Non-
malaria
Ascertainment
of Exposure
Same method of
ascertainment
for cases and
non-malaria
Nonresponse
Rate
1. Adam et al.
[41]
✵ ✵ ✵ ✵ ✵✵ ✵ ✵ ✵ Good
2. Ansart et al.
[37]
✵ ✵ ✵ ✵ ✵✵ ✵ ✵ ✵ Good
3. Anwar et al.
[42]
✵ ✵ ✵ ✵ ✵✵ ✵ ✵ ✵ Good
4. Awoke N and
Arota A [5]
✵ ✵ ✵ ✵ ✵✵ ✵ ✵ ✵ Good
5. Chaves et al.
[15]
✵ ✵ ✵ ✵ ✵✵ ✵ ✵ ✵ Good
6. Erhart et al
[6]
✵ ✵ ✵ ✵ ✵✵ ✵ ✵ ✵ Good
7. Frimpong
et al. [26]
✵ ✵ ✵ ✵ ✵✵ ✵ ✵ ✵ Good
8. Goncalves
et al. [39]
✵ ✵ ✵ ✵ ✵✵ ✵ ✵ ✵ Good
9. Gonzalez
et al. [34]
✵ ✵ ✵ ✵ ✵✵ ✵ ✵ ✵ Good
10. Hanscheid
et al. [7]
✵ ✵ ✵ ✵ ✵✵ ✵ ✵ ✵ Good
11. Hasona et al.
[43]
✵ ✵ ✵ ✵ ✵✵ ✵ ✵ ✵ Good
12. Hojo-Souza
et al. [32]
✵ ✵ ✵ ✵ ✵✵ ✵ ✵ ✵ Good
13. Igbeneghu
et al. [8]
✵ ✵ ✵ ✵ ✵✵ ✵ ✵ ✵ Good
14. Jeremiah et al.
[28]
✵ ✵ ✵ ✵ ✵✵ ✵ ✵ ✵ Good
15. Kayode et al.
[29]
✵ ✵ ✵ ✵ ✵✵ ✵ ✵ ✵ Good
16. Kim et al. [4] ✵ ✵ ✵ ✵ ✵✵ ✵ ✵ ✵ Good
17. Kimbi et al.
[9]
✵ ✵ ✵ ✵ ✵✵ ✵ ✵ ✵ Good
18. Koltas et al.
[35]
✵ ✵ ✵ ✵ ✵✵ ✵ ✵ ✵ Good
19. Kotepui et al.
[13]
✵ ✵ ✵ ✵ ✵✵ ✵ ✵ ✵ Good
20. Maghendji-
Nzondo et al.
[44]
✵ ✵ ✵ ✵ ✵✵ ✵ ✵ ✵ Good
21. Maghendji-
Nzondo et al.
[27]]
✵ ✵ ✵ ✵ ✵✵ ✵ ✵ ✵ Good
22. Okafor et al.
[38]
✵ ✵ ✵ ✵✵ ✵ ✵ ✵ Medium
23. Ourives et al.
[33]
✵ ✵ ✵ ✵ ✵✵ ✵ ✵ ✵ Good
(Continued)
PLOS ONE The leukocyte alteration in malaria
PLOS ONE | https://doi.org/10.1371/journal.pone.0233913 June 23, 2020 14 / 28
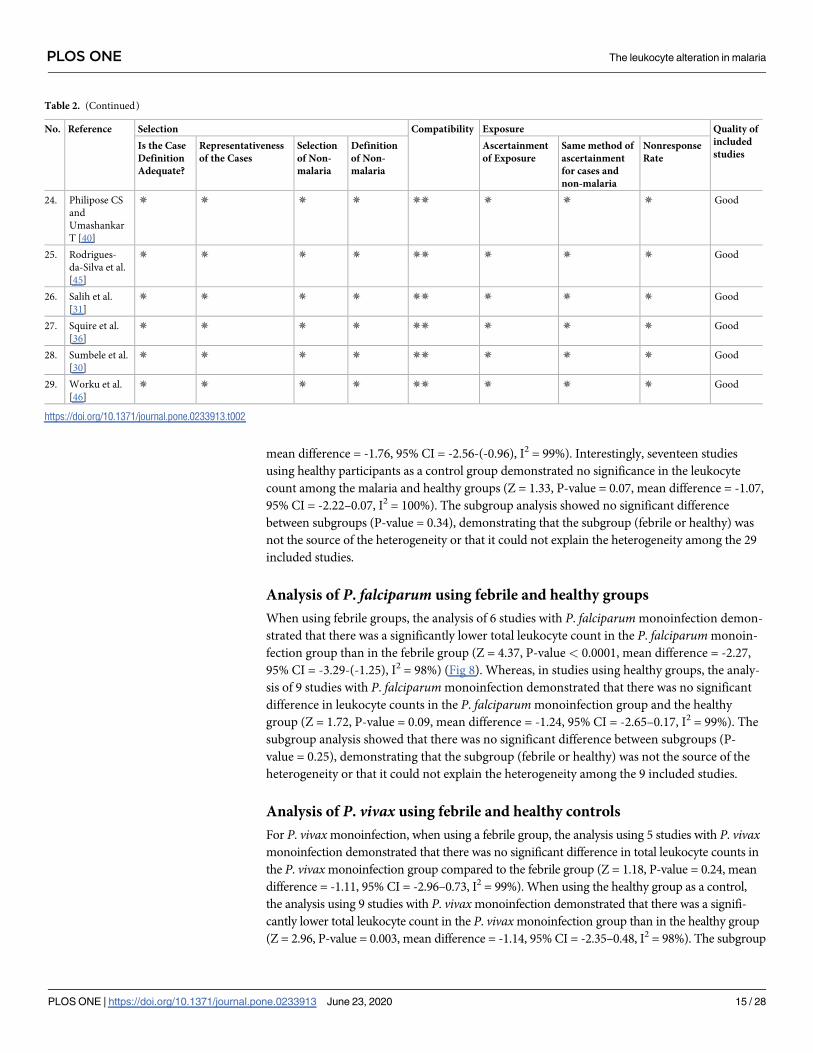
mean difference = -1.76, 95% CI = -2.56-(-0.96), I2 = 99%). Interestingly, seventeen studies
using healthy participants as a control group demonstrated no significance in the leukocyte
count among the malaria and healthy groups (Z = 1.33, P-value = 0.07, mean difference = -1.07,
95% CI = -2.22–0.07, I2 = 100%). The subgroup analysis showed no significant difference
between subgroups (P-value = 0.34), demonstrating that the subgroup (febrile or healthy) was
not the source of the heterogeneity or that it could not explain the heterogeneity among the 29
included studies.
Analysis of P. falciparum using febrile and healthy groups
When using febrile groups, the analysis of 6 studies with P. falciparum monoinfection demon-
strated that there was a significantly lower total leukocyte count in the P. falciparum monoin-
fection group than in the febrile group (Z = 4.37, P-value < 0.0001, mean difference = -2.27,
95% CI = -3.29-(-1.25), I2 = 98%) (Fig 8). Whereas, in studies using healthy groups, the analy-
sis of 9 studies with P. falciparum monoinfection demonstrated that there was no significant
difference in leukocyte counts in the P. falciparum monoinfection group and the healthy
group (Z = 1.72, P-value = 0.09, mean difference = -1.24, 95% CI = -2.65–0.17, I2 = 99%). The
subgroup analysis showed that there was no significant difference between subgroups (P-
value = 0.25), demonstrating that the subgroup (febrile or healthy) was not the source of the
heterogeneity or that it could not explain the heterogeneity among the 9 included studies.
Analysis of P. vivax using febrile and healthy controls
For P. vivax monoinfection, when using a febrile group, the analysis using 5 studies with P. vivaxmonoinfection demonstrated that there was no significant difference in total leukocyte counts in
the P. vivax monoinfection group compared to the febrile group (Z = 1.18, P-value = 0.24, mean
difference = -1.11, 95% CI = -2.96–0.73, I2 = 99%). When using the healthy group as a control,
the analysis using 9 studies with P. vivax monoinfection demonstrated that there was a signifi-
cantly lower total leukocyte count in the P. vivax monoinfection group than in the healthy group
(Z = 2.96, P-value = 0.003, mean difference = -1.14, 95% CI = -2.35–0.48, I2 = 98%). The subgroup
Table 2. (Continued)
No. Reference Selection Compatibility Exposure Quality of
included
studiesIs the Case
Definition
Adequate?
Representativeness
of the Cases
Selection
of Non-
malaria
Definition
of Non-
malaria
Ascertainment
of Exposure
Same method of
ascertainment
for cases and
non-malaria
Nonresponse
Rate
24. Philipose CS
and
Umashankar
T [40]
✵ ✵ ✵ ✵ ✵✵ ✵ ✵ ✵ Good
25. Rodrigues-
da-Silva et al.
[45]
✵ ✵ ✵ ✵ ✵✵ ✵ ✵ ✵ Good
26. Salih et al.
[31]
✵ ✵ ✵ ✵ ✵✵ ✵ ✵ ✵ Good
27. Squire et al.
[36]
✵ ✵ ✵ ✵ ✵✵ ✵ ✵ ✵ Good
28. Sumbele et al.
[30]
✵ ✵ ✵ ✵ ✵✵ ✵ ✵ ✵ Good
29. Worku et al.
[46]
✵ ✵ ✵ ✵ ✵✵ ✵ ✵ ✵ Good
https://doi.org/10.1371/journal.pone.0233913.t002
PLOS ONE The leukocyte alteration in malaria
PLOS ONE | https://doi.org/10.1371/journal.pone.0233913 June 23, 2020 15 / 28

analysis showed that there was no significant difference between the subgroups (P-value = = 0.78)
(Fig 9), demonstrating that the subgroup (febrile or healthy) was not the source of the heterogene-
ity or that it could not explain the heterogeneity among the 5 included studies.
Publication bias
Funnel plot analysis generated a symmetrical funnel plot (Fig 10). The symmetry of the funnel
plot was assessed by Egger’s test, which indicated that no small-study effects were found by
using linear regression analysis (P-value = 0.497, slope coefficient = -0.99). The symmetrical
funnel plot indicated that there was no publication bias.
Discussion
This systematic review and meta-analysis described the pooled mean difference of the total
leukocyte count of our study. The results demonstrated that there was a lower total leukocyte
Fig 1. PRISMA diagram. Flow chart for study selection.
https://doi.org/10.1371/journal.pone.0233913.g001
PLOS ONE The leukocyte alteration in malaria
PLOS ONE | https://doi.org/10.1371/journal.pone.0233913 June 23, 2020 16 / 28

count in the malaria group than in the non-malaria groups. The lower total leukocyte count in
this meta-analysis might be explained by the localization of leukocytes away from the periph-
eral circulation, such as in the spleen, at the sites of infection, or in other peripheral pools,
resulting in a low number of total leukocytes detected in the circulation [12, 47]. A previous
study suggested that the alteration of immune cells in the peripheral blood was also the cause
of leukopenia [48]. Immunity against malaria parasite invasion and the infection of red blood
cells is very high during the liver stage or exoerythrocytic stage compared to the erythrocytic
stage, and major immune responses for these two stages involve CD8+ T cells and antibodies,
respectively [49]. Another possible immune mechanism against malaria infection involves
interleukin 12 (IL-12), which is involved in the pathogenesis of malarial pancytopenia, the
pathogenesis of low total leukocytes, red blood cells, and platelet production from the bone
marrow [50]. One study suggested that the glycosylphosphatidylinositol antigen of malaria
induces monocyte and macrophage activation, resulting in the release of proinflammatory
cytokines, such as tumor necrosis factor-α (TNF-α) and IL-1α, and the phagocytosis of both
Fig 2. Forest plot of the total leukocyte count among included studies. Forest plot showing the total leukocyte count in the malaria and non-malaria groups. [1000/
μL] refers to 1000 per microliter; “IV" in "IV, Random” refers to Inverse variance; "Total" in top row refers to number of patients included; A green square in the
horizontal line refers to the mean difference for each of included study.
https://doi.org/10.1371/journal.pone.0233913.g002
Table 3. Meta-regression analysis of mean age.
SMD Coefficient Standard error t-statistic P-value 95% CI
Mean age -0.03 0.04 -0.72 0.48 -0.11–0.05
Constant -0.25 1.02 -0.25 0.81 -2.35–1.84
� SMD: The standardized mean difference.
https://doi.org/10.1371/journal.pone.0233913.t003
PLOS ONE The leukocyte alteration in malaria
PLOS ONE | https://doi.org/10.1371/journal.pone.0233913 June 23, 2020 17 / 28

Fig 3. Meta-regression graph of mean age as a covariate.
https://doi.org/10.1371/journal.pone.0233913.g003
Fig 4. Forest plot of the neutrophil count among included studies. Forest plot showing the neutrophil count in the malaria and non-malaria groups. [1000/μL] refers
to 1000 per microliter; “IV" in "IV, Random” refers to Inverse variance; "Total" in top row refers to number of patients included; A green square in the horizontal line
refers to the mean difference for each of included study.
https://doi.org/10.1371/journal.pone.0233913.g004
PLOS ONE The leukocyte alteration in malaria
PLOS ONE | https://doi.org/10.1371/journal.pone.0233913 June 23, 2020 18 / 28

infected red blood cells and leukocytes [51]. Several studies have reported that TNF, IL-12, IL-
10, and other cytokines can suppress the production of leukocytes from bone marrow by
inhibiting hemopoietic growth factors or stimulating macrophages to release cytotoxic chemi-
cals, causing damage to hemopoietic cells [52–55].
The differences in leukocyte differential counts were also assessed in the present study.
Among the 11 included studies that reported differential counts, the results demonstrated that
Fig 5. Forest plot of the lymphocyte count among included studies. Forest plot showing the lymphocyte count in the malaria and non-malaria groups. [1000/μL]
refers to 1000 per microliter; “IV" in "IV, Random” refers to Inverse variance; "Total" in top row refers to number of patients included; A green square in the horizontal
line refers to the mean difference for each of included study.
https://doi.org/10.1371/journal.pone.0233913.g005
Fig 6. Forest plot of the NL ratio among included studies. Forest plot showing the NL ratio in the malaria and non-malaria groups. [1000/μL] refers to 1000 per
microliter; “IV" in "IV, Random” refers to Inverse variance; "Total" in top row refers to number of patients included; A green square in the horizontal line refers to the
mean difference for each of included study.
https://doi.org/10.1371/journal.pone.0233913.g006
PLOS ONE The leukocyte alteration in malaria
PLOS ONE | https://doi.org/10.1371/journal.pone.0233913 June 23, 2020 19 / 28

the absolute lymphocyte count and NLR were significantly altered during malaria infection.
The absolute lymphocyte counts of the malaria group were low, and the NLR was high. These
results were consistent with our previous study demonstrating that neutrophil and lymphocyte
counts were the most important leukocytic changes associated with malaria infection [13].
Our previous study also demonstrated that there was a significantly higher NLR in the
malaria-infected group than in the noninfected group [13]. Moreover, the NLR was found to
be correlated with malaria parasitemia, and it was inferior to CRP as a marker for severe
imported malaria [56]. The reduction in lymphocyte counts in the present study may be due
to the redistribution of lymphocytes, with sequestration in the spleen of malaria-infected
patients [50].
Heterogeneity was observed in the 29 articles included in the present study. Although we
used covariates or confounders such as age groups and subgroup analyses of Plasmodium spe-
cies and febrile/healthy groups, they did not reduce the degree of heterogeneity (I2) in the
included studies. Regarding the test for publication bias by Egger’s test (which might deter-
mine publication bias as the source of heterogeneity), no publication bias was found among
the 29 studies. It could be concluded that publication bias was not the underlying cause of data
heterogeneity in the articles included in the present study.
In our systematic review and meta-analysis, the non-malaria groups included both febrile
patients who were negative for malaria parasites and healthy individuals who were located in
the same areas as the malaria group. The results demonstrated that there was a lower total
Fig 7. Subgroup analysis of the total leukocyte count. Forest plot of the subgroup analysis showing the total leukocyte count in malaria compared with the febrile and
healthy groups. [1000/μL] refers to 1000 per microliter; “IV" in "IV, Random” refers to Inverse variance; "Total" in top row refers to number of patients included; A
green square in the horizontal line refers to the mean difference for each of included study.
https://doi.org/10.1371/journal.pone.0233913.g007
PLOS ONE The leukocyte alteration in malaria
PLOS ONE | https://doi.org/10.1371/journal.pone.0233913 June 23, 2020 20 / 28

leukocyte count in the malaria group than in the non-malaria group. However, a subgroup
analysis of the febrile and healthy groups indicated that there was a significantly lower total
leukocyte count in the malaria group than in the febrile group, while a subgroup analysis of
the seventeen studies using the healthy group as a control demonstrated that there was no sig-
nificant decrease in the total leukocyte count in the malaria group. The total leukocyte count
Fig 8. Subgroup analysis of P. falciparum. Forest plot of subgroup analysis showing the total leukocyte count in the P. falciparum group compared to the febrile and
healthy groups. [1000/μL] refers to 1000 per microliter; “IV" in "IV, Random” refers to Inverse variance; "Total" in top row refers to number of patients included; A
green square in the horizontal line refers to the mean difference for each of included study.
https://doi.org/10.1371/journal.pone.0233913.g008
Fig 9. Subgroup analysis of P. vivax. Forest plot of subgroup analysis showing the total leukocyte count in P. vivax compared to febrile and healthy groups. [1000/μL]
refers to 1000 per microliter; “IV" in "IV, Random” refers to Inverse variance; "Total" in top row refers to number of patients included; A green square in the horizontal
line refers to the mean difference for each of included study.
https://doi.org/10.1371/journal.pone.0233913.g009
PLOS ONE The leukocyte alteration in malaria
PLOS ONE | https://doi.org/10.1371/journal.pone.0233913 June 23, 2020 21 / 28

in the malaria group was significantly different from that in the febrile group. Therefore, it is
crucial for researchers to report the total leukocyte count in malaria patients compared to that
in febrile control individuals rather than compared with healthy individuals; a low leukocyte
count is likely to be a useful indicator to aid in malaria diagnosis in malaria-endemic areas.
To confirm whether each Plasmodium species differentially impacted the total leukocyte
count, a subgroup analysis of the total leukocyte count in each Plasmodium spp. was con-
ducted. The mean difference indicated that there was a significant reduction in the total leuko-
cyte count in patients with P. falciparum and P. vivax monoinfection compared to that in
patients in the non-malaria group. Compared with the febrile group, the P. falciparum mono-
infection group had a lower total leukocyte count, while the P. vivax monoinfection group
showed no difference in the total leukocyte count. Compared with the healthy group, the P. fal-ciparum monoinfection group did not show a difference in the total leukocyte count, while the
P. vivax monoinfection group had a lower total leukocyte count. We did not analyze the differ-
ence in the total leukocyte count between P. falciparum and P. vivax because the included stud-
ies did not report total leukocyte counts separately for each species, but some previous studies
indicated that there was a significantly lower total leukocyte count in patients with P. falcipa-rum monoinfection than in those with P. vivax monoinfection [6, 39, 45, 46].
Fig 10. Funnel plot. Funnel plot showing publication bias among the included studies.
https://doi.org/10.1371/journal.pone.0233913.g010
PLOS ONE The leukocyte alteration in malaria
PLOS ONE | https://doi.org/10.1371/journal.pone.0233913 June 23, 2020 22 / 28

The meta-analysis demonstrated that two studies in Nigeria (2010–2011) and Brazil [29,
33] presented an increase in the total leukocyte count in malaria patients compared to non-
malaria patients. The study by Kayode et al. suggested that the increased total leukocyte count
was due to the increased mobilization of leukocytes from the bone marrow to the bloodstream
to fight against malarial parasites [29]. Another study indicated that there was no significant
difference in the total leukocyte count [33]. Both studies used healthy control groups for the
comparison of the total leukocyte count in the malaria group. Interestingly, the latter study
had results consistent with the present study, indicating that there was no significant difference
in the total leukocyte count in malaria and healthy groups [33]. All of these reports did not
indicate the number of days of fever before admission. Our previous study indicated that there
were lower neutrophil/monocyte and higher lymphocyte counts when comparing patients
with fever� 3 days and patients with fever > 3 days (P-value < 0.05). However, the total leu-
kocyte count did not change during the 3 days before admission [57]. The association of the
number of days of fever with the leukocyte count might be explained by a study among native
Dutch volunteers who were bitten by infected mosquitoes in a Controlled Human Malaria
Infection (CHMI) model, which demonstrated an increase in the peripheral total leukocyte
count during malarial infection in the liver stage; however, a subsequent decrease occurred
when the parasites appeared in the peripheral blood [10]. The mechanism of leukocytosis
might involve the infection by malaria parasites in the bone marrow (which would inhibit the
release of leukocytes), increases in proinflammatory cytokines in the peripheral blood, or
febrile paroxysms [50].
A study among children in Africa indicated that a high leukocyte count was associated with
a great risk for death [17]. The cause of death might be delayed diagnosis, as a previous study
indicated that there was an initial increase in peripheral total leukocyte count during liver-
stage infection and a significantly lower total leukocyte count during the blood stage [10].
Here, we present gathered data that support evidence of total leukocyte count as an early detec-
tion tool to screen malarial infection in conjunction with other malarial confirmation tests,
such as in routine malaria diagnosis in malaria-endemic areas. Further, these meta-analytic
results provide clinicians with a rationale for instituting specific initiatives and early interven-
tions in malaria-endemic areas, which may decrease mortality and provide less complicated
and possibly more economical management of potential Plasmodium-related patients, even
before the actual confirmation of Plasmodium infection. A higher total leukocyte count might
indicate the initial stage of malarial infection in the liver, while a low total leukocyte count
could be an indicator of the progression of malarial infection during the blood stage.
Summary of evidence
In summary, our recommendations for further work include using febrile individuals as a con-
trol group to provide data on the differences in the total leukocyte count between the malaria
group and non-malaria groups. This would allow for a precise understanding of malarial infec-
tion-related outcomes and could identify important predictors of the prognosis of malaria
patients. The standardization of both malaria detection techniques and total leukocyte indica-
tors would ensure improved comparability between studies as well as a common approach for
reporting results, which should minimize heterogeneity and allow the calculation of precise
effect measures in a model.
Limitations
The present study had several limitations. First, the heterogeneity, which was not due to publi-
cation bias and other confounders that were already tested in this meta-regression analysis,
PLOS ONE The leukocyte alteration in malaria
PLOS ONE | https://doi.org/10.1371/journal.pone.0233913 June 23, 2020 23 / 28

was a limitation. Some of the published data could not be retrieved because the full-text manu-
scripts were not available. Second, specific leukocyte changes might vary with the level of
malaria endemicity, background hemoglobinopathy, nutritional status, demographic factors,
and malaria immunity [58], which could not be ruled out from this study based on the exclu-
sion criteria. Third, two included studies measured the total leukocyte count using manual
methods [28, 29], which might result in unreliable total leukocyte counts during meta-analysis
and impact the mean difference. These two studies demonstrated that there was a higher mean
leukocyte count in the malaria group than in the non-malaria groups. Fourth, the results of the
present study need to be carefully interpreted, as the specific diagnoses in the febrile groups
were not reported in the included studies. Such information may be highly relevant, such as
bacterial or viral diseases that are likely to cause leukocytosis or dengue, which is likely to
cause leukopenia.
Conclusion
The present systematic review demonstrated that the total leukocyte count was a hematological
parameter that is affected by malarial infection before treatment. Despite the heterogeneity of
the included studies, a significant reduction in the total leukocyte count in malaria patients is a
concern. We recommend including febrile individuals in the non-malaria group to provide
data on the differences in total leukocyte counts in the malaria groups and non-malaria
groups. Future studies must aim to understand the effects of Plasmodium infection on each
specific leukocyte subpopulation, as well as interventions that cause total leukocyte reductions
during follow-up or post-treatment outcomes in malaria-endemic settings.
Supporting information
S1 Checklist. PRISMA statement for reporting systematic reviews and meta-analyses.
(DOC)
S1 Table. Search strategy.
(DOCX)
S2 Table. Detection methods for malaria diagnosis.
(DOCX)
Acknowledgments
The authors would like to thank the authors of all of the published studies that contributed to
the data included in this study.
Author Contributions
Conceptualization: Manas Kotepui, Kwuntida Uthaisar Kotepui.
Data curation: Manas Kotepui, Frederick R. Masangkay.
Formal analysis: Manas Kotepui.
Funding acquisition: Manas Kotepui.
Investigation: Manas Kotepui, Giovanni D. Milanez, Frederick R. Masangkay.
Methodology: Manas Kotepui.
Project administration: Manas Kotepui.
PLOS ONE The leukocyte alteration in malaria
PLOS ONE | https://doi.org/10.1371/journal.pone.0233913 June 23, 2020 24 / 28

Resources: Giovanni D. Milanez, Frederick R. Masangkay.
Software: Manas Kotepui.
Supervision: Kwuntida Uthaisar Kotepui, Giovanni D. Milanez.
Validation: Manas Kotepui, Frederick R. Masangkay.
Writing – original draft: Manas Kotepui.
Writing – review & editing: Kwuntida Uthaisar Kotepui, Giovanni D. Milanez, Frederick R.
Masangkay.
References1. WHO. World malaria report 2019 [Available from: https://www.who.int/publications-detail/world-
malaria-report-2019
2. WHO. Guidelines for the treatment of malaria2010.
3. Warrell DA. Clinical features of malaria. London: A Hodder Arnold Publication; 1993.
4. Kim JS, Oh JS, Chang EA, Bae SY, Nam DH, Lee CH, et al. Alteration of platelet counts and lipid pro-
files after treatment of acute Plasmodium vivax. Acta Tropica. 2008; 106(1):39–43. https://doi.org/10.
1016/j.actatropica.2008.01.002 PMID: 18304498
5. Awoke N, Arota A. Profiles of hematological parameters in plasmodium falciparum and plasmodium
vivax malaria patients attending tercha general hospital, Dawuro zone, south Ethiopia. Infection and
Drug Resistance. 2019; 12:521–7. https://doi.org/10.2147/IDR.S184489 PMID: 30881057
6. Erhart LM, Yingyuen K, Chuanak N, Buathong N, Laoboonchai A, Miller RS, et al. Hematologic and clin-
ical indices of malaria in a semi-immune population of Western Thailand. American Journal of Tropical
Medicine and Hygiene. 2004; 70(1):8–14. PMID: 14971691
7. Hanscheid T, Langin M, Lell B, Potschke M, Oyakhirome S, Kremsner PG, et al. Full blood count and
haemozoin-containing leukocytes in children with malaria: Diagnostic value and association with dis-
ease severity. Malaria Journal. 2008; 7.
8. Igbeneghu C, Odaibo AB, Olaleye DO. Impact of asymptomatic malaria on some hematological param-
eters in the iwo community in southwestern nigeria. Medical Principles and Practice. 2011; 20(5):459–
63. https://doi.org/10.1159/000327673 PMID: 21757937
9. Kimbi HK, Sumbele IU, Nweboh M, Anchang-Kimbi JK, Lum E, Nana Y, et al. Malaria and haematologic
parameters of pupils at different altitudes along the slope of Mount Cameroon: A cross-sectional study.
Malaria Journal. 2013; 12(1).
10. van Wolfswinkel ME, Langenberg MCC, Wammes LJ, Sauerwein RW, Koelewijn R, Hermsen CC, et al.
Changes in total and differential leukocyte counts during the clinically silent liver phase in a controlled
human malaria infection in malaria-naive Dutch volunteers. Malar J. 2017; 16(1):457. https://doi.org/10.
1186/s12936-017-2108-1 PMID: 29126422
11. Taylor WR, Widjaja H, Basri H, Ohrt C, Taufik T, Tjitra E, et al. Changes in the total leukocyte and plate-
let counts in Papuan and non Papuan adults from northeast Papua infected with acute Plasmodium
vivax or uncomplicated Plasmodium falciparum malaria. Malar J. 2008; 7:259. https://doi.org/10.1186/
1475-2875-7-259 PMID: 19094197
12. McKenzie FE, Prudhomme WA, Magill AJ, Forney JR, Permpanich B, Lucas C, et al. White blood cell
counts and malaria. J Infect Dis. 2005; 192(2):323–30. https://doi.org/10.1086/431152 PMID:
15962228
13. Kotepui M, Phunphuech B, Phiwklam N, Chupeerach C, Duangmano S. Effect of malarial infection on
haematological parameters in population near Thailand-Myanmar border. Malaria Journal. 2014; 13(1).
14. Kini RG, Chandrashekhar J. Parasite and the Circulating Pool- Characterisation of Leukocyte Number
and Morphology in Malaria. J Clin Diagn Res. 2016; 10(5):EC44–8. https://doi.org/10.7860/JCDR/2016/
16425.7887 PMID: 27437231
15. Chaves YO, Da Costa AG, Pereira MLM, De Lacerda MVG, Coelho-Dos-Reis JG, Martins-Filho OA,
et al. Immune response pattern in recurrent Plasmodium vivax malaria. Malaria Journal. 2016; 15(1).
16. Modiano D, Sirima BS, Konate A, Sanou I, Sawadogo A. Leucocytosis in severe malaria. Trans R Soc
Trop Med Hyg. 2001; 95(2):175–6. https://doi.org/10.1016/s0035-9203(01)90152-x PMID: 11355553
17. Ladhani S, Lowe B, Cole AO, Kowuondo K, Newton CR. Changes in white blood cells and platelets in
children with falciparum malaria: relationship to disease outcome. Br J Haematol. 2002; 119(3):839–47.
https://doi.org/10.1046/j.1365-2141.2002.03904.x PMID: 12437669
PLOS ONE The leukocyte alteration in malaria
PLOS ONE | https://doi.org/10.1371/journal.pone.0233913 June 23, 2020 25 / 28

18. Tangpukdee N, Yew HS, Krudsood S, Punyapradit N, Somwong W, Looareesuwan S, et al. Dynamic
changes in white blood cell counts in uncomplicated Plasmodium falciparum and P. vivax malaria. Para-
sitol Int. 2008; 57(4):490–4. https://doi.org/10.1016/j.parint.2008.06.005 PMID: 18647661
19. Zahorec R. Ratio of neutrophil to lymphocyte counts—rapid and simple parameter of systemic inflam-
mation and stress in critically ill. Bratisl Lek Listy. 2001; 102(1):5–14. PMID: 11723675
20. Rzepczyk CM, Stamatiou S, Anderson K, Stowers A, Cheng Q, Saul A, et al. Experimental human Plas-
modium falciparum infections: longitudinal analysis of lymphocyte responses with particular reference
to gamma delta T cells. Scand J Immunol. 1996; 43(2):219–27. https://doi.org/10.1046/j.1365-3083.
1996.d01-24.x PMID: 8633202
21. Church LW, Le TP, Bryan JP, Gordon DM, Edelman R, Fries L, et al. Clinical manifestations of Plasmo-
dium falciparum malaria experimentally induced by mosquito challenge. J Infect Dis. 1997; 175(4):915–
20. https://doi.org/10.1086/513990 PMID: 9086149
22. Liberati A, Altman DG, Tetzlaff J, Mulrow C, Gotzsche PC, Ioannidis JP, et al. The PRISMA statement
for reporting systematic reviews and meta-analyses of studies that evaluate healthcare interventions:
explanation and elaboration. BMJ. 2009; 339:b2700. https://doi.org/10.1136/bmj.b2700 PMID:
19622552
23. Wells GA SB, O’Connell D, Peterson J, Welch V, Losos M, Tugwell P The Newcastle-Ottawa Scale
(NOS) for assessing the quality of nonrandomised studies in meta-analyses Canada: Ottawa Hospital
Research Institut; [Available from: http://www.ohri.ca/programs/clinical_epidemiology/oxford.asp.
24. Hozo SP, Djulbegovic B, Hozo I. Estimating the mean and variance from the median, range, and the
size of a sample. BMC Med Res Methodol. 2005; 5:13. https://doi.org/10.1186/1471-2288-5-13 PMID:
15840177
25. Furukawa TA, Barbui C, Cipriani A, Brambilla P, Watanabe N. Imputing missing standard deviations in
meta-analyses can provide accurate results. J Clin Epidemiol. 2006; 59(1):7–10. https://doi.org/10.
1016/j.jclinepi.2005.06.006 PMID: 16360555
26. Frimpong A, Kusi KA, Tornyigah B, Ofori MF, Ndifon W. Characterization of T cell activation and regula-
tion in children with asymptomatic Plasmodium falciparum infection. Malaria Journal. 2018; 17(1).
27. Maghendji-Nzondo S, Nzoughe H, Lemamy GJ, Kouna LC, Pegha-Moukandja I, Lekoulou F, et al.
Prevalence of malaria, prevention measures, and main clinical features in febrile children admitted to
the Franceville Regional Hospital, Gabon. Parasite. 2016; 23.
28. Jeremiah ZA, Uko EK, Buseri FI, Jeremiah TA. Malarial iron-deficiency anaemia among asymptomatic
Nigerian children. Journal of Nutritional and Environmental Medicine. 2007; 16(3–4):232–41.
29. Kayode OT, Kayode AAA, Awonuga OO. Status of selected hematological and biochemical parameters
in malaria and malaria-typhoid co-infection. Journal of Biological Sciences. 2011; 11(5):367–73.
30. Sumbele IUN, Nkemnji GB, Kimbi HK. Soil-transmitted helminths and plasmodium falciparum malaria
among individuals living in different agroecosystems in two rural communities in the mount Cameroon
area: A cross-sectional study. Infectious Diseases of Poverty. 2017; 6(1).
31. Salih MM, Eltahir HG, Abdallah TM, Elmahdi T, Khamis AH, Malik EM, et al. Haematological parame-
ters, haemozoin-containing leukocytes in Sudanese children with severe plasmodium falciparum
malaria. Journal of Infection in Developing Countries. 2018; 12(4):273–8. https://doi.org/10.3855/jidc.
9906 PMID: 31851637
32. Hojo-Souza NS, Pereira DB, Mendes TAO, Passos LSA, Gazzinelli-Guimarães AC, Gazzinelli-Gui-
marães PH, et al. CD4 + T cells apoptosis in Plasmodium vivax infection is mediated by activation of
both intrinsic and extrinsic pathways. Malaria Journal. 2015;14(1). https://doi.org/10.1186/s12936-014-
0529-7
33. Ourives SS, Dos Santos DSA, Alem LR, Rios-Santos F, Fontes C, Damazo AS. Analysis of parasitolog-
ical and haematological parameters and of CD4+ and CD8+ cell number in patients with Plasmodium
vivax malaria. Research Journal of Parasitology. 2015; 10(1):1–14.
34. Gonzalez B, Rodulfo H, De Donato M, Berrizbeitia M, Gomez C, Gonzalez L. Hematologic variations in
patient with malaria caused by Plasmodium vivax before, during and after treatment. Investigacion Clin-
ica. 2009; 50(2):187–201. PMID: 19662814
35. Koltas IS, Demirhindi H, Hazar S, Ozcan K. Supportive presumptive diagnosis of Plasmodium vivax
malaria: Thrombocytopenia and red cell distribution width. Saudi Medical Journal. 2007; 28(4):535–9.
PMID: 17457473
36. Squire DS, Asmah RH, Brown CA, Adjei DN, Obeng-Nkrumah N, Ayeh-Kumi PF. Effect of Plasmodium
falciparum malaria parasites on haematological parameters in Ghanaian children. Journal of Parasitic
Diseases. 2016; 40(2):303–11. https://doi.org/10.1007/s12639-014-0501-z PMID: 27413299
PLOS ONE The leukocyte alteration in malaria
PLOS ONE | https://doi.org/10.1371/journal.pone.0233913 June 23, 2020 26 / 28

37. Ansart S, Perez L, Thellier M, Danis M, Bricaire F, Caumes E. Predictive factors of imported malaria in
272 febrile returning travelers seen as outpatients. Journal of Travel Medicine. 2010; 17(2):124–9.
https://doi.org/10.1111/j.1708-8305.2009.00382.x PMID: 20412180
38. Okafor UE, Tsoka-Gwegweni JM, Bibirigea A, Irimie A, Tomuleasa C. Parasitaemia and haematological
changes in malaria-infected refugees in South Africa. South African Medical Journal. 2016; 106(4):413–
6.
39. Goncalves RM, Salmazi KC, Santos BAN, Bastos MS, Rocha SC, Boscardin SB, et al. CD4+ CD25+
Foxp3+ regulatory T cells, dendritic cells, and circulating cytokines in uncomplicated malaria: Do differ-
ent parasite species elicit similar host responses? Infection and Immunity. 2010; 78(11):4763–72.
https://doi.org/10.1128/IAI.00578-10 PMID: 20713627
40. Philipose CS, Umashankar T. The role of haematological parameters in predicting malaria with special
emphasis on neutrophil lymphocyte count ratio and monocyte lymphocyte ratio: A single Institutional
experience. Tropical Parasitology. 2016; 6(2):147–50. https://doi.org/10.4103/2229-5070.190833
PMID: 27722104
41. Adam I, Ali EA, Abdalla TM. Platelet distribution width, mean platelet volume and haematological
parameters in patients with uncomplicated plasmodium falciparum and P. vivax malaria.
F1000Research. 2017; 6.
42. Anwar A, Shaukat H, Khan HA, Nadeem A, Firdous K. Frequency of pancytopenia in malarial patients,
a clinical study. Pakistan Journal of Medical and Health Sciences. 2016; 10(1):294–5.
43. Hasona N, Amer O, Raef A. Hematological alterations and parasitological studies among infected
patients with Plasmodium vivax and Plasmodium falciparum in Hail, Kingdom of Saudi Arabia. Asian
Pacific Journal of Tropical Disease. 2016; 6(9):695–8.
44. Maghendji-Nzondo S, Kouna LC, Mourembou G, Boundenga L, Imboumy-Limoukou RK, Matsiegui PB,
et al. Malaria in urban, semi-urban and rural areas of southern of Gabon: Comparison of the Pfmdr 1
and Pfcrt genotypes from symptomatic children. Malaria Journal. 2016; 15(1).
45. Rodrigues-da-Silva RN, Lima-Junior JC, Fonseca e Fonseca BP, Zuquim Antas PR, Baldez A, Storer
FL, et al. Alterations in cytokines and haematological parameters during the acute and convalescent
phases of Plasmodium falciparum and Plasmodium vivax infections. Memorias do Instituto Oswaldo
Cruz. 2014; 109(2):154–62. https://doi.org/10.1590/0074-0276140275 PMID: 24676654
46. Worku S, Bjorkman A, Troye-Blomberg M, Jemaneh L, Farnert A, Christensson B. Lymphocyte activa-
tion and subset redistribution in the peripheral blood in acute malaria illness: distinct gammadelta+ T
cell patterns in Plasmodium falciparum and P. vivax infections. Clinical and experimental immunology.
1997; 108(1):34–41. https://doi.org/10.1046/j.1365-2249.1997.d01-981.x PMID: 9097908
47. Leoratti FM, Trevelin SC, Cunha FQ, Rocha BC, Costa PA, Gravina HD, et al. Neutrophil paralysis in
Plasmodium vivax malaria. PLoS Negl Trop Dis. 2012; 6(6):e1710. https://doi.org/10.1371/journal.pntd.
0001710 PMID: 22745844
48. Grobusch MP, Kremsner PG. Uncomplicated malaria. Curr Top Microbiol Immunol. 2005; 295:83–104.
PMID: 16265888
49. Hisaeda H, Yasutomo K, Himeno K. Malaria: immune evasion by parasites. Int J Biochem Cell Biol.
2005; 37(4):700–6. https://doi.org/10.1016/j.biocel.2004.10.009 PMID: 15694829
50. Wickramasinghe SN, Abdalla SH. Blood and bone marrow changes in malaria. Baillieres Best Pract
Res Clin Haematol. 2000; 13(2):277–99. https://doi.org/10.1053/beha.1999.0072 PMID: 10942626
51. Schofield L, Vivas L, Hackett F, Gerold P, Schwarz RT, Tachado S. Neutralizing monoclonal antibodies
to glycosylphosphatidylinositol, the dominant TNF-alpha-inducing toxin of Plasmodium falciparum:
prospects for the immunotherapy of severe malaria. Ann Trop Med Parasitol. 1993; 87(6):617–26.
https://doi.org/10.1080/00034983.1993.11812820 PMID: 8122925
52. Simms HH, Gaither TA, Fries LF, Frank MM. Monokines released during short-term Fc gamma receptor
phagocytosis up-regulate polymorphonuclear leukocytes and monocyte-phagocytic function. J Immu-
nol. 1991; 147(1):265–72. PMID: 1828823
53. Means RT Jr., Dessypris EN, Krantz SB. Inhibition of human erythroid colony-forming units by interleu-
kin-1 is mediated by gamma interferon. J Cell Physiol. 1992; 150(1):59–64. https://doi.org/10.1002/jcp.
1041500109 PMID: 1730787
54. Miller AR, Suttles J, Stout RD. Cytokine priming reduces dependence on TNF-R2 for TNF-alpha-medi-
ated induction of macrophage nitric oxide generation. J Interferon Cytokine Res. 1996; 16(12):1055–63.
https://doi.org/10.1089/jir.1996.16.1055 PMID: 8974009
55. Anstey NM, Granger DL, Hassanali MY, Mwaikambo ED, Duffy PE, Weinberg JB. Nitric oxide, malaria,
and anemia: inverse relationship between nitric oxide production and hemoglobin concentration in
asymptomatic, malaria-exposed children. Am J Trop Med Hyg. 1999; 61(2):249–52. https://doi.org/10.
4269/ajtmh.1999.61.249 PMID: 10463675
PLOS ONE The leukocyte alteration in malaria
PLOS ONE | https://doi.org/10.1371/journal.pone.0233913 June 23, 2020 27 / 28

56. van Wolfswinkel ME, Vliegenthart-Jongbloed K, de Mendonca Melo M, Wever PC, McCall MB, Koele-
wijn R, et al. Predictive value of lymphocytopenia and the neutrophil-lymphocyte count ratio for severe
imported malaria. Malar J. 2013; 12:101. https://doi.org/10.1186/1475-2875-12-101 PMID: 23506136
57. Manas Kotepui CR, Kwuntida Uthaisar. Clinical characteristics, parasitediagnosis and hematological
parameters of malaria in Surat Thani province, Thailand. J Health Res 31(4):281–8.
58. Price RN, Simpson JA, Nosten F, Luxemburger C, Hkirjaroen L, ter Kuile F, et al. Factors contributing to
anemia after uncomplicated falciparum malaria. Am J Trop Med Hyg. 2001; 65(5):614–22. https://doi.
org/10.4269/ajtmh.2001.65.614 PMID: 11716124
PLOS ONE The leukocyte alteration in malaria
PLOS ONE | https://doi.org/10.1371/journal.pone.0233913 June 23, 2020 28 / 28