Embed Size (px)
Citation preview
www.sccjr.ac.uk
REPORT No. 04/2012
Reducing Reoffending: Review of Selected
Countries
FINAL REPORT
September 2012
REPORT No. 04/2012
Reducing Reoffending: Review of Selected
FINAL REPORT FOR AUDIT SCOTLAND
2012
Reducing Reoffending: Review of Selected
FOR AUDIT SCOTLAND
www.sccjr.ac.uk
REPORT No. 04/2012
Copyright Notice
The Authors assert their right under the Copyright, Design and Patents Act, 1988 to be identified as the
author of this work. Permission is granted to reprod
educational use only. Commercial copying, hiring
Copyright © Authors 2012
Acknowledgements
We gratefully acknowledge the input of several colleagues in providing information or guidance about
definitions and levels of reoffending in their countries: Elizabeth Fraser (Scottish Government), Ian
O’Donnell (University College Dublin), Gerhard Jans P
Kristofferson (Staff Academy for th
(Statistics Norway Research Department),
REPORT No. 04/2012
right under the Copyright, Design and Patents Act, 1988 to be identified as the
author of this work. Permission is granted to reproduce any part or all of this
educational use only. Commercial copying, hiring or lending is prohibited.
We gratefully acknowledge the input of several colleagues in providing information or guidance about
definitions and levels of reoffending in their countries: Elizabeth Fraser (Scottish Government), Ian
O’Donnell (University College Dublin), Gerhard Jans Ploeg (Justice Department, Norway), Ragnar
Staff Academy for the Correctional Services Norway – KRUS),
(Statistics Norway Research Department), and Anne Opie (Independent Scholar, New Zealand).
1
right under the Copyright, Design and Patents Act, 1988 to be identified as the
any part or all of this report for personal and
We gratefully acknowledge the input of several colleagues in providing information or guidance about
definitions and levels of reoffending in their countries: Elizabeth Fraser (Scottish Government), Ian
loeg (Justice Department, Norway), Ragnar
KRUS), Torbjørn Skardhamar
and Anne Opie (Independent Scholar, New Zealand).
www.sccjr.ac.uk
REPORT No. 04/2012
Contents
COPYRIGHT NOTICE ................................
ACKNOWLEDGEMENTS ................................
LIST OF FIGURES AND TABLES ................................
KEY POINTS AND FINDINGS ................................
GENERAL POINTS ................................
NATIONAL REOFFENDING TRENDS ................................
REOFFENDING TRENDS BY KEY VARIABLE
RETHINKING REOFFENDING, MOVING TOWARDS
1 INTRODUCTION ................................
1.1 BACKGROUND, SCOPE AND A
1.2 SOME WELL-ESTABLISHED FINDINGS OF
1.3 ORGANISATION OF THE REPORT
2 METHODOLOGY AND RESEARCH ISSUES
2.1 METHODOLOGY ................................
2.2 DEFINING ‘REOFFENDING’ ................................
2.3 COMPARATIVE RESEARCH VS.
3 QUANTITIES AND QUALITIES OF JUSTICE IN S
3.1 SCOTLAND ................................
3.2 ENGLAND AND WALES ................................
3.3 NORTHERN IRELAND ................................
3.4 IRELAND ................................
3.5 NORWAY ................................
3.6 NEW ZEALAND ................................
4 REOFFENDING TRENDS ................................
4.1 PRIOR REIMPRISONMENT STUDIES
4.2 REOFFENDING IN SELECTED COUNTRIES
4.3 SCOTLAND ................................
4.4 ENGLAND & WALES ................................
4.5 NORTHERN IRELAND ................................
4.6 IRELAND ................................
4.7 NORWAY ................................
4.8 NEW ZEALAND ................................
4.9 RECIDIVISM BY KEY VARIABLE
4.10 GENDER ................................
4.11 AGE ................................................................
4.12 OFFENCE ................................
4.13 DISPOSAL ................................
4.14 EXTENT AND TYPE OF CRIMINAL
REPORT No. 04/2012
................................................................................................................................
................................................................................................
................................................................................................
................................................................................................
................................................................................................................................
................................................................................................
ARIABLE ................................................................................................
OVING TOWARDS REINTEGRATION ................................................................
................................................................................................................................
IMS ................................................................................................
INDINGS OF REOFFENDING RESEARCH ................................................................
EPORT ................................................................................................
ARCH ISSUES ................................................................
................................................................................................................................
................................................................................................
. COMPARING RESEARCH ................................................................
TIES OF JUSTICE IN SELECTED COUNTRIES................................
................................................................................................................................
................................................................................................
................................................................................................................................
................................................................................................................................
................................................................................................................................
................................................................................................................................
................................................................................................
TUDIES ................................................................................................
OUNTRIES ................................................................................................
................................................................................................................................
................................................................................................................................
................................................................................................................................
................................................................................................................................
................................................................................................................................
................................................................................................................................
ARIABLE ................................................................................................
................................................................................................................................
................................................................................................
................................................................................................................................
................................................................................................................................
RIMINAL JUSTICE HISTORY ................................................................
2
......................................... 1
.................................................................... 1
.......................................................... 4
.............................................................. 5
........................................................... 5 ..................................................................... 5
............................................................ 7
............................................................ 7
....................................... 8
......................................................... 8 .............................................. 8
........................................................... 9
................................................................. 10
.............................................. 10 ................................................................ 10
............................................................ 13
........................................................... 16
..................................................... 16 ..................................................................... 16
........................................ 16 ........................................................ 17 ....................................................... 17
............................................... 17
.......................................................... 18
...................................................... 18 ............................................... 19
..................................................... 20 ........................................ 23 ........................................ 25
........................................................ 27 ....................................................... 29
............................................... 32 ............................................................ 34
........................................................ 34 .............................................................. 35
....................................................... 36 ...................................................... 37
................................................................. 40

www.sccjr.ac.uk
REPORT No. 04/2012
5 REDUCING REOFFENDING ................................
5.2 RETHINKING THE CONCEPT OF
5.3 REINTEGRATION VS. REOFFENDING
6 REFERENCES ................................
7 APPENDIX: RAW RECONVICTION DATA BY JURIS
REPORT No. 04/2012
................................................................................................
ONCEPT OF ‘REOFFENDING’ ................................................................
EOFFENDING ................................................................................................
................................................................................................................................
ICTION DATA BY JURISDICTION ................................................................
3
...................................................... 42
...................................................................... 42 ..................................................... 45
.......................................... 47
........................................ 50
www.sccjr.ac.uk
REPORT No. 04/2012
List of Figures and Tables
FIGURE 1. COMPARISON OF ONE-YEAR AND TWO
FIGURE 2. REOFFENDING RATES FOR 2008
FIGURE 3. ONE- AND TWO-YEAR RECONVICTION RA
FIGURE 4. AVERAGE TIME (IN DAYS) TO FIRST NEW OFFENCE
WALES, 2000 TO 2009 ................................
FIGURE 5. REIMPRISONMENT RATES OF PRISONERS COMPLET
FIGURE 6. TWO-YEAR RECONVICTION RATE OF ADULTS LEA
FIGURE 7. TWO-YEAR RECONVICTION RATE OF ADULTS ON COMM
FIGURE 8. RECONVICTION RATES BY GENDER IN SELECTED C
FIGURE 9. RECONVICTION RATES IN SCOTLAND BY GENDER AN
FIGURE 10. RECONVICTION RATES BY AGE GROUP IN SELECTE
FIGURE 11. RECONVICTION RATE BY SELECTED INDEX OFFEN
FIGURE 12. RECONVICTION RATES FOR PRISON AND COMMUNITY
FIGURE 13. RECONVICTION RATES BY LENGTH OF PRISON SEN
FIGURE 14. ONE-YEAR RECONVICTION RA
FIGURE 15. ONE-YEAR RECONVICTION RATES BY
TABLE 1. UNADJUSTED AND ADJUSTED R
TABLE 2. REIMPRISONMENT RATES IN COMPARATIVE
TABLE 3. RATES OF RECIDIVISM AMONG S
TABLE 4. ONE YEAR RECONVICTION FREQUENCY RATES AND
TABLE 5. ONE-YEAR RECONVICTION RATES OF
TABLE 6. OVERALL TWO-YEAR RECONVICTION RATES A
TABLE 7. RECIDIVISM AND JOB PROSPECTS OF
TABLE 8. ONE-YEAR RECONVICTION AND REIMPRISONMENT RAT
02 TO 2009-10 ................................
TABLE 9. RATES OF REOFFENDING BY PRISONERS AND COM
COHORT ................................................................
REPORT No. 04/2012
Figures and Tables
YEAR AND TWO-YEAR RATES OF REOFFENDING IN SCOTLAND, 1997-98 TO
2008-09 COHORT IN SCOTLAND BY DISPOSAL ................................
YEAR RECONVICTION RATES IN ENGLAND AND WALES, 2000 TO 2009 ................................
TO FIRST NEW OFFENCE WITHIN ONE YEAR FOR SOME COMMON OFFENCES
................................................................................................................................
OF PRISONERS COMPLETING SENTENCES IN IRELAND BETWEEN 2001
N RATE OF ADULTS LEAVING PRISON IN NEW ZEALAND BY COHORT YEA
TE OF ADULTS ON COMMUNITY SENTENCES IN NEW ZEALAND BY COHORT YEA
GENDER IN SELECTED COUNTRIES ................................................................
COTLAND BY GENDER AND EXTENT OF PRIOR CRIMINAL JUSTICE INVOL
AGE GROUP IN SELECTED COUNTRIES ................................................................
SELECTED INDEX OFFENCE GROUP ................................................................
PRISON AND COMMUNITY DISPOSALS ................................................................
LENGTH OF PRISON SENTENCE ................................................................
YEAR RECONVICTION RATE BY PRIOR CRIMINAL CONVICTIONS IN SCOTLAND, ENGLAND AND
ATES BY PRIOR PRISON SENTENCES IN SCOTLAND AND ENGLAND AND
RECONVICTION RATES FOR ENGLAND AND WALES, SCOTLAND AND THE
OMPARATIVE CONTEXT – 1970S TO EARLY 2000S ................................
SELECTED COUNTRIES ................................................................
FREQUENCY RATES AND ONE YEAR RECONVICTION RATES: 1997-98 TO
ATES OF FIRST QUARTER OFFENDERS IN ENGLAND AND WALES, 2000
RECONVICTION RATES AND NUMBERS IN NORTHERN IRELAND, 2002-2005
ROSPECTS OF NORWEGIAN PRISONERS BY EDUCATION AND MARRIAGE................................
D REIMPRISONMENT RATES AMONG PRISON AND COMMUNITY COHORTS IN
................................................................................................................................
BY PRISONERS AND COMMUNITY-SENTENCED OFFENDERS BY PERIOD OF FOLLOW
................................................................................................
4
TO 2008-09 ..................... 21
.................................................................... 22
................................................ 24
SOME COMMON OFFENCES IN ENGLAND AND
............................................ 24
AND 2004. ...................... 27
EALAND BY COHORT YEAR .................................... 32
EALAND BY COHORT YEAR .................... 33
...................................................... 34
IMINAL JUSTICE INVOLVEMENT ........................... 35
................................................ 36
...................................................... 37
............................................. 38
......................................................... 39
NGLAND AND WALES ......................... 40
NGLAND AND WALES ...................... 41
COTLAND AND THE NETHERLANDS ........... 14
.......................................................... 18
............................................................... 19
TO 2008-09 COHORTS .......... 20
2000 TO 2009 ..................... 23
2005 ...................................... 25
.......................................... 30
COMMUNITY COHORTS IN NEW ZEALAND, 2001-
...................................................... 32
BY PERIOD OF FOLLOW-UP, 2002-03
................................................................. 33

www.sccjr.ac.uk
REPORT No. 04/2012
Key Points and Findings
General Points
1. This report presents research commissioned by Audit Scotland on international levels and
experience of reoffending. It aims to set the Scottish experience of reoffending in context and to
identify factors which other jurisdictions have seen affect reoffending rates.
2. The jurisdictions included in this review are: Scotland, England and Wales, Northern Ireland,
Ireland, Norway and New Zealand.
3. Official statistics and reoffending studies are the
4. 'Reoffending' and 'recidivism'
of criminal justice system activity. In this review, 'reoffending' most often refers to recorded
reconviction or reimprisonment rates and less often to re
5. Using this definition, the factors regularly found to be the most consistent predictors of
reoffending are: age, gender, offence type, disposal (having a prison or community
sentence), length of prison sentence, and length a
6. Direct comparisons of reoffending rates are not possible from the data presented here. Such
comparisons would require thorough investigation to control for the many differences in
definitions, reporting practices, enforcement cultures and political systems.
presented may be useful, however, in comparing the kinds of factors that matter for reoffending
and the impacts these have had on individual country rates.
National Reoffending Trends
7. A ‘typical’ range of reoffending (measured via reimprisonment) in national studies is between
30% and 50%.
8. The countries included in this review define ‘reoffenders’ (all persons arrested, convicted,
sentenced to particular sanctions) and ‘reoffending’ in diverse ways (re
reimprisonment) but report rates of reoffending that mostly fall within the typical range.
9. Reconviction rates in Scotland show relative stabi
30-32% in one-year follow up studies and 43
inclusive of those offenders receiving fines, a category of sanction almost as large as all other
sanctions combined and with a lower than average reoffending rate.
REPORT No. 04/2012
Key Points and Findings
presents research commissioned by Audit Scotland on international levels and
experience of reoffending. It aims to set the Scottish experience of reoffending in context and to
identify factors which other jurisdictions have seen affect reoffending rates.
The jurisdictions included in this review are: Scotland, England and Wales, Northern Ireland,
Ireland, Norway and New Zealand.
Official statistics and reoffending studies are the main source of the data used in the review.
'Reoffending' and 'recidivism' do not refer to actual offending behaviour but to official records
of criminal justice system activity. In this review, 'reoffending' most often refers to recorded
reconviction or reimprisonment rates and less often to re-arrest rates.
ion, the factors regularly found to be the most consistent predictors of
reoffending are: age, gender, offence type, disposal (having a prison or community
sentence), length of prison sentence, and length and severity of criminal justice
rect comparisons of reoffending rates are not possible from the data presented here. Such
comparisons would require thorough investigation to control for the many differences in
definitions, reporting practices, enforcement cultures and political systems.
presented may be useful, however, in comparing the kinds of factors that matter for reoffending
and the impacts these have had on individual country rates.
National Reoffending Trends
A ‘typical’ range of reoffending (measured via reimprisonment) in national studies is between
The countries included in this review define ‘reoffenders’ (all persons arrested, convicted,
articular sanctions) and ‘reoffending’ in diverse ways (re
reimprisonment) but report rates of reoffending that mostly fall within the typical range.
Reconviction rates in Scotland show relative stability over the past decade, fluctuating between
year follow up studies and 43-45% in two-year follow up studies. Note this rate is
inclusive of those offenders receiving fines, a category of sanction almost as large as all other
ined and with a lower than average reoffending rate.
5
presents research commissioned by Audit Scotland on international levels and
experience of reoffending. It aims to set the Scottish experience of reoffending in context and to
identify factors which other jurisdictions have seen affect reoffending rates.
The jurisdictions included in this review are: Scotland, England and Wales, Northern Ireland,
source of the data used in the review.
do not refer to actual offending behaviour but to official records
of criminal justice system activity. In this review, 'reoffending' most often refers to recorded
ion, the factors regularly found to be the most consistent predictors of
reoffending are: age, gender, offence type, disposal (having a prison or community-based
nd severity of criminal justice history.
rect comparisons of reoffending rates are not possible from the data presented here. Such
comparisons would require thorough investigation to control for the many differences in
definitions, reporting practices, enforcement cultures and political systems. The information
presented may be useful, however, in comparing the kinds of factors that matter for reoffending
A ‘typical’ range of reoffending (measured via reimprisonment) in national studies is between
The countries included in this review define ‘reoffenders’ (all persons arrested, convicted,
articular sanctions) and ‘reoffending’ in diverse ways (re-arrest, reconviction or
reimprisonment) but report rates of reoffending that mostly fall within the typical range.
lity over the past decade, fluctuating between
year follow up studies. Note this rate is
inclusive of those offenders receiving fines, a category of sanction almost as large as all other
www.sccjr.ac.uk
REPORT No. 04/2012
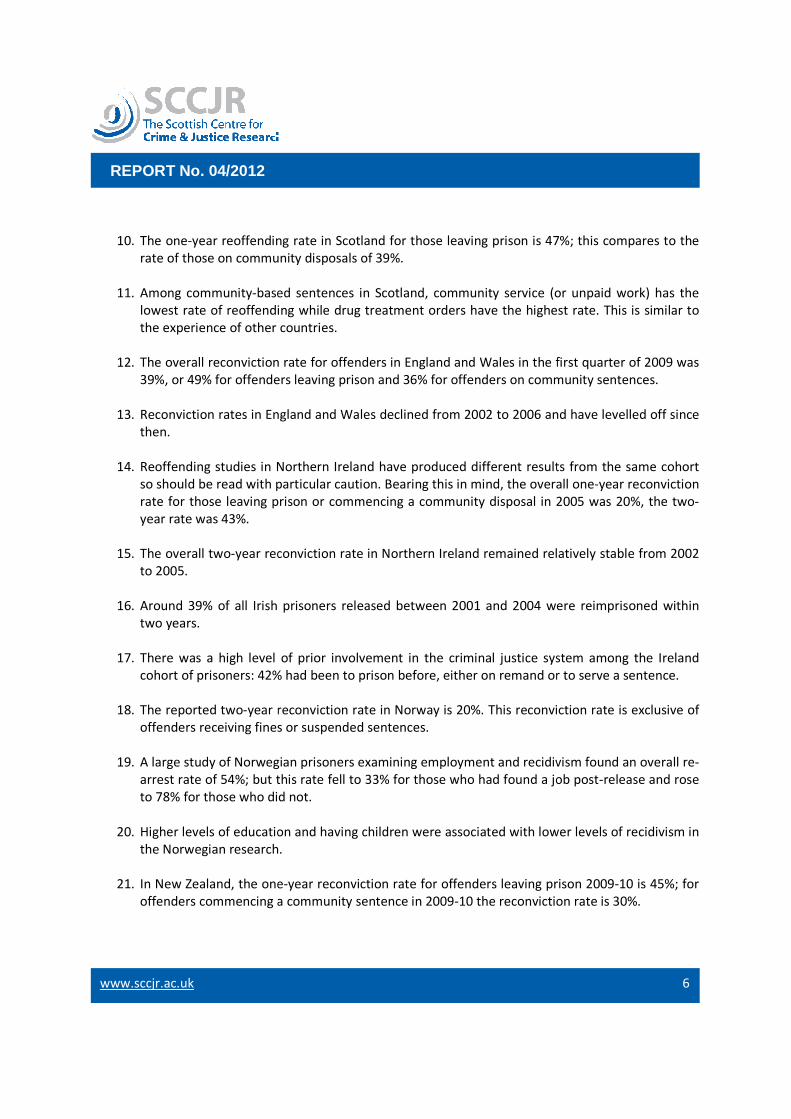
10. The one-year reoffending rate in Scotland for those leaving prison is 47%; this compares to the
rate of those on community disposals of 39%.
11. Among community-based sentences in Scotland, community service (or unpaid work) has the
lowest rate of reoffending while drug treatment orders have the highest rate. This is similar to
the experience of other countries.
12. The overall reconviction rate for offenders in England and Wales in the first quarter of 2009 was
39%, or 49% for offenders leaving prison and 36% for offenders on community sentences.
13. Reconviction rates in England and Wales declined from 2002 to 2006 and have levelled off since
then.
14. Reoffending studies in Northern Ireland have produced different results from the same cohort
so should be read with particular caution. B
rate for those leaving prison or commencing a community disposal in 2005 was 20%, the two
year rate was 43%.
15. The overall two-year reconviction rate in Northern Ireland r
to 2005.
16. Around 39% of all Irish prisoners released between 2001 and 2004 were reimprisoned within
two years.
17. There was a high level of prior involvement in
cohort of prisoners: 42% had been to prison before, either on remand or to serve a sentence.
18. The reported two-year reconviction rate in Norway is 20%.
offenders receiving fines or suspended sentences
19. A large study of Norwegian prisoners examining employment and recidivism found an overall re
arrest rate of 54%; but this rate fell to 33% for those who had foun
to 78% for those who did not.
20. Higher levels of education and having children were associated with lower levels of recidivism in
the Norwegian research.
21. In New Zealand, the one
offenders commencing a community sentence in 2009
REPORT No. 04/2012
year reoffending rate in Scotland for those leaving prison is 47%; this compares to the
rate of those on community disposals of 39%.
based sentences in Scotland, community service (or unpaid work) has the
lowest rate of reoffending while drug treatment orders have the highest rate. This is similar to
the experience of other countries.
The overall reconviction rate for offenders in England and Wales in the first quarter of 2009 was
39%, or 49% for offenders leaving prison and 36% for offenders on community sentences.
ates in England and Wales declined from 2002 to 2006 and have levelled off since
Reoffending studies in Northern Ireland have produced different results from the same cohort
so should be read with particular caution. Bearing this in mind, the overall one
rate for those leaving prison or commencing a community disposal in 2005 was 20%, the two
year reconviction rate in Northern Ireland remained relatively stable from 2002
Around 39% of all Irish prisoners released between 2001 and 2004 were reimprisoned within
There was a high level of prior involvement in the criminal justice system among the Ireland
cohort of prisoners: 42% had been to prison before, either on remand or to serve a sentence.
year reconviction rate in Norway is 20%. This reconviction rate is
offenders receiving fines or suspended sentences.
A large study of Norwegian prisoners examining employment and recidivism found an overall re
arrest rate of 54%; but this rate fell to 33% for those who had found a job post
to 78% for those who did not.
Higher levels of education and having children were associated with lower levels of recidivism in
the Norwegian research.
land, the one-year reconviction rate for offenders leaving prison 2009
offenders commencing a community sentence in 2009-10 the reconviction rate is 30%.
6
year reoffending rate in Scotland for those leaving prison is 47%; this compares to the
based sentences in Scotland, community service (or unpaid work) has the
lowest rate of reoffending while drug treatment orders have the highest rate. This is similar to
The overall reconviction rate for offenders in England and Wales in the first quarter of 2009 was
39%, or 49% for offenders leaving prison and 36% for offenders on community sentences.
ates in England and Wales declined from 2002 to 2006 and have levelled off since
Reoffending studies in Northern Ireland have produced different results from the same cohort
earing this in mind, the overall one-year reconviction
rate for those leaving prison or commencing a community disposal in 2005 was 20%, the two-
emained relatively stable from 2002
Around 39% of all Irish prisoners released between 2001 and 2004 were reimprisoned within
the criminal justice system among the Ireland
cohort of prisoners: 42% had been to prison before, either on remand or to serve a sentence.
his reconviction rate is exclusive of
A large study of Norwegian prisoners examining employment and recidivism found an overall re-
d a job post-release and rose
Higher levels of education and having children were associated with lower levels of recidivism in
year reconviction rate for offenders leaving prison 2009-10 is 45%; for
10 the reconviction rate is 30%.

www.sccjr.ac.uk
REPORT No. 04/2012
22. Two-year follow-up studies show there was a rising rate
Zealand until 2007-08. The rate is levelling off for ex
community sentences.
Reoffending Trends by Key Variable
23. The overall reconviction rate
countries, in line with other international research.
24. However, the gender gap on reconviction rates reduces and even disappears the more serious
and extensive one’s involvement with the criminal justice system has been.
25. Also consistent with the wider literature, younger people have much higher reconviction rates
than older people.
26. Theft and property offences have the highest rates of reconviction in all countries studied.
27. In all countries reviewed, reconviction rates are higher for those leaving prison than those
serving community sentences.
28. Serving a short prison sentence of one year or less is associated with a substantially higher
reconviction rate than serving a longer prison sentence of a few years or more.
29. Having any prior experience of prison greatly
having many prior convictions appears to be less important for reconviction rates in the UK.
Rethinking Reoffending, Moving towards Reintegration
30. We conclude that reoffending is a flawed concept, both
than criminal behaviour
predictors of successful desistance.
31. An approach seeking to reduce the amount of social harm caused by reoffending would
minimally involve: (i) Using the least severe intervention necessary
employment, family life and education
criminal justice involvement on life chances
levels of action and develop positive rather than negative definitions of success
32. Centring reintegration as a goal of working with offenders promotes a pro social role for criminal
justice.
REPORT No. 04/2012
up studies show there was a rising rate of reconvictions for all offenders in New
08. The rate is levelling off for ex-prisoners and declining for those on
Reoffending Trends by Key Variable
The overall reconviction rate for males is higher than that for females among reviewed
countries, in line with other international research.
However, the gender gap on reconviction rates reduces and even disappears the more serious
nvolvement with the criminal justice system has been.
Also consistent with the wider literature, younger people have much higher reconviction rates
offences have the highest rates of reconviction in all countries studied.
In all countries reviewed, reconviction rates are higher for those leaving prison than those
serving community sentences.
Serving a short prison sentence of one year or less is associated with a substantially higher
reconviction rate than serving a longer prison sentence of a few years or more.
Having any prior experience of prison greatly increases one’s likelihood of reconviction, while
having many prior convictions appears to be less important for reconviction rates in the UK.
Rethinking Reoffending, Moving towards Reintegration
We conclude that reoffending is a flawed concept, both what it measures (criminal justice rather
behaviour) and how it focuses policy efforts on signs of failure rather than
predictors of successful desistance.
An approach seeking to reduce the amount of social harm caused by reoffending would
Using the least severe intervention necessary; (ii)
employment, family life and education; (iii) recognising and minimising the destructive impact of
criminal justice involvement on life chances; (iv) reconceptualising rehabilitation to broaden its
levels of action and develop positive rather than negative definitions of success
as a goal of working with offenders promotes a pro social role for criminal
7
of reconvictions for all offenders in New
prisoners and declining for those on
for males is higher than that for females among reviewed
However, the gender gap on reconviction rates reduces and even disappears the more serious
nvolvement with the criminal justice system has been.
Also consistent with the wider literature, younger people have much higher reconviction rates
offences have the highest rates of reconviction in all countries studied.
In all countries reviewed, reconviction rates are higher for those leaving prison than those
Serving a short prison sentence of one year or less is associated with a substantially higher
reconviction rate than serving a longer prison sentence of a few years or more.
increases one’s likelihood of reconviction, while
having many prior convictions appears to be less important for reconviction rates in the UK.
what it measures (criminal justice rather
) and how it focuses policy efforts on signs of failure rather than
An approach seeking to reduce the amount of social harm caused by reoffending would
(ii) focusing investment on
ecognising and minimising the destructive impact of
lising rehabilitation to broaden its
levels of action and develop positive rather than negative definitions of success.
as a goal of working with offenders promotes a pro social role for criminal
www.sccjr.ac.uk
REPORT No. 04/2012
1 Introduction
1.1 Background, Scope and Aims1.1.1 Audit Scotland commissioned this research by the Scottish Centre for Crime and Justice on
international experiences of reoffending. An international perspective of reoffending can
inform understanding of the Scottish experience and suggest
targeted to improve efficiency and effectiveness. The specific aims of this review are to:
• Provide a sense over time of reoffending patterns and experiences of other, potentially
comparable, jurisdictions; and,
• Identify valid predict
1.1.2 In addition, we try to build on this knowledge to comment in general terms on what might
help reduce reoffending.
1.1.3 Through discussion with Audit Scotland we selected five jurisdictions in addition to
Scotland to focus the research. The countries included in this review are: Scotland, England
and Wales, Northern Ireland, Ireland, Norway and New Zealand. These countries were
selected on the basis of size, proximity and shared or relevant penal practices which mi
put Scotland’s experience in context. Making direct international comparisons in an area
like criminal justice is difficult, if not impossible, but considering the differing experiences
of countries may nevertheless shed light on explanations for parti
reoffending within them. We discuss the issue of comparative research below.
1.1.4 The scope of our research encompasses officially reported reoffending rates, where
available. In addition, or in jurisdictions where official data is not p
peer reviewed research on reoffending. Time trend data were not always available or
reliable, and so while this is covered in the review, we tend to emphasise factors that have
affected recent offending rather than on how national rate
1.2 Some Well-established Findings of Reoffending Research1.2.1 Rates of reoffending are well known to vary by these variables: age, gender, offence group,
disposal, prior involvement with the criminal justice system, and period of follow
Hence:
• Younger people have higher reoffending rates than older people
• Men have higher reoffending rates than women
• People on higher end punishments (prison) have higher reoffending rates than those on
lower end ones (community service)
• Prisoners serving short sentences have higher reoffending rates than those serving long
ones;
• Theft offences have higher reoffending rates than sexual offences, and have one of the
highest rates of reconviction generally
REPORT No. 04/2012
Scope and Aims Audit Scotland commissioned this research by the Scottish Centre for Crime and Justice on
international experiences of reoffending. An international perspective of reoffending can
inform understanding of the Scottish experience and suggest where efforts might be
targeted to improve efficiency and effectiveness. The specific aims of this review are to:
Provide a sense over time of reoffending patterns and experiences of other, potentially
comparable, jurisdictions; and,
Identify valid predictors and explanations of reoffending patterns.
In addition, we try to build on this knowledge to comment in general terms on what might
help reduce reoffending.
Through discussion with Audit Scotland we selected five jurisdictions in addition to
to focus the research. The countries included in this review are: Scotland, England
and Wales, Northern Ireland, Ireland, Norway and New Zealand. These countries were
selected on the basis of size, proximity and shared or relevant penal practices which mi
put Scotland’s experience in context. Making direct international comparisons in an area
like criminal justice is difficult, if not impossible, but considering the differing experiences
of countries may nevertheless shed light on explanations for parti
reoffending within them. We discuss the issue of comparative research below.
The scope of our research encompasses officially reported reoffending rates, where
available. In addition, or in jurisdictions where official data is not p
peer reviewed research on reoffending. Time trend data were not always available or
reliable, and so while this is covered in the review, we tend to emphasise factors that have
affected recent offending rather than on how national rates have changed over time.
established Findings of Reoffending ResearchRates of reoffending are well known to vary by these variables: age, gender, offence group,
disposal, prior involvement with the criminal justice system, and period of follow
Younger people have higher reoffending rates than older people;
Men have higher reoffending rates than women;
People on higher end punishments (prison) have higher reoffending rates than those on
lower end ones (community service);
ving short sentences have higher reoffending rates than those serving long
Theft offences have higher reoffending rates than sexual offences, and have one of the
highest rates of reconviction generally;
8
Audit Scotland commissioned this research by the Scottish Centre for Crime and Justice on
international experiences of reoffending. An international perspective of reoffending can
where efforts might be
targeted to improve efficiency and effectiveness. The specific aims of this review are to:
Provide a sense over time of reoffending patterns and experiences of other, potentially
ors and explanations of reoffending patterns.
In addition, we try to build on this knowledge to comment in general terms on what might
Through discussion with Audit Scotland we selected five jurisdictions in addition to
to focus the research. The countries included in this review are: Scotland, England
and Wales, Northern Ireland, Ireland, Norway and New Zealand. These countries were
selected on the basis of size, proximity and shared or relevant penal practices which might
put Scotland’s experience in context. Making direct international comparisons in an area
like criminal justice is difficult, if not impossible, but considering the differing experiences
of countries may nevertheless shed light on explanations for particular trajectories for
reoffending within them. We discuss the issue of comparative research below.
The scope of our research encompasses officially reported reoffending rates, where
available. In addition, or in jurisdictions where official data is not published, we include
peer reviewed research on reoffending. Time trend data were not always available or
reliable, and so while this is covered in the review, we tend to emphasise factors that have
s have changed over time.
established Findings of Reoffending Research Rates of reoffending are well known to vary by these variables: age, gender, offence group,
disposal, prior involvement with the criminal justice system, and period of follow-up.
People on higher end punishments (prison) have higher reoffending rates than those on
ving short sentences have higher reoffending rates than those serving long
Theft offences have higher reoffending rates than sexual offences, and have one of the
www.sccjr.ac.uk
REPORT No. 04/2012
• Those with the longest criminal justice histor
more experiences of contact) have higher reconviction rates than those with no, limited
or later involvement in the criminal justice system
• Most reconvictions occur within one year with a gradual rise and then l
years after that.
1.2.2 While definitions of these variables vary between individual studies (whether older
people’s reoffending rates includes those
these general trends have been an almost univ
1.2.3 Additionally, reoffending rates also vary by marital status, employment and educational
attainment; those who are married, employed and/or have more years of education all have
lower rates of recidivism (O’Donnell et al., 2008; Skardhamar and Telle, 2012;
Baumer, 1997).
1.3 Organisation of the Report1.3.1 In the following sections we briefly describe the methodology and activities undertaken in
carrying out the research; clarify how we are using the terms reoffending and recidivism;
and, review known barriers to comparative criminal justice research. The bulk of the report
is devoted to discussing the experiences of the selected jurisdictions: thumbnail sketches of
salient features of national settings are followed by extensive presentation of data on
reoffending first by country, then by predictive variable. The last part of the report
concludes with a discussion of the factors emerging from the research that might assist
efforts to reduce reoffending rates.
REPORT No. 04/2012
Those with the longest criminal justice histories (earlier ages of first prison sentence,
more experiences of contact) have higher reconviction rates than those with no, limited
or later involvement in the criminal justice system;
Most reconvictions occur within one year with a gradual rise and then l
While definitions of these variables vary between individual studies (whether older
people’s reoffending rates includes those aged 30 and over or 40 or over, for example),
these general trends have been an almost universal finding of reoffending research.
Additionally, reoffending rates also vary by marital status, employment and educational
attainment; those who are married, employed and/or have more years of education all have
lower rates of recidivism (O’Donnell et al., 2008; Skardhamar and Telle, 2012;
Organisation of the Report In the following sections we briefly describe the methodology and activities undertaken in
carrying out the research; clarify how we are using the terms reoffending and recidivism;
barriers to comparative criminal justice research. The bulk of the report
is devoted to discussing the experiences of the selected jurisdictions: thumbnail sketches of
salient features of national settings are followed by extensive presentation of data on
reoffending first by country, then by predictive variable. The last part of the report
concludes with a discussion of the factors emerging from the research that might assist
efforts to reduce reoffending rates.
9
ies (earlier ages of first prison sentence,
more experiences of contact) have higher reconviction rates than those with no, limited
Most reconvictions occur within one year with a gradual rise and then levelling off in the
While definitions of these variables vary between individual studies (whether older
30 and over or 40 or over, for example),
ersal finding of reoffending research.
Additionally, reoffending rates also vary by marital status, employment and educational
attainment; those who are married, employed and/or have more years of education all have
lower rates of recidivism (O’Donnell et al., 2008; Skardhamar and Telle, 2012; and see also
In the following sections we briefly describe the methodology and activities undertaken in
carrying out the research; clarify how we are using the terms reoffending and recidivism;
barriers to comparative criminal justice research. The bulk of the report
is devoted to discussing the experiences of the selected jurisdictions: thumbnail sketches of
salient features of national settings are followed by extensive presentation of data on
reoffending first by country, then by predictive variable. The last part of the report
concludes with a discussion of the factors emerging from the research that might assist
www.sccjr.ac.uk
REPORT No. 04/2012
2 Methodology and Research Issues
2.1 Methodology 2.1.1 This review was conducted through a desk
of key researchers in jurisdictions under review. Data sources include the following:
• Official reported statistics on reoffending,
• Published studies of reoffend
• Communications with corrections officials or knowledgeable academics with data on
reoffending.
2.1.2 We report the published statistics, generally descriptive in nature, as they are broken down
in official reports and academic publications. In some cas
statistics in order to maximise the ability to compare the experience of different countries.
While we strongly emphasise the point that no direct comparisons can be made between
jurisdictions (further discussed below), there ar
reoffending patterns among roughly similar offender groups. For example, one major data
reporting issue is that some countries include offenders who have received monetary
penalties (e.g. fines) as the cohort for which
Because the fine is typically the most common sanction issued and because reconviction
rates for those receiving fines tends to be much lower than for other disposals (such as
those on probation or leaving custody)
its overall reoffending rate. For example, according to one analysis of the 2005 cohort in
Northern Ireland, which included those receiving fines, the two
20.5%; if reoffending includes only those leaving prison, on probation or a community
service order or a combination of these the reoffending rate for this cohort rises to 38% (NI
DOJ, 2012). The exclusion of fine offenders thus brings it into a similar orbit as the (albeit)
one-year Scottish (41%) and England and Wales (39%) rates calculated using the same
penalties (see Chapter 4).
2.2 Defining ‘Reoffending’2.2.1 The term ‘reoffending’ focuses attention, explanation and policy change on the behaviour of
offenders. Unfortunately, t
not of offender behaviour but of criminal justice behaviour. That is, reoffending studies use
statistics on re-arrest, reconviction and reimprisonment as a proxy for reoffending.
reason for this is simple: there is regularly collected information on criminal justice
processes, but for the most part no systematic, comprehensive and reliable information
REPORT No. 04/2012
Methodology and Research Issues
This review was conducted through a desk-based review of research and email consultation
of key researchers in jurisdictions under review. Data sources include the following:
Official reported statistics on reoffending,
Published studies of reoffending, and
Communications with corrections officials or knowledgeable academics with data on
We report the published statistics, generally descriptive in nature, as they are broken down
in official reports and academic publications. In some cases we have recalculated the
statistics in order to maximise the ability to compare the experience of different countries.
While we strongly emphasise the point that no direct comparisons can be made between
jurisdictions (further discussed below), there are situations when it is useful to see
reoffending patterns among roughly similar offender groups. For example, one major data
reporting issue is that some countries include offenders who have received monetary
penalties (e.g. fines) as the cohort for which reoffending is tracked, and some do not.
Because the fine is typically the most common sanction issued and because reconviction
rates for those receiving fines tends to be much lower than for other disposals (such as
those on probation or leaving custody), inclusion of fined offenders in a cohort will reduce
its overall reoffending rate. For example, according to one analysis of the 2005 cohort in
Northern Ireland, which included those receiving fines, the two-year reconviction rate was
ng includes only those leaving prison, on probation or a community
service order or a combination of these the reoffending rate for this cohort rises to 38% (NI
DOJ, 2012). The exclusion of fine offenders thus brings it into a similar orbit as the (albeit)
year Scottish (41%) and England and Wales (39%) rates calculated using the same
penalties (see Chapter 4).
Defining ‘Reoffending’ The term ‘reoffending’ focuses attention, explanation and policy change on the behaviour of
offenders. Unfortunately, the vast majority of work on reoffending relies on measurements
not of offender behaviour but of criminal justice behaviour. That is, reoffending studies use
arrest, reconviction and reimprisonment as a proxy for reoffending.
this is simple: there is regularly collected information on criminal justice
processes, but for the most part no systematic, comprehensive and reliable information
10
based review of research and email consultation
of key researchers in jurisdictions under review. Data sources include the following:
Communications with corrections officials or knowledgeable academics with data on
We report the published statistics, generally descriptive in nature, as they are broken down
es we have recalculated the
statistics in order to maximise the ability to compare the experience of different countries.
While we strongly emphasise the point that no direct comparisons can be made between
e situations when it is useful to see
reoffending patterns among roughly similar offender groups. For example, one major data
reporting issue is that some countries include offenders who have received monetary
reoffending is tracked, and some do not.
Because the fine is typically the most common sanction issued and because reconviction
rates for those receiving fines tends to be much lower than for other disposals (such as
, inclusion of fined offenders in a cohort will reduce
its overall reoffending rate. For example, according to one analysis of the 2005 cohort in
year reconviction rate was
ng includes only those leaving prison, on probation or a community
service order or a combination of these the reoffending rate for this cohort rises to 38% (NI
DOJ, 2012). The exclusion of fine offenders thus brings it into a similar orbit as the (albeit)
year Scottish (41%) and England and Wales (39%) rates calculated using the same
The term ‘reoffending’ focuses attention, explanation and policy change on the behaviour of
he vast majority of work on reoffending relies on measurements
not of offender behaviour but of criminal justice behaviour. That is, reoffending studies use
arrest, reconviction and reimprisonment as a proxy for reoffending. The
this is simple: there is regularly collected information on criminal justice
processes, but for the most part no systematic, comprehensive and reliable information
www.sccjr.ac.uk
REPORT No. 04/2012
directly about offender behaviour.
criminal justice workload statistics will continue to be the basis of quantitative reoffending
studies. However, it is crucial to appreciate the difference between the two and to avoid
conflating them. This is easier said than done, as ‘reoffending’ and ‘r
predecessor concept which is falling out of fashion in English language jurisdictions) are
constantly used interchangeably with ‘re
danger of interchanging the two kinds of concepts is that
might erroneously be equated with offender behaviour. Consider this excerpt from a New
Zealand reconviction study (Nadesu, 2009a: 19):
‘However, the rate of reconviction for recidivist female
same as recidivist male offenders (81%); clearly there is a
offenders who are as criminally inclined as their male
2.2.2 As noted above, an almost universal finding of the research is that women have lower
reconviction rates than men, and so a discovery of places where this gap is closed or the
relationship reversed is notable. However, it cannot be concluded from this data alone that
the reconviction rate is the result of the criminal inclinations of women. Indeed, as the
statistics presented later in this paper will illustrate, having been to prison is one of the
strongest predictors of reconviction, and it is possible therefore that the prior prison
experience variable explains more of the discrepancy found above than the ha
criminality explanation, for which no data is provided. We then need to know about the
causes of prison sentences
precise definition relating to the features of a person) or a function of c
and behaviour? The widely varying imprisonment rates across countries is one of the ways
that criminologists have established that variations in the practices of political and criminal
justice systems is important and likely more inf
differences in criminal justice populations (Scottish Prisons Commission, 2008; Downes and
Hansen, 2006). We might wonder whether, in countries that have seen major fluctuations in
reoffending rates, major change
behaviour.
2.2.3 With this important caveat in mind, we specify issues and usages of terms within this
review.
What is being measured
term reoffending (and recidivism) interchangeably with specific measurements of
criminal justice behaviour, specifying this as ‘reimprisonment’ or ‘reconviction’ or,
more infrequently, other measure where appr
1 Perhaps an exception are life course studies, long
transitions, as in Laub and Sampson, the Cambridge Delinquency Study, the Edinburgh Study of Youth Transitions,
etc.
REPORT No. 04/2012
directly about offender behaviour.1 Because we can only analyse the information we have,
criminal justice workload statistics will continue to be the basis of quantitative reoffending
studies. However, it is crucial to appreciate the difference between the two and to avoid
conflating them. This is easier said than done, as ‘reoffending’ and ‘r
predecessor concept which is falling out of fashion in English language jurisdictions) are
constantly used interchangeably with ‘re-arrest’, ‘reconviction’ and ‘reimprisonment’. The
danger of interchanging the two kinds of concepts is that that criminal justice behaviour
might erroneously be equated with offender behaviour. Consider this excerpt from a New
Zealand reconviction study (Nadesu, 2009a: 19):
However, the rate of reconviction for recidivist female offenders (80%) is almost
ame as recidivist male offenders (81%); clearly there is a “hard core” of female
offenders who are as criminally inclined as their male counterparts.’
As noted above, an almost universal finding of the research is that women have lower
than men, and so a discovery of places where this gap is closed or the
relationship reversed is notable. However, it cannot be concluded from this data alone that
the reconviction rate is the result of the criminal inclinations of women. Indeed, as the
tistics presented later in this paper will illustrate, having been to prison is one of the
strongest predictors of reconviction, and it is possible therefore that the prior prison
experience variable explains more of the discrepancy found above than the ha
criminality explanation, for which no data is provided. We then need to know about the
causes of prison sentences – are they a function of hardcore criminality (or some more
precise definition relating to the features of a person) or a function of c
and behaviour? The widely varying imprisonment rates across countries is one of the ways
that criminologists have established that variations in the practices of political and criminal
justice systems is important and likely more influential than crime in determining observed
differences in criminal justice populations (Scottish Prisons Commission, 2008; Downes and
Hansen, 2006). We might wonder whether, in countries that have seen major fluctuations in
reoffending rates, major changes are the result of individuals or systems altering their
With this important caveat in mind, we specify issues and usages of terms within this
What is being measured – Reoffending: For the purposes of this report, we use the
term reoffending (and recidivism) interchangeably with specific measurements of
criminal justice behaviour, specifying this as ‘reimprisonment’ or ‘reconviction’ or,
more infrequently, other measure where appropriate. When we intend to speak
Perhaps an exception are life course studies, long-term longitudinal research on criminal careers and other life
and Sampson, the Cambridge Delinquency Study, the Edinburgh Study of Youth Transitions,
11
Because we can only analyse the information we have,
criminal justice workload statistics will continue to be the basis of quantitative reoffending
studies. However, it is crucial to appreciate the difference between the two and to avoid
conflating them. This is easier said than done, as ‘reoffending’ and ‘recidivism’ (the
predecessor concept which is falling out of fashion in English language jurisdictions) are
arrest’, ‘reconviction’ and ‘reimprisonment’. The
that criminal justice behaviour
might erroneously be equated with offender behaviour. Consider this excerpt from a New
offenders (80%) is almost the
“hard core” of female
As noted above, an almost universal finding of the research is that women have lower
than men, and so a discovery of places where this gap is closed or the
relationship reversed is notable. However, it cannot be concluded from this data alone that
the reconviction rate is the result of the criminal inclinations of women. Indeed, as the
tistics presented later in this paper will illustrate, having been to prison is one of the
strongest predictors of reconviction, and it is possible therefore that the prior prison
experience variable explains more of the discrepancy found above than the hardcore
criminality explanation, for which no data is provided. We then need to know about the
are they a function of hardcore criminality (or some more
precise definition relating to the features of a person) or a function of criminal justice policy
and behaviour? The widely varying imprisonment rates across countries is one of the ways
that criminologists have established that variations in the practices of political and criminal
luential than crime in determining observed
differences in criminal justice populations (Scottish Prisons Commission, 2008; Downes and
Hansen, 2006). We might wonder whether, in countries that have seen major fluctuations in
s are the result of individuals or systems altering their
With this important caveat in mind, we specify issues and usages of terms within this
: For the purposes of this report, we use the
term reoffending (and recidivism) interchangeably with specific measurements of
criminal justice behaviour, specifying this as ‘reimprisonment’ or ‘reconviction’ or,
opriate. When we intend to speak
term longitudinal research on criminal careers and other life
and Sampson, the Cambridge Delinquency Study, the Edinburgh Study of Youth Transitions,
www.sccjr.ac.uk
REPORT No. 04/2012
directly about offender behaviour we will indicate this, and prefer the term desistance
to describe a decline in offending and anti
Who is being tracked
whose criminal justice experiences are followed
may refer to all those people who, within a specified time period: were arrested for an
offence; were convicted of an offence; completed a prison sentence; beg
community sentence; were in receipt of any sanction. Where cohorts include those
receiving any sanction, reconviction rates are markedly lower than cohorts of those
receiving only sentences administered by a correctional service (e.g. probation,
community service and prison). Much of this effect is attributable to the inclusion of
those receiving fines, by far the most common sanction issued by courts across Europe
and also the sanction with the lowest reconviction rate. Cohort definitions are
specified in the country discussions in Chapter 4.
What counts as a change in reoffending
here generally defines reduced reoffending by comparing the raw statistics on overall
reconviction (or reimprisonment) rates of on
cohort, broken down by key variables. This is problematic in that this means two
different populations are being compared, and there may be important differences
between them which explain changes.
noting that while Dutch reconviction rates have declined in recent years, there has also
been growth in the proportion of females in the offender population, a group for
which reoffending rates are lower.
reoffending is through predicting reoffending rates (by modelling the strongest
predictive variables) given the characteristics of a cohort and then comparing these to
observed rates of reoffending (this is done in England and Wales, the Ne
model has been developed for Northern Ireland but it is unclear if it is in regular use).
How long reoffending is tracked
during which an event of interest (e.g. new offence/arrest, conviction,
is studied. Official statistics on reoffending tend to identify a cohort and then simply
report reoffending levels in a set period after this (e.g. one or two years). An important
issue is whether the follow
is based on conviction date, while data from England and Wales is based on offence
date; this means the former tracks all convictions within a one
latter includes a six month waiting period on the end of its
convictions for offences
conviction took place beyond this period. Other research employs a methodology
where all offenders and recidivism events are studied over the same ti
O’Donnell et al.’s (2008) study followed all reimprisonment activity for all prisoners
leaving Irish prisons between 2001 and 2004, so the follow
REPORT No. 04/2012
directly about offender behaviour we will indicate this, and prefer the term desistance
to describe a decline in offending and anti-social behaviour.
Who is being tracked – Offender Cohort: The cohort refers to the group
whose criminal justice experiences are followed-up. Depending on the study cited, this
may refer to all those people who, within a specified time period: were arrested for an
offence; were convicted of an offence; completed a prison sentence; beg
community sentence; were in receipt of any sanction. Where cohorts include those
receiving any sanction, reconviction rates are markedly lower than cohorts of those
receiving only sentences administered by a correctional service (e.g. probation,
nity service and prison). Much of this effect is attributable to the inclusion of
those receiving fines, by far the most common sanction issued by courts across Europe
and also the sanction with the lowest reconviction rate. Cohort definitions are
d in the country discussions in Chapter 4.
What counts as a change in reoffending – Reduced Reoffending: Research presented
here generally defines reduced reoffending by comparing the raw statistics on overall
reconviction (or reimprisonment) rates of one cohort against another time period’s
cohort, broken down by key variables. This is problematic in that this means two
different populations are being compared, and there may be important differences
between them which explain changes. Wartna and colleagues (2011) make this point
noting that while Dutch reconviction rates have declined in recent years, there has also
been growth in the proportion of females in the offender population, a group for
which reoffending rates are lower. Another means of measurin
reoffending is through predicting reoffending rates (by modelling the strongest
predictive variables) given the characteristics of a cohort and then comparing these to
observed rates of reoffending (this is done in England and Wales, the Ne
model has been developed for Northern Ireland but it is unclear if it is in regular use).
How long reoffending is tracked – Follow-up Period: This is the amount of time
during which an event of interest (e.g. new offence/arrest, conviction,
is studied. Official statistics on reoffending tend to identify a cohort and then simply
report reoffending levels in a set period after this (e.g. one or two years). An important
issue is whether the follow-up period includes offences or reconvictions
is based on conviction date, while data from England and Wales is based on offence
date; this means the former tracks all convictions within a one-year period, while the
latter includes a six month waiting period on the end of its follow
offences committed within the one year period but where the court
conviction took place beyond this period. Other research employs a methodology
where all offenders and recidivism events are studied over the same ti
O’Donnell et al.’s (2008) study followed all reimprisonment activity for all prisoners
leaving Irish prisons between 2001 and 2004, so the follow-up period ranged from 1 to
12
directly about offender behaviour we will indicate this, and prefer the term desistance
The cohort refers to the group of people
up. Depending on the study cited, this
may refer to all those people who, within a specified time period: were arrested for an
offence; were convicted of an offence; completed a prison sentence; began a
community sentence; were in receipt of any sanction. Where cohorts include those
receiving any sanction, reconviction rates are markedly lower than cohorts of those
receiving only sentences administered by a correctional service (e.g. probation,
nity service and prison). Much of this effect is attributable to the inclusion of
those receiving fines, by far the most common sanction issued by courts across Europe
and also the sanction with the lowest reconviction rate. Cohort definitions are
Research presented
here generally defines reduced reoffending by comparing the raw statistics on overall
e cohort against another time period’s
cohort, broken down by key variables. This is problematic in that this means two
different populations are being compared, and there may be important differences
es (2011) make this point
noting that while Dutch reconviction rates have declined in recent years, there has also
been growth in the proportion of females in the offender population, a group for
Another means of measuring reductions in
reoffending is through predicting reoffending rates (by modelling the strongest
predictive variables) given the characteristics of a cohort and then comparing these to
observed rates of reoffending (this is done in England and Wales, the Netherlands; a
model has been developed for Northern Ireland but it is unclear if it is in regular use).
This is the amount of time
during which an event of interest (e.g. new offence/arrest, conviction, imprisonment)
is studied. Official statistics on reoffending tend to identify a cohort and then simply
report reoffending levels in a set period after this (e.g. one or two years). An important
onvictions. Scottish data
is based on conviction date, while data from England and Wales is based on offence
year period, while the
follow-up date to catch
committed within the one year period but where the court
conviction took place beyond this period. Other research employs a methodology
where all offenders and recidivism events are studied over the same time period.
O’Donnell et al.’s (2008) study followed all reimprisonment activity for all prisoners
up period ranged from 1 to
www.sccjr.ac.uk
REPORT No. 04/2012
48 months. This study used survival regression analysis
across persons in release dates and the duration
Known measurement errors and problems
of measurement: Pseudo
cohort receives a conviction within the follow
occurred prior to the index offence. This creates a slight problem of over counting, but
which may be offset b
we do not know exactly how much pseudo
over counting matter. Some jurisdictions control for pseudo
It is useful to keep this is
even the data we have is likely to contain measurement flaws.
2.3 Comparative Research vs. Comparing Research2.3.1 Comparative research seeks to allow for direct comparisons of one country to another. We
want to warn against direct comparison of the countries whose reoffending rates are
considered in this report. At the same time, we would like to suggest why comparing data
from multiple countries is a useful exercise. As to the first issue, the definitio
described in the previous section give a sense of the difficulties facing anyone wishing to
make a like for like comparison among countries; in sum, the impossibility of direct
comparison is due to differences in:
• Definitions – of offences, di
• Data quality and reporting
challenge for analyses of official statistics.
• Legal procedure and rules
etc. or whether prosecutors have discretion to prosecute or not are but two examples
which would significantly affect reconviction results.
• Legal culture – even where definitions and legal procedural rules might be similar,
local practices can vary significantly, e.g. diff
minor offending such as shoplifting in different ways (diversion from court processes or
full scale prosecution).
• Policy and wider social welfare context
provision antisocia
other systems, meaning the workload entering the system is qualitatively and
quantitatively different than in countries without such provision.
2.3.2 For all of these reasons, a country with a reof
more effective reoffending strategies than a country with a reoffending rate of 40%. These
obstacles to comparison are not necessarily insurmountable but require extensive
investigation to determine their effect o
effort to explore possibilities of comparing reoffending between Scotland, England and
REPORT No. 04/2012
48 months. This study used survival regression analysis to account for d
across persons in release dates and the duration of follow-up.
Known measurement errors and problems – Pseudo-convictions and other problems
: Pseudo-convictions refers to the situation where a member of a
cohort receives a conviction within the follow-up period but for an offence that
occurred prior to the index offence. This creates a slight problem of over counting, but
which may be offset by other biases towards undercounting. The bottom line is that
we do not know exactly how much pseudo-convictions and other forms of under and
over counting matter. Some jurisdictions control for pseudo-convictions; most do not.
It is useful to keep this issue in mind, though, as an example of the general point that
even the data we have is likely to contain measurement flaws.
Comparative Research vs. Comparing Research Comparative research seeks to allow for direct comparisons of one country to another. We
want to warn against direct comparison of the countries whose reoffending rates are
considered in this report. At the same time, we would like to suggest why comparing data
from multiple countries is a useful exercise. As to the first issue, the definitio
described in the previous section give a sense of the difficulties facing anyone wishing to
make a like for like comparison among countries; in sum, the impossibility of direct
comparison is due to differences in:
of offences, disposals, offender cohorts.
Data quality and reporting – accuracy and consistency in reporting is the major
challenge for analyses of official statistics.
Legal procedure and rules – whether the cut off age for adults is under 18, under 16
rosecutors have discretion to prosecute or not are but two examples
which would significantly affect reconviction results.
even where definitions and legal procedural rules might be similar,
local practices can vary significantly, e.g. different countries may systematically manage
minor offending such as shoplifting in different ways (diversion from court processes or
full scale prosecution).
Policy and wider social welfare context – in countries with ample social welfare
provision antisocial behaviour might be addressed or prevented through the work of
other systems, meaning the workload entering the system is qualitatively and
quantitatively different than in countries without such provision.
For all of these reasons, a country with a reoffending rate of 30% cannot be said to have
more effective reoffending strategies than a country with a reoffending rate of 40%. These
obstacles to comparison are not necessarily insurmountable but require extensive
investigation to determine their effect on the rates produced in different countries. A recent
effort to explore possibilities of comparing reoffending between Scotland, England and
13
to account for differences
convictions and other problems
convictions refers to the situation where a member of a
up period but for an offence that
occurred prior to the index offence. This creates a slight problem of over counting, but
y other biases towards undercounting. The bottom line is that
convictions and other forms of under and
convictions; most do not.
sue in mind, though, as an example of the general point that
Comparative research seeks to allow for direct comparisons of one country to another. We
want to warn against direct comparison of the countries whose reoffending rates are
considered in this report. At the same time, we would like to suggest why comparing data
from multiple countries is a useful exercise. As to the first issue, the definitional concerns
described in the previous section give a sense of the difficulties facing anyone wishing to
make a like for like comparison among countries; in sum, the impossibility of direct
accuracy and consistency in reporting is the major
whether the cut off age for adults is under 18, under 16
rosecutors have discretion to prosecute or not are but two examples
even where definitions and legal procedural rules might be similar,
erent countries may systematically manage
minor offending such as shoplifting in different ways (diversion from court processes or
in countries with ample social welfare
l behaviour might be addressed or prevented through the work of
other systems, meaning the workload entering the system is qualitatively and
fending rate of 30% cannot be said to have
more effective reoffending strategies than a country with a reoffending rate of 40%. These
obstacles to comparison are not necessarily insurmountable but require extensive
n the rates produced in different countries. A recent
effort to explore possibilities of comparing reoffending between Scotland, England and
www.sccjr.ac.uk
REPORT No. 04/2012
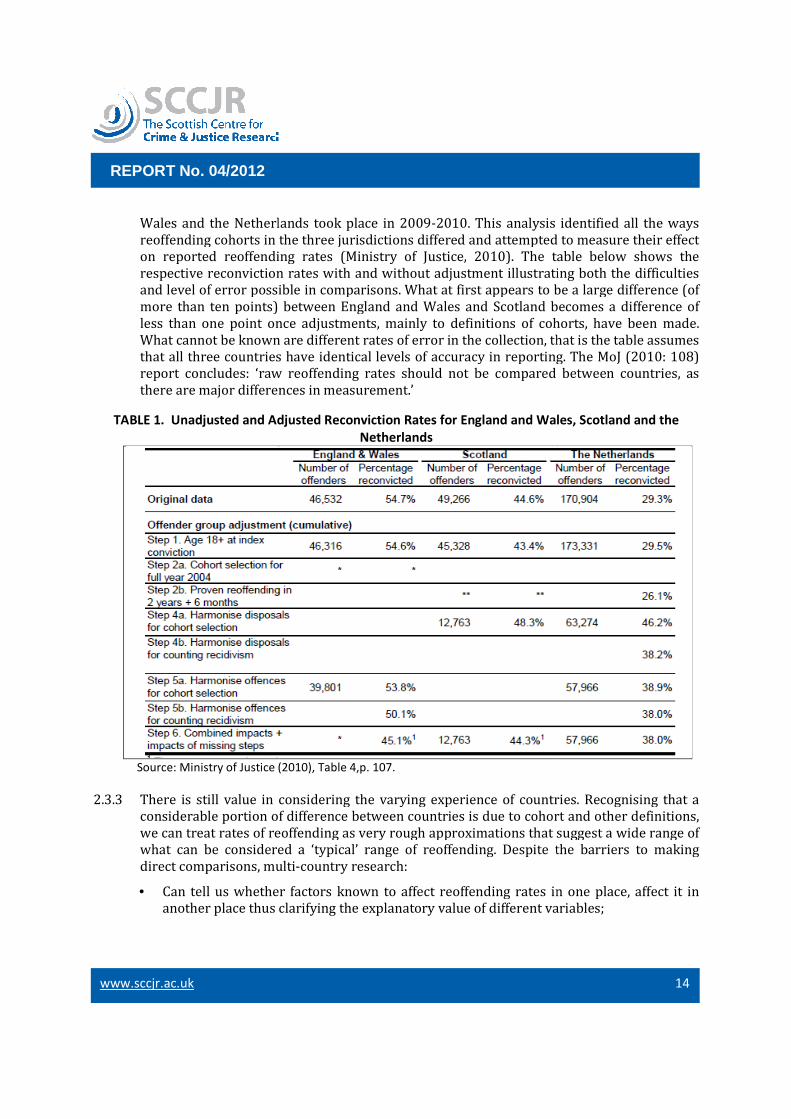
Wales and the Netherlands took place in 2009
reoffending cohorts in the
on reported reoffending rates (Ministry of Justice, 2010). The table below shows the
respective reconviction rates with and without adjustment illustrating both the difficulties
and level of error possible in comparisons. What at first appears to be a large difference (of
more than ten points) between England and Wales and Scotland becomes a difference of
less than one point once adjustments, mainly to definitions of cohorts, have been made
What cannot be known are different rates of error in the collection, that is the table assumes
that all three countries have identical levels of accuracy in reporting. The MoJ (2010: 108)
report concludes: ‘raw reoffending rates should not be compared be
there are major differences in measurement.
TABLE 1. Unadjusted and Adjusted Reconviction Rates for England and Wales, Scotland and the
Source: Ministry of Justice (2010), Table 4,p. 107.
2.3.3 There is still value in considering the varying experience of countries. Recognising that a
considerable portion of difference between countries is due to cohort and other definitions,
we can treat rates of reoffending as very rough approximations that suggest a wide range of
what can be considered a ‘typical’ range of reoffending. Despite the barriers to making
direct comparisons, multi
• Can tell us whether factors known to affect reoffending rates in one place, affect it in
another place thus clarifying the expl
REPORT No. 04/2012
Wales and the Netherlands took place in 2009-2010. This analysis identified all the ways
reoffending cohorts in the three jurisdictions differed and attempted to measure their effect
on reported reoffending rates (Ministry of Justice, 2010). The table below shows the
respective reconviction rates with and without adjustment illustrating both the difficulties
of error possible in comparisons. What at first appears to be a large difference (of
more than ten points) between England and Wales and Scotland becomes a difference of
less than one point once adjustments, mainly to definitions of cohorts, have been made
What cannot be known are different rates of error in the collection, that is the table assumes
that all three countries have identical levels of accuracy in reporting. The MoJ (2010: 108)
raw reoffending rates should not be compared be
there are major differences in measurement.’
Unadjusted and Adjusted Reconviction Rates for England and Wales, Scotland and the
Netherlands
Source: Ministry of Justice (2010), Table 4,p. 107.
considering the varying experience of countries. Recognising that a
considerable portion of difference between countries is due to cohort and other definitions,
we can treat rates of reoffending as very rough approximations that suggest a wide range of
t can be considered a ‘typical’ range of reoffending. Despite the barriers to making
direct comparisons, multi-country research:
Can tell us whether factors known to affect reoffending rates in one place, affect it in
another place thus clarifying the explanatory value of different variables;
14
2010. This analysis identified all the ways
three jurisdictions differed and attempted to measure their effect
on reported reoffending rates (Ministry of Justice, 2010). The table below shows the
respective reconviction rates with and without adjustment illustrating both the difficulties
of error possible in comparisons. What at first appears to be a large difference (of
more than ten points) between England and Wales and Scotland becomes a difference of
less than one point once adjustments, mainly to definitions of cohorts, have been made.
What cannot be known are different rates of error in the collection, that is the table assumes
that all three countries have identical levels of accuracy in reporting. The MoJ (2010: 108)
raw reoffending rates should not be compared between countries, as
Unadjusted and Adjusted Reconviction Rates for England and Wales, Scotland and the
considering the varying experience of countries. Recognising that a
considerable portion of difference between countries is due to cohort and other definitions,
we can treat rates of reoffending as very rough approximations that suggest a wide range of
t can be considered a ‘typical’ range of reoffending. Despite the barriers to making
Can tell us whether factors known to affect reoffending rates in one place, affect it in
anatory value of different variables;

www.sccjr.ac.uk
REPORT No. 04/2012
• Can tell us whether countries making changes in light of these factors have experienced
improvements in reoffending levels; and
• Recognises that concepts such as crime and offending are not universal natural
phenomena but influenced by cultural and national location (Nelken, 2010).
REPORT No. 04/2012
Can tell us whether countries making changes in light of these factors have experienced
improvements in reoffending levels; and
Recognises that concepts such as crime and offending are not universal natural
but influenced by cultural and national location (Nelken, 2010).
15
Can tell us whether countries making changes in light of these factors have experienced
Recognises that concepts such as crime and offending are not universal natural
but influenced by cultural and national location (Nelken, 2010).
www.sccjr.ac.uk
REPORT No. 04/2012
3 Quantities and Qualities of Justice in Selected Countries
This section presents a thumbnail sketch of penal contours and practices of countries included in
this review.
3.1 Scotland 3.1.1 Like other parts of Europe and the UK, Scotland has experienced a trend of declining overall
recorded offences (though with increases in some individual offences), a flattening level of
convictions but rising quantities of all forms of court
community service) except financial penalties (major declines though still the most
numerous of all sanctions) (Recorded Crime in Scotland 2010
Scottish Courts, 2011-12). There has been almost constant reform of
system over the past two decades and with it introduction of new measures and practices
(DTTOs, HDC, bail/remand reform, youth just reform, CPOs, CJAs), a surge in populist
punitivism in the late 1990s through early 2000s and alongside
based paradigm of offender management (McAra, 2009). Nationalist government has
continued change in the criminal justice system, though the punitive and risk dominant
approach may be subsiding in policy, if not in national penal
have one of the highest imprisonment rates in Europe (among western and northern
countries). A particular feature of Scottish penal practice is heavy use of short sentences;
around three-quarters of prison sentences in Scot
Prisons Commission, 2008). There is extensive criminalisation of administrative
misbehaviour, such as breaching bail.
3.2 England and Wales 3.2.1 England and Wales has experienced unprecedented increases in: prison populati
30,000 between 1995 and 2007, MoJ, 2009), number of criminal laws, and numbers of
prisons. Its imprisonment rate is similar to Scotland, and therefore one of the highest
among longstanding EU countries. Among key changes to the justice system have
reorganisation of probation and prison services and the emphasis on probation’s purpose of
enforcement and monitoring of offenders, moving it towards a more punitive stance.
Introduction of the indeterminate sentence for public protection weights
population towards longer term prisoners, though short sentences have been identified as a
policy concern as well. There is a similar criminalisation of administrative misbehaviour
and a similar overall trend of declining crime.
3.3 Northern Ireland 3.3.1 Northern Ireland is a significantly smaller jurisdiction than others included in this review.
Between 1998/99 and 2002/03, recorded crime levels in Northern Ireland increased by
31%, from 109,053 to 142,496, much of which related to the introduction of a
Crime Recording Standard in 2001/02. By 2007/08 the level of recorded crime had fallen
by 24%, to 108,468, remaining fairly stable before falling to 105,040 in 2010/11, the lowest
level of recorded crime in Northern Ireland since the new
(DOJNI, 2012: 9). The prison population declined slightly between 2008 and 2009 (Id.).
REPORT No. 04/2012
Quantities and Qualities of Justice in Selected Countries
This section presents a thumbnail sketch of penal contours and practices of countries included in
r parts of Europe and the UK, Scotland has experienced a trend of declining overall
recorded offences (though with increases in some individual offences), a flattening level of
convictions but rising quantities of all forms of court-ordered disposals (pri
community service) except financial penalties (major declines though still the most
numerous of all sanctions) (Recorded Crime in Scotland 2010-11; Criminal Proceedings in
12). There has been almost constant reform of
system over the past two decades and with it introduction of new measures and practices
(DTTOs, HDC, bail/remand reform, youth just reform, CPOs, CJAs), a surge in populist
punitivism in the late 1990s through early 2000s and alongside this a move towards a risk
based paradigm of offender management (McAra, 2009). Nationalist government has
continued change in the criminal justice system, though the punitive and risk dominant
approach may be subsiding in policy, if not in national penal culture. Scotland continues to
have one of the highest imprisonment rates in Europe (among western and northern
countries). A particular feature of Scottish penal practice is heavy use of short sentences;
quarters of prison sentences in Scotland are for six months or less (Scottish
Prisons Commission, 2008). There is extensive criminalisation of administrative
misbehaviour, such as breaching bail.
England and Wales has experienced unprecedented increases in: prison populati
30,000 between 1995 and 2007, MoJ, 2009), number of criminal laws, and numbers of
prisons. Its imprisonment rate is similar to Scotland, and therefore one of the highest
among longstanding EU countries. Among key changes to the justice system have
reorganisation of probation and prison services and the emphasis on probation’s purpose of
enforcement and monitoring of offenders, moving it towards a more punitive stance.
Introduction of the indeterminate sentence for public protection weights
population towards longer term prisoners, though short sentences have been identified as a
policy concern as well. There is a similar criminalisation of administrative misbehaviour
and a similar overall trend of declining crime.
Northern Ireland is a significantly smaller jurisdiction than others included in this review.
Between 1998/99 and 2002/03, recorded crime levels in Northern Ireland increased by
31%, from 109,053 to 142,496, much of which related to the introduction of a
Crime Recording Standard in 2001/02. By 2007/08 the level of recorded crime had fallen
by 24%, to 108,468, remaining fairly stable before falling to 105,040 in 2010/11, the lowest
level of recorded crime in Northern Ireland since the new counting rules were introduced
The prison population declined slightly between 2008 and 2009 (Id.).
16
Quantities and Qualities of Justice in Selected Countries
This section presents a thumbnail sketch of penal contours and practices of countries included in
r parts of Europe and the UK, Scotland has experienced a trend of declining overall
recorded offences (though with increases in some individual offences), a flattening level of
ordered disposals (prison, probation,
community service) except financial penalties (major declines though still the most
11; Criminal Proceedings in
12). There has been almost constant reform of the criminal justice
system over the past two decades and with it introduction of new measures and practices
(DTTOs, HDC, bail/remand reform, youth just reform, CPOs, CJAs), a surge in populist
this a move towards a risk-
based paradigm of offender management (McAra, 2009). Nationalist government has
continued change in the criminal justice system, though the punitive and risk dominant
culture. Scotland continues to
have one of the highest imprisonment rates in Europe (among western and northern
countries). A particular feature of Scottish penal practice is heavy use of short sentences;
land are for six months or less (Scottish
Prisons Commission, 2008). There is extensive criminalisation of administrative
England and Wales has experienced unprecedented increases in: prison population (over
30,000 between 1995 and 2007, MoJ, 2009), number of criminal laws, and numbers of
prisons. Its imprisonment rate is similar to Scotland, and therefore one of the highest
among longstanding EU countries. Among key changes to the justice system have been the
reorganisation of probation and prison services and the emphasis on probation’s purpose of
enforcement and monitoring of offenders, moving it towards a more punitive stance.
Introduction of the indeterminate sentence for public protection weights the prison
population towards longer term prisoners, though short sentences have been identified as a
policy concern as well. There is a similar criminalisation of administrative misbehaviour
Northern Ireland is a significantly smaller jurisdiction than others included in this review.
Between 1998/99 and 2002/03, recorded crime levels in Northern Ireland increased by
31%, from 109,053 to 142,496, much of which related to the introduction of a new National
Crime Recording Standard in 2001/02. By 2007/08 the level of recorded crime had fallen
by 24%, to 108,468, remaining fairly stable before falling to 105,040 in 2010/11, the lowest
ting rules were introduced
The prison population declined slightly between 2008 and 2009 (Id.).
www.sccjr.ac.uk
REPORT No. 04/2012
3.4 Ireland 3.4.1 Ireland has traditionally had relatively little crime, and more than 20 years ago was
described in the literature as a ‘nation not obs
quoting Adler, 1983). It continues to exhibit one of the lowest rates of recorded crime in
Europe (O’Donnell et al. 2008, quoting
incarceration also remains comparativel
(O’Donnell, 2008). When prison is used, sentences tend to be short, with more than one in
three of less than three months’ duration and the majority (59 per cent in 2005) under six
months (Irish Prison Service, 2
imprisonment is rising, with the prison population doubling in the past 20 years
(Martynowicz and Quigley, 2010). Until very recently, most data have been collected
manually and there have been questions abo
3.5 Norway 3.5.1 Norway has one of the lowest rates of imprisonment among the counties of Europe.
Interestingly it has a higher than average
individual prison capacities than other parts of Europe (Wor
2012). It also features very short prison sentences and lengths of stay: the average time
served in Norwegian prisons is three months and only five per cent of the prison population
stays longer than a year on average (Skardhama
Nordic countries (also including Denmark, Finland, Iceland and Sweden) which are
coordinating information gathering and reporting practices (e.g. Kristoffersen, 2008).
3.6 New Zealand 3.6.1 New Zealand is a country of similar size to Scotland and has a similar imprisonment rate as
Scotland and England and Wales (World Prison Population Brief, 2012). This a higher rate
than Australia. An important feature of the country is its indigenous popul
overrepresentation of ethnic minorities (Maori and Pacific Islander) in the criminal justice
system. This overrepresentation is a topic of policy interest and statistical analysis. New
Zealand also has an established reputation for use of restora
juvenile level, though the influence of penal populism may be more important for
understanding its high imprisonment rate (Pratt and Clark, 2005). Family violence is a
major category of offending and focus of statistics collectio
2011).
REPORT No. 04/2012
Ireland has traditionally had relatively little crime, and more than 20 years ago was
described in the literature as a ‘nation not obsessed by crime’(O’Donnell et al., 2008,
Adler, 1983). It continues to exhibit one of the lowest rates of recorded crime in
O’Donnell et al. 2008, quoting Kilcommins et al., 2004: ch. 3). The level of
incarceration also remains comparatively low, at 72 per 100,000 population in 2006
(O’Donnell, 2008). When prison is used, sentences tend to be short, with more than one in
three of less than three months’ duration and the majority (59 per cent in 2005) under six
months (Irish Prison Service, 2006: 12). (O’Donnell et al, 2008: 126)
imprisonment is rising, with the prison population doubling in the past 20 years
(Martynowicz and Quigley, 2010). Until very recently, most data have been collected
manually and there have been questions about data quality.
Norway has one of the lowest rates of imprisonment among the counties of Europe.
Interestingly it has a higher than average number of prisons but much smaller than average
individual prison capacities than other parts of Europe (World Prison Population Brief,
2012). It also features very short prison sentences and lengths of stay: the average time
served in Norwegian prisons is three months and only five per cent of the prison population
stays longer than a year on average (Skardhamar and Telle, 2012). Norway is one of the
Nordic countries (also including Denmark, Finland, Iceland and Sweden) which are
coordinating information gathering and reporting practices (e.g. Kristoffersen, 2008).
New Zealand is a country of similar size to Scotland and has a similar imprisonment rate as
Scotland and England and Wales (World Prison Population Brief, 2012). This a higher rate
than Australia. An important feature of the country is its indigenous popul
overrepresentation of ethnic minorities (Maori and Pacific Islander) in the criminal justice
system. This overrepresentation is a topic of policy interest and statistical analysis. New
Zealand also has an established reputation for use of restorative justice especially at
juvenile level, though the influence of penal populism may be more important for
understanding its high imprisonment rate (Pratt and Clark, 2005). Family violence is a
major category of offending and focus of statistics collection (NZ Department of Corrections,
17
Ireland has traditionally had relatively little crime, and more than 20 years ago was
O’Donnell et al., 2008,
Adler, 1983). It continues to exhibit one of the lowest rates of recorded crime in
Kilcommins et al., 2004: ch. 3). The level of
y low, at 72 per 100,000 population in 2006
(O’Donnell, 2008). When prison is used, sentences tend to be short, with more than one in
three of less than three months’ duration and the majority (59 per cent in 2005) under six
006: 12). (O’Donnell et al, 2008: 126). However,
imprisonment is rising, with the prison population doubling in the past 20 years
(Martynowicz and Quigley, 2010). Until very recently, most data have been collected
Norway has one of the lowest rates of imprisonment among the counties of Europe.
of prisons but much smaller than average
ld Prison Population Brief,
2012). It also features very short prison sentences and lengths of stay: the average time
served in Norwegian prisons is three months and only five per cent of the prison population
r and Telle, 2012). Norway is one of the
Nordic countries (also including Denmark, Finland, Iceland and Sweden) which are
coordinating information gathering and reporting practices (e.g. Kristoffersen, 2008).
New Zealand is a country of similar size to Scotland and has a similar imprisonment rate as
Scotland and England and Wales (World Prison Population Brief, 2012). This a higher rate
than Australia. An important feature of the country is its indigenous population and
overrepresentation of ethnic minorities (Maori and Pacific Islander) in the criminal justice
system. This overrepresentation is a topic of policy interest and statistical analysis. New
tive justice especially at
juvenile level, though the influence of penal populism may be more important for
understanding its high imprisonment rate (Pratt and Clark, 2005). Family violence is a
n (NZ Department of Corrections,
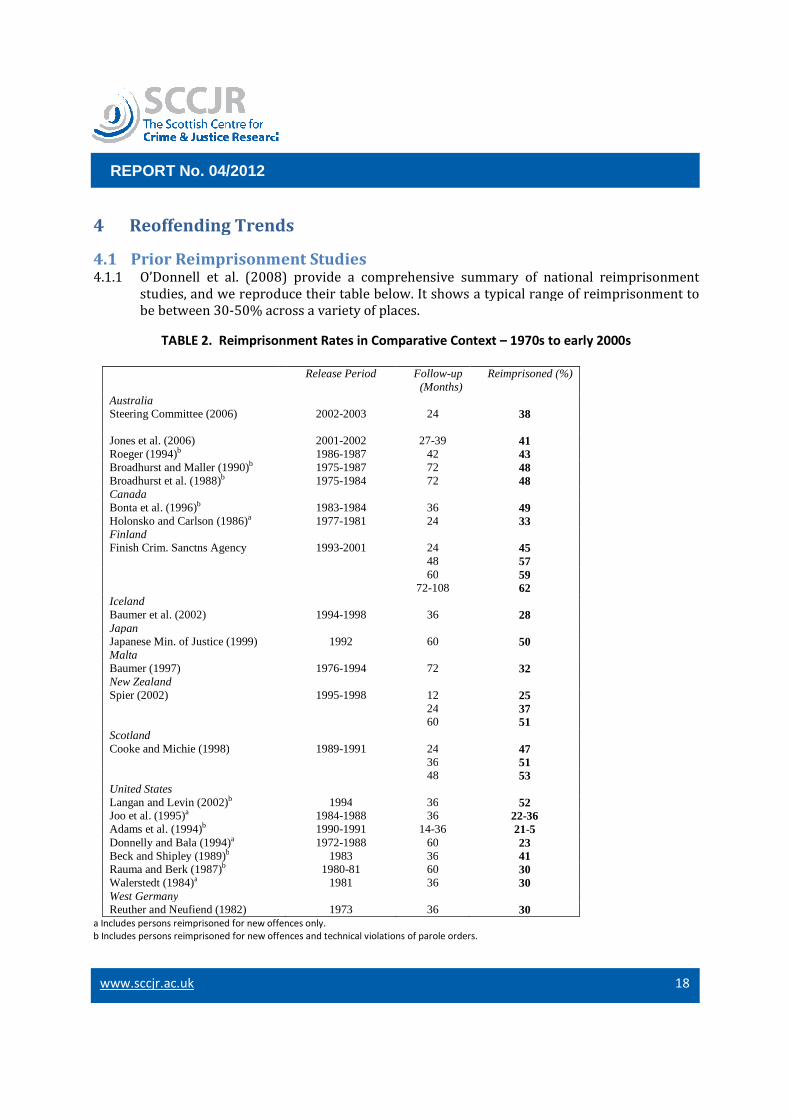
www.sccjr.ac.uk
REPORT No. 04/2012
4 Reoffending Trends
4.1 Prior Reimprisonment Studies4.1.1 O’Donnell et al. (2008) provide a comprehensive summary of national reimprisonment
studies, and we reproduce their table below. It shows a typical range of
be between 30-50% across a variety of places.
TABLE 2. Reimprisonment Rates in Comparative Context
Australia Steering Committee (2006)
Jones et al. (2006) Roeger (1994)b Broadhurst and Maller (1990)b Broadhurst et al. (1988)b Canada Bonta et al. (1996)b Holonsko and Carlson (1986)a Finland Finish Crim. Sanctns Agency Iceland Baumer et al. (2002) Japan Japanese Min. of Justice (1999) Malta Baumer (1997) New Zealand Spier (2002) Scotland Cooke and Michie (1998) United States Langan and Levin (2002)b Joo et al. (1995)a Adams et al. (1994)b Donnelly and Bala (1994)a Beck and Shipley (1989)b Rauma and Berk (1987)b Walerstedt (1984)a West Germany Reuther and Neufiend (1982)
a Includes persons reimprisoned for new offences only.
b Includes persons reimprisoned for new offences and technical violations of parole orders.
REPORT No. 04/2012
Reoffending Trends
Prior Reimprisonment Studies O’Donnell et al. (2008) provide a comprehensive summary of national reimprisonment
studies, and we reproduce their table below. It shows a typical range of
50% across a variety of places.
Reimprisonment Rates in Comparative Context – 1970s to early 2000s
Release Period Follow-up (Months)
Reimprisoned (%)
2002-2003 24 38
2001-2002 27-39 41 1986-1987 42 43 1975-1987 72 48 1975-1984 72 48
1983-1984 36 49 1977-1981 24 33
1993-2001 24 45
48 57 60 59 72-108 62
1994-1998 36 28
1992 60 50
1976-1994 72 32
1995-1998 12 25 24 37 60 51
1989-1991 24 47 36 51 48 53
1994 36 52 1984-1988 36 22-36 1990-1991 14-36 21-5 1972-1988 60 23
1983 36 41 1980-81 60 30
1981 36 30
1973 36 30 for new offences only.
b Includes persons reimprisoned for new offences and technical violations of parole orders.
18
O’Donnell et al. (2008) provide a comprehensive summary of national reimprisonment
studies, and we reproduce their table below. It shows a typical range of reimprisonment to
0s to early 2000s
Reimprisoned (%)
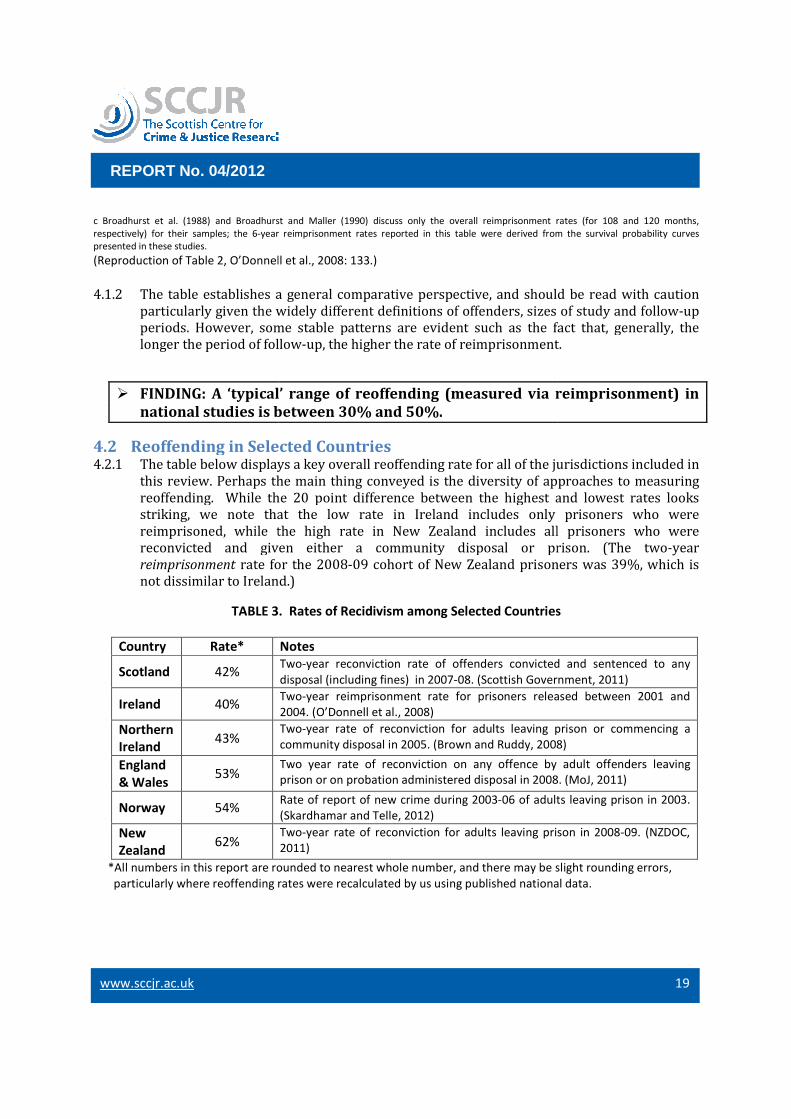
www.sccjr.ac.uk
REPORT No. 04/2012
c Broadhurst et al. (1988) and Broadhurst and Maller (1990) discuss only the overall reimprisonment
respectively) for their samples; the 6-year reimprisonment rates reported in this table were derived from the survival probability curves
presented in these studies.
(Reproduction of Table 2, O’Donnell et al., 2008: 133
4.1.2 The table establishes a general comparative perspective, and should be read with caution
particularly given the widely different definitions of offenders, sizes of study and follow
periods. However, some stable patterns are evident such as the fact that, generally, the
longer the period of follow
� FINDING: A ‘typical’ range of reoffending (measured via reimprisonment) in
national studies is between
4.2 Reoffending in Selected Countries4.2.1 The table below displays a key overall reoffending rate for all of the jurisdictions included in
this review. Perhaps the main thing conveyed is the diversity of approaches to measuring
reoffending. While the
striking, we note that the low rate in Ireland includes only prisoners who were
reimprisoned, while the high rate in New Zealand includes all prisoners who were
reconvicted and given either a
reimprisonment rate for the 2008
not dissimilar to Ireland.)
TABLE 3.
Country Rate*
Scotland 42%
Ireland 40%
Northern
Ireland 43%
England
& Wales 53%
Norway 54%
New
Zealand 62%
*All numbers in this report are rounded to nearest whole number
particularly where reoffending rates were recalculated by us using published national data.
REPORT No. 04/2012
c Broadhurst et al. (1988) and Broadhurst and Maller (1990) discuss only the overall reimprisonment rates (for 108 and 120 months,
year reimprisonment rates reported in this table were derived from the survival probability curves
O’Donnell et al., 2008: 133.)
a general comparative perspective, and should be read with caution
particularly given the widely different definitions of offenders, sizes of study and follow
However, some stable patterns are evident such as the fact that, generally, the
longer the period of follow-up, the higher the rate of reimprisonment.
FINDING: A ‘typical’ range of reoffending (measured via reimprisonment) in
national studies is between 30% and 50%.
Reoffending in Selected Countries The table below displays a key overall reoffending rate for all of the jurisdictions included in
this review. Perhaps the main thing conveyed is the diversity of approaches to measuring
reoffending. While the 20 point difference between the highest and lowest rates looks
striking, we note that the low rate in Ireland includes only prisoners who were
reimprisoned, while the high rate in New Zealand includes all prisoners who were
reconvicted and given either a community disposal or prison. (The two
rate for the 2008-09 cohort of New Zealand prisoners was 39%, which is
not dissimilar to Ireland.)
TABLE 3. Rates of Recidivism among Selected Countries
Notes
Two-year reconviction rate of offenders convicted and sentenced to any
disposal (including fines) in 2007-08. (Scottish Government, 2011)
Two-year reimprisonment rate for prisoners released between 2001 and
2004. (O’Donnell et al., 2008)
Two-year rate of reconviction for adults leaving prison
community disposal in 2005. (Brown and Ruddy, 2008)
Two year rate of reconviction on any offence by
prison or on probation administered disposal in 2008
Rate of report of new crime during 2003-06 of adults leaving prison in 2003
(Skardhamar and Telle, 2012)
Two-year rate of reconviction for adults leaving prison in 2008
2011)
ounded to nearest whole number, and there may be slight rounding errors,
particularly where reoffending rates were recalculated by us using published national data.
19
rates (for 108 and 120 months,
year reimprisonment rates reported in this table were derived from the survival probability curves
a general comparative perspective, and should be read with caution
particularly given the widely different definitions of offenders, sizes of study and follow-up
However, some stable patterns are evident such as the fact that, generally, the
up, the higher the rate of reimprisonment.
FINDING: A ‘typical’ range of reoffending (measured via reimprisonment) in
The table below displays a key overall reoffending rate for all of the jurisdictions included in
this review. Perhaps the main thing conveyed is the diversity of approaches to measuring
20 point difference between the highest and lowest rates looks
striking, we note that the low rate in Ireland includes only prisoners who were
reimprisoned, while the high rate in New Zealand includes all prisoners who were
community disposal or prison. (The two-year
09 cohort of New Zealand prisoners was 39%, which is
Rates of Recidivism among Selected Countries
offenders convicted and sentenced to any
08. (Scottish Government, 2011)
year reimprisonment rate for prisoners released between 2001 and
prison or commencing a
. (Brown and Ruddy, 2008)
Two year rate of reconviction on any offence by adult offenders leaving
in 2008. (MoJ, 2011)
06 of adults leaving prison in 2003.
prison in 2008-09. (NZDOC,
, and there may be slight rounding errors,
particularly where reoffending rates were recalculated by us using published national data.
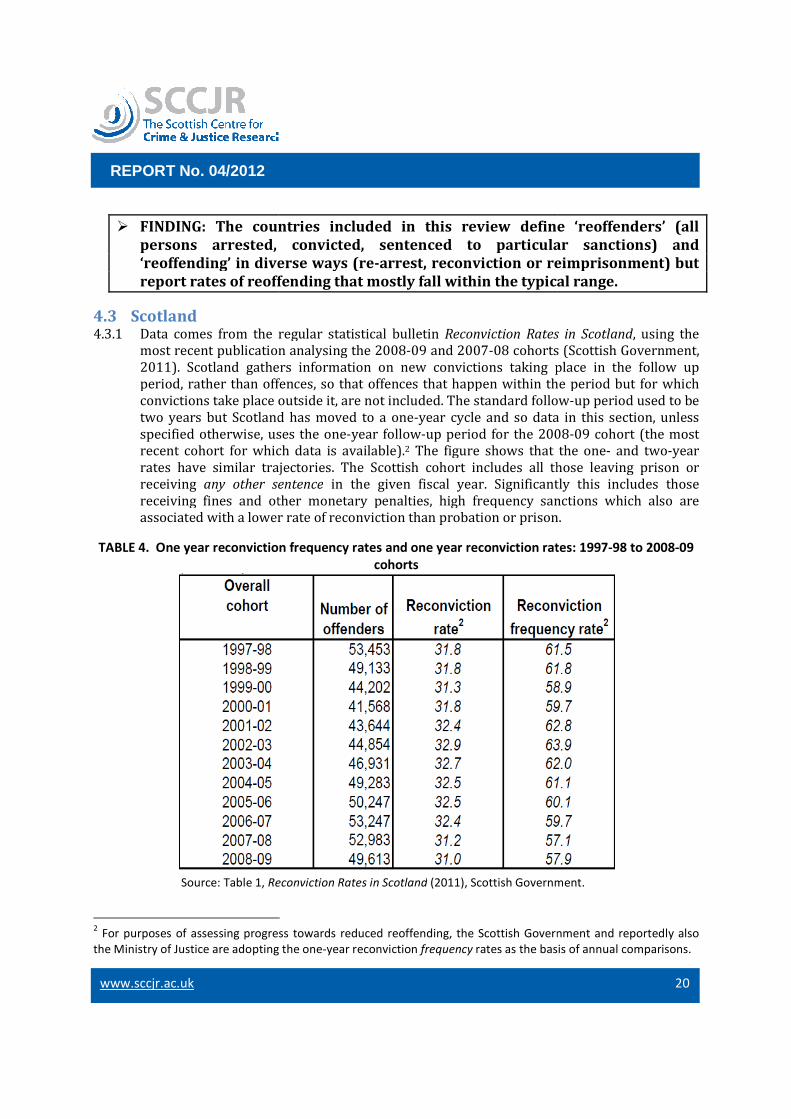
www.sccjr.ac.uk
REPORT No. 04/2012
� FINDING: The countries
persons arrested, convicted, sentenced to particular sanctions) and
‘reoffending’ in diverse ways (re
report rates of reoffending that mostly fall within the typi
4.3 Scotland 4.3.1 Data comes from the regular statistical bulletin
most recent publication analysing the 2008
2011). Scotland gathers information on new convictions taking place in the follow up
period, rather than offences, so that offences that happen within the p
convictions take place outside it, are not included. The standard follow
two years but Scotland has moved to a one
specified otherwise, uses the one
recent cohort for which data is available).
rates have similar trajectories. The Scottish cohort includes all those leaving prison or
receiving any other sentence
receiving fines and other monetary penalties, high frequency sanctions which also are
associated with a lower rate of reconviction than probation or prison.
TABLE 4. One year reconviction frequency rates an
Source: Table 1, Reconviction Rates in Scotland
2 For purposes of assessing progress towards reduced reoffending, the Scottish Government and reportedly also
the Ministry of Justice are adopting the one
REPORT No. 04/2012
FINDING: The countries included in this review define ‘reoffenders’ (all
persons arrested, convicted, sentenced to particular sanctions) and
‘reoffending’ in diverse ways (re-arrest, reconviction or reimprisonment) but
report rates of reoffending that mostly fall within the typical range.
Data comes from the regular statistical bulletin Reconviction Rates in Scotland
most recent publication analysing the 2008-09 and 2007-08 cohorts (Scottish Government,
2011). Scotland gathers information on new convictions taking place in the follow up
period, rather than offences, so that offences that happen within the p
convictions take place outside it, are not included. The standard follow
two years but Scotland has moved to a one-year cycle and so data in this section, unless
specified otherwise, uses the one-year follow-up period for the 2008
recent cohort for which data is available).2 The figure shows that the one
rates have similar trajectories. The Scottish cohort includes all those leaving prison or
any other sentence in the given fiscal year. Significantly this includes those
receiving fines and other monetary penalties, high frequency sanctions which also are
associated with a lower rate of reconviction than probation or prison.
TABLE 4. One year reconviction frequency rates and one year reconviction rates: 1997
cohorts
Reconviction Rates in Scotland (2011), Scottish Government.
For purposes of assessing progress towards reduced reoffending, the Scottish Government and reportedly also
the Ministry of Justice are adopting the one-year reconviction frequency rates as the basis of annual comparisons.
20
included in this review define ‘reoffenders’ (all
persons arrested, convicted, sentenced to particular sanctions) and
arrest, reconviction or reimprisonment) but
cal range.
Reconviction Rates in Scotland, using the
08 cohorts (Scottish Government,
2011). Scotland gathers information on new convictions taking place in the follow up
period, rather than offences, so that offences that happen within the period but for which
convictions take place outside it, are not included. The standard follow-up period used to be
year cycle and so data in this section, unless
od for the 2008-09 cohort (the most
The figure shows that the one- and two-year
rates have similar trajectories. The Scottish cohort includes all those leaving prison or
fiscal year. Significantly this includes those
receiving fines and other monetary penalties, high frequency sanctions which also are
associated with a lower rate of reconviction than probation or prison.
d one year reconviction rates: 1997-98 to 2008-09
(2011), Scottish Government.
For purposes of assessing progress towards reduced reoffending, the Scottish Government and reportedly also
rates as the basis of annual comparisons.
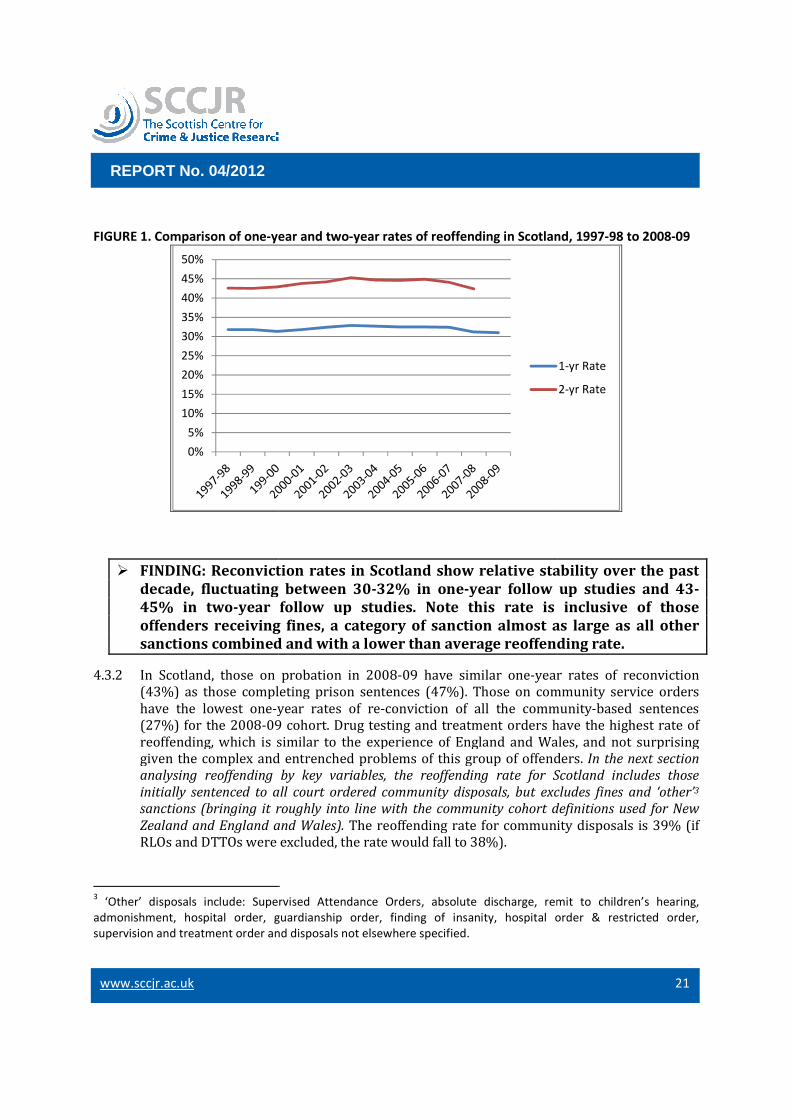
www.sccjr.ac.uk
REPORT No. 04/2012
FIGURE 1. Comparison of one-year and two
� FINDING: Reconviction rates in Scotland show relative stability over the past
decade, fluctuating between 30
45% in two-year follow up studies.
offenders receiving fines, a category of sanction almost as large as all other
sanctions combined and with a lower than average reoffending rate.
4.3.2 In Scotland, those on probation in 2008
(43%) as those completing prison sentences (47%). Those on community service orders
have the lowest one-year rates of re
(27%) for the 2008-09 cohort. Drug testing and treatment orders have the
reoffending, which is similar to the experience of England and Wales, and not surprising
given the complex and entrenched problems of this group of offenders.
analysing reoffending by key variables, the reoffending rate
initially sentenced to all court ordered community disposals,
sanctions (bringing it roughly into line with the community cohort definitions used for New
Zealand and England and Wales).
RLOs and DTTOs were excluded, the rate would fall to 38%).
3 ‘Other’ disposals include: Supervised Attendance Orders, absolute discharge, remit to children’s hearing,
admonishment, hospital order, guardianship order, finding of insanity, hospital orde
supervision and treatment order and disposals not elsewhere specified.
0%
5%
10%
15%
20%
25%
30%
35%
40%
45%
50%
REPORT No. 04/2012
year and two-year rates of reoffending in Scotland, 1997
FINDING: Reconviction rates in Scotland show relative stability over the past
decade, fluctuating between 30-32% in one-year follow up studies and 43
year follow up studies. Note this rate is inclusive of those
offenders receiving fines, a category of sanction almost as large as all other
sanctions combined and with a lower than average reoffending rate.
In Scotland, those on probation in 2008-09 have similar one-year rates o
(43%) as those completing prison sentences (47%). Those on community service orders
year rates of re-conviction of all the community
09 cohort. Drug testing and treatment orders have the
reoffending, which is similar to the experience of England and Wales, and not surprising
given the complex and entrenched problems of this group of offenders.
analysing reoffending by key variables, the reoffending rate for Scotland includes
all court ordered community disposals, but excludes
sanctions (bringing it roughly into line with the community cohort definitions used for New
Zealand and England and Wales). The reoffending rate for community disposals is 39% (if
RLOs and DTTOs were excluded, the rate would fall to 38%).
‘Other’ disposals include: Supervised Attendance Orders, absolute discharge, remit to children’s hearing,
admonishment, hospital order, guardianship order, finding of insanity, hospital orde
supervision and treatment order and disposals not elsewhere specified.
21
year rates of reoffending in Scotland, 1997-98 to 2008-09
FINDING: Reconviction rates in Scotland show relative stability over the past
year follow up studies and 43-
Note this rate is inclusive of those
offenders receiving fines, a category of sanction almost as large as all other
sanctions combined and with a lower than average reoffending rate.
year rates of reconviction
(43%) as those completing prison sentences (47%). Those on community service orders
conviction of all the community-based sentences
09 cohort. Drug testing and treatment orders have the highest rate of
reoffending, which is similar to the experience of England and Wales, and not surprising
given the complex and entrenched problems of this group of offenders. In the next section
for Scotland includes those
but excludes fines and ‘other’3
sanctions (bringing it roughly into line with the community cohort definitions used for New
ending rate for community disposals is 39% (if
‘Other’ disposals include: Supervised Attendance Orders, absolute discharge, remit to children’s hearing,
admonishment, hospital order, guardianship order, finding of insanity, hospital order & restricted order,
1-yr Rate
2-yr Rate
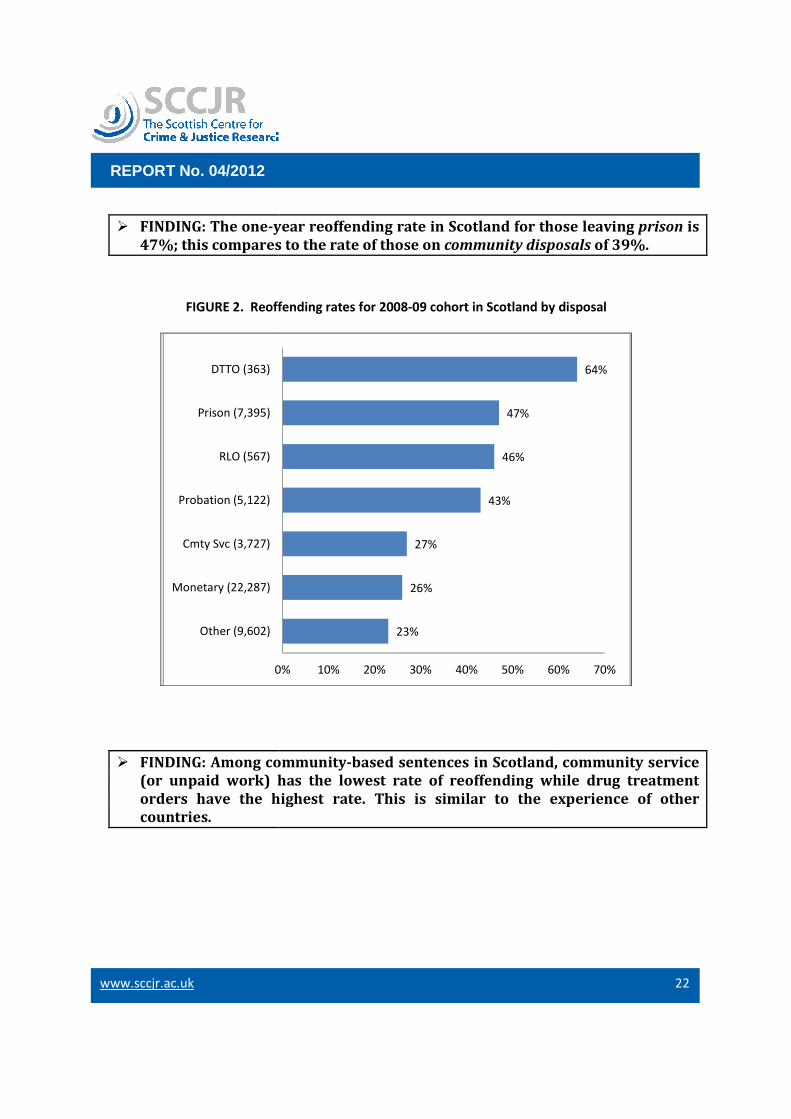
www.sccjr.ac.uk
REPORT No. 04/2012
� FINDING: The one-year reoffending rate in Scotland for those leaving
47%; this compares to the rate of those on
FIGURE 2. Reoffending rates for 2008
� FINDING: Among community
(or unpaid work) has the lowest rate of reoffending while drug treatment
orders have the highest rate.
countries.
0%
Other (9,602)
Monetary (22,287)
Cmty Svc (3,727)
Probation (5,122)
RLO (567)
Prison (7,395)
DTTO (363)
REPORT No. 04/2012
year reoffending rate in Scotland for those leaving
47%; this compares to the rate of those on community disposals
Reoffending rates for 2008-09 cohort in Scotland by disposal
FINDING: Among community-based sentences in Scotland, community service
(or unpaid work) has the lowest rate of reoffending while drug treatment
orders have the highest rate. This is similar to the experience of other
23%
26%
27%
43%
46%
47%
0% 10% 20% 30% 40% 50% 60%
22
year reoffending rate in Scotland for those leaving prison is
community disposals of 39%.
09 cohort in Scotland by disposal
based sentences in Scotland, community service
(or unpaid work) has the lowest rate of reoffending while drug treatment
This is similar to the experience of other
64%
60% 70%

www.sccjr.ac.uk
REPORT No. 04/2012
4.4 England & Wales 4.4.1 The Ministry of Justice regularly publishes adult reconviction statistics and in addition
produces sub-studies contained, for example, in its compendium of criminal justice
statistics. The cohort includes all offenders in the first quarter of a given year
been convicted and are either completing a prison sentence or beginning one of the court
ordered sentences administered by probation (e.g. probation, drug treatment orders,
suspended sentences, etc.), and thus excludes pre
like fines (Table 5). The 2003 Criminal Justice Act reorganised community sentences into a
single order (the ‘community order’) and introduced a new sanction, the suspended
sentence order. Use of suspended sentences has grown rapidly, nearly
first use in 2006 to over 15,000 in the first quarter of 2009; this has occurred alongside
increases in other kinds of community orders as well as prison sentences (some of which
they were intended to displace). England and Wales will
system of counting that includes a full year’s cohort and a wider range of disposals
(including pre-court ones) which means many more people will be added to the cohort, and
the level of reoffending will decline (Ministry of Ju
� FINDING: The overall
the first quarter of 2009 was 39%, or 49% for offenders leaving
36% for offenders on
TABLE 5. One-year Reconviction Rates of First
Source: Table 2, Adult re-convictions: results from the 2009 cohort, England and Wales, Ministry of Justice.
REPORT No. 04/2012
The Ministry of Justice regularly publishes adult reconviction statistics and in addition
studies contained, for example, in its compendium of criminal justice
statistics. The cohort includes all offenders in the first quarter of a given year
been convicted and are either completing a prison sentence or beginning one of the court
ordered sentences administered by probation (e.g. probation, drug treatment orders,
suspended sentences, etc.), and thus excludes pre-court disposals and mone
like fines (Table 5). The 2003 Criminal Justice Act reorganised community sentences into a
single order (the ‘community order’) and introduced a new sanction, the suspended
sentence order. Use of suspended sentences has grown rapidly, nearly
first use in 2006 to over 15,000 in the first quarter of 2009; this has occurred alongside
increases in other kinds of community orders as well as prison sentences (some of which
they were intended to displace). England and Wales will be moving from 2012 to a new
system of counting that includes a full year’s cohort and a wider range of disposals
court ones) which means many more people will be added to the cohort, and
the level of reoffending will decline (Ministry of Justice 2011).
overall reconviction rate for offenders in England and Wales in
the first quarter of 2009 was 39%, or 49% for offenders leaving
36% for offenders on community sentences.
year Reconviction Rates of First Quarter Offenders in England and Wales, 2000 to 2009
convictions: results from the 2009 cohort, England and Wales, Ministry of Justice.
23
The Ministry of Justice regularly publishes adult reconviction statistics and in addition
studies contained, for example, in its compendium of criminal justice
statistics. The cohort includes all offenders in the first quarter of a given year who have
been convicted and are either completing a prison sentence or beginning one of the court-
ordered sentences administered by probation (e.g. probation, drug treatment orders,
court disposals and monetary penalties
like fines (Table 5). The 2003 Criminal Justice Act reorganised community sentences into a
single order (the ‘community order’) and introduced a new sanction, the suspended
sentence order. Use of suspended sentences has grown rapidly, nearly doubling from their
first use in 2006 to over 15,000 in the first quarter of 2009; this has occurred alongside
increases in other kinds of community orders as well as prison sentences (some of which
be moving from 2012 to a new
system of counting that includes a full year’s cohort and a wider range of disposals
court ones) which means many more people will be added to the cohort, and
reconviction rate for offenders in England and Wales in
the first quarter of 2009 was 39%, or 49% for offenders leaving prison and
Quarter Offenders in England and Wales, 2000 to 2009
convictions: results from the 2009 cohort, England and Wales, Ministry of Justice.
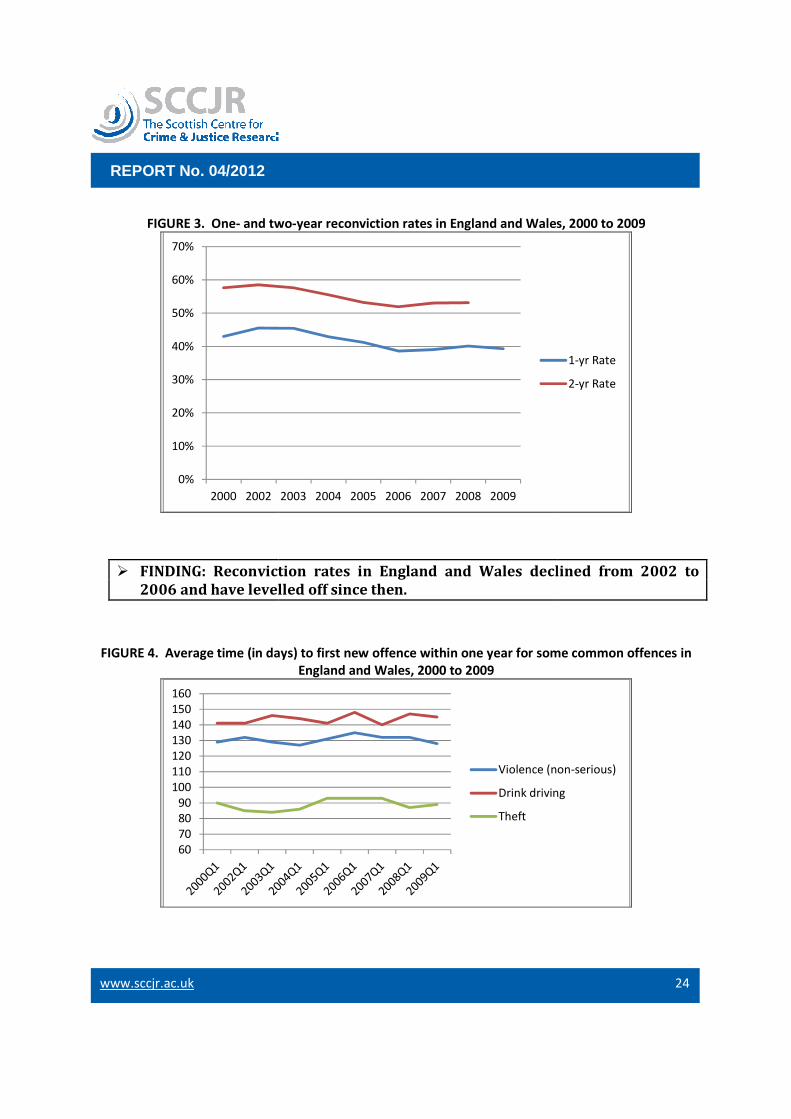
www.sccjr.ac.uk
REPORT No. 04/2012
FIGURE 3. One- and two
� FINDING: Reconviction rates in England and Wales declined from 2002 to
2006 and have levelled off since then.
FIGURE 4. Average time (in days) to first new offence within one year for some common offences
0%
10%
20%
30%
40%
50%
60%
70%
2000 2002
60
70
80
90
100
110
120
130
140
150
160
REPORT No. 04/2012
and two-year reconviction rates in England and Wales, 2000 to 2009
FINDING: Reconviction rates in England and Wales declined from 2002 to
2006 and have levelled off since then.
Average time (in days) to first new offence within one year for some common offences
England and Wales, 2000 to 2009
2003 2004 2005 2006 2007 2008 2009
Violence (non
Drink driving
Theft
24
year reconviction rates in England and Wales, 2000 to 2009
FINDING: Reconviction rates in England and Wales declined from 2002 to
Average time (in days) to first new offence within one year for some common offences in
1-yr Rate
2-yr Rate
Violence (non-serious)
Drink driving
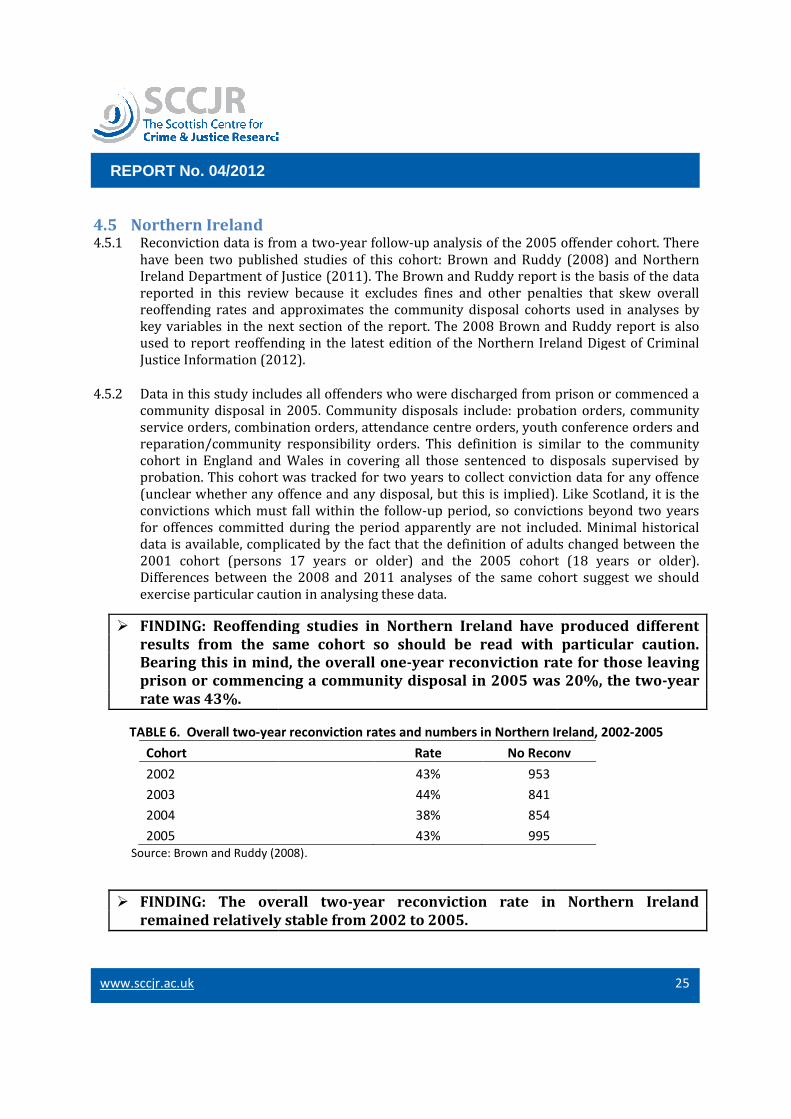
www.sccjr.ac.uk
REPORT No. 04/2012
4.5 Northern Ireland 4.5.1 Reconviction data is from a two
have been two published studies of this cohort: Brown and Ruddy (2008) and Northern
Ireland Department of Justice (2011). The Brown and Ruddy report
reported in this review because it excludes fines and other penalties that skew overall
reoffending rates and approximates the community disposal cohorts used in analyses by
key variables in the next section of the report. The 200
used to report reoffending in the latest edition of the Northern Ireland Digest of Criminal
Justice Information (2012).
4.5.2 Data in this study includes all offenders who were discharged from prison or commenced a
community disposal in 2005. Community disposals include:
service orders, combination
reparation/community responsibility orders
cohort in England and Wales in covering all those sentenced to disposals supervised by
probation. This cohort was tracked for two years to collect conviction data for any offence
(unclear whether any offence and any disposal, but this is implied). Like Scotland
convictions which must fall within the follow
for offences committed during the period apparently are not included. Minimal historical
data is available, complicated by the fact that the definition of
2001 cohort (persons 17 years or older) and the 2005 cohort (18 years or older).
Differences between the 2008 and 2011 analyses of the same cohort suggest we should
exercise particular caution in analysing these data.
� FINDING: Reoffending studies in Northern Ireland have produced different
results from the same cohort so should be read with particular caution.
Bearing this in mind, the overall one
prison or commencing a community disposal
rate was 43%.
TABLE 6. Overall two-year
Cohort
2002
2003
2004
2005
Source: Brown and Ruddy (2008)
� FINDING: The overall two
remained relatively stable from 2002 to 2005.
REPORT No. 04/2012
Reconviction data is from a two-year follow-up analysis of the 2005 offender cohort. There
have been two published studies of this cohort: Brown and Ruddy (2008) and Northern
Ireland Department of Justice (2011). The Brown and Ruddy report
reported in this review because it excludes fines and other penalties that skew overall
reoffending rates and approximates the community disposal cohorts used in analyses by
key variables in the next section of the report. The 2008 Brown and Ruddy report is also
used to report reoffending in the latest edition of the Northern Ireland Digest of Criminal
Justice Information (2012).
Data in this study includes all offenders who were discharged from prison or commenced a
sposal in 2005. Community disposals include: probation orders, commun
service orders, combination orders, attendance centre orders, youth c
community responsibility orders. This definition is similar to the community
t in England and Wales in covering all those sentenced to disposals supervised by
probation. This cohort was tracked for two years to collect conviction data for any offence
(unclear whether any offence and any disposal, but this is implied). Like Scotland
convictions which must fall within the follow-up period, so convictions beyond two years
for offences committed during the period apparently are not included. Minimal historical
data is available, complicated by the fact that the definition of adults changed between the
2001 cohort (persons 17 years or older) and the 2005 cohort (18 years or older).
Differences between the 2008 and 2011 analyses of the same cohort suggest we should
exercise particular caution in analysing these data.
Reoffending studies in Northern Ireland have produced different
results from the same cohort so should be read with particular caution.
Bearing this in mind, the overall one-year reconviction rate for those leaving
prison or commencing a community disposal in 2005 was 20%, the two
year reconviction rates and numbers in Northern Ireland, 2002
Rate No Reconv
43% 953
44% 841
38% 854
43% 995
Source: Brown and Ruddy (2008).
FINDING: The overall two-year reconviction rate in Northern Ireland
remained relatively stable from 2002 to 2005.
25
up analysis of the 2005 offender cohort. There
have been two published studies of this cohort: Brown and Ruddy (2008) and Northern
is the basis of the data
reported in this review because it excludes fines and other penalties that skew overall
reoffending rates and approximates the community disposal cohorts used in analyses by
8 Brown and Ruddy report is also
used to report reoffending in the latest edition of the Northern Ireland Digest of Criminal
Data in this study includes all offenders who were discharged from prison or commenced a
probation orders, community
orders, attendance centre orders, youth conference orders and
. This definition is similar to the community
t in England and Wales in covering all those sentenced to disposals supervised by
probation. This cohort was tracked for two years to collect conviction data for any offence
(unclear whether any offence and any disposal, but this is implied). Like Scotland, it is the
up period, so convictions beyond two years
for offences committed during the period apparently are not included. Minimal historical
adults changed between the
2001 cohort (persons 17 years or older) and the 2005 cohort (18 years or older).
Differences between the 2008 and 2011 analyses of the same cohort suggest we should
Reoffending studies in Northern Ireland have produced different
results from the same cohort so should be read with particular caution.
year reconviction rate for those leaving
in 2005 was 20%, the two-year
reconviction rates and numbers in Northern Ireland, 2002-2005
Reconv
year reconviction rate in Northern Ireland
www.sccjr.ac.uk
REPORT No. 04/2012
4.5.3 Slightly less than half of all reconvictions tracked in the two
first 12 months. At the one
(including both prison and community disposal groups) was 20%. This is half the one
follow-up rate in England and Wales (but note England and Wales’s two
includes convictions that happened beyond
within it) and nearly half that of Scotland (once monetary penalties are removed from the
Scottish cohort).
REPORT No. 04/2012
Slightly less than half of all reconvictions tracked in the two-year period happened in the
first 12 months. At the one-year point, the overall reconviction rate for the 2005 cohort
(including both prison and community disposal groups) was 20%. This is half the one
up rate in England and Wales (but note England and Wales’s two
includes convictions that happened beyond this period so long as the offence occurred
within it) and nearly half that of Scotland (once monetary penalties are removed from the
26
year period happened in the
erall reconviction rate for the 2005 cohort
(including both prison and community disposal groups) was 20%. This is half the one-year
up rate in England and Wales (but note England and Wales’s two-year sample
this period so long as the offence occurred
within it) and nearly half that of Scotland (once monetary penalties are removed from the
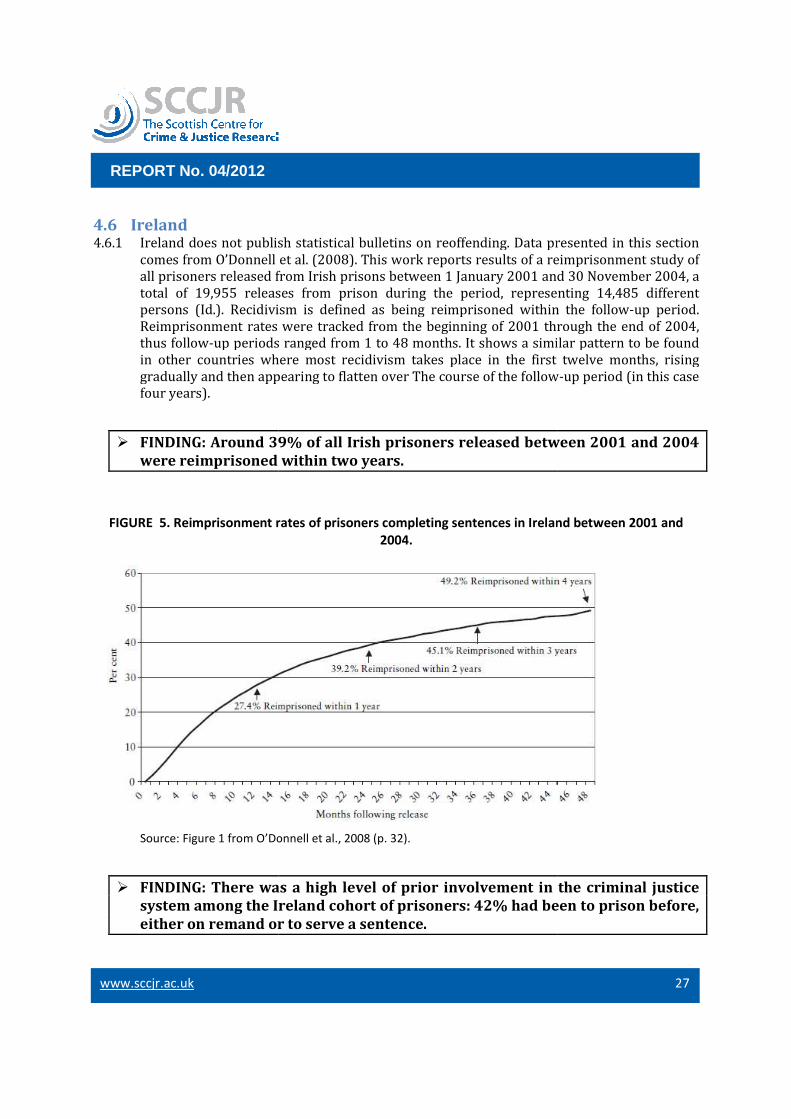
www.sccjr.ac.uk
REPORT No. 04/2012
4.6 Ireland 4.6.1 Ireland does not publish statistical bulletins on reoffending. Data presented in this section
comes from O’Donnell et al. (2008). This work
all prisoners released from Irish prisons between 1 January 2001
total of 19,955 releases from prison during the period, representin
persons (Id.). Recidivism is defined as being reimprisoned within the follow
Reimprisonment rates were tracked from the beginning of 2001 through the end of 2004,
thus follow-up periods ranged from 1 to 48 months
in other countries where most recidivism takes place in the first twelve months, rising
gradually and then appearing to flatten over The course of the follow
four years).
� FINDING: Around 39% of all Irish prisone
were reimprisoned within two years.
FIGURE 5. Reimprisonment rates of prisoners completing sentences in Ireland between 2001 and
Source: Figure 1 from O’Donnell et al., 2008 (p. 32).
� FINDING: There was a high level of prior involvement in the criminal justice
system among the Ireland cohort of prisoners: 42% had been to prison before,
either on remand or to serve a sentence.
REPORT No. 04/2012
Ireland does not publish statistical bulletins on reoffending. Data presented in this section
comes from O’Donnell et al. (2008). This work reports results of a reimprisonment study of
from Irish prisons between 1 January 2001 and 30 November 2004, a
total of 19,955 releases from prison during the period, representin
Recidivism is defined as being reimprisoned within the follow
Reimprisonment rates were tracked from the beginning of 2001 through the end of 2004,
up periods ranged from 1 to 48 months. It shows a similar p
in other countries where most recidivism takes place in the first twelve months, rising
gradually and then appearing to flatten over The course of the follow
FINDING: Around 39% of all Irish prisoners released between 2001 and 2004
were reimprisoned within two years.
Reimprisonment rates of prisoners completing sentences in Ireland between 2001 and
2004.
Figure 1 from O’Donnell et al., 2008 (p. 32).
There was a high level of prior involvement in the criminal justice
system among the Ireland cohort of prisoners: 42% had been to prison before,
either on remand or to serve a sentence.
27
Ireland does not publish statistical bulletins on reoffending. Data presented in this section
a reimprisonment study of
and 30 November 2004, a
total of 19,955 releases from prison during the period, representing 14,485 different
Recidivism is defined as being reimprisoned within the follow-up period.
Reimprisonment rates were tracked from the beginning of 2001 through the end of 2004,
. It shows a similar pattern to be found
in other countries where most recidivism takes place in the first twelve months, rising
gradually and then appearing to flatten over The course of the follow-up period (in this case
rs released between 2001 and 2004
Reimprisonment rates of prisoners completing sentences in Ireland between 2001 and
There was a high level of prior involvement in the criminal justice
system among the Ireland cohort of prisoners: 42% had been to prison before,

www.sccjr.ac.uk
REPORT No. 04/2012
4.6.2 In common with other recidivism research the Irish study found ‘
Ireland were significantly higher
education, the unemployed
reimprisonment was ‘significantly
their confinement and who had a prior prison committal in the recent past
the influence of past imprisonment on future imprisonment. The specific reference to
remand is of note because it is a relatively neglec
interest in Scotland where remand rates have risen significantly over the past ten to 15
years (see Prison Statistics Scotland, 2010
4.6.3 The Irish study also found a significantly higher rate or reimprisonment a
defaulters, who were two and half times more likely to be reimprisoned than those who had
been directly sentenced to prison (O’Donnell et al., 2008).
REPORT No. 04/2012
In common with other recidivism research the Irish study found ‘that
eland were significantly higher among males, younger persons, those with less f
education, the unemployed and the illiterate.’ (O’Donnell et al., 2008: 134). In addition,
significantly higher among those who were held on remand as part of
and who had a prior prison committal in the recent past
the influence of past imprisonment on future imprisonment. The specific reference to
remand is of note because it is a relatively neglected aspect of reoffending research and of
interest in Scotland where remand rates have risen significantly over the past ten to 15
years (see Prison Statistics Scotland, 2010-11).
The Irish study also found a significantly higher rate or reimprisonment a
defaulters, who were two and half times more likely to be reimprisoned than those who had
been directly sentenced to prison (O’Donnell et al., 2008).
28
that recidivism rates in
among males, younger persons, those with less formal
’ (O’Donnell et al., 2008: 134). In addition,
ere held on remand as part of
and who had a prior prison committal in the recent past’, again echoing
the influence of past imprisonment on future imprisonment. The specific reference to
ted aspect of reoffending research and of
interest in Scotland where remand rates have risen significantly over the past ten to 15
The Irish study also found a significantly higher rate or reimprisonment among fine
defaulters, who were two and half times more likely to be reimprisoned than those who had
www.sccjr.ac.uk
REPORT No. 04/2012
4.7 Norway 4.7.1 The Nordic countries (Norway, Denmark, Sweden, Finland and Iceland) have agreed that
recidivism shall be defined as a new conviction
community sentence, though t
participating countries
primary prerequisite for recidivism is any legally binding sentence within two years,
the new sentence is
sentences are thus excluded. Secondly, the act of crime(s) must have happened after release
from prison or after the start of a community sanction. The latter includes community
sentence or service, conditional sentence with supervision, as well as any c
sentence with treatment or electronic monitoring super
(correspondence from
reconvictions (www. krus.no/
available in English but the reconviction rate
cohort, is 20% (correspondence
� FINDING: The reported two
4.7.2 The term ‘recidivism’ used in the following discussion refers to all people arrested and
charged (without regard to whether the charge was dropped, dealt with through a pre
disposal or committed for trial and ultimately resulting in conviction), and rates of arrest in
the five years thereafter. English language data discussing the 2000 cohort shows
consistency with the patterns in other countries. ‘
many of the persons charged are caught for several offences over a longer period of time: Of
all persons charged with crimes
charged] for at least one offence during the next five years. The
per cent, was among those with more serious types of theft and robbery as
offence in 2000. Statistics for the period 2000
previous statistics on recidivism, e.g.
women (32 per cent). As in previous years, the share of recidivism among men decreases
considerably with higher age, whilst the share of recidivism among women increases up to
the age group 30-39 years, where it i
2007). Analysis of the 2005 cohort shows the same trends for gender and age (Statistics
Norway, 2012: Table 21).
4.7.3 In addition to official data, there is a recent s
education and other factors
The authors included in their cohort
custody [i.e. remand])
4 This is at the low end of the reconviction range for countries reviewed in this research, but note that only those
eventually sentenced to a sanction supervised
convicted and sentenced to a fine or suspended sentence) are included in this rate.
reconviction rates include anyone receiving a new conviction, regardless of the senten
REPORT No. 04/2012
The Nordic countries (Norway, Denmark, Sweden, Finland and Iceland) have agreed that
recidivism shall be defined as a new conviction resulting in either a prison se
community sentence, though there remain some dissimilarities between the five
rticipating countries (Correspondence from Gerhard Jans Ploeg, 23 April 2012)
primary prerequisite for recidivism is any legally binding sentence within two years,
to be served in the correctional services. Fines and suspende
sentences are thus excluded. Secondly, the act of crime(s) must have happened after release
from prison or after the start of a community sanction. The latter includes community
sentence or service, conditional sentence with supervision, as well as any c
sentence with treatment or electronic monitoring supervised by the probation services
from Ragnar Kristoffersen, 13 August 2012). The relevant report on
krus.no/ no/ Publikasjoner/ Publikasjoner_ utenom_seriene/
but the reconviction rate in Norway using this definition, for the 2005
cohort, is 20% (correspondence from Ragnar Kristoffersen, 7 May 2012).
FINDING: The reported two-year reconviction rate in Norway is 20%.
The term ‘recidivism’ used in the following discussion refers to all people arrested and
charged (without regard to whether the charge was dropped, dealt with through a pre
sposal or committed for trial and ultimately resulting in conviction), and rates of arrest in
the five years thereafter. English language data discussing the 2000 cohort shows
consistency with the patterns in other countries. ‘The survey on recidivism show
many of the persons charged are caught for several offences over a longer period of time: Of
all persons charged with crimes in 2000…61 per cent were caught
for at least one offence during the next five years. The [greatest]
per cent, was among those with more serious types of theft and robbery as
offence in 2000. Statistics for the period 2000-2005 also show other similarities with
previous statistics on recidivism, e.g. [higher] recidivism for men (50 per cent) than for
women (32 per cent). As in previous years, the share of recidivism among men decreases
considerably with higher age, whilst the share of recidivism among women increases up to
39 years, where it is at its highest with 40 per cent’
. Analysis of the 2005 cohort shows the same trends for gender and age (Statistics
Norway, 2012: Table 21).
In addition to official data, there is a recent study exploring the relationship of emp
and other factors on recidivism in Norway (Skardhamar and Telle, 2012
The authors included in their cohort ‘all inmates released from prison sentences
custody [i.e. remand]) during 2003 [amounting to] 7,476 individuals
This is at the low end of the reconviction range for countries reviewed in this research, but note that only those
eventually sentenced to a sanction supervised by the correctional service (i.e. recidivism excludes those re
convicted and sentenced to a fine or suspended sentence) are included in this rate.
reconviction rates include anyone receiving a new conviction, regardless of the sentence they received for it.
29
The Nordic countries (Norway, Denmark, Sweden, Finland and Iceland) have agreed that
either a prison sentence or a
some dissimilarities between the five
Gerhard Jans Ploeg, 23 April 2012). The
primary prerequisite for recidivism is any legally binding sentence within two years, where
to be served in the correctional services. Fines and suspended
sentences are thus excluded. Secondly, the act of crime(s) must have happened after release
from prison or after the start of a community sanction. The latter includes community
sentence or service, conditional sentence with supervision, as well as any conditional
vised by the probation services
. The relevant report on
tenom_seriene/ ) is not
using this definition, for the 2005
2012).4
year reconviction rate in Norway is 20%.
The term ‘recidivism’ used in the following discussion refers to all people arrested and
charged (without regard to whether the charge was dropped, dealt with through a pre-court
sposal or committed for trial and ultimately resulting in conviction), and rates of arrest in
the five years thereafter. English language data discussing the 2000 cohort shows
The survey on recidivism shows that
many of the persons charged are caught for several offences over a longer period of time: Of
61 per cent were caught [arrested and initially
reatest] recidivism, [at] 80
per cent, was among those with more serious types of theft and robbery as [their] principle
2005 also show other similarities with
recidivism for men (50 per cent) than for
women (32 per cent). As in previous years, the share of recidivism among men decreases
considerably with higher age, whilst the share of recidivism among women increases up to
at its highest with 40 per cent’ (Statistics Norway,
. Analysis of the 2005 cohort shows the same trends for gender and age (Statistics
relationship of employment,
(Skardhamar and Telle, 2012, 2009).
all inmates released from prison sentences (excluding
7,476 individuals. If someone was
This is at the low end of the reconviction range for countries reviewed in this research, but note that only those
by the correctional service (i.e. recidivism excludes those re-
convicted and sentenced to a fine or suspended sentence) are included in this rate. In contrast, Scottish
ce they received for it.
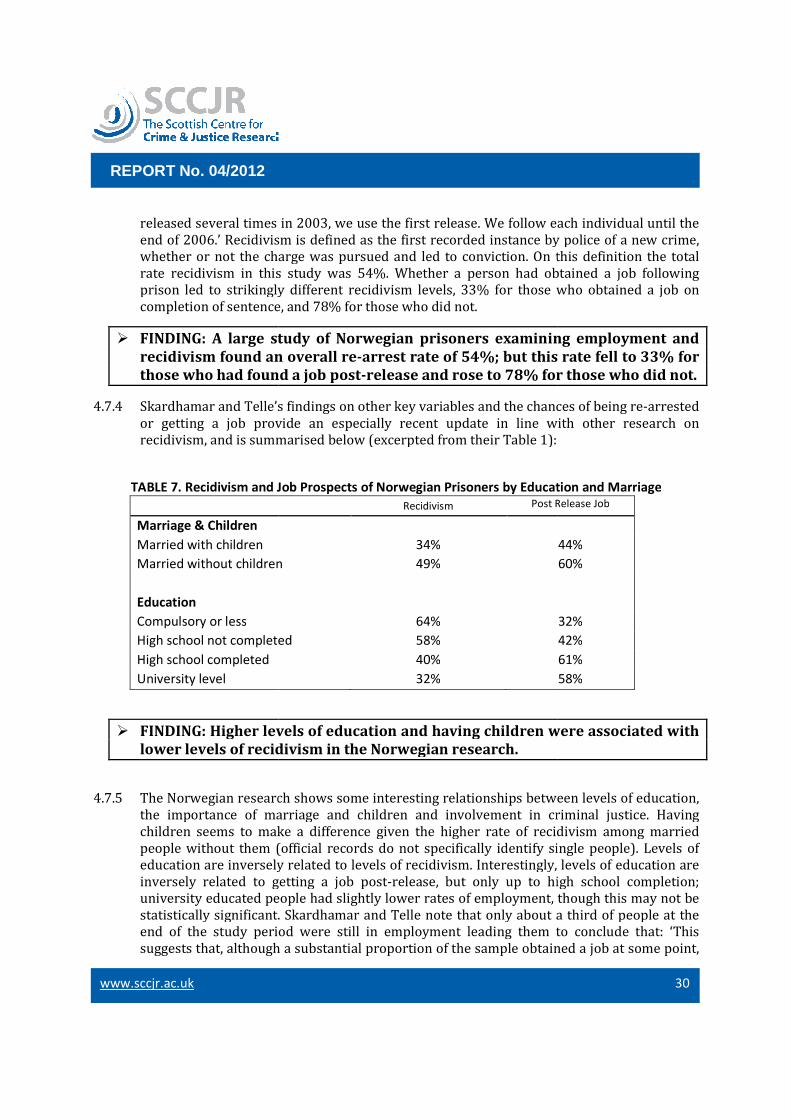
www.sccjr.ac.uk
REPORT No. 04/2012
released several times in 2003, we use the first release. We follow each individual until the
end of 2006.’ Recidivism
whether or not the charge was pursued and led to con
rate recidivism in this study was
prison led to strikingly different recidivism levels,
completion of sentence, and 78% for those
� FINDING: A large study of Norwegian prisoners examining employment and
recidivism found an overall re
those who had found a job post
4.7.4 Skardhamar and Telle’s findings on other key variables and the chances of being re
or getting a job provide an especially recent update in line with other research on
recidivism, and is summarised below (excerpted from their Table 1):
TABLE 7. Recidivism and Job Prospects of Norwegian Prisoners by Education and Marriage
Marriage & Children
Married with children
Married without children
Education
Compulsory or less
High school not completed
High school completed
University level
� FINDING: Higher levels of education and having children were associated with
lower levels of recidivism in the Norwegian research.
4.7.5 The Norwegian research shows some interesting relationships between levels of education,
the importance of marriage and children and involvement in criminal justice. Having
children seems to make a difference given the higher rate of recidivism among marri
people without them (official records do not specifically identify single people). Levels of
education are inversely related to levels of recidivism. Interestingly, levels of education are
inversely related to getting a job post
university educated people had slightly lower rates of employment, though this may not be
statistically significant. Skardhamar and Telle note that only about a third of people at the
end of the study period were still in employment
suggests that, although a substantial proportion of the sample obt
REPORT No. 04/2012
released several times in 2003, we use the first release. We follow each individual until the
end of 2006.’ Recidivism is defined as the first recorded instance by police
whether or not the charge was pursued and led to conviction. On this definition the total
in this study was 54%. Whether a person had obtained a job following
prison led to strikingly different recidivism levels, 33% for those who obtained a job on
completion of sentence, and 78% for those who did not.
FINDING: A large study of Norwegian prisoners examining employment and
recidivism found an overall re-arrest rate of 54%; but this rate fell to 33% for
those who had found a job post-release and rose to 78% for those who did not.
nd Telle’s findings on other key variables and the chances of being re
or getting a job provide an especially recent update in line with other research on
recidivism, and is summarised below (excerpted from their Table 1):
Job Prospects of Norwegian Prisoners by Education and Marriage
Recidivism Post Release Job
34%
Married without children 49%
64%
High school not completed 58%
40%
32%
FINDING: Higher levels of education and having children were associated with
lower levels of recidivism in the Norwegian research.
The Norwegian research shows some interesting relationships between levels of education,
the importance of marriage and children and involvement in criminal justice. Having
children seems to make a difference given the higher rate of recidivism among marri
people without them (official records do not specifically identify single people). Levels of
education are inversely related to levels of recidivism. Interestingly, levels of education are
inversely related to getting a job post-release, but only up to high school completion;
university educated people had slightly lower rates of employment, though this may not be
statistically significant. Skardhamar and Telle note that only about a third of people at the
end of the study period were still in employment leading them to conclude that: ‘This
that, although a substantial proportion of the sample obtained a job at some point,
30
released several times in 2003, we use the first release. We follow each individual until the
by police of a new crime,
On this definition the total
. Whether a person had obtained a job following
33% for those who obtained a job on
FINDING: A large study of Norwegian prisoners examining employment and
arrest rate of 54%; but this rate fell to 33% for
release and rose to 78% for those who did not.
nd Telle’s findings on other key variables and the chances of being re-arrested
or getting a job provide an especially recent update in line with other research on
Job Prospects of Norwegian Prisoners by Education and Marriage
Post Release Job
44%
60%
32%
42%
61%
58%
FINDING: Higher levels of education and having children were associated with
The Norwegian research shows some interesting relationships between levels of education,
the importance of marriage and children and involvement in criminal justice. Having
children seems to make a difference given the higher rate of recidivism among married
people without them (official records do not specifically identify single people). Levels of
education are inversely related to levels of recidivism. Interestingly, levels of education are
high school completion;
university educated people had slightly lower rates of employment, though this may not be
statistically significant. Skardhamar and Telle note that only about a third of people at the
leading them to conclude that: ‘This
ained a job at some point,
www.sccjr.ac.uk
REPORT No. 04/2012
many had trouble keeping one
reducing reoffending, though it is
matters so much as getting employment at all post
conscientious in noting that in using official records only formal employment and offending
(measured via arrest) is captu
employment (or marriage or children, for that matter) prevent reoffending (in the way that
a matched sample comparison might). One might also speculate that employment and
children affect justice system decision making as much as offender behaviour in that police,
prosecutors and courts may be inclined to select lower impact options if higher impact ones
(arrest over caution, diversion over prosecution, community service over prison) would
interfere with job and family responsibilities.
REPORT No. 04/2012
had trouble keeping one.’ This is a relevant issue for considering the aspirations of
reducing reoffending, though it is not clear that staying in employment or the same job
matters so much as getting employment at all post-release. The authors also are
conscientious in noting that in using official records only formal employment and offending
(measured via arrest) is captured, and that it cannot be determined from this research that
employment (or marriage or children, for that matter) prevent reoffending (in the way that
a matched sample comparison might). One might also speculate that employment and
e system decision making as much as offender behaviour in that police,
prosecutors and courts may be inclined to select lower impact options if higher impact ones
(arrest over caution, diversion over prosecution, community service over prison) would
ere with job and family responsibilities.
31
.’ This is a relevant issue for considering the aspirations of
not clear that staying in employment or the same job
release. The authors also are
conscientious in noting that in using official records only formal employment and offending
red, and that it cannot be determined from this research that
employment (or marriage or children, for that matter) prevent reoffending (in the way that
a matched sample comparison might). One might also speculate that employment and
e system decision making as much as offender behaviour in that police,
prosecutors and courts may be inclined to select lower impact options if higher impact ones
(arrest over caution, diversion over prosecution, community service over prison) would
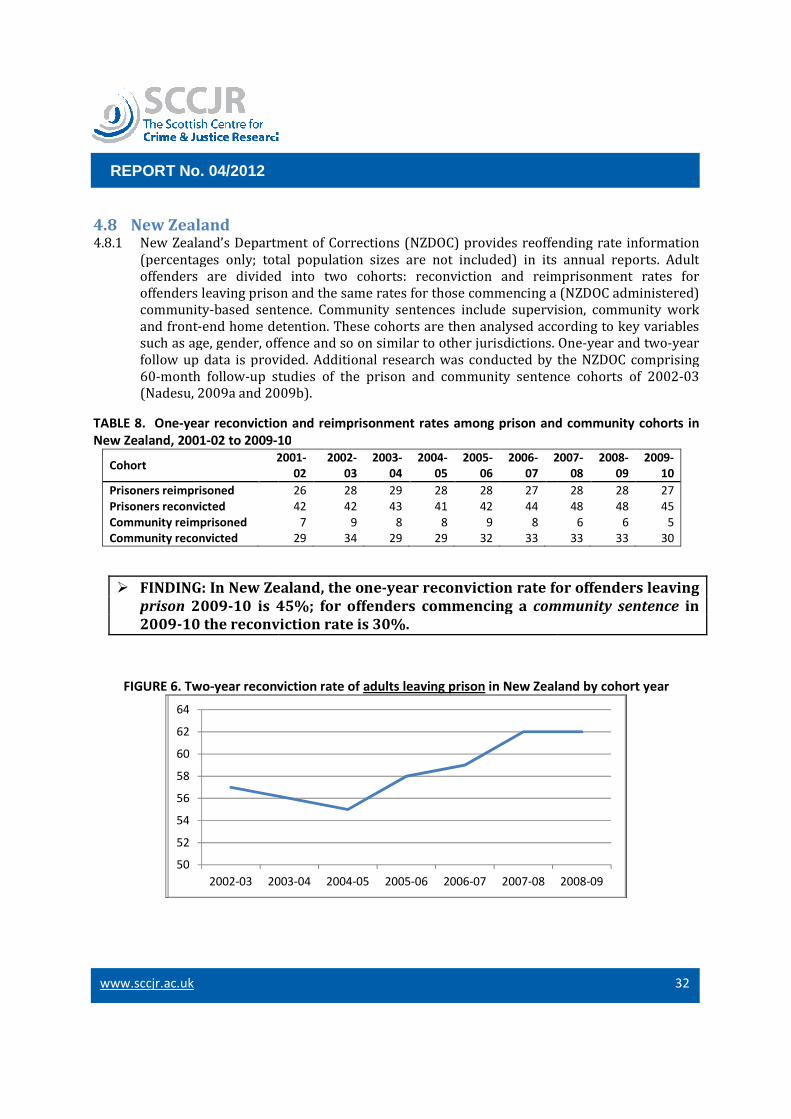
www.sccjr.ac.uk
REPORT No. 04/2012
4.8 New Zealand 4.8.1 New Zealand’s Department of Corrections (NZDOC) provides reoffending rate information
(percentages only; total population sizes are not included) in its annual reports. Adult
offenders are divided in
offenders leaving prison and the same rates for those commencing a (NZDOC administered)
community-based sentence. Community sentences include supervision, community work
and front-end home detention
such as age, gender, offence and so on similar to other jurisdictions. One
follow up data is provided. Additional research was conducted by the NZDOC comprising
60-month follow-up studies of the prison and community sentence cohorts of 2002
(Nadesu, 2009a and 2009b).
TABLE 8. One-year reconviction and reimprisonment rates among prison and community cohorts in
New Zealand, 2001-02 to 2009-10
Cohort 2001
Prisoners reimprisoned
Prisoners reconvicted
Community reimprisoned
Community reconvicted
� FINDING: In New Zealand, the one
prison 2009-10 is 45%; for offenders commencing a
2009-10 the reconviction rate is 30%.
FIGURE 6. Two-year reconviction rate of
50
52
54
56
58
60
62
64
2002-03 2003
REPORT No. 04/2012
New Zealand’s Department of Corrections (NZDOC) provides reoffending rate information
(percentages only; total population sizes are not included) in its annual reports. Adult
offenders are divided into two cohorts: reconviction and reimprisonment rates for
offenders leaving prison and the same rates for those commencing a (NZDOC administered)
based sentence. Community sentences include supervision, community work
end home detention. These cohorts are then analysed according to key variables
such as age, gender, offence and so on similar to other jurisdictions. One
follow up data is provided. Additional research was conducted by the NZDOC comprising
up studies of the prison and community sentence cohorts of 2002
(Nadesu, 2009a and 2009b).
year reconviction and reimprisonment rates among prison and community cohorts in
10
2001-
02
2002-
03
2003-
04
2004-
05
2005-
06
2006-
07
2007
26 28 29 28 28 27
42 42 43 41 42 44
7 9 8 8 9 8
29 34 29 29 32 33
FINDING: In New Zealand, the one-year reconviction rate for offenders leaving
10 is 45%; for offenders commencing a community sentence
10 the reconviction rate is 30%.
year reconviction rate of adults leaving prison in New Zealand by cohort year
2003-04 2004-05 2005-06 2006-07 2007-08
32
New Zealand’s Department of Corrections (NZDOC) provides reoffending rate information
(percentages only; total population sizes are not included) in its annual reports. Adult
to two cohorts: reconviction and reimprisonment rates for
offenders leaving prison and the same rates for those commencing a (NZDOC administered)
based sentence. Community sentences include supervision, community work
. These cohorts are then analysed according to key variables
such as age, gender, offence and so on similar to other jurisdictions. One-year and two-year
follow up data is provided. Additional research was conducted by the NZDOC comprising
up studies of the prison and community sentence cohorts of 2002-03
year reconviction and reimprisonment rates among prison and community cohorts in
2007-
08
2008-
09
2009-
10
28 28 27
48 48 45
6 6 5
33 33 30
year reconviction rate for offenders leaving
community sentence in
in New Zealand by cohort year
2008-09
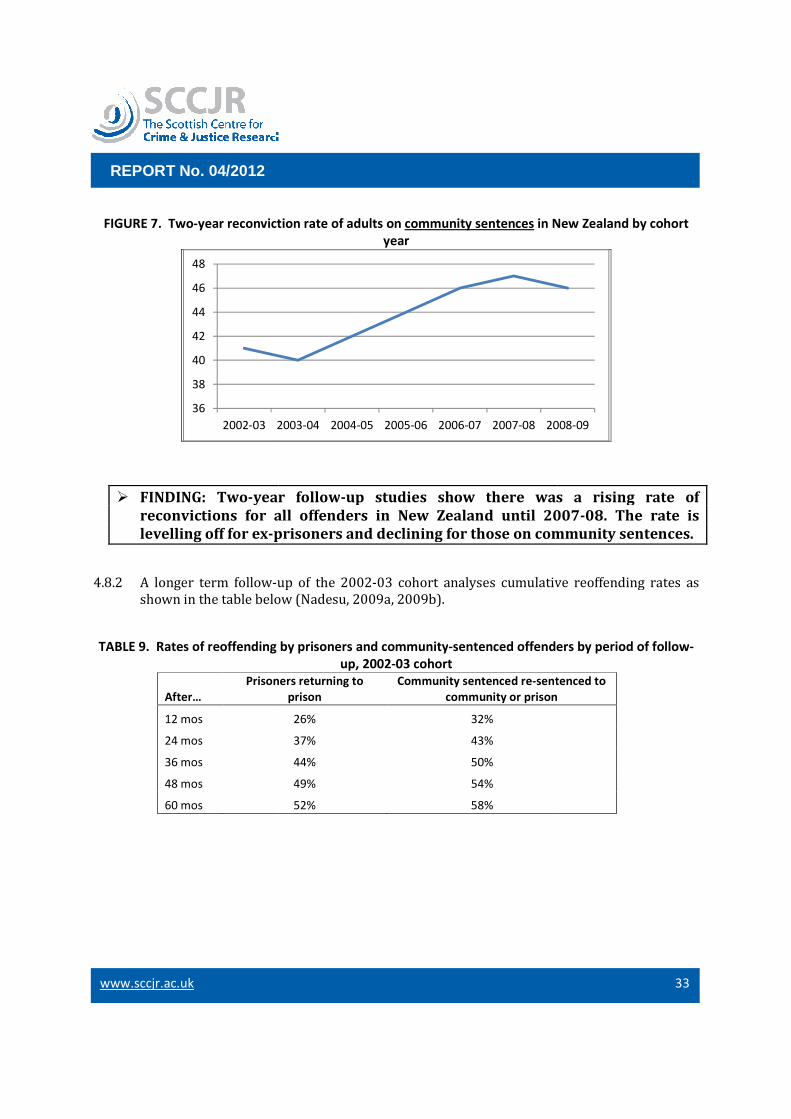
www.sccjr.ac.uk
REPORT No. 04/2012
FIGURE 7. Two-year reconviction rate of adults on
� FINDING: Two-year follow
reconvictions for all offenders in New Zealand u
levelling off for ex-prisoners and declining for those on community sentences.
4.8.2 A longer term follow-up of the 2002
shown in the table below (Nadesu, 2009a, 2009b).
TABLE 9. Rates of reoffending by prisoners and community
After…
Prisoners returning to
12 mos
24 mos
36 mos
48 mos
60 mos
36
38
40
42
44
46
48
2002-03 2003
REPORT No. 04/2012
year reconviction rate of adults on community sentences in New Zealand by cohort
year
year follow-up studies show there was a rising rate of
reconvictions for all offenders in New Zealand until 2007
prisoners and declining for those on community sentences.
up of the 2002-03 cohort analyses cumulative reoffending rates as
shown in the table below (Nadesu, 2009a, 2009b).
es of reoffending by prisoners and community-sentenced offenders by period of follow
up, 2002-03 cohort
Prisoners returning to
prison
Community sentenced re-sentenced to
community or prison
26% 32%
37% 43%
44% 50%
49% 54%
52% 58%
2003-04 2004-05 2005-06 2006-07 2007-08 2008
33
in New Zealand by cohort
up studies show there was a rising rate of
ntil 2007-08. The rate is
prisoners and declining for those on community sentences.
03 cohort analyses cumulative reoffending rates as
sentenced offenders by period of follow-
sentenced to
community or prison
2008-09
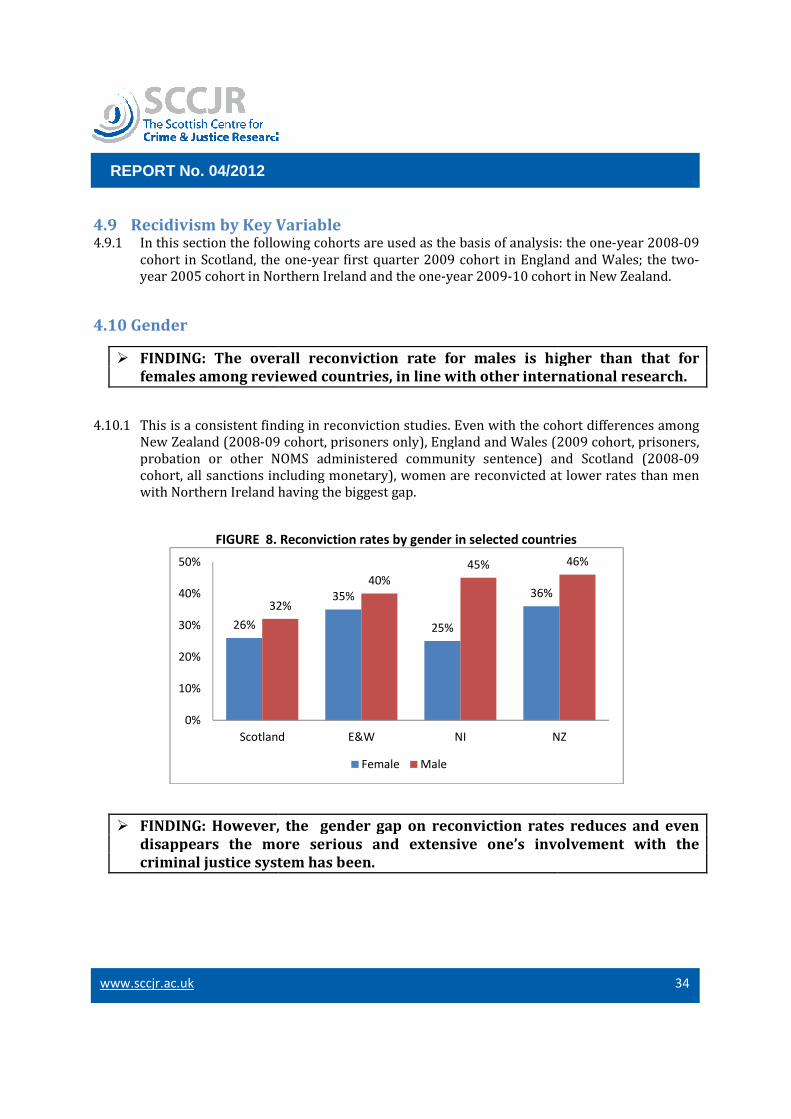
www.sccjr.ac.uk
REPORT No. 04/2012
4.9 Recidivism by Key Variable4.9.1 In this section the following cohorts are used as the basis of analysis: the one
cohort in Scotland, the one
year 2005 cohort in Northern Ireland and the one
4.10 Gender
� FINDING: The overall reconviction rate for males is higher than that for
females among reviewed countries, in line with other international research.
4.10.1 This is a consistent finding in reconviction studies. Even with the cohort differences among
New Zealand (2008-09 cohort, prisoners only), England and Wales (2009 cohort, prisoners,
probation or other NOMS administered community sentence) and Scotland (200
cohort, all sanctions including monetary), women are reconvicted at lower rates than men
with Northern Ireland having the biggest gap.
FIGURE 8. Reconviction rates by gender in selected countries
� FINDING: However, the gender gap on reconviction
disappears the more serious and extensive one’s involvement with the
criminal justice system has been.
26%
32%
0%
10%
20%
30%
40%
50%
Scotland
REPORT No. 04/2012
Recidivism by Key Variable In this section the following cohorts are used as the basis of analysis: the one
cohort in Scotland, the one-year first quarter 2009 cohort in England and Wales; the two
Northern Ireland and the one-year 2009-10 cohort in New Zealand.
FINDING: The overall reconviction rate for males is higher than that for
females among reviewed countries, in line with other international research.
This is a consistent finding in reconviction studies. Even with the cohort differences among
09 cohort, prisoners only), England and Wales (2009 cohort, prisoners,
probation or other NOMS administered community sentence) and Scotland (200
cohort, all sanctions including monetary), women are reconvicted at lower rates than men
with Northern Ireland having the biggest gap.
8. Reconviction rates by gender in selected countries
FINDING: However, the gender gap on reconviction rates reduces and even
disappears the more serious and extensive one’s involvement with the
criminal justice system has been.
35%
25%
36%32%
40%
45%
Scotland E&W NI NZ
Female Male
34
In this section the following cohorts are used as the basis of analysis: the one-year 2008-09
year first quarter 2009 cohort in England and Wales; the two-
10 cohort in New Zealand.
FINDING: The overall reconviction rate for males is higher than that for
females among reviewed countries, in line with other international research.
This is a consistent finding in reconviction studies. Even with the cohort differences among
09 cohort, prisoners only), England and Wales (2009 cohort, prisoners,
probation or other NOMS administered community sentence) and Scotland (2008-09
cohort, all sanctions including monetary), women are reconvicted at lower rates than men
8. Reconviction rates by gender in selected countries
rates reduces and even
disappears the more serious and extensive one’s involvement with the
46%
NZ
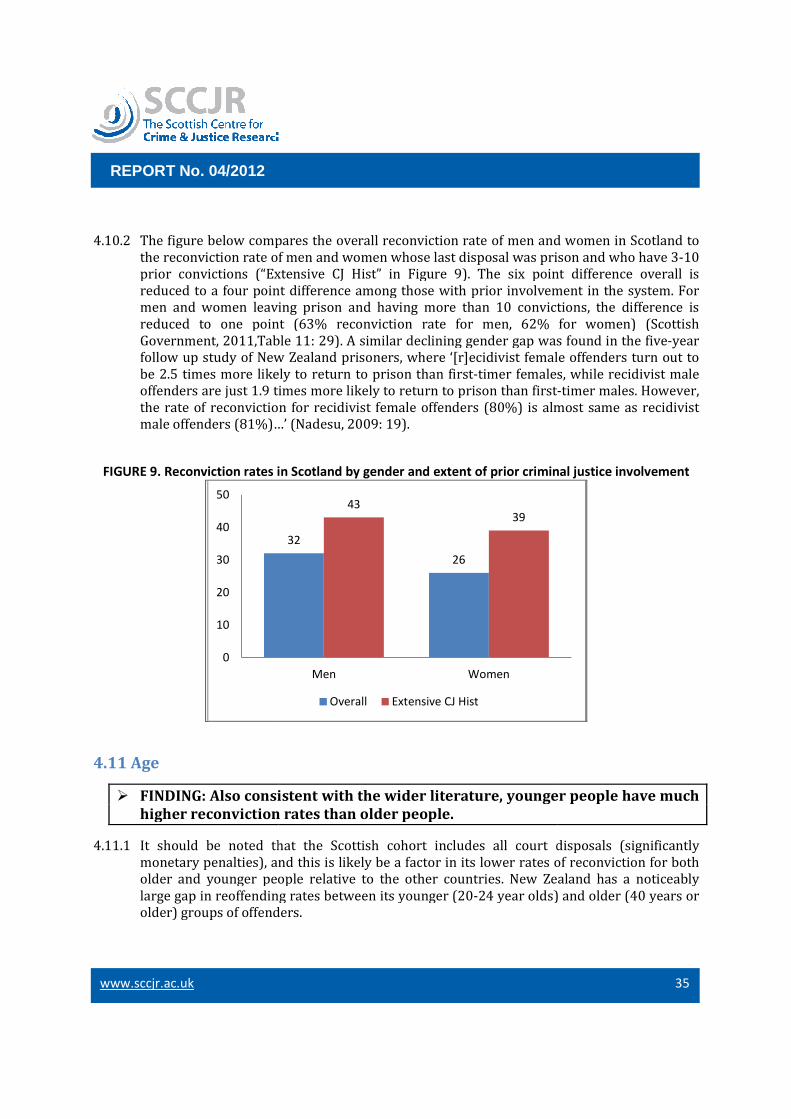
www.sccjr.ac.uk
REPORT No. 04/2012
4.10.2 The figure below compares the overall reconviction rate of men and women in Scotland to
the reconviction rate of men and women whose last disposal was prison and who have 3
prior convictions (“Extensive CJ Hist” in Figure 9). The six point difference ov
reduced to a four point difference among those with prior involvement in the system. For
men and women leaving prison and having more than 10 convictions, the difference is
reduced to one point (63% reconviction rate for men, 62% for women) (Scott
Government, 2011,Table 11: 29). A similar declining gender gap was found in the five
follow up study of New Zealand prisoners, where ‘[r]
be 2.5 times more likely to return to prison than
offenders are just 1.9 times more likely to return
the rate of reconviction for recidivist female
male offenders (81%)…’ (Nadesu, 2009: 19).
FIGURE 9. Reconviction rates in Scotland
4.11 Age
� FINDING: Also consistent with the wider literature, younger people have much
higher reconviction rates than older people.
4.11.1 It should be noted that the Sco
monetary penalties), and this is likely be a factor in its lower rates of reconviction for both
older and younger people relative to the other countries. New Zealand has a noticeably
large gap in reoffending rates between its younger (20
older) groups of offenders.
0
10
20
30
40
50
REPORT No. 04/2012
The figure below compares the overall reconviction rate of men and women in Scotland to
the reconviction rate of men and women whose last disposal was prison and who have 3
prior convictions (“Extensive CJ Hist” in Figure 9). The six point difference ov
reduced to a four point difference among those with prior involvement in the system. For
men and women leaving prison and having more than 10 convictions, the difference is
reduced to one point (63% reconviction rate for men, 62% for women) (Scott
Government, 2011,Table 11: 29). A similar declining gender gap was found in the five
follow up study of New Zealand prisoners, where ‘[r]ecidivist female offenders turn out to
be 2.5 times more likely to return to prison than first-timer females,
offenders are just 1.9 times more likely to return to prison than first-
the rate of reconviction for recidivist female offenders (80%) is almost same as r
male offenders (81%)…’ (Nadesu, 2009: 19).
in Scotland by gender and extent of prior criminal justice involvement
FINDING: Also consistent with the wider literature, younger people have much
higher reconviction rates than older people.
It should be noted that the Scottish cohort includes all court disposals (significantly
monetary penalties), and this is likely be a factor in its lower rates of reconviction for both
older and younger people relative to the other countries. New Zealand has a noticeably
ffending rates between its younger (20-24 year olds) and older (40 years or
older) groups of offenders.
32
26
4339
Men Women
Overall Extensive CJ Hist
35
The figure below compares the overall reconviction rate of men and women in Scotland to
the reconviction rate of men and women whose last disposal was prison and who have 3-10
prior convictions (“Extensive CJ Hist” in Figure 9). The six point difference overall is
reduced to a four point difference among those with prior involvement in the system. For
men and women leaving prison and having more than 10 convictions, the difference is
reduced to one point (63% reconviction rate for men, 62% for women) (Scottish
Government, 2011,Table 11: 29). A similar declining gender gap was found in the five-year
ecidivist female offenders turn out to
timer females, while recidivist male
-timer males. However,
offenders (80%) is almost same as recidivist
by gender and extent of prior criminal justice involvement
FINDING: Also consistent with the wider literature, younger people have much
ttish cohort includes all court disposals (significantly
monetary penalties), and this is likely be a factor in its lower rates of reconviction for both
older and younger people relative to the other countries. New Zealand has a noticeably
24 year olds) and older (40 years or
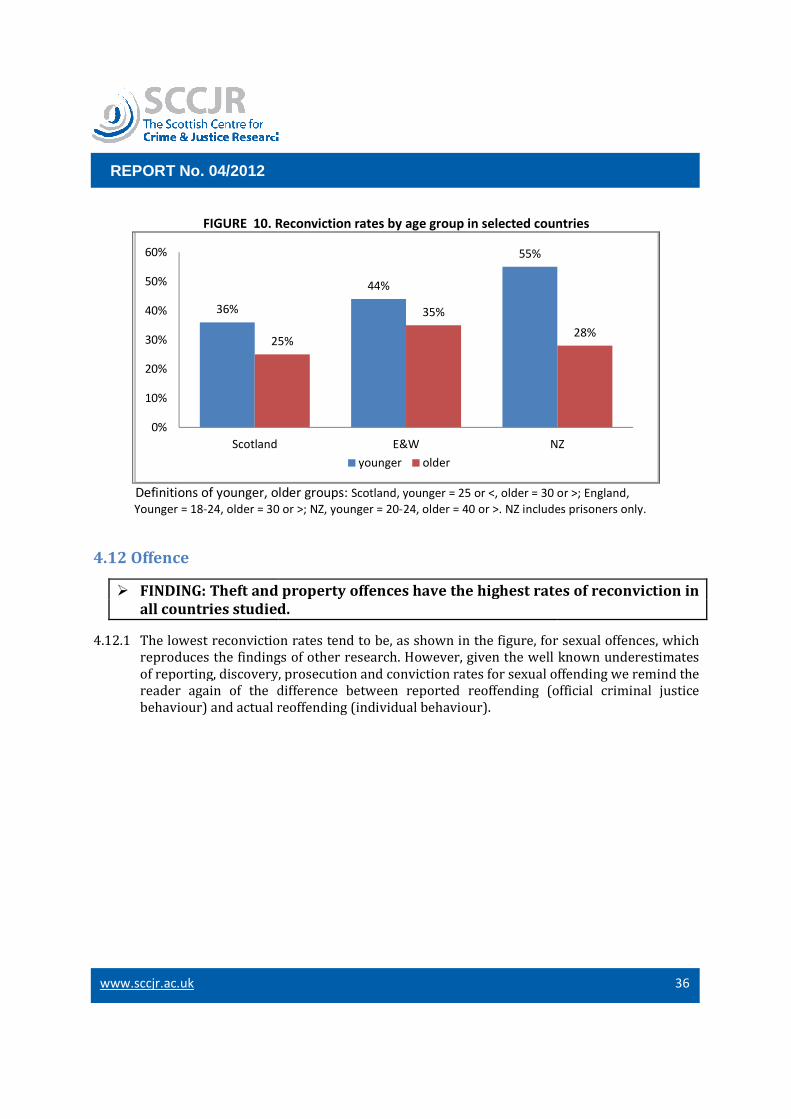
www.sccjr.ac.uk
REPORT No. 04/2012
FIGURE 10. Reconviction rates by age group in selected countries
Definitions of younger, older groups:
Younger = 18-24, older = 30 or >
4.12 Offence
� FINDING: Theft and property offences have the highest rates of reconviction in
all countries studied.
4.12.1 The lowest reconviction rates tend to be, as shown in the figure, for sexual offences, which
reproduces the findings of other research. However, given the well known underestimates
of reporting, discovery, prosecution and conviction rates for sexual offend
reader again of the difference between reported reoffending (official criminal justice
behaviour) and actual reoffending (individual behaviour).
36%
25%
0%
10%
20%
30%
40%
50%
60%
Scotland
REPORT No. 04/2012
FIGURE 10. Reconviction rates by age group in selected countries
Definitions of younger, older groups: Scotland, younger = 25 or <, older = 30 or >
24, older = 30 or >; NZ, younger = 20-24, older = 40 or >. NZ includes
FINDING: Theft and property offences have the highest rates of reconviction in
all countries studied.
The lowest reconviction rates tend to be, as shown in the figure, for sexual offences, which
reproduces the findings of other research. However, given the well known underestimates
of reporting, discovery, prosecution and conviction rates for sexual offend
reader again of the difference between reported reoffending (official criminal justice
behaviour) and actual reoffending (individual behaviour).
44%
55%
25%
35%
E&W NZ
younger older
36
FIGURE 10. Reconviction rates by age group in selected countries
er = 30 or >; England,
includes prisoners only.
FINDING: Theft and property offences have the highest rates of reconviction in
The lowest reconviction rates tend to be, as shown in the figure, for sexual offences, which
reproduces the findings of other research. However, given the well known underestimates
of reporting, discovery, prosecution and conviction rates for sexual offending we remind the
reader again of the difference between reported reoffending (official criminal justice
28%
NZ
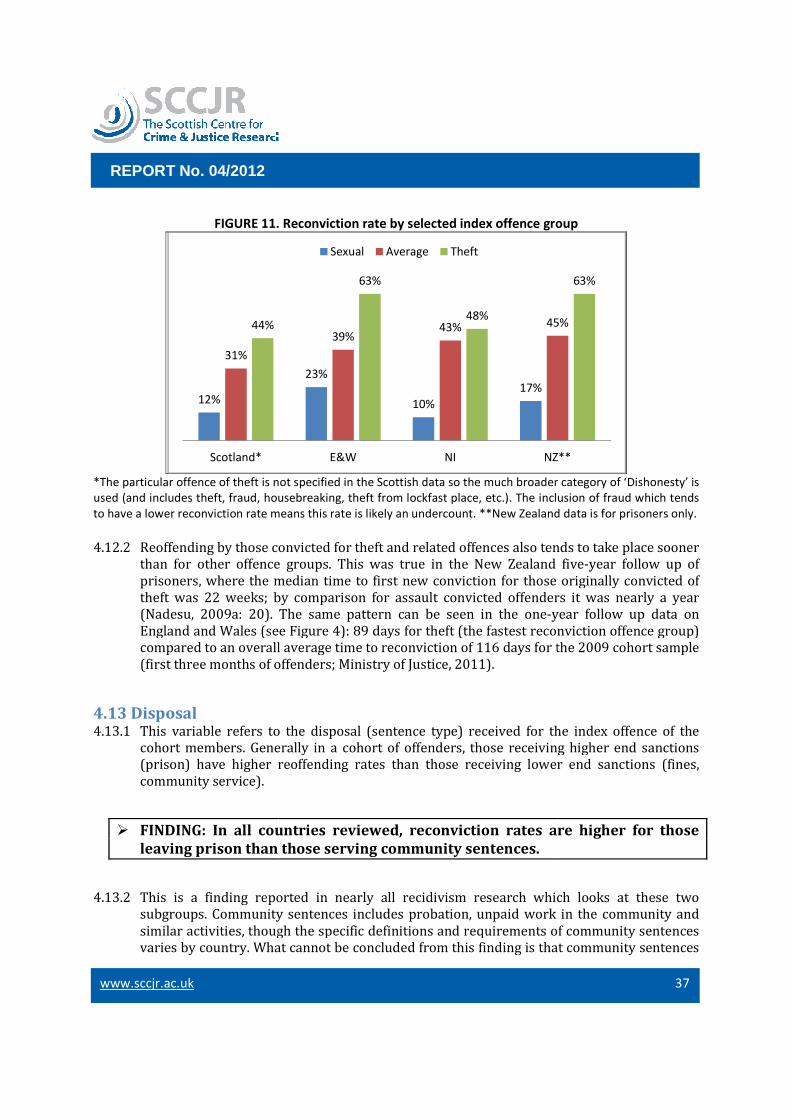
www.sccjr.ac.uk
REPORT No. 04/2012
FIGURE 11. Reconviction rate by selected index offence group
*The particular offence of theft is not specified in the Scottish data so the much broader category of ‘Dishonesty’ is
used (and includes theft, fraud, housebreaking, theft from lockfast place, etc.). The inclusion of fraud which tends
to have a lower reconviction rate means this r
4.12.2 Reoffending by those convicted for theft and related offences also tends to take place sooner
than for other offence groups. This was true in the New Zealand five
prisoners, where the median time to first new conviction for those originally convicted of
theft was 22 weeks; by comparison for assault convicted offenders it was nearly a year
(Nadesu, 2009a: 20). The same pattern can be seen in the one
England and Wales (see Figure 4): 89 days for theft (the fastest reconviction offence group)
compared to an overall average time to reconviction of 116 days for the 2009 cohort sample
(first three months of offenders; Ministry of Justice, 2011).
4.13 Disposal 4.13.1 This variable refers to the disposal (sentence type) received for the index offence of the
cohort members. Generally in a cohort of offenders, those receiving higher end sanctions
(prison) have higher reoffending rates than those receiving lower end san
community service).
� FINDING: In all countries reviewed, reconviction rates are higher for those
leaving prison than those serving community sentences.
4.13.2 This is a finding reported in nearly all recidivism research which looks at these two
subgroups. Community sentences includes probation, unpaid work in the community and
similar activities, though the specific definitions and requirements of community sentences
varies by country. What cannot be concluded from this finding is that community se
12%
31%
44%
Scotland*
REPORT No. 04/2012
11. Reconviction rate by selected index offence group
theft is not specified in the Scottish data so the much broader category of ‘Dishonesty’ is
used (and includes theft, fraud, housebreaking, theft from lockfast place, etc.). The inclusion of fraud which tends
to have a lower reconviction rate means this rate is likely an undercount. **New Zealand data is for prisoners only.
Reoffending by those convicted for theft and related offences also tends to take place sooner
than for other offence groups. This was true in the New Zealand five
soners, where the median time to first new conviction for those originally convicted of
theft was 22 weeks; by comparison for assault convicted offenders it was nearly a year
(Nadesu, 2009a: 20). The same pattern can be seen in the one-year follow up data
England and Wales (see Figure 4): 89 days for theft (the fastest reconviction offence group)
compared to an overall average time to reconviction of 116 days for the 2009 cohort sample
(first three months of offenders; Ministry of Justice, 2011).
This variable refers to the disposal (sentence type) received for the index offence of the
cohort members. Generally in a cohort of offenders, those receiving higher end sanctions
(prison) have higher reoffending rates than those receiving lower end san
FINDING: In all countries reviewed, reconviction rates are higher for those
leaving prison than those serving community sentences.
This is a finding reported in nearly all recidivism research which looks at these two
bgroups. Community sentences includes probation, unpaid work in the community and
similar activities, though the specific definitions and requirements of community sentences
varies by country. What cannot be concluded from this finding is that community se
23%
10%
17%
39%43% 45%
63%
48%
E&W NI NZ**
Sexual Average Theft
37
11. Reconviction rate by selected index offence group
theft is not specified in the Scottish data so the much broader category of ‘Dishonesty’ is
used (and includes theft, fraud, housebreaking, theft from lockfast place, etc.). The inclusion of fraud which tends
ate is likely an undercount. **New Zealand data is for prisoners only.
Reoffending by those convicted for theft and related offences also tends to take place sooner
than for other offence groups. This was true in the New Zealand five-year follow up of
soners, where the median time to first new conviction for those originally convicted of
theft was 22 weeks; by comparison for assault convicted offenders it was nearly a year
year follow up data on
England and Wales (see Figure 4): 89 days for theft (the fastest reconviction offence group)
compared to an overall average time to reconviction of 116 days for the 2009 cohort sample
This variable refers to the disposal (sentence type) received for the index offence of the
cohort members. Generally in a cohort of offenders, those receiving higher end sanctions
(prison) have higher reoffending rates than those receiving lower end sanctions (fines,
FINDING: In all countries reviewed, reconviction rates are higher for those
This is a finding reported in nearly all recidivism research which looks at these two
bgroups. Community sentences includes probation, unpaid work in the community and
similar activities, though the specific definitions and requirements of community sentences
varies by country. What cannot be concluded from this finding is that community sentences
45%
63%
NZ**
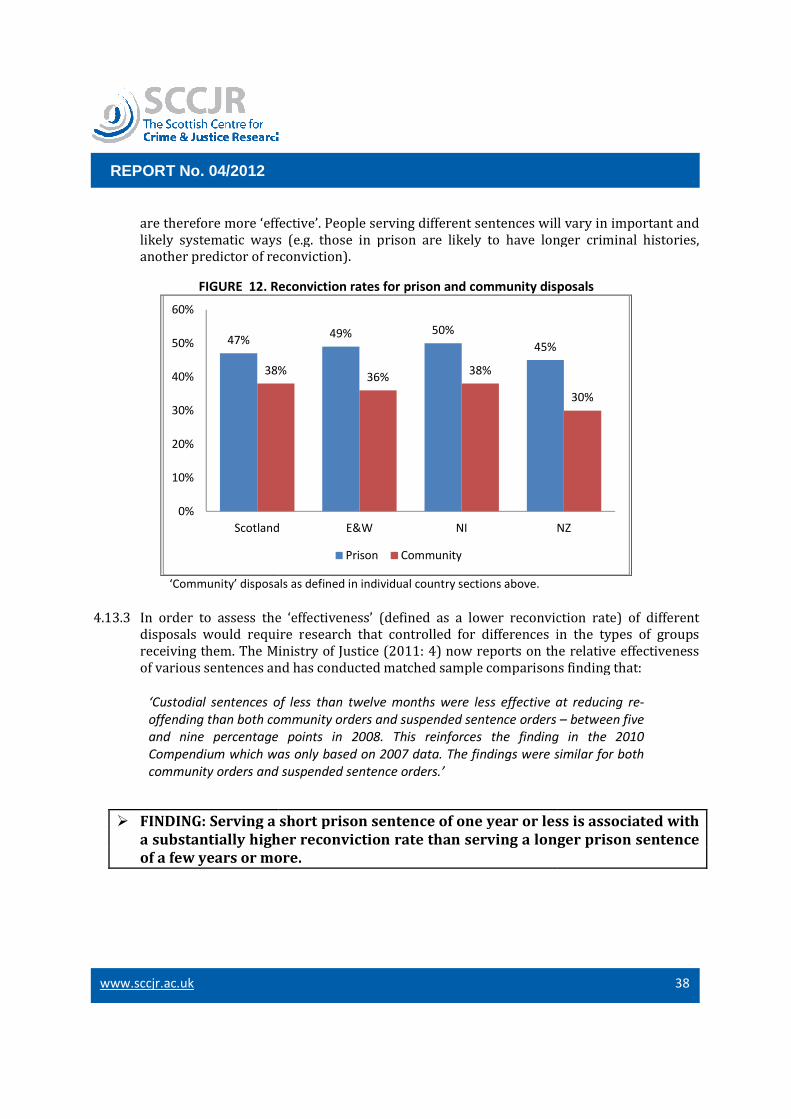
www.sccjr.ac.uk
REPORT No. 04/2012
are therefore more ‘effective’. People serving different sentences will vary in important and
likely systematic ways (e.g. those in prison are likely to have longer criminal histories,
another predictor of reconviction).
FIGURE 12. Reconviction r
‘Community’ disposal
4.13.3 In order to assess the ‘effectiveness’ (defined as a lower reconviction rate) of different
disposals would require r
receiving them. The Ministry of Justice (2011: 4) now reports on the relative effectiveness
of various sentences and has conducted matched sample comparisons finding that:
‘Custodial sentences of less than twelve months were less effective at reducing re
offending than both community orders and suspended sentence orders
and nine percentage points in 2008. This reinforces the finding in the 2010
Compendium which was only based on
community orders and su
� FINDING: Serving a short prison sentence of one year or less is associated with
a substantially higher reconviction rate than serving a longer prison sentence
of a few years or more.
47%
38%
0%
10%
20%
30%
40%
50%
60%
Scotland
REPORT No. 04/2012
are therefore more ‘effective’. People serving different sentences will vary in important and
likely systematic ways (e.g. those in prison are likely to have longer criminal histories,
another predictor of reconviction).
Reconviction rates for prison and community disposals
‘Community’ disposals as defined in individual country sections above.
In order to assess the ‘effectiveness’ (defined as a lower reconviction rate) of different
disposals would require research that controlled for differences in the types of groups
receiving them. The Ministry of Justice (2011: 4) now reports on the relative effectiveness
of various sentences and has conducted matched sample comparisons finding that:
of less than twelve months were less effective at reducing re
offending than both community orders and suspended sentence orders
and nine percentage points in 2008. This reinforces the finding in the 2010
Compendium which was only based on 2007 data. The findings were similar for both
community orders and suspended sentence orders.’
FINDING: Serving a short prison sentence of one year or less is associated with
a substantially higher reconviction rate than serving a longer prison sentence
of a few years or more.
49% 50%
45%
38%36%
38%
Scotland E&W NI NZ
Prison Community
38
are therefore more ‘effective’. People serving different sentences will vary in important and
likely systematic ways (e.g. those in prison are likely to have longer criminal histories,
disposals
In order to assess the ‘effectiveness’ (defined as a lower reconviction rate) of different
esearch that controlled for differences in the types of groups
receiving them. The Ministry of Justice (2011: 4) now reports on the relative effectiveness
of various sentences and has conducted matched sample comparisons finding that:
of less than twelve months were less effective at reducing re-
offending than both community orders and suspended sentence orders – between five
and nine percentage points in 2008. This reinforces the finding in the 2010
2007 data. The findings were similar for both
FINDING: Serving a short prison sentence of one year or less is associated with
a substantially higher reconviction rate than serving a longer prison sentence
30%
NZ
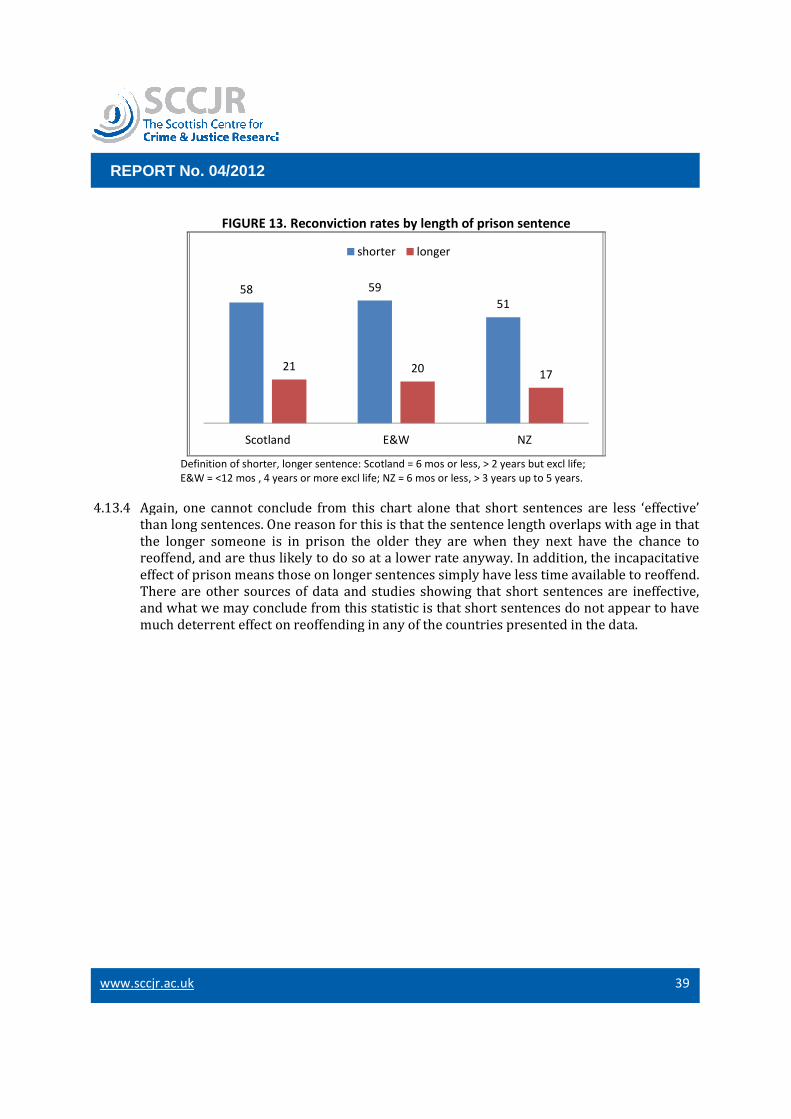
www.sccjr.ac.uk
REPORT No. 04/2012
FIGURE 13. Reconviction rates by length of prison sentence
Definition of shorter, longer sentence:
E&W = <12 mos , 4 years or more excl life
4.13.4 Again, one cannot conclude from this chart alone that short sentences are less ‘effective’
than long sentences. One reason for this is that the sentence length overlaps with ag
the longer someone is in prison the older they are when they next have the chance to
reoffend, and are thus likely to do so at a lower rate anyway. In addition, the incapacitative
effect of prison means those on longer sentences simply have less
There are other sources of data and studies showing that short sentences are ineffective,
and what we may conclude from this statistic is that short sentences do not appear to have
much deterrent effect on reoffending in any of
58
Scotland
REPORT No. 04/2012
FIGURE 13. Reconviction rates by length of prison sentence
Definition of shorter, longer sentence: Scotland = 6 mos or less, > 2 years but excl life
4 years or more excl life; NZ = 6 mos or less, > 3 years up to 5 years
Again, one cannot conclude from this chart alone that short sentences are less ‘effective’
than long sentences. One reason for this is that the sentence length overlaps with ag
the longer someone is in prison the older they are when they next have the chance to
reoffend, and are thus likely to do so at a lower rate anyway. In addition, the incapacitative
effect of prison means those on longer sentences simply have less time available to reoffend.
There are other sources of data and studies showing that short sentences are ineffective,
and what we may conclude from this statistic is that short sentences do not appear to have
much deterrent effect on reoffending in any of the countries presented in the data.
59
51
21 2017
Scotland E&W NZ
shorter longer
39
FIGURE 13. Reconviction rates by length of prison sentence
> 2 years but excl life;
> 3 years up to 5 years.
Again, one cannot conclude from this chart alone that short sentences are less ‘effective’
than long sentences. One reason for this is that the sentence length overlaps with age in that
the longer someone is in prison the older they are when they next have the chance to
reoffend, and are thus likely to do so at a lower rate anyway. In addition, the incapacitative
time available to reoffend.
There are other sources of data and studies showing that short sentences are ineffective,
and what we may conclude from this statistic is that short sentences do not appear to have
the countries presented in the data.

www.sccjr.ac.uk
REPORT No. 04/2012
4.14 Extent and Type of Criminal Justice History
� FINDING: Having any prior experience of
likelihood of reconviction, while
less important for reconviction rates in the UK.
4.14.1 In England having many multiple prior convictions is not associated with having a higher
than average reconviction rate, while having prior prison sentences is. Prior convictions
seem to have the most importance for reconviction in Scotland.
FIGURE 14. One-year reconviction rate by prior criminal convictions in Scotland, England and Wales
4.14.2 For both Scotland and England and Wales, however, having
raised the chances of reconviction above the average, and well above the average if one had
many prior prison sentences . For example, those who had been to prison once or twice had
a reconviction rate around 20 points higher than t
both Scotland and England and Wales.
15%
7%
0%
5%
10%
15%
20%
25%
30%
35%
40%
45%
No prior
REPORT No. 04/2012
Extent and Type of Criminal Justice History
any prior experience of prison greatly increases one’s
likelihood of reconviction, while having many prior convictions
less important for reconviction rates in the UK.
In England having many multiple prior convictions is not associated with having a higher
than average reconviction rate, while having prior prison sentences is. Prior convictions
the most importance for reconviction in Scotland.
year reconviction rate by prior criminal convictions in Scotland, England and Wales
For both Scotland and England and Wales, however, having any prior prison sentences
raised the chances of reconviction above the average, and well above the average if one had
many prior prison sentences . For example, those who had been to prison once or twice had
a reconviction rate around 20 points higher than those who had never been to prison in
both Scotland and England and Wales.
24%
31%
36%
7%
17%
39%
No prior 1-2 prior Average 3-10 prior
Scotland England
40
greatly increases one’s
convictions appears to be
In England having many multiple prior convictions is not associated with having a higher
than average reconviction rate, while having prior prison sentences is. Prior convictions
year reconviction rate by prior criminal convictions in Scotland, England and Wales
prior prison sentences
raised the chances of reconviction above the average, and well above the average if one had
many prior prison sentences . For example, those who had been to prison once or twice had
hose who had never been to prison in
31%
10 prior
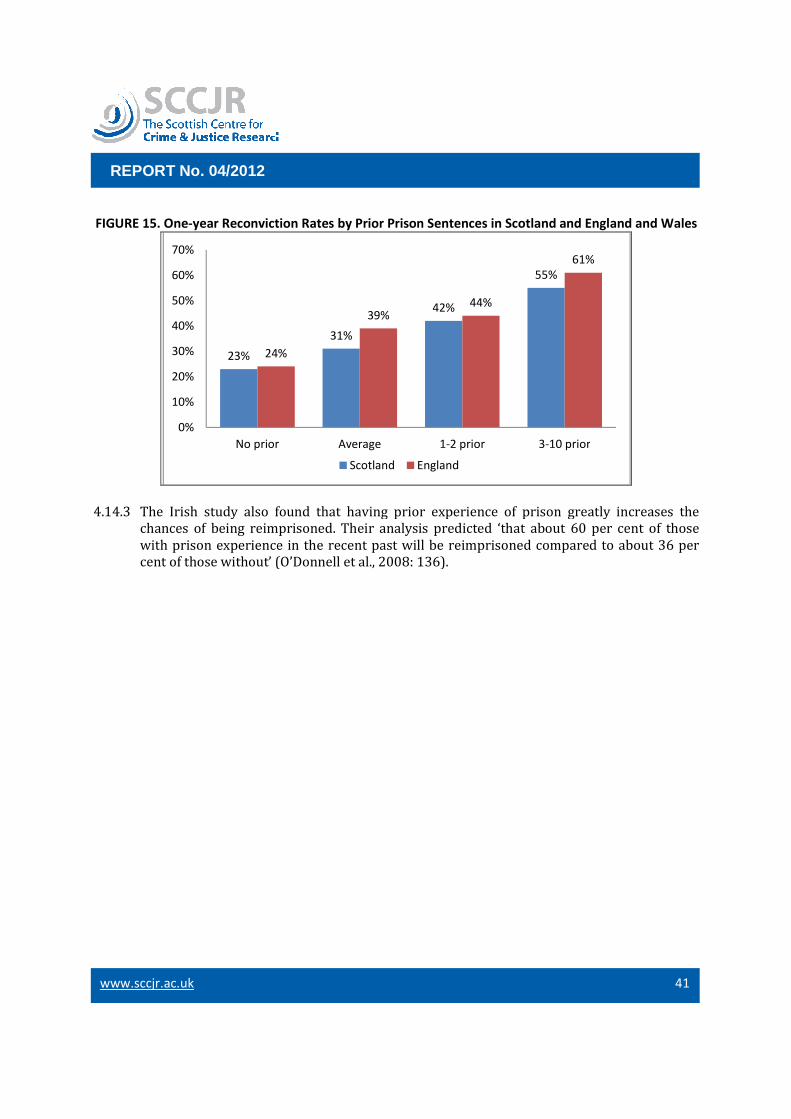
www.sccjr.ac.uk
REPORT No. 04/2012
FIGURE 15. One-year Reconviction Rates by Prior Prison Sentences in Scotland and England and Wales
4.14.3 The Irish study also found that having prior experience of prison greatly increases the
chances of being reimprisoned. Their analysis predicted
with prison experience
cent of those without’ (O’Donnell et al., 2008: 136).
23% 24%
0%
10%
20%
30%
40%
50%
60%
70%
No prior
REPORT No. 04/2012
year Reconviction Rates by Prior Prison Sentences in Scotland and England and Wales
The Irish study also found that having prior experience of prison greatly increases the
chances of being reimprisoned. Their analysis predicted ‘that about 60 per cent
with prison experience in the recent past will be reimprisoned compared to abou
’ (O’Donnell et al., 2008: 136).
31%
42%
55%
24%
39%44%
No prior Average 1-2 prior 3-10 prior
Scotland England
41
year Reconviction Rates by Prior Prison Sentences in Scotland and England and Wales
The Irish study also found that having prior experience of prison greatly increases the
that about 60 per cent of those
ompared to about 36 per
55%
61%
10 prior
www.sccjr.ac.uk
REPORT No. 04/2012
5 Reducing Reoffending 5.1.1 What can we learn about the behaviour of individuals from measures that track the
behaviour of systems? In this final chapter we address this methodological problem,
concluding that it is the concept of reoffending itself which requires reform. While there is a
large body of research on what works in offender treatment, it is impossible to trace one
particular intervention to any possible impact on a national reoffending
rate. In light of this we consider first, how the concept of reoffending fundamentally is a
negative one, focusing on failure. Such a concept is well suited to the data we have from the
criminal justice system itself, as the agencies c
rules and violations of laws. Second, we overview an emergent development in offender
management, which attempts to develop a positive version of reducing reoffending, which
focuses on the prerequisites of suppo
measuring his or her lapses from it. In the final section, we discuss the notion of
‘reintegration’. This concept is gaining in popularity as a way to frame and design services
around offender desistanc
5.2 Rethinking the Concept of ‘Reoffending’5.2.1 The statistics from the nations reviewed here show, in line with research on other
jurisdictions, that reoffending varies consistently by several variables which amount to
features of the individual offender: age,
and gender are not within the power of the criminal justice system to influence, and so
might appear to be an intractable dimension of reoffending in that young men will always
be a bigger driver of crimi
remembering that what is measured in reoffending rates is not the actual level of
misbehaviour by different people, but the actual level of criminal justice involvement in
their lives. Given this, age and gender differences must be understood as more than natural
and independent phenomena, but also as patterns of enforcement behaviour. Are young
men congregating on the street more likely to be stopped and arrested by police (and
prosecuted and punished) than a group of older people engaging in the same behaviour
behind closed doors? If they are, and research suggests this is the case, then a reducing
reoffending strategy might entail increasing opportunities and spaces for young people to
gather and engage in healthy and licit activities. Perhaps more than suggesting specific
strategies, the review of reoffending rates demonstrates how imperfect is our ability to
measure statistically the thing we are interested in
thus to develop an understanding of what might help change it. This has meant in policy
terms a focus first of all on individuals and as a result of this, a continued ‘tendency to target
the intervention on factors that pre
and social] factors that predict desistance
identify a range of issues that show the most promise in keeping people out of spiralling
criminal justice involvement.
1. Using the least severe intervention necessary.one’s involvement in the criminal justice system is, the higher the rate of reconviction. This
effect appears to outweigh gender differences in reoffending (an issue worthy of proper
REPORT No. 04/2012
Reducing Reoffending What can we learn about the behaviour of individuals from measures that track the
behaviour of systems? In this final chapter we address this methodological problem,
ncluding that it is the concept of reoffending itself which requires reform. While there is a
large body of research on what works in offender treatment, it is impossible to trace one
particular intervention to any possible impact on a national reoffending
rate. In light of this we consider first, how the concept of reoffending fundamentally is a
negative one, focusing on failure. Such a concept is well suited to the data we have from the
criminal justice system itself, as the agencies comprising this system respond to breaches of
rules and violations of laws. Second, we overview an emergent development in offender
management, which attempts to develop a positive version of reducing reoffending, which
focuses on the prerequisites of supporting an offender’s desistance journey rather than on
measuring his or her lapses from it. In the final section, we discuss the notion of
‘reintegration’. This concept is gaining in popularity as a way to frame and design services
around offender desistance.
Rethinking the Concept of ‘Reoffending’ The statistics from the nations reviewed here show, in line with research on other
jurisdictions, that reoffending varies consistently by several variables which amount to
features of the individual offender: age, gender, criminal and criminal justice history. Age
and gender are not within the power of the criminal justice system to influence, and so
might appear to be an intractable dimension of reoffending in that young men will always
be a bigger driver of criminal justice workloads than older women. However, it is worth
remembering that what is measured in reoffending rates is not the actual level of
misbehaviour by different people, but the actual level of criminal justice involvement in
, age and gender differences must be understood as more than natural
and independent phenomena, but also as patterns of enforcement behaviour. Are young
men congregating on the street more likely to be stopped and arrested by police (and
ished) than a group of older people engaging in the same behaviour
behind closed doors? If they are, and research suggests this is the case, then a reducing
reoffending strategy might entail increasing opportunities and spaces for young people to
d engage in healthy and licit activities. Perhaps more than suggesting specific
strategies, the review of reoffending rates demonstrates how imperfect is our ability to
measure statistically the thing we are interested in – actual behaviour by individuals
thus to develop an understanding of what might help change it. This has meant in policy
terms a focus first of all on individuals and as a result of this, a continued ‘tendency to target
the intervention on factors that predict [individual] criminal behaviour, not on [individual
factors that predict desistance’ (McNeill, 2012: 9). In the points that follow, we
identify a range of issues that show the most promise in keeping people out of spiralling
criminal justice involvement.
least severe intervention necessary. The more serious and long
one’s involvement in the criminal justice system is, the higher the rate of reconviction. This
effect appears to outweigh gender differences in reoffending (an issue worthy of proper
42
What can we learn about the behaviour of individuals from measures that track the
behaviour of systems? In this final chapter we address this methodological problem,
ncluding that it is the concept of reoffending itself which requires reform. While there is a
large body of research on what works in offender treatment, it is impossible to trace one
particular intervention to any possible impact on a national reoffending (i.e. reconviction)
rate. In light of this we consider first, how the concept of reoffending fundamentally is a
negative one, focusing on failure. Such a concept is well suited to the data we have from the
omprising this system respond to breaches of
rules and violations of laws. Second, we overview an emergent development in offender
management, which attempts to develop a positive version of reducing reoffending, which
rting an offender’s desistance journey rather than on
measuring his or her lapses from it. In the final section, we discuss the notion of
‘reintegration’. This concept is gaining in popularity as a way to frame and design services
The statistics from the nations reviewed here show, in line with research on other
jurisdictions, that reoffending varies consistently by several variables which amount to
gender, criminal and criminal justice history. Age
and gender are not within the power of the criminal justice system to influence, and so
might appear to be an intractable dimension of reoffending in that young men will always
nal justice workloads than older women. However, it is worth
remembering that what is measured in reoffending rates is not the actual level of
misbehaviour by different people, but the actual level of criminal justice involvement in
, age and gender differences must be understood as more than natural
and independent phenomena, but also as patterns of enforcement behaviour. Are young
men congregating on the street more likely to be stopped and arrested by police (and
ished) than a group of older people engaging in the same behaviour
behind closed doors? If they are, and research suggests this is the case, then a reducing
reoffending strategy might entail increasing opportunities and spaces for young people to
d engage in healthy and licit activities. Perhaps more than suggesting specific
strategies, the review of reoffending rates demonstrates how imperfect is our ability to
actual behaviour by individuals – and
thus to develop an understanding of what might help change it. This has meant in policy
terms a focus first of all on individuals and as a result of this, a continued ‘tendency to target
behaviour, not on [individual
’ (McNeill, 2012: 9). In the points that follow, we
identify a range of issues that show the most promise in keeping people out of spiralling
The more serious and long-lived
one’s involvement in the criminal justice system is, the higher the rate of reconviction. This
effect appears to outweigh gender differences in reoffending (an issue worthy of proper
www.sccjr.ac.uk
REPORT No. 04/2012
statistical analysis). Whether this is due to the fact that individuals with more involvement
are more committed to criminal behaviour, less embedded in positive social networks and
environments or more likely to be targeted for arrest, conviction and punishm
‘usual suspects’ thesis) is not clear from the data presented here. It may be a combination of
all three. Regardless of the causes, a commitment to avoid higher levels of enforcement and
punishment where possible helps avoid pulling individuals de
creates a self-fulfilling prophecy of further involvement in the system.
Although Scotland (and the other jurisdictions studied here, e.g. O’Donnell, 2002; Ploeg and
Sandlie, 2011) in principle uses the least restrictive means po
criminal justice, attention to making this principle explicit and operational at levels of policy
and practice are worth exploring. Many of those with the most entrenched criminal justice
histories in Scotland engage in offe
to the public – shoplifting and public order offences driven by drug and alcohol problems
(Scottish Prisons Commission, 2008). This low level of offending can rise to the level of
serious community deg
often courts deal with this sort of offending pattern through prison, justifying it as the only
possible option (Tombs and Jaeger, 2006). The new Community Payback Order (which
partly is a re-labelling of pre
ease of combining these and offering new mechanisms to maximise their supportive role,
e.g. progress reviews) aims at providing an option short of prison that has a better
breaking this cycle of offending and imprisonment, though it is too early to evaluate their
impact in this regard.
2. Focusing investment on factors known to improve a person’s prospects: employment,
family life and education.
circumstances of individual offenders consistently show that employment status,
educational level, and family status, are strong predictors of recidivism (e.g. Baumer, 1997;
O’Donnell et al., 2008; Skardhamar and Telle, 2012).
outside and before the criminal justice system, making clear that reoffending is an issue that
cannot be improved primarily through the actions of the justice system itself. Increasing
attention to this fact is beginnin
conceptual model for targeting the naturally occurring social support networks of an
offender group of particular salience in Scotland
drug problems (Pettus-
offender focus of most intervention and support and also provides a model for working with
those already caught up in the criminal justice system. Among the countries studied here,
research has also shown that when the criminal justice system reduces barriers to family
support, in this case through home visits from Irish prisons, markedly lower rates of
recidivism follow (Baumer et al., 2009).
3. Recognising and minimising the destructiv
on life chances. As with aggressive cancer treatments which aim to kill a tumour but in so
doing carry serious and sometimes life threatening side
REPORT No. 04/2012
tistical analysis). Whether this is due to the fact that individuals with more involvement
are more committed to criminal behaviour, less embedded in positive social networks and
environments or more likely to be targeted for arrest, conviction and punishm
‘usual suspects’ thesis) is not clear from the data presented here. It may be a combination of
all three. Regardless of the causes, a commitment to avoid higher levels of enforcement and
punishment where possible helps avoid pulling individuals deeper into a system which
fulfilling prophecy of further involvement in the system.
Although Scotland (and the other jurisdictions studied here, e.g. O’Donnell, 2002; Ploeg and
Sandlie, 2011) in principle uses the least restrictive means possible in the administration of
criminal justice, attention to making this principle explicit and operational at levels of policy
and practice are worth exploring. Many of those with the most entrenched criminal justice
histories in Scotland engage in offending which is more of a nuisance than a severe danger
shoplifting and public order offences driven by drug and alcohol problems
(Scottish Prisons Commission, 2008). This low level of offending can rise to the level of
serious community degradation when it occurs at high levels in particular areas, and so
often courts deal with this sort of offending pattern through prison, justifying it as the only
possible option (Tombs and Jaeger, 2006). The new Community Payback Order (which
labelling of pre-existing community sanctions but also creates possibilities for
ease of combining these and offering new mechanisms to maximise their supportive role,
e.g. progress reviews) aims at providing an option short of prison that has a better
breaking this cycle of offending and imprisonment, though it is too early to evaluate their
Focusing investment on factors known to improve a person’s prospects: employment,
family life and education. Studies which have considered the wider personal
circumstances of individual offenders consistently show that employment status,
educational level, and family status, are strong predictors of recidivism (e.g. Baumer, 1997;
O’Donnell et al., 2008; Skardhamar and Telle, 2012). These things are also best addressed
outside and before the criminal justice system, making clear that reoffending is an issue that
cannot be improved primarily through the actions of the justice system itself. Increasing
attention to this fact is beginning to emerge in research, with one recent effort developing a
conceptual model for targeting the naturally occurring social support networks of an
offender group of particular salience in Scotland – high rate offending ex
-Davis et al., 2011). This approach goes against the typical individual
offender focus of most intervention and support and also provides a model for working with
those already caught up in the criminal justice system. Among the countries studied here,
search has also shown that when the criminal justice system reduces barriers to family
support, in this case through home visits from Irish prisons, markedly lower rates of
recidivism follow (Baumer et al., 2009).
Recognising and minimising the destructive impact of criminal justice involvement
As with aggressive cancer treatments which aim to kill a tumour but in so
doing carry serious and sometimes life threatening side-effects of their own, criminal justice
43
tistical analysis). Whether this is due to the fact that individuals with more involvement
are more committed to criminal behaviour, less embedded in positive social networks and
environments or more likely to be targeted for arrest, conviction and punishment (the
‘usual suspects’ thesis) is not clear from the data presented here. It may be a combination of
all three. Regardless of the causes, a commitment to avoid higher levels of enforcement and
eper into a system which
fulfilling prophecy of further involvement in the system.
Although Scotland (and the other jurisdictions studied here, e.g. O’Donnell, 2002; Ploeg and
ssible in the administration of
criminal justice, attention to making this principle explicit and operational at levels of policy
and practice are worth exploring. Many of those with the most entrenched criminal justice
nding which is more of a nuisance than a severe danger
shoplifting and public order offences driven by drug and alcohol problems
(Scottish Prisons Commission, 2008). This low level of offending can rise to the level of
radation when it occurs at high levels in particular areas, and so
often courts deal with this sort of offending pattern through prison, justifying it as the only
possible option (Tombs and Jaeger, 2006). The new Community Payback Order (which
existing community sanctions but also creates possibilities for
ease of combining these and offering new mechanisms to maximise their supportive role,
e.g. progress reviews) aims at providing an option short of prison that has a better chance of
breaking this cycle of offending and imprisonment, though it is too early to evaluate their
Focusing investment on factors known to improve a person’s prospects: employment,
onsidered the wider personal
circumstances of individual offenders consistently show that employment status,
educational level, and family status, are strong predictors of recidivism (e.g. Baumer, 1997;
These things are also best addressed
outside and before the criminal justice system, making clear that reoffending is an issue that
cannot be improved primarily through the actions of the justice system itself. Increasing
g to emerge in research, with one recent effort developing a
conceptual model for targeting the naturally occurring social support networks of an
high rate offending ex-prisoners with
Davis et al., 2011). This approach goes against the typical individual
offender focus of most intervention and support and also provides a model for working with
those already caught up in the criminal justice system. Among the countries studied here,
search has also shown that when the criminal justice system reduces barriers to family
support, in this case through home visits from Irish prisons, markedly lower rates of
e impact of criminal justice involvement
As with aggressive cancer treatments which aim to kill a tumour but in so
effects of their own, criminal justice
www.sccjr.ac.uk
REPORT No. 04/2012
interventions can have simila
direction in prison research in particular, the so
on families and others in the age of mass imprisonment (e.g., Breen, 2010). Research in
Scotland also has shown that short prison sentences in particular exert a damaging
influence on the lives of offenders well beyond any given period of imprisonment
(Armstrong and Weaver, 2010).
One response to the negative effects of the criminal justice system has been to document
this effect at the level of communities and neighbourhoods, not just individuals: prisons and
probation tend to draw their caseloads from small numbers of post code ar
communities have disproportionate amounts of state investment but it is investment which
reflects and reproduces weakened social ties
level of expense but investing it in state resources which support
individuals can thrive has been the aim of the justice reinvestment movement (see Allen and
Stern, 2007; and the special issue coverage in
10, no. 3).
4. Reconceptualising rehabilitation to
rather than negative definitions of success.
fundamental ideas about the aetiology of offending and rehabilitation. The traditional focus
on individual offending
century old beliefs of crime as disease and interventions as cure; a negative orientation
breaches of norms and punishment of these rather than recognition of progress and
support of positive behaviour; and a segregation of people into offenders and non
offenders, us and them. This orientation tends overall to draw attention to the largely
negative options available through the justice system rather than thinking more holistically
about the transformative potential of criminal justice and other systems. Developing
interventions that engage people more broadly and positively and thus which can have a
more sustained impact on reducing reoffending requires more than review of particular
offender programmes but a reassessment of the very concept of rehabilitation. McNeill
(2012) has begun to articulate such a renewed concept that significantly widens the areas
where rehabilitation should be measured and re
supporting positive behaviour rather than measuring and sanctioning negative behaviour.
That is, McNeill’s (2012) approach builds on the preceding points of this section and
proposes rehabilitation as a four
following:
• psychological rehabilitation
individual-level change in the offender and securing an authentic commitment to
desistance (p. 14); and then,
• legal or judicial rehabilitation
stigma that it represents can ever be set aside, sealed, or surpassed; then,
REPORT No. 04/2012
interventions can have similar iatrogenic consequences. This has been a theme of the new
direction in prison research in particular, the so-called ‘secondary effects of imprisonment’
on families and others in the age of mass imprisonment (e.g., Breen, 2010). Research in
has shown that short prison sentences in particular exert a damaging
influence on the lives of offenders well beyond any given period of imprisonment
(Armstrong and Weaver, 2010).
One response to the negative effects of the criminal justice system has been to document
this effect at the level of communities and neighbourhoods, not just individuals: prisons and
probation tend to draw their caseloads from small numbers of post code ar
communities have disproportionate amounts of state investment but it is investment which
reflects and reproduces weakened social ties – police, court and prison. Taking this same
level of expense but investing it in state resources which support
individuals can thrive has been the aim of the justice reinvestment movement (see Allen and
Stern, 2007; and the special issue coverage in Criminology & Public Policy Journal
Reconceptualising rehabilitation to broaden its levels of action and develop positive
rather than negative definitions of success. Choices about specific interventions reflect
fundamental ideas about the aetiology of offending and rehabilitation. The traditional focus
on individual offending behaviour as the target of intervention reflects: continuity with
century old beliefs of crime as disease and interventions as cure; a negative orientation
breaches of norms and punishment of these rather than recognition of progress and
ositive behaviour; and a segregation of people into offenders and non
offenders, us and them. This orientation tends overall to draw attention to the largely
negative options available through the justice system rather than thinking more holistically
the transformative potential of criminal justice and other systems. Developing
interventions that engage people more broadly and positively and thus which can have a
more sustained impact on reducing reoffending requires more than review of particular
ender programmes but a reassessment of the very concept of rehabilitation. McNeill
(2012) has begun to articulate such a renewed concept that significantly widens the areas
where rehabilitation should be measured and re-focuses the concept on enabling and
supporting positive behaviour rather than measuring and sanctioning negative behaviour.
That is, McNeill’s (2012) approach builds on the preceding points of this section and
proposes rehabilitation as a four-level process involving successive attainment of
psychological rehabilitation – which is principally concerned with promoting positive
level change in the offender and securing an authentic commitment to
desistance (p. 14); and then,
legal or judicial rehabilitation – when, how and to what extent a criminal record and the
stigma that it represents can ever be set aside, sealed, or surpassed; then,
44
r iatrogenic consequences. This has been a theme of the new
called ‘secondary effects of imprisonment’
on families and others in the age of mass imprisonment (e.g., Breen, 2010). Research in
has shown that short prison sentences in particular exert a damaging
influence on the lives of offenders well beyond any given period of imprisonment
One response to the negative effects of the criminal justice system has been to document
this effect at the level of communities and neighbourhoods, not just individuals: prisons and
probation tend to draw their caseloads from small numbers of post code areas. Such
communities have disproportionate amounts of state investment but it is investment which
police, court and prison. Taking this same
level of expense but investing it in state resources which support communities where
individuals can thrive has been the aim of the justice reinvestment movement (see Allen and
Criminology & Public Policy Journal, 2011, vol
broaden its levels of action and develop positive
Choices about specific interventions reflect
fundamental ideas about the aetiology of offending and rehabilitation. The traditional focus
behaviour as the target of intervention reflects: continuity with
century old beliefs of crime as disease and interventions as cure; a negative orientation – on
breaches of norms and punishment of these rather than recognition of progress and
ositive behaviour; and a segregation of people into offenders and non-
offenders, us and them. This orientation tends overall to draw attention to the largely
negative options available through the justice system rather than thinking more holistically
the transformative potential of criminal justice and other systems. Developing
interventions that engage people more broadly and positively and thus which can have a
more sustained impact on reducing reoffending requires more than review of particular
ender programmes but a reassessment of the very concept of rehabilitation. McNeill
(2012) has begun to articulate such a renewed concept that significantly widens the areas
focuses the concept on enabling and
supporting positive behaviour rather than measuring and sanctioning negative behaviour.
That is, McNeill’s (2012) approach builds on the preceding points of this section and
level process involving successive attainment of the
which is principally concerned with promoting positive
level change in the offender and securing an authentic commitment to
and to what extent a criminal record and the
stigma that it represents can ever be set aside, sealed, or surpassed; then,

www.sccjr.ac.uk
REPORT No. 04/2012
• moral rehabilitation
up to a restored social position as a citiz
• social rehabilitation
entails both the restoration of the citizen’s formal social status and the availability of the
personal and social means t
more subjective; specifically, the informal social recognition and acceptance of the
reformed ex-offender’ (p. 15).
5.2.2 McNeill’s argument suggests we cannot make choices about this or that interventio
basis of reoffending rates alone. To do so would be to focus on the negative that in fact tells
us very little about the long
contain no information about positive change
progress where the offending is at a less severe or frequent rate (issues which the statistics
in Scotland and England and Wales attempt to capture). This is in fact the case for the
intervention with the highest associated level of
reoffending among those on this disposal currently stands above 60%, the statistics show
reduced frequency of offending, suggesting a positive outcome for one of the most difficult
offender groups to engage. Beyond t
increasingly certain knowledge that rehabilitation is not solely a process which happens
inside the head or soul of an offender, but within the body of the system and polity. We
know that societies w
(Downes and Hansen, 2006; Lacey, 2008; Cavadino and Dignan, 2006), and this broader
conceptualisation of rehabilitation suggests how this connection might work. It is not
simply investment but al
and are welcomed back into the fold. Certainly, understanding the ‘effectiveness’ of any
given country’s criminal justice system can no longer be understood as a simple function of
its cost against its reoffending rates.
5.3 Reintegration vs. Reoffending5.3.1 Reoffending is of limited assistance in developing and evaluating a more holistic and
socially situated version of rehabilitation. Instead, researchers are focusing attention on
reintegration (see, e.g., Déscarpes and Durnescu, 2012). Reintegration can encompass
individual, community and social levels of progress towards desistance. We know that
family relationships, particularly having children, are a strong predictor of reconviction. A
focus on reintegration would be able to measure progress at each of these levels, for
example, when:
• The individual offender is working to maintain relationships with partner and children;
• There is good availability of family support (child care, counselling
sensitive school staff
• There is wider social
support for job training and education and other mechanisms of regaining full citizenship).
REPORT No. 04/2012
moral rehabilitation – in simple terms, an offender has to pay back before s/he can trade
up to a restored social position as a citizen of good character (p. 15); and finally,
social rehabilitation – in ‘European jurisprudence, the concept of ‘social rehabilitation’
entails both the restoration of the citizen’s formal social status and the availability of the
personal and social means to do so…But here [refers to something that is] deeper and
more subjective; specifically, the informal social recognition and acceptance of the
offender’ (p. 15).
McNeill’s argument suggests we cannot make choices about this or that interventio
basis of reoffending rates alone. To do so would be to focus on the negative that in fact tells
us very little about the long-term prospects of change in an individual. Reoffending rates
contain no information about positive change – new offending
progress where the offending is at a less severe or frequent rate (issues which the statistics
in Scotland and England and Wales attempt to capture). This is in fact the case for the
intervention with the highest associated level of reoffending in Scotland
reoffending among those on this disposal currently stands above 60%, the statistics show
reduced frequency of offending, suggesting a positive outcome for one of the most difficult
offender groups to engage. Beyond this, however, McNeill’s four-level process builds on the
increasingly certain knowledge that rehabilitation is not solely a process which happens
inside the head or soul of an offender, but within the body of the system and polity. We
know that societies where social investment is high have lower imprisonment rates
(Downes and Hansen, 2006; Lacey, 2008; Cavadino and Dignan, 2006), and this broader
conceptualisation of rehabilitation suggests how this connection might work. It is not
simply investment but also an environment in which those who have transgressed laws can
and are welcomed back into the fold. Certainly, understanding the ‘effectiveness’ of any
given country’s criminal justice system can no longer be understood as a simple function of
ainst its reoffending rates.
Reintegration vs. Reoffending Reoffending is of limited assistance in developing and evaluating a more holistic and
socially situated version of rehabilitation. Instead, researchers are focusing attention on
, e.g., Déscarpes and Durnescu, 2012). Reintegration can encompass
individual, community and social levels of progress towards desistance. We know that
family relationships, particularly having children, are a strong predictor of reconviction. A
reintegration would be able to measure progress at each of these levels, for
offender is working to maintain relationships with partner and children;
There is good availability of family support (child care, counselling
sensitive school staff) in a person’s home community; and,
social support for settling back into communities (funding and structural
support for job training and education and other mechanisms of regaining full citizenship).
45
in simple terms, an offender has to pay back before s/he can trade
en of good character (p. 15); and finally,
in ‘European jurisprudence, the concept of ‘social rehabilitation’
entails both the restoration of the citizen’s formal social status and the availability of the
o do so…But here [refers to something that is] deeper and
more subjective; specifically, the informal social recognition and acceptance of the
McNeill’s argument suggests we cannot make choices about this or that intervention on the
basis of reoffending rates alone. To do so would be to focus on the negative that in fact tells
term prospects of change in an individual. Reoffending rates
might still constitute
progress where the offending is at a less severe or frequent rate (issues which the statistics
in Scotland and England and Wales attempt to capture). This is in fact the case for the
reoffending in Scotland – DTTOs. While
reoffending among those on this disposal currently stands above 60%, the statistics show
reduced frequency of offending, suggesting a positive outcome for one of the most difficult
level process builds on the
increasingly certain knowledge that rehabilitation is not solely a process which happens
inside the head or soul of an offender, but within the body of the system and polity. We
here social investment is high have lower imprisonment rates
(Downes and Hansen, 2006; Lacey, 2008; Cavadino and Dignan, 2006), and this broader
conceptualisation of rehabilitation suggests how this connection might work. It is not
so an environment in which those who have transgressed laws can
and are welcomed back into the fold. Certainly, understanding the ‘effectiveness’ of any
given country’s criminal justice system can no longer be understood as a simple function of
Reoffending is of limited assistance in developing and evaluating a more holistic and
socially situated version of rehabilitation. Instead, researchers are focusing attention on
, e.g., Déscarpes and Durnescu, 2012). Reintegration can encompass
individual, community and social levels of progress towards desistance. We know that
family relationships, particularly having children, are a strong predictor of reconviction. A
reintegration would be able to measure progress at each of these levels, for
offender is working to maintain relationships with partner and children;
There is good availability of family support (child care, counselling and health services,
for settling back into communities (funding and structural
support for job training and education and other mechanisms of regaining full citizenship).
www.sccjr.ac.uk
REPORT No. 04/2012
5.3.2 Against this, we also know that having had experience of prison, even once, significantly
raises the chance of re
work to ensure the criminal justice system recognised its own iatrogenic eff
power to make worse the thing it is seeking to make better. A decision to choose a prison
over another kind of sentence, which is so readily done at present in Scotland, would
require, if the system were guided by reintegration rather th
whether such a sentence would fulfill, have no effect on or undermine the state’s own
responsibility to support re
5.3.3 Other countries put a concept of reintegration into practice through:
• Second Chance Act (
greatest use of imprisonment.
on financial support of services which ease a prisoner’s re
‘federal grants to government agencies and nonprofit organizations to provide
employment assistance, substance abuse treatment, housing, family programming,
mentoring, victims support, and other services that can help reduce recidivism’
(http://reentrypolicy.org/government_affairs/second_chance_act
• The reintegration guarantee (Norway)
offenders before and after serving their sentence are characterised by many and serious
problem[s]’ as of 2005 ‘everyone who had served a community sentence or been
imprisoned should be guaranteed services providing
education, employment, health services, addiction treatment, proper housing, debt
counselling and identity papers’ (Ploeg and Sandlie, 2011: 391). It is noted these are not
just rights of offenders but rights that all citizens
guarantee was reaffirmed by the Government in 2009.
• Principle of normality and importance of local services (Norway)
community is a central aspect of rehabilitation (Ploeg and Sandlie, 2011: 390).
Education and medical/health services are provided locally.
• Research Focusing on
supporting the social support systems of offenders, particularly with substance use
disorders, recognises the value of social support in achieving stability (and desistance)
and the negative effects of individually focused interv
Pettus et al, 2012). Examples of reviewed models include Circles of Support and
Accountability, La Bodega
imprisoned drug users)
supportive person they identify
• Routes out of Prison (ROOP) (Scotland)
to provide a tailored understanding of the needs of individual prisoners and support
from a person with an em
Déscarpes and Durnescu, 2012).
REPORT No. 04/2012
Against this, we also know that having had experience of prison, even once, significantly
raises the chance of re-imprisonment. A guiding value of reintegration might additionally
work to ensure the criminal justice system recognised its own iatrogenic eff
power to make worse the thing it is seeking to make better. A decision to choose a prison
over another kind of sentence, which is so readily done at present in Scotland, would
require, if the system were guided by reintegration rather than reoffending, assessing
whether such a sentence would fulfill, have no effect on or undermine the state’s own
responsibility to support re-settlement of offenders.
Other countries put a concept of reintegration into practice through:
Second Chance Act (US): This Act marks a major shift in policy by
greatest use of imprisonment. It is also known as the Prisoner Re
on financial support of services which ease a prisoner’s re-
‘federal grants to government agencies and nonprofit organizations to provide
employment assistance, substance abuse treatment, housing, family programming,
ng, victims support, and other services that can help reduce recidivism’
http://reentrypolicy.org/government_affairs/second_chance_act
The reintegration guarantee (Norway): Recognising that ‘the life circumstances of
offenders before and after serving their sentence are characterised by many and serious
problem[s]’ as of 2005 ‘everyone who had served a community sentence or been
imprisoned should be guaranteed services providing them with a form of income,
education, employment, health services, addiction treatment, proper housing, debt
counselling and identity papers’ (Ploeg and Sandlie, 2011: 391). It is noted these are not
just rights of offenders but rights that all citizens have’ (Id.). The reintegration
guarantee was reaffirmed by the Government in 2009.
Principle of normality and importance of local services (Norway): proximity to the local
community is a central aspect of rehabilitation (Ploeg and Sandlie, 2011: 390).
ation and medical/health services are provided locally.
Research Focusing on Naturally Occurring Social Networks (US): A variety of examples of
supporting the social support systems of offenders, particularly with substance use
disorders, recognises the value of social support in achieving stability (and desistance)
and the negative effects of individually focused interventions and sanctions (Davis
Pettus et al, 2012). Examples of reviewed models include Circles of Support and
Accountability, La Bodega (a service providing support exclusively to family members of
imprisoned drug users) and Support Matters a pilot project involving prisoners and a
supportive person they identify.
Routes out of Prison (ROOP) (Scotland): Peer support of prisoners through life coaching
to provide a tailored understanding of the needs of individual prisoners and support
from a person with an empathic understanding of the prison experience (as cited in
Déscarpes and Durnescu, 2012).
46
Against this, we also know that having had experience of prison, even once, significantly
imprisonment. A guiding value of reintegration might additionally
work to ensure the criminal justice system recognised its own iatrogenic effect – that is, its
power to make worse the thing it is seeking to make better. A decision to choose a prison
over another kind of sentence, which is so readily done at present in Scotland, would
an reoffending, assessing
whether such a sentence would fulfill, have no effect on or undermine the state’s own
major shift in policy by the country with the
Prisoner Re-Entry Act and focuses
-settlement authorising
‘federal grants to government agencies and nonprofit organizations to provide
employment assistance, substance abuse treatment, housing, family programming,
ng, victims support, and other services that can help reduce recidivism’
http://reentrypolicy.org/government_affairs/second_chance_act)
ognising that ‘the life circumstances of
offenders before and after serving their sentence are characterised by many and serious
problem[s]’ as of 2005 ‘everyone who had served a community sentence or been
them with a form of income,
education, employment, health services, addiction treatment, proper housing, debt
counselling and identity papers’ (Ploeg and Sandlie, 2011: 391). It is noted these are not
have’ (Id.). The reintegration
: proximity to the local
community is a central aspect of rehabilitation (Ploeg and Sandlie, 2011: 390).
: A variety of examples of
supporting the social support systems of offenders, particularly with substance use
disorders, recognises the value of social support in achieving stability (and desistance)
entions and sanctions (Davis
Pettus et al, 2012). Examples of reviewed models include Circles of Support and
(a service providing support exclusively to family members of
involving prisoners and a
: Peer support of prisoners through life coaching
to provide a tailored understanding of the needs of individual prisoners and support
pathic understanding of the prison experience (as cited in
www.sccjr.ac.uk
REPORT No. 04/2012
6 References Allen, R. and Stern, V. (eds.) (2007)
International Centre for Prison Studies
http://www.prisonstudies.org/info/downloads/justice
Armstrong, S. and Weaver, E. (2010)
experience of short prison sentences and
available from : www.sccjr.ac.uk
Baumer, E.P. (1997) ‘Levels and Predictors of Recidivism: The Malta Experience’, Criminology 35(4): 601
28.
Baumer, E. (2009) ‘The Porous Prison
Prison Journal, vol. 89(1): 119
Breen, J. (2010) ‘Secondary Effects of Imprisonment: The New Direction of Prison Research,’
Probation Journal, vol. 10: 46
Brown, A and Ruddy, D (2008) Reconviction in Northern
Research and Statistical Bulletin 8/2008, Northern Ireland Office, Statistics and Research
Branch, Available from:
http://www.nio.gov.uk/2008_reconviction_in_northern_ireland__results_from_the_2005_coh
ort.pdf
Cavadino, M. and Dignan, J. (2006)
Publications Ltd.
Department of Justice of Northern Ireland (DOJNI)
2009, Research and Statistical Bulletin 2/2010
Department of Justice of Northern Ireland (DOJNI) (2011)
Research and Statistical Bulletin 1/2011
Department of Justice of Northern Ireland (DOJNI) (2012) Digest of Information on the Northern Ireland
Criminal Justice System – Volume Four
Déscarpes, and Durnescu, I. (2012)
mechanism for the social re
Sectoral Operational Programme Development of Human Resources 2007
version on file with SCCJR and available on request].
Downes, D. and Hansen, K. (2006) ‘Welfare and
Armstrong and L. McAra, (eds.),
European Sourcebook of Crime and Criminal Justice Statistics
http://europeansourcebook.org/ob285_full.pdf
Francis, B., Harman, J., Humphreys, L. (2005) Predicting Reconviction Rates in
Kristoffersen, R. (ed.) (2008) Correctional Service of Norway Staff Academy, Correctional Statistics of
Denmark, Finland, Iceland, Norway an
Lacey, N. (2008) The Prisoners’ Dilemma: Political Economy and Punishment in Contemporary
Democracies, Cambridge: CUP.
Martynowicz, A. and Quigley, M. (2010) Reintegration of Prisoners in Ireland: New Research Findings,
Irish Probation Journal, vol. 10: 65
REPORT No. 04/2012
Allen, R. and Stern, V. (eds.) (2007) Justice Reinvestment – A New Approach to Crime and Justice
International Centre for Prison Studies, King’s College London – School of Law
http://www.prisonstudies.org/info/downloads/justice-reinvestment-2007.pdf
Armstrong, S. and Weaver, E. (2010) What Do the Punished Think of Punishment? The comparative
experience of short prison sentences and community-based punishments, SCCJR Report 04/2010,
available from : www.sccjr.ac.uk
Baumer, E.P. (1997) ‘Levels and Predictors of Recidivism: The Malta Experience’, Criminology 35(4): 601
The Porous Prison: A Note on the Rehabilitative Potential of Visits Home
Prison Journal, vol. 89(1): 119-126.
Breen, J. (2010) ‘Secondary Effects of Imprisonment: The New Direction of Prison Research,’
, vol. 10: 46-64.
Brown, A and Ruddy, D (2008) Reconviction in Northern Ireland: Results from the 2005 cohort,
Research and Statistical Bulletin 8/2008, Northern Ireland Office, Statistics and Research
http://www.nio.gov.uk/2008_reconviction_in_northern_ireland__results_from_the_2005_coh
Cavadino, M. and Dignan, J. (2006) Penal systems: a comparative approach
Department of Justice of Northern Ireland (DOJNI) (2010) The Northern Ireland Prison Population in
2009, Research and Statistical Bulletin 2/2010
Department of Justice of Northern Ireland (DOJNI) (2011) Adult Reconviction in Northern Ireland 2005
Research and Statistical Bulletin 1/2011
stice of Northern Ireland (DOJNI) (2012) Digest of Information on the Northern Ireland
Volume Four
Déscarpes, and Durnescu, I. (2012) Study regarding the development of an integrated inter
mechanism for the social reintegration of former convicts, European Social Fund, through the
Sectoral Operational Programme Development of Human Resources 2007-
version on file with SCCJR and available on request].
Downes, D. and Hansen, K. (2006) ‘Welfare and Punishment in Comparative Perspective,’ in S.
Armstrong and L. McAra, (eds.), Perspectives on Punishment: The Contours of Control
European Sourcebook of Crime and Criminal Justice Statistics – 2010, 4th
edition, WODC. Available at:
ropeansourcebook.org/ob285_full.pdf
J., Humphreys, L. (2005) Predicting Reconviction Rates in
Kristoffersen, R. (ed.) (2008) Correctional Service of Norway Staff Academy, Correctional Statistics of
Denmark, Finland, Iceland, Norway and Sweden 2002 – 2006.
The Prisoners’ Dilemma: Political Economy and Punishment in Contemporary
, Cambridge: CUP.
Martynowicz, A. and Quigley, M. (2010) Reintegration of Prisoners in Ireland: New Research Findings,
Probation Journal, vol. 10: 65-84.
47
A New Approach to Crime and Justice,
School of Law, available from:
2007.pdf
What Do the Punished Think of Punishment? The comparative
, SCCJR Report 04/2010,
Baumer, E.P. (1997) ‘Levels and Predictors of Recidivism: The Malta Experience’, Criminology 35(4): 601–
Potential of Visits Home, The
Breen, J. (2010) ‘Secondary Effects of Imprisonment: The New Direction of Prison Research,’ Irish
Ireland: Results from the 2005 cohort,
Research and Statistical Bulletin 8/2008, Northern Ireland Office, Statistics and Research
http://www.nio.gov.uk/2008_reconviction_in_northern_ireland__results_from_the_2005_coh
Penal systems: a comparative approach. London: SAGE
The Northern Ireland Prison Population in
Adult Reconviction in Northern Ireland 2005
stice of Northern Ireland (DOJNI) (2012) Digest of Information on the Northern Ireland
tudy regarding the development of an integrated inter-institutional
European Social Fund, through the
-2013, [English language
Punishment in Comparative Perspective,’ in S.
Perspectives on Punishment: The Contours of Control, Oxford: OUP.
edition, WODC. Available at:
Kristoffersen, R. (ed.) (2008) Correctional Service of Norway Staff Academy, Correctional Statistics of
The Prisoners’ Dilemma: Political Economy and Punishment in Contemporary
Martynowicz, A. and Quigley, M. (2010) Reintegration of Prisoners in Ireland: New Research Findings,
www.sccjr.ac.uk
REPORT No. 04/2012
McMullan, S. and Ruddy, D. (2005) Statistics and Research Branch Adult Reconviction in Northern
Ireland 2001, Research and Statistical Bulletin 3/2005, Available from:
http://www.nio.gov.uk/adult_reconviction_in_northern_ireland_2001_3
McAra, L. (2009) Crime and Punishment in a Small Nation: Why Penology Matters, Inaugural Lecture, 11
December 2009, Edinburgh University Law
McNeill, F. (2012 in press) Four forms of ‘offender’ rehabilitation: Towards an interdisciplinary
perspective, Legal and Criminological Psychology
Ministry of Justice (2009) The Story of the Prison Population in England and Wales, Statistics Bulle
available from:
population.pdf
Ministry of Justice (2010) ‘Chapter 4.3 Comparison of
of reoffending statistics and analysis, Statistics Bulletin, pp. 100
http://www.justice.gov.uk/publication
Ministry of Justice (2011a) Compendium of reoffending statistics and analysis, Statistics Bulletin,
available from: http://www.justice.gov.uk/publications/compendium
Ministry of Justice (2011b) Adult re
Statistics bulletin, March 2011:
reoffending-statistics-09.pdf
Nadesu, A. (2009a) Reconviction patterns of released prisoners: A 60
Zealand Department of Corrections Research Report, available at:
http://www.corrections.govt.nz/research.html
Nadesu, A. (2009b) Reconviction patterns of offenders managed in the community: A 60
up analysis, New Zealand Department of Corrections Research Report, available at:
http://www.corrections.govt.nz/research.html
Nelken, D. (2010) Comparative Criminal Justice: Making Sense of Difference
New Zealand Department of Corrections (2003
http://www.corrections.govt.nz/news
Northern Ireland Depart of Justice (2011) Adult Reconviction I
Statistical Bulletin 1/2011, Statistics and Research Branch, available at:
Northern Ireland, NIO Research and Statistical Bulletin 7/2005, available from:
http://www.nio.gov.uk/predicting_reconviction_rates_in_norther
O’Donnell, I. (2002) ‘The Reintegration of Prisoners,’ Administration, vol. 50(2): 80
O’Donnell, Baumer, E. and Hughes, N. (2008) ‘Recidivism in the Republic of Ireland,’ Criminology and
Criminal Justice, vol: 8(2): 123
Pettus-Davis, C., Howard, M.O., Roberts
Support in Interventions for Former Prisoners with Substance Use Disorders: Conceptual
Framework and Program Model’,
Ploeg, G and Sandlie, J-E. (2011) Mapping Probation Futures: Norway, Probation Journal, vol. 58(4): 386
394.
Pratt, J. and Clark, M. (2005) ‘Penal Populism in New Zealand,’
322.
REPORT No. 04/2012
McMullan, S. and Ruddy, D. (2005) Statistics and Research Branch Adult Reconviction in Northern
Ireland 2001, Research and Statistical Bulletin 3/2005, Available from:
http://www.nio.gov.uk/adult_reconviction_in_northern_ireland_2001_3-2005.pdf
McAra, L. (2009) Crime and Punishment in a Small Nation: Why Penology Matters, Inaugural Lecture, 11
December 2009, Edinburgh University Law School.
McNeill, F. (2012 in press) Four forms of ‘offender’ rehabilitation: Towards an interdisciplinary
Legal and Criminological Psychology.
Ministry of Justice (2009) The Story of the Prison Population in England and Wales, Statistics Bulle
http://www.justice.gov.uk/downloads/statistics/mojstats/story
Ministry of Justice (2010) ‘Chapter 4.3 Comparison of Reoffending Rates Across Countries,’ Compendium
of reoffending statistics and analysis, Statistics Bulletin, pp. 100
http://www.justice.gov.uk/publications/compendium-reoffending.htm
Compendium of reoffending statistics and analysis, Statistics Bulletin,
available from: http://www.justice.gov.uk/publications/compendium-reoffending.htm
Ministry of Justice (2011b) Adult re-convictions: results from the 2009 cohort, England and Wales
Statistics bulletin, March 2011: http://www.justice.gov.uk/downloads/statistics/mojstats/adult
09.pdf
Nadesu, A. (2009a) Reconviction patterns of released prisoners: A 60-months follow
Zealand Department of Corrections Research Report, available at:
://www.corrections.govt.nz/research.html
Nadesu, A. (2009b) Reconviction patterns of offenders managed in the community: A 60
up analysis, New Zealand Department of Corrections Research Report, available at:
http://www.corrections.govt.nz/research.html
Comparative Criminal Justice: Making Sense of Difference, Sage.
New Zealand Department of Corrections (2003-2011) Annual Reports, available from:
http://www.corrections.govt.nz/news-and-publications/statutory-reports/annual
Northern Ireland Depart of Justice (2011) Adult Reconviction In Northern Ireland 2005, Research and
Statistical Bulletin 1/2011, Statistics and Research Branch, available at:
Northern Ireland, NIO Research and Statistical Bulletin 7/2005, available from:
http://www.nio.gov.uk/predicting_reconviction_rates_in_northern_ireland_7
O’Donnell, I. (2002) ‘The Reintegration of Prisoners,’ Administration, vol. 50(2): 80
O’Donnell, Baumer, E. and Hughes, N. (2008) ‘Recidivism in the Republic of Ireland,’ Criminology and
Criminal Justice, vol: 8(2): 123–146.
Howard, M.O., Roberts-Lewis, A., Scheyett, A. M. (2011) ‘Naturally Occurring Social
Support in Interventions for Former Prisoners with Substance Use Disorders: Conceptual
Framework and Program Model’, Journal of Criminal Justice, vol. 39 (2011) 479
E. (2011) Mapping Probation Futures: Norway, Probation Journal, vol. 58(4): 386
Pratt, J. and Clark, M. (2005) ‘Penal Populism in New Zealand,’ Punishment and Society
48
McMullan, S. and Ruddy, D. (2005) Statistics and Research Branch Adult Reconviction in Northern
Ireland 2001, Research and Statistical Bulletin 3/2005, Available from:
2005.pdf
McAra, L. (2009) Crime and Punishment in a Small Nation: Why Penology Matters, Inaugural Lecture, 11
McNeill, F. (2012 in press) Four forms of ‘offender’ rehabilitation: Towards an interdisciplinary
Ministry of Justice (2009) The Story of the Prison Population in England and Wales, Statistics Bulletin,
http://www.justice.gov.uk/downloads/statistics/mojstats/story-prison-
Reoffending Rates Across Countries,’ Compendium
of reoffending statistics and analysis, Statistics Bulletin, pp. 100-109, available from:
Compendium of reoffending statistics and analysis, Statistics Bulletin,
reoffending.htm
ons: results from the 2009 cohort, England and Wales
http://www.justice.gov.uk/downloads/statistics/mojstats/adult-
months follow-up analysis, New
Zealand Department of Corrections Research Report, available at:
Nadesu, A. (2009b) Reconviction patterns of offenders managed in the community: A 60-months follow-
up analysis, New Zealand Department of Corrections Research Report, available at:
, Sage.
2011) Annual Reports, available from:
reports/annual-reports.html
n Northern Ireland 2005, Research and
Northern Ireland, NIO Research and Statistical Bulletin 7/2005, available from:
n_ireland_7-2005.pdf
O’Donnell, I. (2002) ‘The Reintegration of Prisoners,’ Administration, vol. 50(2): 80-96.
O’Donnell, Baumer, E. and Hughes, N. (2008) ‘Recidivism in the Republic of Ireland,’ Criminology and
Lewis, A., Scheyett, A. M. (2011) ‘Naturally Occurring Social
Support in Interventions for Former Prisoners with Substance Use Disorders: Conceptual
1) 479–488
E. (2011) Mapping Probation Futures: Norway, Probation Journal, vol. 58(4): 386-
Punishment and Society, Vol 7(3): 303–
www.sccjr.ac.uk
REPORT No. 04/2012
Recorded Crime in Scotland, 2
http://www.scotland.gov.uk/Publications/2011/09/02120241/0
Criminal Proceedings in Scottish Courts, 2010
http://www.scotland.gov.uk/Publications/2011/12/12131605/0
Scottish Government (2011a) Reconviction Rates in Scotland: 2007
Statistical Bulletin (Crime and Justice Series)
http://www.scotland.gov.uk/Publications/2011/08/29151240/0
Scottish Government (2011b) Da
http://www.scotland.gov.uk/Topics/Statistics/Browse/Crime
Scottish Government (2012) Scottish Reconviction Datasets, E
http://www.scotland.gov.uk/Topics/Statistics/Browse/Crime
Justice/Datasets/ReconvictOffendDatasets/
Scottish Prisons Commission (2008) Scotland’s Choice: Report of the Scottish Prisons Commission,
Scottish Government. Available from:
http://www.scotland.gov.uk/Publicat
Skardhamar, T. and Telle, K. (2012) Post
Quantitative Criminology.
Statistics and Research Branch, Adult Reconviction In Northern Ireland (2005) Research and Statistical
Bulletin 1/2011. Available from:
publications/reoffending-stats
Statistics Norway (2007) Offences Investigated, 2005
http://www.ssb.no/lovbrudde_en/arkiv/art
Tombs, J. and Jaeger, E. (2006) ‘
Imprison,’ British Journal of Criminology
Wartna, B.S.J. and Nijssen, L.T.J. (2006) National studies on recidivism: An inventory of
recidivism research in 33 European countries
Wartna, B.S.J. Tollenaar, N. Blom, M. Alma, S.M. Bregman, I.M.., Essers, A.A.M and van Straalen, E.K.
(2011) Recidivism report 2002
2011-5a
REPORT No. 04/2012
Recorded Crime in Scotland, 2010-11 (2011). Available from:
http://www.scotland.gov.uk/Publications/2011/09/02120241/0
Criminal Proceedings in Scottish Courts, 2010-11 (2011) Available from:
http://www.scotland.gov.uk/Publications/2011/12/12131605/0
Scottish Government (2011a) Reconviction Rates in Scotland: 2007-08 and 2008
Statistical Bulletin (Crime and Justice Series), available from:
http://www.scotland.gov.uk/Publications/2011/08/29151240/0
Scottish Government (2011b) Datasets for reconvictions 2007-08 and 2008
http://www.scotland.gov.uk/Topics/Statistics/Browse/Crime-Justice/Datasets/ReconrateAug2011
Scottish Government (2012) Scottish Reconviction Datasets, Excel tables, available from :
http://www.scotland.gov.uk/Topics/Statistics/Browse/Crime-
Justice/Datasets/ReconvictOffendDatasets/reconchar0809
Scottish Prisons Commission (2008) Scotland’s Choice: Report of the Scottish Prisons Commission,
Scottish Government. Available from:
http://www.scotland.gov.uk/Publications/2008/06/30162955/0
Skardhamar, T. and Telle, K. (2012) Post-release Employment and Recidivism in Norway, Journal of
Statistics and Research Branch, Adult Reconviction In Northern Ireland (2005) Research and Statistical
in 1/2011. Available from: http://www.dojni.gov.uk/index/statistics-
stats-and-research/adult_reconviction_in_northern_ireland_2005.pdf
Offences Investigated, 2005 ‘More adults charged with crimes’,
http://www.ssb.no/lovbrudde_en/arkiv/art-2007-08-13-01-en.html
J. and Jaeger, E. (2006) ‘Denying Responsibility: Sentencers’ Accounts of their Decisions to
British Journal of Criminology, Vol. 46, No. 5, pp. 803-821.
Wartna, B.S.J. and Nijssen, L.T.J. (2006) National studies on recidivism: An inventory of
recidivism research in 33 European countries
Wartna, B.S.J. Tollenaar, N. Blom, M. Alma, S.M. Bregman, I.M.., Essers, A.A.M and van Straalen, E.K.
(2011) Recidivism report 2002-2008: Trends in the reconviction rate of Dutch offenders, Fact shee
49
11 (2011). Available from:
11 (2011) Available from:
08 and 2008-09 Offender Cohorts,
, available from:
08 and 2008-09, available from:
Justice/Datasets/ReconrateAug2011
xcel tables, available from :
Scottish Prisons Commission (2008) Scotland’s Choice: Report of the Scottish Prisons Commission,
Scottish Government. Available from:
release Employment and Recidivism in Norway, Journal of
Statistics and Research Branch, Adult Reconviction In Northern Ireland (2005) Research and Statistical
-research/stats-research-
research/adult_reconviction_in_northern_ireland_2005.pdf
‘More adults charged with crimes’,
Denying Responsibility: Sentencers’ Accounts of their Decisions to
Wartna, B.S.J. and Nijssen, L.T.J. (2006) National studies on recidivism: An inventory of large-scale
Wartna, B.S.J. Tollenaar, N. Blom, M. Alma, S.M. Bregman, I.M.., Essers, A.A.M and van Straalen, E.K.
2008: Trends in the reconviction rate of Dutch offenders, Fact sheet
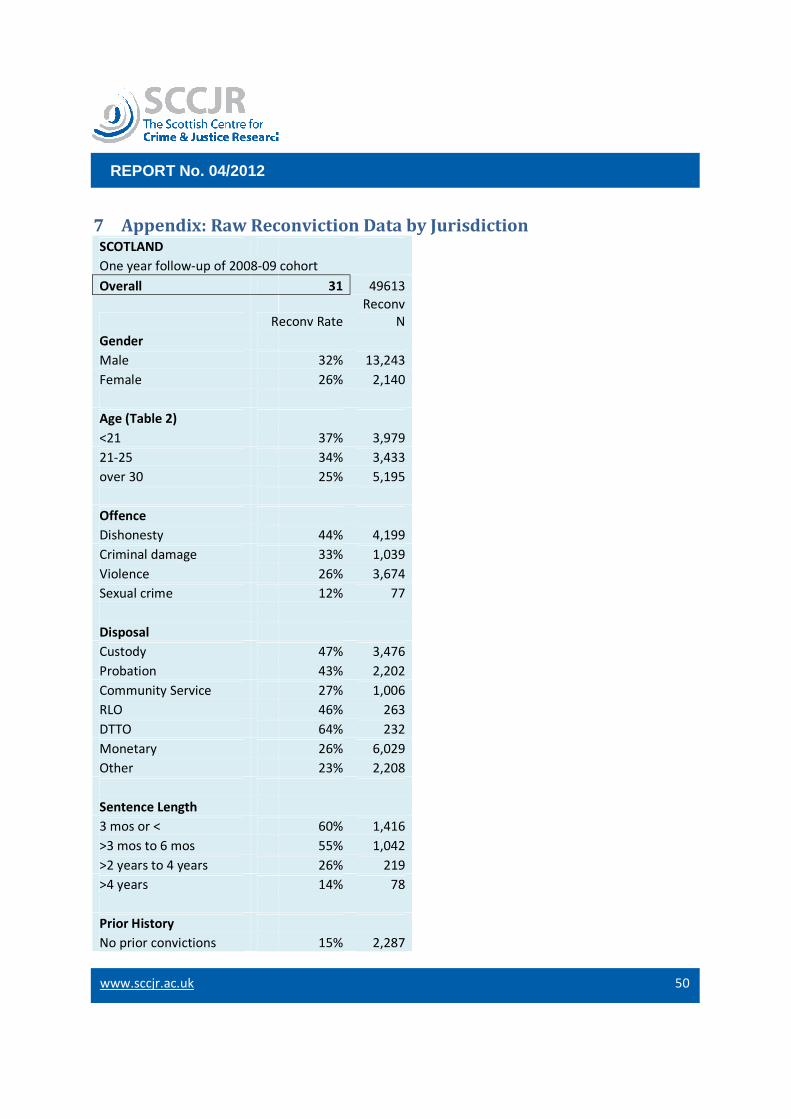
www.sccjr.ac.uk
REPORT No. 04/2012
7 Appendix: Raw Reconviction Data by JurisdictionSCOTLAND
One year follow-up of 2008-09 cohort
Overall
Reconv Rate
Gender
Male
Female
Age (Table 2)
<21
21-25
over 30
Offence
Dishonesty
Criminal damage
Violence
Sexual crime
Disposal
Custody
Probation
Community Service
RLO
DTTO
Monetary
Other
Sentence Length
3 mos or <
>3 mos to 6 mos
>2 years to 4 years
>4 years
Prior History
No prior convictions
REPORT No. 04/2012
Appendix: Raw Reconviction Data by Jurisdiction
09 cohort
31 49613
Reconv Rate
Reconv
N
32% 13,243
26% 2,140
37% 3,979
34% 3,433
25% 5,195
44% 4,199
33% 1,039
26% 3,674
12% 77
47% 3,476
43% 2,202
27% 1,006
46% 263
64% 232
26% 6,029
23% 2,208
60% 1,416
55% 1,042
26% 219
14% 78
15% 2,287
50
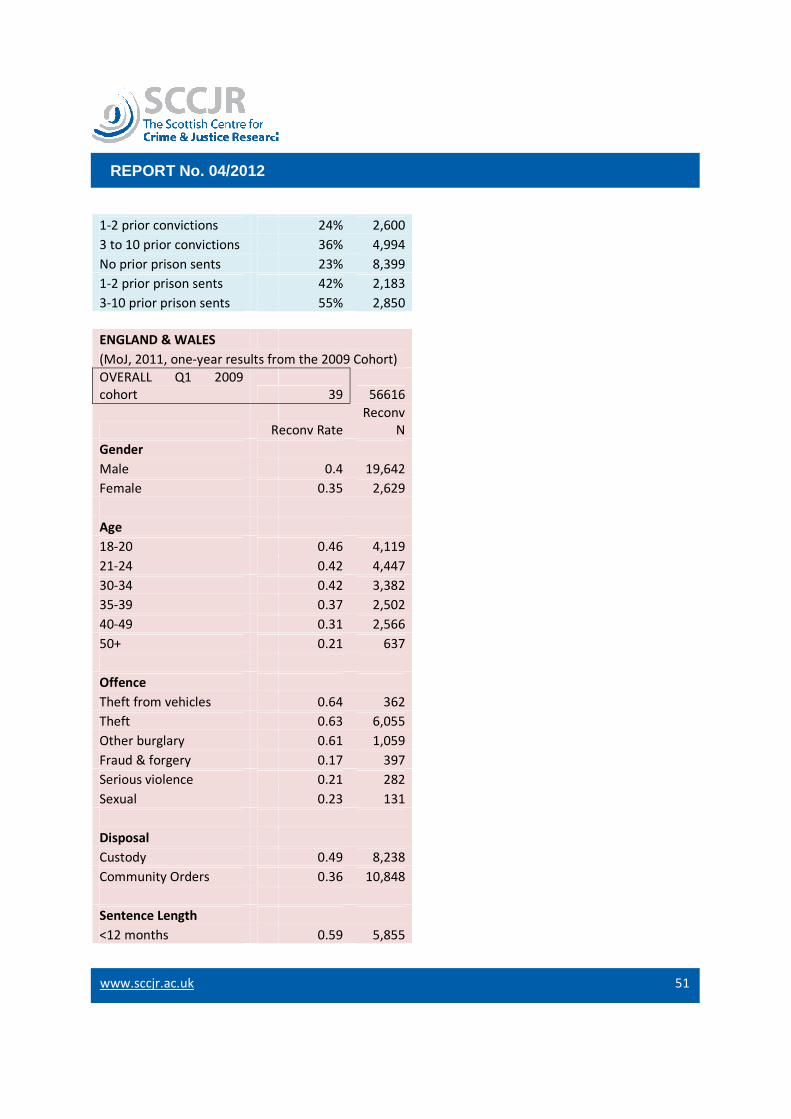
www.sccjr.ac.uk
REPORT No. 04/2012
1-2 prior convictions
3 to 10 prior convictions
No prior prison sents
1-2 prior prison sents
3-10 prior prison sents
ENGLAND & WALES
(MoJ, 2011, one-year results from the 2009 Cohort)
OVERALL Q1 2009
cohort
Reconv Rate
Gender
Male
Female
Age
18-20
21-24
30-34
35-39
40-49
50+
Offence
Theft from vehicles
Theft
Other burglary
Fraud & forgery
Serious violence
Sexual
Disposal
Custody
Community Orders
Sentence Length
<12 months
REPORT No. 04/2012
24% 2,600
36% 4,994
23% 8,399
42% 2,183
55% 2,850
year results from the 2009 Cohort)
39 56616
Reconv Rate
Reconv
N
0.4 19,642
0.35 2,629
0.46 4,119
0.42 4,447
0.42 3,382
0.37 2,502
0.31 2,566
0.21 637
0.64 362
0.63 6,055
0.61 1,059
0.17 397
0.21 282
0.23 131
0.49 8,238
0.36 10,848
0.59 5,855
51
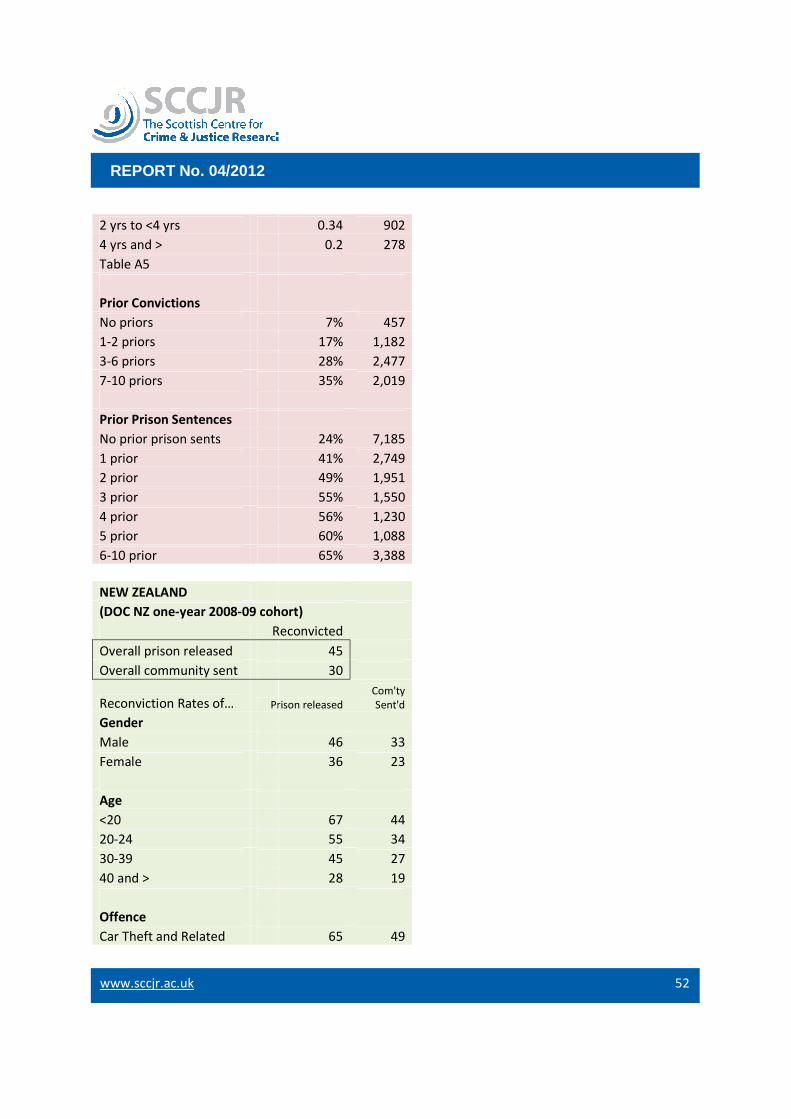
www.sccjr.ac.uk
REPORT No. 04/2012
2 yrs to <4 yrs
4 yrs and >
Table A5
Prior Convictions
No priors
1-2 priors
3-6 priors
7-10 priors
Prior Prison Sentences
No prior prison sents
1 prior
2 prior
3 prior
4 prior
5 prior
6-10 prior
NEW ZEALAND
(DOC NZ one-year 2008-09 cohort)
Reconvicted
Overall prison released
Overall community sent
Reconviction Rates of… Prison released
Gender
Male
Female
Age
<20
20-24
30-39
40 and >
Offence
Car Theft and Related
REPORT No. 04/2012
0.34 902
0.2 278
7% 457
17% 1,182
28% 2,477
35% 2,019
24% 7,185
41% 2,749
49% 1,951
55% 1,550
56% 1,230
60% 1,088
65% 3,388
09 cohort)
Reconvicted
45
30
Prison released
Com'ty
Sent'd
46 33
36 23
67 44
55 34
45 27
28 19
65 49
52
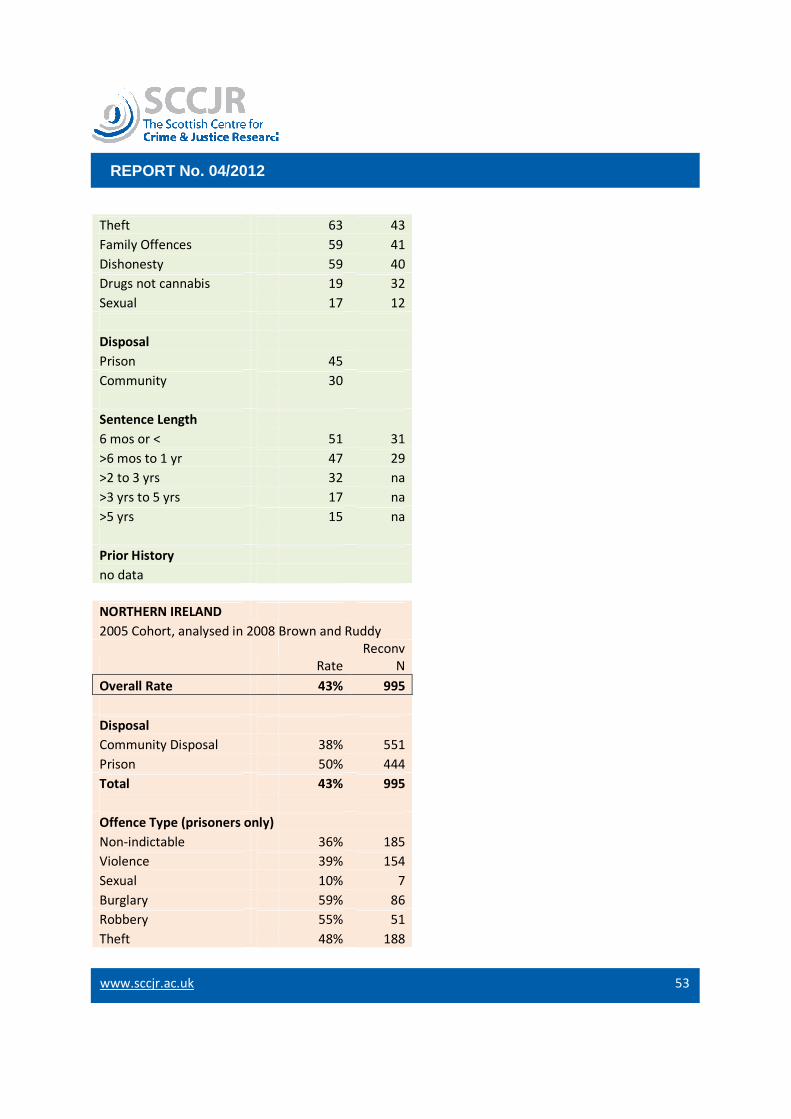
www.sccjr.ac.uk
REPORT No. 04/2012
Theft
Family Offences
Dishonesty
Drugs not cannabis
Sexual
Disposal
Prison
Community
Sentence Length
6 mos or <
>6 mos to 1 yr
>2 to 3 yrs
>3 yrs to 5 yrs
>5 yrs
Prior History
no data
NORTHERN IRELAND
2005 Cohort, analysed in 2008 Brown and Ruddy
Overall Rate
Disposal
Community Disposal
Prison
Total
Offence Type (prisoners only)
Non-indictable
Violence
Sexual
Burglary
Robbery
Theft
REPORT No. 04/2012
63 43
59 41
59 40
19 32
17 12
45
30
51 31
47 29
32 na
17 na
15 na
in 2008 Brown and Ruddy
Rate
Reconv
N
43% 995
38% 551
50% 444
43% 995
36% 185
39% 154
10% 7
59% 86
55% 51
48% 188
53
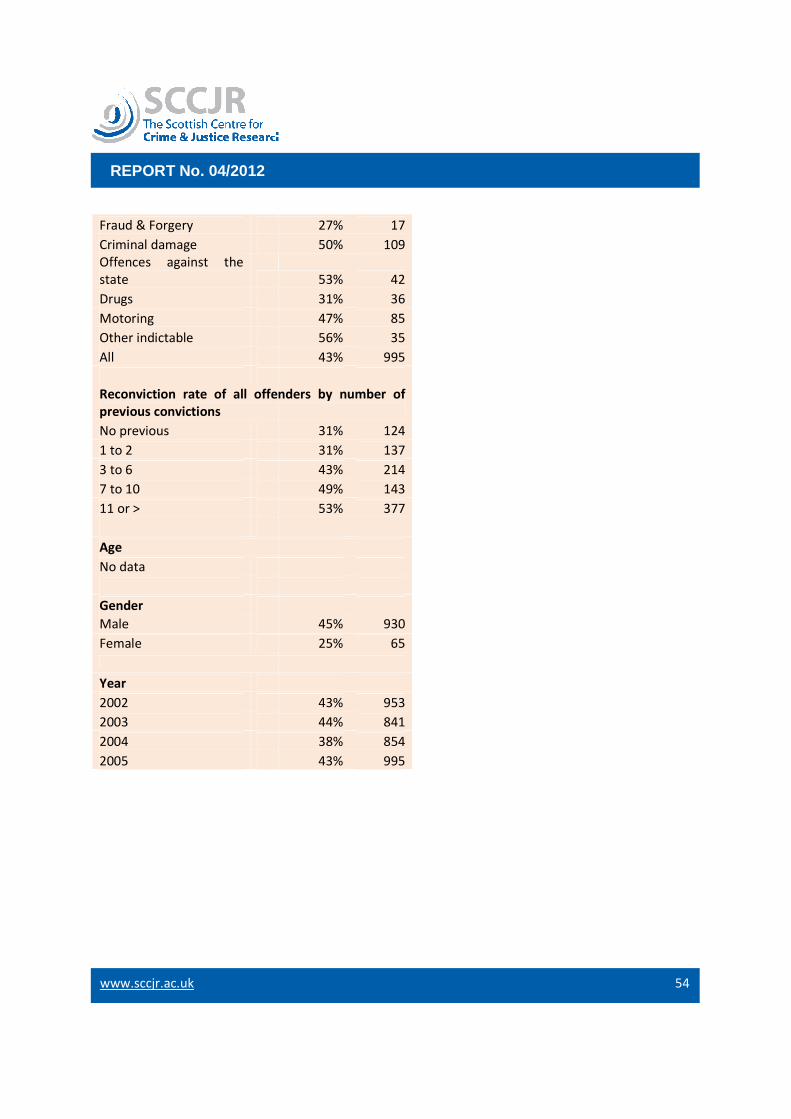
www.sccjr.ac.uk
REPORT No. 04/2012
Fraud & Forgery
Criminal damage
Offences against the
state
Drugs
Motoring
Other indictable
All
Reconviction rate of all offenders by number of
previous convictions
No previous
1 to 2
3 to 6
7 to 10
11 or >
Age
No data
Gender
Male
Female
Year
2002
2003
2004
2005
REPORT No. 04/2012
27% 17
50% 109
53% 42
31% 36
47% 85
56% 35
43% 995
Reconviction rate of all offenders by number of
31% 124
31% 137
43% 214
49% 143
53% 377
45% 930
25% 65
43% 953
44% 841
38% 854
43% 995
54