Embed Size (px)
Citation preview
Reducing Maternal Mortality in Tanzania: Selected Pregnancy Outcomes in Kigoma Summary
1
Reducing Maternal Mortality in Tanzania:
Selected Pregnancy Outcomes Findings from
Kigoma Region
Background Tanzania has the fourth highest number of maternal deaths in Sub-Saharan Africa and the sixth highest in the world (World Health Organization, 2014). The Millennium Development Goal 5 national target is to reduce maternal mortality to 193 maternal deaths per 100,000 live births by 2015 through high-skilled birth attendance (80% of all births), provision of comprehensive emergency obstetric care in 100% of hospitals, provision of basic emergency obstetric care in 70% of health centers and dispensaries, and a contraceptive prevalence rate of 60% (Ministry of Health and Social Welfare, Sharpened One Plan, 2014).
Since 2006, Bloomberg Philanthropies (BP) has supported the Reducing Maternal Mortality in Tanzania Project, aimed at decreasing maternal mortality through
improved comprehensive obstetric care in Kigoma, Morogoro and Pwani regions. The World Lung Foundation implements the intervention, which has included upgrading the capacity of 15 facilities (10 health centers and 5 hospitals) to perform obstetric surgeries, in addition to training over 100 non-physician clinicians in anesthesia and emergency obstetric and neonatal care (EmONC). In 2013, BP engaged epidemiologists from the U.S. Centers for Disease Control and Prevention (CDC) to independently evaluate the project‟s progress, as well as its impact on maternal health outcomes in Kigoma Region.
CDC employed a multi-method approach including: a standardized health facility assessment, extraction of pregnancy outcomes, obstetric complications, and abortion and surgery information from obstetric registers, and documentation of facility-based maternal deaths using multiple sources.
This evaluation aims to assess current practices and outcomes in project-supported facilities as well as other facilities that provide delivery care throughout Kigoma region. Kigoma is the first region to implement the project and the first to start decentralizing comprehensive emergency obstetric care to make it accessible in health centers. The evaluation provides information on the current level and trends in EmONC services and examines the contribution of project-supported facilities to the changes in the level of care in the region.
Contact:
Florina Serbanescu, MD, MPH
Partners:
Tanzania Ministry of Health & Social Welfare
Kigoma Region
Bloomberg Philanthropies
Fondation H&B Agerup
World Lung Foundation
U.S. Centers for Disease Control and Prevention
Reducing Maternal Mortality in Tanzania: Selected Pregnancy Outcomes in Kigoma Summary
2
Methods
Study Area
Kigoma Region is in the western part of Tanzania, with a population of approximately 2,127,930 people and a male-to-female ratio of 1:1.07. Most of the population lives in rural villages, whose economies center on agriculture, small business, and fishing, for those near Lake Tanganyika. The region is bordered by Burundi and Kagera Region to the north, Shinyanga and Tabora Regions to the east, Democratic Republic of Congo (DRC) to the west, and Katavi Region to the south. Due to war and political instability in neighboring countries, Burundi and DRC, Kigoma Region experienced an influx of refugees. At the time of study implementation, most refugee camps in Kigoma Region had closed, with only two main camps continuing to operate. At the time of study planning, the region was divided administratively in four districts, all of which were included in the evaluation: Kigoma Urban (Ujiji Municipality) (population: 215,458), Kigoma Rural (Kigoma DC) (population: 595,206), Kasulu District (population: 888,380), and Kibondo District (population: 428,886) (Tanzania Population and Housing Census, NBS, 2013). The goal of the WLF-supported project is to expand access and utilization of comprehensive EmONC services and help the region achieve the MDG 5 goal. With the financial support of BP, the region upgraded nine health facilities (three hospitals and six health centers) with the technical and personnel capacity to provide and strengthen comprehensive EmONC services.
Maternal and Child Health Indicators in Kigoma, 2010
Compared to other regions in Tanzania, Kigoma had some of the greatest need for family planning and maternal and child health, as reflected in the following indicators for year 2010 (Tanzania Demographic and Health Survey, NBS, 2013) (Table 1).
Table 1. Maternal and Child Health Indicators, Kigoma Region and Tanzania, 2010
Indicator Kigoma Region Tanzania
Modern contraceptive prevalence rate 14% 27%
Unmet family planning need 41%* 18%
Institutional delivery rate 33%† 50%
Cesarean section rate 2%† 5%
15–19 year-olds who have begun childbearing 30% 23%
Neonatal mortality rate (per 1,000 live births) 25 26
Total fertility rate (births per woman) 7.1‡ 5.4
Total wanted fertility rate (births per woman) 6.3 4.7 * Highest unmet family planning need in the country. †Second lowest institutional delivery rate and C-section rate in the country. ‡Highest total fertility rate in the country.
Reducing Maternal Mortality in Tanzania: Selected Pregnancy Outcomes in Kigoma Summary
3
Study Objectives Assessing progress toward the MDG 5 goal during the initiative‟s implementation requires a baseline measuring of maternal mortality in facilities and communities. Given the early onset of interventions, a baseline assessment was not within the scope of the CDC evaluation. This study aims to evaluate the ongoing initiatives to improve emergency obstetric and newborn health by: • Documenting EmONC functionality, coverage, and quality of care in all facilities;
• Examining changes in the proportion of facility-based deliveries in the region;
• Examining changes in EmONC indicators and other delivery care indicators in all facilities
and in project-supported facilities;
• Comparing maternal and child health outcomes in the region as a whole to the outcomes of
the population receiving services from project facilities; and
• Analyzing the contribution of EmONC services in project facilities in relationship to the
overall contribution of other reproductive health services in the district.
Data Sources The study assessed facilities with at least 90 deliveries per year (reference year 2012), totaling 127 health facilities (Kigoma Urban, 3; Kigoma Rural, 27, Kasulu District, 51; Kibondo District, 46). CDC evaluated basic infrastructure and EmONC capacity/functionality in 1251 health facilities currently providing obstetric services in Kigoma Region using a health facility assessment questionnaire. These facilities provided care to an estimated 97% of all institutional births in 2012, according to the data made available to CDC by each district in July 2013. CDC collected individual data from five hospitals (three project-supported; two non-project-supported), 23 health centers (six project-supported; 17 non-project-supported), and 97 health dispensaries2 (all non-project-supported). Only an estimated 3% of institutional deliveries in 2012 were attended in the dispensaries not included in the study.
This report describes findings from the data resulting from the extraction of pregnancy outcomes
and abortion and surgery information from obstetric registers, as well as documentation of
facility-based maternal deaths. CDC retrospectively collected individual pregnancy outcome
data from delivering facilities using tailored extraction data collection forms. Maternity registers
were typically the only data source in lower-level facilities. Surgical and admission and
discharge registers were additionally used in higher level facilities. Information on each birth
was triangulated from several registers and tabulated by maternal characteristics. Although up
to 3 maternal complications were captured, only the most immediately life-threatening
complication was used to analyze maternal morbidity and case fatality rates.
1 Due to 2 years of missing pregnancy outcomes data, Rusaba and Kitagata dispensaries were excluded from the
analysis. 2 Excluded from the study are dispensaries with less than 90 annual deliveries in 2012 (Kasulu District: Kigembe,
Kilelema, Shunguliba; Kibondo District: Bitare, Kagezi, Kanyonza, Muhange, Nengo, Nyabibuye; Kigoma District: Kalya, Kamara, Kashaguru, Kiganza, Matendo, Mkigo, Nkonkwa).
Reducing Maternal Mortality in Tanzania: Selected Pregnancy Outcomes in Kigoma Summary
4
Detection of maternal deaths in hospitals and health centers was enhanced using the Rapid
Ascertainment of Pregnancy-Induced Deaths (RAPID) methodology (Immpact, 2007). RAPID
minimizes reporting of facility maternal deaths by reviewing all health facility records relating to
deaths among women of reproductive. These include: maternity registers, operation theater
registers (obstetric and general theaters), registers from women‟s inpatient wards (obstetrics,
gynecology, and female wards), including admission and discharge registers, daily report
registers, nurses‟ “round books” and maternal death notification and review forms.
Selected Findings Availability of EmONC Facilities About 15% of women develop complications in childbirth that are potentially life-threatening and
require immediate access to emergency obstetric care. Emergency obstetric and neonatal care
(EmONC) is a proven cost-effective strategy to reducing maternal mortality (Singh et al., 2009).
All women experiencing obstetric complications must have access to EmONC facilities with
„basic‟ and „comprehensive‟ levels of care. Basic care interventions (aka signal functions)
include the administration of parenteral antibiotics, anticonvulsants, and uterotonics; manual
removal of placenta; removal of retained products of conception; assisted vaginal delivery
(AVD) (vacuum extractor or forceps); and neonatal resuscitation. Comprehensive care includes
all the basic functions, as well as obstetric surgery and blood transfusions.
Health facility assessments were conducted in all 125 hospitals, health centers and
dispensaries that provided delivery care in 2012 (facility volume of 90 deliveries per year or
higher). Information on facility infrastructure, communication and transport, drugs and
equipment, human resources, and availability of routine and emergency obstetric care are
published in the “Health Facility Assessment of Emergency Obstetric and Neonatal Care
Services in Kigoma Region: Selected Findings” (CDC, June 2014).
Briefly, health facilities in Kigoma were classified as Basic (BEmONC) or Comprehensive
(CEmONC) care facilities (or neither) on the basis of whether they had recently performed
EmONC signal functions. The number of CEmONC facilities (those having the ability to perform
Cesarean sections and blood transfusions, in addition to seven basic life-saving interventions
that should be available in BEmONC facilities) increased from 7 to 13 due to the project‟s
efforts3. Facilities were classified as CEmONC or CEmONC-1 (and BEmONC and BEMONC-1,
respectively), with the missing function being assisted vaginal delivery. Although all project-
supported facilities performed AVDs in the past 12 months, this procedure is relatively
uncommon in other delivering facilities. Despite provision of other signal functions, these
facilities may not qualify as providing EmONC, given that AVD is rarely performed. This report
thus classifies facilities performing all BEmONC and CEmONC functions except AVD as
BEmONC-1 and CEmONC-1, respectively. For the current analysis, EmONC facilities are
classified as those routinely performing all other life-saving interventions, regardless of AVD
performance.
3 based on the signal functions provided during the previous 12 months.
Reducing Maternal Mortality in Tanzania: Selected Pregnancy Outcomes in Kigoma Summary
5
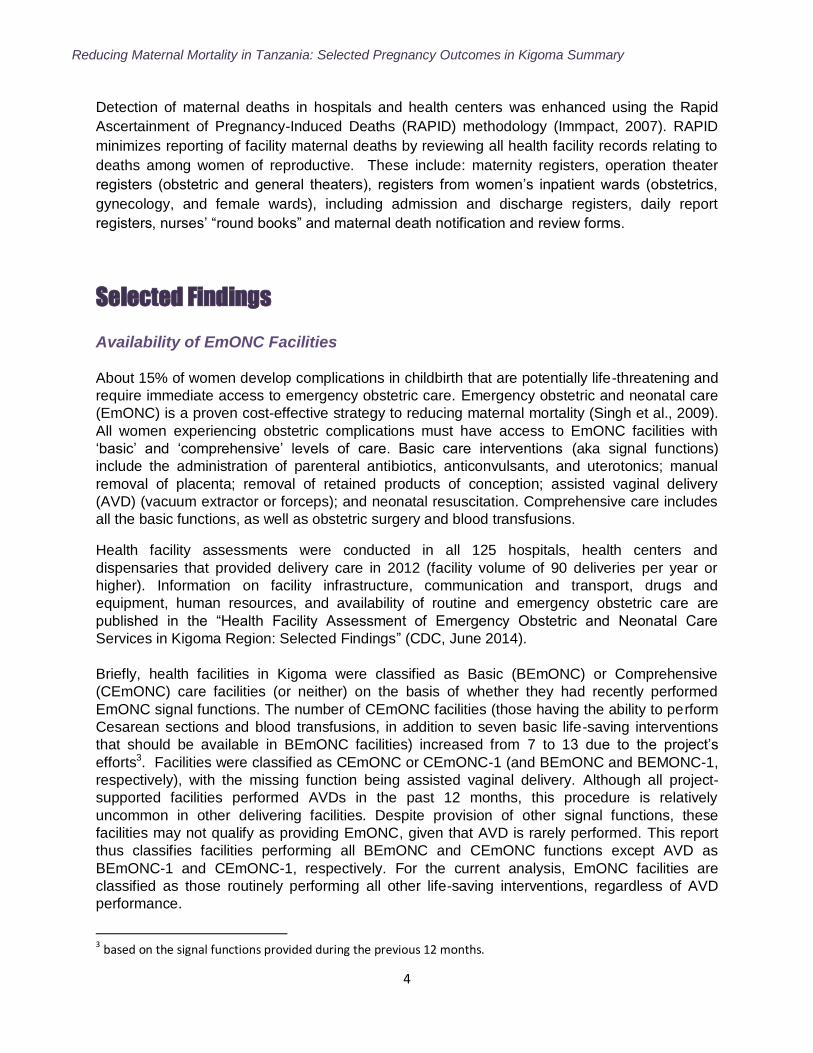
Table 2a. Availability of EmONC1 Facilities per 500,000 Population in 12 Months Prior to Assessment, by District, July 2012–June 2013
District Population, 2012 Census
Recommended minimum number of EmONC2
facilities
Number of Existing EmONC facilities3
All EmONC CEmONC BEmONC
only CEmONC Total EmONC
Kigoma Urban 215,458 2 1 0 2 2
Kigoma Rural 595,206 6 1 1 3 4
Kasulu 888,380 9 2 4 5 9
Kibondo 428,886 4 1 0 3 3
TOTAL 2,127,930 21 5 5 13 18 1 Includes BEmONC and CEmONC facilities that may not have performed AVD in past 12 months (i.e., BEmONC-1 and CEmONC-1). 2
WHO recommends minimum level of five EmONC facilities per 500,000 population, including at least one CEmONC facility. 3
EmONC functionality is classified using signal functions over the past 12 months. Includes CEmONC and BEmONC facilities that may have not provided assisted vaginal delivery within the past 12 months.
Table 2b. Availability of EmONC1 Facilities per 500,000 Population in Three Months Prior to Assessment, by District, April–June 2013
District Population, 2012 Census
Recommended minimum
number of EmONC2 facilities
Number of Existing EmONC facilities3
All EmONC CEmONC BEmONC
only CEmONC Total EmONC
Kigoma Urban 215,458 2 1 0 1 1
Kigoma Rural 595,206 6 1 1 3 4
Kasulu 888,380 9 2 1 4 5
Kibondo 428,886 4 1 0 1 1
TOTAL 2,127,930 21 5 2 9 11 1 Includes BEmONC and CEmONC facilities that may not have performed AVD in past three months (i.e., BEmONC-1 and CEmONC-1). 2 WHO recommends minimum level of five EmONC facilities per 500,000 population, including at least one CEmONC facility. 3
EmONC functionality is classified using signal functions over the past three months. Includes CEmONC and BEmONC facilities that may have not provided assisted vaginal delivery within the past three months.
In the past 12 months, 18 facilities per 2,179,618 population provided EmONC services (13 CEmONC and 5 BEmONC), which is lower than the WHO-recommended number of at least 5 EmONC facilities per 500,000 population (Table 2a). All districts meet the WHO-recommended number of 1 CEmONC facility per 500,000 population. Only Kasulu met the minimum recommended number of EmONC facilities.
In the past 3 months, 11 facilties (9 CEmONC and 2 BEmONC) provided the full rage of EmONC services (Table 2b). Less than optimal access to emergency obstetric care may explain the slow progress in achieving a minimum rate of cesarean deliveries and in increasing met need for emergency obstetric care in Kigoma Region.
Reducing Maternal Mortality in Tanzania: Selected Pregnancy Outcomes in Kigoma Summary
6
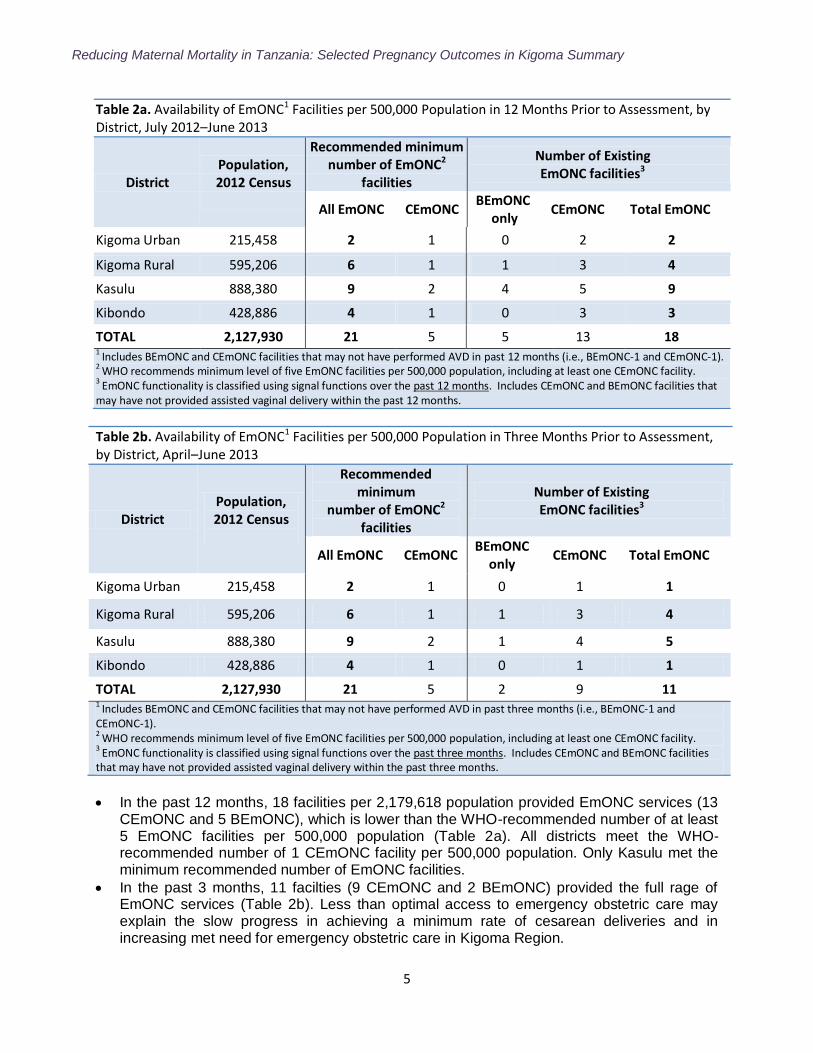
Table 3 shows common indicators that relate specifically to life-saving interventions provided in EmONC settings, where all emergency obstetric complications that cause most maternal deaths should be treated.
Table 3. EmONC Indicators* and additional delivery care indicators
Indicator Definition
Availability of EmONC*
The number of facilities providing EmONC† per 500,000
population
Proportion of institutional deliveries (%) The number of women who delivered in health facilities divided by the expected number of live births in the area of observation
Proportion of all births in EmONC facilities* (%)
The number of women who delivered in EmONC facilities divided by the expected number of live births in the area of observation
Population-based Cesarean section (CS) rate* (%) The number of Cesarean sections performed in health facilities for any reason divided by the expected number of live births in the area of observation
Facility CS rate (%) The number of Cesarean sections performed in CEmONC facilities for any reason divided by the number of births in CEmONC facilities
Met need for EmONC services* (%)
The number of women who delivered in health facilities and were treated for direct obstetric complications divided by the expected number of women with direct obstetric complications
Direct obstetric case fatality rate* (%)
The number of women who died of direct obstetric complications in facilities divided by the number of women diagnosed/treated with direct obstetric complications in the same facilities
Proportion of indirect maternal mortality* (%) The number of maternal deaths from indirect obstetric causes in facilities divided by the number of maternal deaths of direct and indirect obstetric causes in the same facilities
Institutional maternal mortality ratio (per 100,000 live births in facilities)
The number of maternal deaths from direct and indirect obstetric causes in facilities divided by the number of live births in the same facilities, expressed per 100,000 live births
Stillbirth rate (‰) The number of stillbirths in facilities divided by the number of total births in the same facilities, expressed per 1,000 births
Intrapartum stillbirth rate (‰) The number of fresh stillbirths divided by the number of total births in the same facilities, expressed per 1,000 births
Neonatal mortality rate (‰) Proportion of pre-discharge neonatal deaths divided by the number of live births in the same facilities, expressed per 1,000 live births
*Indicators recommended for monitoring the EmONC care (WHO, 2009)
† EmONC facilities include both CEmONC and BEmONC facilities
Reducing Maternal Mortality in Tanzania: Selected Pregnancy Outcomes in Kigoma Summary
7
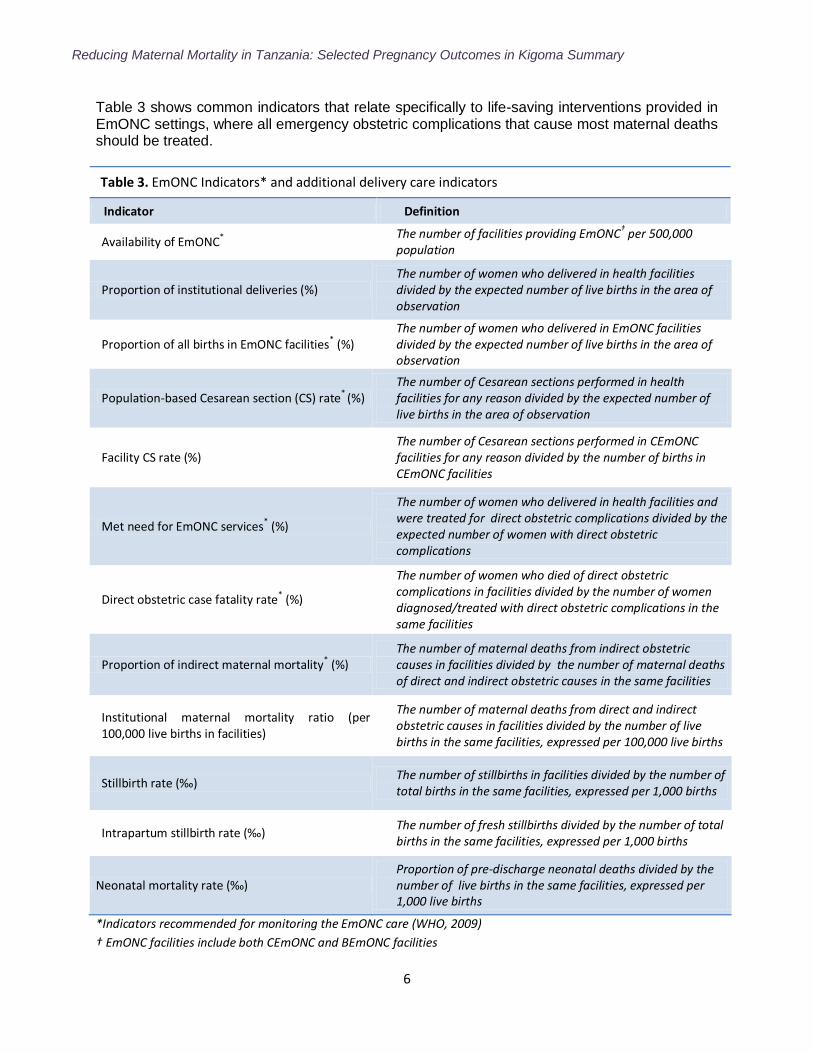
Institutional Delivery Rate4
Only 38% of estimated births occurring in Kigoma Region in January–June 2013 took place in facilities designated for delivery care5. Thus, over half of all deliveries are estimated to have occurred at home without any skilled obstetric care. Overall, 21% of births in Kigoma in 2013 took place in health centers and hospitals that provided BEmONC or CEmOC care.
The overall number of institutional deliveries increased from 17,162 to 18,999 (11%) in Kigoma Region from January–June 2011 to January–June 2013 (Figure 1). The institutional delivery rate increased by 6% during the same period of time.
Project-supported health centers and hospitals comprise 7% of all health facilities included in the study; 42% of institutional deliveries in Kigoma occurred in these facilities from January 2011–June 2013. Non-project-supported health centers and hospitals (comprising 15% of health facilities in Kigoma) accounted for 22% of the regional institutional deliveries during this time, whereas dispensaries (comprising 78% of health facilities) accounted for 36% of institutional deliveries in the region. No dispensary provided complete BEmONC.
Thus, project-supported facilities, which comprise 32% of all health centers and hospitals in Kigoma Region, provided most (66%) delivery care occurring in health centers and hospitals from January 2011–June 2013.
Project-supported facilities saw a 16% increase in institutional deliveries January–June 2011 to January–June 2013, whereas non-project-supported health centers and hospitals experienced a 3% decrease in institutional deliveries.
4 To account for missing months in the facility data, 323 of 3,750 (8.6%) facility-months were imputed for January 2011–June 2013.
All other indicators were calculated with raw data. 5 Estimated number of births projected from 2012 Tanzania Population and Housing Census, published 2013.
0
2000
4000
6000
8000
Jan-June 2011 July-Dec 2011 Jan-June 2012 July-Dec 2012 Jan-June 2013
Inst
itu
tio
nal
Del
iver
ies
Semester
Figure 1. Number of Institutional Deliveries (Adjusted) by Facility Type, January 2011–June 2013
Project-Supported Hospitals (n=3) Non-Project-Supported Hospitals (n=2)Project-Supported Health Centers (n=6) Non-Project-Supported Health Centers (n=17)Dispensaries (n=97)
Reducing Maternal Mortality in Tanzania: Selected Pregnancy Outcomes in Kigoma Summary
8
Cesarean Section Rate
Cesarean sections (C-sections) can prevent both maternal and neonatal deaths, in addition to severe maternal health complications (e.g., obstetric fistulae). The population-based C-section rate (CSR, number of C-sections performed as a proportion of all births) thus serves as an indicator of access to life-saving obstetric care. WHO recommends an optimal range of 5-15% (WHO, 2009), and anything below 5% suggests that women in need of this life-saving procedure cannot access it.
At 2.3%, the average CSR in Kigoma Region is substantially lower than the minimum recommended C-section rate (Figure 2). Moreover, there is minimal change over the study period. This low overall CSR raises concerns regarding low accessibility to EmONC for women needing the procedure.
Among women who delivered in CEmONC facilities in January 2011–June 2013, 12% delivered by C-section (hospitals: 15%; health centers: 6%).
Health centers with CEmONC capacity experienced a continuous increase in the proportion of C-sections; the CSR in health centers doubled from 3.1% in the first half of 2011 to 6.3% in 2013, likely due to the increased number of health centers‟ operating theaters from the intervention. However, the proportion of C-section deliveries in the two non-project-supported CEmONC health centers (Matyazo, a private facility, and Shunga) surpasses the proportion of C-sections in project-supported health centers (Nyenge, Kakonko, Mabamba, Buhingu, Nguruka, Ujiji) by a considerable margin (January–June 2011: 11.3% vs. 1.1%, respectively; January–June 2013: 13.8% vs. 4.3%, respectively). One possible explanation is the more extensive practice of vacuum-assisted delivery in the project health centers,
18.7 18.3
16.5 17.0
15.2
3.1 4.0
4.6 5.7 6.3 2.2%
2.5% 2.1% 2.5% 2.2%
0%
1%
2%
3%
4%
5%
6%
7%
8%
9%
10%
0
2
4
6
8
10
12
14
16
18
20
Jan-Jun 2011 Jul-Dec 2011 Jan-Jun 2012 Jul-Dec 2012 Jan-Jun 2013C
-Sec
tio
n R
ate
(Po
pu
lati
on
)
% F
acili
ty D
eliv
erie
s w
ith
C-S
ecti
on
Semester
Figure 2. All Facility and Population Cesarean Section Rates, Kigoma Region, January 2011–June 2013
Hospitals (n=5) Health Centers* (n=8) CS Rate (%)*Only includes health centers with operating theaters: Matyazo, Shunga, and all project-supported health centers (Nyenge, Kakonko, Mabamba, Buhingu, Nguruka, Ujiji).
Reducing Maternal Mortality in Tanzania: Selected Pregnancy Outcomes in Kigoma Summary
9
which potentially avoids C-sections in the absence of absolute surgical indications. Another is the availability of surgical teams and skills, which is greater in Matyazo, a private not-for-profit health center managed by the only obstetrician in the region.
This increase in surgical capacity in health centers likely contributed to the decreased proportion of C-section deliveries in hospitals (Figure 2). Between 2011 and 2012, C-section deliveries in project-supported hospitals increased by only 4%, while the C-section deliveries declined by 32% in non-project-supported hospitals (data not shown).
Obstetric Complications and Met Need for EmONC
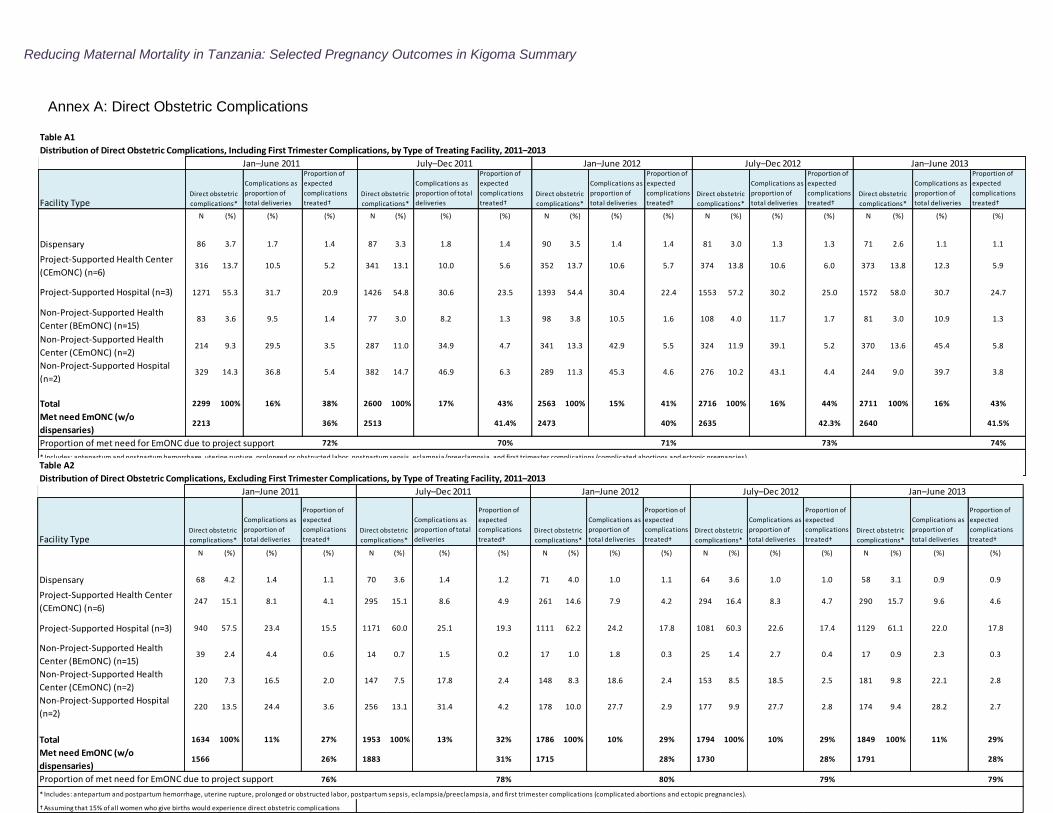
Monitoring the proportion of all women with major direct obstetric complications who receive treatment in EmONC facilities provides insights into the coverage and utilization of EmONC services. Direct obstetric complications include: hemorrhage (antepartum, intrapartum, or postpartum), prolonged or obstructed labor, ruptured uterus, postpartum sepsis, complications of abortion, pre-eclampsia/eclampsia, and ectopic pregnancy. CDC estimated the number of direct obstetric complications by triangulating information from multiple sources. Data sources differ for complications that occur at the time of delivery and soon after birth and for first trimester obstetric complications (e.g., complications of abortion and ectopic pregnancy). To ensure completeness, individual information were gathered on direct obstetric complications associated with the delivery and immediate postpartum periods from maternity registers (i.e., labor and delivery logbooks), obstetric surgery logbooks, and obstetric admission and discharge logbooks. CDC only recorded complications associated with labor, delivery, and early postpartum periods to avoid double counting. Aggregate data were collected on abortions from several wards and registers (e.g., female or gynecology ward logbooks, major and minor surgery logbooks, and obstetric logbooks). All evacuation procedures and surgeries for first and second trimester abortions were counted and considered that virtually all of these procedures were performed for post-abortion complications. CDC calculated the met need for EmONC using two approaches: a) taking into account only care provided for direct obstetric complications during labor, delivery, and early postpartum, and b) adding to the complications attended, the surgical post-abortion care and surgical treatment provided for ectopic pregnancies.
Annually, about 5,000 women who deliver in health facilities in Kigoma experience severe direct obstetric complications6 (Annex A: Table A1). Most of these women received care in project-supported facilities (from 69% in January–June 2011 to 72% in January–June 2013). The regional and district hospitals provided care for the highest number of major obstetric complications (from 55% in January–June 2011 to 58% in January–June 2013). Non-project supported hospitals experienced a decrease in the number of complications attended (from 14% to 9%, respectively), while the project supported health centers cared constantly for 14% of complications. The 2 other CEmONC health centers (Matiazo and Shunga, both
6 Includes: antepartum and postpartum hemorrhage, uterine rupture, prolonged or obstructed labor, postpartum
sepsis, eclampsia/preeclampsia, and first trimester complications requiring surgical interventions (e.g., complicated
abortions and ectopic pregnancies)
Reducing Maternal Mortality in Tanzania: Selected Pregnancy Outcomes in Kigoma Summary
10
faith-based facilities) provided care for an increased proportion of complications (from 9% to 14%, respectively).
Overall, about 16% of all women who delivered in facilities from January–June 2011 to January–June 2013 received care for major direct obstetric complications (Annex A: Table A1).
Met EmONC Need Measuring met need for EmONC provides insight into whether pregnant women can access (due to geographic coverage/proximity) and use EmONC services. WHO recommends the use of this indicator in two settings: EmONC-only facilities and all facilities. Met need is the proportion of women receiving EmONC services for serious obstetric complications among those expected to experience severe pregnancy complications, usually estimated to occur in 15% of pregnancies. WHO recommends that 100% of such women receive treatment in EmONC facilities. The expected number of complicated pregnancies in a population is difficult to ascertain; WHO recommends using the number of live births [estimated by applying the crude birth rate (CBR) to the population of the region] multiplied by .15 as a proxy (WHO, 2009).
2213
2513 2473
2635 2640
36% 41% 40% 42% 42%
0%
10%
20%
30%
40%
50%
60%
70%
80%
90%
100%
0
300
600
900
1200
1500
1800
2100
2400
2700
Jan-Jun 2011 Jul-Dec 2011 Jan-Jun 2012 Jul-Dec 2012 Jan-Jun 2013
Pro
po
rtio
n T
reat
ed
Nu
mb
er
of
Dir
ect
Ob
stet
ric
Co
mp
licat
ion
s
Semester
Figure 3. Number of Direct Obstetric Complications (Including First Trimester Complications) and Met Need for EmONC, EmONC Facilities, January 2011–June 2013
Direct obstetric complications treated in EmOC Met EmONC need
Reducing Maternal Mortality in Tanzania: Selected Pregnancy Outcomes in Kigoma Summary
11
Although the number of EmONC facilities in Kigoma has increased, three out of four districts
have not reached the WHO-recommended minimum per 500,000 population (Table 2). As a
result, met EmONC need in Kigoma Region remains low (Annex A: Table A1).
Direct obstetric complications treated in all facilities (including care provided in dispensaries)
as a proportion of all expected complications was 38% in January–June 2011 and 43% in
January–June 2013 (Annex A: Table A1). Similarly, the met need in EmONC facilities
increased from 36% to 42%, respectively (Figure 3).
Project-supported facilities provide most of the EmONC care in the region. Between 71%
(2011) and 74% (July 2012–June 2013) of the met need for EmONC was accomplished
through emergency obstetric care provided in the project-supported facilities (Annex A:
Table A1). This increase is entirely due to increased CEmONC care in the project-supported
health centers, whose share of complicated deliveries increased from 11% in January–June
2011 to 12% in January–June 2013. Some of the increase may be explained by
redistribution of care from Maweni Regional Hospital to Ujiji Health Center. Most of it,
however, is likely due to better access to CEmONC services for women with severe
pregnancy complications, achieved by upgrading the other five health centers currently
providing EmONC services.
The met need for EmONC was also calculated through care provided only for major direct
obstetric complications occurring during labor, delivery and early postpartum (excluding first
trimester complications related to abortions and ectopic pregnancies). As expected, this
conservative estimate of met obstetric need was lower in all facilities, though gradually
increasing (from 26% in January–June 2011 to 28% in January–June 2013 (Annex A: Table
A2).
Reducing Maternal Mortality in Tanzania: Selected Pregnancy Outcomes in Kigoma Summary
12
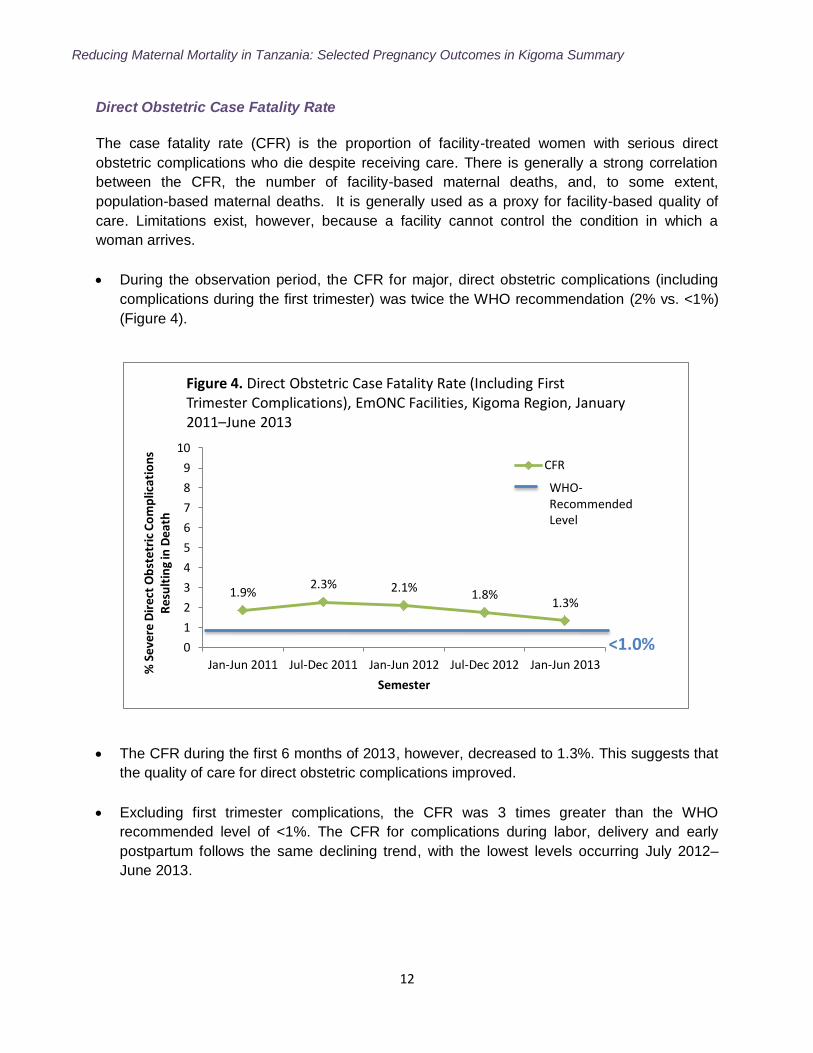
Direct Obstetric Case Fatality Rate
The case fatality rate (CFR) is the proportion of facility-treated women with serious direct
obstetric complications who die despite receiving care. There is generally a strong correlation
between the CFR, the number of facility-based maternal deaths, and, to some extent,
population-based maternal deaths. It is generally used as a proxy for facility-based quality of
care. Limitations exist, however, because a facility cannot control the condition in which a
woman arrives.
During the observation period, the CFR for major, direct obstetric complications (including
complications during the first trimester) was twice the WHO recommendation (2% vs. <1%)
(Figure 4).
The CFR during the first 6 months of 2013, however, decreased to 1.3%. This suggests that
the quality of care for direct obstetric complications improved.
Excluding first trimester complications, the CFR was 3 times greater than the WHO
recommended level of <1%. The CFR for complications during labor, delivery and early
postpartum follows the same declining trend, with the lowest levels occurring July 2012–
June 2013.
1.9% 2.3% 2.1%
1.8% 1.3%
0
1
2
3
4
5
6
7
8
9
10
Jan-Jun 2011 Jul-Dec 2011 Jan-Jun 2012 Jul-Dec 2012 Jan-Jun 2013% S
ever
e D
ire
ct O
bst
etri
c C
om
plic
atio
ns
Res
ult
ing
in D
eath
Semester
Figure 4. Direct Obstetric Case Fatality Rate (Including First Trimester Complications), EmONC Facilities, Kigoma Region, January 2011–June 2013
CFR
WHO-Recommended Level
<1.0%
Reducing Maternal Mortality in Tanzania: Selected Pregnancy Outcomes in Kigoma Summary
13
Institutional Maternal Mortality
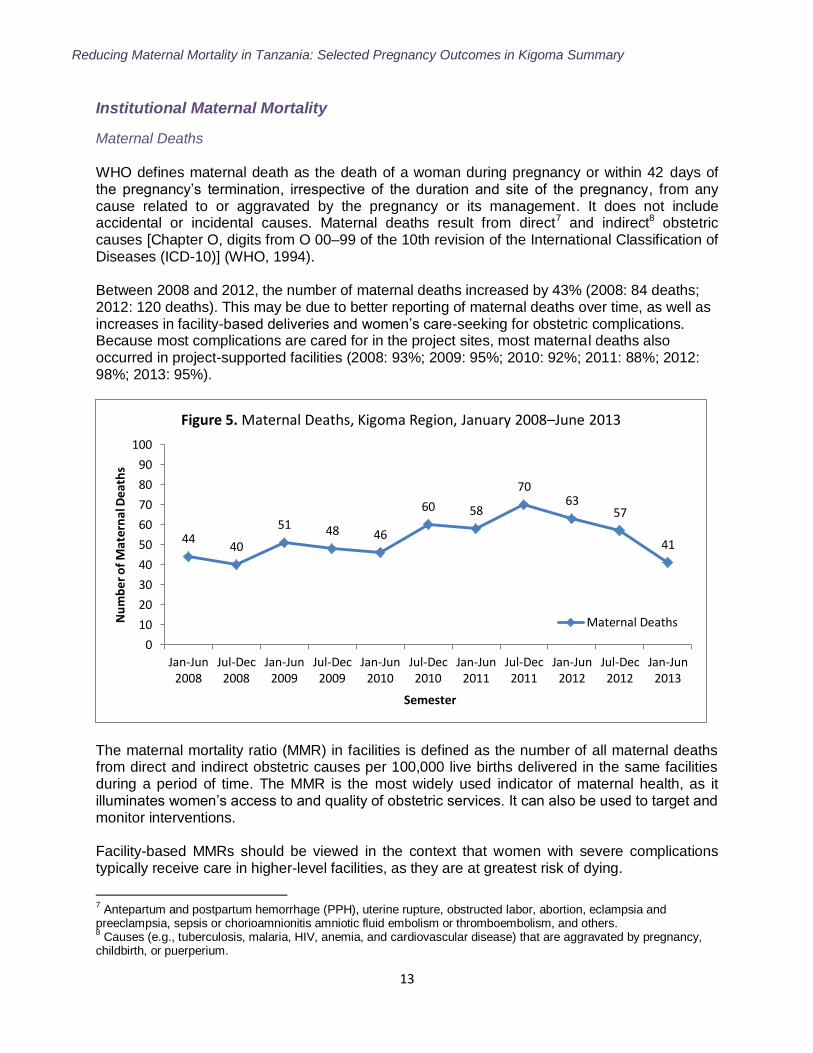
Maternal Deaths
WHO defines maternal death as the death of a woman during pregnancy or within 42 days of the pregnancy‟s termination, irrespective of the duration and site of the pregnancy, from any cause related to or aggravated by the pregnancy or its management. It does not include accidental or incidental causes. Maternal deaths result from direct7 and indirect8 obstetric causes [Chapter O, digits from O 00–99 of the 10th revision of the International Classification of Diseases (ICD-10)] (WHO, 1994). Between 2008 and 2012, the number of maternal deaths increased by 43% (2008: 84 deaths; 2012: 120 deaths). This may be due to better reporting of maternal deaths over time, as well as increases in facility-based deliveries and women‟s care-seeking for obstetric complications. Because most complications are cared for in the project sites, most maternal deaths also occurred in project-supported facilities (2008: 93%; 2009: 95%; 2010: 92%; 2011: 88%; 2012: 98%; 2013: 95%).
The maternal mortality ratio (MMR) in facilities is defined as the number of all maternal deaths from direct and indirect obstetric causes per 100,000 live births delivered in the same facilities during a period of time. The MMR is the most widely used indicator of maternal health, as it illuminates women‟s access to and quality of obstetric services. It can also be used to target and monitor interventions. Facility-based MMRs should be viewed in the context that women with severe complications typically receive care in higher-level facilities, as they are at greatest risk of dying.
7 Antepartum and postpartum hemorrhage (PPH), uterine rupture, obstructed labor, abortion, eclampsia and
preeclampsia, sepsis or chorioamnionitis amniotic fluid embolism or thromboembolism, and others. 8 Causes (e.g., tuberculosis, malaria, HIV, anemia, and cardiovascular disease) that are aggravated by pregnancy,
childbirth, or puerperium.
44 40
51 48 46
60 58
70 63
57
41
0
10
20
30
40
50
60
70
80
90
100
Jan-Jun2008
Jul-Dec2008
Jan-Jun2009
Jul-Dec2009
Jan-Jun2010
Jul-Dec2010
Jan-Jun2011
Jul-Dec2011
Jan-Jun2012
Jul-Dec2012
Jan-Jun2013
Nu
mb
er o
f M
ater
nal
Dea
ths
Semester
Figure 5. Maternal Deaths, Kigoma Region, January 2008–June 2013
Maternal Deaths
Reducing Maternal Mortality in Tanzania: Selected Pregnancy Outcomes in Kigoma Summary
14
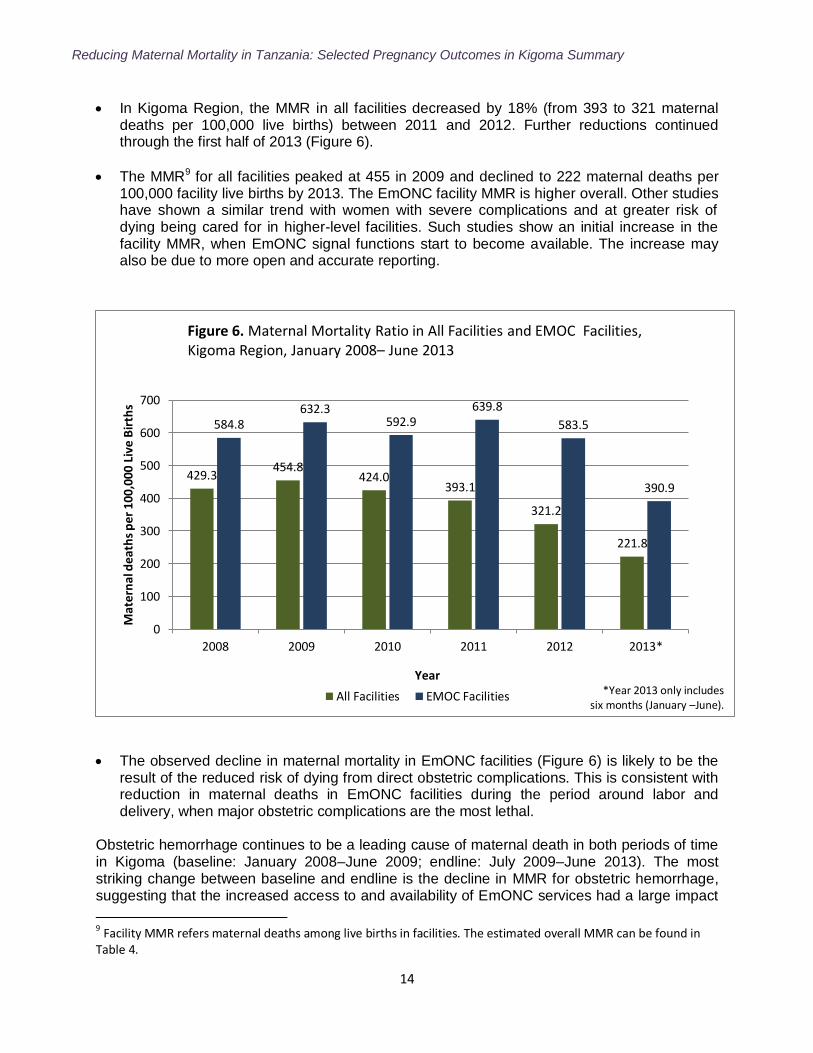
In Kigoma Region, the MMR in all facilities decreased by 18% (from 393 to 321 maternal deaths per 100,000 live births) between 2011 and 2012. Further reductions continued through the first half of 2013 (Figure 6).
The MMR9 for all facilities peaked at 455 in 2009 and declined to 222 maternal deaths per 100,000 facility live births by 2013. The EmONC facility MMR is higher overall. Other studies have shown a similar trend with women with severe complications and at greater risk of dying being cared for in higher-level facilities. Such studies show an initial increase in the facility MMR, when EmONC signal functions start to become available. The increase may also be due to more open and accurate reporting.
The observed decline in maternal mortality in EmONC facilities (Figure 6) is likely to be the result of the reduced risk of dying from direct obstetric complications. This is consistent with reduction in maternal deaths in EmONC facilities during the period around labor and delivery, when major obstetric complications are the most lethal.
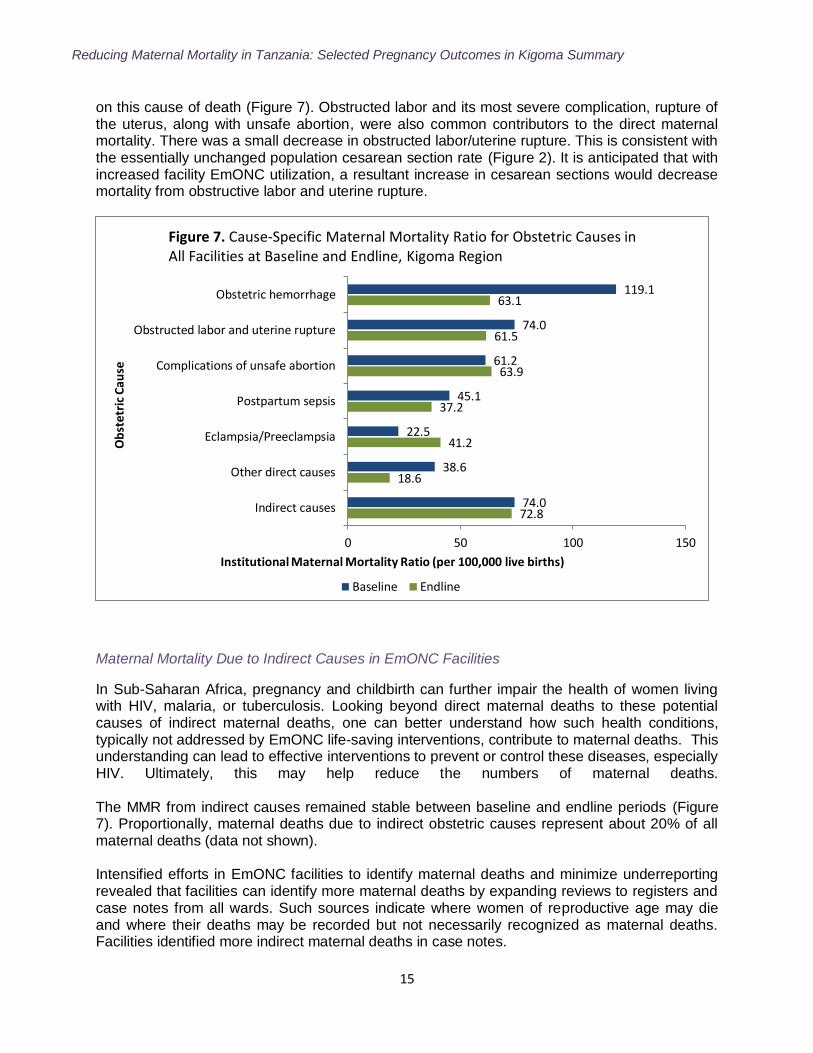
Obstetric hemorrhage continues to be a leading cause of maternal death in both periods of time in Kigoma (baseline: January 2008–June 2009; endline: July 2009–June 2013). The most striking change between baseline and endline is the decline in MMR for obstetric hemorrhage, suggesting that the increased access to and availability of EmONC services had a large impact
9 Facility MMR refers maternal deaths among live births in facilities. The estimated overall MMR can be found in Table 4.
429.3 454.8
424.0 393.1
321.2
221.8
584.8 632.3
592.9 639.8
583.5
390.9
0
100
200
300
400
500
600
700
2008 2009 2010 2011 2012 2013*
Mat
ern
al d
eath
s p
er 1
00,0
00 L
ive
Bir
ths
Year
Figure 6. Maternal Mortality Ratio in All Facilities and EMOC Facilities, Kigoma Region, January 2008– June 2013
All Facilities EMOC Facilities *Year 2013 only includes six months (January –June).
Reducing Maternal Mortality in Tanzania: Selected Pregnancy Outcomes in Kigoma Summary
15
on this cause of death (Figure 7). Obstructed labor and its most severe complication, rupture of the uterus, along with unsafe abortion, were also common contributors to the direct maternal mortality. There was a small decrease in obstructed labor/uterine rupture. This is consistent with the essentially unchanged population cesarean section rate (Figure 2). It is anticipated that with increased facility EmONC utilization, a resultant increase in cesarean sections would decrease mortality from obstructive labor and uterine rupture.
Maternal Mortality Due to Indirect Causes in EmONC Facilities
In Sub-Saharan Africa, pregnancy and childbirth can further impair the health of women living with HIV, malaria, or tuberculosis. Looking beyond direct maternal deaths to these potential causes of indirect maternal deaths, one can better understand how such health conditions, typically not addressed by EmONC life-saving interventions, contribute to maternal deaths. This understanding can lead to effective interventions to prevent or control these diseases, especially HIV. Ultimately, this may help reduce the numbers of maternal deaths. The MMR from indirect causes remained stable between baseline and endline periods (Figure 7). Proportionally, maternal deaths due to indirect obstetric causes represent about 20% of all maternal deaths (data not shown). Intensified efforts in EmONC facilities to identify maternal deaths and minimize underreporting revealed that facilities can identify more maternal deaths by expanding reviews to registers and case notes from all wards. Such sources indicate where women of reproductive age may die and where their deaths may be recorded but not necessarily recognized as maternal deaths. Facilities identified more indirect maternal deaths in case notes.
72.8
18.6
41.2
37.2
63.9
61.5
63.1
74.0
38.6
22.5
45.1
61.2
74.0
119.1
0 50 100 150
Indirect causes
Other direct causes
Eclampsia/Preeclampsia
Postpartum sepsis
Complications of unsafe abortion
Obstructed labor and uterine rupture
Obstetric hemorrhage
Institutional Maternal Mortality Ratio (per 100,000 live births)
Ob
stet
ric
Cau
se
Figure 7. Cause-Specific Maternal Mortality Ratio for Obstetric Causes in All Facilities at Baseline and Endline, Kigoma Region
Baseline Endline
Reducing Maternal Mortality in Tanzania: Selected Pregnancy Outcomes in Kigoma Summary
16
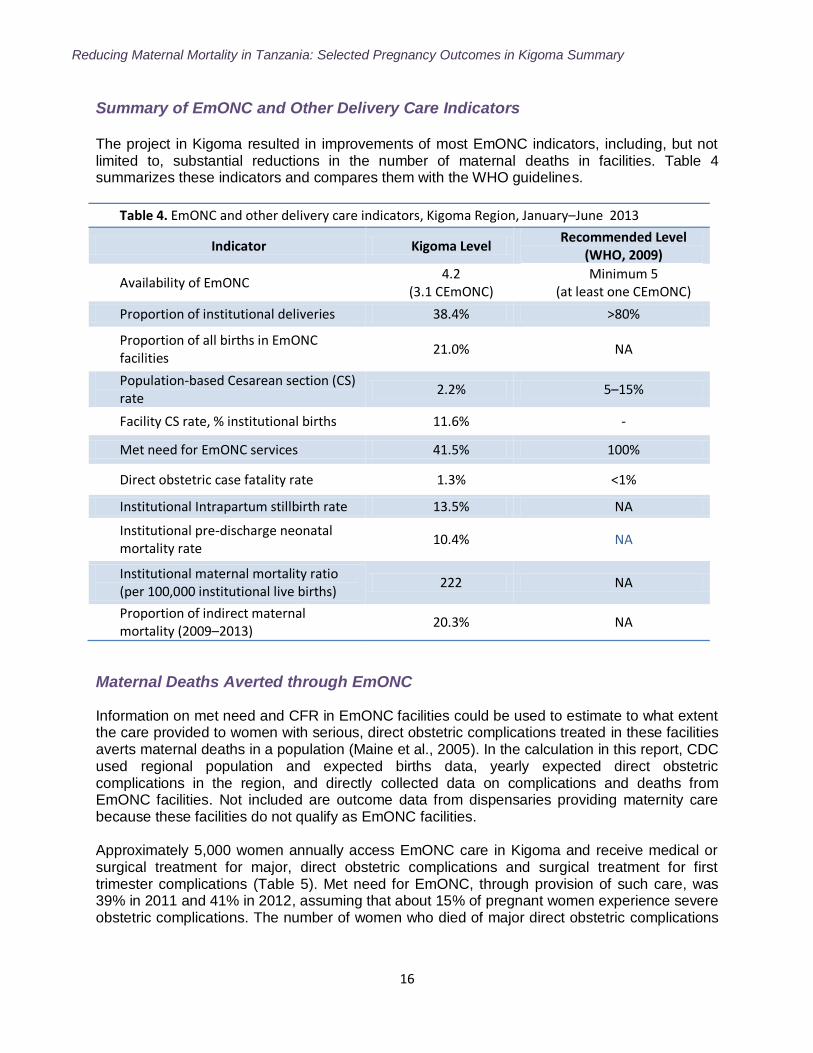
Summary of EmONC and Other Delivery Care Indicators The project in Kigoma resulted in improvements of most EmONC indicators, including, but not limited to, substantial reductions in the number of maternal deaths in facilities. Table 4 summarizes these indicators and compares them with the WHO guidelines.
Table 4. EmONC and other delivery care indicators, Kigoma Region, January–June 2013
Indicator Kigoma Level Recommended Level
(WHO, 2009)
Availability of EmONC 4.2
(3.1 CEmONC) Minimum 5
(at least one CEmONC)
Proportion of institutional deliveries 38.4% >80%
Proportion of all births in EmONC facilities
21.0% NA
Population-based Cesarean section (CS) rate
2.2% 5–15%
Facility CS rate, % institutional births 11.6% -
Met need for EmONC services 41.5% 100%
Direct obstetric case fatality rate 1.3% <1%
Institutional Intrapartum stillbirth rate 13.5% NA
Institutional pre-discharge neonatal mortality rate
10.4% NA
Institutional maternal mortality ratio (per 100,000 institutional live births)
222 NA
Proportion of indirect maternal mortality (2009–2013)
20.3% NA
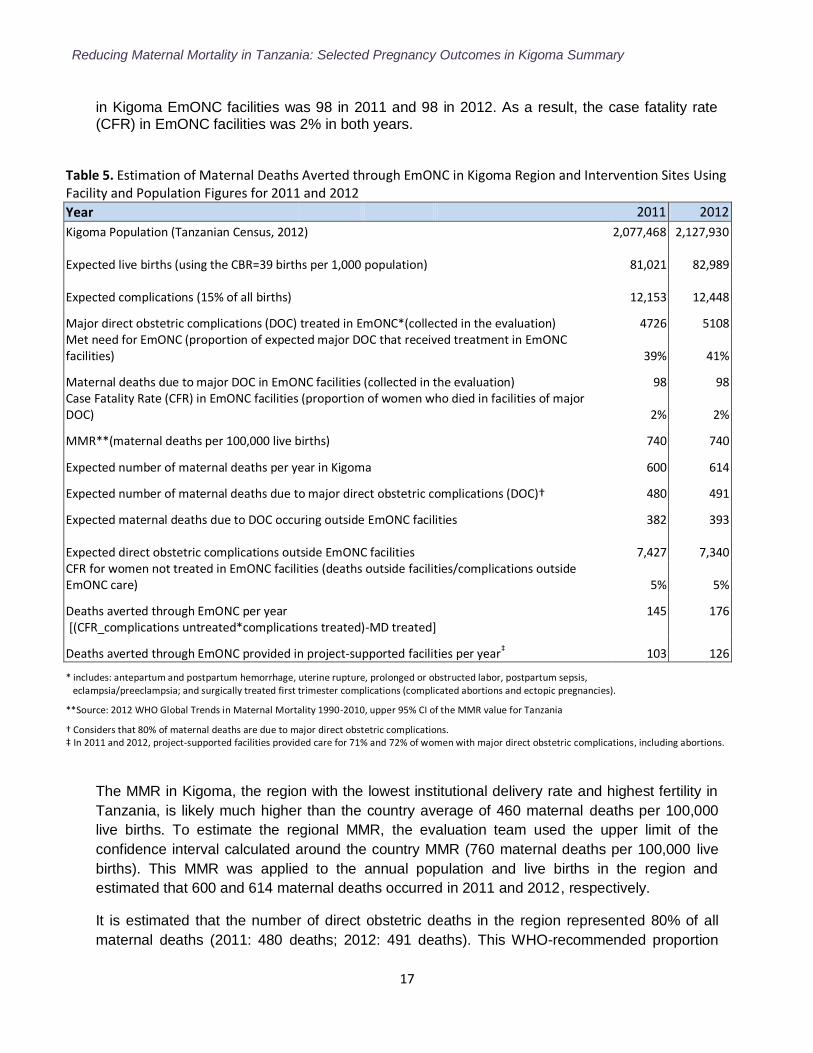
Maternal Deaths Averted through EmONC
Information on met need and CFR in EmONC facilities could be used to estimate to what extent the care provided to women with serious, direct obstetric complications treated in these facilities averts maternal deaths in a population (Maine et al., 2005). In the calculation in this report, CDC used regional population and expected births data, yearly expected direct obstetric complications in the region, and directly collected data on complications and deaths from EmONC facilities. Not included are outcome data from dispensaries providing maternity care because these facilities do not qualify as EmONC facilities. Approximately 5,000 women annually access EmONC care in Kigoma and receive medical or surgical treatment for major, direct obstetric complications and surgical treatment for first trimester complications (Table 5). Met need for EmONC, through provision of such care, was 39% in 2011 and 41% in 2012, assuming that about 15% of pregnant women experience severe obstetric complications. The number of women who died of major direct obstetric complications
Reducing Maternal Mortality in Tanzania: Selected Pregnancy Outcomes in Kigoma Summary
17
in Kigoma EmONC facilities was 98 in 2011 and 98 in 2012. As a result, the case fatality rate (CFR) in EmONC facilities was 2% in both years.
Table 5. Estimation of Maternal Deaths Averted through EmONC in Kigoma Region and Intervention Sites Using Facility and Population Figures for 2011 and 2012
Year 2011 2012
Kigoma Population (Tanzanian Census, 2012) 2,077,468 2,127,930
Expected live births (using the CBR=39 births per 1,000 population)
81,021
82,989
Expected complications (15% of all births)
12,153
12,448
Major direct obstetric complications (DOC) treated in EmONC*(collected in the evaluation) 4726 5108 Met need for EmONC (proportion of expected major DOC that received treatment in EmONC facilities) 39% 41%
Maternal deaths due to major DOC in EmONC facilities (collected in the evaluation) 98 98 Case Fatality Rate (CFR) in EmONC facilities (proportion of women who died in facilities of major DOC) 2% 2%
MMR**(maternal deaths per 100,000 live births)
740 740
Expected number of maternal deaths per year in Kigoma
600 614
Expected number of maternal deaths due to major direct obstetric complications (DOC)† 480 491
Expected maternal deaths due to DOC occuring outside EmONC facilities 382 393
Expected direct obstetric complications outside EmONC facilities
7,427
7,340 CFR for women not treated in EmONC facilities (deaths outside facilities/complications outside EmONC care) 5% 5%
Deaths averted through EmONC per year
145 176 [(CFR_complications untreated*complications treated)-MD treated]
Deaths averted through EmONC provided in project-supported facilities per year‡ 103 126
* includes: antepartum and postpartum hemorrhage, uterine rupture, prolonged or obstructed labor, postpartum sepsis, eclampsia/preeclampsia; and surgically treated first trimester complications (complicated abortions and ectopic pregnancies).
**Source: 2012 WHO Global Trends in Maternal Mortality 1990-2010, upper 95% CI of the MMR value for Tanzania
† Considers that 80% of maternal deaths are due to major direct obstetric complications. ‡ In 2011 and 2012, project-supported facilities provided care for 71% and 72% of women with major direct obstetric complications, including abortions.
The MMR in Kigoma, the region with the lowest institutional delivery rate and highest fertility in
Tanzania, is likely much higher than the country average of 460 maternal deaths per 100,000
live births. To estimate the regional MMR, the evaluation team used the upper limit of the
confidence interval calculated around the country MMR (760 maternal deaths per 100,000 live
births). This MMR was applied to the annual population and live births in the region and
estimated that 600 and 614 maternal deaths occurred in 2011 and 2012, respectively.
It is estimated that the number of direct obstetric deaths in the region represented 80% of all
maternal deaths (2011: 480 deaths; 2012: 491 deaths). This WHO-recommended proportion
Reducing Maternal Mortality in Tanzania: Selected Pregnancy Outcomes in Kigoma Summary
18
was confirmed in our cause-specific analysis of maternal deaths in Kigoma facilities. By
subtracting the maternal deaths in EmONC facilities from the total estimated maternal deaths
due to direct obstetric complications, approximately 382 and 393 maternal deaths occurred
outside EmONC facilities in 2011 and 2012.
The deaths occurring among women with obstetric complications who did not access EmONC
services were compared with the estimated number of women with such complications who did
not access EmONC care (calculated as the difference between expected direct obstetric
complications and complications documented as being treated in EmONC facilities). Women not
accessing care experienced a CFR 2.5 times higher than women with complications who
received care in EmONC facilities (5% vs. 2%).
To estimate the maternal deaths averted through care in EmONC facilities, the evaluation team
first applied the CFR of women with untreated complications to the number of women who
received EmONC care for direct obstetric complications. This yields the number of maternal
deaths expected to have occurred in the population had EmONC not been available [2011: 243
maternal deaths (5% of 4,726 complications); 2012: 274 maternal deaths (5% of 5,108
complications)].
Each year, however, an estimated 98 women died as a result of direct obstetric causes, despite
receiving EmONC care. The number of institutional EmONC direct maternal deaths were thus
subtracted from the hypothetical deaths averted, yielding the following total of maternal deaths
averted through EmONC services:
2011: 243 – 98 = 145
2012: 274 – 98 = 176
Project-supported facilities provide care for over 70% of women with major direct obstetric
complications who had accessed care (3,354 and 3,672 women in 2011 and 2012, respectively)
(Annex A: Table A1). In 2011 and 2012, 103 and 126 maternal lives were saved through care
provided in project-supported facilities, respectively (Table 4). For each maternal death averted,
over 30 major direct obstetric complications were successfully treated.
Reducing Maternal Mortality in Tanzania: Selected Pregnancy Outcomes in Kigoma Summary
19
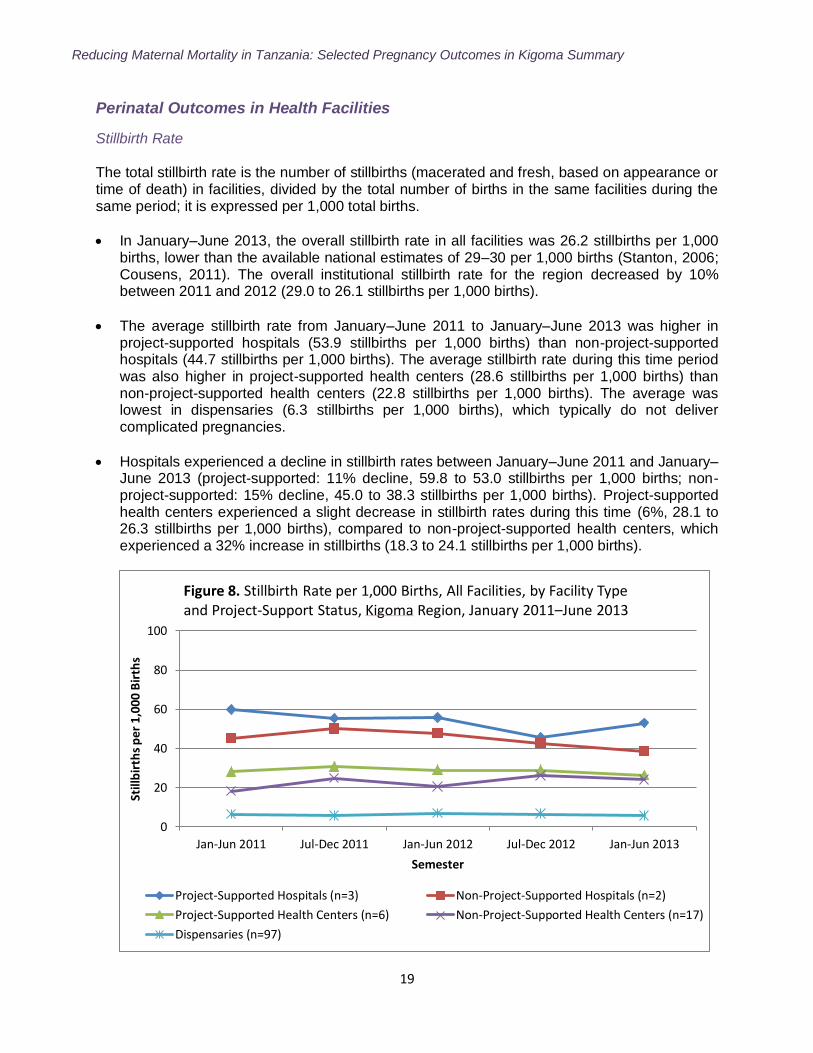
Perinatal Outcomes in Health Facilities
Stillbirth Rate
The total stillbirth rate is the number of stillbirths (macerated and fresh, based on appearance or time of death) in facilities, divided by the total number of births in the same facilities during the same period; it is expressed per 1,000 total births.
In January–June 2013, the overall stillbirth rate in all facilities was 26.2 stillbirths per 1,000 births, lower than the available national estimates of 29–30 per 1,000 births (Stanton, 2006; Cousens, 2011). The overall institutional stillbirth rate for the region decreased by 10% between 2011 and 2012 (29.0 to 26.1 stillbirths per 1,000 births).
The average stillbirth rate from January–June 2011 to January–June 2013 was higher in project-supported hospitals (53.9 stillbirths per 1,000 births) than non-project-supported hospitals (44.7 stillbirths per 1,000 births). The average stillbirth rate during this time period was also higher in project-supported health centers (28.6 stillbirths per 1,000 births) than non-project-supported health centers (22.8 stillbirths per 1,000 births). The average was lowest in dispensaries (6.3 stillbirths per 1,000 births), which typically do not deliver complicated pregnancies.
Hospitals experienced a decline in stillbirth rates between January–June 2011 and January–June 2013 (project-supported: 11% decline, 59.8 to 53.0 stillbirths per 1,000 births; non-project-supported: 15% decline, 45.0 to 38.3 stillbirths per 1,000 births). Project-supported health centers experienced a slight decrease in stillbirth rates during this time (6%, 28.1 to 26.3 stillbirths per 1,000 births), compared to non-project-supported health centers, which experienced a 32% increase in stillbirths (18.3 to 24.1 stillbirths per 1,000 births).
0
20
40
60
80
100
Jan-Jun 2011 Jul-Dec 2011 Jan-Jun 2012 Jul-Dec 2012 Jan-Jun 2013
Still
bir
ths
per
1,0
00 B
irth
s
Semester
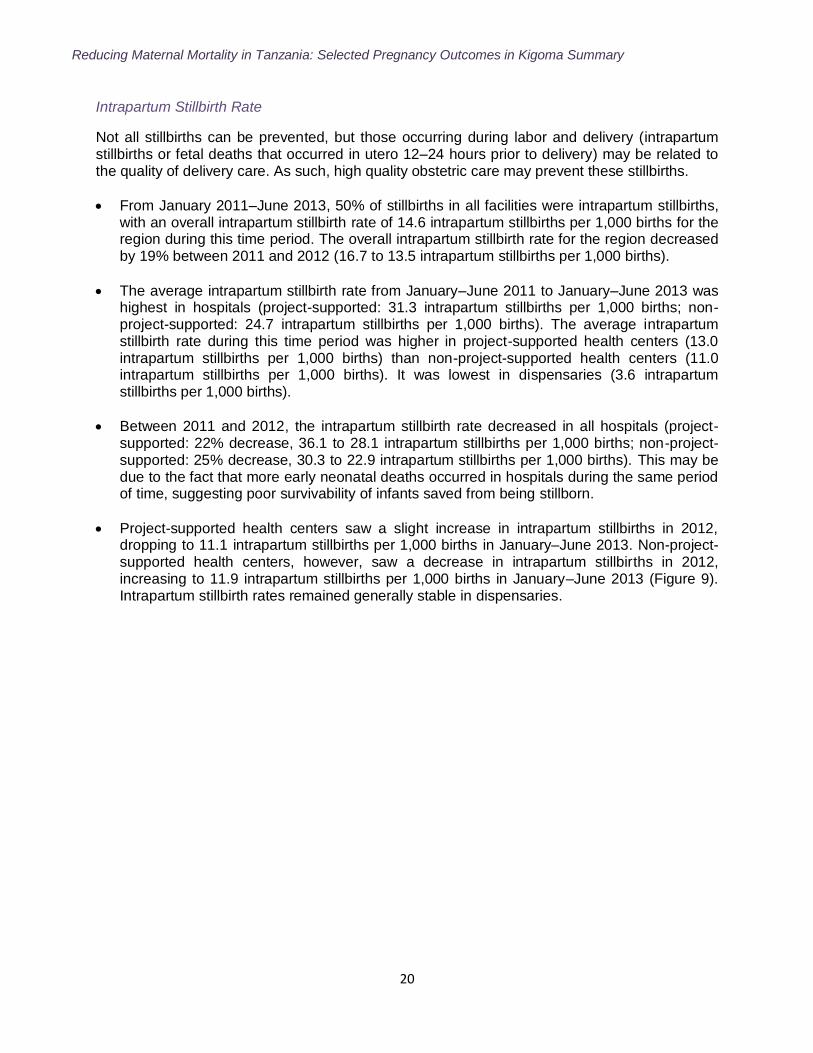
Figure 8. Stillbirth Rate per 1,000 Births, All Facilities, by Facility Type and Project-Support Status, Kigoma Region, January 2011–June 2013
Project-Supported Hospitals (n=3) Non-Project-Supported Hospitals (n=2)
Project-Supported Health Centers (n=6) Non-Project-Supported Health Centers (n=17)
Dispensaries (n=97)
Reducing Maternal Mortality in Tanzania: Selected Pregnancy Outcomes in Kigoma Summary
20
Intrapartum Stillbirth Rate
Not all stillbirths can be prevented, but those occurring during labor and delivery (intrapartum stillbirths or fetal deaths that occurred in utero 12–24 hours prior to delivery) may be related to the quality of delivery care. As such, high quality obstetric care may prevent these stillbirths.
From January 2011–June 2013, 50% of stillbirths in all facilities were intrapartum stillbirths, with an overall intrapartum stillbirth rate of 14.6 intrapartum stillbirths per 1,000 births for the region during this time period. The overall intrapartum stillbirth rate for the region decreased by 19% between 2011 and 2012 (16.7 to 13.5 intrapartum stillbirths per 1,000 births).
The average intrapartum stillbirth rate from January–June 2011 to January–June 2013 was highest in hospitals (project-supported: 31.3 intrapartum stillbirths per 1,000 births; non-project-supported: 24.7 intrapartum stillbirths per 1,000 births). The average intrapartum stillbirth rate during this time period was higher in project-supported health centers (13.0 intrapartum stillbirths per 1,000 births) than non-project-supported health centers (11.0 intrapartum stillbirths per 1,000 births). It was lowest in dispensaries (3.6 intrapartum stillbirths per 1,000 births).
Between 2011 and 2012, the intrapartum stillbirth rate decreased in all hospitals (project-supported: 22% decrease, 36.1 to 28.1 intrapartum stillbirths per 1,000 births; non-project-supported: 25% decrease, 30.3 to 22.9 intrapartum stillbirths per 1,000 births). This may be due to the fact that more early neonatal deaths occurred in hospitals during the same period of time, suggesting poor survivability of infants saved from being stillborn.
Project-supported health centers saw a slight increase in intrapartum stillbirths in 2012, dropping to 11.1 intrapartum stillbirths per 1,000 births in January–June 2013. Non-project-supported health centers, however, saw a decrease in intrapartum stillbirths in 2012, increasing to 11.9 intrapartum stillbirths per 1,000 births in January–June 2013 (Figure 9). Intrapartum stillbirth rates remained generally stable in dispensaries.
Reducing Maternal Mortality in Tanzania: Selected Pregnancy Outcomes in Kigoma Summary
21
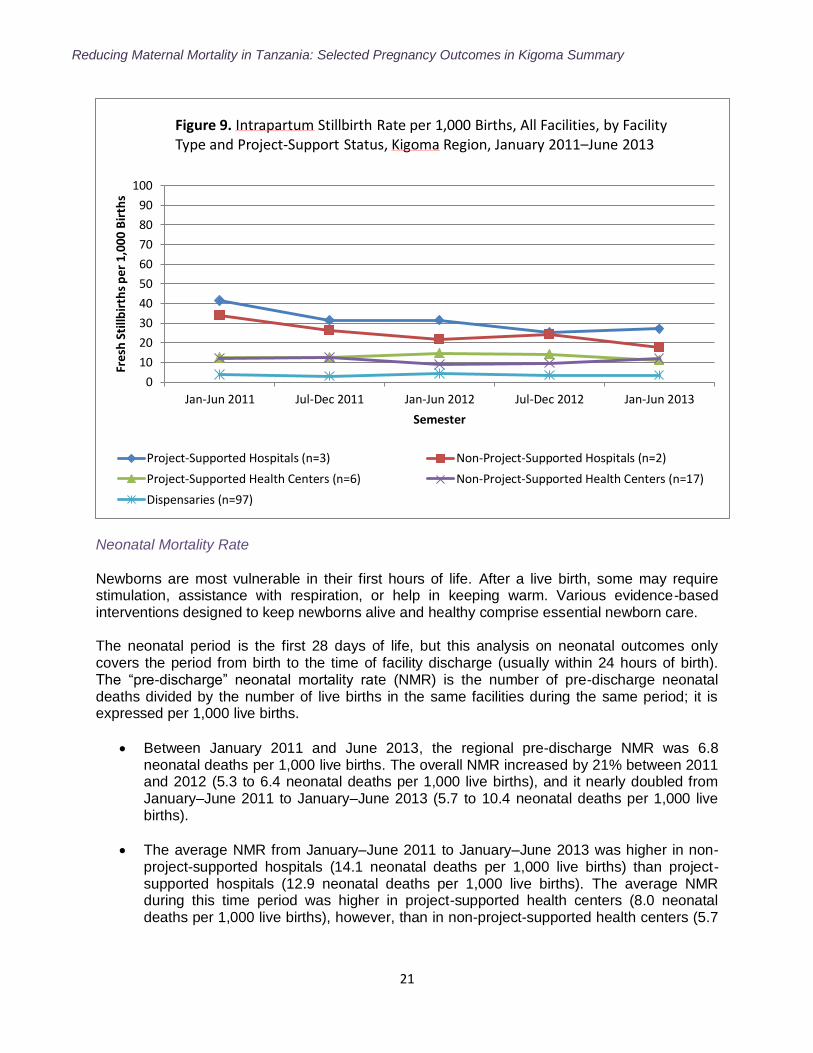
Neonatal Mortality Rate
Newborns are most vulnerable in their first hours of life. After a live birth, some may require stimulation, assistance with respiration, or help in keeping warm. Various evidence-based interventions designed to keep newborns alive and healthy comprise essential newborn care. The neonatal period is the first 28 days of life, but this analysis on neonatal outcomes only covers the period from birth to the time of facility discharge (usually within 24 hours of birth). The “pre-discharge” neonatal mortality rate (NMR) is the number of pre-discharge neonatal deaths divided by the number of live births in the same facilities during the same period; it is expressed per 1,000 live births.
Between January 2011 and June 2013, the regional pre-discharge NMR was 6.8 neonatal deaths per 1,000 live births. The overall NMR increased by 21% between 2011 and 2012 (5.3 to 6.4 neonatal deaths per 1,000 live births), and it nearly doubled from January–June 2011 to January–June 2013 (5.7 to 10.4 neonatal deaths per 1,000 live births).
The average NMR from January–June 2011 to January–June 2013 was higher in non-project-supported hospitals (14.1 neonatal deaths per 1,000 live births) than project-supported hospitals (12.9 neonatal deaths per 1,000 live births). The average NMR during this time period was higher in project-supported health centers (8.0 neonatal deaths per 1,000 live births), however, than in non-project-supported health centers (5.7
0
10
20
30
40
50
60
70
80
90
100
Jan-Jun 2011 Jul-Dec 2011 Jan-Jun 2012 Jul-Dec 2012 Jan-Jun 2013
Fre
sh S
tillb
irth
s p
er 1
,000
Bir
ths
Semester
Figure 9. Intrapartum Stillbirth Rate per 1,000 Births, All Facilities, by Facility Type and Project-Support Status, Kigoma Region, January 2011–June 2013
Project-Supported Hospitals (n=3) Non-Project-Supported Hospitals (n=2)
Project-Supported Health Centers (n=6) Non-Project-Supported Health Centers (n=17)
Dispensaries (n=97)
Reducing Maternal Mortality in Tanzania: Selected Pregnancy Outcomes in Kigoma Summary
22
neonatal deaths per 1,000 live births). It was lowest in dispensaries (1.4 neonatal deaths per 1,000 live births).
Between 2011 and 2012, the overall pre-discharge neonatal mortality rate increased by 21% in Kigoma (5.3 to 6.4 neonatal deaths per 1,000 live births). Project-supported hospitals experienced a 63% increase in the neonatal mortality rate (7.5 to 12.2 neonatal deaths per 1,000 live births). Non-project-supported hospitals, however, experienced a 15% decrease (15.0 to 12.8 neonatal deaths per 1,000 live births). Project-supported health centers experienced a 58% increase in neonatal deaths (5.7 to 9.0 neonatal deaths per 1,000 live births), while the rates in non-project-supported health centers declined (6.0 to 5.0 neonatal deaths per 1,000 live births).
0
5
10
15
20
25
30
35
40
Jan-Jun 2011 Jul-Dec 2011 Jan-Jun 2012 Jul-Dec 2012 Jan-Jun 2013
Neo
nat
al D
eath
s p
er 1
,000
Liv
e B
irth
s
Semester
Figure 10. Neonatal Death Rate per 1,000 Live Births, All Facilities, by Facility Type and BP-Support Status, Kigoma Region, January 2011–June 2013
BP-Supported Hospitals (n=3) Non-BP-Supported Hospitals (n=2)
BP-Supported Health Centers (n=6) Non-BP-Supported Health Centers (n=17)
Dispensaries (n=97)
Reducing Maternal Mortality in Tanzania: Selected Pregnancy Outcomes in Kigoma Summary
23
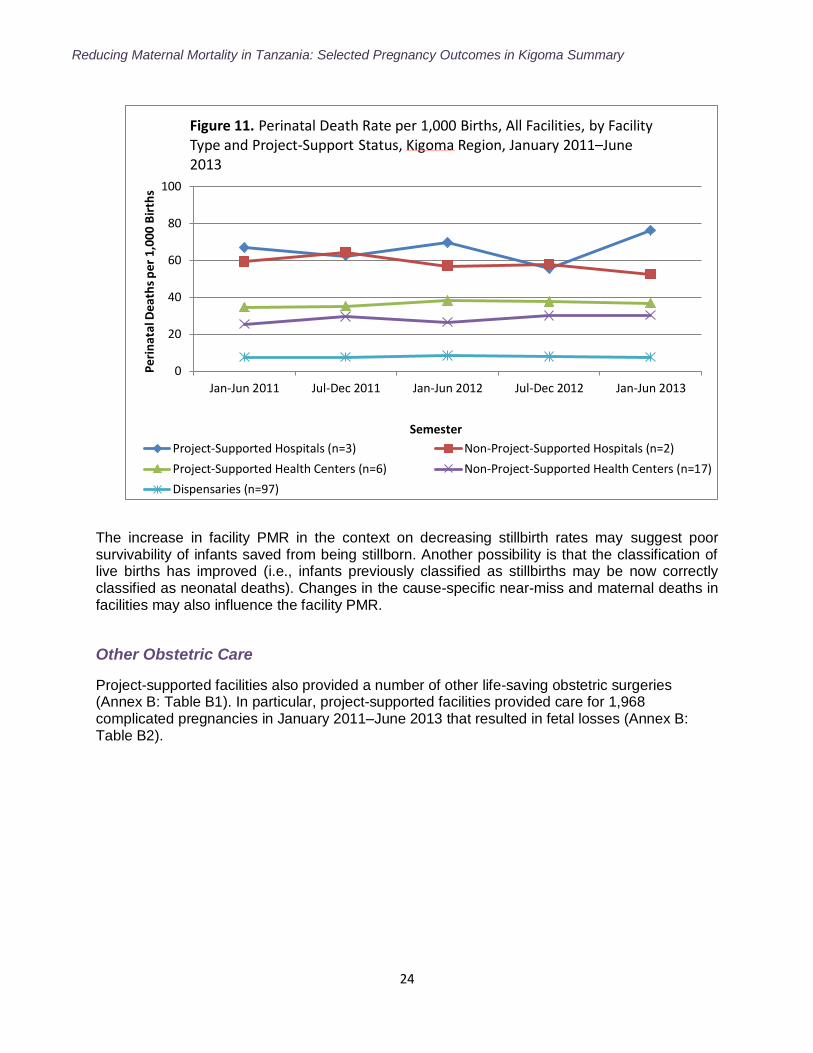
Perinatal Mortality Rate
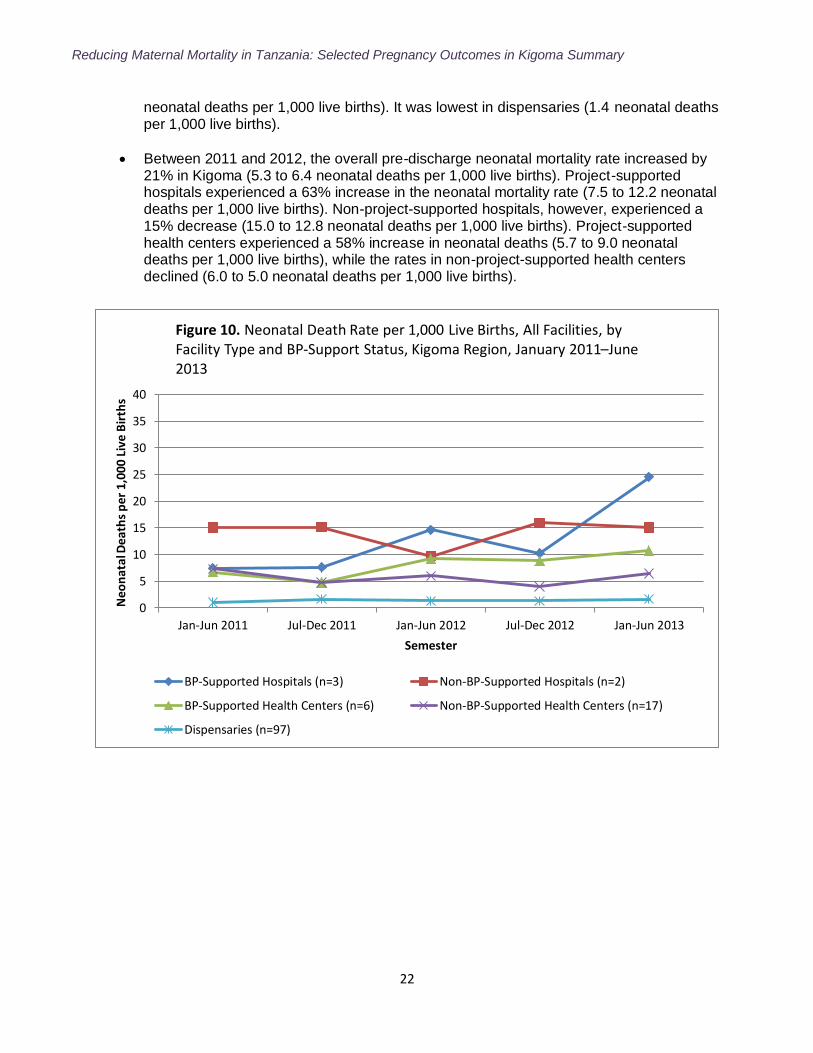
The perinatal mortality rate (PMR) includes both stillbirths and neonatal deaths, providing an overall understanding of what happens to a baby before labor, through labor and delivery, and after its birth. Both stillbirths and neonatal deaths are included to minimize the impact of misclassification (i.e., stillbirth instead of live birth resulting in neonatal death), thus capturing all deaths, regardless of whether they happened before or after delivery. PMR thus serves as an overall measure of the obstetric care provided around delivery and related outcomes. The PMR is the number of stillbirths and pre-discharge neonatal deaths divided by the total number of births in the same facilities; it is expressed as per 1,000 total births. Use of the PMR also provides insight into the holistic impact of perinatal interventions. Rather than focusing on outcomes of stillbirths versus neonatal deaths, the PMR integrates the natural continuum between the periods when stillbirths and neonatal deaths occur. This is important for those perinatal interventions successful in reducing stillbirths but unsuccessful in improving neonatal survival of those live-born babies who were “saved” from stillbirth. The PMR still captures these “delayed” deaths.
The overall regional PMR from January 2011–June 2013 was 33.9 perinatal deaths per 1,000 births. Between January–June 2011 and January–June 2013, the overall institutional PMR increased from 33.8 to 36.3 perinatal deaths per 1,000 births (7% increase).The overall PMR increased by 6% between 2011 and 2012 (34.2 to 32.3 perinatal deaths per 1,000 births).
The average PMR from January–June 2011 to January–June 2013 was higher in project-supported hospitals (66.0 perinatal deaths per 1,000 births) than non-project-supported hospitals (58.1 perinatal deaths per 1,000 births). The average PMR during this time period was higher in project-supported health centers (36.4 perinatal deaths per 1,000 births) than non-project-supported health centers (28.3 perinatal deaths per 1,000 births). It was lowest in dispensaries (7.7 perinatal deaths per 1,000 births).
The PMR increased by 38% in project-supported hospitals and decreased by 9% in non-project-supported hospitals in the last two semesters (July–December 2012: 55.4 and 57.8 perinatal deaths per 1,000 births, respectively; January–June 2013: 76.2 and 52.7 perinatal deaths per 1,000 births, respectively) (Figure 11). The PMR in the two other hospitals (both faith-based hospitals) declined slightly (Figure 11).
In project-supported health centers, the PMR increased between 2011 and 2012 (35.2 and 38 perinatal deaths per 1,000 births in July–December 2011 and January–June 2012, respectively) but decreased after the first semester of 2012 (37.5 and 36.7 perinatal deaths per 1,000 births in July–December 2012 and January–June 2013, respectively) (Figure 11). Non-project-supported health centers, however, saw opposite trends; the PMR decreased between 2011 and 2012 (29.4 and 26.4 perinatal deaths per 1,000 births in July–December 2011 and January–June 2012, respectively) and increased after the first semester of 2012 (30 and 30.3 perinatal deaths per 1,000 births in July–December 2012 and January–June 2013, respectively) (Figure 11).
Reducing Maternal Mortality in Tanzania: Selected Pregnancy Outcomes in Kigoma Summary
24
0
20
40
60
80
100
Jan-Jun 2011 Jul-Dec 2011 Jan-Jun 2012 Jul-Dec 2012 Jan-Jun 2013
Pe
rin
atal
De
ath
s p
er
1,00
0 B
irth
s
Semester
Figure 11. Perinatal Death Rate per 1,000 Births, All Facilities, by Facility Type and Project-Support Status, Kigoma Region, January 2011–June 2013
Project-Supported Hospitals (n=3) Non-Project-Supported Hospitals (n=2)
Project-Supported Health Centers (n=6) Non-Project-Supported Health Centers (n=17)
Dispensaries (n=97)
The increase in facility PMR in the context on decreasing stillbirth rates may suggest poor survivability of infants saved from being stillborn. Another possibility is that the classification of live births has improved (i.e., infants previously classified as stillbirths may be now correctly classified as neonatal deaths). Changes in the cause-specific near-miss and maternal deaths in facilities may also influence the facility PMR.
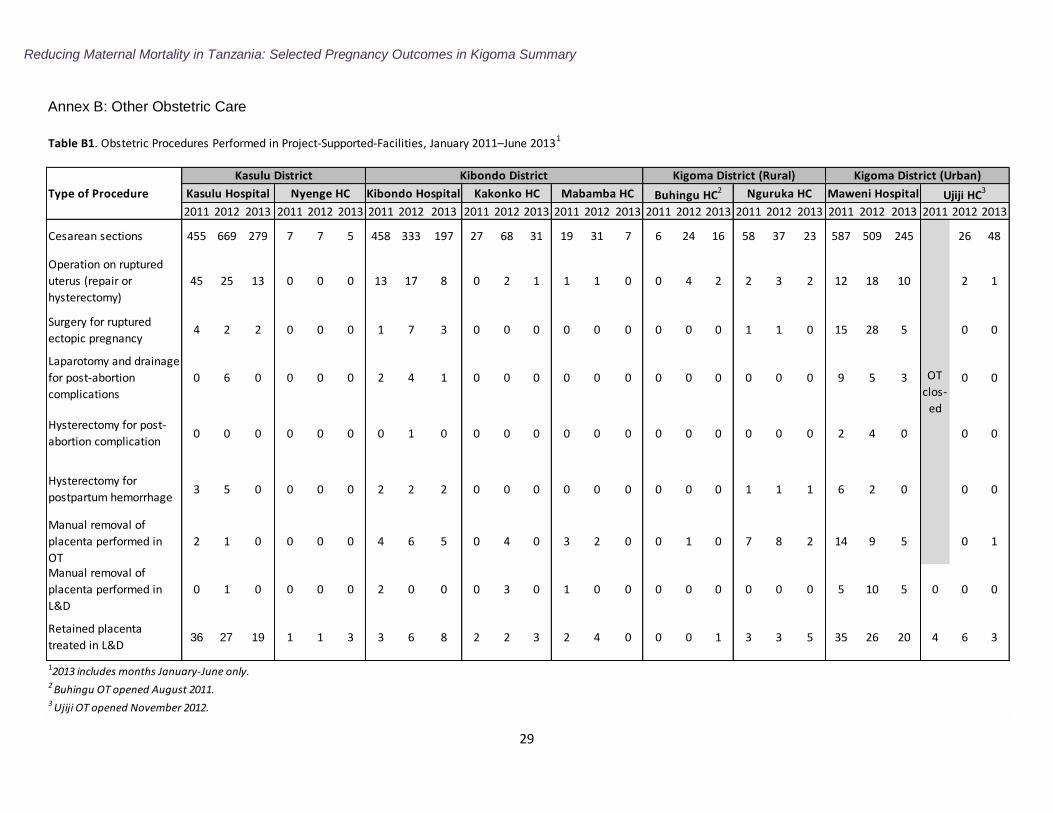
Other Obstetric Care
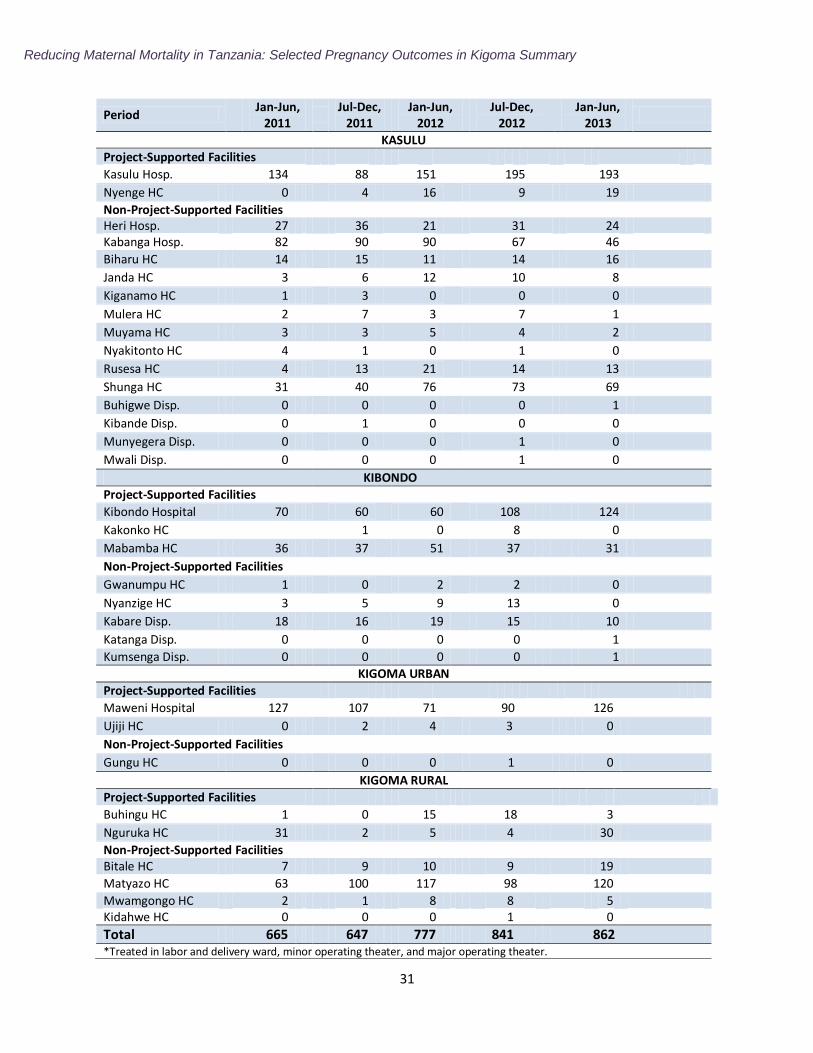
Project-supported facilities also provided a number of other life-saving obstetric surgeries (Annex B: Table B1). In particular, project-supported facilities provided care for 1,968 complicated pregnancies in January 2011–June 2013 that resulted in fetal losses (Annex B: Table B2).
Reducing Maternal Mortality in Tanzania: Selected Pregnancy Outcomes in Kigoma Summary
25
Implications and Recommendations
To help sustain maternal health initiatives in Kigoma Region, a taskforce of partners should be established. The taskforce should bring together public agencies and private organizations in a partnership aiming to: meet regularly to assess progress of maternal health activities, monitor the initiatives‟ cost-effectiveness, reduce duplication of activities, and ensure sharing of resources and information.
Given the continued low rate of institutional deliveries in Kigoma Region, qualitative approaches should explore factors (e.g., logistical, personal, political, religious) preventing women from seeking and accessing facility-based care. Additionally, community outreach activities should be undertaken to educate community members about available health facility services and encourage use of such facilities for perinatal care and delivery.
In conjunction with community outreach activities, health facilities must increase their capacity to treat the increasing the number of patients seeking facility-based care. This could include increased numbers of medical staff, beds, and delivery kits and medications, as well as continuous on-the-job education and supervision and improved quality of care assurance practices. Dispensaries experienced an increase in facility deliveries, as they are the most geographically accessible to women. Thus, interventions to improve quality of care must occur at all levels, including the dispensary level.
The documented increase in volume and complexity of delivery care should be considered for procurement and logistics related to equipment, supplies, essential drugs and blood, infrastructure maintenance, and human resources allocation.
Improving transportation availability and accessibility could contribute to increased institutional deliveries and decreased maternal and perinatal mortality, as it would decrease care-seeking delays (e.g., travel time to facility). Most transport delays can be addressed by a combination of community mobilization activities and an effectively linked communications system that ties all components of the healthcare system together. Establishing a point of contact in each community to alert facilities of incoming complicated deliveries and designated emergency transport pathways between facilities is also an effective approach.
Protocols should be introduced for emergency transport at the lower-level facilities and case management guidelines and drills for immediate care of severe obstetric complications at in-referral facilities. Future studies should assess the protocols and effectiveness of emergency referrals between low- and high-level health facilities in ensuring that women with obstetric complications benefit from timely access the EmONC services. Such assessments should explore the ability of low-level facilities‟ personnel to diagnose severe obstetric complications, their knowledge of where and when to refer, how to stabilize them before transport, as well as how to communicate, organize, and get feedback on referrals.
The current availability of EmONC facilities does not meet the WHO recommendation, given the minimal number of BEmONC facilities. As Kigoma Region currently meets the WHO recommendation of one CEmONC facility per 500,000 population, interventions should prioritize scaling up quality BEmONC services.
Reducing Maternal Mortality in Tanzania: Selected Pregnancy Outcomes in Kigoma Summary
26
The project should consider developing a rotation for midwives in remote areas to practice obstetric skills at facilities with a higher number of severe obstetric cases. The project
should also consider supporting low-technology, simulation‐based EmONC practice.
Given the low C-section rate and high perinatal mortality and case fatality rates, capacity to perform quality obstetric surgeries in the project sites should be strengthened. Such efforts should include increased availability of clean surgical equipment, surgical checklists, surgical training of medical personnel, and supportive supervision.
Develop concrete steps in facilities to utilize the results of reviews of near-miss obstetric deaths and maternal deaths (i.e., maternal death reviews and World Lung Foundation audits) to identify gaps, improve the quality of obstetric care, and mobilize political will and commitments at the district and regional level.
Pre-discharge neonatal mortality remains high, indicating the need for better monitoring of intrapartum hypoxia (reduction of oxygen to body‟s tissue), increased capacity to perform C-sections, and improved use of protocols for neonatal resuscitation.
Improve the quality of facility-based maternal and perinatal health outcome data and the facility‟s ability to utilize them in decision-making. This would entail training on key quality-of-care indicators, as well as data interpretation and understanding the relevance and use of accurate information for identifying gaps, mobilizing and allocating resources, and monitoring and evaluating changes.
Reducing Maternal Mortality in Tanzania: Selected Pregnancy Outcomes in Kigoma Summary
27
References
1. World Health Organization. Trends in maternal mortality: 1990 to 2013 Estimates by WHO,
UNICEF, UNFPA, The World Bank and the United Nations Population Division. Geneva: World Health Organization, May 2014.
2. The United Republic of Tanzania National Ministry of Health and Social Welfare, The
National Road Map Strategic Plan to Accelerate Reduction of Maternal Newborn and Child Deaths in Tanzania 2008–2015, Sharpened One Plan, April 2014.
3. The United Republic of Tanzania National Bureau of Statistics (NBS) and Office of Chief
Government Statistician. 2012 Population and Housing Census. Dar es Salaam and Zanzibar: NBS and Office of Chief Government Statistician, March 2013.
4. The United Republic of Tanzania National Bureau of Statistics (NBS) and ICF Macro. Tanzania Demographic and Health Survey 2010. Dar es Salaam: NBS and ICF Macro, April 2011.
5. Immpact. Rapid ascertainment process for institutional deaths (RAPID). Module 4, Tool 2. In: Immpact Toolkit: A Guide and Tools for Maternal Mortality Program Assessment. Aberdeen, Scotland: University of Aberdeen; 2007.
6. Singh S, Darroch J, Ashford L, Vlassoff M. Adding it Up: The Costs and Benefits of Investing
in Family Planning and Maternal and Newborn Health. New York. Guttmacher Institute and
United Nations Population Fund, 2009. 7. World Health Organization (WHO). Monitoring Emergency Obstetric Care: A Handbook.
2009.
8. Stanton C, et al. Stillbirth rates: delivering estimates in 190 countries. Lancet. 2006; 367:1487–94.
9. Cousens S, et al. National, regional, and worldwide estimates of stillbirth rates in 2009 with trends since 1995: a systematic analysis. Lancet. 2011; 377:1319-30.
10. World Health Organization. ICD-10. http://www.who.int/classifications/icd/en/. 1994.
11. Maine D, Paxton A, Bailey P, Patterson G. Estimating maternal deaths averted: A field-
based methodology. International Journal of Gynecology and Obstetrics 2005; 89: 218–220.
Reducing Maternal Mortality in Tanzania: Selected Pregnancy Outcomes in Kigoma Summary
28
Table A1
Distribution of Direct Obstetric Complications, Including First Trimester Complications, by Type of Treating Facility, 2011–2013
Facility Type
Complications as
proportion of
total deliveries
Proportion of
expected
complications
treated†
Complications as
proportion of total
deliveries
Proportion of
expected
complications
treated†
Complications as
proportion of
total deliveries
Proportion of
expected
complications
treated†
Complications as
proportion of
total deliveries
Proportion of
expected
complications
treated†
Complications as
proportion of
total deliveries
Proportion of
expected
complications
treated†
N (%) (%) (%) N (%) (%) (%) N (%) (%) (%) N (%) (%) (%) N (%) (%) (%)
Dispensary 86 3.7 1.7 1.4 87 3.3 1.8 1.4 90 3.5 1.4 1.4 81 3.0 1.3 1.3 71 2.6 1.1 1.1
Project-Supported Health Center
(CEmONC) (n=6)316 13.7 10.5 5.2 341 13.1 10.0 5.6 352 13.7 10.6 5.7 374 13.8 10.6 6.0 373 13.8 12.3 5.9
Project-Supported Hospital (n=3) 1271 55.3 31.7 20.9 1426 54.8 30.6 23.5 1393 54.4 30.4 22.4 1553 57.2 30.2 25.0 1572 58.0 30.7 24.7
Non-Project-Supported Health
Center (BEmONC) (n=15)83 3.6 9.5 1.4 77 3.0 8.2 1.3 98 3.8 10.5 1.6 108 4.0 11.7 1.7 81 3.0 10.9 1.3
Non-Project-Supported Health
Center (CEmONC) (n=2)214 9.3 29.5 3.5 287 11.0 34.9 4.7 341 13.3 42.9 5.5 324 11.9 39.1 5.2 370 13.6 45.4 5.8
Non-Project-Supported Hospital
(n=2)329 14.3 36.8 5.4 382 14.7 46.9 6.3 289 11.3 45.3 4.6 276 10.2 43.1 4.4 244 9.0 39.7 3.8
Total 2299 100% 16% 38% 2600 100% 17% 43% 2563 100% 15% 41% 2716 100% 16% 44% 2711 100% 16% 43%
Met need EmONC (w/o
dispensaries)2213 36% 2513 41.4% 2473 40% 2635 42.3% 2640 41.5%
Proportion of met need for EmONC due to project support 72% 70% 71% 73% 74%
* Includes: antepartum and postpartum hemorrhage, uterine rupture, prolonged or obstructed labor, postpartum sepsis, eclampsia/preeclampsia, and first trimester complications (complicated abortions and ectopic pregnancies).
† Assuming that 15% of all women who give births would experience direct obstetric complications
Direct obstetric
complications*
Direct obstetric
complications*
Direct obstetric
complications*
Direct obstetric
complications*
Direct obstetric
complications*
Jan–June 2011 July–Dec 2011 Jan–June 2012 July–Dec 2012 Jan–June 2013
Table A2
Distribution of Direct Obstetric Complications, Excluding First Trimester Complications, by Type of Treating Facility, 2011–2013
Facility Type
Complications as
proportion of
total deliveries
Proportion of
expected
complications
treated†
Complications as
proportion of total
deliveries
Proportion of
expected
complications
treated†
Complications as
proportion of
total deliveries
Proportion of
expected
complications
treated†
Complications as
proportion of
total deliveries
Proportion of
expected
complications
treated†
Complications as
proportion of
total deliveries
Proportion of
expected
complications
treated†
N (%) (%) (%) N (%) (%) (%) N (%) (%) (%) N (%) (%) (%) N (%) (%) (%)
Dispensary 68 4.2 1.4 1.1 70 3.6 1.4 1.2 71 4.0 1.0 1.1 64 3.6 1.0 1.0 58 3.1 0.9 0.9
Project-Supported Health Center
(CEmONC) (n=6)247 15.1 8.1 4.1 295 15.1 8.6 4.9 261 14.6 7.9 4.2 294 16.4 8.3 4.7 290 15.7 9.6 4.6
Project-Supported Hospital (n=3) 940 57.5 23.4 15.5 1171 60.0 25.1 19.3 1111 62.2 24.2 17.8 1081 60.3 22.6 17.4 1129 61.1 22.0 17.8
Non-Project-Supported Health
Center (BEmONC) (n=15)39 2.4 4.4 0.6 14 0.7 1.5 0.2 17 1.0 1.8 0.3 25 1.4 2.7 0.4 17 0.9 2.3 0.3
Non-Project-Supported Health
Center (CEmONC) (n=2)120 7.3 16.5 2.0 147 7.5 17.8 2.4 148 8.3 18.6 2.4 153 8.5 18.5 2.5 181 9.8 22.1 2.8
Non-Project-Supported Hospital
(n=2)220 13.5 24.4 3.6 256 13.1 31.4 4.2 178 10.0 27.7 2.9 177 9.9 27.7 2.8 174 9.4 28.2 2.7
Total 1634 100% 11% 27% 1953 100% 13% 32% 1786 100% 10% 29% 1794 100% 10% 29% 1849 100% 11% 29%
Met need EmONC (w/o
dispensaries)1566 26% 1883 31% 1715 28% 1730 28% 1791 28%
Proportion of met need for EmONC due to project support 76% 78% 80% 79% 79%
* Includes: antepartum and postpartum hemorrhage, uterine rupture, prolonged or obstructed labor, postpartum sepsis, eclampsia/preeclampsia, and first trimester complications (complicated abortions and ectopic pregnancies).
† Assuming that 15% of all women who give births would experience direct obstetric complications
Direct obstetric
complications*
Direct obstetric
complications*
Direct obstetric
complications*
Direct obstetric
complications*
Direct obstetric
complications*
Jan–June 2011 July–Dec 2011 Jan–June 2012 July–Dec 2012 Jan–June 2013
Annex A: Direct Obstetric Complications
Reducing Maternal Mortality in Tanzania: Selected Pregnancy Outcomes in Kigoma Summary
29
2011 2012 2013 2011 2012 2013 2011 2012 2013 2011 2012 2013 2011 2012 2013 2011 2012 2013 2011 2012 2013 2011 2012 2013 2011 2012 2013
Cesarean sections 455 669 279 7 7 5 458 333 197 27 68 31 19 31 7 6 24 16 58 37 23 587 509 245 26 48
Operation on ruptured
uterus (repair or
hysterectomy)
45 25 13 0 0 0 13 17 8 0 2 1 1 1 0 0 4 2 2 3 2 12 18 10 2 1
Surgery for ruptured
ectopic pregnancy4 2 2 0 0 0 1 7 3 0 0 0 0 0 0 0 0 0 1 1 0 15 28 5 0 0
Laparotomy and drainage
for post-abortion
complications
0 6 0 0 0 0 2 4 1 0 0 0 0 0 0 0 0 0 0 0 0 9 5 3 0 0
Hysterectomy for post-
abortion complication0 0 0 0 0 0 0 1 0 0 0 0 0 0 0 0 0 0 0 0 0 2 4 0 0 0
Hysterectomy for
postpartum hemorrhage3 5 0 0 0 0 2 2 2 0 0 0 0 0 0 0 0 0 1 1 1 6 2 0 0 0
Manual removal of
placenta performed in
OT
2 1 0 0 0 0 4 6 5 0 4 0 3 2 0 0 1 0 7 8 2 14 9 5 0 1
Manual removal of
placenta performed in
L&D
0 1 0 0 0 0 2 0 0 0 3 0 1 0 0 0 0 0 0 0 0 5 10 5 0 0 0
Retained placenta
treated in L&D36 27 19 1 1 3 3 6 8 2 2 3 2 4 0 0 0 1 3 3 5 35 26 20 4 6 3
Kibondo District
Maweni Hospital
Kigoma District (Urban)
OT
clos-
ed
3 Ujiji OT opened November 2012.
2 Buhingu OT opened August 2011.
Table B1. Obstetric Procedures Performed in Project-Supported-Facilities, January 2011–June 20131
12013 includes months January-June only.
Ujiji HC3
Kigoma District (Rural)
Type of Procedure Mabamba HC Buhingu HC2 Nguruka HCKibondo HospitalKasulu Hospital Nyenge HC
Kasulu District
Kakonko HC
Annex B: Other Obstetric Care

Reducing Maternal Mortality in Tanzania: Selected Pregnancy Outcomes in Kigoma Summary
30
Annex B (cont‟d)
Table B2. Number of Abortion Complications & Ectopic Pregnancies Surgically Treated*, by District and Facility, 2011–2013
Reducing Maternal Mortality in Tanzania: Selected Pregnancy Outcomes in Kigoma Summary
31
Period
Jan-Jun,
2011
Jul-Dec, 2011
Jan-Jun, 2012
Jul-Dec, 2012
Jan-Jun, 2013
KASULU
Project-Supported Facilities
Kasulu Hosp. 134
88 151
195 193
Nyenge HC 0
4 16
9 19
Non-Project-Supported Facilities Heri Hosp. 27
36 21
31 24
Kabanga Hosp. 82
90 90
67 46
Biharu HC 14
15 11
14 16
Janda HC 3
6 12
10 8
Kiganamo HC 1
3 0
0 0
Mulera HC 2
7 3
7 1
Muyama HC 3
3 5
4 2
Nyakitonto HC 4
1 0
1 0
Rusesa HC 4
13 21
14 13
Shunga HC 31
40 76
73 69
Buhigwe Disp. 0
0 0
0 1
Kibande Disp. 0
1 0
0 0
Munyegera Disp. 0
0 0
1 0
Mwali Disp. 0
0 0
1 0
KIBONDO
Project-Supported Facilities
Kibondo Hospital 70
60
60
108 124
Kakonko HC
1
0
8 0
Mabamba HC 36
37
51
37 31
Non-Project-Supported Facilities
Gwanumpu HC 1
0
2
2 0
Nyanzige HC 3
5
9
13 0
Kabare Disp. 18
16
19
15 10
Katanga Disp. 0
0
0
0 1
Kumsenga Disp. 0
0
0
0 1
KIGOMA URBAN
Project-Supported Facilities
Maweni Hospital 127
107 71
90 126
Ujiji HC 0
2 4
3 0
Non-Project-Supported Facilities
Gungu HC 0
0 0
1 0
KIGOMA RURAL
Project-Supported Facilities
Buhingu HC 1 0 15 18 3
Nguruka HC 31 2 5 4 30
Non-Project-Supported Facilities Bitale HC 7 9 10 9 19
Matyazo HC 63 100 117 98 120
Mwamgongo HC 2 1 8 8 5 Kidahwe HC 0 0 0 1 0
Total 665 647 777 841 862 *Treated in labor and delivery ward, minor operating theater, and major operating theater.