Embed Size (px)
Citation preview

East Tennessee State UniversityDigital Commons @ East
Tennessee State University
Electronic Theses and Dissertations Student Works
5-2015
Reducing Radio Frequency Susceptibilities inCommercial-Off-the-Shelf Camera Equipment foruse in Electromagnetic Compatibility TestingKevin MaininiEast Tennessee State University
Follow this and additional works at: https://dc.etsu.edu/etd
Part of the Electrical and Electronics Commons, and the Electromagnetics and PhotonicsCommons
This Thesis - Open Access is brought to you for free and open access by the Student Works at Digital Commons @ East Tennessee State University. Ithas been accepted for inclusion in Electronic Theses and Dissertations by an authorized administrator of Digital Commons @ East Tennessee StateUniversity. For more information, please contact [email protected].
Recommended CitationMainini, Kevin, "Reducing Radio Frequency Susceptibilities in Commercial-Off-the-Shelf Camera Equipment for use inElectromagnetic Compatibility Testing" (2015). Electronic Theses and Dissertations. Paper 2484. https://dc.etsu.edu/etd/2484

Reducing Radio Frequency Susceptibilities in Commercial-Off-the-Shelf Camera Equipment for
use in Electromagnetic Compatibility Testing
_____________________
A thesis
presented to
the faculty of the Department of Engineering
East Tennessee State University
In partial fulfillment
of the requirements for the degree
Master of Science in Engineering Technology
_____________________
by
Kevin A. Mainini
May 2015
_____________________
Dr. J. Paul Sims, Chair
Dr. Mohammad Moin Uddin
Dr. Dennis W. Coffey
Keywords: Radio Frequency, Shielding Method, GTEM Wave Cell, Compatibility Testing
2
ABSTRACT
Reducing Radio Frequency Susceptibilities in Commercial-Off-the-Shelf Camera Equipment for
use in Electromagnetic Compatibility Testing
by
Kevin A. Mainini
The Technical Testing and Analysis Center (TTAC) Group at Oak Ridge National Laboratory
performs electromagnetic compatibility testing on various radiation detection units. These tests
require remote viewing of the equipment’s display to monitor its compliance with national and
international standards. The Commercial-Off-the-Shelf (COTS) camera equipment that is used to
monitor the displays exhibits radio frequency susceptibilities causing issues when determining
the actual susceptibilities of the device under test. In order to mitigate this issue, a COTS camera
was placed in two common test positions and cycled through three angled orientations with
various radio frequency shielding methods applied. The development of these shielding methods
was investigated in this thesis. The goal was to reduce the number of susceptible frequencies.
The reduction of susceptibilities would greatly increase the viewing capacity of the cameras
during testing. The techniques discovered have allowed for other COTS camera equipment to be
modified and used effectively during electromagnetic compatibility testing.

3
DEDICATION
This thesis is dedicated to my parents. Mom, words are not enough to express my love
and gratitude for all that you do for me. Dad, your vast knowledge continues to be an inspiration
for me. I love you both.
− Kevin

4
TABLE OF CONTENTS
Page:
ABSTRACT .................................................................................................................................... 2
DEDICATION ................................................................................................................................ 3
LIST OF ACRONYMS .................................................................................................................. 6
LIST OF TABLES .......................................................................................................................... 7
LIST OF FIGURES ........................................................................................................................ 8
CHAPTER:
1. INTRODUCTION .................................................................................................................... 10
2. BACKGROUND ...................................................................................................................... 11
Objective ............................................................................................................................... 13
Literary Review .................................................................................................................... 13
3. SCOPE ...................................................................................................................................... 18
Equipment ............................................................................................................................. 19
Panasonic Camera Description ...................................................................................... 19
Gigahertz Transverse Electromagnetic Wave Cell ........................................................ 20
Signal Generator and Amplifiers ................................................................................... 21
LabVIEW User Interface ............................................................................................... 22
High Frequency Broadband Meter................................................................................. 23
GTEM Test Lamp .......................................................................................................... 24
Shielding and Suppression Approach ................................................................................... 24
Selected Shielding and Suppression Materials .............................................................. 26
4. PROCEDURE ........................................................................................................................... 28
Initial Test Plan ..................................................................................................................... 28
Recording Susceptibilities ............................................................................................. 36
Initial Findings ...................................................................................................................... 37
Susceptible Frequency Baseline (30 MHz – 2.5 GHz) .................................................. 37
Shielding and Suppression Material Performance (30 MHz – 2.5 GHz) ...................... 39
Depiction of Video Disturbances Caused by Susceptibilities........................................ 42
Modified Test Plan ............................................................................................................... 47
Modified Test Plan Findings ................................................................................................ 49

5
Susceptible Frequency Baseline Re-Scan (30 MHz – 550 MHz) .................................. 49
Shielding and Suppression Material Re-Scan Performance (30 MHz – 550 MHz) ...... 51
Data Analysis ................................................................................................................. 54
Final Test Plan ...................................................................................................................... 55
5. RESULTS ................................................................................................................................. 57
Analysis of Final Results ...................................................................................................... 58
6. CONCLUSIONS....................................................................................................................... 59
BIBLIOGRAPHY ......................................................................................................................... 60
APPENDICIES ............................................................................................................................. 62
Appendix A: ANSI Electromagnetic Compatibility Standards ............................................ 62
Appendix B: Panasonic-WV-CP470 Series .......................................................................... 70
Appendix C: Narda NBM-550 High Frequency Broadband Meter ...................................... 72
Appendix D: Material Specifications ................................................................................... 78
VITA ............................................................................................................................................. 81
6
LIST OF ACRONYMS
American National Standards Institute (ANSI)
Closed-Circuit Television (CCTV)
Commercial - Off - the - Shelf (COTS)
Electromagnetic Compatibility Testing (EMC)
Electromagnetic Interference (EMI)
Equipment Under Test (EUT)
Gigahertz Transverse Electromagnetic Cell (GTEM)
Institute of Electrical and Electronics Engineers Standards Association (IEEE-SA)
International Electrotechnical Commission (IEC)
National Voluntary Laboratory Accreditation Program (NVLAP)
Oak Ridge National Laboratory (ORNL)
Radio Frequency (RF)
Technical Testing and Analysis Center (TTAC)

7
LIST OF TABLES
Table 1: ANSI Standards Used by the TTAC Group, IEEE, January 21, 2015 ........................... 18
Table 2: Spectrum Analyzer and Amplifiers Used During Testing .............................................. 21
Table 3: General Description of Tests to be Performed ............................................................... 35
Table 4: Testing Sequence for the Camera and the Materials ...................................................... 35
Table 5: General Description of Susceptibility Re-Scan Test ...................................................... 48
Table 6: Modified Testing Sequence for the Camera and the Materials ...................................... 48
Table 7: General Description of Final Susceptibility Test............................................................ 56
Table 8: Final Testing Sequence for the Camera and the Materials ............................................. 56

8
LIST OF FIGURES
Figure 1: Gigahertz Transverse Electromagnetic Wave Cell (Used With Permission From: ETS-
Lindgren Inc., 2013, p. 1). ............................................................................................ 12
Figure 2: Commercial Off the Shelf Panasonic WV CP470 (Adapted from: Panasonic, 2014, p.
1). .................................................................................................................................. 12
Figure 3: Agilent Technologies Signal Generator ........................................................................ 21
Figure 4: LabVIEW User Interface for RF Immunity Testing ..................................................... 22
Figure 5: Narda NBM-550 with >3 MHz Probe ........................................................................... 23
Figure 6: Wall of Various Ferrite Beads ....................................................................................... 25
Figure 7:Material Characteristic Graph of Ferrite Bead Clip (Adapted from: www.EBAY.com,
2015) ............................................................................................................................. 27
Figure 8: Camera Locations within the GTEM ............................................................................ 29
Figure 9: Camera Orientations within the GTEM ........................................................................ 30
Figure 10: Measuring the Height of the GTEM Septum and Camera .......................................... 31
Figure 11: Camera Centered in the GTEM with a +60° Orientation ............................................ 32
Figure 12: Camera Centered in the GTEM with a -60° Orientation ............................................. 33
Figure 13: Camera Offset in the GTEM with a 0° Orientation..................................................... 34
Figure 14: Panasonic Camera Functioning Properly (remote monitor) ........................................ 36
Figure 15: Baseline Scan – Center (30 MHz – 2.5 GHz) ............................................................. 37
Figure 16: Baseline Scan – Offset (30MHz – 2.5 GHz) ............................................................... 38
Figure 17: Copper Shielding Fabric – Center (30 MHz – 2.5 GHz)............................................. 39
Figure 18: Copper Shielding Fabric – Offset (30 MHz - 2.5 GHz) .............................................. 40
Figure 19: ShieldIt Super Shielding Fabric –Center (30 MHz – 2.5 GHz) .................................. 40
Figure 20: ShieldIt Super Shielding Fabric –Offset (30 MHz – 2.5 GHz) ................................... 41
Figure 21: Ferrite Bead –Center (30 MHz – 2.5 GHz) ................................................................. 41
Figure 22: Ferrite Bead – Offset (30 MHz – 2.5 GHz) ................................................................. 42
Figure 23: Video Ribboning ......................................................................................................... 43
Figure 24: Increased Ribboning Speed ......................................................................................... 44
Figure 25: Vertical De-synchronization........................................................................................ 44
Figure 26: Increased Vertical De-synchronization ....................................................................... 45
Figure 27: Increased Vertical De-synchronization and Ribboning............................................... 45
Figure 28: Horizontal and Vertical De-synchronization ............................................................... 46
Figure 29: Complete Loss of Signal ............................................................................................. 46
Figure 30: Baseline Scan – Center (30 MHz – 550 MHz) ............................................................ 49
Figure 31: Baseline Scan – Offset (30 MHz – 550 MHz) ............................................................ 50
Figure 32: Copper Shielding Fabric – Center (30 MHz – 550 MHz) ........................................... 51
Figure 33: Copper Shielding Fabric – Offset (30 MHz – 550 MHz)............................................ 52
Figure 34: ShieldIt Super Shielding Fabric – Center (30 MHz – 550 MHz) ................................ 52
Figure 35: ShieldIt Super Shielding Fabric – Offset (30 MHz – 550 MHz) ................................ 53

9
Figure 36: Ferrite Bead – Center (30 MHz – 550 MHz) .............................................................. 53
Figure 37: Ferrite Bead – Offset (30 MHz – 550 MHz) ............................................................... 54
Figure 38: Combination of Shielding Materials – Center (30 MHz – 550 MHz) ......................... 57

10
CHAPTER 1
INTRODUCTION
The Technical Testing and Analysis Center (TTAC) Group at Oak Ridge National
Laboratory (ORNL) is an independent testing laboratory involved mainly in the testing of
radiation detection units. The tests performed on these units are based on national and
international standards such as the American National Standards Institute (ANSI), Institute of
Electrical and Electronics Engineers Standards Association (IEEE-SA), International
Electrotechnical Commissions (IEC), Military Standards, and various other standards. The
applicable standards contain the tests and outcomes required for all types of equipment being
tested. The TTAC Group has the capability to test a variety of radiation detection devices and
other equipment such as: hand-held detection units, backpack detection units, spectrometric
detectors, personal protective equipment, and mobile detectors as well as a number of prototype
radiation portal monitors that are sent by sponsors for evaluation. The TTAC Group is currently
accredited by the National Voluntary Laboratory Accreditation Program (NVLAP) making it
imperative that TTAC be able to properly perform tests in compliance with the above applicable
standards-based test for every product.
The TTAC Group performs electromagnetic compatibility (EMC) testing such as
radiated emissions, radio frequency susceptibilities, and conducted immunities. The instruments
used by the TTAC Group to conduct these tests are a semi-anechoic chamber and a Gigahertz
Transverse Electromagnetic wave cell (GTEM). The semi-anechoic chamber is capable of testing
a frequency range of 26 MHz to 18 GHz. The GTEM can test a frequency range from DC to 18
GHz.

11
CHAPTER 2
BACKGROUND
During radio frequency susceptibility testing, the equipment under test (EUT) is placed in
the center of the GTEM and exposed to a range of radio frequencies at a specific intensity based
on the EUT and the associated standards. Since the test operators cannot be in the chamber with
the EUT during the test (for health and safety reasons), a commercial-off-the-shelf (COTS)
camera is placed in the GTEM along with the EUT to monitor the activity of the equipment. The
COTS camera outputs video to a remote viewing monitor to either be watched live during the
test, or to be recorded for viewing at a later date. Recording the test allows the test operators the
ability to review the test if any discrepancies are found in later tests. While this is a very helpful
method for the test operators, the camera itself contains radio frequency susceptibilities that can
cause viewing issues. Depending on the position of the COTS camera in the chamber, certain
frequency bands will cause various malfunctions on the output signal. This occurs any time those
specific frequency bands are scanned making it difficult or even impossible to see what is going
on inside the chamber. It is vital that the operator be able to identify weather the EUT is
functioning properly at all scanned frequencies. With this issue hindering their view of the EUT
the identification becomes significantly more challenging and sometimes unattainable. This is
considered unacceptable to the TTAC Group and therefore requires that a solution be researched
and implemented. Pictures of the GTEM (Figure 1) and the COTS camera (Figure 2) that will be
used in this experiment are shown below.

12
Figure 1: Gigahertz Transverse Electromagnetic Wave Cell (Used With Permission From: ETS-
Lindgren Inc., 2013, p. 1).
Figure 2: Commercial Off the Shelf Panasonic WV CP470 (Adapted from: Panasonic, 2014, p.
1).

13
Objective
The objective of this thesis is to determine an effective shielding method to increase the
viewing capacity of COTS camera equipment that is used in EMC testing. In order to achieve
this goal, a COTS camera will be tested in the GTEM cell independently and with various radio
frequency shielding materials and techniques. The COTS camera will be placed in the two most
typical positions in the GTEM during testing of EUTs (centered and offset). It will then be
cycled through the three most extreme angled orientations (+60°, 0°, and -60°) for a total of six
locations/positions per shielding material/method. The COTS camera will then be exposed to
typical radio frequency susceptibility testing procedures based on all ANSI standards used by the
TTAC group (80 MHz to 2.5 GHz).
The above tests will allow sufficient data to be collected in order to find a viable solution
to the adverse effects. It is hypothesized that with the addition of radio frequency shielding
materials, the susceptible frequencies will be significantly reduced or removed from the COTS
camera. The combination of acquired data and analysis will allow for a general modification
process to be used on this and other COTS cameras.
Literary Review
The Technical Testing and Analysis Center (TTAC) Group at Oak Ridge National
Laboratory performs electromagnetic compatibility testing on various radiation detection units.
These tests require remote viewing of the equipment’s display to monitor its compliance with
national and international standards. The Commercial-Off-the-Shelf (COTS) camera equipment
that is used to monitor the displays exhibits radio frequency susceptibilities causing issues when
determining the actual susceptibilities of the device under test.

14
In order to mitigate this issue, the COTS camera will be tested with various radio frequency (RF)
shielding and suppression materials applied to it. Before going further, it is important to
understand the following terms as defined by Xingcun Colin Tong,
Electromagnetic compatibility (EMC) is the capability of electrical and electronic
systems, equipment, and devices to operate in their intended electromagnetic
environment within a defined margin of safety, and at design levels or performance,
without suffering or causing unacceptable degradation as a result of electromagnetic
interference (EMI). EMC can generally be achieved by suppressing EMI and immunizing
susceptibility of the systems and devices. Susceptibility is a relative measure of a device’s
or a system’s propensity to be disrupted or damaged by EMI exposure to an incident field
or signal. It indicates the lack of immunity. Immunity is a relative measure of a device’s
or system’s ability to withstand EMI exposure while maintaining a predefined
performance level. Radiated immunity is a product’s relative ability to withstand
electromagnetic energy that arrives via free space propagation. Conducted immunity is a
product’s relative ability to withstand electromagnetic energy that penetrates it through
external cables, power cords, and input/output (I/O) interconnects. (Tong, 2008)
Immunity (susceptibility) control has two parts: conducted (on hard wire) and radiated (radio-
wave coupling) (Whitaker, 2002). In an attempt to find an effective way of removing or reducing
the susceptibilities seen in the COTS camera, solutions for both radiated and conducted
susceptibilities were researched.

15
Since the enclosure of the COTS camera cannot be tampered with, it was decided that
shielding fabrics would be the best way to fully surround the camera. EMI shielding fabrics
make use of two independent methods for preventing radiated susceptibilities: reflection and
absorption. Just like light off a mirror, reflecting fabrics bounce electromagnetic waves off its
surface. On the other hand, in fabrics that use the absorption method, the electromagnetic wave
penetrates the material and is absorbed as it passes through, much like heat loss through an
insulating wall (William Kimmel, 2003). According to an application note by Learn EMC
entitled Shield Theory, shielding a device with various metallic materials can be a very effective
way to protect the device from electromagnetic interference. Simply surrounding a device in a
metal box with no seams or entry points would be the best form of protection; however, in the
real world that is typically not an option due to the additional cost, additional weight, and general
loss of functionality in some cases. In the application note, calculations are used to determine the
shielding effectiveness of copper foil. These calculations were theoretical and based on perfect
situation numbers. It was found that the copper foil had a calculated shield effectiveness of 154
dB. Since most EMC test equipment has a maximum dynamic range of somewhere between 80 -
120 dB, the copper foil can essentially be considered impenetrable. When comparing the
calculated shield effectiveness of the copper foil to shielding materials that can be more readily
procured, there are more realistic effectiveness ratings averaging from about 50 dB to around 85
dB. (Learn EMC, 2013)

16
In an application note written by Metal Textiles entitled, EMI/RFI Shielding, it is stated
that shielding effectiveness can be explained two ways: the first way is that circulation currents
are induced by the EMI field on the resisting shield. The circulating currents create their own
fields on the shield which then opposes or reduces the intensity of the EMI field, thus creating a
barrier. The second explanation is that the shielding effectiveness is caused by either reflection
or absorption or both depending on the material. The EMI field can either bounce off the
shielding material and away from the device or it will penetrate the shield and be absorbed
before affecting the device. In either explanation, "EMI from external sources will be reduced to
much lower levels inside the shield than the level outside the shield, and only the particular
shielded equipment benefited" (Metal Textiles, 2012). EMI can be radiated into a device through
any kind of opening or imperfect joint on an enclosure, making it imperative that the shielding be
completely closed (if possible) and sealed to achieve the most shielding effectiveness possible.
(Metal Textiles, 2012)
In an article written by Holland Shielding Systems BV, entitled EMI Shielding
Applications, it is stated that due to the complexity of current printed circuit board designs, it is
simpler and more cost-effective to develop shields for the device’s enclosure. The way the
shielding is selected for the device is based on the frequency that is/will be affecting the device.
For lower frequencies, <10 kHz, a thicker material is necessary. As the frequency increases, the
material thickness can be decreased; however, as the frequency increases, the wavelength of that
frequency shortens making gaps in the material more of an issue. For higher frequencies, 10 kHz
to 40 GHz, great attention should be focused on minimizing the amount of gaps or holes in the
shielding. (Holland Shielding Systems BV, 2015)

17
In an article produced by EMI Software titled, "What is Conducted Susceptibility?", it is
explained that conducted susceptibility is the ability of a device to function properly when radio
frequencies are introduced onto its interconnecting conductors such as power cables or data
transmission lines. During typical conducted susceptibility testing, low and mid frequency noise
is injected on to the device’s power cables and/or data transmission lines to characterize how the
device reacts. This can be injected as either a current or a voltage depending on the device and
the test being performed. The current or voltage is increased after every successful test until the
device shows susceptibility. The amplitude at which the device shows unacceptable behaviors as
a response to the injected noise is known as the susceptibility threshold. In most cases, these
unacceptable behaviors cease as soon as the injected noise is removed. (EMI Software, 2015)
In an Engineering Note titled, ILB, ILBB Ferrite Beads, the general description of how
ferrite beads work and how they can reduce conducted susceptibilities on device cables is
explained. A ferrite bead is basically a resistor that has a fluctuating resistance value that is
dependent on the frequency being induced. The higher the frequency, the more impedance
produced. Other forms of EMI restricting components such as inductors or capacitors can cause
resonant problems at high frequencies making the ferrite bead the only practical solution (at high
frequencies). The ferrite material, when used at high frequencies, provides resistive
characteristics that attenuate the frequencies. This is caused by eddy currents that in turn heat the
ferrite material a minuscule amount. (Vishay Dale, 2015)

18
CHAPTER 3
SCOPE
The scope of this thesis is to develop a general purpose technique for the reduction of
radio frequency susceptibilities in COTS camera equipment being used in Electromagnetic
Compatibility testing. A Panasonic-WV-CP470 Closed - Circuit Television (CCTV) camera will
be used throughout the duration of the testing. The camera will be tested in the TTAC Group's
GTEM wave cell (5400 Series). The GTEM is controlled by a LabVIEW program developed in-
house at ORNL specifically for this application. The LabVIEW program controls three
amplifiers and a signal generator. There will also be a broadband radio frequency power meter
placed within the GTEM to monitor the frequencies being generated. Table 1 contains the ANSI
standards used as references when developing the test plan:
Table 1: ANSI Standards Used by the TTAC Group, IEEE, January 21, 2015
Standard ID Standard Description
N42.32 American National Standard Performance Criteria for Alarming Personal Radiation
Detectors for Homeland Security
N42.33 American National Standard for Portable Radiation Detection Instrumentation for
Homeland Security
N42.34 American National Standard Performance Criteria for Hand-Held Instruments for the
Detection and Identification of Radionuclides
N42.35 American National Standard for Evaluation and Performance of Radiation Detection
Portal Monitors for Use in Homeland Security
N42.38 American National Standard Performance Criteria Spectroscopy-Based Portal Monitors
Used for Homeland Security
N42.43 American National Standard Performance Criteria for Mobile and Transportable
Radiation Monitors Used for Homeland Security
N42.48 American National Standard Performance Requirements for Spectroscopic Personal
Radiation Detectors (SPRDs) for Homeland Security
N42.53 American National Standard Performance Criteria for Backpack-Based Radiation
Detection Systems Used for Homeland Security

19
The standards in Table 1 are used by TTAC to evaluate equipment supplied by sponsors or
vendors/manufacturers. Since each standard has slightly different requirements needed for
equipment acceptance, the frequency requirements that repeatedly occurred and the most severe
intensity were selected in order to cover the full range of the standards. By testing to these
extremes, the full range of requirements detailed by the standards can be tested in a single trial.
Once the requirements were selected, they were utilized to decide the materials that could
provide the camera the most benefit. These materials were: Pure Copper Polyester Taffeta®
fabric, ShieldIt Super® fabric, and a Ferrite bead clipped to the video cable.
Equipment
A brief description of the equipment that will be used during the testing is necessary in
order to apply the findings to future tests.
Panasonic Camera Description
The camera that was used for testing was a Panasonic-WV-CP470 Closed - Circuit
Television (CCTV) camera (shown in Figure 2). This camera is most typically used by the
TTAC Group during EMC testing. It is a COTS camera that is typically used in a network of
similar cameras for surveillance purposes. The Panasonic camera outputs video through a BNC
cable. The camera’s output can be viewed on a remote monitor. The use of the BNC cable also
gives the camera the capability to output to a Digital Video Recorder (DVR). The DVR is used
to record the video output of up to four cameras. For detailed specifications on the Panasonic-
WV-CP470 Closed-Circuit Television (CCTV) camera, refer to Appendix B.

20
Gigahertz Transverse Electromagnetic Wave Cell
The Gigahertz Transverse Electromagnetic (GTEM) wave cell is a radio frequency test
chamber (shown in Figure 1). The following quote is taken from the GTEM Operation manual. It
has been used to maintain the accuracy necessary to describe this instrument.
“It is mainly used for Electromagnetic Compatibility testing such as radiated immunities
and radiated emissions. The GTEM is a pyramidal tapered, dual-terminated section of 50-
ohm transmission line. The cell is flared to create a test volume within which the EUT is
placed. At the input, a normal 50-ohm coaxial line is physically transformed to a
rectangular cross section with an aspect ratio of 3:2 horizontal to vertical. The center
conductor, known as the septum, is a flat, wide conductor which, when driven by a signal
generator, produces a reasonably sized region of a nominally uniform electric field
distribution beneath it. This region of nominally uniform field is the test volume for
radiated immunity (susceptibility) testing.” (Gigahertz Transverse Electromagnetic
(GTEM) Cell Operation Manual, 2013, p. 9).

21
Signal Generator and Amplifiers
The signal generator and amplifiers used during the tests are listed in Table 2. Figure 3
shows the Agilent Technologies Signal Generator in Stand By mode.
Table 2: Spectrum Analyzer and Amplifiers Used During Testing
Signal Generator Brand Frequency Range
Agilent Technologies E8257C 250 kHz-20 GHz
Amplifiers Brand Frequency Range Wattage
Ophir RF 5127 Power Amplifier 20 – 1000 MHz 200 W
Instruments for Industry S21-50 1 – 2 GHz 50 W
Instruments for Industry S42-50 2 – 4 GHz 50 W
Figure 3: Agilent Technologies Signal Generator
22
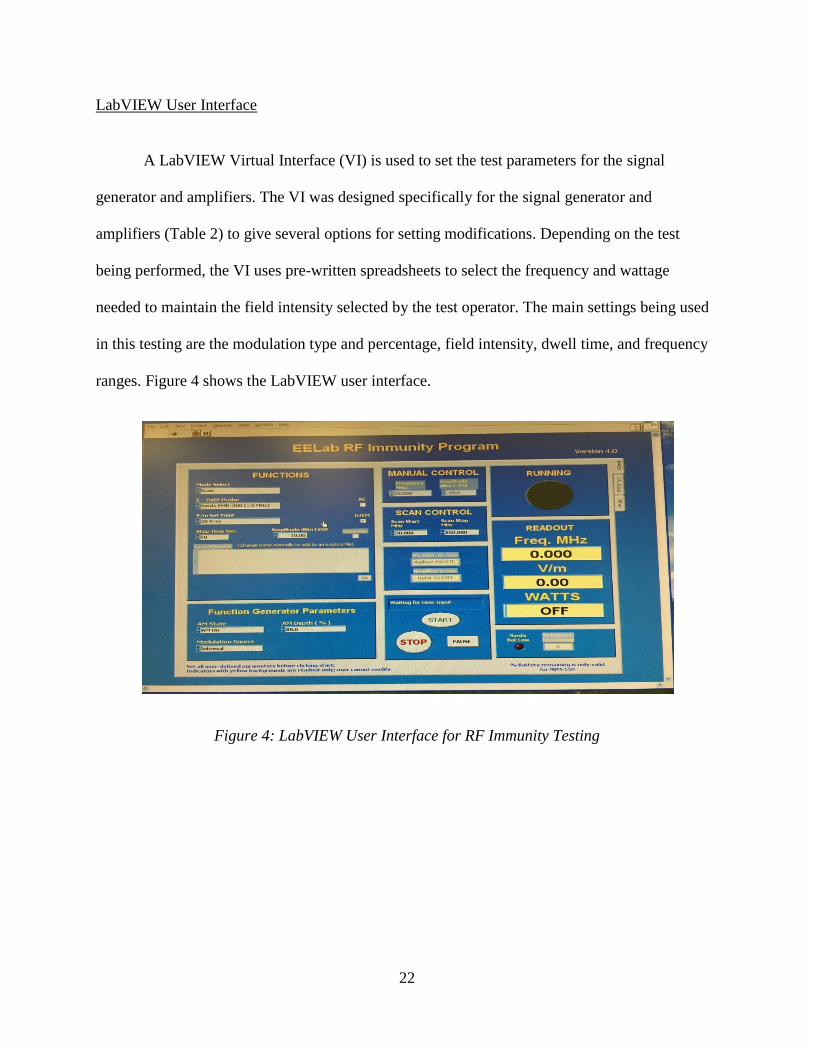
LabVIEW User Interface
A LabVIEW Virtual Interface (VI) is used to set the test parameters for the signal
generator and amplifiers. The VI was designed specifically for the signal generator and
amplifiers (Table 2) to give several options for setting modifications. Depending on the test
being performed, the VI uses pre-written spreadsheets to select the frequency and wattage
needed to maintain the field intensity selected by the test operator. The main settings being used
in this testing are the modulation type and percentage, field intensity, dwell time, and frequency
ranges. Figure 4 shows the LabVIEW user interface.
Figure 4: LabVIEW User Interface for RF Immunity Testing

23
High Frequency Broadband Meter
In order to monitor the field strength and frequencies during each test, a broadband field
meter was placed in the chamber alongside the camera. The meter that was used was a Narda
NBM-550. This high frequency broadband meter is calibrated to the same standards being tested
in this thesis; refer to Appendix A. A fiber optic cable was used as the data transmission cable so
as to not interfere with the quality of the tests being performed. There are several different
probes that could be used with the Narda NBM-550 depending on the tests being performed. For
this test, the > 3 MHz probe was used. This probe allows the Narda NBM-550 to test to
frequencies above 3 MHz. Figure 5 shows the Narda NBM-550 with the >3 MHz probe attached.
Figure 5: Narda NBM-550 with >3 MHz Probe

24
GTEM Test Lamp
The TTAC Group conducts all tests in the GTEM with an RF lamp to view EUT display
screens that do not have backlights. This lamp is necessary due to the lack of light in the GTEM
during testing. The lamp was in the GTEM along with the Panasonic camera and the Narda
Broadband RF probe during all testing conducted for this thesis. The GTEM was calibrated with
this equipment inside so that it has no effect on the testing. The lamp will be used both to
recreate the typical testing scenario of the TTAC Group and also to provide light for remote
viewing of the camera image.
Shielding and Suppression Approach
In order to reduce the susceptibilities present in the camera, a few different methods
were researched. Since radio frequencies can be both radiated into a device and/or conducted
into the device through the power or transmission lines, it was decided that both failure
opportunities were to be tested. The methods researched included: various shielding fabrics for
radiated susceptibilities, ferrite beads for conducted susceptibilities, and the effectiveness of
layering shielding fabrics for increased performance.
When discussing shielding fabrics, William Kimmel (2003) states, “Electromagnetic
Interference (EMI) shielding involves two independent mechanisms: reflection and absorption.
In reflection, an electromagnetic wave bounces off the surface, just like light off a mirror. In
absorption, the electromagnetic wave penetrates the material and is absorbed as it passes
through, much like heat loss through an insulating wall” (William Kimmel, 2003).

25
Only one shielding method (absorption) will be used during the testing involved in this thesis to
maintain consistency throughout the materials. Absorption is also the preferred method in this
application when looking at future testing using the camera. If the camera is shielded using a
reflecting material, it may reflect some of the energy in the GTEM to the EUT during testing
conducted by the TTAC Group. This can cause skewed results and for that reason is removed as
an option.
As explained by Chris T. Burket (2010), “A ferrite bead is a passive device that removes
noise energy from a circuit in the form of heat. The bead creates impedance over a broad
frequency range that eliminates all or part of the undesired noise energy over that frequency
range”. However, it is not an easy task to find the exact ferrite bead needed for an application.
Ferrite bead suppliers have been known to use different materials for the same ferrite beads
(Burket, 2010). That being said, it is not uncommon to use a trial and error type system when
selecting the appropriate ferrite bead for an application. Figure 6 shows a wall dedicated to the
various sizes, shapes, and impedances found in typical ferrite beads.
Figure 6: Wall of Various Ferrite Beads

26
The image in Figure 6 was taken at a certified Radio Frequency test facility that uses the trial and
error system to find suitable ferrite beads during their testing. Another common issue seen with
ferrite beads is where they should be placed for optimal performance. William Kimmel (2003)
states, “Unshielded cables can also cause problems at high frequencies. In those cases, high-
frequency filtering is needed directly at the interface to assure that the shield is not degraded at
high frequencies. Common solutions are EMI filters on power and signal lines, or ferrite beads
on the lines or cables. These must be installed as close to the shield penetration as possible” (p.
29.1 – 29.19). For this thesis, a ferrite bead with the correct diameter to encapsulate the cable
will be attached (as close to the camera as possible) to the video cable of the camera.
When layering shielding fabrics, Less EMF Inc. (2014) states, “An RF absorber will
absorb the bulk of the signal, and minimize reflection. The energy absorbed is released as a tiny,
almost un-measurable amount of heat. Grounding is usually not needed…Some amount of RF
does get through the shield, as no shield is 100% effective. You can use double or triple layers of
shielding to improve performance” (Less EMF Inc., 2014). Since layering the shielding fabrics
can improve performance, this can be added as a test option depending on the results found in
early testing.
Using the information found and described above, the appropriate shielding and suppression
materials were selected.
Selected Shielding and Suppression Materials
The materials chosen to shield the camera were: Pure Copper Polyester Taffeta® fabric,
ShieldIt Super® fabric, and a Ferrite bead clipped to the video cable. The Pure Copper Polyester
Taffeta® fabric states that it is capable of shielding from 10 MHz – 3 GHz at 80 dB.

27
ShieldIt Super® fabric is advertised to shield from 10 MHz – to 3 GHz at 60 dB. These
materials will be using the absorption method of shielding as described in the above section. The
copper fabric has a surface resistance of 0.05 ohms/sq. while the ShieldIt Super fabric has a
surface resistance of 0.5 ohms/sq. A lower surface resistivity allows the fabric to dissipate the
field energy more quickly making it more effective. For the ferrite bead, a general purpose
ferrite bead will be placed as close to the camera as possible and sized to tightly encapsulate the
video cable, per the description stated in the above section. The ferrite bead has a practical
frequency of 0.1 -1.0 MHz. Figure 7 is a characteristic curve of the ferrite bead.
Figure 7:Material Characteristic Graph of Ferrite Bead Clip (Adapted from: www.EBAY.com,
2015)
Depending on the results found during the testing of the fabrics and ferrite bead, it may become
necessary to layer the fabrics in order to increase performance.

28
CHAPTER 4
PROCEDURE
Initial Test Plan
Based on the previously mentioned ANSI standards used by the TTAC Group for EMC
testing, the following specifications were used to test the camera:
The camera will be exposed to an RF field intensity of 50 V/m
The frequency range will be 30 MHz – 2.5 GHz
The frequency range will be 80% amplitude modulated with a 1 kHz sine
wave
The frequency will sweep at a 1% change rate of the fundamental
frequency
There will be a 3 second dwell time on each individual frequency
Since the camera is used to monitor the EUT, its position is dependent on the EUT and the test
operator to find the most effective viewing angle. These various positions needed to be recreated
since there was no EUT present during the tests. The most typical and extreme locations as well
as angled orientations were selected in order to test all possible scenarios. The camera was
placed in two locations: centered in the GTEM, fully covered by the septum and offset in the
GTEM where it was only partially covered by the septum. Figure 8 shows a top view of the
GTEM with the camera in the two selected locations (centered and offset).

29
While in those two locations, the camera was cycled through three angle orientations: lens
pointing straight ahead at a 0° angle, lens pointing up at a +60° angle, and lens pointing down at
a -60° angle. Figure 9 shows the selected test angles.
Figure 8: Camera Locations within the GTEM

30
Figure 9: Camera Orientations within the GTEM
+60°
-60°
0°

31
The testing started with the camera unshielded to retrieve a baseline set of data. For the
first test, the camera was placed in the center of the GTEM and oriented straight ahead with a 0°
angle. The center of the GTEM is defined, in this thesis, as the location where the camera is
completely covered by the septum; refer to Figure 8. At this location, the septum is 35 inches
above the floor of the GTEM, shown in Figure 10.
Figure 10: Measuring the Height of the GTEM Septum and Camera
The camera was supported above the floor of the GTEM by foam blocks so that the
camera was 18 inches above the floor of the GTEM measured from the floor to the center of the
camera. The camera was then set 22 inches from each side of the GTEM septum (width). The
Narda probe was placed in the GTEM as close to the camera as possible so that it was reading
the field applied to the camera. Once the setup was completed, the test could be initiated.

32
The test for each location and orientation was a scan from 30 MHz – 2.5 GHz with a dwell time
of 3 seconds on each frequency. This first test took 29 minutes to complete. After the data for the
first scan had been recorded, the camera angle was adjusted to +60°. All angle orientation
adjustments made to the camera during the tests were measured with a protractor in order to
ensure a consistent angle for each test setup. The camera’s location remained in the center of the
GTEM. Figure 11 shows the camera in the center of the GTEM with an orientation of +60°.
Figure 11: Camera Centered in the GTEM with a +60° Orientation
After changing the camera’s orientation, the same scan (described above) was performed. When
the scan was completed, the camera’s orientation was adjusted once more to -60°, shown in
Figure 12, not changing the cameras location.

33
Figure 12: Camera Centered in the GTEM with a -60° Orientation
Again, the camera was subjected to the same scan as described above. The camera’s
orientation was then reset to 0° and the location was moved from centered in the GTEM to
offset. The offset position is defined, in this thesis, as the location where the camera is only
partially covered by the septum; refer to Figure 8. Similar measurements were used in the setup
of the camera in the offset location: the camera was positioned where the septum is 35 inches
above the GTEM floor and supported by foam blocks so that the center of the camera is actually
18 inches above the GTEM floor. The only difference was that instead of centering the camera
22 inches from each side of the GTEM septum, it was now 45.5 inches from the opposite edge of
the GTEM septum (width). This placed only half of the camera under the septum. In Figure 13,
the camera is in the offset location and at the 0° angle orientation.

34
Figure 13: Camera Offset in the GTEM with a 0° Orientation
The camera was again subjected to the scan and cycled through the two other angled orientations
in this location (+60° and -60°). Once completed, the camera had been through a total of 6 scans;
two locations with six orientations (three orientations per location). Table 3 shows the six tests
previously described.

35
Table 3: General Description of Tests to be Performed
Test Material Location Orientation Frequency Range Dwell Time
1 None Center 0° 30 MHz- 2.5 GHz 3 Sec.
2 None Center +60° 30 MHz- 2.5 GHz 3 Sec.
3 None Center -60° 30 MHz- 2.5 GHz 3 Sec.
4 None Offset 0° 30 MHz- 2.5 GHz 3 Sec.
5 None Offset +60° 30 MHz- 2.5 GHz 3 Sec.
6 None Offset -60° 30 MHz- 2.5 GHz 3 Sec.
Following these first six tests (Baseline), the data were analyzed, for future use, in order to
properly judge the performance of the shielding and suppression materials. The selected
methods/materials were: Pure Copper Polyester Taffeta® fabric, ShieldIt Super® fabric, and a
Ferrite bead clipped to the video cable. The camera went through the same six tests for each of
the above listed materials (24 tests total). Table 4 shows a step by step diagram of the test
sequence.
Table 4: Testing Sequence for the Camera and the Materials
Step Description
1 The camera (no shielding material) is placed in the center of the GTEM (fully covered by the
septum) pointing straight ahead (0°)
2 A frequency scan is initiated from 30 MHz – 2.5 GHz with a 3 second dwell time on each
frequency
3 Any change in the video display is recorded as a susceptibility
4 The camera’s orientation is changed to pointing +60° while still in the center of the GTEM
5 Steps 2 and 3 are repeated
6 The camera’s orientation is changed to pointing -60° while still in the center of the GTEM
7 Steps 2 and 3 are repeated
8 The camera (no shielding material) is offset from the center of the GTEM (half covered by the
septum) pointing straight ahead (0°)
9 Steps 2 – 7 are repeated
10 Steps 1 – 9 are repeated with Pure Copper Polyester Taffeta® shielding fabric added to the
camera
11 Steps 1 – 9 are repeated with ShieldIt Super® shielding fabric added to the camera
12 Steps 1 – 9 are repeated with a Ferrite bead clipped to the video output cable

36
Recording Susceptibilities
During these tests, it was decided that susceptibilities were to be considered any
disturbance on the camera’s output monitor. Figure 14 shows the camera’s video monitor when
the camera is functioning properly. This image was used as a comparison when determining
camera malfunctions due to susceptible frequencies.
Figure 14: Panasonic Camera Functioning Properly (remote monitor)

37
Initial Findings
The following are graphs of the data collected during the initial testing of the COTS
camera based on the specifications of the initial test plan described above. Each graph consists of
the data from one location and the three subsequent orientations. Each data point represents a
frequency that caused a disturbance on the remote monitor of the camera.
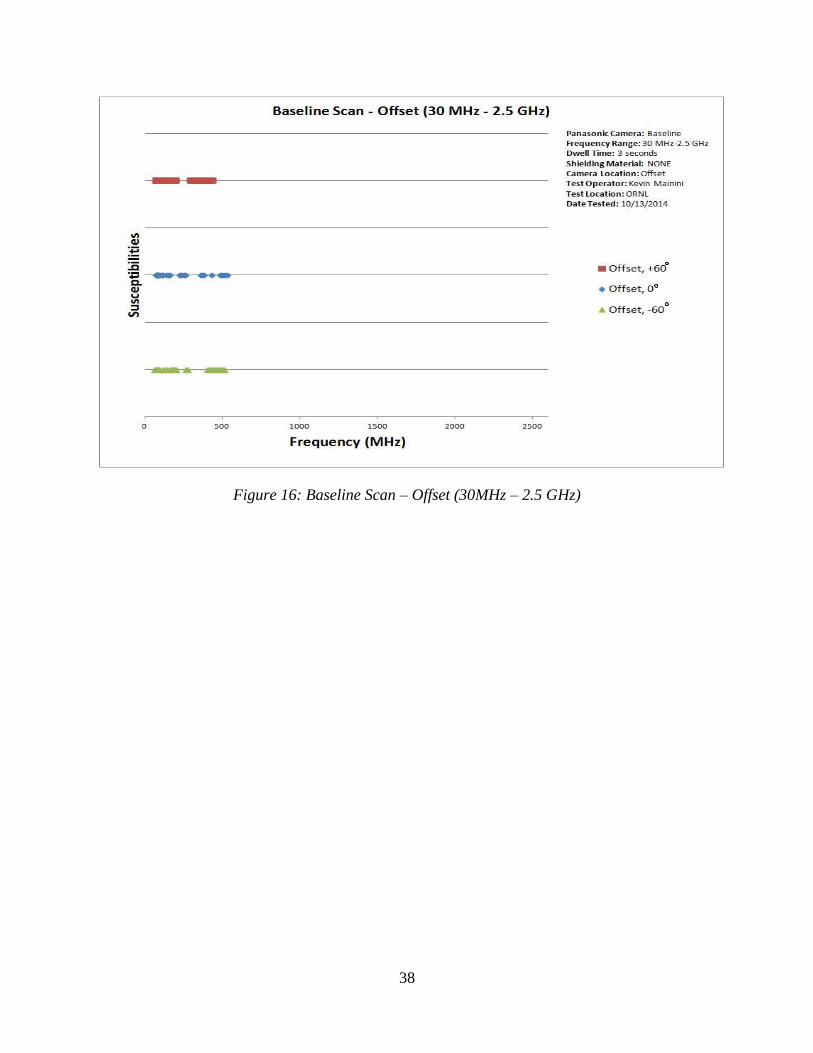
Susceptible Frequency Baseline (30 MHz – 2.5 GHz)
Figure 15 and Figure 16 are Baseline scans of the COTS camera (camera tested with no
shielding or suppression materials). The susceptible frequencies seen in these two graphs were
used as a reference when analyzing the performance of the shielding or suppression materials.
Figure 15: Baseline Scan – Center (30 MHz – 2.5 GHz)
38
Figure 16: Baseline Scan – Offset (30MHz – 2.5 GHz)

39
Shielding and Suppression Material Performance (30 MHz – 2.5 GHz)
Figure 17 through Figure 22 show the susceptible frequencies recorded during the initial
scan of the camera with shielding and suppression materials based on the initial test plan. Less
susceptible frequencies (data points) represent better attenuation/performance of the shielding or
suppression material in that location and orientation.
Figure 17: Copper Shielding Fabric – Center (30 MHz – 2.5 GHz)

40
Figure 18: Copper Shielding Fabric – Offset (30 MHz - 2.5 GHz)
Figure 19: ShieldIt Super Shielding Fabric –Center (30 MHz – 2.5 GHz)

41
Figure 20: ShieldIt Super Shielding Fabric –Offset (30 MHz – 2.5 GHz)
Figure 21: Ferrite Bead –Center (30 MHz – 2.5 GHz)

42
Figure 22: Ferrite Bead – Offset (30 MHz – 2.5 GHz)
As seen in Figure 15 through Figure 22, the camera was not susceptible to frequencies higher
than 550 MHz. It was decided at this time, to modify the test plan in order to focus the test range
more on the susceptible frequencies.
Depiction of Video Disturbances Caused by Susceptibilities
Figure 23 through Figure 29 show the various degrees of disturbances seen on the
monitor due to the susceptibilities of the camera. They are listed in order from insignificant
disturbance (Figures 23 and 24) to moderate disturbance (Figures 25 and 26) to extreme
disturbance Figures 27, 28, and 29).

43
Insignificant disturbances include video ribboning which does not block the operator’s view of
the EUT’s display screen but is still considered a susceptibility, in this thesis, because it causes a
change on the output monitor. Both moderate and extreme disturbances significantly block the
operator’s view of the EUT’s display screen.
Figure 23: Video Ribboning

44
Figure 24: Increased Ribboning Speed
Figure 25: Vertical De-synchronization

45
Figure 26: Increased Vertical De-synchronization
Figure 27: Increased Vertical De-synchronization and Ribboning

46
Figure 28: Horizontal and Vertical De-synchronization
Figure 29: Complete Loss of Signal

47
Modified Test Plan
Following the initial tests and analysis, it was discovered that the COTS camera was not
susceptible to any frequency past 550 MHz. This result led to the decision to modify the test plan
and rescan the camera with a smaller frequency range at a longer dwell time. This allowed for a
narrower test range with more detailed results. Therefore, based on the ANSI standards used by
the TTAC Group for EMC testing (Table 1) and the data found in the initial testing, the
following modified specifications were used to retest the camera:
The camera will be exposed to an RF field intensity of 50 V/m
The frequency range will be 30 MHz – 550 MHz
The frequency range will be 80% amplitude modulated with a 1 kHz sine
wave
The frequency will sweep at a 1% change rate of the fundamental
frequency
There will be a 10 second dwell time on each individual frequency
This second test was a re-scan of all frequencies that showed susceptibilities in the initial testing.
The second test scanned from 30 MHz – 550 MHZ with a 10 second dwell time on each
frequency. This narrowed susceptibility re-scan took 50 minutes to complete. There were no
modifications made to the physical setup of the COTS camera in the GTEM. Table 5 shows the
general description of the susceptibility re-scan test to be performed.

48
Table 5: General Description of Susceptibility Re-Scan Test
Test Material Location Orientation Frequency Range Dwell Time
1 None Center 0° 30 MHz- 550 MHz 10 Sec.
2 None Center +60° 30 MHz- 550 MHz 10 Sec.
3 None Center -60° 30 MHz- 550 MHz 10 Sec.
4 None Offset 0° 30 MHz- 550 MHz 10 Sec.
5 None Offset +60° 30 MHz- 550 MHz 10 Sec.
6 None Offset -60° 30 MHz- 550 MHz 10 Sec.
Following the six susceptibility re-scan tests, the camera was again tested with various radio
frequency shielding and suppression materials. The materials were: Pure Copper Polyester
Taffeta® fabric, ShieldIt Super® fabric, and a Ferrite bead clipped to the video cable. The
camera went through the same six tests for each of the above listed materials (24 tests total).
Table 6 shows a step by step diagram of the modified test sequence.
Table 6: Modified Testing Sequence for the Camera and the Materials
Step Description
1 The camera (no shielding material) is placed in the center of the GTEM (fully covered by the
septum) pointing straight ahead (0°)
2 A frequency scan is initiated from 30 MHz – 550 MHz with a 10 second dwell time on each
frequency
3 Any change in the video display is recorded as a susceptibility
4 The camera’s orientation is changed to pointing +60° while still in the center of the GTEM
5 Steps 2 and 3 are repeated
6 The camera’s orientation is changed to pointing -60° while still in the center of the GTEM
7 Steps 2 and 3 are repeated
8 The camera (no shielding material) is offset from the center of the GTEM (half covered by the
septum) pointing straight ahead (0°)
9 Steps 2 – 7 are repeated
10 Steps 1 – 9 are repeated with Pure Copper Polyester Taffeta shielding fabric added to the
camera
11 Steps 1 – 9 are repeated with ShieldIt Super shielding fabric added to the camera
12 Steps 1 – 9 are repeated with a Ferrite bead clipped to the video output cable

49
Modified Test Plan Findings
Below, are graphs of the data collected during the secondary testing of the COTS camera
based on the specifications of the modified test plan described above. Each graph consists of the
data from one location and the three subsequent orientations. Each data point represents a
frequency that caused a disturbance on the remote monitor of the camera.
Susceptible Frequency Baseline Re-Scan (30 MHz – 550 MHz)
Due to the modifications made to the test plan, a re-scan of the camera without any
shielding or suppression materials was necessary. Again, these baseline scans (Figure 30 and
Figure 31) were used as a reference when analyzing the performance of the shielding and
suppression materials.
Figure 30: Baseline Scan – Center (30 MHz – 550 MHz)

50
Figure 31: Baseline Scan – Offset (30 MHz – 550 MHz)

51
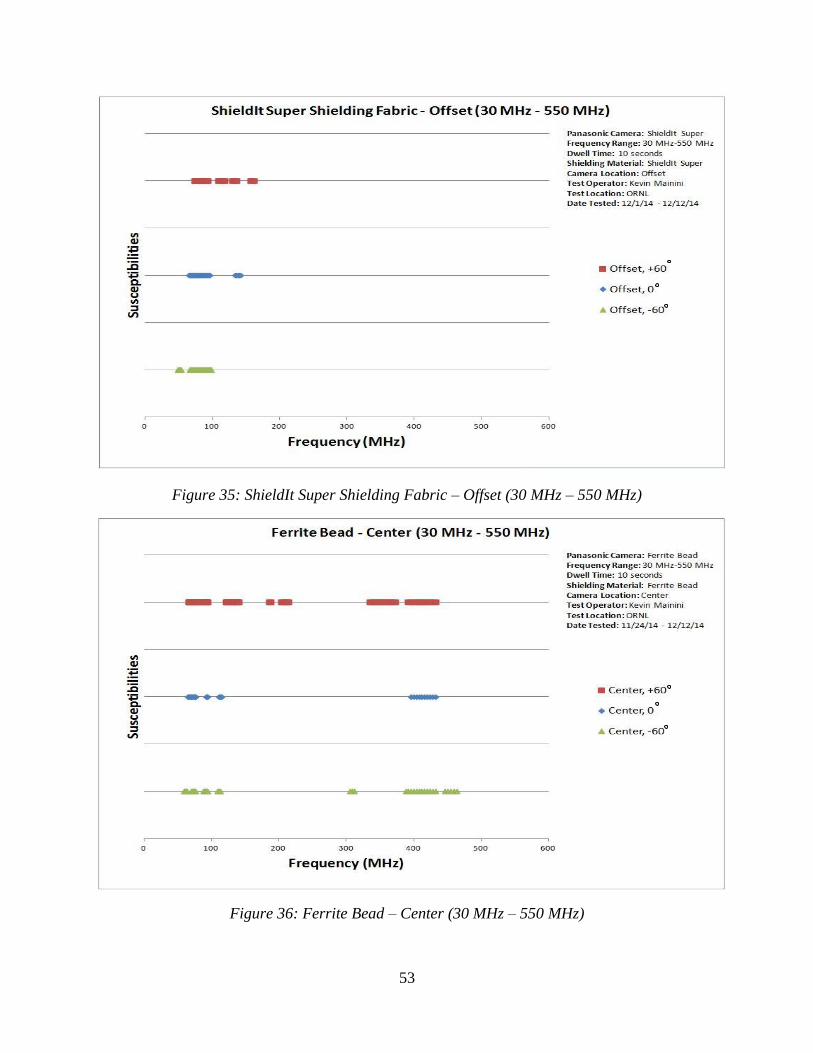
Shielding and Suppression Material Re-Scan Performance (30 MHz – 550 MHz)
Figure 32 through Figure 37 show the susceptible frequencies recorded during the re-scan
of the camera with shielding and suppression materials based on the modified test plan. Less
susceptible frequencies (data points) represent better attenuation/performance of the shielding or
suppression material in that location and orientation.
Figure 32: Copper Shielding Fabric – Center (30 MHz – 550 MHz)

52
Figure 33: Copper Shielding Fabric – Offset (30 MHz – 550 MHz)
Figure 34: ShieldIt Super Shielding Fabric – Center (30 MHz – 550 MHz)
53
Figure 35: ShieldIt Super Shielding Fabric – Offset (30 MHz – 550 MHz)
Figure 36: Ferrite Bead – Center (30 MHz – 550 MHz)

54
Figure 37: Ferrite Bead – Offset (30 MHz – 550 MHz)
Data Analysis
When comparing any of the shielding or suppression material data to the Baseline data, it
can be seen that a significant amount of susceptible frequencies were able to be attenuated. A
majority of the attenuated frequencies were toward the upper half of the modified test range
(>300 MHz). However, it became apparent that none of the materials, on their own, would be
able to shield all susceptible frequencies affecting the COTS camera. The full spectrum of video
disturbances was still apparent as well (ribboning, de-synchronization, complete loss of signal,
and combinations of all three). In an attempt to optimize the performance of the shielding and
suppression material techniques, a final test plan was formulated. The final test plan would
include a combination of the techniques, based on the collected data, designed to minimize the
remaining susceptibilities.

55
Final Test Plan
After analyzing the results from the tests performed based on the modified test plan,
enough data had been collected to create a final test plan. This final test plan was designed to
measure the attenuation of the remaining susceptible frequencies. As a reference, the following
specifications were used in the final test of the camera:
The camera will be exposed to an RF field intensity of 50 V/m
The frequency range will be 30 MHz – 550 MHz
The frequency range will be 80% amplitude modulated with a 1 kHz sine
wave
The frequency will sweep at a 1% change rate of the fundamental
frequency
There will be a 10 second dwell time on each individual frequency
The physical test setup and radio frequency specifications were not modified in this test plan;
however, since the centered test location showed the least amount of improvement, it was the
only test location. With the offset test location removed, the camera was scanned a total of three
times (one test location in three angled orientations). In this final test plan, the only modification
made is that a combination of the selected shielding and suppression materials was used during
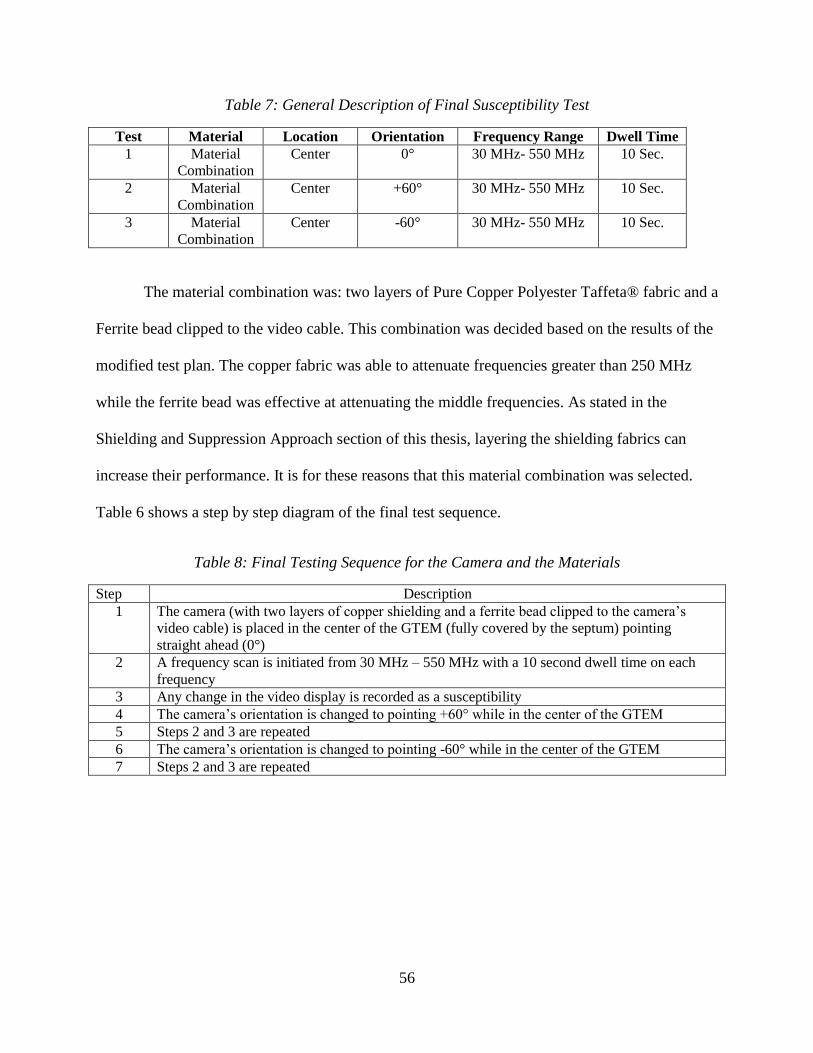
the tests. Table 5 shows the general description of the final test to be performed.
56
Table 7: General Description of Final Susceptibility Test
Test Material Location Orientation Frequency Range Dwell Time
1 Material
Combination
Center 0° 30 MHz- 550 MHz 10 Sec.
2 Material
Combination
Center +60° 30 MHz- 550 MHz 10 Sec.
3 Material
Combination
Center -60° 30 MHz- 550 MHz 10 Sec.
The material combination was: two layers of Pure Copper Polyester Taffeta® fabric and a
Ferrite bead clipped to the video cable. This combination was decided based on the results of the
modified test plan. The copper fabric was able to attenuate frequencies greater than 250 MHz
while the ferrite bead was effective at attenuating the middle frequencies. As stated in the
Shielding and Suppression Approach section of this thesis, layering the shielding fabrics can
increase their performance. It is for these reasons that this material combination was selected.
Table 6 shows a step by step diagram of the final test sequence.
Table 8: Final Testing Sequence for the Camera and the Materials
Step Description
1 The camera (with two layers of copper shielding and a ferrite bead clipped to the camera’s
video cable) is placed in the center of the GTEM (fully covered by the septum) pointing
straight ahead (0°)
2 A frequency scan is initiated from 30 MHz – 550 MHz with a 10 second dwell time on each
frequency
3 Any change in the video display is recorded as a susceptibility
4 The camera’s orientation is changed to pointing +60° while in the center of the GTEM
5 Steps 2 and 3 are repeated
6 The camera’s orientation is changed to pointing -60° while in the center of the GTEM
7 Steps 2 and 3 are repeated

57
CHAPTER 5
RESULTS
Figure 38 below shows the data collected from the final test plan. The camera was tested
in the center of the chamber only with two layers of Pure Copper Polyester Taffeta fabric as well
as a ferrite bead clipped to the camera’s video cable. The graph consists of the data from one
location and the three subsequent orientations. Each data point represents a frequency that caused
a disturbance on the remote monitor of the camera.
Figure 38: Combination of Shielding Materials – Center (30 MHz – 550 MHz)

58
Analysis of Final Results
As seen in Figure 38 above, almost all of the susceptibilities found in the camera were
attenuated. There was only a small band of frequencies left that remained unfixed. However, the
intensity of the remaining susceptibilities was drastically reduced. For purposes explained earlier
in this thesis, any changes seen on the camera’s remote monitor were recorded as susceptibilities.
The susceptibilities seen in the final testing of the camera only contained a small amount of
ribboning. They were recorded as susceptibilities because they created disturbances on the output
monitor but the ribboning was so minute that a test operator would still be able to read an EUT
display screen through the disturbance.

59
CHAPTER 6
CONCLUSIONS
The TTAC group uses COTS cameras to view the display screens of various radiation
detectors that are undergoing EMC testing. These COTS cameras exhibit susceptibilities during
this EMC testing which cause viewing issues for the test operators. In order to reduce or remove
the susceptibilities exhibited by the cameras during testing, various radio frequency shielding
and suppression methods were researched. The selected materials and methods were tested in the
most extreme conditions, locations, and orientations typically tested by the TTAC Group. After
testing the COTS camera in these conditions, locations, and orientations, the data collected was
analyzed to further the testing and narrow the test focus in order to find the most viable solution.
The preferred method for reducing the amount of susceptible frequencies apparent in the
COTS camera is layering the camera with two sheets of copper fabric and attaching a ferrite bead
to the video cable. Not only were almost all of the susceptible frequencies attenuated completely
by using this method, but the overall intensity of the field affecting the camera was greatly
reduced. The reduction in field intensity allowed the camera to maintain full view of the EUT
throughout the entirety of the final testing (with the exception of some video ribboning that had
very little effect on the viewing capacity).

60
BIBLIOGRAPHY
Burket, C. T. (2010, August 1). All Ferrite Beads are not Created Equal - Understanding the
Importance of Ferrite Bead Material Performance. Retrieved from InComplianceMag:
http://incompliancemag.com/article/all-ferrite-beads-are-not-created-equal-
understanding-the-importance-of-ferrite-bead-material-behavior/
EBAY. (2015). Snap On Ferrite Core Noise Suppressor EMI RFI Clip Cable Filter. Retrieved
March 1, 2015, from EBAY: http://www.ebay.com/itm/5-New-3-5mm-Snap-On-Ferrite-
Core-Noise-Suppressor-EMI-RFI-Clip-Cable-Filter-S-
/160830000831?pt=LH_DefaultDomain_0&hash=item2572370ebf
EMI Software. (2015). What is Conducted Susceptibility? Retrieved January 1, 2015, from EMI
Software: http://www.emisoftware.com/help/whatisconductedsusceptibility.asp
ETS-Lindgren Inc. (2013, December 1). Model 5400 Series Gigahertz Transverse
Electromagnetic Cell Operation Manual. Cedar Park, Texas.
Fawwaz T. Ulaby, E. M. (2010). Fundamentals of Applied Electromagnetics. Upper Saddle
River: Pearson Education, Inc.
Holland Shielding Systems BV. (2015). EMI Shielding Applications. Retrieved March 10, 2015,
from Holland Shielding Systems BV: http://hollandshielding.com/106-
EMI%20Shielding%20Applications
IEEE. (2015, January 21). IEEE Get Program. Retrieved from IEEE Standards Association:
http://standards.ieee.org/about/get/index.html
Learn EMC. (2013). Shielding Theory. Retrieved January 1, 2015, from Learn EMC:
http://www.learnemc.com/tutorials/Shielding01/Shielding_Theory.html
Less EMF. (2015, April 9). Shielding and Conductive Fabrics. Retrieved from Less EMF:
http://www.lessemf.com/fabric.html
Less EMF Inc. (2014). Frequently Asked Questions About EMF Shielding. Retrieved from Less
EMF: http://www.lessemf.com/faq-shie.html
Metal Textiles. (2012). EMI/RFI Shielding Theory. Retrieved March 10, 2015, from Metal
Textiles: http://www.metexcorp.com/emirfi_theory.cfm
Miller, G. M. (1999). Modern Electronic Communication. Upper Saddle River: Prentice-Hall,
Inc.

61
Narda Safety Solutions. (2015, April 9). NBM-550 Broadband Field Meter. Retrieved from
Electric and Magnetic Field Measurment: http://www.narda-
sts.us/pdf_files/DataSheets/NBM550_DataSheet.pdf
Panasonic . (2015, April 9). Super Dynamic II Color Surveillance Cameras. Retrieved from
Panasonic: http://www.broadcaststore.com/pdf/model/786666/WV-CP470_474.pdf
Tong, X. C. (2008). Advanced Materials and Design for Electromagnetic Interference Shielding.
Boca Raton: CRC Press.
Vishay Dale. (2015). Engineer Note: ILB, ILBB Ferrite Beads. Retrieved January 1, 2015, from
Vishay: http://www.vishay.com/docs/ilb_ilbb_enote.pdf
Whitaker, J. C. (2002). Electronics Systems Maintenance Handbook (Second Edition). Boca
Raton: CRC Press.
William Kimmel, J. P. (2003). Electrical Measurment, Signal Processing, and Displays. CRC
Press.

62
APPENDICES
Appendix A: ANSI Electromagnetic Compatibility Standards
ANSI N42.32 – American National Standard Performance Criteria for Alarming Personal
Radiation Detectors for Homeland Security
8.2 Radio Frequency
8.2.1 Requirement
The instrument shall not be affected by radio frequency (RF) fields over the frequency
range of 80 MHz to 2.5 GHz at an intensity of 50 volts per meter (V/m). When exposed
to these RF fields, the instrument shall function correctly. No alarms shall occur as a
result of the RF radiation alone.
8.2.2 Test method
The test shall be performed using the following technique.
Prior to the RF test, expose the instrument to a 137Cs radiation field that produces a
stable reading on the instrument (≤12% COV). For instruments with a digital and unit-
less display record ten independent readings and determine the mean value, standard
deviation, and coefficient of variation. For instruments with a non-numerical display
(bar-graph, LEDs only, etc.) observe and record the response. Place the instrument and
source in a RF controlled environment and expose it to a RF field of 50 V/m as measured
without an instrument present in the test cell over a frequency range of 80 MHz to 2.5
GHz that is 80% amplitude modulated with a 1 kHz sine wave. The test should be
performed using an automated sweep at a frequency change rate not greater than 1% of
the fundamental. For instruments with a digital rate display, the instrument’s response
during the test shall be within ±15% of the pre-test reading. For instruments with a unit-
less display, the instrument’s response shall not change from the pre-test response by
more than 10% of the full scale reading or ±1 unit, whichever is greater. For instruments
with a non-numerical display (bar-graph, LEDs only, etc.), the instruments’ display shall
not change from the pre-test response. Remove the radiation source and repeat the test.
No alarms shall occur as a result of the RF radiation alone. NOTE—The COV
requirement is not applicable when testing without radiation sources.

63
ANSI N42.33 – American National Standard for Portable Radiation Detection Instrumentation
for Homeland Security
8.2 Radio Frequency
8.2.1 Requirement
The instrument shall not be affected by radio frequency (RF) fields over the frequency
range of 80 MHz to 2.5 GHz at an intensity of 10 volts per meter (V/m). No alarms shall
occur as a result of the RF radiation alone.
8.2.2 Test method
The test shall be performed using the following technique. Expose the instrument to a
137Cs gamma source. Collect ten independent readings and calculate the mean reading,
standard deviation, and coefficient of variation. Increase the exposure rate as needed to
obtain a COV value that is ≤12%. NOTE—It may be necessary to increase the alarm
threshold to prevent an alarm due to the exposure rate used for testing. Place the
instrument and source in a RF controlled environment and expose it to a RF field of 20
V/m as measured without an instrument present in the test cell over a frequency range of
80 MHz to 2.5 GHz that is 80% amplitude modulated with a 1 kHz sine wave. The test
should be performed using an automated sweep at a frequency change rate not greater
than 1% of the fundamental frequency. Observe the instrument during exposure to the RF
field. Repeat the test without the additional radiation field. NOTE—The COV
requirement is not applicable when testing without radioactive sources. The results are
acceptable if no alarms, spurious indications, or reproducible changes in response occur
that exceed ±15% of the initial indicated value. If susceptibilities occur, retest the
instrument over the frequency bands where susceptibility was observed at 10 V/m in
three mutually orthogonal orientations. If the instrument now passes the test, the results
are considered acceptable.

64
ANSI N42.34 – American National Standard Performance Criteria for Hand-Held Instruments
for the Detection and Identification of Radionuclides
8.2 Radio Frequency (RF) Susceptibility
8.2.1 Requirement
The instrument should not be affected by RF fields over the frequency range of 80 MHz
to 2500 MHz at an intensity of 10 volts per meter (V/m).
8.2.2 Test method
The test shall be performed using the following technique. Without radiation test sources,
expose the instrument to an RF field of 20 V/m over a frequency range of 80 MHz to
2500 MHz that is 80% amplitude modulated with a 1 kHz sine wave. The test should be
performed using an automated sweep at a frequency change rate not greater 1% of the
fundamental (previous) frequency. Dwell time should be chosen based on the
instrument’s response time, but should not be less than 3 s. NOTE—20 V/m is selected
so that the test can be performed in one orientation. Repeat the test with the instrument
exposed to 137Cs and 252Cf positioned to provide a stable response on the instrument. If
susceptibilities are indicated by substantial changes in the indicated readings (deviations
exceeding ±15% of the initial mean gamma-ray or neutron readings) or other operational
changes such as alarm activation, the RF exposure shall be repeated over the range of
susceptibility at 10 V/m in three orientations relative to the emission source. The results
are acceptable if no alarms, spurious indications, or reproducible changes in response
occur that exceed ±15% of the initial indicated value.

65
ANSI N42.35 – American National Standard for Evaluation and Performance of Radiation
Detection Portal Monitors for Use in Homeland Security
8.1 Radio Frequency (RF)
8.1.1 Requirement
The monitor should not be affected by RF fields over the frequency range of 80 MHz to
2500 MHz at an intensity of 10 volts per meter (V/m).
8.1.2 Test method
The system may be disassembled for test purposes, unless the monitor enclosure is
designed to insulate internal components. All components including interconnections
shall be tested. Due to the physical size of a portal monitor system, it may be necessary to
reposition the system within the RF field to ensure that each area is exposed at the proper
intensity. The test shall be performed using the following technique. Place the complete
monitor or those components that have the greatest potential for susceptibility in a
controlled RF environment and expose to a RF field of 20 V/m over a frequency range of
80 MHz to 2500 MHz that is 80% amplitude modulated with a 1 kHz sine wave. The test
should be performed using an automated sweep at a frequency change rate not greater 1%
of the fundamental (previous) frequency. Dwell time should be chosen based on the
monitor’s response time, but should not be less than 3 s. NOTE—20 V/m is selected so
that the test can be performed in one orientation. If susceptibilities are indicated by
substantial changes in the indicated readings (deviations exceeding ±15% of the initial
mean gamma-ray or neutron readings) or other operational changes such as alarm
activation, the RF exposure shall be repeated over the range of susceptibility at 10 V/m in
three orientations relative to the emission source. The test is acceptable if no alarms or
other spurious indications occur and if there is no substantial change in response
(reproducible deviations not exceeding ±15% of the initial mean gamma-ray or neutron
readings) during the RF exposure.

66
ANSI N42.38 – American National Standard Performance Criteria Spectroscopy-Based Portal
Monitors Used for Homeland Security
8.2 Radio Frequency (RF) Susceptibility
8.2.1 Requirement
The monitor should not be affected by RF fields over the frequency range of 20 MHz to
2500 MHz at an intensity of 10 volts per meter (V/m).
8.2.2 Test method
NOTE—Due to the physical size of a portal monitor system, individual components can
be gathered together for test purposes, although this is not recommended. Place the
monitor (as a whole system or collection of components) in a controlled RF environment
and expose it to an RF field of 20 V/m over a frequency range of 20 MHz to 2500 MHz
that is 80% amplitude modulated with a 1 kHz sine wave. NOTE—Due to the physical
size of a portal monitor system, it may be necessary to reposition the system within the
RF field to ensure that each area is exposed at the proper intensity. The test should be
performed using an automated sweep at a frequency change rate not greater 1% of the
fundamental (previous) frequency. Dwell time should be chosen based on the monitor’s
response time, but should not be less than 3 s. NOTE—20 V/m is selected so that the test
can be performed in one orientation. If susceptibilities are indicated by substantial
changes in the indicated readings (deviations exceeding ±15% of the initial mean gamma-
ray or neutron readings) or other operational changes such as alarm activation, the RF
exposure shall be repeated over the range of susceptibility at 10 V/m in three orientations
relative to the emission source. The test is acceptable if no alarms, spurious indications,
or reproducible changes in response occur that exceed ±15% of the initial indicated value.

67
ANSI N42.43 – American National Standard Performance Criteria for Mobile and Transportable
Radiation Monitors Used for Homeland Security
8.1 Radio Frequency (RF)
8.1.1 Requirement
The monitor should not be affected by RF fields over the frequency range of 80 MHz to
2500 MHz at an intensity of 10 V/m. Because backpacks are typically used where they
may be exposed to the higher intensities found in close proximity to cell phones, the
performance requirement for RF is 50 V/m.
8.1.2 Test method
Place the complete monitor or those components that have the greatest potential for
susceptibility in a controlled RF environment and expose it to a RF field of 20 V/m (50
V/m for backpacks) over a frequency range of 80 MHz to 2500 MHz that is 80%
amplitude modulated with a 1 kHz sine wave. The test should be performed using an
automated sweep at a frequency change rate not greater 1% of the fundamental (previous)
frequency. Dwell time should be chosen based on the monitor’s response time, but should
not be less than 3 s. NOTE—20 V/m is selected so that the test can be performed in one
orientation. Backpacks will require to be tested in multiple orientations. If susceptibilities
are indicated by substantial changes in the indicated readings (deviations exceeding
±15% of the initial mean gamma-ray or neutron readings) or other operational changes
such as alarm activation, the RF exposure shall be repeated over the range of
susceptibility at 10 V/m (50 V/m for backpacks) in three orientations relative to the
emission source. The test is acceptable if no alarms, spurious indications, or changes in
response occur that exceed ±15% of the initial indicated value.

68
ANSI N42.48 – American National Standard Performance Requirements for Spectroscopic
Personal Radiation Detectors (SPRDs) for Homeland Security
8.3 Radio Frequency
8.3.1 Requirement
The instrument shall not be affected by radio frequency (RF) fields over the frequency
range of 80 MHz to 2.5 GHz at an intensity of 50 volts per meter (V/m). When exposed
to these RF fields, the instrument shall function correctly. No alarms shall occur as a
result of the RF field alone.
8.3.2 Test method
Prior to the RF test, establish the nominal reading. Place the instrument and source in a
RF controlled environment and expose it to a RF field of 50 V/m as measured without an
instrument present in the test cell over a frequency range of 80 MHz to 2.5 GHz that is
80% amplitude modulated with a 1-kHz sine wave. The test should be performed using
an automated sweep at a frequency change rate not greater than 1% of the fundamental.
The instrument’s readings during the test should be within ±15% of the nominal reading.
No other functional changes shall occur, such as alarm activation, mode changes, loss of
display, etc. Remove the radiation source and repeat the test.

69
ANSI N42.53 – American National Standard Performance Criteria for Backpack-Based
Radiation Detection Systems Used for Homeland Security
8.1 Radio Frequency (RF)
8.1.1 Requirements
A BRD should not be affected by radio frequency (RF) fields over the frequency range of
80 MHz to 6000 MHz. The field intensity shall be 50 V/m over the frequency range from
80 MHz to 1000 MHz. For frequencies over 1000 MHz, the intensity is 3 V/m. NOTE—
Wireless interface technologies, such as IEEE 802.11, IEEE 802.15.1, and 900-MHz
radio, may not work in the presence of RF. 50 V/m is selected due to the likely presence
of RF emitters in close proximity to the BRD when worn. The remaining requirements
are from the reference standard IEC 61000-4-3.
8.1.2 Test method
The susceptibility test shall be performed with and without radiation sources (background
only). Statistical requirements are not used for background-only measurements.
A) Place the BRD in the test chamber oriented with the detection side (0° as shown in
Figure 3) facing the emission source. RF test set up information can be found in IEC
61000-4-3.
B) With the BRD and any components normally used by the operator (e.g., tethered
display) in position for test, expose the BRD to a gamma-ray and neutron radiation field
(when applicable) using 137Cs and 252Cf.
C) Record ten readings with the source(s) present.
D) Calculate and record the mean, standard deviation, and COV. The COV shall be less
than or equal to 12%. If the COV is greater than 12%, the radiation level should be
increased to reduce the variation between readings. Due to the expected low response of
the neutron detector, a COV greater than 12% is acceptable for the neutron response.
E) Using the acceptable mean reading, establish the acceptance range of ±15%.
F) With the sources in position, expose the BRD to an RF field of 50 V/m over a
frequency range from 80 MHz to 1000 MHz and 3 V/m for frequencies up to 6000 MHz
that is 80% amplitude modulated with a 1-kHz sine wave. The test should be performed
using an automated sweep at a frequency change rate not greater 1% of the fundamental
(previous) frequency. Dwell time at each frequency should be chosen based on the
BRD’s response time, but should not be less than 3 s.
G) Observe the response of the BRD during the RF exposure. Record any functional
changes that may occur (e.g., alarms, fault indications) and frequency ranges where the
gamma or neutron response went outside of the acceptance range.
H) Without changing the positions of the source(s) or BRD, repeat the RF exposure over
the frequency ranges where the response was outside of the acceptance range to verify
susceptibility.
I) Repeat f) through h) without the sources. Due to the low response levels, the use of
±15% of the average background readings is not required.
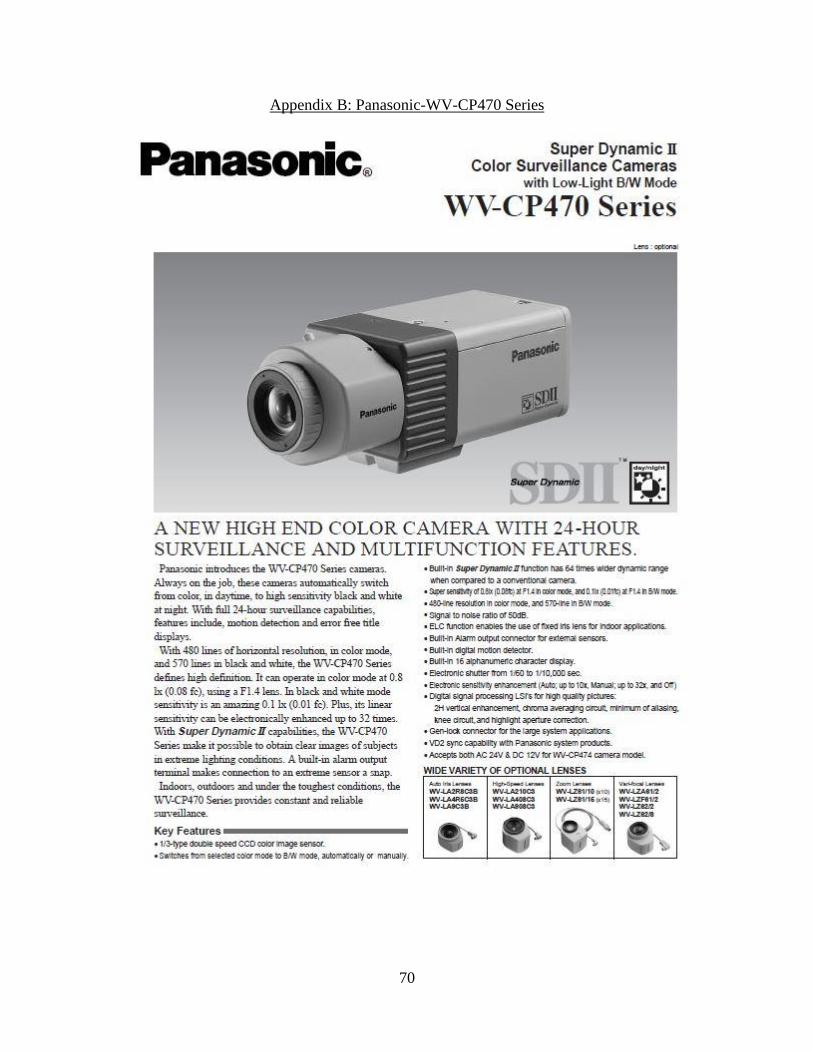
70
Appendix B: Panasonic-WV-CP470 Series

71

72
Appendix C: Narda NBM-550 High Frequency Broadband Meter

73

74

75

76

77

78
Appendix D: Material Specifications

79

80
Ferrite Bead Clip
Source: EBAY, 2015
Source: EBAY, 2015

81
VITA
KEVIN A. MAININI
Education: Farragut High School, Knoxville, Tennessee
B.S. Manufacturing Engineering Technology with disciplines in
Mechanical and Electrical Engineering,
East Tennessee State University,
Johnson City, Tennessee, 2013
M.S. Engineering Technology with disciplines in
Mechanical and Electrical Engineering,
East Tennessee State University,
Johnson City, Tennessee, 2015
Professional Experience: Research Assistant, Oak Ridge National Laboratory; Oak Ridge,
Tennessee, 2013 - 2015
Graduate Assistant, East Tennessee State University, College of Business and Technology, 2013 – 2015
Publications: Mainini, Kevin A. (2014). "Engineered Improvements to Increase
Efficiency and Capabilities of Radiation Detection Test
Equipment in the Technical Testing and Analysis Center."
Oak Ridge National Lab. Oak Ridge, Tennessee