Embed Size (px)
Citation preview
96
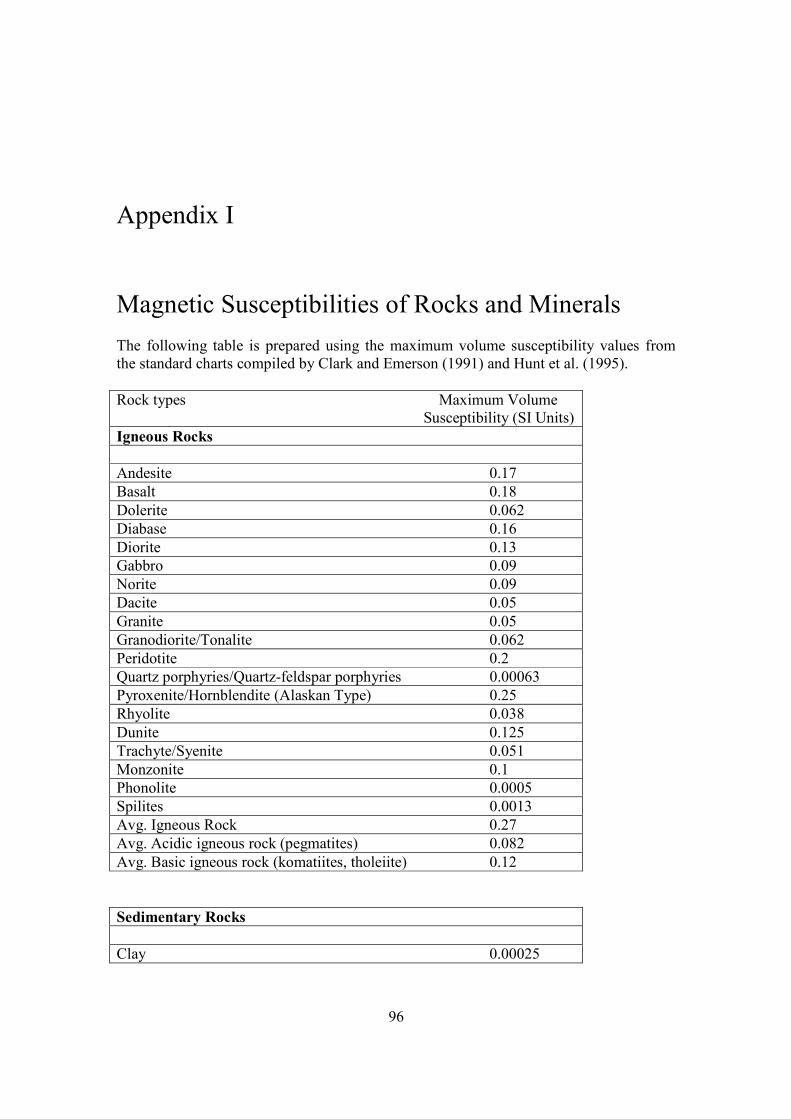
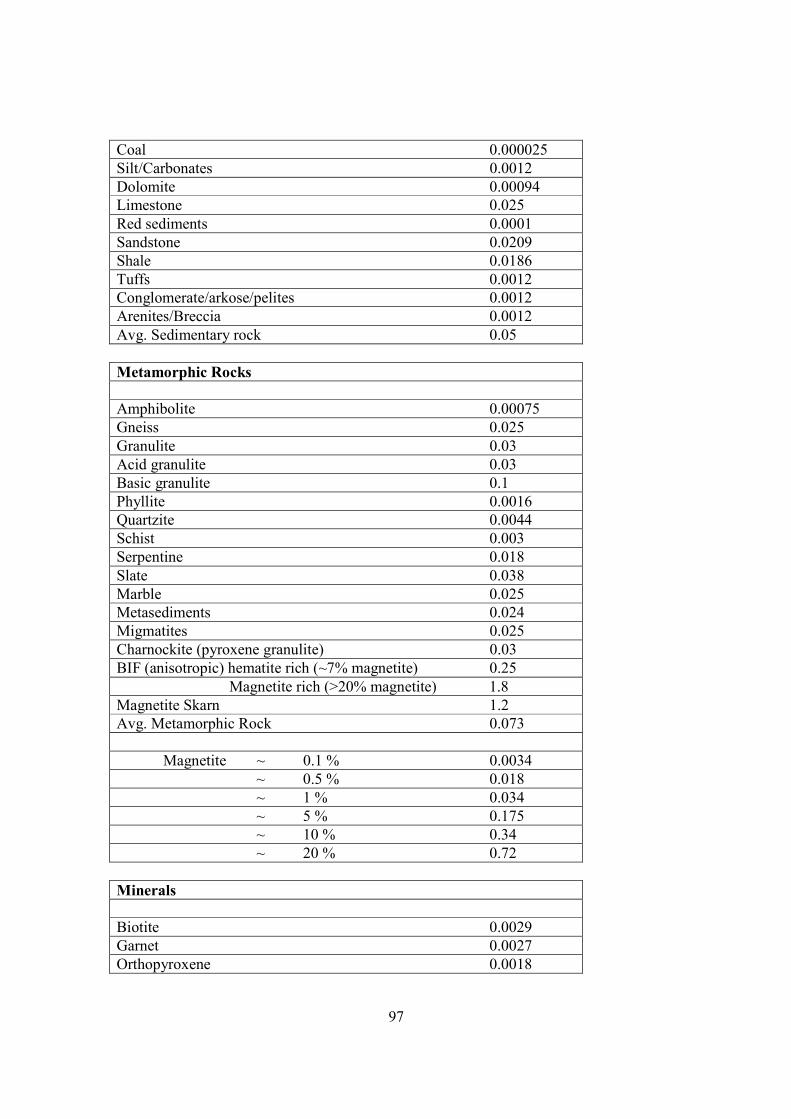
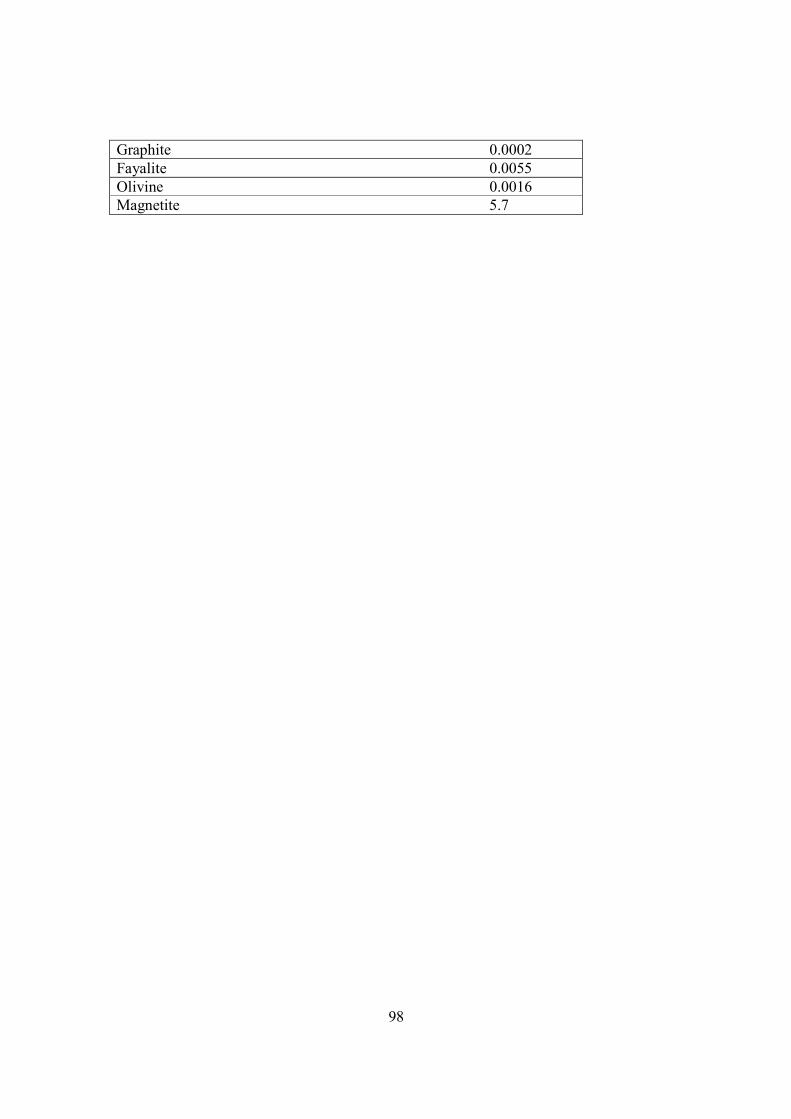
Appendix I Magnetic Susceptibilities of Rocks and Minerals The following table is prepared using the maximum volume susceptibility values from the standard charts compiled by Clark and Emerson (1991) and Hunt et al. (1995). Rock types Maximum Volume Susceptibility (SI Units) Igneous Rocks Andesite 0.17 Basalt 0.18 Dolerite 0.062 Diabase 0.16 Diorite 0.13 Gabbro 0.09 Norite 0.09 Dacite 0.05 Granite 0.05 Granodiorite/Tonalite 0.062 Peridotite 0.2 Quartz porphyries/Quartz-feldspar porphyries 0.00063 Pyroxenite/Hornblendite (Alaskan Type) 0.25 Rhyolite 0.038 Dunite 0.125 Trachyte/Syenite 0.051 Monzonite 0.1 Phonolite 0.0005 Spilites 0.0013 Avg. Igneous Rock 0.27 Avg. Acidic igneous rock (pegmatites) 0.082 Avg. Basic igneous rock (komatiites, tholeiite) 0.12 Sedimentary Rocks Clay 0.00025
97
Coal 0.000025 Silt/Carbonates 0.0012 Dolomite 0.00094 Limestone 0.025 Red sediments 0.0001 Sandstone 0.0209 Shale 0.0186 Tuffs 0.0012 Conglomerate/arkose/pelites 0.0012 Arenites/Breccia 0.0012 Avg. Sedimentary rock 0.05 Metamorphic Rocks Amphibolite 0.00075 Gneiss 0.025 Granulite 0.03 Acid granulite 0.03 Basic granulite 0.1 Phyllite 0.0016 Quartzite 0.0044 Schist 0.003 Serpentine 0.018 Slate 0.038 Marble 0.025 Metasediments 0.024 Migmatites 0.025 Charnockite (pyroxene granulite) 0.03 BIF (anisotropic) hematite rich (~7% magnetite) 0.25 Magnetite rich (>20% magnetite) 1.8 Magnetite Skarn 1.2 Avg. Metamorphic Rock 0.073 Magnetite ~ 0.1 % 0.0034 ~ 0.5 % 0.018 ~ 1 % 0.034 ~ 5 % 0.175 ~ 10 % 0.34 ~ 20 % 0.72 Minerals Biotite 0.0029 Garnet 0.0027 Orthopyroxene 0.0018
98
Graphite 0.0002 Fayalite 0.0055 Olivine 0.0016 Magnetite 5.7
99
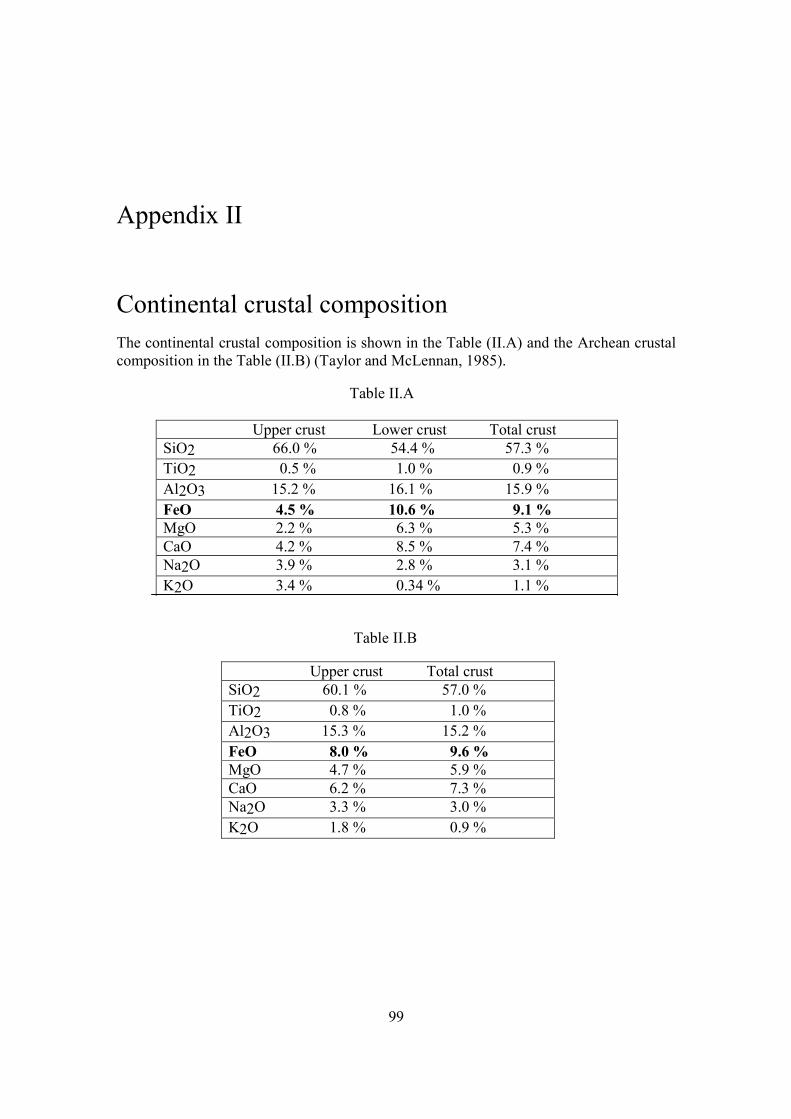
Appendix II Continental crustal composition The continental crustal composition is shown in the Table (II.A) and the Archean crustal composition in the Table (II.B) (Taylor and McLennan, 1985).
Table II.A
Upper crust Lower crust Total crust SiO2 66.0 % 54.4 % 57.3 % TiO2 0.5 % 1.0 % 0.9 % Al2O3 15.2 % 16.1 % 15.9 % FeO 4.5 % 10.6 % 9.1 % MgO 2.2 % 6.3 % 5.3 % CaO 4.2 % 8.5 % 7.4 % Na2O 3.9 % 2.8 % 3.1 % K2O 3.4 % 0.34 % 1.1 %
Table II.B
Upper crust Total crust SiO2 60.1 % 57.0 % TiO2 0.8 % 1.0 % Al2O3 15.3 % 15.2 % FeO 8.0 % 9.6 % MgO 4.7 % 5.9 % CaO 6.2 % 7.3 % Na2O 3.3 % 3.0 % K2O 1.8 % 0.9 %
100
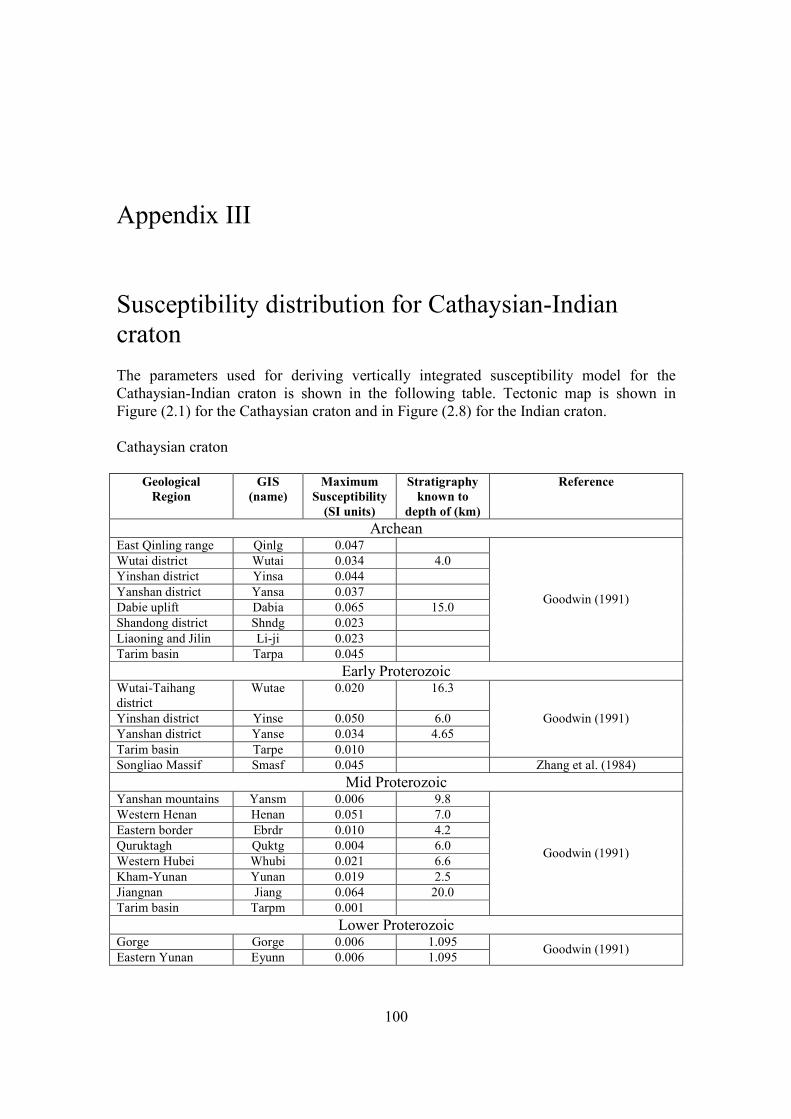
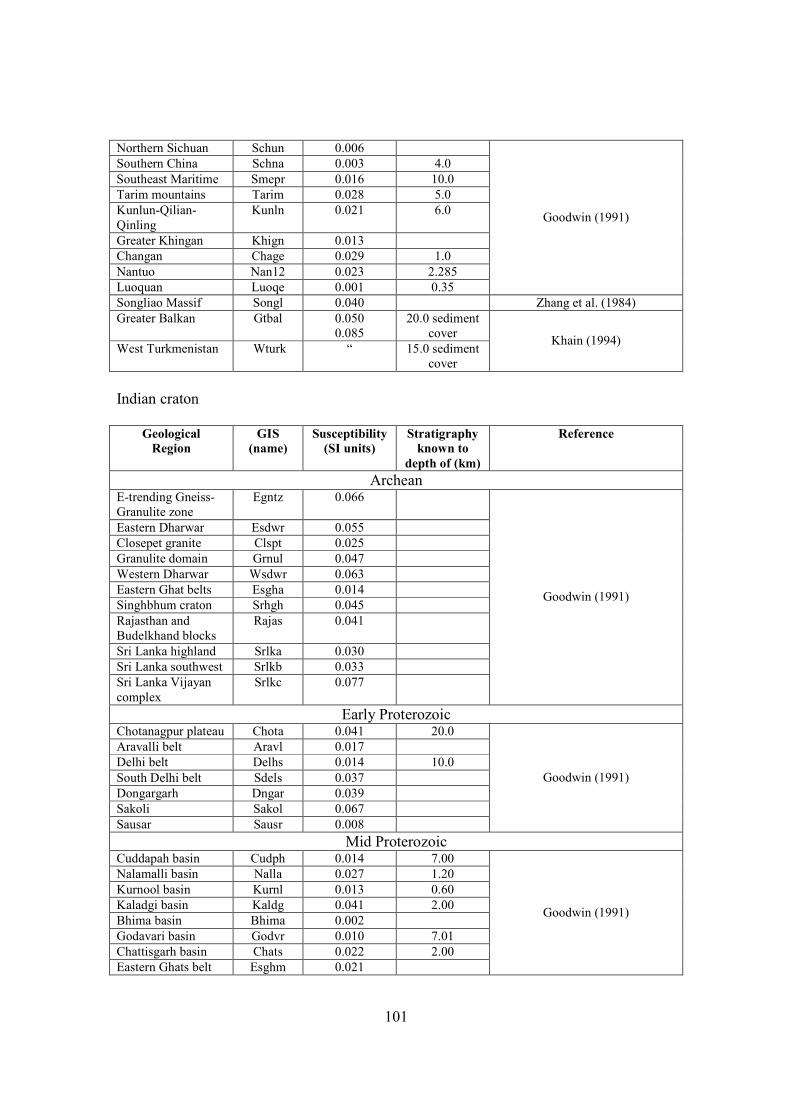
Appendix III Susceptibility distribution for Cathaysian-Indian craton The parameters used for deriving vertically integrated susceptibility model for the Cathaysian-Indian craton is shown in the following table. Tectonic map is shown in Figure (2.1) for the Cathaysian craton and in Figure (2.8) for the Indian craton. Cathaysian craton
Geological Region
GIS (name)
Maximum Susceptibility
(SI units)
Stratigraphy known to
depth of (km)
Reference
Archean East Qinling range Qinlg 0.047 Wutai district Wutai 0.034 4.0 Yinshan district Yinsa 0.044 Yanshan district Yansa 0.037 Dabie uplift Dabia 0.065 15.0 Shandong district Shndg 0.023 Liaoning and Jilin Li-ji 0.023 Tarim basin Tarpa 0.045
Goodwin (1991)
Early Proterozoic Wutai-Taihang district
Wutae 0.020 16.3
Yinshan district Yinse 0.050 6.0 Yanshan district Yanse 0.034 4.65 Tarim basin Tarpe 0.010
Goodwin (1991)
Songliao Massif Smasf 0.045 Zhang et al. (1984) Mid Proterozoic
Yanshan mountains Yansm 0.006 9.8 Western Henan Henan 0.051 7.0 Eastern border Ebrdr 0.010 4.2 Quruktagh Quktg 0.004 6.0 Western Hubei Whubi 0.021 6.6 Kham-Yunan Yunan 0.019 2.5 Jiangnan Jiang 0.064 20.0 Tarim basin Tarpm 0.001
Goodwin (1991)
Lower Proterozoic Gorge Gorge 0.006 1.095 Eastern Yunan Eyunn 0.006 1.095 Goodwin (1991)
101
Northern Sichuan Schun 0.006 Southern China Schna 0.003 4.0 Southeast Maritime Smepr 0.016 10.0 Tarim mountains Tarim 0.028 5.0 Kunlun-Qilian-Qinling
Kunln 0.021 6.0
Greater Khingan Khign 0.013 Changan Chage 0.029 1.0 Nantuo Nan12 0.023 2.285 Luoquan Luoqe 0.001 0.35
Goodwin (1991)
Songliao Massif Songl 0.040 Zhang et al. (1984) Greater Balkan Gtbal 0.050
0.085 20.0 sediment
cover West Turkmenistan Wturk “ 15.0 sediment
cover
Khain (1994)
Indian craton
Geological Region
GIS (name)
Susceptibility (SI units)
Stratigraphy known to
depth of (km)
Reference
Archean E-trending Gneiss-Granulite zone
Egntz 0.066
Eastern Dharwar Esdwr 0.055 Closepet granite Clspt 0.025 Granulite domain Grnul 0.047 Western Dharwar Wsdwr 0.063 Eastern Ghat belts Esgha 0.014 Singhbhum craton Srhgh 0.045 Rajasthan and Budelkhand blocks
Rajas 0.041
Sri Lanka highland Srlka 0.030 Sri Lanka southwest Srlkb 0.033 Sri Lanka Vijayan complex
Srlkc 0.077
Goodwin (1991)
Early Proterozoic Chotanagpur plateau Chota 0.041 20.0 Aravalli belt Aravl 0.017 Delhi belt Delhs 0.014 10.0 South Delhi belt Sdels 0.037 Dongargarh Dngar 0.039 Sakoli Sakol 0.067 Sausar Sausr 0.008
Goodwin (1991)
Mid Proterozoic Cuddapah basin Cudph 0.014 7.00 Nalamalli basin Nalla 0.027 1.20 Kurnool basin Kurnl 0.013 0.60 Kaladgi basin Kaldg 0.041 2.00 Bhima basin Bhima 0.002 Godavari basin Godvr 0.010 7.01 Chattisgarh basin Chats 0.022 2.00 Eastern Ghats belt Esghm 0.021
Goodwin (1991)
102
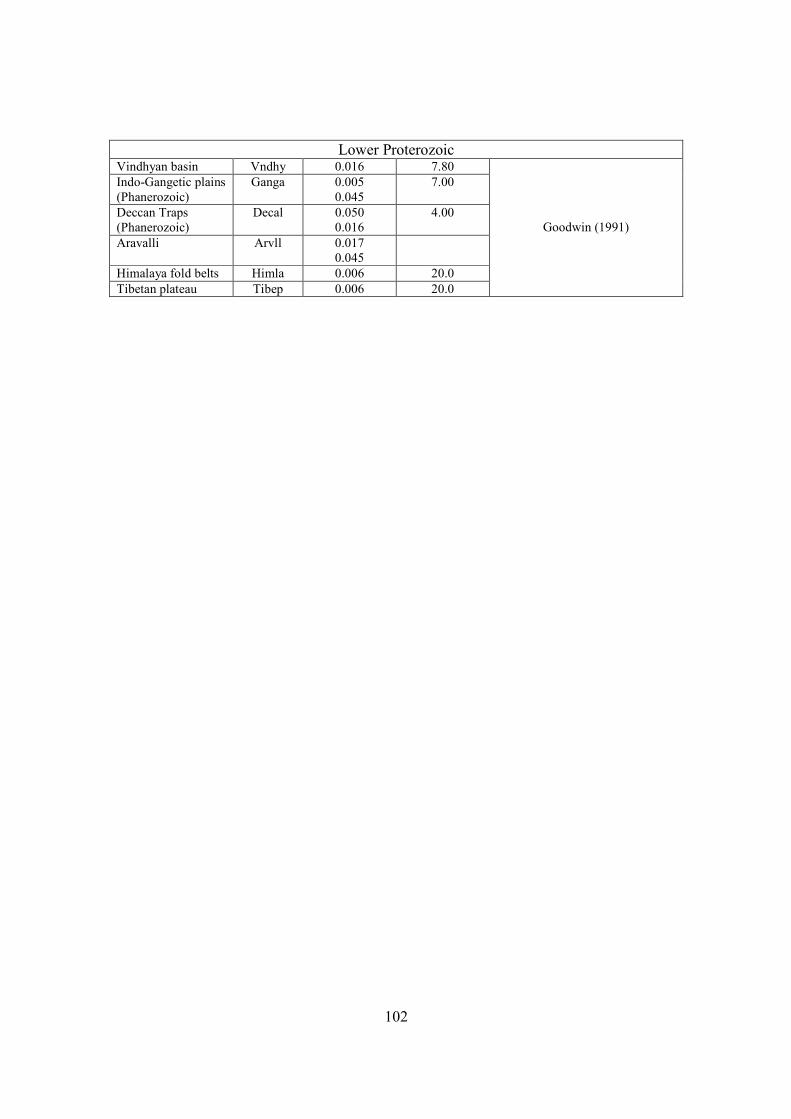
Lower Proterozoic Vindhyan basin Vndhy 0.016 7.80 Indo-Gangetic plains (Phanerozoic)
Ganga 0.005 0.045
7.00
Deccan Traps (Phanerozoic)
Decal 0.050 0.016
4.00
Aravalli
Arvll 0.017 0.045
Himalaya fold belts Himla 0.006 20.0 Tibetan plateau Tibep 0.006 20.0
Goodwin (1991)
103
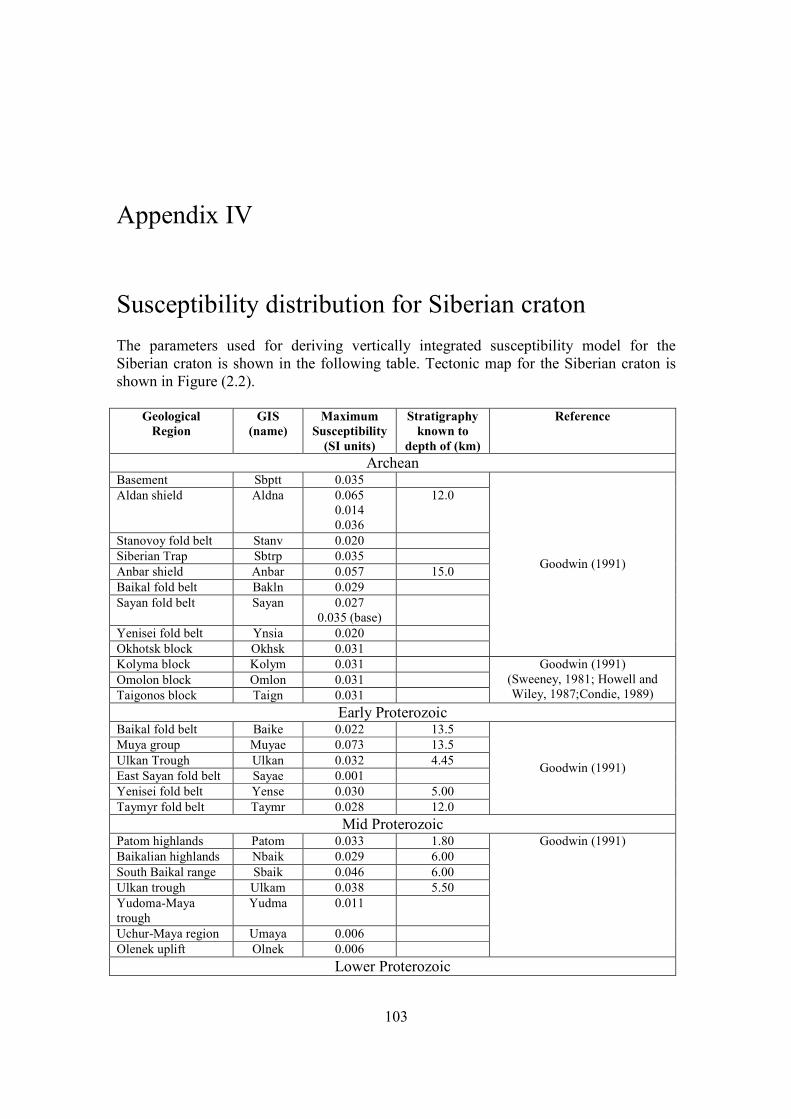
Appendix IV Susceptibility distribution for Siberian craton The parameters used for deriving vertically integrated susceptibility model for the Siberian craton is shown in the following table. Tectonic map for the Siberian craton is shown in Figure (2.2).
Geological Region
GIS (name)
Maximum Susceptibility
(SI units)
Stratigraphy known to
depth of (km)
Reference
Archean Basement Sbptt 0.035 Aldan shield Aldna 0.065
0.014 0.036
12.0
Stanovoy fold belt Stanv 0.020 Siberian Trap Sbtrp 0.035 Anbar shield Anbar 0.057 15.0 Baikal fold belt Bakln 0.029 Sayan fold belt Sayan 0.027
0.035 (base)
Yenisei fold belt Ynsia 0.020 Okhotsk block Okhsk 0.031
Goodwin (1991)
Kolyma block Kolym 0.031 Omolon block Omlon 0.031 Taigonos block Taign 0.031
Goodwin (1991) (Sweeney, 1981; Howell and Wiley, 1987;Condie, 1989)
Early Proterozoic Baikal fold belt Baike 0.022 13.5 Muya group Muyae 0.073 13.5 Ulkan Trough Ulkan 0.032 4.45 East Sayan fold belt Sayae 0.001 Yenisei fold belt Yense 0.030 5.00 Taymyr fold belt Taymr 0.028 12.0
Goodwin (1991)
Mid Proterozoic Patom highlands Patom 0.033 1.80 Baikalian highlands Nbaik 0.029 6.00 South Baikal range Sbaik 0.046 6.00 Ulkan trough Ulkam 0.038 5.50 Yudoma-Maya trough
Yudma 0.011
Uchur-Maya region Umaya 0.006 Olenek uplift Olnek 0.006
Goodwin (1991)
Lower Proterozoic
104
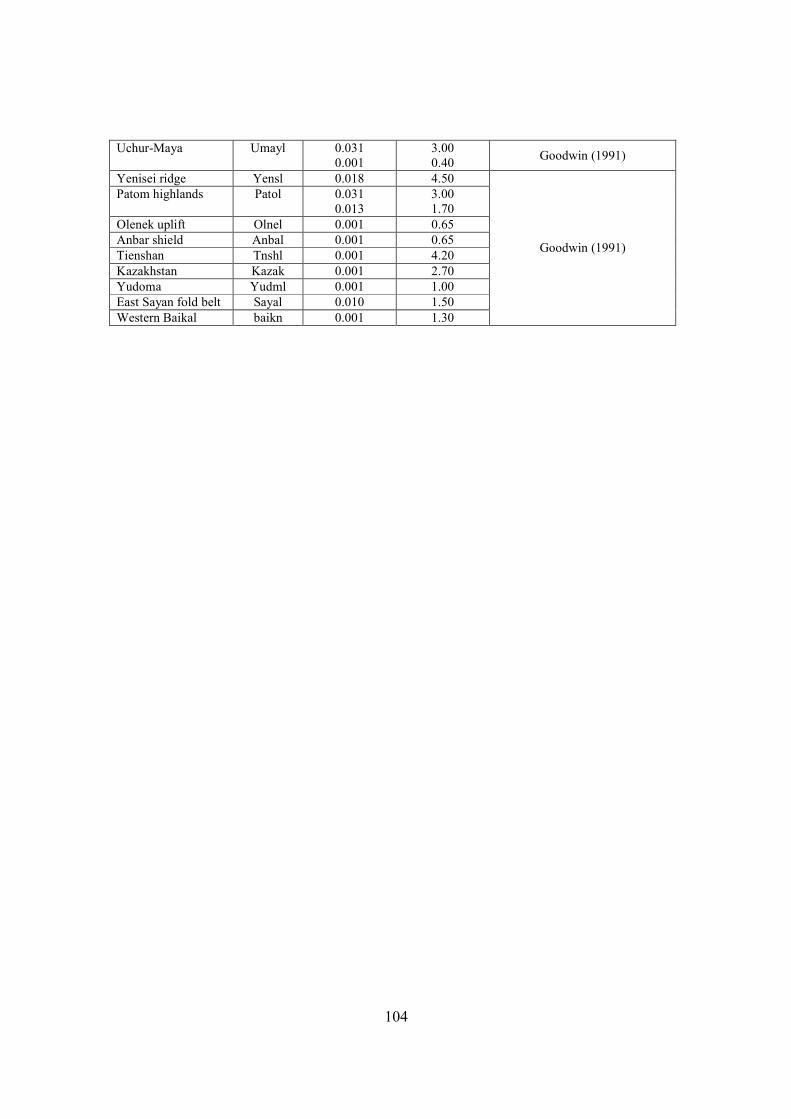
Uchur-Maya Umayl 0.031 0.001
3.00 0.40 Goodwin (1991)
Yenisei ridge Yensl 0.018 4.50 Patom highlands Patol 0.031
0.013 3.00 1.70
Olenek uplift Olnel 0.001 0.65 Anbar shield Anbal 0.001 0.65 Tienshan Tnshl 0.001 4.20 Kazakhstan Kazak 0.001 2.70 Yudoma Yudml 0.001 1.00 East Sayan fold belt Sayal 0.010 1.50 Western Baikal baikn 0.001 1.30
Goodwin (1991)
105
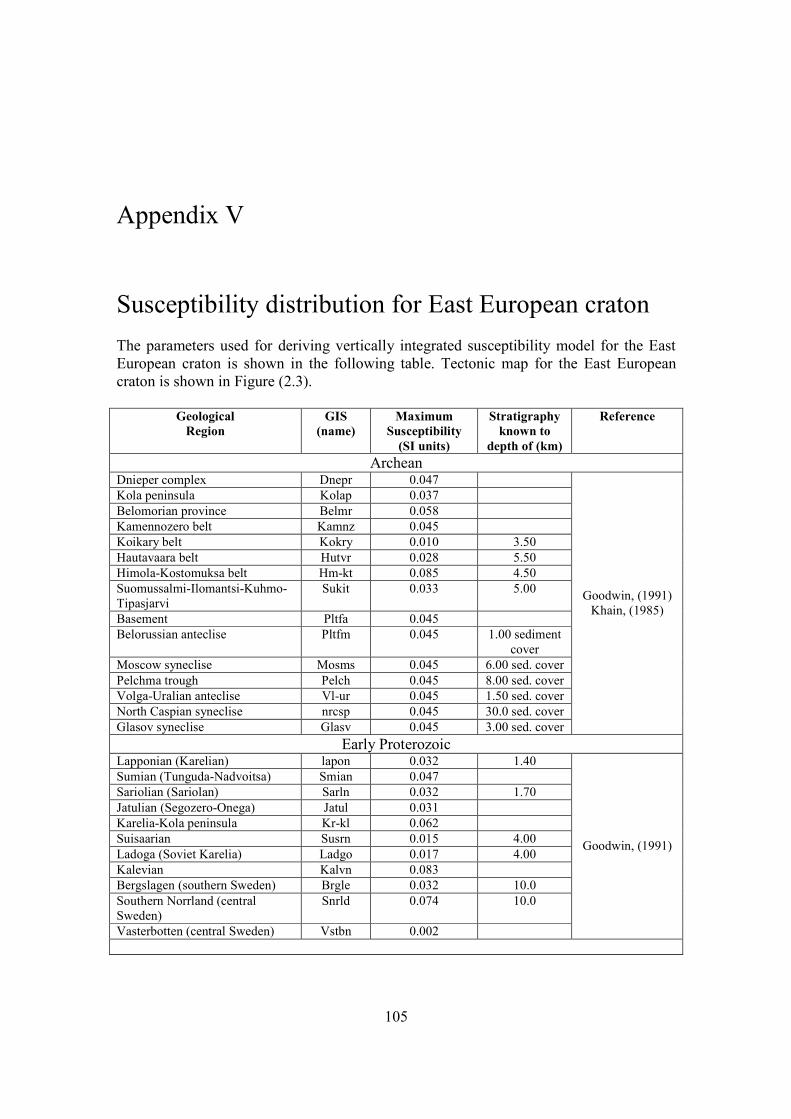
Appendix V Susceptibility distribution for East European craton The parameters used for deriving vertically integrated susceptibility model for the East European craton is shown in the following table. Tectonic map for the East European craton is shown in Figure (2.3).
Geological Region
GIS (name)
Maximum Susceptibility
(SI units)
Stratigraphy known to
depth of (km)
Reference
Archean Dnieper complex Dnepr 0.047 Kola peninsula Kolap 0.037 Belomorian province Belmr 0.058 Kamennozero belt Kamnz 0.045 Koikary belt Kokry 0.010 3.50 Hautavaara belt Hutvr 0.028 5.50 Himola-Kostomuksa belt Hm-kt 0.085 4.50 Suomussalmi-Ilomantsi-Kuhmo-Tipasjarvi
Sukit 0.033 5.00
Basement Pltfa 0.045 Belorussian anteclise Pltfm 0.045 1.00 sediment
cover Moscow syneclise Mosms 0.045 6.00 sed. cover Pelchma trough Pelch 0.045 8.00 sed. cover Volga-Uralian anteclise Vl-ur 0.045 1.50 sed. cover North Caspian syneclise nrcsp 0.045 30.0 sed. cover Glasov syneclise Glasv 0.045 3.00 sed. cover
Goodwin, (1991) Khain, (1985)
Early Proterozoic Lapponian (Karelian) lapon 0.032 1.40 Sumian (Tunguda-Nadvoitsa) Smian 0.047 Sariolian (Sariolan) Sarln 0.032 1.70 Jatulian (Segozero-Onega) Jatul 0.031 Karelia-Kola peninsula Kr-kl 0.062 Suisaarian Susrn 0.015 4.00 Ladoga (Soviet Karelia) Ladgo 0.017 4.00 Kalevian Kalvn 0.083 Bergslagen (southern Sweden) Brgle 0.032 10.0 Southern Norrland (central Sweden)
Snrld 0.074 10.0
Vasterbotten (central Sweden) Vstbn 0.002
Goodwin, (1991)
106
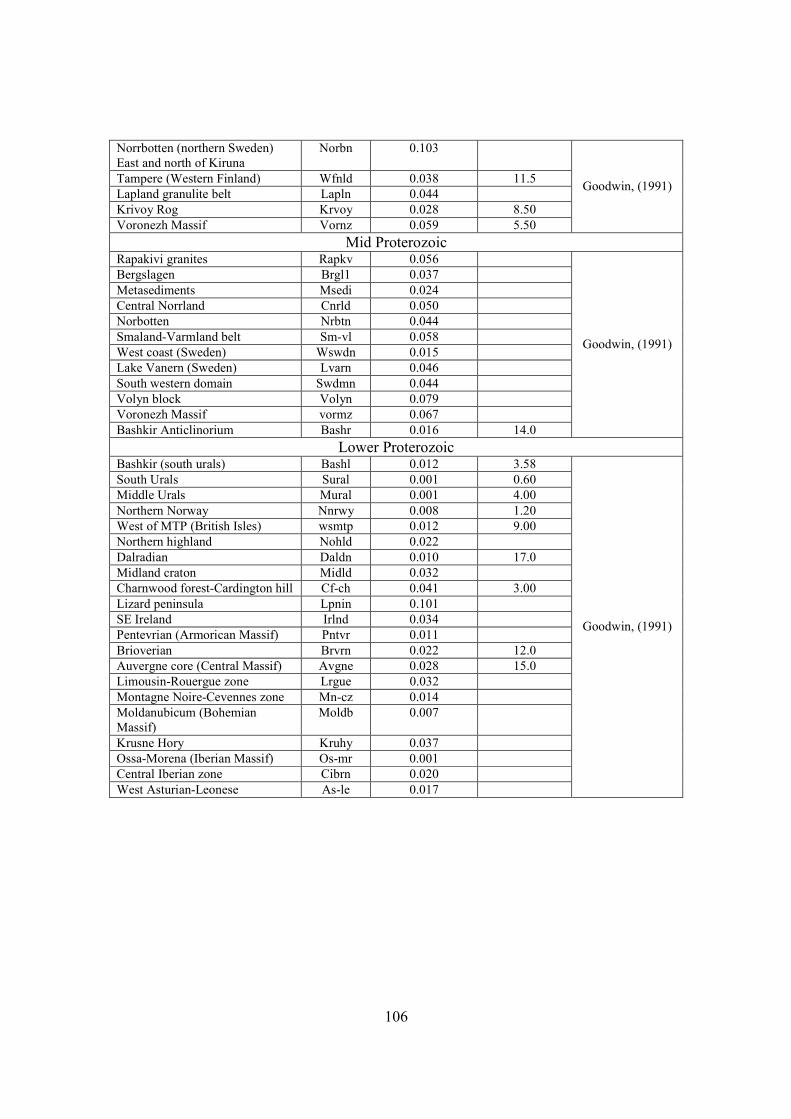
Norrbotten (northern Sweden) East and north of Kiruna
Norbn 0.103
Tampere (Western Finland) Wfnld 0.038 11.5 Lapland granulite belt Lapln 0.044 Krivoy Rog Krvoy 0.028 8.50 Voronezh Massif Vornz 0.059 5.50
Goodwin, (1991)
Mid Proterozoic Rapakivi granites Rapkv 0.056 Bergslagen Brgl1 0.037 Metasediments Msedi 0.024 Central Norrland Cnrld 0.050 Norbotten Nrbtn 0.044 Smaland-Varmland belt Sm-vl 0.058 West coast (Sweden) Wswdn 0.015 Lake Vanern (Sweden) Lvarn 0.046 South western domain Swdmn 0.044 Volyn block Volyn 0.079 Voronezh Massif vormz 0.067 Bashkir Anticlinorium Bashr 0.016 14.0
Goodwin, (1991)
Lower Proterozoic Bashkir (south urals) Bashl 0.012 3.58 South Urals Sural 0.001 0.60 Middle Urals Mural 0.001 4.00 Northern Norway Nnrwy 0.008 1.20 West of MTP (British Isles) wsmtp 0.012 9.00 Northern highland Nohld 0.022 Dalradian Daldn 0.010 17.0 Midland craton Midld 0.032 Charnwood forest-Cardington hill Cf-ch 0.041 3.00 Lizard peninsula Lpnin 0.101 SE Ireland Irlnd 0.034 Pentevrian (Armorican Massif) Pntvr 0.011 Brioverian Brvrn 0.022 12.0 Auvergne core (Central Massif) Avgne 0.028 15.0 Limousin-Rouergue zone Lrgue 0.032 Montagne Noire-Cevennes zone Mn-cz 0.014 Moldanubicum (Bohemian Massif)
Moldb 0.007
Krusne Hory Kruhy 0.037 Ossa-Morena (Iberian Massif) Os-mr 0.001 Central Iberian zone Cibrn 0.020 West Asturian-Leonese As-le 0.017
Goodwin, (1991)
107
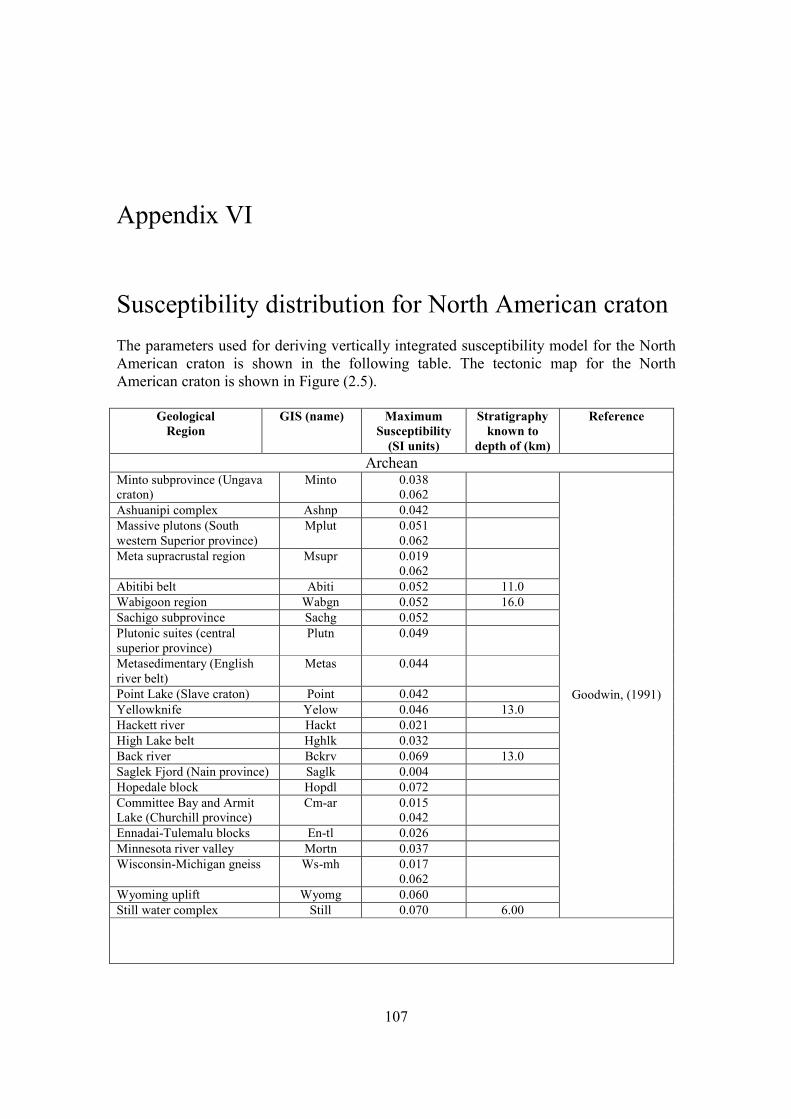
Appendix VI Susceptibility distribution for North American craton The parameters used for deriving vertically integrated susceptibility model for the North American craton is shown in the following table. The tectonic map for the North American craton is shown in Figure (2.5).
Geological Region
GIS (name) Maximum Susceptibility
(SI units)
Stratigraphy known to
depth of (km)
Reference
Archean Minto subprovince (Ungava craton)
Minto 0.038 0.062
Ashuanipi complex Ashnp 0.042 Massive plutons (South western Superior province)
Mplut 0.051 0.062
Meta supracrustal region Msupr 0.019 0.062
Abitibi belt Abiti 0.052 11.0 Wabigoon region Wabgn 0.052 16.0 Sachigo subprovince Sachg 0.052 Plutonic suites (central superior province)
Plutn 0.049
Metasedimentary (English river belt)
Metas 0.044
Point Lake (Slave craton) Point 0.042 Yellowknife Yelow 0.046 13.0 Hackett river Hackt 0.021 High Lake belt Hghlk 0.032 Back river Bckrv 0.069 13.0 Saglek Fjord (Nain province) Saglk 0.004 Hopedale block Hopdl 0.072 Committee Bay and Armit Lake (Churchill province)
Cm-ar 0.015 0.042
Ennadai-Tulemalu blocks En-tl 0.026 Minnesota river valley Mortn 0.037 Wisconsin-Michigan gneiss Ws-mh 0.017
0.062
Wyoming uplift Wyomg 0.060 Still water complex Still 0.070 6.00
Goodwin, (1991)
108
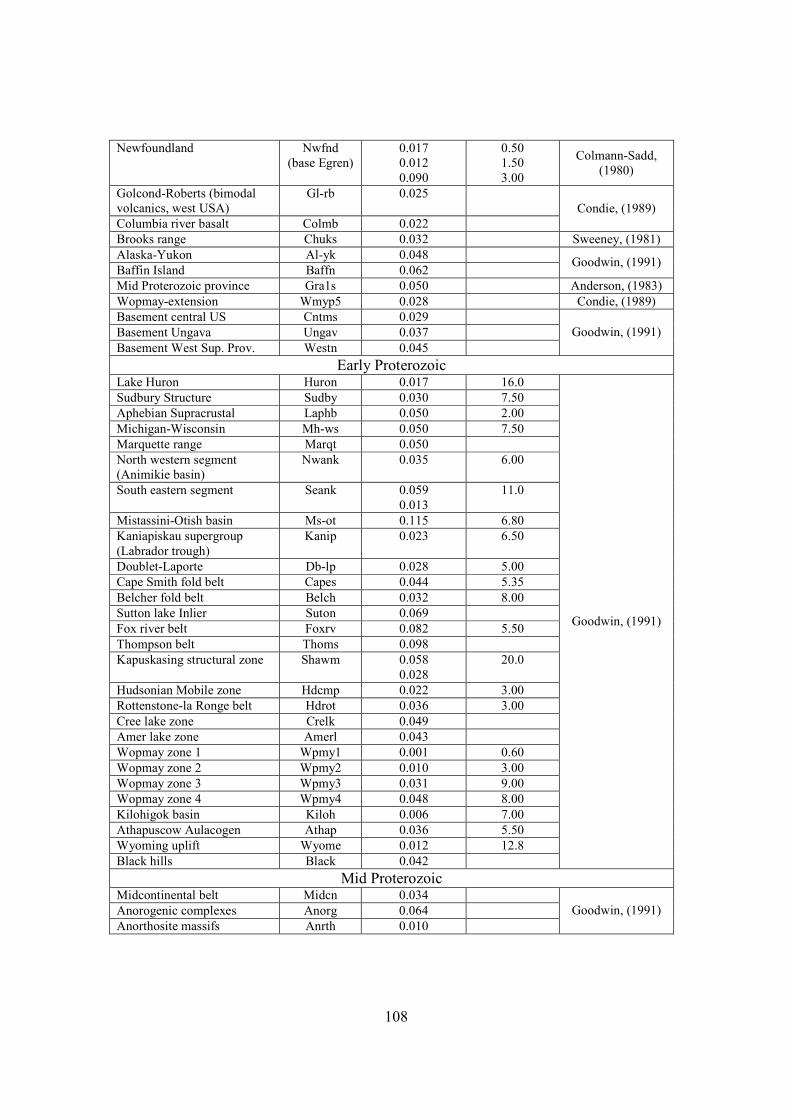
Newfoundland
Nwfnd (base Egren)
0.017 0.012 0.090
0.50 1.50 3.00
Colmann-Sadd, (1980)
Golcond-Roberts (bimodal volcanics, west USA)
Gl-rb 0.025
Columbia river basalt Colmb 0.022 Condie, (1989)
Brooks range Chuks 0.032 Sweeney, (1981) Alaska-Yukon Al-yk 0.048 Baffin Island Baffn 0.062 Goodwin, (1991)
Mid Proterozoic province Gra1s 0.050 Anderson, (1983) Wopmay-extension Wmyp5 0.028 Condie, (1989) Basement central US Cntms 0.029 Basement Ungava Ungav 0.037 Basement West Sup. Prov. Westn 0.045
Goodwin, (1991)
Early Proterozoic Lake Huron Huron 0.017 16.0 Sudbury Structure Sudby 0.030 7.50 Aphebian Supracrustal Laphb 0.050 2.00 Michigan-Wisconsin Mh-ws 0.050 7.50 Marquette range Marqt 0.050 North western segment (Animikie basin)
Nwank 0.035 6.00
South eastern segment Seank 0.059 0.013
11.0
Mistassini-Otish basin Ms-ot 0.115 6.80 Kaniapiskau supergroup (Labrador trough)
Kanip 0.023 6.50
Doublet-Laporte Db-lp 0.028 5.00 Cape Smith fold belt Capes 0.044 5.35 Belcher fold belt Belch 0.032 8.00 Sutton lake Inlier Suton 0.069 Fox river belt Foxrv 0.082 5.50 Thompson belt Thoms 0.098 Kapuskasing structural zone Shawm 0.058
0.028 20.0
Hudsonian Mobile zone Hdcmp 0.022 3.00 Rottenstone-la Ronge belt Hdrot 0.036 3.00 Cree lake zone Crelk 0.049 Amer lake zone Amerl 0.043 Wopmay zone 1 Wpmy1 0.001 0.60 Wopmay zone 2 Wpmy2 0.010 3.00 Wopmay zone 3 Wpmy3 0.031 9.00 Wopmay zone 4 Wpmy4 0.048 8.00 Kilohigok basin Kiloh 0.006 7.00 Athapuscow Aulacogen Athap 0.036 5.50 Wyoming uplift Wyome 0.012 12.8 Black hills Black 0.042
Goodwin, (1991)
Mid Proterozoic Midcontinental belt Midcn 0.034 Anorogenic complexes Anorg 0.064 Anorthosite massifs Anrth 0.010
Goodwin, (1991)
109
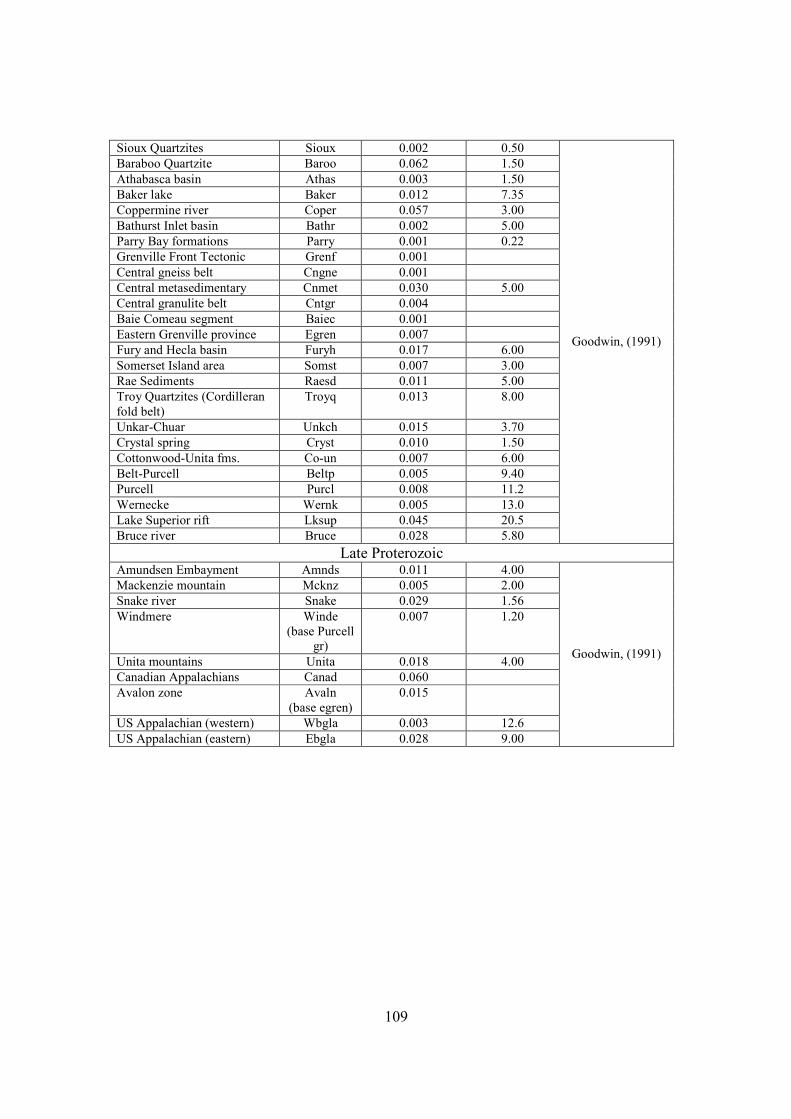
Sioux Quartzites Sioux 0.002 0.50 Baraboo Quartzite Baroo 0.062 1.50 Athabasca basin Athas 0.003 1.50 Baker lake Baker 0.012 7.35 Coppermine river Coper 0.057 3.00 Bathurst Inlet basin Bathr 0.002 5.00 Parry Bay formations Parry 0.001 0.22 Grenville Front Tectonic Grenf 0.001 Central gneiss belt Cngne 0.001 Central metasedimentary Cnmet 0.030 5.00 Central granulite belt Cntgr 0.004 Baie Comeau segment Baiec 0.001 Eastern Grenville province Egren 0.007 Fury and Hecla basin Furyh 0.017 6.00 Somerset Island area Somst 0.007 3.00 Rae Sediments Raesd 0.011 5.00 Troy Quartzites (Cordilleran fold belt)
Troyq 0.013 8.00
Unkar-Chuar Unkch 0.015 3.70 Crystal spring Cryst 0.010 1.50 Cottonwood-Unita fms. Co-un 0.007 6.00 Belt-Purcell Beltp 0.005 9.40 Purcell Purcl 0.008 11.2 Wernecke Wernk 0.005 13.0 Lake Superior rift Lksup 0.045 20.5 Bruce river Bruce 0.028 5.80
Goodwin, (1991)
Late Proterozoic Amundsen Embayment Amnds 0.011 4.00 Mackenzie mountain Mcknz 0.005 2.00 Snake river Snake 0.029 1.56 Windmere Winde
(base Purcell gr)
0.007 1.20
Unita mountains Unita 0.018 4.00 Canadian Appalachians Canad 0.060 Avalon zone Avaln
(base egren) 0.015
US Appalachian (western) Wbgla 0.003 12.6 US Appalachian (eastern) Ebgla 0.028 9.00
Goodwin, (1991)
110
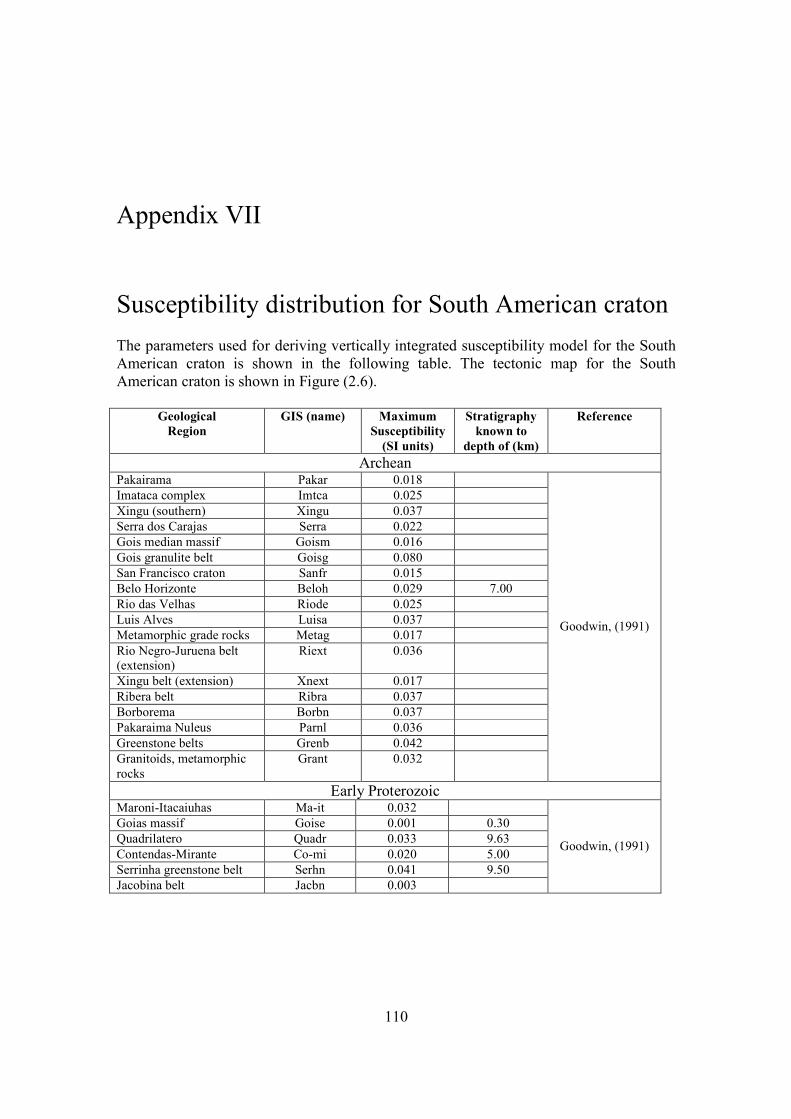
Appendix VII Susceptibility distribution for South American craton The parameters used for deriving vertically integrated susceptibility model for the South American craton is shown in the following table. The tectonic map for the South American craton is shown in Figure (2.6).
Geological Region
GIS (name) Maximum Susceptibility
(SI units)
Stratigraphy known to
depth of (km)
Reference
Archean Pakairama Pakar 0.018 Imataca complex Imtca 0.025 Xingu (southern) Xingu 0.037 Serra dos Carajas Serra 0.022 Gois median massif Goism 0.016 Gois granulite belt Goisg 0.080 San Francisco craton Sanfr 0.015 Belo Horizonte Beloh 0.029 7.00 Rio das Velhas Riode 0.025 Luis Alves Luisa 0.037 Metamorphic grade rocks Metag 0.017 Rio Negro-Juruena belt (extension)
Riext 0.036
Xingu belt (extension) Xnext 0.017 Ribera belt Ribra 0.037 Borborema Borbn 0.037 Pakaraima Nuleus Parnl 0.036 Greenstone belts Grenb 0.042 Granitoids, metamorphic rocks
Grant 0.032
Goodwin, (1991)
Early Proterozoic Maroni-Itacaiuhas Ma-it 0.032 Goias massif Goise 0.001 0.30 Quadrilatero Quadr 0.033 9.63 Contendas-Mirante Co-mi 0.020 5.00 Serrinha greenstone belt Serhn 0.041 9.50 Jacobina belt Jacbn 0.003
Goodwin, (1991)
111
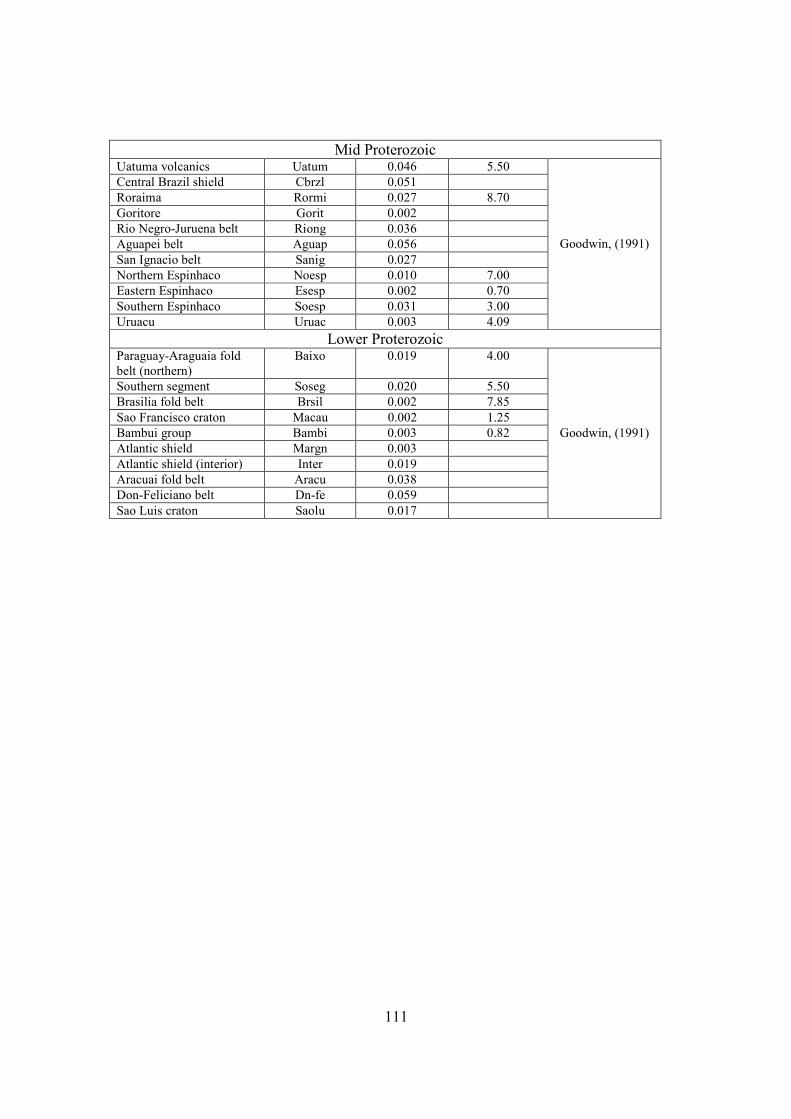
Mid Proterozoic Uatuma volcanics Uatum 0.046 5.50 Central Brazil shield Cbrzl 0.051 Roraima Rormi 0.027 8.70 Goritore Gorit 0.002 Rio Negro-Juruena belt Riong 0.036 Aguapei belt Aguap 0.056 San Ignacio belt Sanig 0.027 Northern Espinhaco Noesp 0.010 7.00 Eastern Espinhaco Esesp 0.002 0.70 Southern Espinhaco Soesp 0.031 3.00 Uruacu Uruac 0.003 4.09
Goodwin, (1991)
Lower Proterozoic Paraguay-Araguaia fold belt (northern)
Baixo 0.019 4.00
Southern segment Soseg 0.020 5.50 Brasilia fold belt Brsil 0.002 7.85 Sao Francisco craton Macau 0.002 1.25 Bambui group Bambi 0.003 0.82 Atlantic shield Margn 0.003 Atlantic shield (interior) Inter 0.019 Aracuai fold belt Aracu 0.038 Don-Feliciano belt Dn-fe 0.059 Sao Luis craton Saolu 0.017
Goodwin, (1991)
112
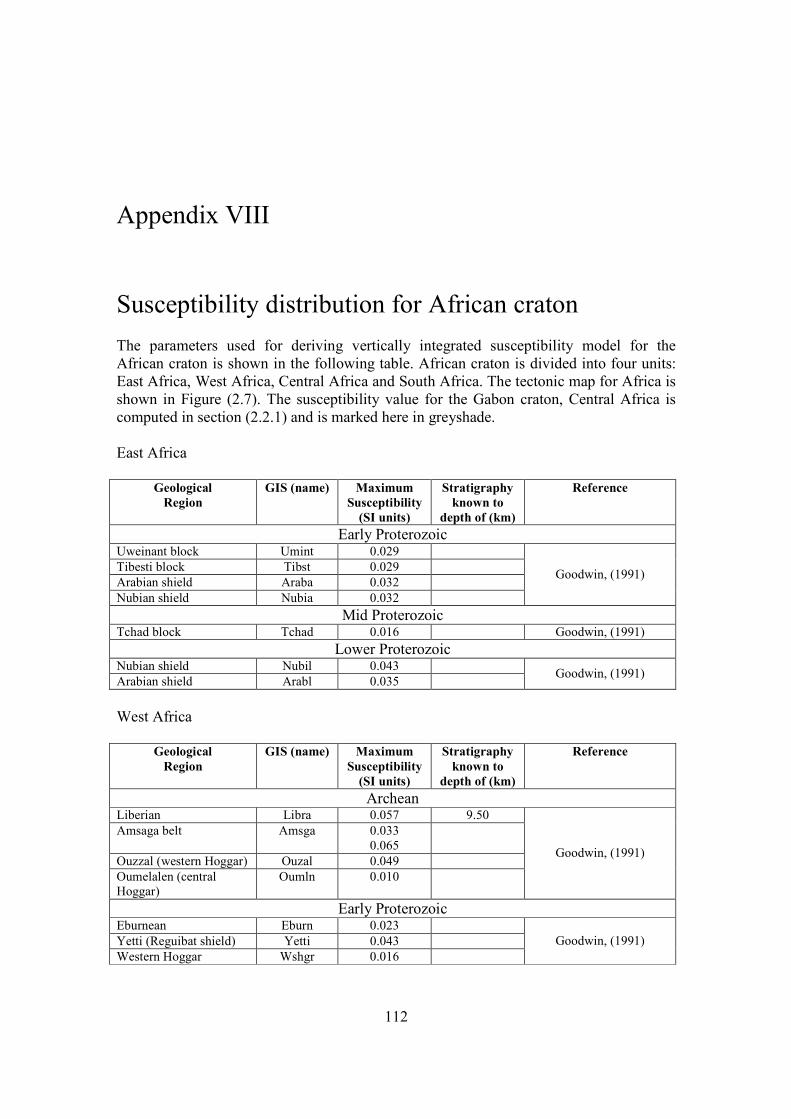
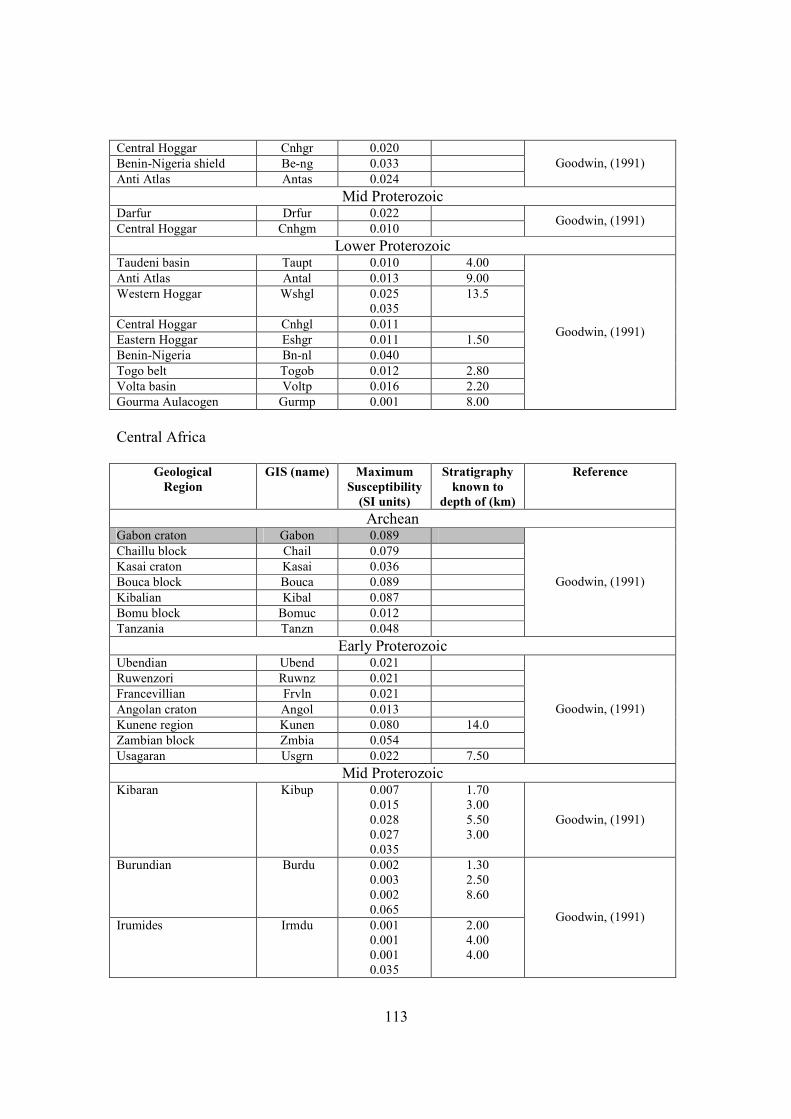
Appendix VIII Susceptibility distribution for African craton The parameters used for deriving vertically integrated susceptibility model for the African craton is shown in the following table. African craton is divided into four units: East Africa, West Africa, Central Africa and South Africa. The tectonic map for Africa is shown in Figure (2.7). The susceptibility value for the Gabon craton, Central Africa is computed in section (2.2.1) and is marked here in greyshade. East Africa
Geological Region
GIS (name) Maximum Susceptibility
(SI units)
Stratigraphy known to
depth of (km)
Reference
Early Proterozoic Uweinant block Umint 0.029 Tibesti block Tibst 0.029 Arabian shield Araba 0.032 Nubian shield Nubia 0.032
Goodwin, (1991)
Mid Proterozoic Tchad block Tchad 0.016 Goodwin, (1991)
Lower Proterozoic Nubian shield Nubil 0.043 Arabian shield Arabl 0.035 Goodwin, (1991)
West Africa
Geological Region
GIS (name) Maximum Susceptibility
(SI units)
Stratigraphy known to
depth of (km)
Reference
Archean Liberian Libra 0.057 9.50 Amsaga belt Amsga 0.033
0.065
Ouzzal (western Hoggar) Ouzal 0.049 Oumelalen (central Hoggar)
Oumln 0.010
Goodwin, (1991)
Early Proterozoic Eburnean Eburn 0.023 Yetti (Reguibat shield) Yetti 0.043 Western Hoggar Wshgr 0.016
Goodwin, (1991)
113
Central Hoggar Cnhgr 0.020 Benin-Nigeria shield Be-ng 0.033 Anti Atlas Antas 0.024
Goodwin, (1991)
Mid Proterozoic Darfur Drfur 0.022 Central Hoggar Cnhgm 0.010 Goodwin, (1991)
Lower Proterozoic Taudeni basin Taupt 0.010 4.00 Anti Atlas Antal 0.013 9.00 Western Hoggar Wshgl 0.025
0.035 13.5
Central Hoggar Cnhgl 0.011 Eastern Hoggar Eshgr 0.011 1.50 Benin-Nigeria Bn-nl 0.040 Togo belt Togob 0.012 2.80 Volta basin Voltp 0.016 2.20 Gourma Aulacogen Gurmp 0.001 8.00
Goodwin, (1991)
Central Africa
Geological Region
GIS (name) Maximum Susceptibility
(SI units)
Stratigraphy known to
depth of (km)
Reference
Archean Gabon craton Gabon 0.089 Chaillu block Chail 0.079 Kasai craton Kasai 0.036 Bouca block Bouca 0.089 Kibalian Kibal 0.087 Bomu block Bomuc 0.012 Tanzania Tanzn 0.048
Goodwin, (1991)
Early Proterozoic Ubendian Ubend 0.021 Ruwenzori Ruwnz 0.021 Francevillian Frvln 0.021 Angolan craton Angol 0.013 Kunene region Kunen 0.080 14.0 Zambian block Zmbia 0.054 Usagaran Usgrn 0.022 7.50
Goodwin, (1991)
Mid Proterozoic Kibaran Kibup 0.007
0.015 0.028 0.027 0.035
1.70 3.00 5.50 3.00
Goodwin, (1991)
Burundian Burdu 0.002 0.003 0.002 0.065
1.30 2.50 8.60
Irumides Irmdu 0.001 0.001 0.001 0.035
2.00 4.00 4.00
Goodwin, (1991)
114
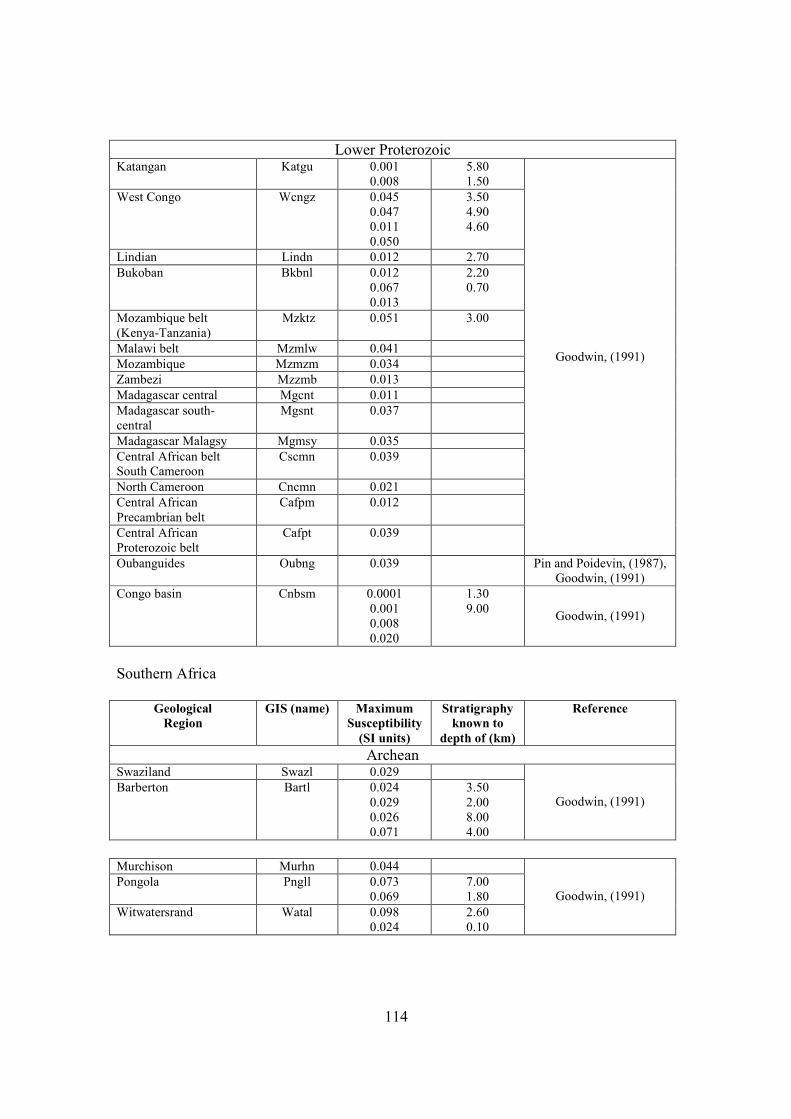
Lower Proterozoic Katangan Katgu 0.001
0.008 5.80 1.50
West Congo Wcngz 0.045 0.047 0.011 0.050
3.50 4.90 4.60
Lindian Lindn 0.012 2.70 Bukoban Bkbnl 0.012
0.067 0.013
2.20 0.70
Mozambique belt (Kenya-Tanzania)
Mzktz 0.051 3.00
Malawi belt Mzmlw 0.041 Mozambique Mzmzm 0.034 Zambezi Mzzmb 0.013 Madagascar central Mgcnt 0.011 Madagascar south-central
Mgsnt 0.037
Madagascar Malagsy Mgmsy 0.035 Central African belt South Cameroon
Cscmn 0.039
North Cameroon Cncmn 0.021 Central African Precambrian belt
Cafpm 0.012
Central African Proterozoic belt
Cafpt 0.039
Goodwin, (1991)
Oubanguides Oubng 0.039 Pin and Poidevin, (1987), Goodwin, (1991)
Congo basin Cnbsm 0.0001 0.001 0.008 0.020
1.30 9.00
Goodwin, (1991)
Southern Africa
Geological Region
GIS (name) Maximum Susceptibility
(SI units)
Stratigraphy known to
depth of (km)
Reference
Archean Swaziland Swazl 0.029 Barberton Bartl 0.024
0.029 0.026 0.071
3.50 2.00 8.00 4.00
Goodwin, (1991)
Murchison Murhn 0.044 Pongola Pngll 0.073
0.069 7.00 1.80
Witwatersrand Watal 0.098 0.024
2.60 0.10
Goodwin, (1991)
115
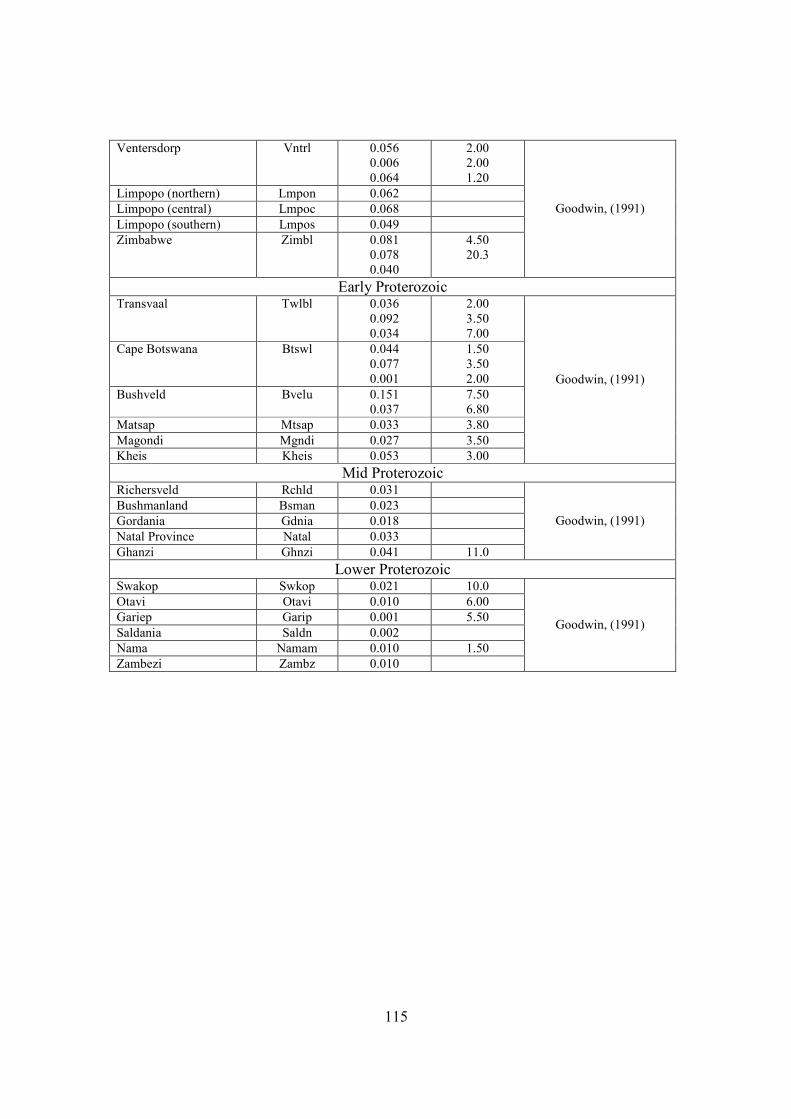
Ventersdorp Vntrl 0.056 0.006 0.064
2.00 2.00 1.20
Limpopo (northern) Lmpon 0.062 Limpopo (central) Lmpoc 0.068 Limpopo (southern) Lmpos 0.049 Zimbabwe Zimbl 0.081
0.078 0.040
4.50 20.3
Goodwin, (1991)
Early Proterozoic Transvaal Twlbl 0.036
0.092 0.034
2.00 3.50 7.00
Cape Botswana Btswl 0.044 0.077 0.001
1.50 3.50 2.00
Bushveld Bvelu 0.151 0.037
7.50 6.80
Matsap Mtsap 0.033 3.80 Magondi Mgndi 0.027 3.50 Kheis Kheis 0.053 3.00
Goodwin, (1991)
Mid Proterozoic Richersveld Rchld 0.031 Bushmanland Bsman 0.023 Gordania Gdnia 0.018 Natal Province Natal 0.033 Ghanzi Ghnzi 0.041 11.0
Goodwin, (1991)
Lower Proterozoic Swakop Swkop 0.021 10.0 Otavi Otavi 0.010 6.00 Gariep Garip 0.001 5.50 Saldania Saldn 0.002 Nama Namam 0.010 1.50 Zambezi Zambz 0.010
Goodwin, (1991)
116
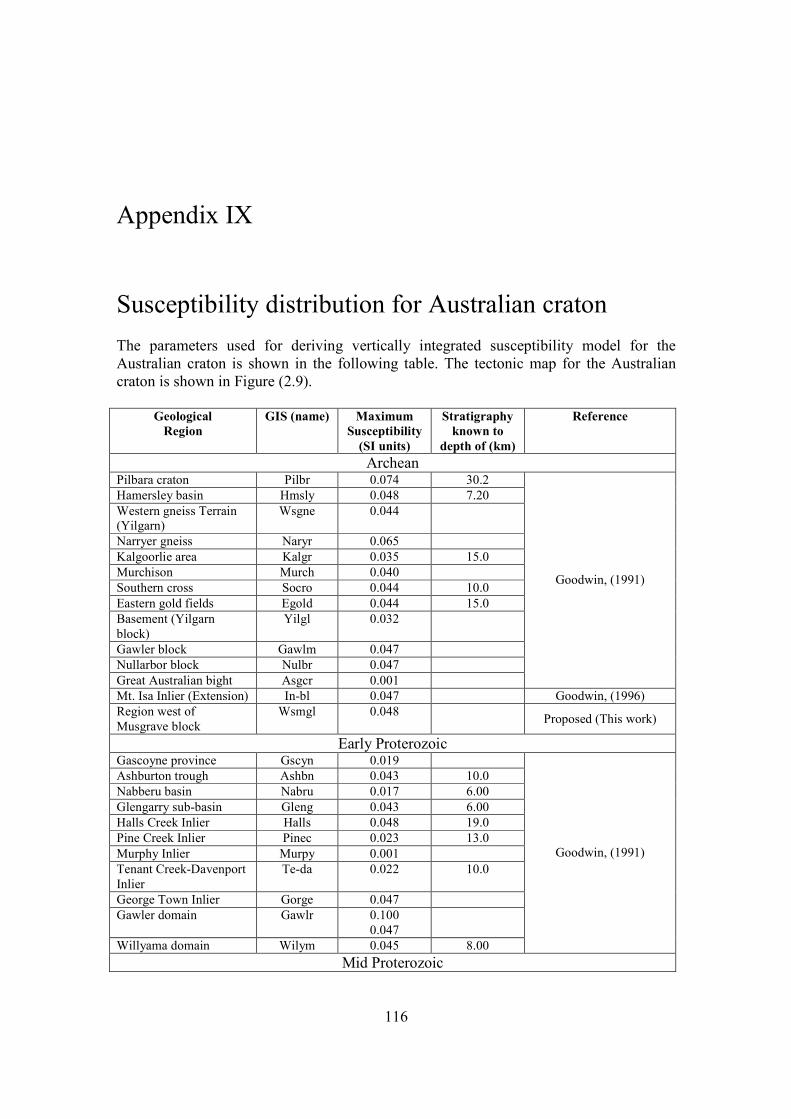
Appendix IX Susceptibility distribution for Australian craton The parameters used for deriving vertically integrated susceptibility model for the Australian craton is shown in the following table. The tectonic map for the Australian craton is shown in Figure (2.9).
Geological Region
GIS (name) Maximum Susceptibility
(SI units)
Stratigraphy known to
depth of (km)
Reference
Archean Pilbara craton Pilbr 0.074 30.2 Hamersley basin Hmsly 0.048 7.20 Western gneiss Terrain (Yilgarn)
Wsgne 0.044
Narryer gneiss Naryr 0.065 Kalgoorlie area Kalgr 0.035 15.0 Murchison Murch 0.040 Southern cross Socro 0.044 10.0 Eastern gold fields Egold 0.044 15.0 Basement (Yilgarn block)
Yilgl 0.032
Gawler block Gawlm 0.047 Nullarbor block Nulbr 0.047 Great Australian bight Asgcr 0.001
Goodwin, (1991)
Mt. Isa Inlier (Extension) In-bl 0.047 Goodwin, (1996) Region west of Musgrave block
Wsmgl 0.048 Proposed (This work)
Early Proterozoic Gascoyne province Gscyn 0.019 Ashburton trough Ashbn 0.043 10.0 Nabberu basin Nabru 0.017 6.00 Glengarry sub-basin Gleng 0.043 6.00 Halls Creek Inlier Halls 0.048 19.0 Pine Creek Inlier Pinec 0.023 13.0 Murphy Inlier Murpy 0.001 Tenant Creek-Davenport Inlier
Te-da 0.022 10.0
George Town Inlier Gorge 0.047 Gawler domain Gawlr 0.100
0.047
Willyama domain Wilym 0.045 8.00
Goodwin, (1991)
Mid Proterozoic
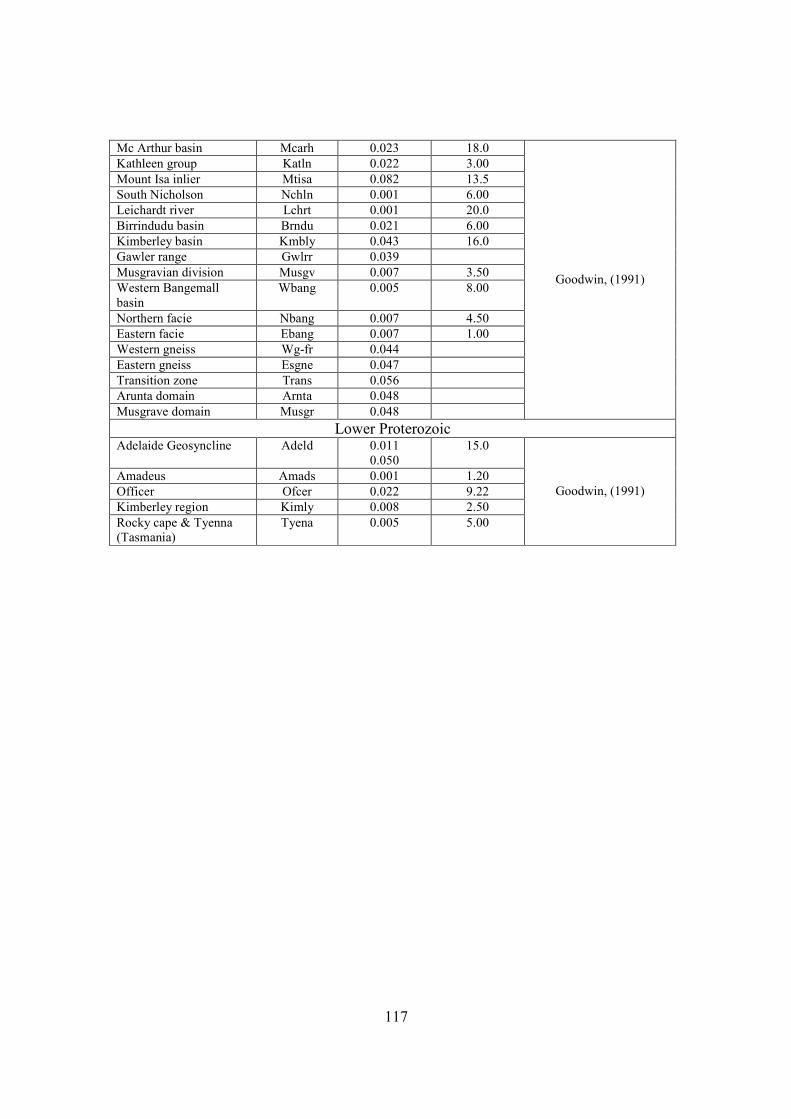
117
Mc Arthur basin Mcarh 0.023 18.0 Kathleen group Katln 0.022 3.00 Mount Isa inlier Mtisa 0.082 13.5 South Nicholson Nchln 0.001 6.00 Leichardt river Lchrt 0.001 20.0 Birrindudu basin Brndu 0.021 6.00 Kimberley basin Kmbly 0.043 16.0 Gawler range Gwlrr 0.039 Musgravian division Musgv 0.007 3.50 Western Bangemall basin
Wbang 0.005 8.00
Northern facie Nbang 0.007 4.50 Eastern facie Ebang 0.007 1.00 Western gneiss Wg-fr 0.044 Eastern gneiss Esgne 0.047 Transition zone Trans 0.056 Arunta domain Arnta 0.048 Musgrave domain Musgr 0.048
Goodwin, (1991)
Lower Proterozoic Adelaide Geosyncline Adeld 0.011
0.050 15.0
Amadeus Amads 0.001 1.20 Officer Ofcer 0.022 9.22 Kimberley region Kimly 0.008 2.50 Rocky cape & Tyenna (Tasmania)
Tyena 0.005 5.00
Goodwin, (1991)
118
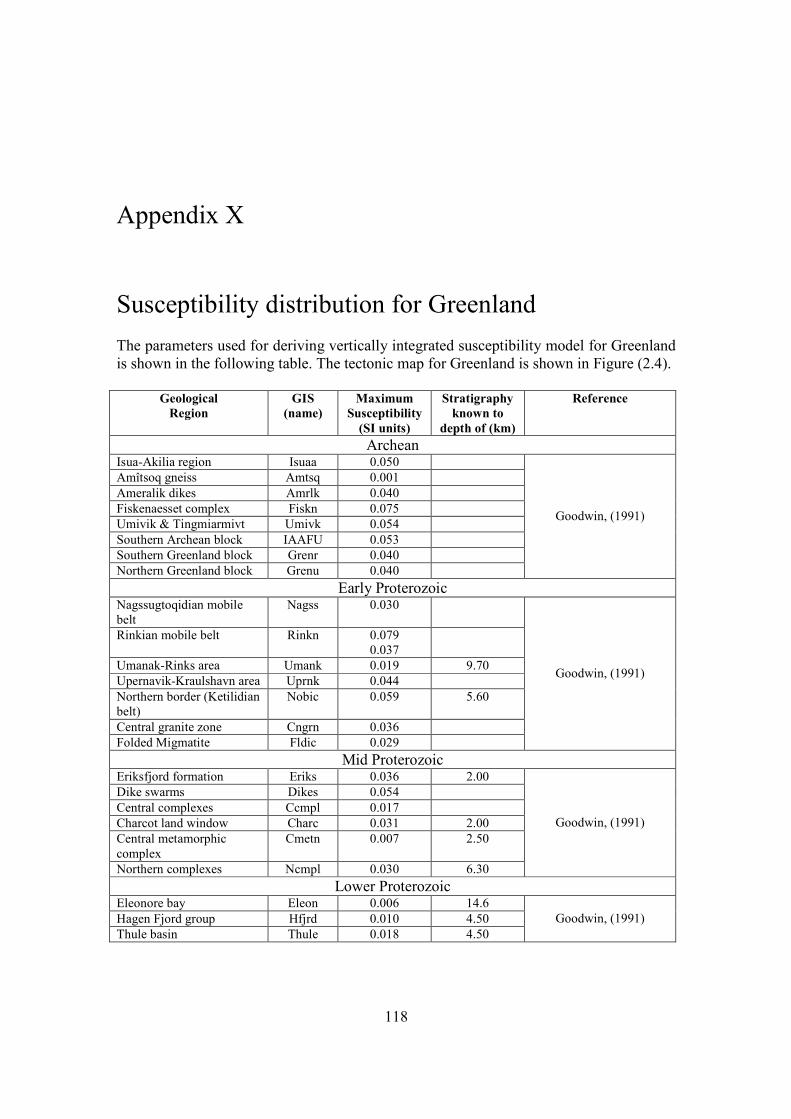
Appendix X Susceptibility distribution for Greenland The parameters used for deriving vertically integrated susceptibility model for Greenland is shown in the following table. The tectonic map for Greenland is shown in Figure (2.4).
Geological Region
GIS (name)
Maximum Susceptibility
(SI units)
Stratigraphy known to
depth of (km)
Reference
Archean Isua-Akilia region Isuaa 0.050 Amîtsoq gneiss Amtsq 0.001 Ameralik dikes Amrlk 0.040 Fiskenaesset complex Fiskn 0.075 Umivik & Tingmiarmivt Umivk 0.054 Southern Archean block IAAFU 0.053 Southern Greenland block Grenr 0.040 Northern Greenland block Grenu 0.040
Goodwin, (1991)
Early Proterozoic Nagssugtoqidian mobile belt
Nagss 0.030
Rinkian mobile belt Rinkn 0.079 0.037
Umanak-Rinks area Umank 0.019 9.70 Upernavik-Kraulshavn area Uprnk 0.044 Northern border (Ketilidian belt)
Nobic 0.059 5.60
Central granite zone Cngrn 0.036 Folded Migmatite Fldic 0.029
Goodwin, (1991)
Mid Proterozoic Eriksfjord formation Eriks 0.036 2.00 Dike swarms Dikes 0.054 Central complexes Ccmpl 0.017 Charcot land window Charc 0.031 2.00 Central metamorphic complex
Cmetn 0.007 2.50
Northern complexes Ncmpl 0.030 6.30
Goodwin, (1991)
Lower Proterozoic Eleonore bay Eleon 0.006 14.6 Hagen Fjord group Hfjrd 0.010 4.50 Thule basin Thule 0.018 4.50
Goodwin, (1991)
119
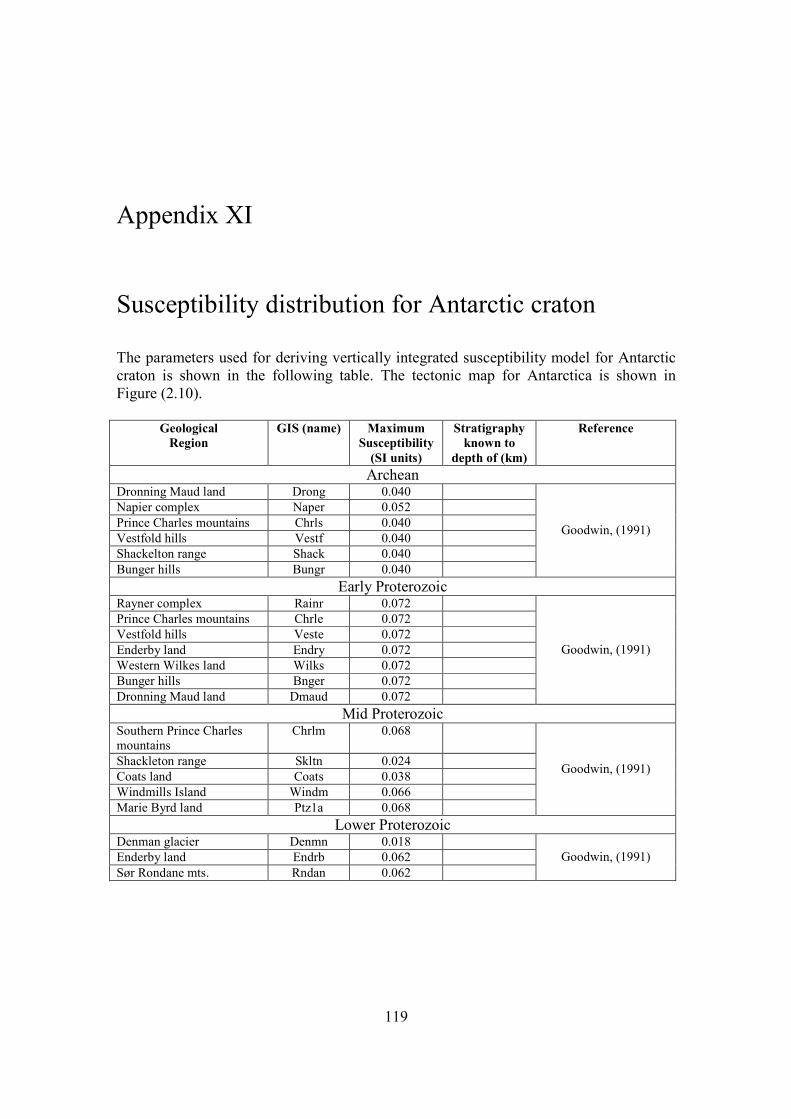
Appendix XI Susceptibility distribution for Antarctic craton The parameters used for deriving vertically integrated susceptibility model for Antarctic craton is shown in the following table. The tectonic map for Antarctica is shown in Figure (2.10).
Geological Region
GIS (name) Maximum Susceptibility
(SI units)
Stratigraphy known to
depth of (km)
Reference
Archean Dronning Maud land Drong 0.040 Napier complex Naper 0.052 Prince Charles mountains Chrls 0.040 Vestfold hills Vestf 0.040 Shackelton range Shack 0.040 Bunger hills Bungr 0.040
Goodwin, (1991)
Early Proterozoic Rayner complex Rainr 0.072 Prince Charles mountains Chrle 0.072 Vestfold hills Veste 0.072 Enderby land Endry 0.072 Western Wilkes land Wilks 0.072 Bunger hills Bnger 0.072 Dronning Maud land Dmaud 0.072
Goodwin, (1991)
Mid Proterozoic Southern Prince Charles mountains
Chrlm 0.068
Shackleton range Skltn 0.024 Coats land Coats 0.038 Windmills Island Windm 0.066 Marie Byrd land Ptz1a 0.068
Goodwin, (1991)
Lower Proterozoic Denman glacier Denmn 0.018 Enderby land Endrb 0.062 Sør Rondane mts. Rndan 0.062
Goodwin, (1991)
120
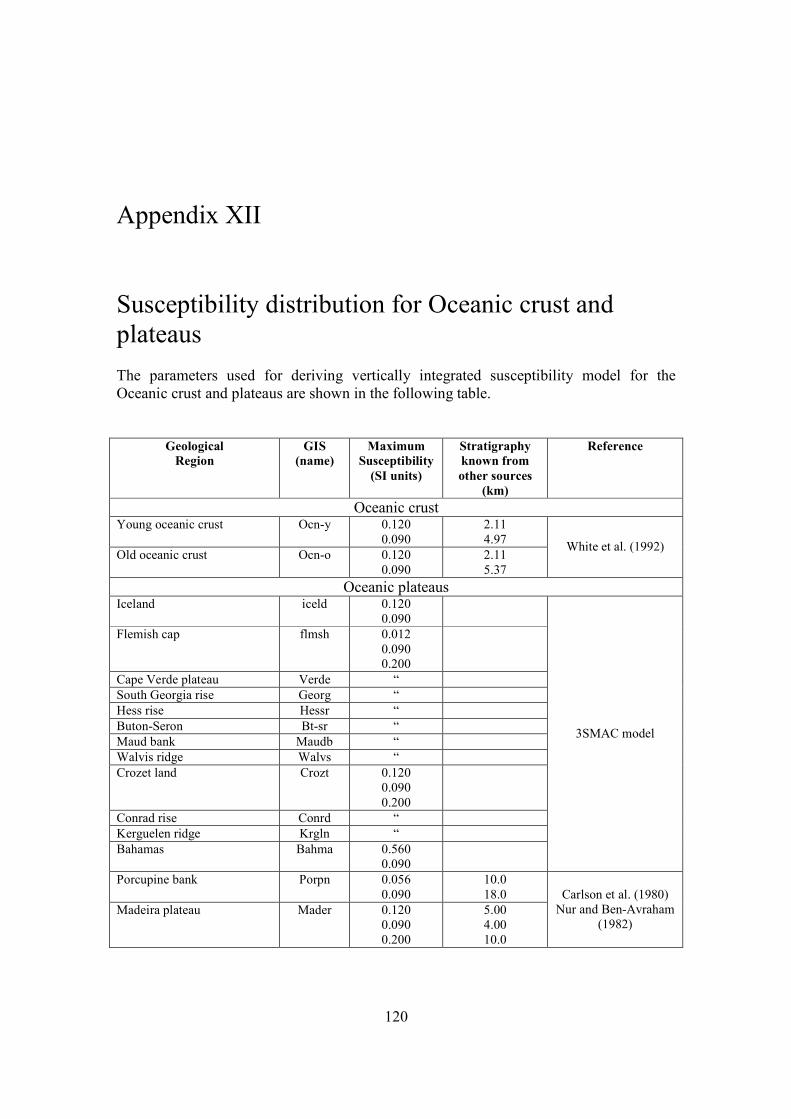
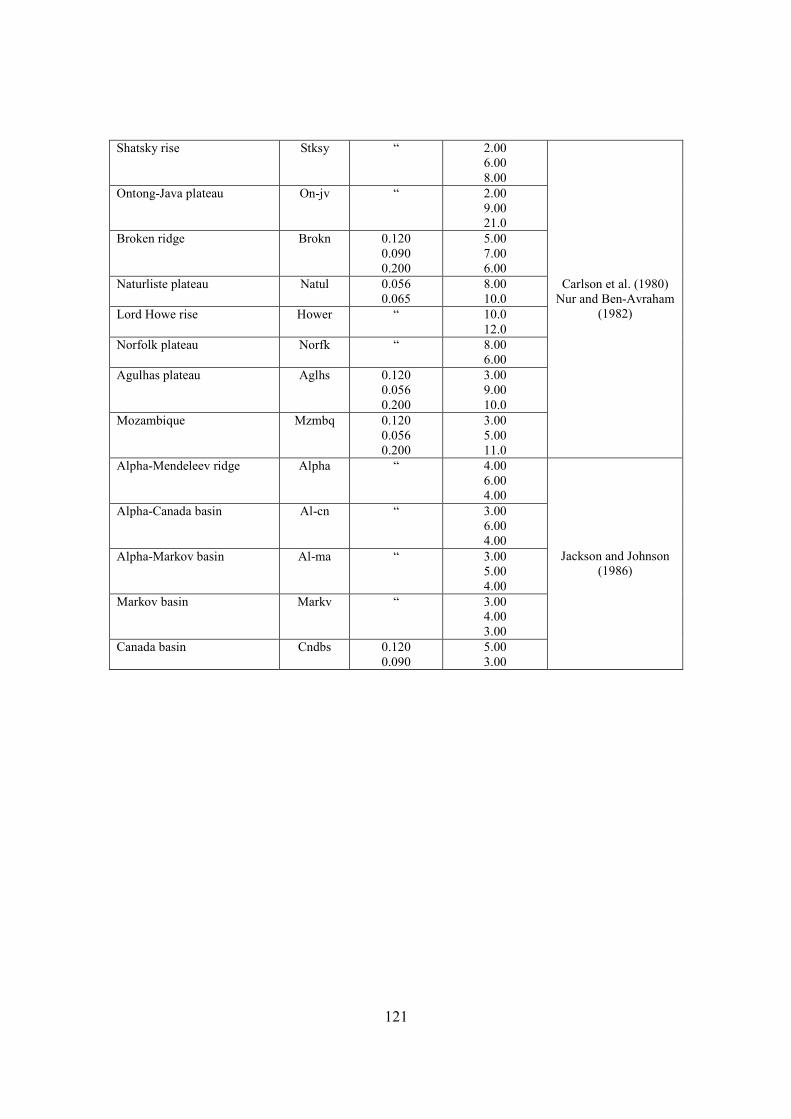
Appendix XII Susceptibility distribution for Oceanic crust and plateaus The parameters used for deriving vertically integrated susceptibility model for the Oceanic crust and plateaus are shown in the following table.
Geological Region
GIS (name)
Maximum Susceptibility
(SI units)
Stratigraphy known from other sources
(km)
Reference
Oceanic crust Young oceanic crust Ocn-y 0.120
0.090 2.11 4.97
Old oceanic crust Ocn-o 0.120 0.090
2.11 5.37
White et al. (1992)
Oceanic plateaus Iceland iceld 0.120
0.090
Flemish cap flmsh 0.012 0.090 0.200
Cape Verde plateau Verde “ South Georgia rise Georg “ Hess rise Hessr “ Buton-Seron Bt-sr “ Maud bank Maudb “ Walvis ridge Walvs “ Crozet land Crozt 0.120
0.090 0.200
Conrad rise Conrd “ Kerguelen ridge Krgln “ Bahamas Bahma 0.560
0.090
3SMAC model
Porcupine bank Porpn 0.056 0.090
10.0 18.0
Madeira plateau Mader 0.120 0.090 0.200
5.00 4.00 10.0
Carlson et al. (1980) Nur and Ben-Avraham
(1982)
121
Shatsky rise Stksy “ 2.00 6.00 8.00
Ontong-Java plateau On-jv “ 2.00 9.00 21.0
Broken ridge Brokn 0.120 0.090 0.200
5.00 7.00 6.00
Naturliste plateau Natul 0.056 0.065
8.00 10.0
Lord Howe rise Hower “ 10.0 12.0
Norfolk plateau Norfk “ 8.00 6.00
Agulhas plateau Aglhs 0.120 0.056 0.200
3.00 9.00 10.0
Mozambique Mzmbq 0.120 0.056 0.200
3.00 5.00 11.0
Carlson et al. (1980) Nur and Ben-Avraham
(1982)
Alpha-Mendeleev ridge Alpha “ 4.00 6.00 4.00
Alpha-Canada basin Al-cn “ 3.00 6.00 4.00
Alpha-Markov basin Al-ma “ 3.00 5.00 4.00
Markov basin Markv “ 3.00 4.00 3.00
Canada basin Cndbs 0.120 0.090
5.00 3.00
Jackson and Johnson (1986)