Embed Size (px)
Citation preview
REDUCED ENERGY CONSUMPTION IN PLASTICS ENGINEERING
2005 EUROPEAN BENCHMARKING SURVEY OF ENERGY CONSUMPTION
AND ADOPTION OF BEST PRACTICE
‘Analysis of a survey of the European plastics processing industry conducted from April to September
2005’
30th
September 2005
The sole responsibility for the content of this report lies with the authors. It does not
represent the opinion of the Community. The European Commission is not responsible for
any use that may be made of the information contained therein.

TABLE OF CONTENTS
EXECUTIVE SUMMARY.......................................................................................................................................... 1
COMPANIES TAKING PART ........................................................................................................................................ 1 SPECIFIC ENERGY CONSUMPTION (SEC) ................................................................................................................. 1 COST AND SOURCE OF ENERGY................................................................................................................................ 1 ENERGY AWARENESS ............................................................................................................................................. 1
BACKGROUND ....................................................................................................................................................... 2
RECIPE PARTNERS ............................................................................................................................................... 2 WHY RECIPE? ...................................................................................................................................................... 3 RECIPE ACTIVITIES ............................................................................................................................................... 3
BENCHMARKING ENERGY USE IN POLYMER PROCESSING............................................................................ 5
WHAT IS BENCHMARKING?....................................................................................................................................... 5 ENERGY BENCHMARKING......................................................................................................................................... 5
PART 1 COMPANY BACKGROUND .............................................................................................................. 6
PART 2 BUSINESS OPERATIONS................................................................................................................. 7
PART 3 ENERGY USAGE............................................................................................................................. 11
SPECIFIC ENERGY CONSUMPTION (SEC) ............................................................................................................... 11 BUILDINGS ........................................................................................................................................................... 11 SITE SPECIFIC ENERGY CONSUMPTION BY COUNTRY ................................................................................................ 13 SITE-SPECIFIC ENERGY CONSUMPTION BY BUSINESS TYPE ....................................................................................... 15 EFFECT OF MACHINE SIZE ...................................................................................................................................... 16 ELECTRIC VS. HYDRAULIC INJECTION MOULDING MACHINES ...................................................................................... 17 USING SPECIFIC ENERGY CONSUMPTION TO REDUCE ENERGY................................................................................... 17 TYPES OF FUEL USED ............................................................................................................................................ 18 COST OF ENERGY ................................................................................................................................................. 19 SOURCES OF ENERGY ........................................................................................................................................... 20
PART 4 ENERGY MANAGEMENT PRACTICES AND ATTITUDES ............................................................ 22
ENVIRONMENTAL POLICIES .................................................................................................................................... 23 ENERGY AUDITS AND MONITORING.......................................................................................................................... 24 ENERGY AWARENESS SCORE ................................................................................................................................ 25 ATTITUDES TOWARDS ENERGY ............................................................................................................................... 27
CONCLUSIONS ..................................................................................................................................................... 29
COMPANIES TAKING PART ...................................................................................................................................... 29 SPECIFIC ENERGY CONSUMPTION (SEC)................................................................................................................. 29 COST OF ENERGY AND FUELS USED ...................................................................................................................... 30 SOURCES OF ENERGY........................................................................................................................................... 30 ENERGY AWARENESS ........................................................................................................................................... 30
APPENDIX 1 – THE QUESTIONNAIRE................................................................................................................. 32
APPENDIX 2 – ENERGY AWARENESS SCORE.................................................................................................. 40
APPENDIX 3 – CONVERSION FIGURES.............................................................................................................. 42
1
EXECUTIVE SUMMARY
The RECIPE project conducted a benchmarking questionnaire based survey of the European plastics industry to
assess energy usage, management and awareness. The objective was to aid plans to reduce the amount used,
and cost, of energy. The survey and data analysis was carried out between April and September 2005: highlights
include: -
Companies taking part
• 165 companies took part covering both SMEs and larger companies.
• Majority were in category 50 – 249 employees with a turnover of €10m.
• Most were from Germany, Spain and the UK and cover 8 plastics processes.
• Average age of machinery was 9 years, from Germany at 6 years to the UK at 13 years.
• 60% operated 24 hours, 5 days per week with average machine utilisation of 75%.
Specific Energy Consumption (SEC)
• The average site-specific energy consumption was 2.87 kW/kg/hr.
• This ranged from 0.63 kW/kg/hr for compounding to 6.2 kW/kg/hr for vacuum thermoforming.
• Age and design of buildings made negligible difference to the SEC.
• SEC was higher for small machines and lower for electric vs. hydraulic drives.
• SEC is a function of the process, plus age, size, and efficiency of the machinery.
Cost and source of energy
• The average cost of energy across Europe was 0.08€/kWh.
• UK had 80% using both gas and electricity, but Spain used mainly electricity.
• In Germany, 70% purchased from a local scheme and recovered energy for reuse.
• Elsewhere, 14% purchased from a local scheme or recovered energy for reuse.
Energy Awareness
• 30% had a written energy policy but only 5% employed an energy manager.
• 30% have ISO 14000 but only 5% have EMAS registration.
• 20% had an energy audit in the last 5 years, mostly in the UK.
• 40% had used energy consultants and 30% monitored energy on each machine.
• An energy awareness score, with a maximum of 16, was calculated for each company - 60% scored less
than the average of 4, and only 1% scored in the range 14 to 16.
• 60% of companies felt that unless form action was taken now, significant damage could be done to the
plastics industry within Europe in the near future.
• 50% said it was everybody’s responsibility to observe the Kyoto protocol.
This survey has generated enough information to set benchmarks for specific energy consumption across Europe.
The general attitude to the ‘energy’ issue was positive, but it is apparent that a lot of improvement could still be
made. The future of the plastics industry in Europe could depend upon how we now manage the issue of energy
consumption and increasing costs.
2
2005 EUROPEAN BENCHMARKING SURVEY OF ENERGY CONSUMPTION
AND ADOPTION OF BEST PRACTICE
BACKGROUND
RECIPE (Reduced Energy Consumption in Plastics Engineering) is a European Union funded project to provide
plastics processors with the knowledge, justification and tools needed to reduce energy consumption through the
implementation of best practice and the introduction of new technologies. This industry comprises more than
27,000 companies (more than 80% SMEs) employing more than one million people, and with total sales of over
100 billion euros.
Potential Impacts
In 2001, 35.6 million tonnes of plastic were consumed in the EU, rising to approximately 40 million tonnes when the
key Eastern European processing countries are included. Based on UK industry figures for energy usage in each
of the major processing technologies (extrusion, blown film, injection moulding and blow moulding) and share of the
total processing capacity, we can estimate an average energy use of 1.85 kWh/kg for plastics processing. With a
consumption figure of 40 million tonnes, the total figure for energy usage is 74 x 109
kWh. This equates to a total
annual emission of more than 30 million tonnes of CO2.
If it were possible to reduce energy consumption across the industry by 10%, this would result in an annual
reduction in CO2 emissions of more than 3 million tonnes.
RECIPE Partners
RECIPE has 8 partner organisations from 6 countries.
• Rapra Technology Ltd (UK)
Europe’s leading independent plastics and rubber research and technology organisation providing
specialist technical, commercial and information services for the polymer industry and end-user industries
including the automotive, construction, electrical, medical, offshore, packaging and polyurethane sectors.
• British Plastics Federation (UK)
The BPF is the leading trade association for the UK plastics industry (representing approximately 80% of
turnover), a springboard for industry action, existing to exploit common opportunities and resolve shared
problems. Membership encompasses producers, suppliers and processors in addition to additive and
machinery suppliers and manufacturers.
• Danish Technology Institute (Denmark)
The Danish Technology Institute is a not for profit organisation that promotes growth by improving
interaction and encouraging synergy between research organisations, businesses and the community.
• ASCAMM+ (Spain)
ASCAMM+ is a not for profit organisation founded in 1979. It currently has over 200 members comprising
of a workforce of over 4000 people. ASCAMM+’s activities include specialised training, promotion of the
industry and advisory services.
3
• AIMPLAS (Spain)
AIMPLAS is an innovation and technology centre based in Spain. Founded in 1990, AIMPLAS conducts
research within the plastics transformation sector in order to increase the competitiveness of the plastics
industry and related sectors.
• Pôle Européen de Plasturgie (France)
Pôle Européen de Plasturgie was founded in 1990 with the assistance of the plastics industry:
transformers, mould and die manufacturers, machine manufacturers, plastic producers and toolmakers. It
aims to increases the competitiveness of the industry by improving the research and technology
developments, from design to finished product.
• CRIF – Wallonie (Belgium)
CRIF-Wallonie started life in 1969 as CRIF Plastics; in order to answer the specific needs of the plastic
processing members of Agoria. The main activities can be split into three areas; engineering of materials
including the design of high tech components in plastic and metal, smart manufacturing and process and
rapid manufacturing.
• Fraunhofer Institut fuer Chemische Technologie ICT (Germany)
The research and design expertise of the Fraunhofer Institute for Chemical Technology ICT is primarily
geared towards products and processes in the fields of polymer engineering, environmental engineering,
electrochemistry and energetic materials.
Why RECIPE?
The foundations of RECIPE were developed from the recommendations of the Technology Roadmap (TRM) for
Low Energy Polymer Processing conducted by the Faraday Plastics Partnership, (a UK organisation with the aim of
improving the competitiveness of the UK plastics industry through research, development, transfer and exploitation
of new and improved science and technology). Technology Road Mapping is a high level tool for supporting
technology management and planning which has been widely adopted in industry to support national and sector
‘foresight’ initiatives. In its most basic form, a TRM can be considered as a time-based chart consisting of a
number of layers that can typically include commercial, technological, legislative and environmental perspectives.
The recommendations of the TRM aim to catalyse the plastics industry into measuring its energy use performance
and change for the better. This includes industry benchmarking and sectoral targets – a programme of market
research to study how energy efficient the polymer processing sector is in its current practices; a demonstration
unit – establishing a ‘show and tell unit’ to illustrate the benefits of energy efficiency, a cost of ownership model –
establishing a financial model for typical paybacks to incentivise the industry to adopt energy saving measures and
training – in energy measurement and management.
RECIPE Activities
The four key activities are:
• European Best Practice Guide
An industry specific guide providing advice related to the processes and working practices prevalent in the
industry.
4
• Publications
RECIPE will issue a series of fact sheets relating to energy saving technologies, initiatives and practices
and a regular newsletter.
• Interactive Energy Efficiency Tools
The interactive toolkit will enable companies to evaluate energy consumption and look closely at individual
processes within the plant. It will then provide guidance on efficiency and highlight key plant areas where
they most substantial energy and cost savings can be made most easily. The Cosy of Ownership model,
included in the toolkit, will enable processors to calculate the cost of purchasing and operating a piece of
equipment over its projected lifetime, based on energy efficiency and projected usage.
• Information
Seminars will be run across Europe demonstrating the latest developments in technology, local energy
schemes, funding opportunities and the interactive tools developed by RECIPE.
Intelligent Energy - Europe
Intelligent Energy – Europe (EIE) is a European Community programme promoting energy efficiency and
renewable sources. The programme aims to encourage the development, demonstration and take-up of energy
efficient products, services and renewable energy sources.

5
BENCHMARKING ENERGY USE IN POLYMER PROCESSING
What is benchmarking?
Benchmarking is the process of assessing and setting targets for improvement and achievement in order to reduce
costs, save money and improve performance.
Energy benchmarking
Energy benchmarking is the collection, analysis and reporting of data to provide industrial companies with a context
for assessing comparative energy efficiencies. It is an important means of energy management, which allows
companies a comparison with the ‘best of the best’. Using energy more efficiently helps your business improve its
productivity and bottom line, making it more competitive, while reducing greenhouse gases that contribute to
climate change. Energy benchmarking and monitoring allows your company to identify deficiencies and adapt to a
better practice.
To start the benchmarking process it is necessary to calculate the specific energy consumption (SEC) from the
total energy used and tonnage processed. SEC is normally expressed as kilowatt-hours per kilogram (kWh/kg). A
simple calculation is -
Total energy used in 12 month period = x (kWh)
Total tonnage produced in 12 month period = y (tonnes)
Specific Energy Consumption (kWh/kg) = x/1000y
By comparing the SEC for a site against the standard values derived from this survey, it is possible to evaluate the
efficiency of your processing site.
6
PART 1 COMPANY BACKGROUND
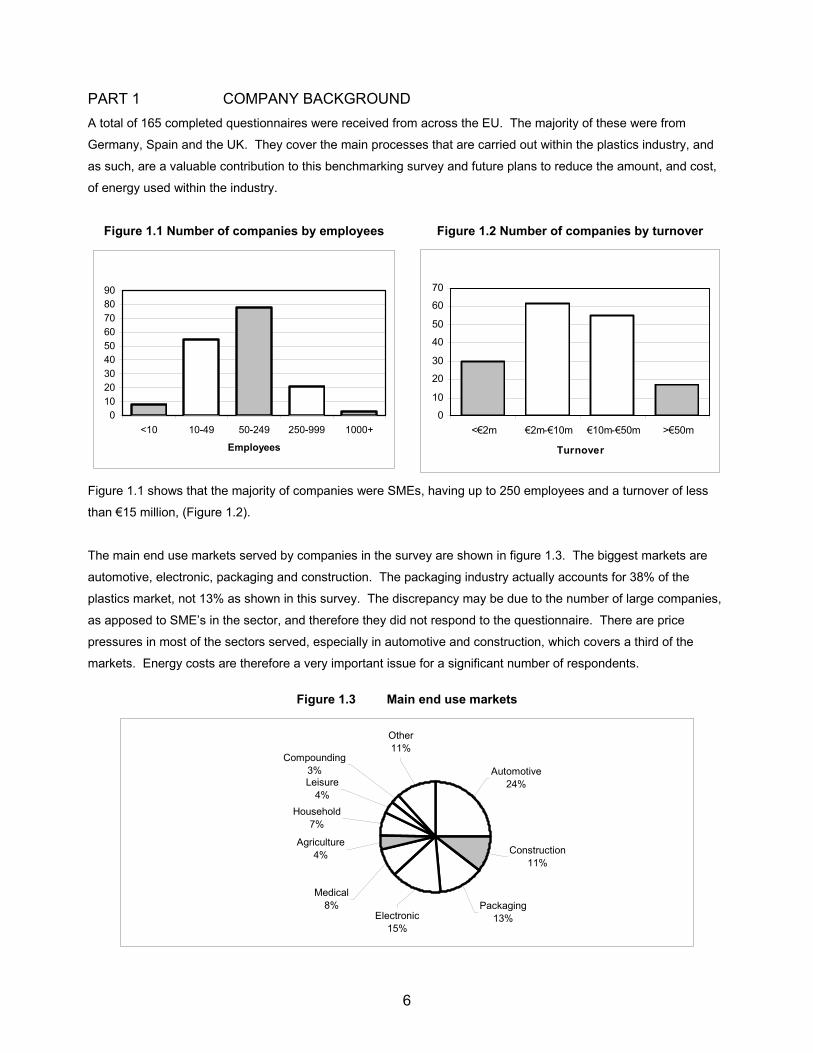
A total of 165 completed questionnaires were received from across the EU. The majority of these were from
Germany, Spain and the UK. They cover the main processes that are carried out within the plastics industry, and
as such, are a valuable contribution to this benchmarking survey and future plans to reduce the amount, and cost,
of energy used within the industry.
Figure 1.1 Number of companies by employees Figure 1.2 Number of companies by turnover
0
10
20
30
40
50
60
70
80
90
<10 10-49 50-249 250-999 1000+
Employees
0
10
20
30
40
50
60
70
<€2m €2m-€10m €10m-€50m >€50m
Turnover
Figure 1.1 shows that the majority of companies were SMEs, having up to 250 employees and a turnover of less
than €15 million, (Figure 1.2).
The main end use markets served by companies in the survey are shown in figure 1.3. The biggest markets are
automotive, electronic, packaging and construction. The packaging industry actually accounts for 38% of the
plastics market, not 13% as shown in this survey. The discrepancy may be due to the number of large companies,
as apposed to SME’s in the sector, and therefore they did not respond to the questionnaire. There are price
pressures in most of the sectors served, especially in automotive and construction, which covers a third of the
markets. Energy costs are therefore a very important issue for a significant number of respondents.
Figure 1.3 Main end use markets
Other
11%
Electronic
15%
Medical
8%
Agriculture
4%
Household
7%
Leisure
4%
Compounding
3%
Construction
11%
Automotive
24%
Packaging
13%
7
PART 2 BUSINESS OPERATIONS
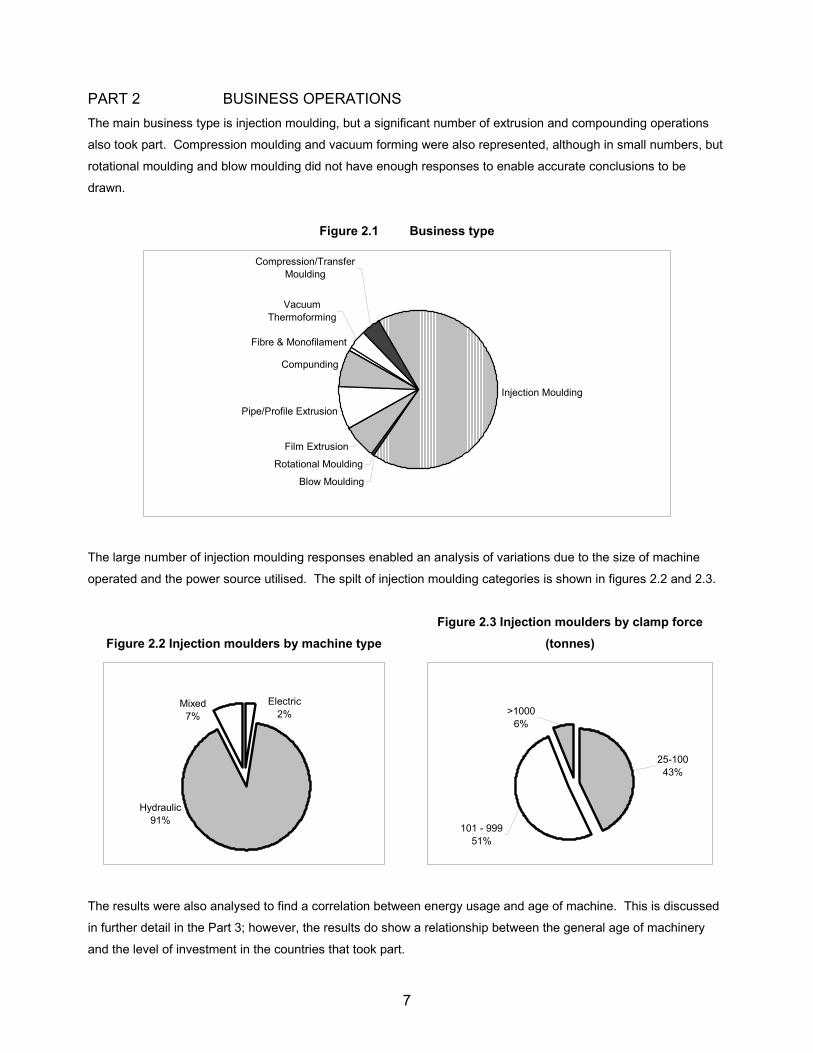
The main business type is injection moulding, but a significant number of extrusion and compounding operations
also took part. Compression moulding and vacuum forming were also represented, although in small numbers, but
rotational moulding and blow moulding did not have enough responses to enable accurate conclusions to be
drawn.
Figure 2.1 Business type
Injection Moulding
Blow Moulding
Rotational Moulding
Film Extrusion
Pipe/Profile Extrusion
Compunding
Fibre & Monofilament
Compression/Transfer
Moulding
Vacuum
Thermoforming
The large number of injection moulding responses enabled an analysis of variations due to the size of machine
operated and the power source utilised. The spilt of injection moulding categories is shown in figures 2.2 and 2.3.
Figure 2.2 Injection moulders by machine type
Figure 2.3 Injection moulders by clamp force
(tonnes)
Hydraulic
91%
Electric
2%Mixed
7%
>1000
6%
25-100
43%
101 - 999
51%
The results were also analysed to find a correlation between energy usage and age of machine. This is discussed
in further detail in the Part 3; however, the results do show a relationship between the general age of machinery
and the level of investment in the countries that took part.
8
Figure 2.4 Average age of machine by country Figure 2.5 Average machine age by type
Germany Spain UK Overall
0
2
4
6
8
10
12
14
Years
Injection
MouldingExtrusion Compunding Others Overall
0
2
4
6
8
10
12
14
16
Years
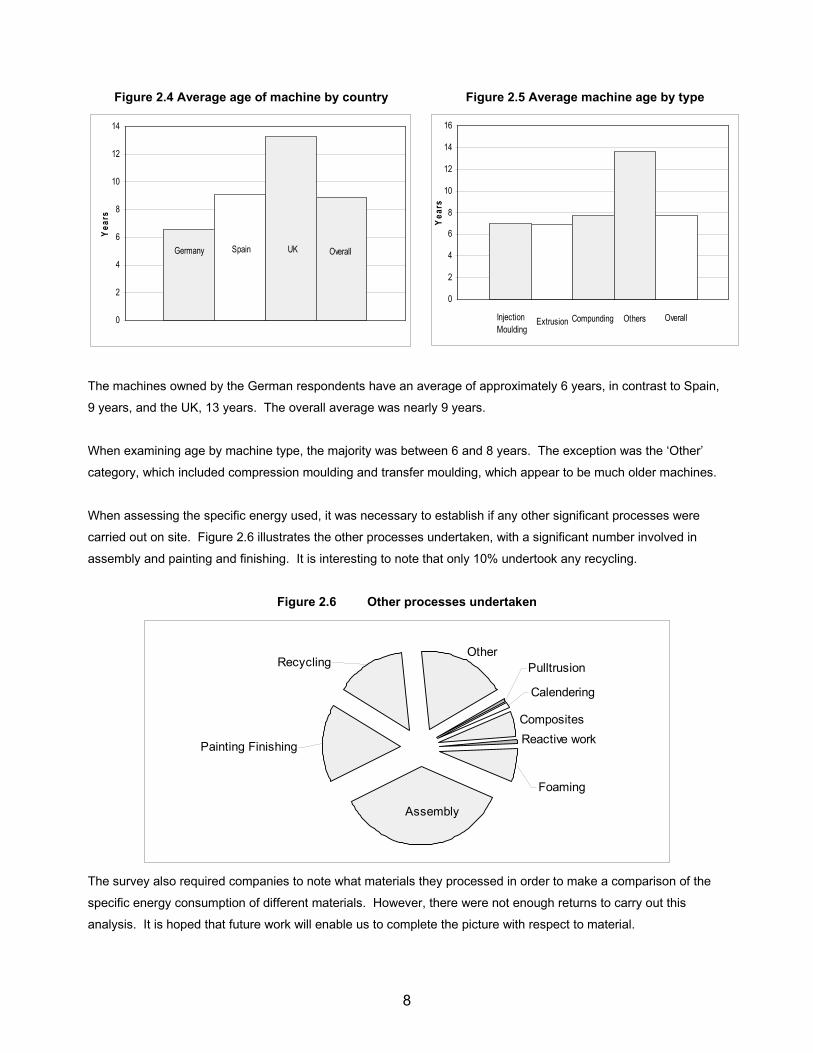
The machines owned by the German respondents have an average of approximately 6 years, in contrast to Spain,
9 years, and the UK, 13 years. The overall average was nearly 9 years.
When examining age by machine type, the majority was between 6 and 8 years. The exception was the ‘Other’
category, which included compression moulding and transfer moulding, which appear to be much older machines.
When assessing the specific energy used, it was necessary to establish if any other significant processes were
carried out on site. Figure 2.6 illustrates the other processes undertaken, with a significant number involved in
assembly and painting and finishing. It is interesting to note that only 10% undertook any recycling.
Figure 2.6 Other processes undertaken
Composites
Reactive work
Recycling
Painting Finishing
Calendering
Pulltrusion
Foaming
Assembly
Other
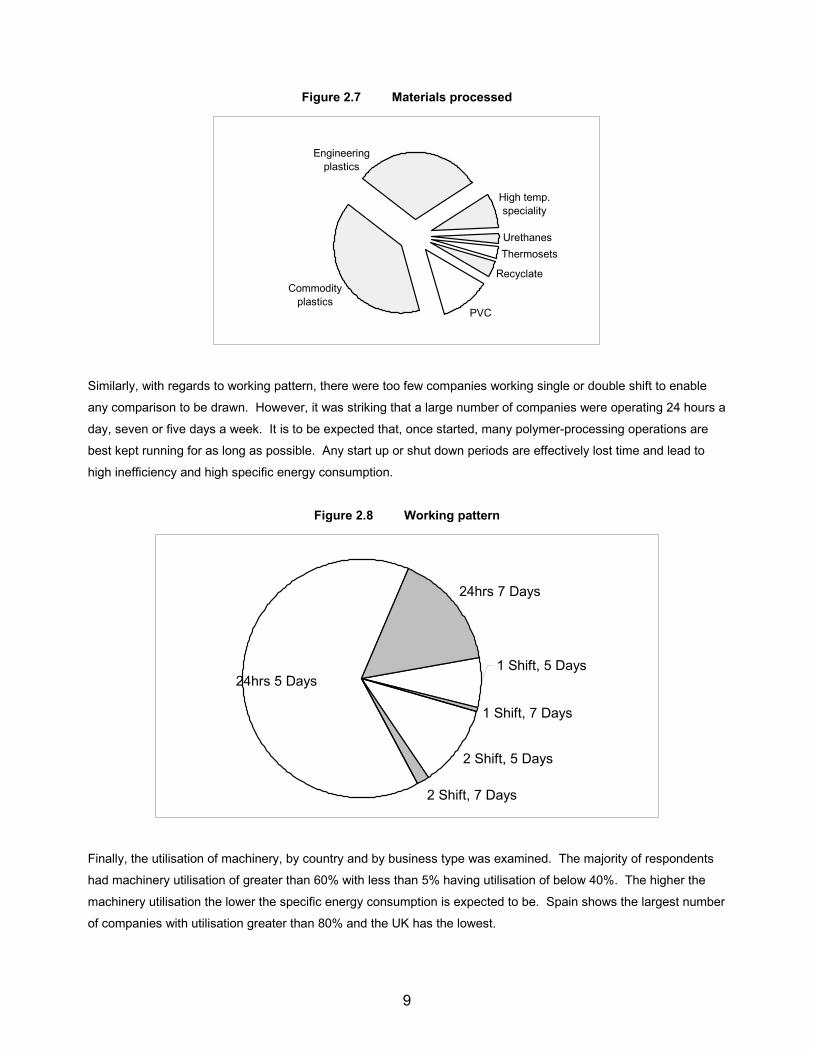
The survey also required companies to note what materials they processed in order to make a comparison of the
specific energy consumption of different materials. However, there were not enough returns to carry out this
analysis. It is hoped that future work will enable us to complete the picture with respect to material.
9
Figure 2.7 Materials processed
PVC
Commodity
plastics
High temp.
speciality
Urethanes
Thermosets
Recyclate
Engineering
plastics
Similarly, with regards to working pattern, there were too few companies working single or double shift to enable
any comparison to be drawn. However, it was striking that a large number of companies were operating 24 hours a
day, seven or five days a week. It is to be expected that, once started, many polymer-processing operations are
best kept running for as long as possible. Any start up or shut down periods are effectively lost time and lead to
high inefficiency and high specific energy consumption.
Figure 2.8 Working pattern
1 Shift, 7 Days
2 Shift, 5 Days
2 Shift, 7 Days
24hrs 7 Days
1 Shift, 5 Days24hrs 5 Days
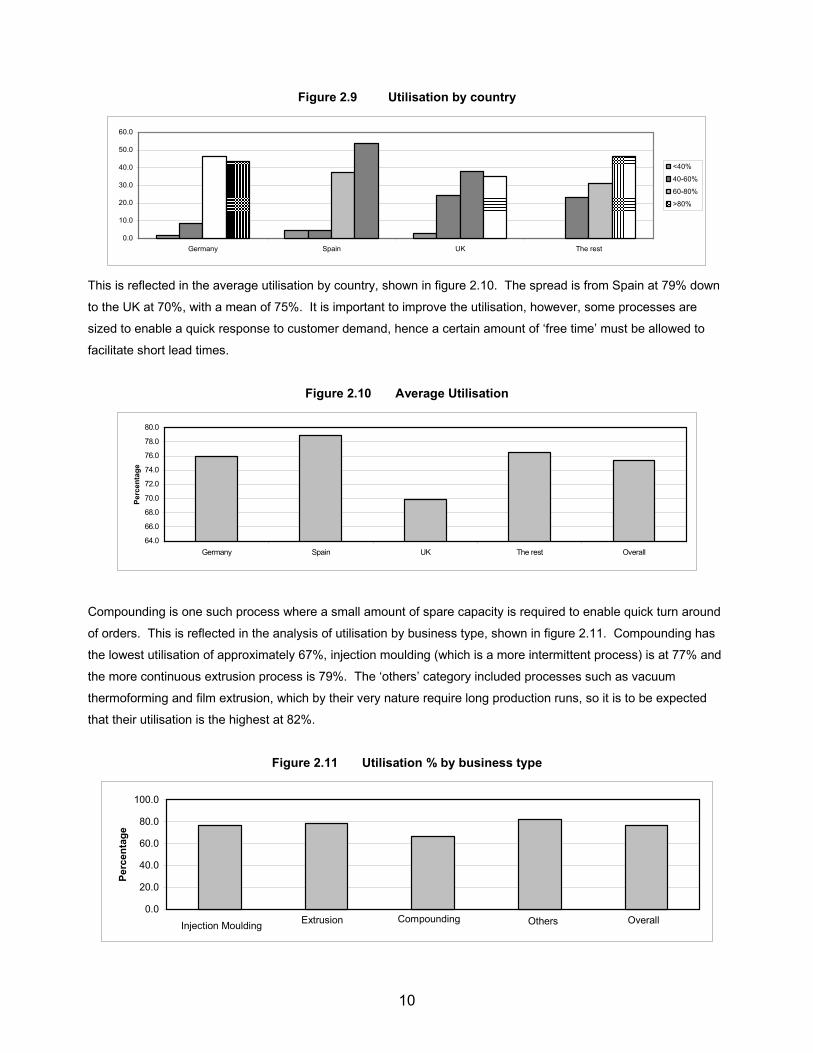
Finally, the utilisation of machinery, by country and by business type was examined. The majority of respondents
had machinery utilisation of greater than 60% with less than 5% having utilisation of below 40%. The higher the
machinery utilisation the lower the specific energy consumption is expected to be. Spain shows the largest number
of companies with utilisation greater than 80% and the UK has the lowest.
10
Figure 2.9 Utilisation by country
0.0
10.0
20.0
30.0
40.0
50.0
60.0
Germany Spain UK The rest
<40%
40-60%
60-80%
>80%
This is reflected in the average utilisation by country, shown in figure 2.10. The spread is from Spain at 79% down
to the UK at 70%, with a mean of 75%. It is important to improve the utilisation, however, some processes are
sized to enable a quick response to customer demand, hence a certain amount of ‘free time’ must be allowed to
facilitate short lead times.
Figure 2.10 Average Utilisation
64.0
66.0
68.0
70.0
72.0
74.0
76.0
78.0
80.0
Germany Spain UK The rest Overall
Percentage
Compounding is one such process where a small amount of spare capacity is required to enable quick turn around
of orders. This is reflected in the analysis of utilisation by business type, shown in figure 2.11. Compounding has
the lowest utilisation of approximately 67%, injection moulding (which is a more intermittent process) is at 77% and
the more continuous extrusion process is 79%. The ‘others’ category included processes such as vacuum
thermoforming and film extrusion, which by their very nature require long production runs, so it is to be expected
that their utilisation is the highest at 82%.
Figure 2.11 Utilisation % by business type
Injection MouldingExtrusion Compounding Others Overall
0.0
20.0
40.0
60.0
80.0
100.0
Percentage
11
PART 3 ENERGY USAGE
Specific Energy Consumption (SEC)
Specific energy consumption is a measure of the energy used for every unit throughput of polymer. This is
normally expressed as the energy, in kWh, consumed whilst processing one kg of polymer. Hence the units are
kWh/kg, or alternatively, kW/kg/hr.
There are two measurements of SEC; the first is to assess an individual machine by measuring the energy used
whilst processing a quantity of polymer. This is recorded by noting the current, the drive details and throughput
rate. This is termed the ‘machine SEC’. The second measurement is to take an overview of the complete site over
a set period of time, e.g. twelve months. This information is usually found in the company records. This measure
is termed ‘site SEC’. With rising energy prices it is important to measure and monitor these costs.
Although there are clearly two different measures of specific energy consumption, it is important to note that within
this report it has only been possible to measure ‘site SEC’. The majority of data supplied is accurate and detailed,
often recording costs to the euro-cent, and energy consumption to the last kWh, however, there are a few
estimates within the data where the accuracy could not be verified. These estimates may be responsible for some
of the extremes of data, but they are few enough not to upset the overall picture.
We can arrive at a theoretical minimum for specific energy consumption by examining the energy required to melt a
polymer and raise its temperature to the processing temperature. For polyolefins this figure is around 0.2 kW/kg/hr,
and for high temperature polymers such as polyaromatics, and some nylons, this rises to 0.4 kW/kg/hr. We should
therefore expect the minimum ‘machine SEC’ to be approximately 0.4 kW/kg/hr.
The ‘site SEC’ includes ancillary equipment, office heating and lighting, and general site services, therefore it is
expected to be greater than ‘machine SEC’. Different types of processes will have a different SEC as they heat
and cool the polymer more than once, whilst others require further operations to be carried out.
The SEC was calculated for each completed questionnaire, as well as the cost of energy in Euros/kWh. This
enabled the comparisons detailed in the following sections.
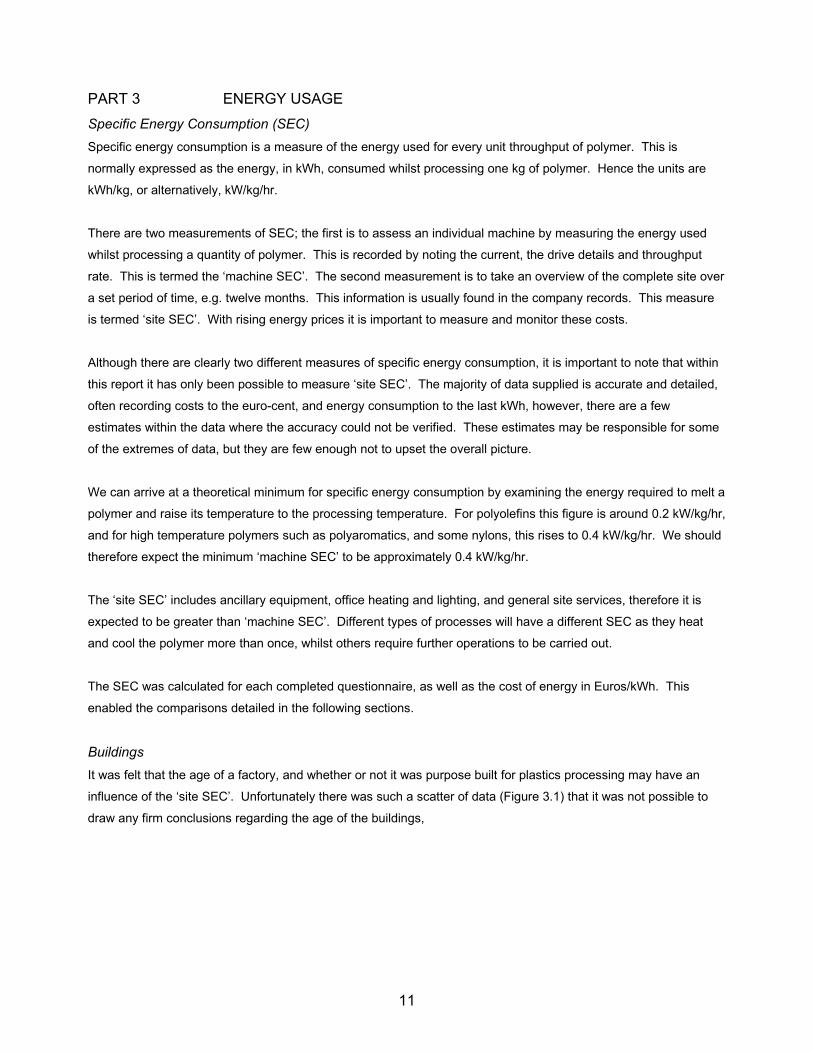
Buildings
It was felt that the age of a factory, and whether or not it was purpose built for plastics processing may have an
influence of the ‘site SEC’. Unfortunately there was such a scatter of data (Figure 3.1) that it was not possible to
draw any firm conclusions regarding the age of the buildings,
12
Figure 3.1 SEC against age of building and all processes
A trend line through all the data appears to show a reduction in the SEC for newer buildings, but with only a few
results at the older end of the range, one or two high-energy intensive processes in old buildings could influence
this line. Separating out injection moulding, to eliminate any variations from ‘business type’, did not improve the
picture (Figure 3.2) and the resultant trend line appears to be the same.
Figure 3.2 SEC against age of building – Injection moulding
As a further check, other business types were examined against age of building, but they all gave similar results to
that shown for film extrusion, (figure 3.3). This shows that there is no change with age over a building age range of
40 years. Therefore, the results show that the age of the building has no real influence over ‘site SEC’ and other
factors, such as building maintenance and working practices may be more important.
Figure 3.3 SEC against age of building – Film extrusion
0.0
1.0
2.0
3.0
4.0
1960 1965 1970 1975 1980 1985 1990 1995 2000 2005 2010
Age of Building
kW/kg/hr
13
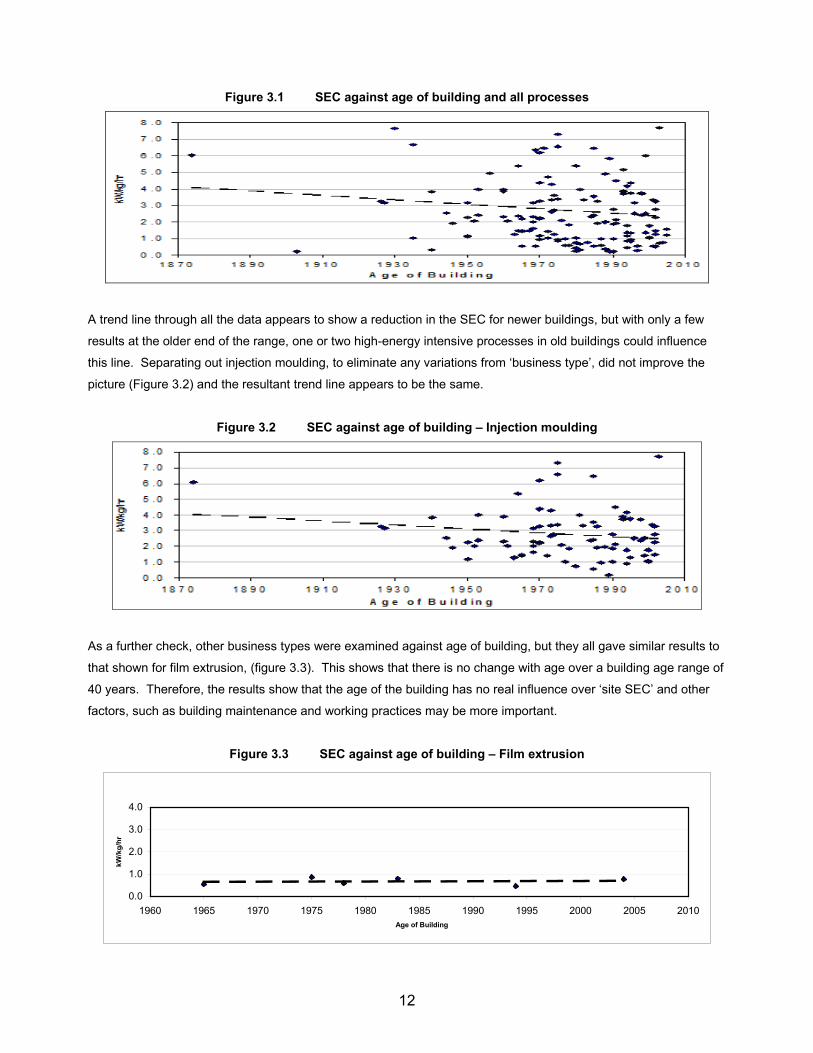
A number of respondents recorded that the factory was purpose built for the current, or similar operation. This may
provide an operational advantage, but it did not have any influence on the ‘site SEC’. The data was separated into
three main business types where ‘purpose built’ was specified and a comparison made to non-purpose built, (figure
3.4). The actual difference, in all cases, was insignificant. Therefore, it can be concluded that, as long as the
building is suitable for the process, being purpose built does not affect the ‘site SEC’.
Figure 3.4 Purpose built factory
0.0
0.5
1.0
1.5
2.0
2.5
3.0
3.5
All Injection Moulding Extrusion Compounding
kW/kg/hr
Yes
No
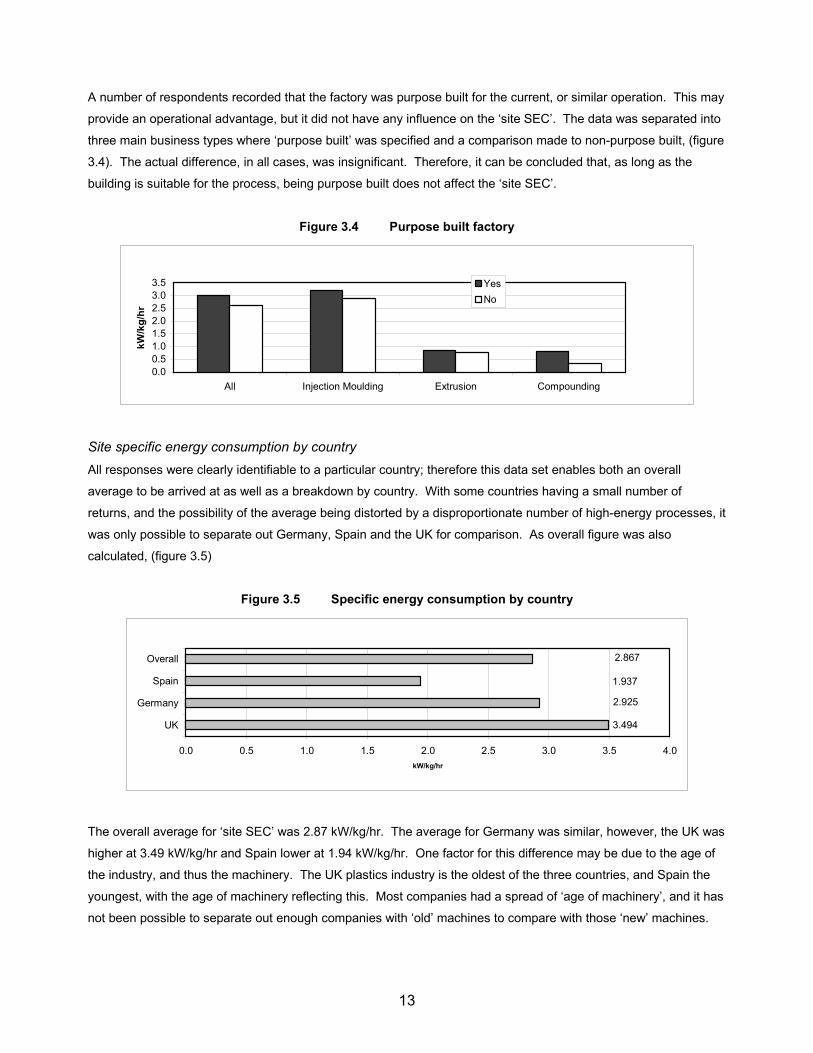
Site specific energy consumption by country
All responses were clearly identifiable to a particular country; therefore this data set enables both an overall
average to be arrived at as well as a breakdown by country. With some countries having a small number of
returns, and the possibility of the average being distorted by a disproportionate number of high-energy processes, it
was only possible to separate out Germany, Spain and the UK for comparison. As overall figure was also
calculated, (figure 3.5)
Figure 3.5 Specific energy consumption by country
3.494
2.925
1.937
2.867
0.0 0.5 1.0 1.5 2.0 2.5 3.0 3.5 4.0
UK
Germany
Spain
Overall
kW/kg/hr
The overall average for ‘site SEC’ was 2.87 kW/kg/hr. The average for Germany was similar, however, the UK was
higher at 3.49 kW/kg/hr and Spain lower at 1.94 kW/kg/hr. One factor for this difference may be due to the age of
the industry, and thus the machinery. The UK plastics industry is the oldest of the three countries, and Spain the
youngest, with the age of machinery reflecting this. Most companies had a spread of ‘age of machinery’, and it has
not been possible to separate out enough companies with ‘old’ machines to compare with those ‘new’ machines.
14
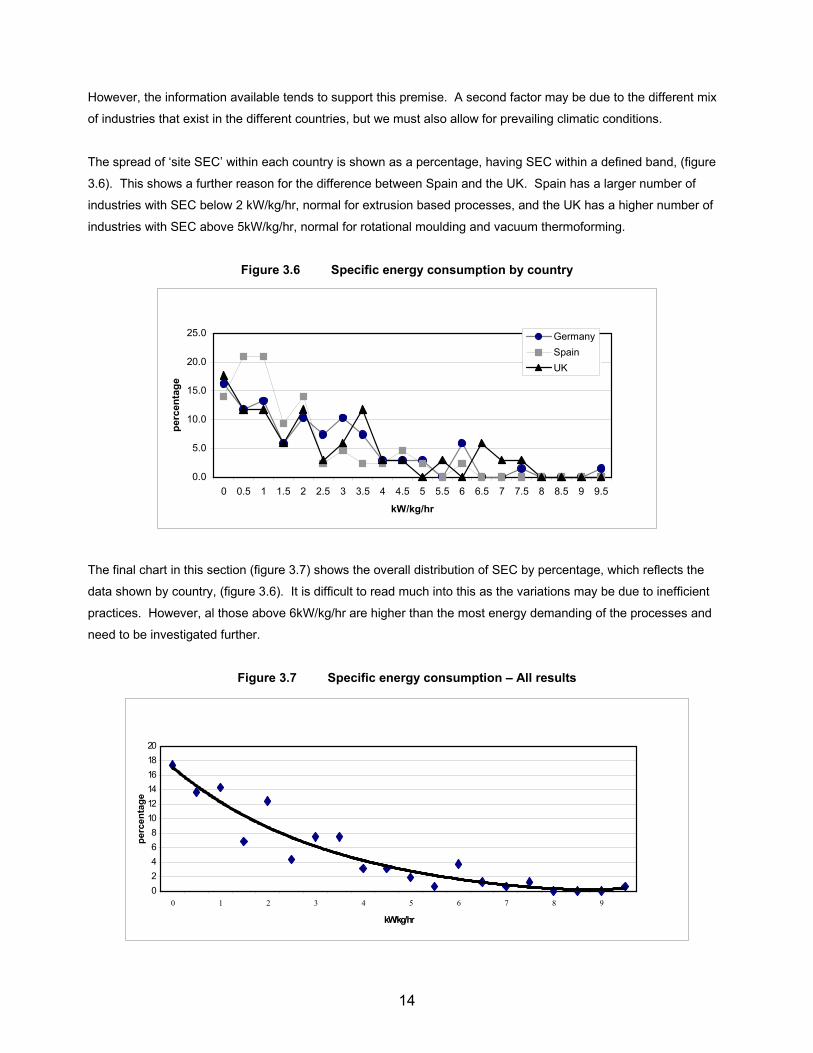
However, the information available tends to support this premise. A second factor may be due to the different mix
of industries that exist in the different countries, but we must also allow for prevailing climatic conditions.
The spread of ‘site SEC’ within each country is shown as a percentage, having SEC within a defined band, (figure
3.6). This shows a further reason for the difference between Spain and the UK. Spain has a larger number of
industries with SEC below 2 kW/kg/hr, normal for extrusion based processes, and the UK has a higher number of
industries with SEC above 5kW/kg/hr, normal for rotational moulding and vacuum thermoforming.
Figure 3.6 Specific energy consumption by country
0.0
5.0
10.0
15.0
20.0
25.0
0 0.5 1 1.5 2 2.5 3 3.5 4 4.5 5 5.5 6 6.5 7 7.5 8 8.5 9 9.5
kW/kg/hr
percentage
Germany
Spain
UK
The final chart in this section (figure 3.7) shows the overall distribution of SEC by percentage, which reflects the
data shown by country, (figure 3.6). It is difficult to read much into this as the variations may be due to inefficient
practices. However, al those above 6kW/kg/hr are higher than the most energy demanding of the processes and
need to be investigated further.
Figure 3.7 Specific energy consumption – All results
0
2
4
6
8
10
12
14
16
18
20
0 1 2 3 4 5 6 7 8 9
kW/kg/hr
percentage
15
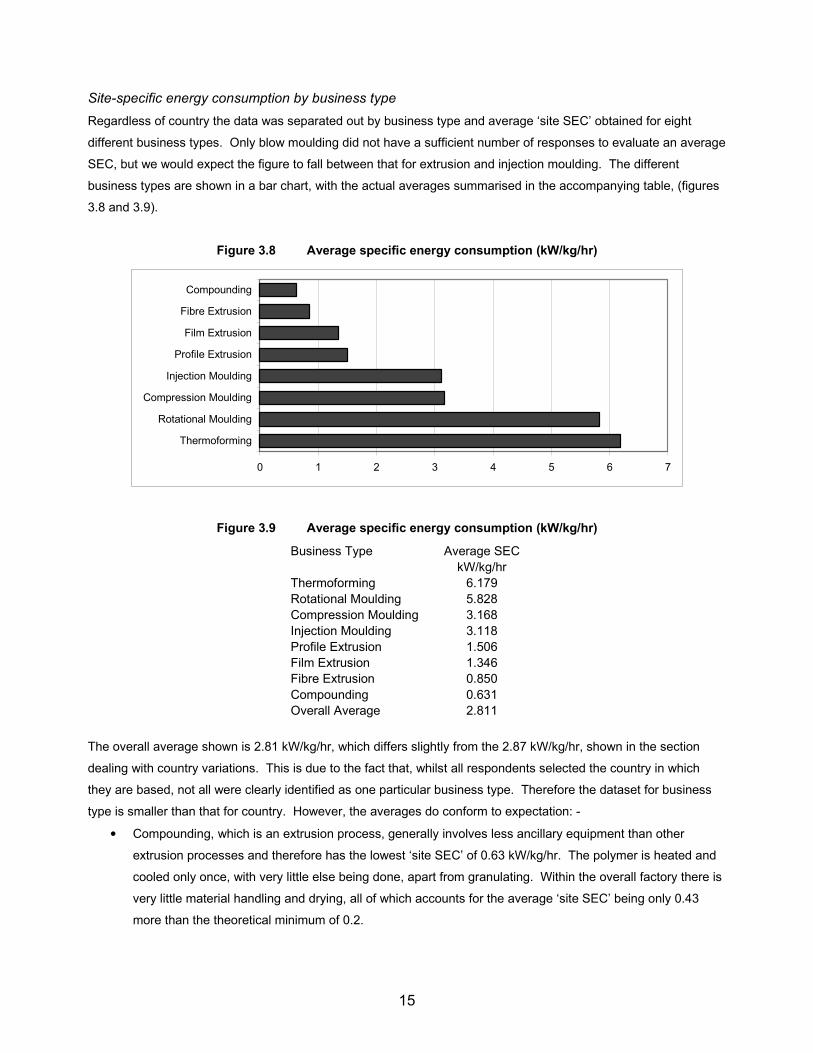
Site-specific energy consumption by business type
Regardless of country the data was separated out by business type and average ‘site SEC’ obtained for eight
different business types. Only blow moulding did not have a sufficient number of responses to evaluate an average
SEC, but we would expect the figure to fall between that for extrusion and injection moulding. The different
business types are shown in a bar chart, with the actual averages summarised in the accompanying table, (figures
3.8 and 3.9).
Figure 3.8 Average specific energy consumption (kW/kg/hr)
0 1 2 3 4 5 6 7
Thermoforming
Rotational Moulding
Compression Moulding
Injection Moulding
Profile Extrusion
Film Extrusion
Fibre Extrusion
Compounding
Figure 3.9 Average specific energy consumption (kW/kg/hr)
Business Type Average SEC
kW/kg/hr
Thermoforming 6.179
Rotational Moulding 5.828
Compression Moulding 3.168
Injection Moulding 3.118
Profile Extrusion 1.506
Film Extrusion 1.346
Fibre Extrusion 0.850
Compounding 0.631
Overall Average 2.811
The overall average shown is 2.81 kW/kg/hr, which differs slightly from the 2.87 kW/kg/hr, shown in the section
dealing with country variations. This is due to the fact that, whilst all respondents selected the country in which
they are based, not all were clearly identified as one particular business type. Therefore the dataset for business
type is smaller than that for country. However, the averages do conform to expectation: -
• Compounding, which is an extrusion process, generally involves less ancillary equipment than other
extrusion processes and therefore has the lowest ‘site SEC’ of 0.63 kW/kg/hr. The polymer is heated and
cooled only once, with very little else being done, apart from granulating. Within the overall factory there is
very little material handling and drying, all of which accounts for the average ‘site SEC’ being only 0.43
more than the theoretical minimum of 0.2.
16
• Fibre extrusion (0.85 kW/kg/hr) has more downstream equipment, including stretching rolls and winding
machinery, whilst film extrusion (1.35 kW/kg/hr) will include cast film and blown film, again involving more
complex downstream operations.
• Pipe and profile extrusion (1.5 kW/kg/hr) not only has complex downstream operations, but often involves
the storage and handling of large hollow product, sometimes with welding, trimming and assembly
operations, all of which add to the increased energy usage.
• Injection moulding (3.1 kW/kg/hr) is essentially a basic extrusion process, followed by another process of
moulding, which involves heating and cooling of a large mass of metal that forms the mould, plus the
energy needed to close the mould. There is an often an additional downstream operation, including
complex assembly, occasionally in clean room environments, which accounts for the higher ‘site SEC’.
• Compression moulding (3.2 kW/kg/hr) is a slow process where the mould is heated and compresses whilst
the reaction takes place. The specific energy requirement is similar to injection moulding.
• Rotational moulding (5.8 kW/kg/hr) essentially has to heat and cool the large surface area of a metal mould
for every hollow article produced. The mould is often heated by hot air circulating around the rotational
mould, which is sometimes smaller than the chamber, thus reducing the efficiency even further. A large
amount of energy is used for a small weight of polymer, explaining the high ‘site SEC’.
• Vacuum thermoforming (6.2 kW/kg/hr) is firstly a sheet extrusion process, where the sheet is subsequently
reheated and then formed under vacuum in a mould. The items produced are generally thin walled and
light in weight. Additionally, when producing multiple circular items from a sheet, the excess material is
recycled, adding to the specific energy consumption.
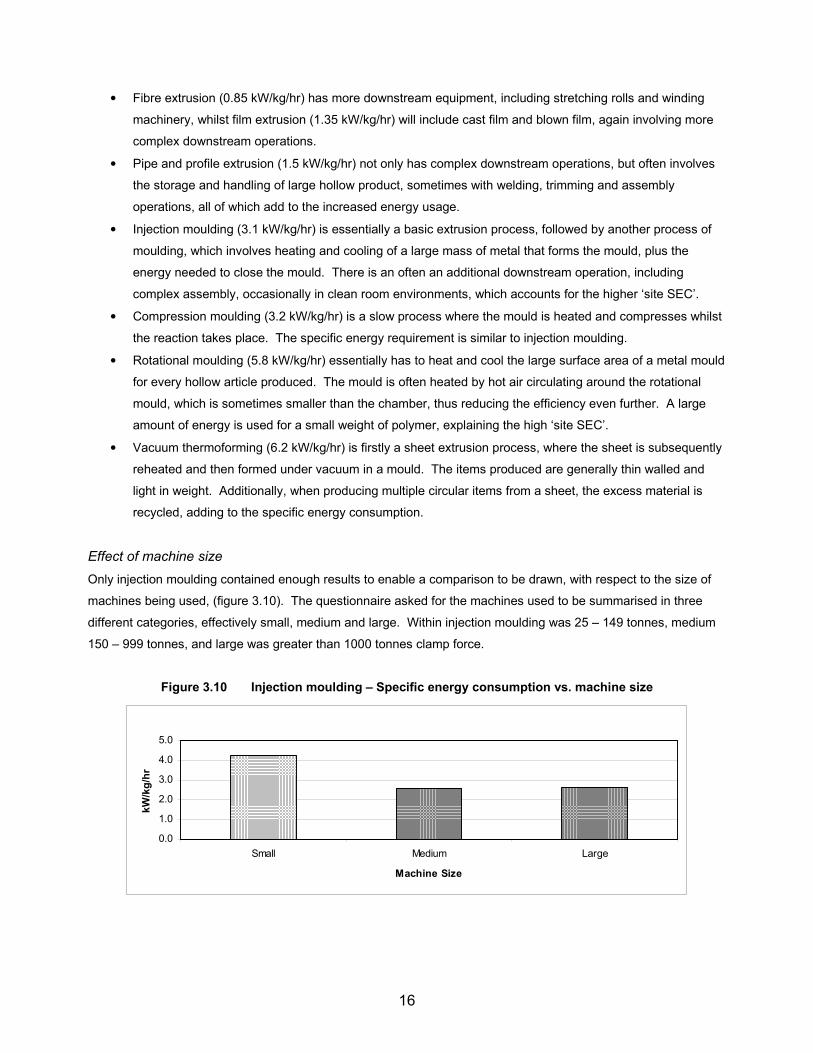
Effect of machine size
Only injection moulding contained enough results to enable a comparison to be drawn, with respect to the size of
machines being used, (figure 3.10). The questionnaire asked for the machines used to be summarised in three
different categories, effectively small, medium and large. Within injection moulding was 25 – 149 tonnes, medium
150 – 999 tonnes, and large was greater than 1000 tonnes clamp force.
Figure 3.10 Injection moulding – Specific energy consumption vs. machine size
0.0
1.0
2.0
3.0
4.0
5.0
Small Medium Large
Machine Size
kW/kg/hr
17
The results confirmed that ‘site SEC’ dropped from 4.2 kW/kg/hr for the smaller machines to 2.5 kW/kg/hr for the
medium and large machines.
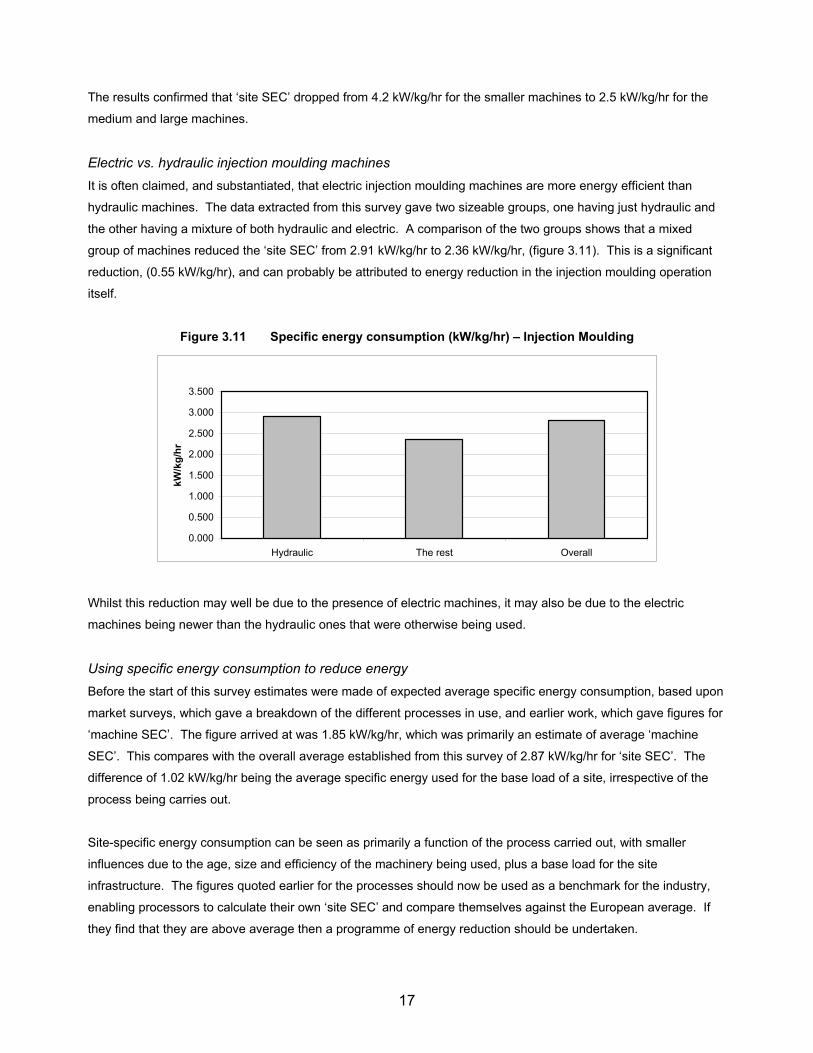
Electric vs. hydraulic injection moulding machines
It is often claimed, and substantiated, that electric injection moulding machines are more energy efficient than
hydraulic machines. The data extracted from this survey gave two sizeable groups, one having just hydraulic and
the other having a mixture of both hydraulic and electric. A comparison of the two groups shows that a mixed
group of machines reduced the ‘site SEC’ from 2.91 kW/kg/hr to 2.36 kW/kg/hr, (figure 3.11). This is a significant
reduction, (0.55 kW/kg/hr), and can probably be attributed to energy reduction in the injection moulding operation
itself.
Figure 3.11 Specific energy consumption (kW/kg/hr) – Injection Moulding
0.000
0.500
1.000
1.500
2.000
2.500
3.000
3.500
Hydraulic The rest Overall
kW/kg/hr
Whilst this reduction may well be due to the presence of electric machines, it may also be due to the electric
machines being newer than the hydraulic ones that were otherwise being used.
Using specific energy consumption to reduce energy
Before the start of this survey estimates were made of expected average specific energy consumption, based upon
market surveys, which gave a breakdown of the different processes in use, and earlier work, which gave figures for
‘machine SEC’. The figure arrived at was 1.85 kW/kg/hr, which was primarily an estimate of average ‘machine
SEC’. This compares with the overall average established from this survey of 2.87 kW/kg/hr for ‘site SEC’. The
difference of 1.02 kW/kg/hr being the average specific energy used for the base load of a site, irrespective of the
process being carries out.
Site-specific energy consumption can be seen as primarily a function of the process carried out, with smaller
influences due to the age, size and efficiency of the machinery being used, plus a base load for the site
infrastructure. The figures quoted earlier for the processes should now be used as a benchmark for the industry,
enabling processors to calculate their own ‘site SEC’ and compare themselves against the European average. If
they find that they are above average then a programme of energy reduction should be undertaken.
18
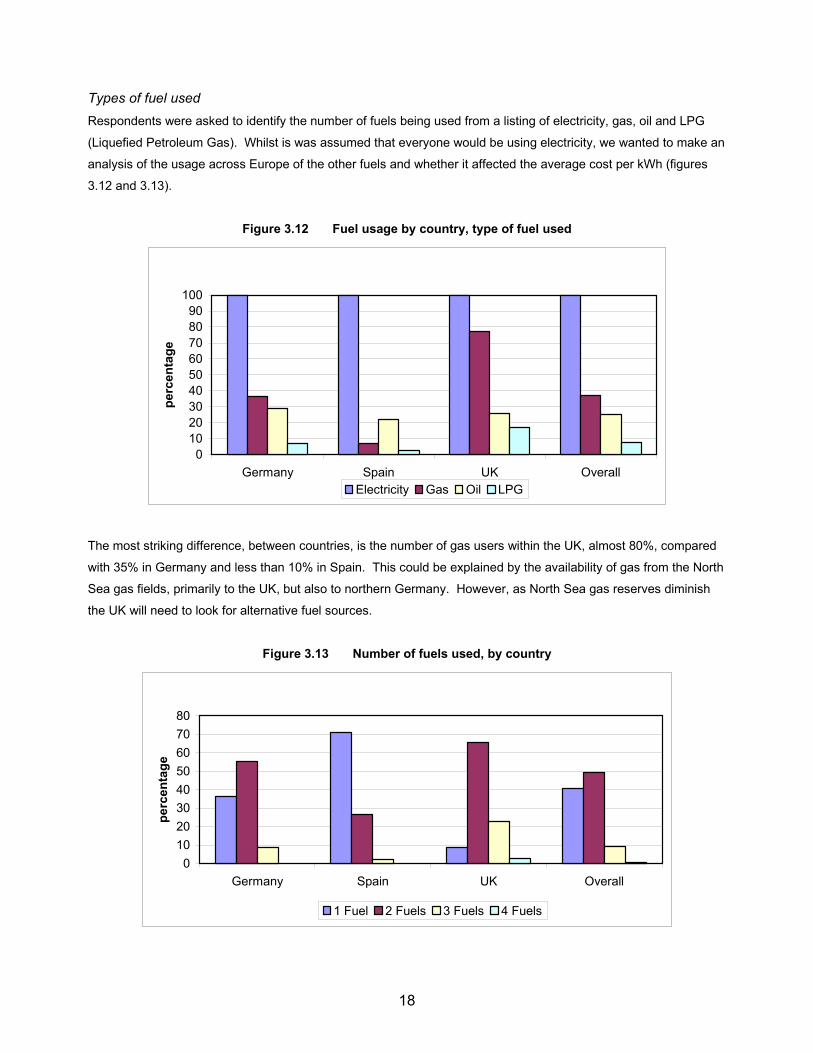
Types of fuel used
Respondents were asked to identify the number of fuels being used from a listing of electricity, gas, oil and LPG
(Liquefied Petroleum Gas). Whilst is was assumed that everyone would be using electricity, we wanted to make an
analysis of the usage across Europe of the other fuels and whether it affected the average cost per kWh (figures
3.12 and 3.13).
Figure 3.12 Fuel usage by country, type of fuel used
0
10
20
30
40
50
60
70
80
90
100
Germany Spain UK Overall
percentage
Electricity Gas Oil LPG
The most striking difference, between countries, is the number of gas users within the UK, almost 80%, compared
with 35% in Germany and less than 10% in Spain. This could be explained by the availability of gas from the North
Sea gas fields, primarily to the UK, but also to northern Germany. However, as North Sea gas reserves diminish
the UK will need to look for alternative fuel sources.
Figure 3.13 Number of fuels used, by country
0
10
20
30
40
50
60
70
80
Germany Spain UK Overall
percentage
1 Fuel 2 Fuels 3 Fuels 4 Fuels
19
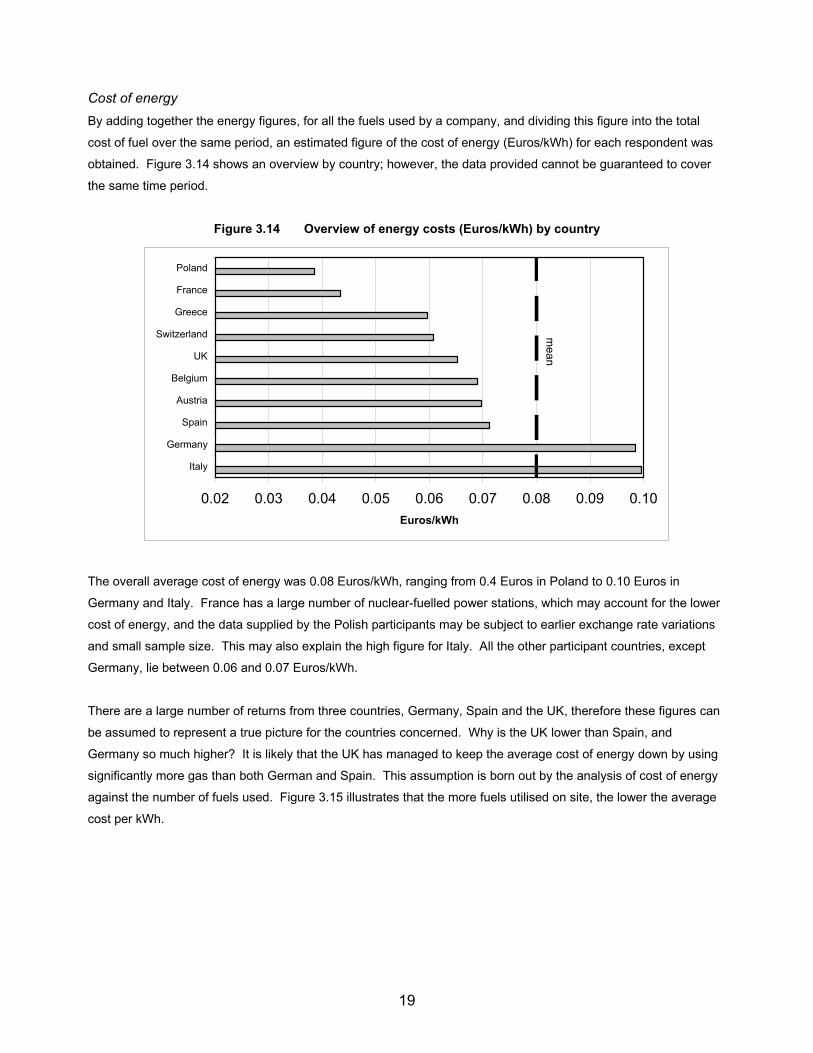
Cost of energy
By adding together the energy figures, for all the fuels used by a company, and dividing this figure into the total
cost of fuel over the same period, an estimated figure of the cost of energy (Euros/kWh) for each respondent was
obtained. Figure 3.14 shows an overview by country; however, the data provided cannot be guaranteed to cover
the same time period.
Figure 3.14 Overview of energy costs (Euros/kWh) by country
0.02 0.03 0.04 0.05 0.06 0.07 0.08 0.09 0.10
Italy
Germany
Spain
Austria
Belgium
UK
Switzerland
Greece
France
Poland
Euros/kWh
me
an
The overall average cost of energy was 0.08 Euros/kWh, ranging from 0.4 Euros in Poland to 0.10 Euros in
Germany and Italy. France has a large number of nuclear-fuelled power stations, which may account for the lower
cost of energy, and the data supplied by the Polish participants may be subject to earlier exchange rate variations
and small sample size. This may also explain the high figure for Italy. All the other participant countries, except
Germany, lie between 0.06 and 0.07 Euros/kWh.
There are a large number of returns from three countries, Germany, Spain and the UK, therefore these figures can
be assumed to represent a true picture for the countries concerned. Why is the UK lower than Spain, and
Germany so much higher? It is likely that the UK has managed to keep the average cost of energy down by using
significantly more gas than both German and Spain. This assumption is born out by the analysis of cost of energy
against the number of fuels used. Figure 3.15 illustrates that the more fuels utilised on site, the lower the average
cost per kWh.

20
Figure 3.15 Euros/kWh by number of fuels used
0.02 0.03 0.04 0.05 0.06 0.07 0.08 0.09 0.10
1 Fuels Used
2 Fuels Used
>2 Fuels used
Euros/kWh
Sources of energy
An analysis was carried on the differences in local power generation, and regional differences. Very few
companies that took part in the survey generated their own electricity (figure 3.16), however questions 3.5 and 3.6
(see Appendix 1) highlighted a major difference between Germany and the other countries responding to this
survey, (Figures 3.17, 3.18, 3.19 and 3.20).
Figure 3.16 Do you generate your electricity?
SomeAll
None
In Germany 72% of respondents indicated that they purchased all or some of their electricity from a local
generation scheme, compared with only 14% for the rest of the countries surveyed,
Figure 3.17 Do you purchase electricity from a local
generation scheme? (Germany)
Figure 3.18 Do you purchase electricity from a local
generation scheme? (All except Germany)
All
66%
Some
6%
None
28%
All
14%
Some
0%None
86%
21
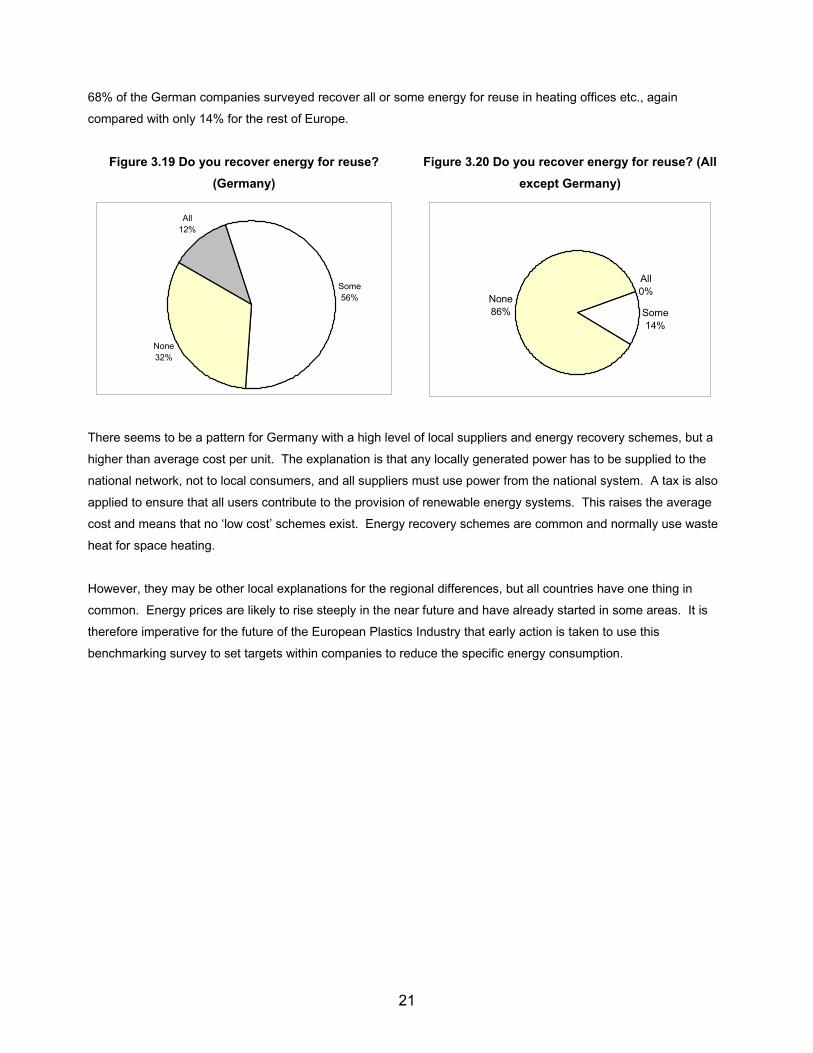
68% of the German companies surveyed recover all or some energy for reuse in heating offices etc., again
compared with only 14% for the rest of Europe.
Figure 3.19 Do you recover energy for reuse?
(Germany)
Figure 3.20 Do you recover energy for reuse? (All
except Germany)
All
12%
Some
56%
None
32%
All
0%
Some
14%
None
86%
There seems to be a pattern for Germany with a high level of local suppliers and energy recovery schemes, but a
higher than average cost per unit. The explanation is that any locally generated power has to be supplied to the
national network, not to local consumers, and all suppliers must use power from the national system. A tax is also
applied to ensure that all users contribute to the provision of renewable energy systems. This raises the average
cost and means that no ‘low cost’ schemes exist. Energy recovery schemes are common and normally use waste
heat for space heating.
However, they may be other local explanations for the regional differences, but all countries have one thing in
common. Energy prices are likely to rise steeply in the near future and have already started in some areas. It is
therefore imperative for the future of the European Plastics Industry that early action is taken to use this
benchmarking survey to set targets within companies to reduce the specific energy consumption.
22
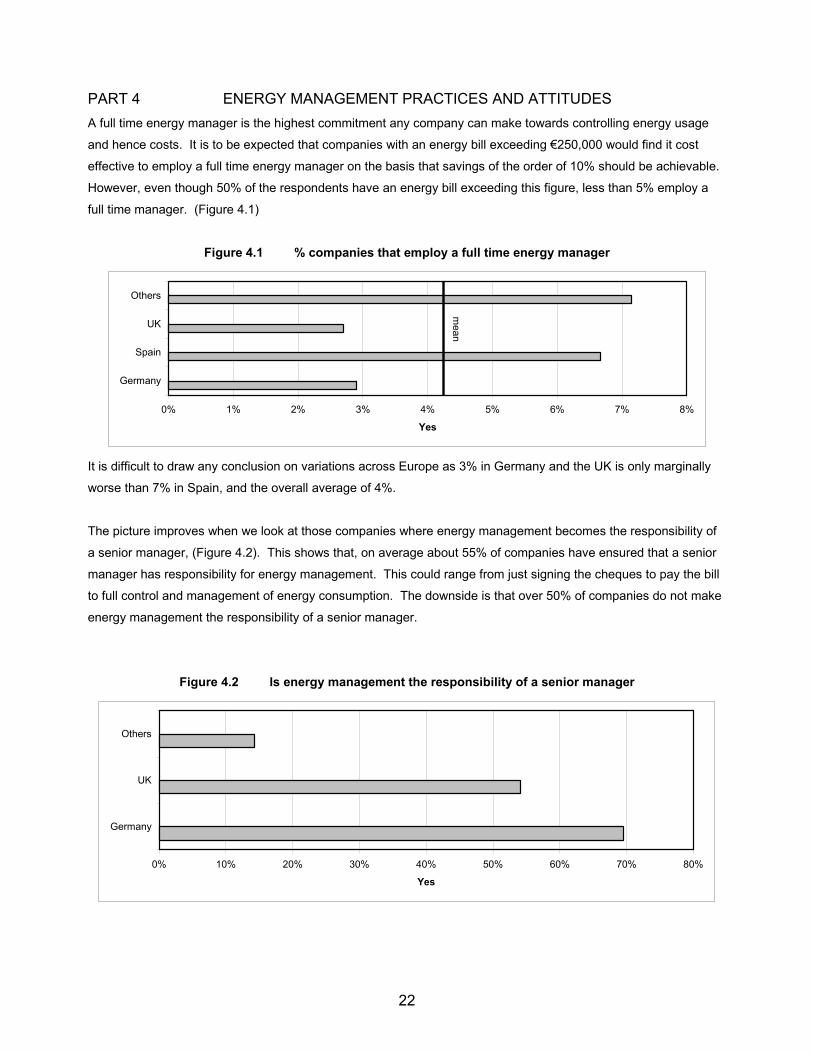
PART 4 ENERGY MANAGEMENT PRACTICES AND ATTITUDES
A full time energy manager is the highest commitment any company can make towards controlling energy usage
and hence costs. It is to be expected that companies with an energy bill exceeding €250,000 would find it cost
effective to employ a full time energy manager on the basis that savings of the order of 10% should be achievable.
However, even though 50% of the respondents have an energy bill exceeding this figure, less than 5% employ a
full time manager. (Figure 4.1)
Figure 4.1 % companies that employ a full time energy manager
0% 1% 2% 3% 4% 5% 6% 7% 8%
Germany
Spain
UK
Others
Yes
me
an
It is difficult to draw any conclusion on variations across Europe as 3% in Germany and the UK is only marginally
worse than 7% in Spain, and the overall average of 4%.
The picture improves when we look at those companies where energy management becomes the responsibility of
a senior manager, (Figure 4.2). This shows that, on average about 55% of companies have ensured that a senior
manager has responsibility for energy management. This could range from just signing the cheques to pay the bill
to full control and management of energy consumption. The downside is that over 50% of companies do not make
energy management the responsibility of a senior manager.
Figure 4.2 Is energy management the responsibility of a senior manager
0% 10% 20% 30% 40% 50% 60% 70% 80%
Germany
UK
Others
Yes
23
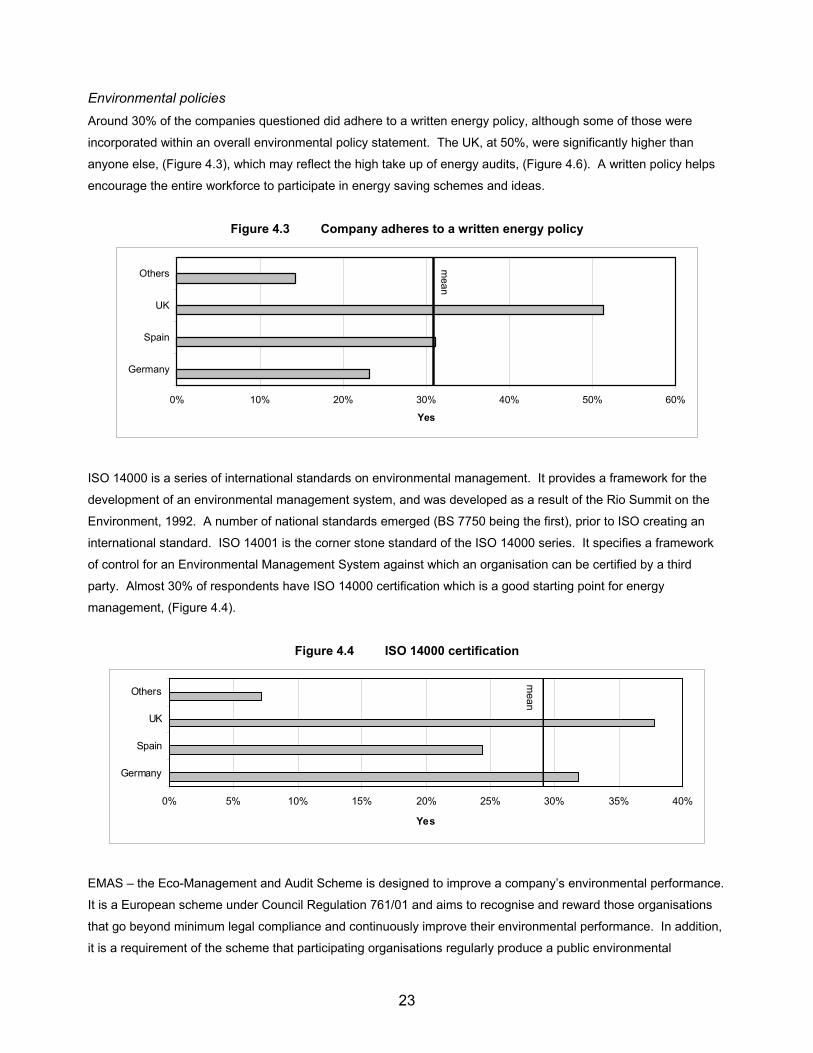
Environmental policies
Around 30% of the companies questioned did adhere to a written energy policy, although some of those were
incorporated within an overall environmental policy statement. The UK, at 50%, were significantly higher than
anyone else, (Figure 4.3), which may reflect the high take up of energy audits, (Figure 4.6). A written policy helps
encourage the entire workforce to participate in energy saving schemes and ideas.
Figure 4.3 Company adheres to a written energy policy
0% 10% 20% 30% 40% 50% 60%
Germany
Spain
UK
Others
Yes
me
an
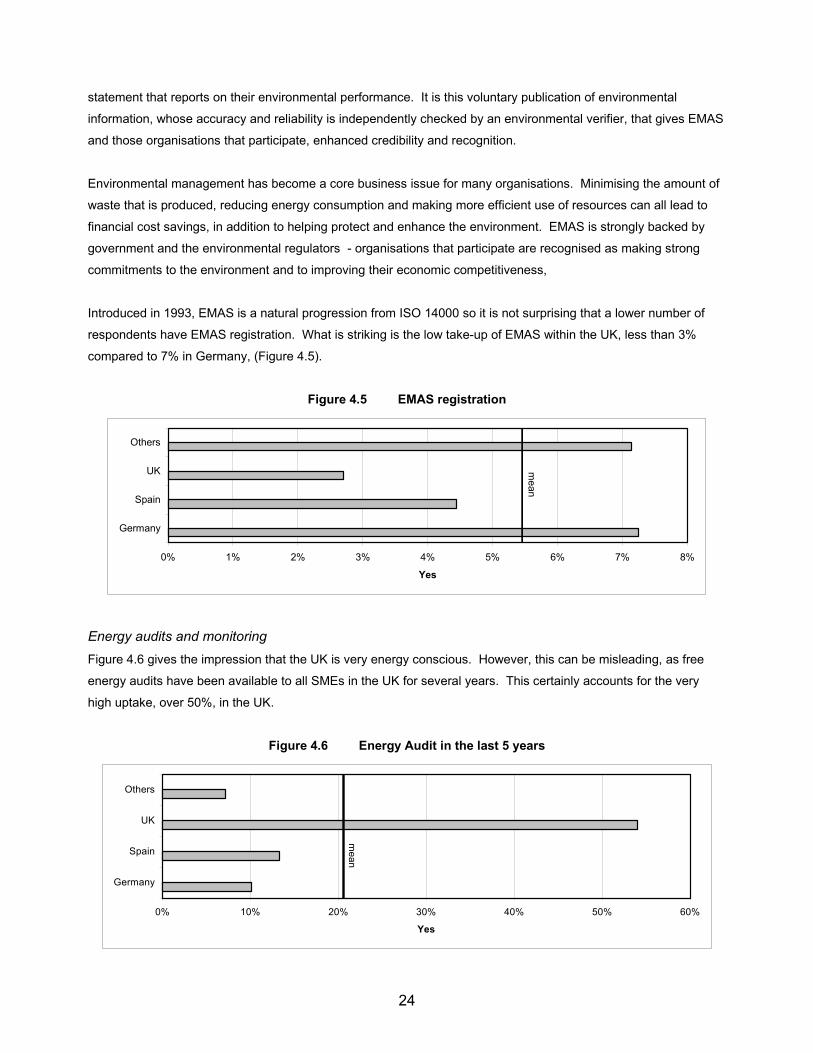
ISO 14000 is a series of international standards on environmental management. It provides a framework for the
development of an environmental management system, and was developed as a result of the Rio Summit on the
Environment, 1992. A number of national standards emerged (BS 7750 being the first), prior to ISO creating an
international standard. ISO 14001 is the corner stone standard of the ISO 14000 series. It specifies a framework
of control for an Environmental Management System against which an organisation can be certified by a third
party. Almost 30% of respondents have ISO 14000 certification which is a good starting point for energy
management, (Figure 4.4).
Figure 4.4 ISO 14000 certification
0% 5% 10% 15% 20% 25% 30% 35% 40%
Germany
Spain
UK
Others
Yes
me
an
EMAS – the Eco-Management and Audit Scheme is designed to improve a company’s environmental performance.
It is a European scheme under Council Regulation 761/01 and aims to recognise and reward those organisations
that go beyond minimum legal compliance and continuously improve their environmental performance. In addition,
it is a requirement of the scheme that participating organisations regularly produce a public environmental
24
statement that reports on their environmental performance. It is this voluntary publication of environmental
information, whose accuracy and reliability is independently checked by an environmental verifier, that gives EMAS
and those organisations that participate, enhanced credibility and recognition.
Environmental management has become a core business issue for many organisations. Minimising the amount of
waste that is produced, reducing energy consumption and making more efficient use of resources can all lead to
financial cost savings, in addition to helping protect and enhance the environment. EMAS is strongly backed by
government and the environmental regulators - organisations that participate are recognised as making strong
commitments to the environment and to improving their economic competitiveness,
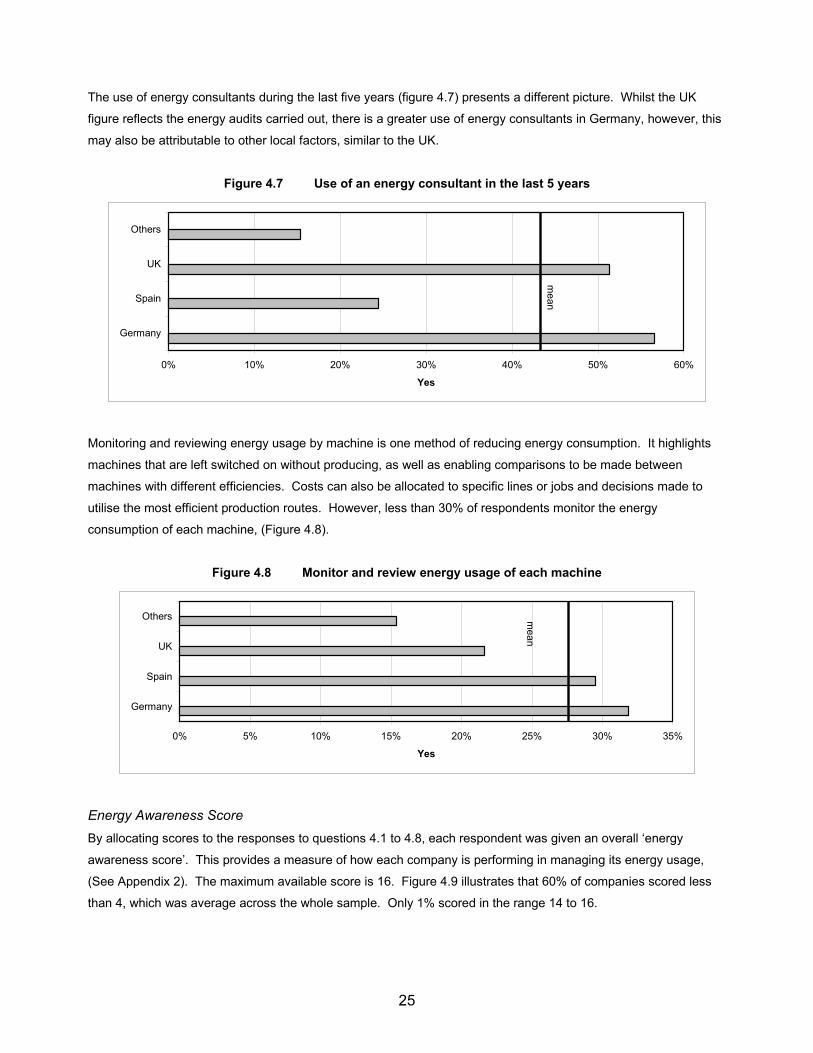
Introduced in 1993, EMAS is a natural progression from ISO 14000 so it is not surprising that a lower number of
respondents have EMAS registration. What is striking is the low take-up of EMAS within the UK, less than 3%
compared to 7% in Germany, (Figure 4.5).
Figure 4.5 EMAS registration
0% 1% 2% 3% 4% 5% 6% 7% 8%
Germany
Spain
UK
Others
Yes
me
an
Energy audits and monitoring
Figure 4.6 gives the impression that the UK is very energy conscious. However, this can be misleading, as free
energy audits have been available to all SMEs in the UK for several years. This certainly accounts for the very
high uptake, over 50%, in the UK.
Figure 4.6 Energy Audit in the last 5 years
0% 10% 20% 30% 40% 50% 60%
Germany
Spain
UK
Others
Yes
me
an
25
The use of energy consultants during the last five years (figure 4.7) presents a different picture. Whilst the UK
figure reflects the energy audits carried out, there is a greater use of energy consultants in Germany, however, this
may also be attributable to other local factors, similar to the UK.
Figure 4.7 Use of an energy consultant in the last 5 years
0% 10% 20% 30% 40% 50% 60%
Germany
Spain
UK
Others
Yes
me
an
Monitoring and reviewing energy usage by machine is one method of reducing energy consumption. It highlights
machines that are left switched on without producing, as well as enabling comparisons to be made between
machines with different efficiencies. Costs can also be allocated to specific lines or jobs and decisions made to
utilise the most efficient production routes. However, less than 30% of respondents monitor the energy
consumption of each machine, (Figure 4.8).
Figure 4.8 Monitor and review energy usage of each machine
0% 5% 10% 15% 20% 25% 30% 35%
Germany
Spain
UK
Others
Yes
me
an
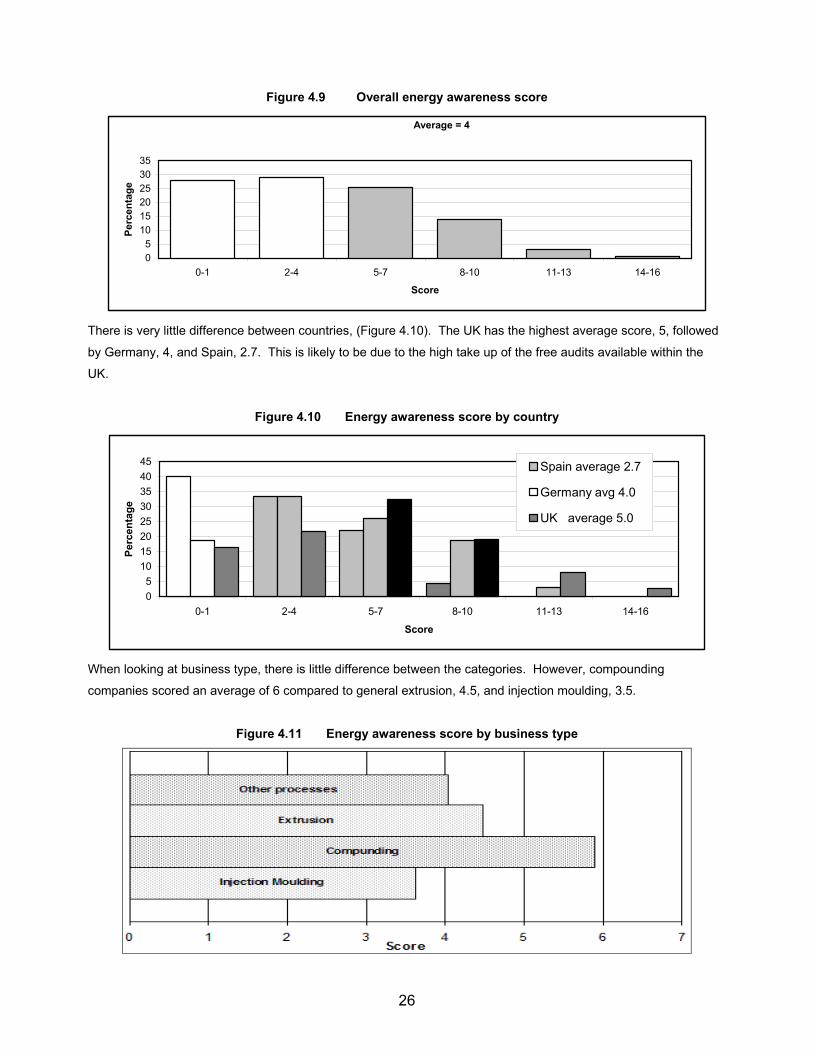
Energy Awareness Score
By allocating scores to the responses to questions 4.1 to 4.8, each respondent was given an overall ‘energy
awareness score’. This provides a measure of how each company is performing in managing its energy usage,
(See Appendix 2). The maximum available score is 16. Figure 4.9 illustrates that 60% of companies scored less
than 4, which was average across the whole sample. Only 1% scored in the range 14 to 16.
26
Figure 4.9 Overall energy awareness score
Average = 4
0
5
10
15
20
25
30
35
0-1 2-4 5-7 8-10 11-13 14-16
Score
Percentage
There is very little difference between countries, (Figure 4.10). The UK has the highest average score, 5, followed
by Germany, 4, and Spain, 2.7. This is likely to be due to the high take up of the free audits available within the
UK.
Figure 4.10 Energy awareness score by country
0
5
10
15
20
25
30
35
40
45
0-1 2-4 5-7 8-10 11-13 14-16
Score
Percentage
Spain average 2.7
Germany avg 4.0
UK average 5.0
When looking at business type, there is little difference between the categories. However, compounding
companies scored an average of 6 compared to general extrusion, 4.5, and injection moulding, 3.5.
Figure 4.11 Energy awareness score by business type
27
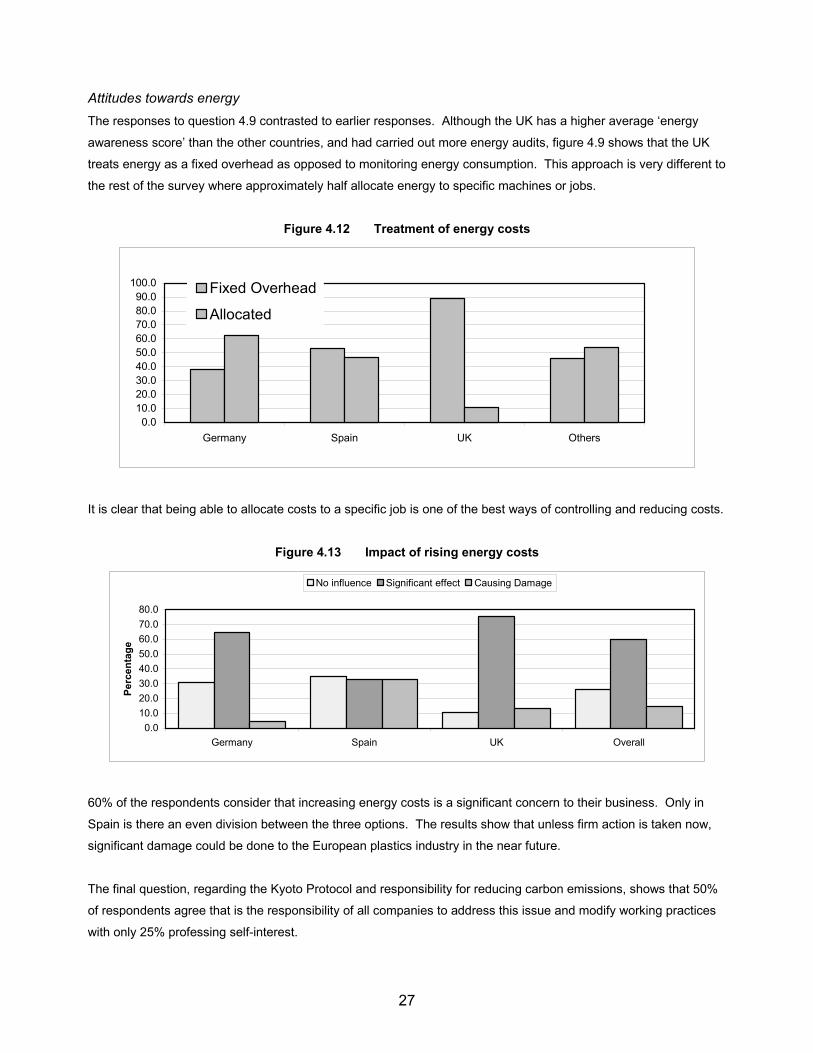
Attitudes towards energy
The responses to question 4.9 contrasted to earlier responses. Although the UK has a higher average ‘energy
awareness score’ than the other countries, and had carried out more energy audits, figure 4.9 shows that the UK
treats energy as a fixed overhead as opposed to monitoring energy consumption. This approach is very different to
the rest of the survey where approximately half allocate energy to specific machines or jobs.
Figure 4.12 Treatment of energy costs
0.0
10.0
20.0
30.0
40.0
50.0
60.0
70.0
80.0
90.0
100.0
Germany Spain UK Others
Fixed Overhead
Allocated
It is clear that being able to allocate costs to a specific job is one of the best ways of controlling and reducing costs.
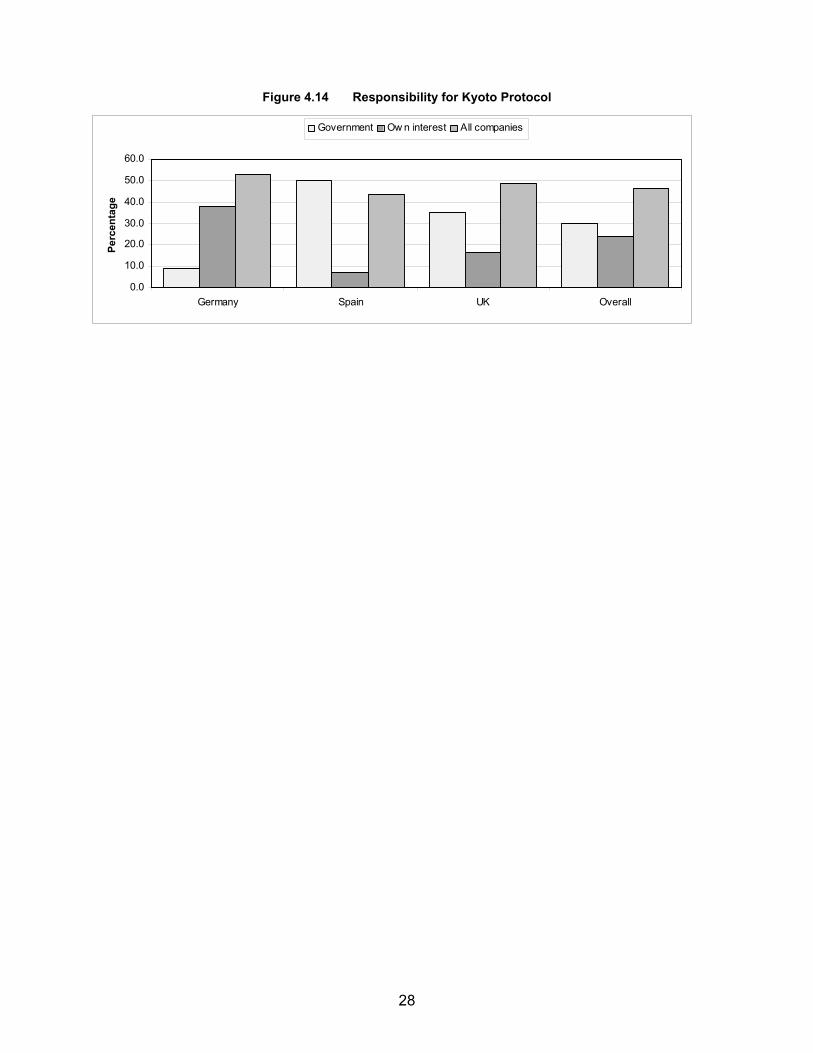
Figure 4.13 Impact of rising energy costs
0.0
10.0
20.0
30.0
40.0
50.0
60.0
70.0
80.0
Germany Spain UK Overall
Percentage
No influence Significant effect Causing Damage
60% of the respondents consider that increasing energy costs is a significant concern to their business. Only in
Spain is there an even division between the three options. The results show that unless firm action is taken now,
significant damage could be done to the European plastics industry in the near future.
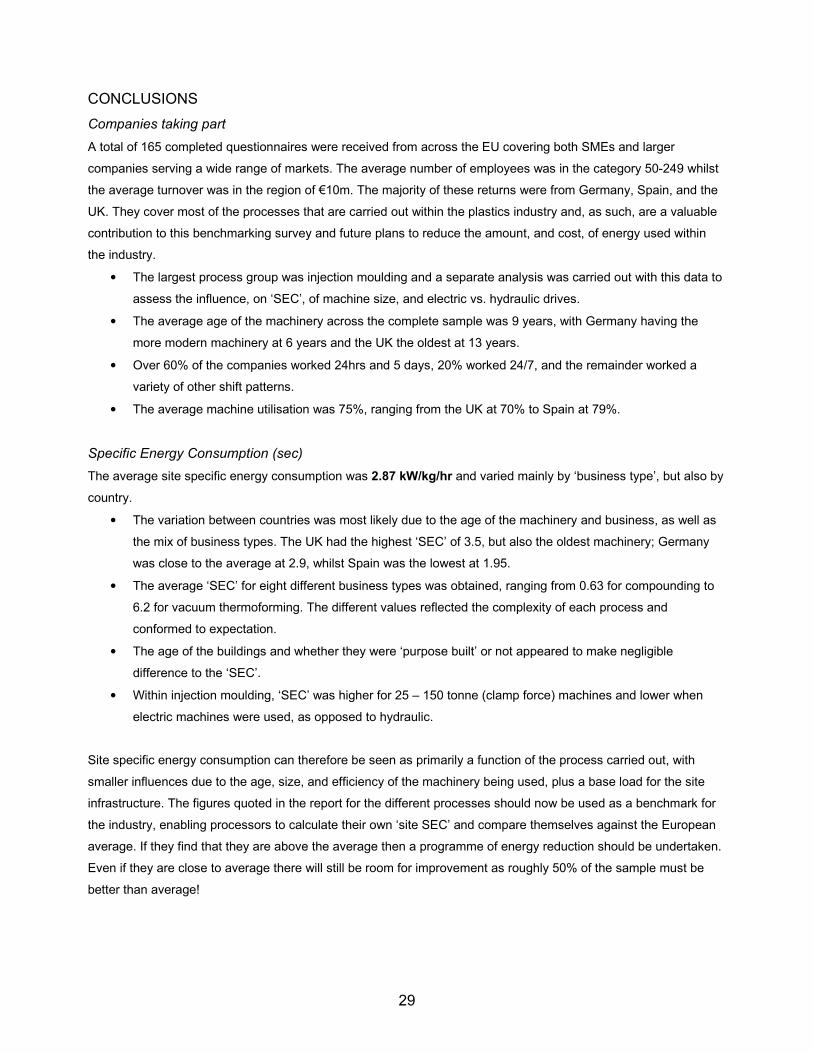
The final question, regarding the Kyoto Protocol and responsibility for reducing carbon emissions, shows that 50%
of respondents agree that is the responsibility of all companies to address this issue and modify working practices
with only 25% professing self-interest.
28
Figure 4.14 Responsibility for Kyoto Protocol
0.0
10.0
20.0
30.0
40.0
50.0
60.0
Germany Spain UK Overall
Percentage
Government Ow n interest All companies
29
CONCLUSIONS
Companies taking part
A total of 165 completed questionnaires were received from across the EU covering both SMEs and larger
companies serving a wide range of markets. The average number of employees was in the category 50-249 whilst
the average turnover was in the region of €10m. The majority of these returns were from Germany, Spain, and the
UK. They cover most of the processes that are carried out within the plastics industry and, as such, are a valuable
contribution to this benchmarking survey and future plans to reduce the amount, and cost, of energy used within
the industry.
• The largest process group was injection moulding and a separate analysis was carried out with this data to
assess the influence, on ‘SEC’, of machine size, and electric vs. hydraulic drives.
• The average age of the machinery across the complete sample was 9 years, with Germany having the
more modern machinery at 6 years and the UK the oldest at 13 years.
• Over 60% of the companies worked 24hrs and 5 days, 20% worked 24/7, and the remainder worked a
variety of other shift patterns.
• The average machine utilisation was 75%, ranging from the UK at 70% to Spain at 79%.
Specific Energy Consumption (sec)
The average site specific energy consumption was 2.87 kW/kg/hr and varied mainly by ‘business type’, but also by
country.
• The variation between countries was most likely due to the age of the machinery and business, as well as
the mix of business types. The UK had the highest ‘SEC’ of 3.5, but also the oldest machinery; Germany
was close to the average at 2.9, whilst Spain was the lowest at 1.95.
• The average ‘SEC’ for eight different business types was obtained, ranging from 0.63 for compounding to
6.2 for vacuum thermoforming. The different values reflected the complexity of each process and
conformed to expectation.
• The age of the buildings and whether they were ‘purpose built’ or not appeared to make negligible
difference to the ‘SEC’.
• Within injection moulding, ‘SEC’ was higher for 25 – 150 tonne (clamp force) machines and lower when
electric machines were used, as opposed to hydraulic.
Site specific energy consumption can therefore be seen as primarily a function of the process carried out, with
smaller influences due to the age, size, and efficiency of the machinery being used, plus a base load for the site
infrastructure. The figures quoted in the report for the different processes should now be used as a benchmark for
the industry, enabling processors to calculate their own ‘site SEC’ and compare themselves against the European
average. If they find that they are above the average then a programme of energy reduction should be undertaken.
Even if they are close to average there will still be room for improvement as roughly 50% of the sample must be
better than average!
30
Cost of Energy and Fuels Used
The average cost of energy for respondents across Europe over a 12-month period was 0.08 €/kWh, but ranged
from 0.04 for Poland to 0.10 for Germany. The variation could be due to a variety of factors such as exchange
rates, the small number of returns from some of the countries mentioned, and also because the data could not be
guaranteed to cover a consistent period of time. Another factor was the mixture of fuels utilised, the UK had 80%
using both gas and electricity, whilst Spain was very reliant upon electricity. The survey showed that, where a
company uses a mixture of fuels, it is likely that their average cost per kWh will be lower. In fact those using more
than two types of fuel paid significantly less per kWh for their fuel.
Sources of Energy
Hardly any companies generated their own electricity, and only 14% purchased electricity from a local generation
scheme or recovered energy for reuse. The exception was Germany where about 70% purchased from a local
scheme and recovered energy for reuse.
Energy Awareness
• Around 30% of the companies responding to the survey claimed to adhere to a written energy policy,
although some of these were incorporated within an overall environmental policy statement.
• The UK at 50% was significantly higher than other countries, which may reflect the high take up of energy
audits, funded by government through the Carbon Trust.
• Less than 5% actually employ a full time energy manager.
• About 55% of companies have ensured that a senior manager has responsibility for energy management.
• Almost 30% of those who completed the questionnaire have ISO 14000 certification which is a good
starting point for energy management. However, this does mean that 70% of those who completed the
questionnaire did not have ISO 14000.
• EMAS is a natural progression from ISO14000 so it is not surprising that a lower number have EMAS
registration, but such a low figure of 5% is surprising.
• Only 20% had an energy audit in the last 5 years, most of these in the UK.
• Around 40% had made use of energy consultants.
• Less than 30% monitored energy on each machine.
An energy awareness score, arrived at from the responses in this section, had a potential maximum of 16. About
60% of companies scored less than 4, which was the average for the whole sample. Only 1% scored in the range
14 to 16. As it is likely that most of those companies returning a questionnaire were already concerned about
energy, the conclusion must be that we still have a long way to go in energy management.
Attitudes towards energy can be summarised as follows: -
• The UK plastics industry far from monitoring energy usually treats it as a fixed overhead. This approach is
very different to the remainder of the respondents where roughly half allocate energy to specific machines
or jobs. It is clear that being able to allocate costs to a specific job is one of the best ways of controlling and
reducing costs, and this may partly explain the higher ‘sec’ within the UK. Hence, a review of overhead

31
costing within the UK is required to assist in the target of reducing energy usage and hence carbon dioxide
emissions.
• 60% of companies felt that unless firm action was taken now to combat rising energy costs, significant
damage could be done to the plastics industry within Europe in the near future.
• The heartening response to the question on the Kyoto protocol was that almost 50% felt that reducing
energy usage was everybody’s responsibility, with only 25% claiming to put their own business interests
first.
This survey has generated enough information to set benchmarks for specific energy consumption, across Europe,
for eight different plastics processes. It also provides insights regarding the influence of, age and type of building,
age and size of machinery, and country of operation, which may reflect differing governmental influence.
The general attitude to the ‘energy’ issue amongst respondents was positive but, from the low energy awareness
score, it is apparent that a lot of improvement could still be made. It is important, therefore, that all companies
review their energy position, compare themselves against the benchmark data, and implement changes
accordingly. Their future, and that of the plastics industry in Europe, could depend upon how we manage the issue
of energy consumption and increasing costs.
32
RECIPE (REDUCED ENERGY CONSUMPTION IN PLASTICS ENGINEERING)
2005 EUROPEAN BENCHMARKING SURVEY OF ENERGY CONSUMPTION AND ADOPTION OF
BEST PRACTICE
APPENDIX 1 – THE QUESTIONNAIRE
33
Introduction
The purpose of this questionnaire is to benchmark energy usage in plastics processing companies
across Europe in 2005, and to establish where variations exist from ‘typical’ usage. In addition, we should
like to understand how companies view and manage their energy usage.
This survey is the first action within a European-funded programme specifically intended to assist
plastics processors in reducing energy consumption. The information we collect will influence future
actions under this programme, as well as providing representative data against which all companies can
evaluate their own energy consumption.
Please answer the following questions as precisely as possible, in order that we may draw
meaningful conclusions. We will not disclose any data about individual companies within the survey
results.
All respondents will receive a copy of the final report regarding energy efficiency in European
plastics processing.
Please return your completed questionnaires to;
Suzanne Wilkinson, Project Manager
Address Rapra Technology Ltd, Shawbury, Shrewsbury, Shropshire, SY4 4NR
FAX 01939 251118
E-mail [email protected]
If you have any questions or would like more information, call 01939 252435 or e-mail
34
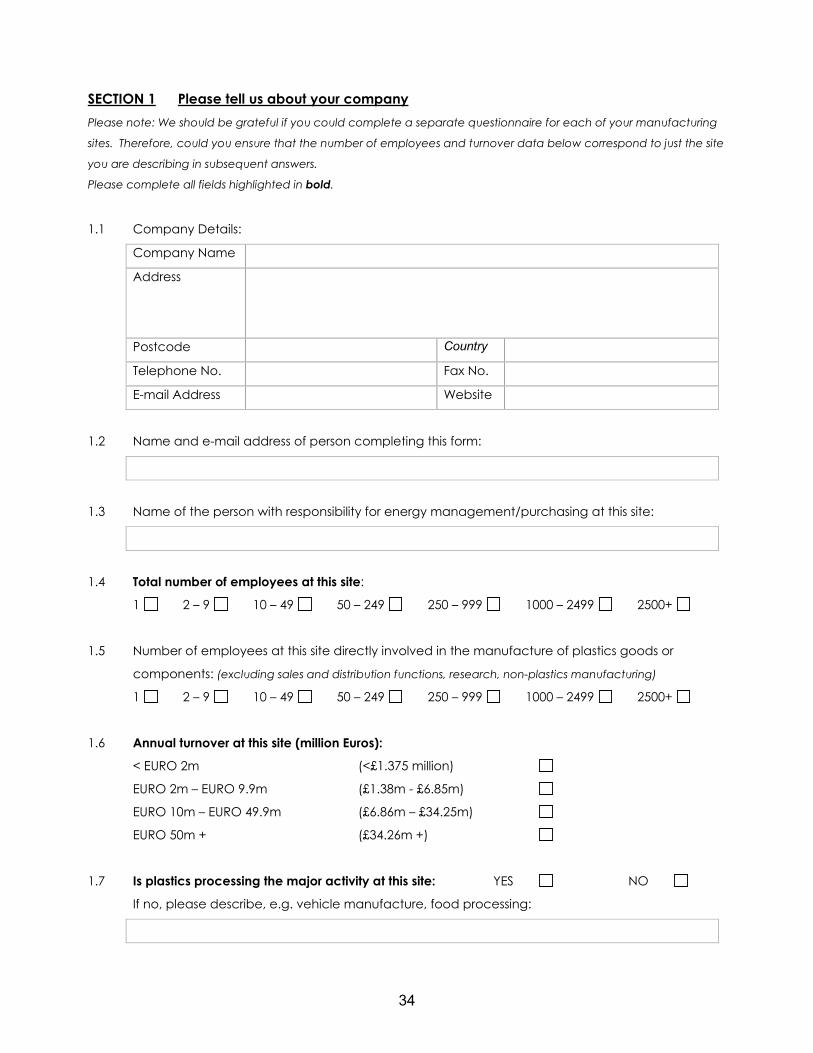
SECTION 1 Please tell us about your company
Please note: We should be grateful if you could complete a separate questionnaire for each of your manufacturing
sites. Therefore, could you ensure that the number of employees and turnover data below correspond to just the site
you are describing in subsequent answers.
Please complete all fields highlighted in bold.
1.1 Company Details:
Company Name
Address
Postcode Country
Telephone No. Fax No.
E-mail Address Website
1.2 Name and e-mail address of person completing this form:
1.3 Name of the person with responsibility for energy management/purchasing at this site:
1.4 Total number of employees at this site:
1 2 – 9 10 – 49 50 – 249 250 – 999 1000 – 2499 2500+
1.5 Number of employees at this site directly involved in the manufacture of plastics goods or
components: (excluding sales and distribution functions, research, non-plastics manufacturing)
1 2 – 9 10 – 49 50 – 249 250 – 999 1000 – 2499 2500+
1.6 Annual turnover at this site (million Euros):
< EURO 2m (<£1.375 million)
EURO 2m – EURO 9.9m (£1.38m - £6.85m)
EURO 10m – EURO 49.9m (£6.86m – £34.25m)
EURO 50m + (£34.26m +)
1.7 Is plastics processing the major activity at this site: YES NO
If no, please describe, e.g. vehicle manufacture, food processing:
35
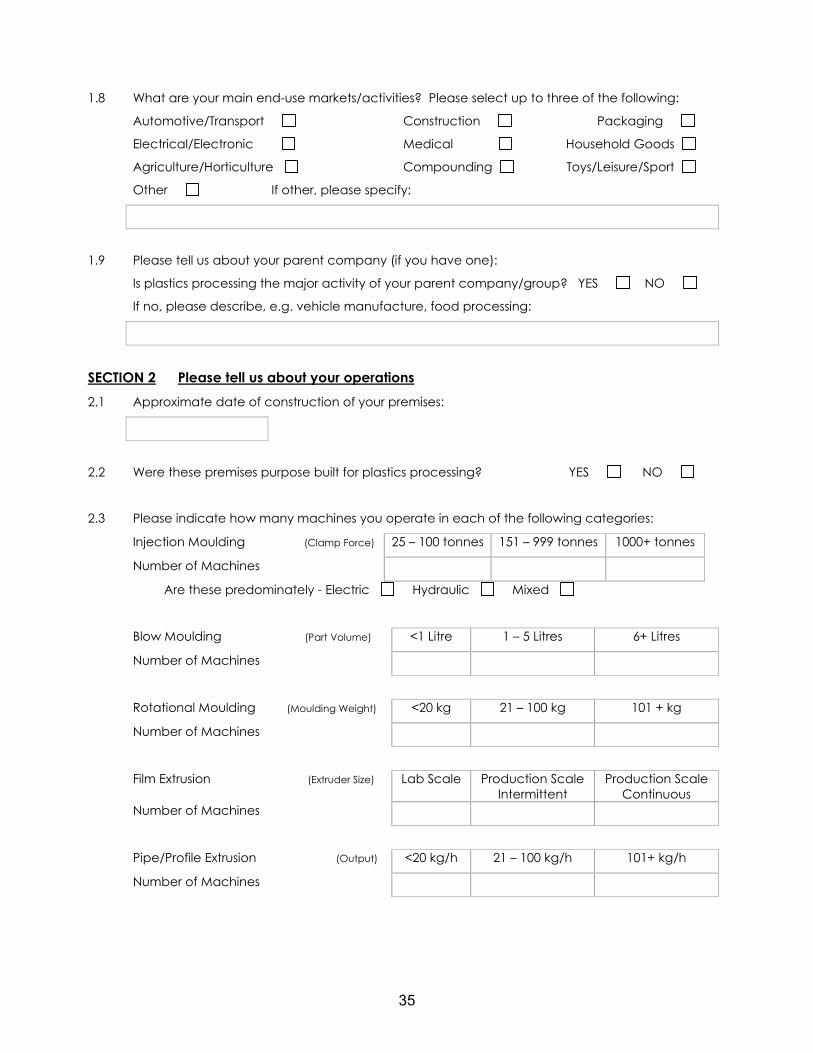
1.8 What are your main end-use markets/activities? Please select up to three of the following:
Automotive/Transport Construction Packaging
Electrical/Electronic Medical Household Goods
Agriculture/Horticulture Compounding Toys/Leisure/Sport
Other If other, please specify:
1.9 Please tell us about your parent company (if you have one):
Is plastics processing the major activity of your parent company/group? YES NO
If no, please describe, e.g. vehicle manufacture, food processing:
SECTION 2 Please tell us about your operations
2.1 Approximate date of construction of your premises:
2.2 Were these premises purpose built for plastics processing? YES NO
2.3 Please indicate how many machines you operate in each of the following categories:
Injection Moulding (Clamp Force) 25 – 100 tonnes 151 – 999 tonnes 1000+ tonnes
Number of Machines
Are these predominately - Electric Hydraulic Mixed
Blow Moulding (Part Volume) <1 Litre 1 – 5 Litres 6+ Litres
Number of Machines
Rotational Moulding (Moulding Weight) <20 kg 21 – 100 kg 101 + kg
Number of Machines
Film Extrusion (Extruder Size) Lab Scale Production Scale
Intermittent
Production Scale
Continuous
Number of Machines
Pipe/Profile Extrusion (Output) <20 kg/h 21 – 100 kg/h 101+ kg/h
Number of Machines
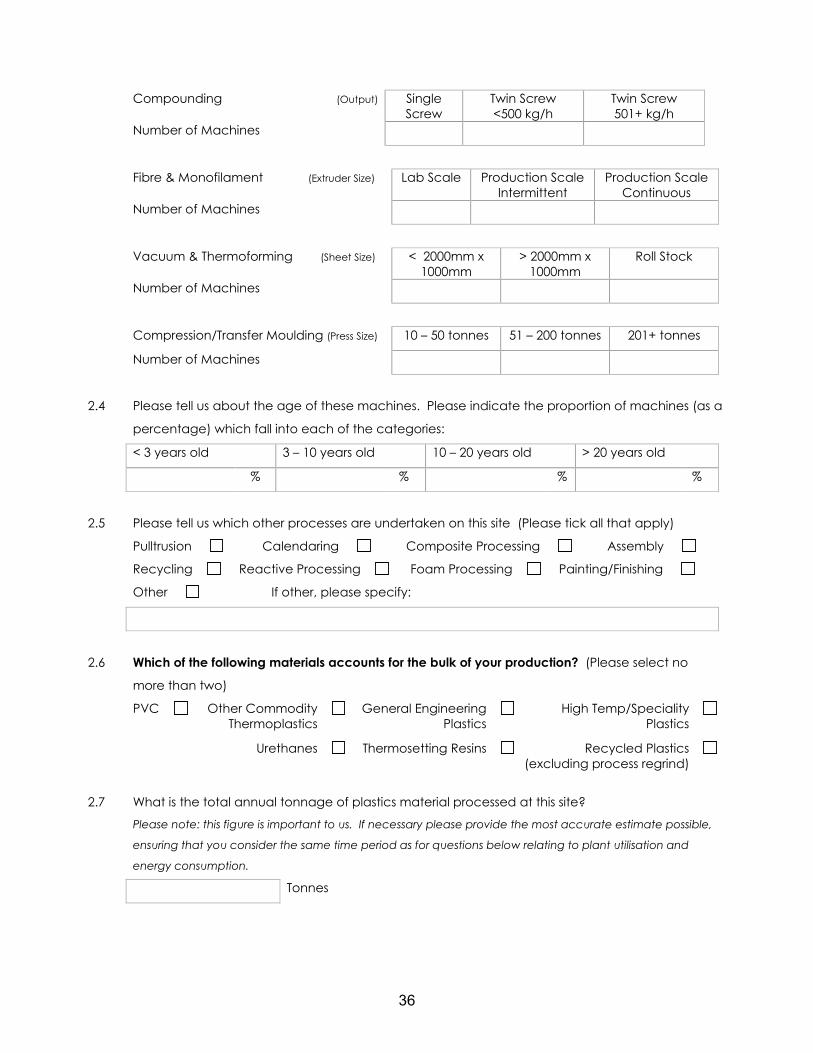
36
Compounding (Output) Single
Screw
Twin Screw
<500 kg/h
Twin Screw
501+ kg/h
Number of Machines
Fibre & Monofilament (Extruder Size) Lab Scale Production Scale
Intermittent
Production Scale
Continuous
Number of Machines
Vacuum & Thermoforming (Sheet Size) < 2000mm x
1000mm
> 2000mm x
1000mm
Roll Stock
Number of Machines
Compression/Transfer Moulding (Press Size) 10 – 50 tonnes 51 – 200 tonnes 201+ tonnes
Number of Machines
2.4 Please tell us about the age of these machines. Please indicate the proportion of machines (as a
percentage) which fall into each of the categories:
< 3 years old 3 – 10 years old 10 – 20 years old > 20 years old
% % % %
2.5 Please tell us which other processes are undertaken on this site (Please tick all that apply)
Pulltrusion Calendaring Composite Processing Assembly
Recycling Reactive Processing Foam Processing Painting/Finishing
Other If other, please specify:
2.6 Which of the following materials accounts for the bulk of your production? (Please select no
more than two)
PVC Other Commodity
Thermoplastics
General Engineering
Plastics
High Temp/Speciality
Plastics
Urethanes Thermosetting Resins Recycled Plastics
(excluding process regrind)
2.7 What is the total annual tonnage of plastics material processed at this site?
Please note: this figure is important to us. If necessary please provide the most accurate estimate possible,
ensuring that you consider the same time period as for questions below relating to plant utilisation and
energy consumption.
Tonnes
37
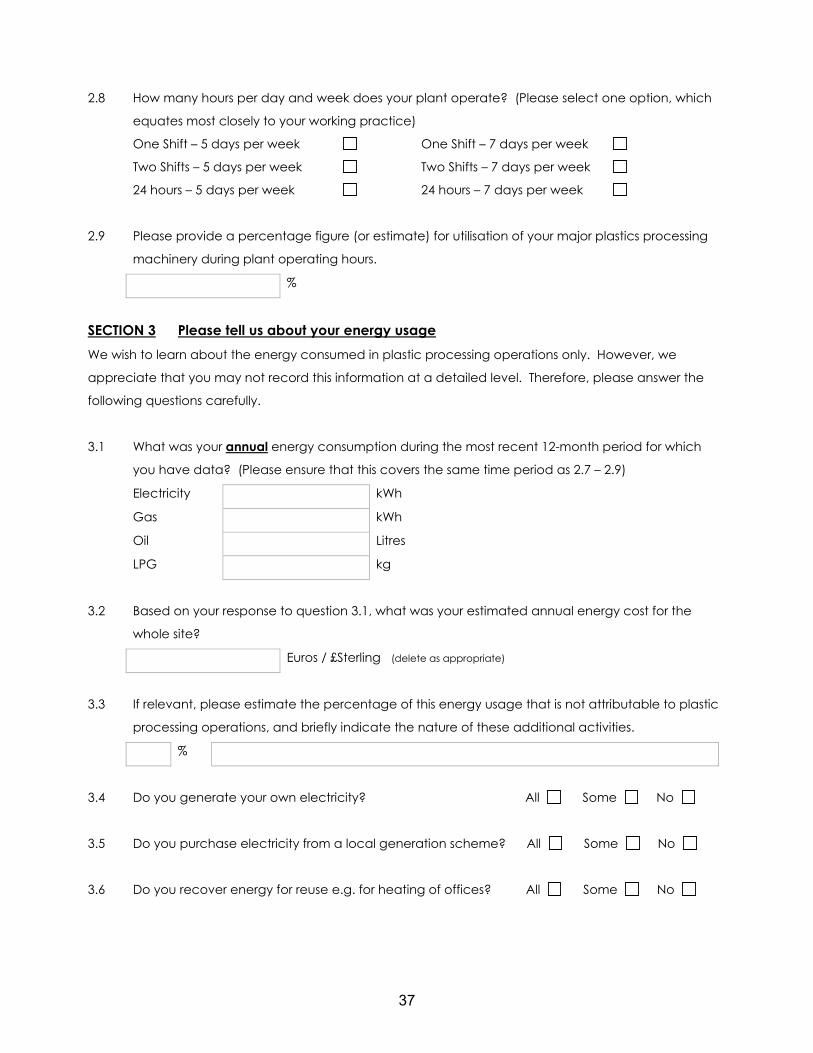
2.8 How many hours per day and week does your plant operate? (Please select one option, which
equates most closely to your working practice)
One Shift – 5 days per week One Shift – 7 days per week
Two Shifts – 5 days per week Two Shifts – 7 days per week
24 hours – 5 days per week 24 hours – 7 days per week
2.9 Please provide a percentage figure (or estimate) for utilisation of your major plastics processing
machinery during plant operating hours.
%
SECTION 3 Please tell us about your energy usage
We wish to learn about the energy consumed in plastic processing operations only. However, we
appreciate that you may not record this information at a detailed level. Therefore, please answer the
following questions carefully.
3.1 What was your annual energy consumption during the most recent 12-month period for which
you have data? (Please ensure that this covers the same time period as 2.7 – 2.9)
Electricity kWh
Gas kWh
Oil Litres
LPG kg
3.2 Based on your response to question 3.1, what was your estimated annual energy cost for the
whole site?
Euros / £Sterling (delete as appropriate)
3.3 If relevant, please estimate the percentage of this energy usage that is not attributable to plastic
processing operations, and briefly indicate the nature of these additional activities.
%
3.4 Do you generate your own electricity? All Some No
3.5 Do you purchase electricity from a local generation scheme? All Some No
3.6 Do you recover energy for reuse e.g. for heating of offices? All Some No

38
SECTION 4 Finally, please tell us about your energy management practices and attitudes
4.1 Do you employ a full time energy manager Yes No
4.2 Is energy management the specific responsibility of one member of
your senior management?
Yes No
4.3 Does your company adhere to a written energy/environmental
policy?
Yes No
4.4 Does your company have ISO 14000 certification? Yes No
4.5 Does your company have EMAS registration? Yes No
4.6 Have you had an energy audit at this site in the last 5 years? Yes No
4.7 Have you employed the services of an energy consultant in the last 5
years?
Yes No
4.8 Do you monitor and review the energy consumption of individual
plastics processing machines?
Yes No
4.9 Which of the following statements most closely reflects the way in which energy costs are
accounted for in your business?
The cost of energy is treated as a fixed overhead
The cost of energy is allocated to specific machines or jobs
4.10 Which of the following statements most closely reflects your views on the impact of rising energy
costs?
The cost of energy does not significantly influence the competitiveness of our products
Increases in energy costs are of considerable concern to our business now
The rising cost of energy is causing significant damage to our business now

39
4.11 Which of the following statements most closely reflects your views on the requirements of the
Kyoto protocol to reduce carbon dioxide emissions?
This is the responsibility of governments and should be addressed e.g. through the
development of sustainable energy provision
We will address this issue only where there are clear benefits for our company
It is the responsibility of all companies to address this issue and modify working practices of
required
4.12 Would you like to receive a copy of the RECIPE report? YES NO
Thank you for completing this questionnaire, please return it to
Suzanne Wilkinson, Project Manager
Address Rapra Technology Ltd, Shawbury, Shrewsbury, Shropshire, SY4 4NR
FAX 01939 251118
E-mail [email protected]

40
RECIPE (REDUCED ENERGY CONSUMPTION IN PLASTICS ENGINEERING)
2005 EUROPEAN BENCHMARKING SURVEY OF ENERGY CONSUMPTION AND ADOPTION OF
BEST PRACTICE
APPENDIX 2 – ENERGY AWARENESS SCORE
41
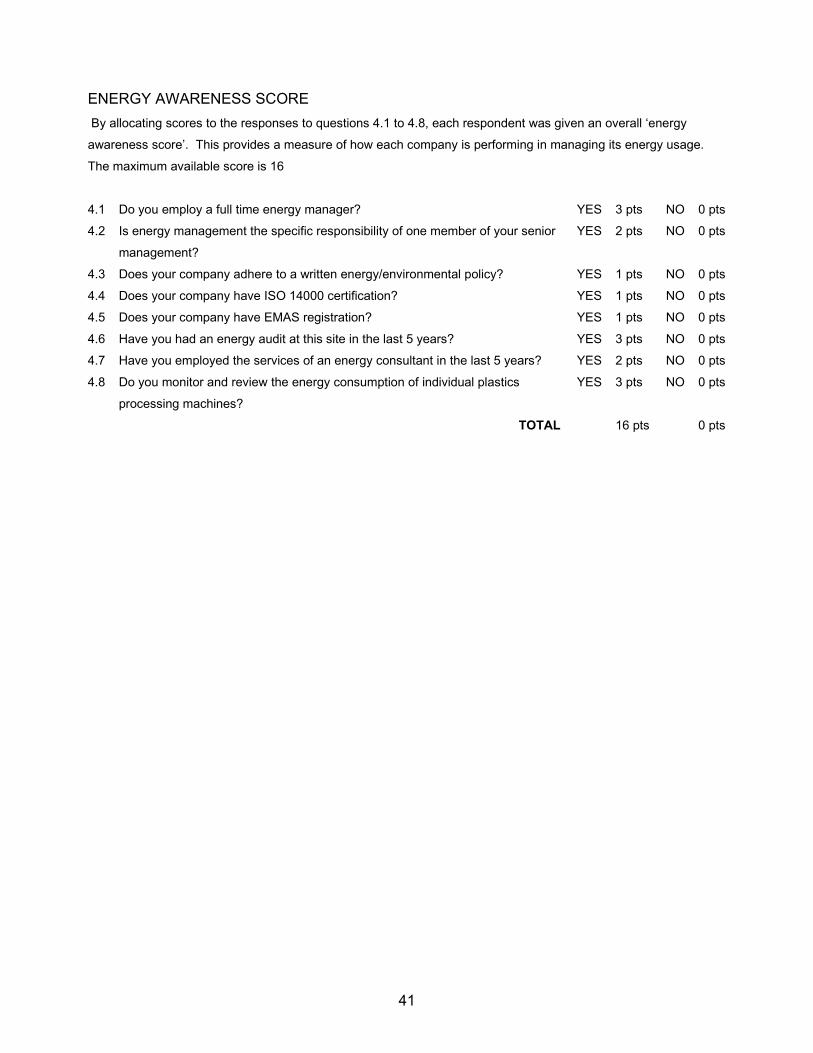
ENERGY AWARENESS SCORE
By allocating scores to the responses to questions 4.1 to 4.8, each respondent was given an overall ‘energy
awareness score’. This provides a measure of how each company is performing in managing its energy usage.
The maximum available score is 16
4.1 Do you employ a full time energy manager? YES 3 pts NO 0 pts
4.2 Is energy management the specific responsibility of one member of your senior
management?
YES 2 pts NO 0 pts
4.3 Does your company adhere to a written energy/environmental policy? YES 1 pts NO 0 pts
4.4 Does your company have ISO 14000 certification? YES 1 pts NO 0 pts
4.5 Does your company have EMAS registration? YES 1 pts NO 0 pts
4.6 Have you had an energy audit at this site in the last 5 years? YES 3 pts NO 0 pts
4.7 Have you employed the services of an energy consultant in the last 5 years? YES 2 pts NO 0 pts
4.8 Do you monitor and review the energy consumption of individual plastics
processing machines?
YES 3 pts NO 0 pts
TOTAL 16 pts 0 pts
42
RECIPE (REDUCED ENERGY CONSUMPTION IN PLASTICS ENGINEERING)
2005 EUROPEAN BENCHMARKING SURVEY OF ENERGY CONSUMPTION AND ADOPTION OF
BEST PRACTICE
APPENDIX 3 – CONVERSION FIGURES

43
CONVERSION FIGURES
The conversion figures used within this report are –
• Gas 10.417 kWh/per cubic metre
• Oil 11.69 kWh/litre
• Liquid Petroleum Gas 13.70 kWh/kg