Embed Size (px)
DESCRIPTION
Â
Citation preview

Virgilio M. Viana, Gabriel Ribenboim, Thais Megid, Victor Salviati
REDD and Sustainable Development– Perspective from Brazil
RED
D W
oR
kin
g P
aP
ERs

First published by the International Institute for Environment and Development (UK) in 2010Copyright © Fundação Amazonas Sustentável and International Institute for Environment and DevelopmentAll rights reserved
For a full list of publications please contact:International Institute for Environment and Development (IIED)3 Endsleigh Street, London WC1H 0DD, United KingdomTel: +44 (0)20 7388 2117Fax: +44 (0)20 7388 [email protected] www.iied.org/pubs
Citation: Virgilio, V, Ribenboim, G, Megid, T and Salviati, V (2010) REDD Working Papers: REDD and sustainable development – perspective from Brazil IIED, London.
All omissions and inaccuracies in this document are the responsibility of the authors. The views expressed do not necessarily represent those of the institutions involved, nor do they necessarily represent official policies of Norad.
Design by: Eileen Higgins, email: [email protected] photo: iStockphoto.com/Zocha_K

Poverty and sustainable development impacts of REDD architecture; options for equity, growth and the environment
About this project...Poverty and sustainable development impacts of REDD architecture is a multi-country project led by the International Institute for Environment and Development (IIED, UK) and the University of Life Sciences (Aas, Norway). It started in July 2009 and will continue to May 2013. The project is funded by the Norwegian Agency for Development Cooperation (Norad) as part of the Norwegian Government’s Climate and Forest Initiative. The first phase of the project (July 2009 to May 2010) has been in partnership with Fundação Amazonas Sustentável (Brazil); Civic Response (Ghana); SNV (Viet Nam); Sokoine University of Agriculture, Faculty of Forestry and Nature Conservation (Tanzania); and Makerere University, Faculty of Forestry and Nature Conservation (Uganda).
The project aims to increase understanding of how different options for REDD design and policy at international, national and sub-national level will affect achievement of greenhouse gas emission reduction and co-benefits of sustainable development and poverty reduction. As well as examining the internal distribution and allocation of REDD payments under different design option scenarios at both international and national level, the project will work with selected REDD pilot projects in each of the five countries to generate evidence and improve understanding on the poverty impacts of REDD pilot activities, the relative merits of different types of payment mechanisms and the transaction costs.
In the first phase of the project, exploratory studies of different aspects of the design of REDD mechanisms were conducted to lay the foundation for the work in Phase 2. These Working Papers are designed to share the preliminary findings of research undertaken during the first phase of this project. They have not been subject to a full peer review process and are being made available online to stimulate discussion and feedback.
...in BrazilThis report looks at the implications of different approaches to reference level setting in REDD, taking an international approach and then applying this to the Brazilian national context to demonstrate the financial implications, resulting emissions reductions, and ultimately the viability of different approaches. Using the OSIRIS model the report examines three core questions regarding REDD mechanisms: What is the cost efficiency – the USD spent to reduce one tonne of CO2e (equivalent) at different carbon prices? What is its effectiveness – the ratio between the carbon price and the cost per tonne of CO2e? And what is the Net Present Value of gross REDD revenue?

About the authorsVirgilio M. Viana is CEO of Fundação Amazonas Sustentável (Amazonas Sustainable Foundation, FAS), in Brazil; Gabriel Ribenboim is the Manager of Special Projects at FAS; Thais Megid is
Coordinator of Special Projects at FAS and Victor Salviati is Analyst of Special Projects at FAS.
AcknowledgementsThis report has been produced under the project Poverty and sustainable development impacts of REDD architecture; options for equity growth and the environment, with generous support from the Norwegian Agency for Development Cooperation (NORAD).
We would like to thank the entire FAS team and a special thanks to Luiza Lima, intern at FAS, who helped us in developing as well as reviewing this report.

Contents
1 Introduction 1.1 Goal of the report 1.2 Justification of the proposed activities
2 Methodology 2.1 REDD modelling
3 Results 3.1 International 3.2 Results for Brazil
4 Conclusions 4.1 International level results 4.2 Results for Brazil and their implications
5 Bibliography
AnnexExecutive summary of the Brazilian task force on REDD and climate changes
144
55
99
18
212121
25
27

�
REDD and Sustainable Development – Perspective from Brazil
In addition to natural global climate changes, it is widely accepted that unsustainable development has jeopardised the biogeochemical equilibrium of the planet (IPCC, 2007). Land-use, land-use change and forestry (LULUCF) alone accounted for up to 14 per cent of CO2 emissions between 1850 and 1998 – about 136 gigatonnes of carbon (IPCC, 2007).
In a single year, 2007, electricity and heating were responsible for the majority of greenhouse gas (GHG) emissions – but were followed by land-use and forestry (Figure 1). Furthermore, LULUCF, and GHG emissions from agriculture are together greater than those produced by electricity and heating (World Resources Institute, 2000).
Introduction 1
Figure 1. Sources of global GHG emission in 2007
Source: World Resources Initiative, 2007
Yet LULUCF, which plays such an important role, mainly in high-forested tropical countries such as Brazil and Indonesia, has not received the attention it deserves for climate change mitigation, certainly not from the Kyoto Protocol. Even a 2006 decision of the United Nations Framework Convention on Climate Change (UNFCCC) has not seen LULUCF develop as it should: less than 6 per cent of the over 1,900 registered projects under the Clean Development Mechanism (CDM) can be classified as LULUCF (UNFCCC 2009).
The causes include weak government in those tropical countries that lack capacity to enforce national policies to combat deforestation activities, in the face of agricultural expansion (Moutinho, Schwartzman and Santilli, 2005), and scientific expertise to monitor the carbon stocks within growing forests (Schlamadinger et al., 2007).
�
REDD Working Papers
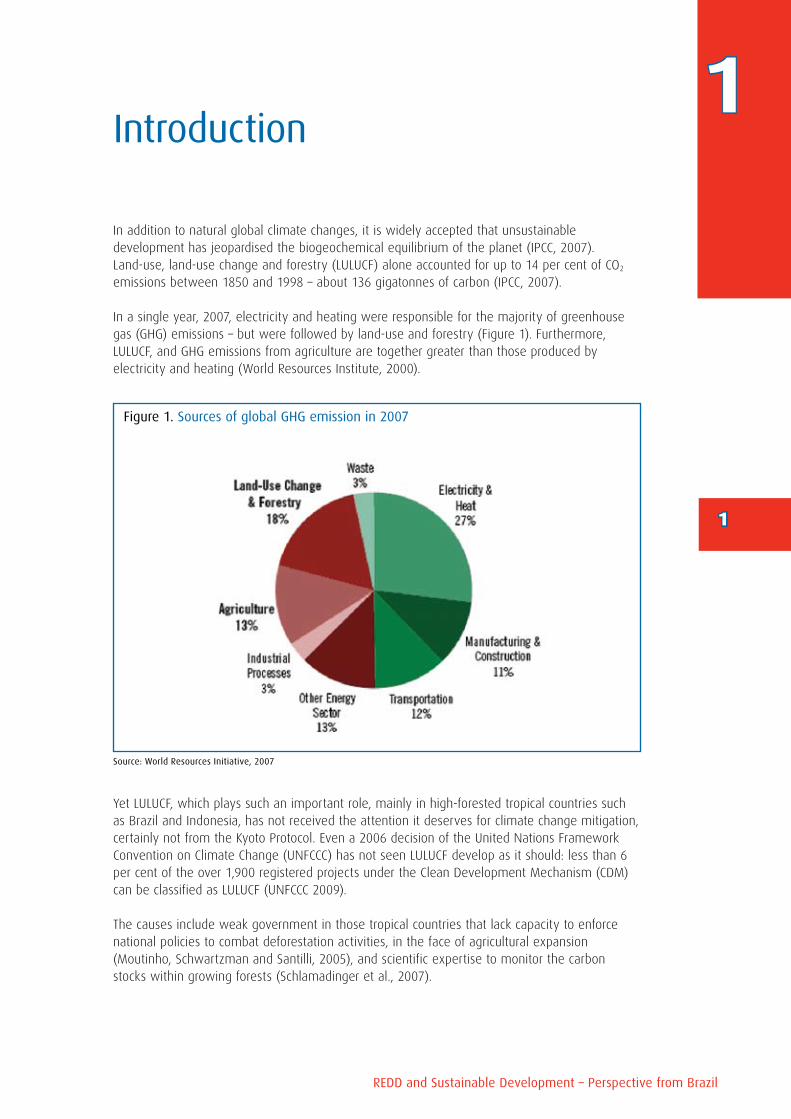
According to Stern (2007), curbing LULUCF emissions is a relatively low cost mitigation option: about US$5 billion yearly to prevent deforestation altogether in eight countries that are associated with about 70 per cent of LULUCF emissions globally. For high forest cover countries, incorporation of actions toward Reduced Emissions from Deforestation and Forest Degradation (REDD) within their national policies is one feasible way to cease LULUCF emissions (Busch, et al., 2009a). While there is some contention, there is an increasing consensus on REDD as a mechanism to curb GHG emission worldwide (Keller, 2008). Figure 2. World GHG emissions flowchart
Source: World Resources Initiative, 2000
Since COP-11 (Montreal, Canada), the Subsidiary Body for Scientific and Technical Advice has been discussing how to proceed with REDD. At COP-13 (Bali, Indonesia) the Bali Road Map was adopted as a two-year process, with the aim of finalising a binding agreement in 2009, in Copenhagen. The Bali Road Map includes the Bali Action Plan (BAP), which was adopted by a decision at COP-13; as well as negotiations made under the Ad Hoc Working Group on Further Commitments for Annex I Parties under the Kyoto Protocol (AWG-KP). It was expected that by the time of the 2009 deadline, the Adaptation Fund would have been launched, the scope and content of the Article 9 review of the Kyoto Protocol presented, and decisions taken on technology transfer and the REDD mechanism (UNFCCC, 2008).
REDD initiatives are also included in the Nationally Appropriate Mitigation Actions (NAMAs), which are the commitments of the developing countries to reduce their own greenhouse gas emissions. The Brazilian economy, for instance, is growing rapidly and a development model is needed that does not generate a significant increase of gases in the atmosphere.
To make this happen, Brazil has to reduce the pace of its emissions through national actions (MCT, 2009). Two REDD initiatives have been launched by the National Government: 1) the

�
REDD and Sustainable Development – Perspective from Brazil
National Action Plan to Prevent and Control Deforestation in the Amazon (PPCDAM) (2004), which includes territorial ordinance and environmental monitoring, as well as fostering sustainable development within the region (Lima, 2009); and 2) the National Plan on Climate Change (2008), which establishes national targets for emissions reduction in several sectors and includes the Amazon. The aim is to reach an 80 per cent reduction by 2020.
In parallel with these political actions, Brazil has set up the Amazon Fund1, managed by the Brazilian National Bank for Economic and Social Development (BNDES). Created in 2008, this non-reimbursable financing mechanism is helping to foster the preservation of the Amazon forest, contributing to both preventing and combating deforestation, as well as promoting sustainable development initiatives (Amazon Fund, 2008).
According to Lima (2009), this fund is one of the most important and large-scale REDD pilot programmes in the world, not only curbing GHG emissions from deforestation and fostering the sustainable development in the Amazon, but also alleviating poverty (Viana, 2009a, b).
Financing is at the core of all this. The rich countries must provide financial support so that the developing countries can implement their NAMAs and so change their development model without losing the opportunity to grow (MCT, 2009).
The Brazilian position on financing REDD is that there is space for the three existing options: donations from Annex 1 countries to support NAMAs, and both non-compensatory and compensatory resources from the carbon market. Under the non-compensatory proposal, a percentage of the money raised when carbon emission allowances are auctioned can be transferred to developing countries to finance NAMAs and REDD projects. Brazil also accepts the option of the compensatory market, but on the understanding that developed countries will only be able to offset their emissions if they comply with their domestic mitigation goals in other sectors, such as energy (MCT, 2009).
As avoided deforestation is not included in the first commitment period (2008–2012) of the Kyoto Protocol, discussions have focused on how REDD should operate in the second commitment period (2012–16) (Viana, 2009a).
It is known that REDD can address climate issues and poverty simultaneously, by preserving the carbon stock (avoided deforestation initiatives) in association with rewards to local people for conserving their forests (Viana, 2009a).
This has been already verified by the Juma Sustainable Development Reserve Project (hereafter, the Juma Project) in Amazonas, Brazil, approved under the Climate, Community and Biodiversity Alliance standard, and validated by TÜV SÜD. Moreover, the Juma Project is part of a broader initiative focused on payments for environmental services and therefore there are social and economic policies that help to preserve the forest – the ‘forests are worth more standing than cut’ (Viana, 2009b).
One of these policies is the Bolsa Floresta Programme. With both public and private sponsors and partners, Bolsa Floresta invests US$8.1 million a year in supporting 6,000 families that are committed to zero-deforestation activities (Viana, 2009b).
REDD-plus was one of the few advances coming from COP-15 (Copenhagen, Denmark). The Copenhagen Accord recognised the potential contribution a REDD-plus mechanism could make
1. For further information access http://www.amazonfund.gov.br/

�
REDD Working Papers
by providing incentives for forest-based mitigation and by mobilising new and additional resources from developed countries for forestry. Six donor countries committed $3.5 billion for REDD-plus from 2010 to 2012 (later increased to US$4 billion)2. The allocation of such resources is also in advanced discussions within the Interim REDD+ Partnership and, so far, REDD+ is one of the mitigation activities that has moved forward the most.
The success of an international REDD+ mechanism will depend on national contexts (internal policies, particular scenarios set, and so on) as well as international agreements on emission reduction trading and how to verify these reductions. In this context, Brazil plays an important role in the international REDD mechanisms, presenting itself at the forefront of the subject, participating actively in discussions and taking a position of influence. Brazil has developed internal policies, both federal and state, to regulate REDD in the country as a way to encourage a reduction in the rate of deforestation.
1.1 Goal of the reportThis report examines the implications of different approaches to setting reference levels in REDD with a focus on the emission reductions achieved and the cost-efficiency of achieving these reductions, taking into account the leakage effect on countries with low deforestation rates. FAS has chosen the OSIRIS methodological approach, which considers and analyses both international and national agreements within REDD scenarios.
1.2 Justification of the proposed activitiesBrazil’s biggest source of GHG emissions is believed to be deforestation and forest degradation (Busch et al., 2009a; Eliasch, 2008, and others). Thus, modelling national deforestation scenarios, considering both global and national policies and approaches, is crucial to understanding the different aspects and likely outcomes of REDD mechanisms.
2. REDD+ Partnership Adopted, May 27, 2010 http://www.oslocfc2010.no
�
REDD and Sustainable Development – Perspective from Brazil
This section explains how REDD scenarios were modelled and which approaches and data were used.
2.1 REDD modelling – reasons for selecting OSIRISThe models were run on OSIRIS (Open Source Impacts of REDD Incentives Spreadsheet version 3.0), a tool developed by Conservation International and collaborators (Busch et al., 2009b). OSIRIS was chosen because the tool allows the cost-benefit of REDD to be analysed based on emission reduction, carbon price, commitment period, carbon stock within the forest, and agriculture cost. It also allows approaches such as stock-and-flow, national historical, combined incentives, and cap-and-trade to be used, so that the Brazilian situation could be compared with other countries. Moreover, OSIRIS enables data to be customised and different REDD approaches to be modelled.
Note that OSIRIS includes CO2 only and excludes other greenhouse gases.
2.1.1 Background to OSIRISTo model its parameters, OSIRIS considers agriculture as the main alternative to REDD implementation in forest frontier areas. Therefore, it models a global partial equilibrium market during one period for a single composite commodity, which is the output of agriculture, including a one-time timber harvest produced on one hectare of land at the forest frontier (Busch et al 2009a; Murray 2008). The global supply curve for frontier agriculture in OSIRIS is the sum of national supply curves for each of 84 tropical or developing countries, potentially eligible for REDD. These supply curves are based on spatially explicit estimates of economic returns to agriculture and timber (Busch et al 2009a). Once this is done, OSIRIS models the impact of different REDD reference level design approaches at different carbon prices, also considering the opportunity cost (agriculture, for example) in relation to those carbon prices.
2.1.2 Issues examined in the modellingAs the major objective of this report was to assess the financial aspects of different REDD schemes, considering some stated propositions, some issues to be analysed were set.The first was cost-efficiency; that is, the US$ spent to reduce one tonne of CO2 equivalent (tCO2e) at different carbon prices (Busch et al., 2009b). This takes account of increases in deforestation and hence emissions in low deforestation countries – leakage. Costs higher than the carbon prices imply that leakage is taking place. The second was the project’s effectiveness; the ratio between the carbon price and the cost per tonne of CO2e (Busch et al., 2009b). A ratio higher than 1 implies greater effectiveness.
Finally, the net present value (NPV) of gross REDD revenue was considered – in other words, the gross REDD payments minus management cost and opportunity cost of one-off logging (Busch et al., 2009b).3
Methodology2
3. For further explanation, see Busch et al. (2009a) where the NPV of gross REDD revenues is defined by the A+B polygon at Figure 2 (p 5).

�
REDD Working Papers
2.1.3 Reference levels examinedMany research studies have been published on aspects of the REDD mechanism. Five approaches to setting reference levels are examined in this report:l national historical reference levels (Santilli et al., 2005)l combined incentives (Strassburg et al., 2009)l stock-flow-with-targets (Cattaneo, 2009) l cap-and-trade for REDD (Eliasch, 2008)l mixed mechanism (Busch, 2009, personal communication)
2.1.3.1 National historical reference levelsSantilli et al. (2005) have based their mechanism on the assumption that if Brazil and Indonesia curbed their emissions from deforestation, this would achieve four-fifths of the Kyoto Protocol goal.
Santilli et al. developed the ‘compensated reductions’ concept, whereby countries have to set national targets on deforestation emissions based on analysis of historical rates. Any improvement achieved such that deforestation emissions were below target would constitute a creditable emission reduction.
2.1.3.2 Combined incentives (Strassburg et al 2009)Strassburg et al. have proposed a mechanism that offers incentives to all forested countries, no matter whether they have high forest cover or low.
Strassburg et al. combine the national historical deforestation rate from a country with an adjustment to the global average deforestation rate. The adjustment factor a, (0<a<1) is a weighting index, which combines two mechanisms: historical reference (a = 1) and carbon stock reference (a = 0). As the a-factor varies, it is possible to prioritise both high-deforestation and low-deforestation countries (Busch et al., 2009a).
Low-deforestation countries define higher reference values, likewise high-deforestation ones set lower reference values. Thus, according to Strassburg et al., every forested country would be attracted to this approach, as it considers both historical reference and carbon stock. High deforestation countries then have sufficient incentive to curb their LULUCF emissions and low-deforestation ones will be rewarded by the carbon stock approach as their deforestation rate is below the global average.
2.1.3.3 Stock-flow-with-targetsCattaneo (2009) has proposed another variation on Santilli’s national historical reference: targets, for example national targets, are set and if there are improvements on these in generating emission reductions, the revenues from the reductions sold would be shared among the participants. In other words, when a country sells its emission reductions, a percentage would go to an international fund to pay for the existing carbon stocks in forests.
Thus, Cattaneo’s approach uses as a reference level a national historical target, as well as a withholding rate (hereafter ‘w’, default = 0.15)4 related to the carbon price to attract countries that do not have high deforestation levels but have a large carbon stock within planted forests.
4. For the design-specific parameters, multiple parameter values were tested, and the value chosen for which the design performed optimally (subjective combination of greatest emissions reductions and lowest cost per emissions reduction) under the default parameter (carbon price, elasticity etc) settings (Busch, J., personal communication).

�
REDD and Sustainable Development – Perspective from Brazil
2.1.3.4 Cap-and-trade for REDDThe approach of Eliasch (2008) was chosen only for comparison with the other mechanisms, as a previous study (Busch et al., 2009a) showed it to have the greatest climate effectiveness and cost efficiency under all parameter values.
With this type of mechanism, a country that reduces its emissions, from deforestation below a stated level would be able to commercialise its carbon credits – although it would be necessary to fix a ‘cap’ for the participant countries, which would be reviewed every ‘x’ years.
2.1.3.5 Mixed mechanismBusch (2009, personal communication) combines the stock-flow approach (Cattaneo, 2009) with the combined incentives (Strassburg et al., 2009), taking both mechanisms into account on a complementary level – considering the weight (a-factor) given by Strassburg in addition to a default withholding (w = 0.15) (Busch, et al., 2009b). In this way it addresses the interests of both low-deforestation countries and high-carbon-stock countries. The OSIRIS worksheets were adapted to accommodate this mixed mechanism.
2.1.4 Using OSIRIS – default and customised valuesFor this report OSIRIS was used to model REDD frameworks, considering both default and customised values. Four carbon prices (US$5, $10, $20 and $30) were used, making it possible to check feasibility and differences between the reference level frameworks across different prices. Four default commitment periods were used: (i) 2000–05 (FAO, 2005), (ii) 2011–15 (IIASA, 2008), (iii) 2016–20 (IIASA, 2008), and (iv) 2021–25 (IIASA, 2008).
The classification of countries as high forest cover with high deforestation rate, or high forest cover with low deforestation rate, was based on several studies (Griscom et al., 2009; Angelsen et al., 2009; Fonseca et al., 2007), as well as historical rates of forest loss since 1990.
Table 1 shows the parameters used within OSIRIS for Brazil to illustrate the basic approach.
For two of the reference level approaches (national historical and cap and trade) default values in OSIRIS were used. For the other three, customised parameters were set as shown in Table 2 for each reference level approach.
Table 1. Data and data sources gathering within OSIRIS regarding Brazil
Note: data values from All Countries, High-deforested Countries, and Low-deforested Countries come from the sum and averages of related countries included (see OSIRIS for further explanation)
Data Value DataSource
Land area (thousands ha) 845,942 (FAO, 2005)
Forest area (thousands ha) 477,698 (FAO, 2005)
Original forested lands (%) 86.1 (Busch, et al., 2009b)
Annual forest cover change (2000-2005) (thousands ha) 3,103 (FAO, 2005)
Rate of forest cover loss (2000-2005) (%) 0.6 (FAO, 2005)
Fraction of tropical forest area at risk in a long run (%) 59 (Busch, et al., 2009b)
Forest carbon densities (tonnes C/ha) 178 (Ruesch & Gibbs, 2008)
Soil carbon (tonnes C/ha) 96.67 (Global Soil Data Task Group, 2000)
Average timber rent (2004, USD) 261 (Sohngen & Tennity, 2004)
GDP (USD bln/year) 1,314.2 (World Bank, 2007)
�
REDD Working Papers
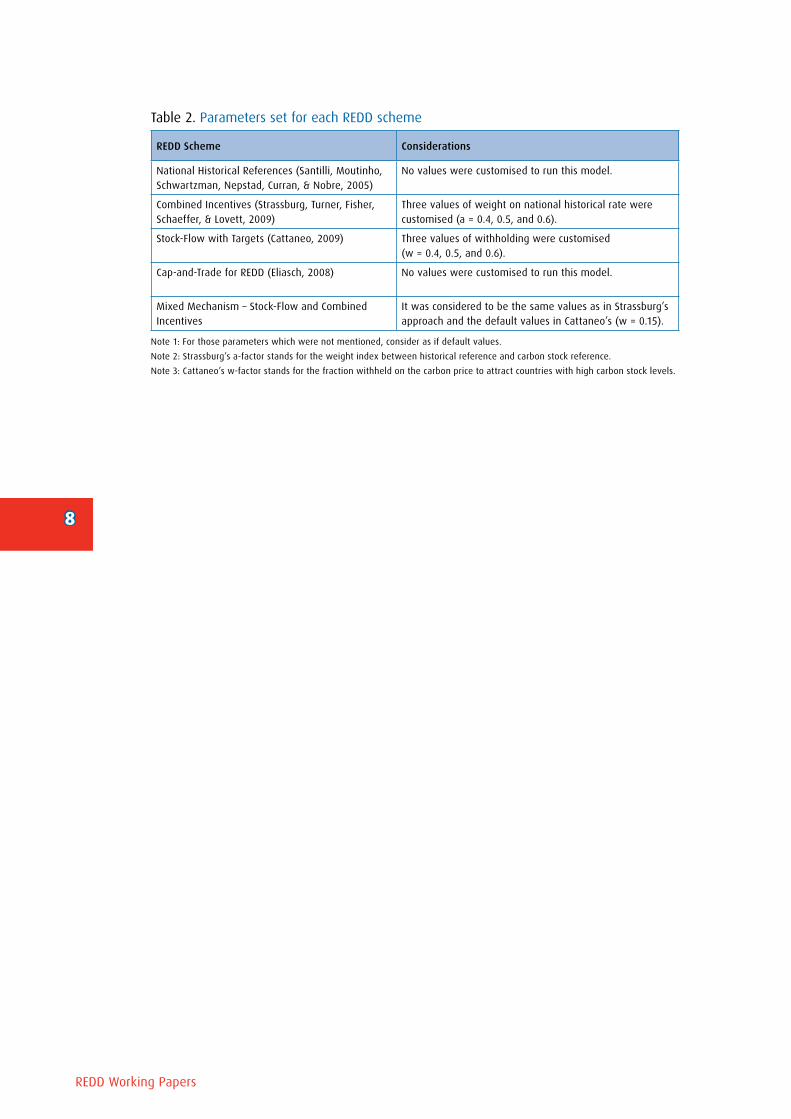
Table 2. Parameters set for each REDD scheme
Note 1: For those parameters which were not mentioned, consider as if default values.
Note 2: Strassburg’s a-factor stands for the weight index between historical reference and carbon stock reference.
Note 3: Cattaneo’s w-factor stands for the fraction withheld on the carbon price to attract countries with high carbon stock levels.
REDDScheme Considerations
National Historical References (Santilli, Moutinho, Schwartzman, Nepstad, Curran, & Nobre, 2005)
No values were customised to run this model.
Combined Incentives (Strassburg, Turner, Fisher, Schaeffer, & Lovett, 2009)
Three values of weight on national historical rate were customised (a = 0.4, 0.5, and 0.6).
Stock-Flow with Targets (Cattaneo, 2009) Three values of withholding were customised (w = 0.4, 0.5, and 0.6).
Cap-and-Trade for REDD (Eliasch, 2008) No values were customised to run this model.
Mixed Mechanism – Stock-Flow and Combined Incentives
It was considered to be the same values as in Strassburg’s approach and the default values in Cattaneo’s (w = 0.15).

�
REDD and Sustainable Development – Perspective from Brazil
Results
3.1 InternationalPresented here are the options for international REDD architecture to ensure equity and sustainable development benefits.
3.1.1 Modelling national historical references based on Santilli et al. (2005)Santilli et al.’s approach prioritises historical national emission reduction over existing carbon stock. As Chart 1 indicates, high-deforestation countries have strong advantages over low-deforestation countries regarding cost-efficiency.
3
Chart 1. Santilli’s model results regarding cost-efficiency
3.1.1.1 Overall results for the historical reference approach (Santilli)This preliminary analysis highlights the advantages of the national historical approach for high-deforestation countries (Table 3), mainly on cost efficiency grounds. The higher the historical deforestation rate, the more carbon credits the country can generate.
Santilli’sapproach Cost-efficiency($/tCO
2e)
Projecteffectiveness(CO
2price/Cost($/tCO
2e))
NPVofgrossREDDrevenue(2008USDmillion/yr)
USD 5
ALL COUNTRIES 6.09 0.821 23,132
High Forest/High Defor 4.49 1.113 10,830
High Forest/Low Defor 7.26 0.688 433.5
USD 10
ALL COUNTRIES 11.25 0.888 57,623
High Forest/High Defor 8.77 1.140 26,694
High Forest/Low Defor 69.56 0.143 1,066
USD 20
ALL COUNTRIES 19.81 1.001 123,213
High Forest/High Defor 17.14 1.166 55,554
High Forest/Low Defor N.A. N.A. 2,193
USD 30
ALL COUNTRIES 29.26 1.025 174,746
High Forest/High Defor 25.71 1.167 76,883
High Forest/Low Defor N.A. N.A. 3,038
Table 3. Main results for Santilli’s approach regarding financial issues for all analysed commitment periods
Note 1: N.A. not applicable because emission reductions for the group of countries taking account of leakage are negative, i.e. for the group of countries as a whole, emissions increase. Deriving an average cost of emission reduction figures is therefore not appropriate. Note 2: The All Countries values do not match the sum of High Forest/High Defor and High Forest/Low Defor categories. This is explained by other categories considered at OSIRIS analysis (e.g. Low Forest/High Defor and Low Forest/Low Defor).

�0
REDD Working Papers
3.1.2 Combined incentives: Strassburg et al. (2009)3.1.2.1 Modelling weighted average of global and national references considered a = 0.4l high-deforestation countries show high values for their change in deforestation rate (%) in
comparison with low deforestation countriesl high-deforestation countries show high scores on cost-efficiency (Chart 2) and NPV of gross
REDD revenue
Chart 2. Cost-efficiency considering all Strassburg’s factors and their carbon prices
Table 4. Main results for Strassburg’s approach (a = 0.4) regarding financial issues
Strassburg’sa=0.4 Cost-efficiency($/tCO
2e)
Projecteffectiveness(CO
2price/Cost($/tCO
2e))
NPVofgrossREDDrevenue(2008USDmillion/yr)
USD 5
All Countries 6.24 0.801 23,021
HighFor/HighDef 5.09 0.982 12,201
HighFor/LowDef 16.50 0.303 2,411
USD 10
All Countries 10.94 0.914 57,654
HighFor/HighDef 9.65 1.036 29,024
HighFor/LowDef 31.53 0.317 5,288
USD 20
All Countries 21.05 0.950 124,911
HighFor/HighDef 19.18 1.042 59,759
HighFor/LowDef 62.87 0.318 10,911
USD 30
All Countries 28.78 1.042 177,684
HighFor/HighDef 28.43 1.055 83,094
HighFor/LowDef 94.30 0.318 15,120
3.1.2.2 Modelling weighted average of global and national references considered a = 0.5l high-deforestation countries show similar results for change in deforestation rate (%) in
comparison with low-deforestation countriesl high-deforestation countries show relevant differences in relation to low-deforestation
countries on cost-efficiency; however, this difference seems less expressive than at Strassburg’s a = 0.4 (Chart 2)

��
REDD and Sustainable Development – Perspective from Brazil
3.1.2.3 Modelling weighted average of global and national references considered a = 0.6l high-deforestation countries show relevant differences in relation to low-deforestation
countries on cost-efficiency; however, this difference seems less marked than at Strassburg’s a = 0.5 (Chart 2)
Table 5. Main results for Strassburg’s approaches (a = 0.5) regarding financial issues
Strassburg’sa=0.5 Cost-efficiency($/tCO
2e)
Projecteffectiveness(CO
2price/Cost($/tCO
2e))
NPVofgrossREDDrevenue(2008USDmillion/yr)
USD 5
All Countries 6.00 0.833 22,872
HighFor/HighDef 5.05 0.990 12,036
HighFor/LowDef 14.24 0.351 2,079
USD 10
All Countries 10.80 0.926 57,865
HighFor/HighDef 9.52 1.050 28,611
HighFor/LowDef 27.32 0.366 4,582
USD 20
All Countries 20.87 0.958 124,496
HighFor/HighDef 18.82 1.063 59,083
HighFor/LowDef 54.49 0.367 9,458
USD 30
All Countries 28.44 1.054 173,733
HighFor/HighDef 28.05 1.070 81,962
HighFor/LowDef 81.74 0.367 13,106
Table 6. Main results for Strassburg’s approaches (a = 0.6) regarding financial issues
Strassburg’sa=0.6 Cost-efficiency($/tCO
2e)
Projecteffectiveness(CO
2price/Cost($/tCO
2e))
NPVofgrossREDDrevenue(2008USDmillion/yr)
USD 5
All Countries 5.87 0.852 23,583
HighFor/HighDef 4.97 1.001 11,808
HighFor/LowDef 11.98 0.417 1,748
USD 10
All Countries 10.76 0.929 57,618
HighFor/HighDef 9.38 1.066 28,198
HighFor/LowDef 23.11 0.433 3,877
USD 20
All Countries 20.67 0.968 123,944
HighFor/HighDef 18.39 1.088 58,437
HighFor/LowDef 46.12 0.434 8,005
USD 30
All Countries 27.91 1.075 171,647
HighFor/HighDef 27.19 1.103 88,807
HighFor/LowDef 69.18 0.434 11,092
3.1.2.4 Overall results for the combined incentives approach There are some advantages of Strassburg’s model regarding high-deforestation countries in relation to low-deforestation countries, especially regarding the NPV and project effectiveness, which are most advantageous to countries at the high deforestation rates. However, as the carbon price increases as well as the a-factors, these differences diminish – indicating a kind of equilibrium. This may be due to Strassburg’s approach on historical national reference weighted by the stock-flow prioritising countries with high-forested areas and high deforestation rate. Considering cost-efficiency and the overall averages of each scenario, it may be said that the best equilibrium is set at US$20 (a = 0.6). However, such values have increased in relation to the carbon price as well as the commitment period (Chart 3).

��
REDD Working Papers
Chart 3. The average cost-efficiency of each of Strassburg’s models (left axis, bars) and the average cost-efficiency for the Brazilian scenarios within Strassburg’s models (right axis, dots)
3.1.3 Stock and flow: Cattaneo (2009)3.1.3.1 Modelling stock-flow with targets considered w = 0.4l the differences between high-deforestation and low-deforestation countries regarding project
effectiveness are significantl on cost-efficiency, high-deforestation countries show advantages in comparison with low-
deforestation ones
Table 7. Main results for Cattaneo’s approach (w = 0.4) regarding financial issues for all analysed commitment periods
Cattaneo’sw=0.4 Cost-efficiency($/tCO
2e)
Projecteffectiveness(CO
2price/Cost($/tCO
2e))
NPVofgrossREDDrevenue(2008USDmillion/yr)
USD 5
All Countries 5.55 0.901 25,260
HighFor/HighDef 4.73 1.057 11,850
HighFor/LowDef 8.54 0.585 1,781
USD 10
All Countries 10.11 0.989 75,965
HighFor/HighDef 8.84 1.131 37,670
HighFor/LowDef 21.17 0.472 5,719
USD 20
All Countries 19.00 1.053 169,120
HighFor/HighDef 17.91 1.117 81,938
HighFor/LowDef 43.71 0.468 12,510
USD 30
All Countries 26.63 1.127 232,673
HighFor/HighDef 26.73 1.122 113,346
HighFor/LowDef 65.48 0.458 17,248

��
REDD and Sustainable Development – Perspective from Brazil
3.1.3.2 Modelling stock-flow with targets considered w = 0.5 l the differences between high-deforestation and low-deforestation countries regarding project
effectiveness are still significantl on cost-efficiency, high-deforestation countries have big advantages in relation to low-
deforestation ones
Table 8. Main results for Cattaneo’s approaches (w = 0.5) regarding financial issues for all analysed commitment periods
Cattaneo’sw=0.5 Cost-efficiency($/tCO
2e)
Projecteffectiveness(CO
2price/Cost($/tCO
2e))
NPVofgrossREDDrevenue(2008USDmillion/yr)
USD 5
All Countries 6.48 0.772 27,398
HighFor/HighDef 5.91 0.846 13,194
HighFor/LowDef 10.06 0.497 2,257
USD 10
All Countries 10.13 0.987 85,613
HighFor/HighDef 8.83 1.135 42,994
HighFor/LowDef 24.57 0.407 7,312
USD 20
All Countries 18.44 1.085 189,907
HighFor/HighDef 17.96 1.114 94,000
HighFor/LowDef 51.22 0.390 16,060
USD 30
All Countries 26.22 1.144 261,963
HighFor/HighDef 27.13 1.106 130,368
HighFor/LowDef 76.52 0.392 22,271
3.1.3.3 Modelling stock-flow with targets considered w = 0.6 l high-deforestation countries show the lowest cost-efficiency in comparison with low-
deforestation countriesl regarding the project effectiveness criterion, high-deforestation countries have big advantages
compared to low-deforestation countries
Table 9. Main results for Cattaneo’s approaches (w = 0.6) regarding financial issues
Cattaneo’sw=0.6 Cost-efficiency($/tCO
2e)
Projecteffectiveness(CO
2price/Cost($/tCO
2e))
NPVofgrossREDDrevenue(2008USDmillion/yr)
USD 5
All Countries 6.88 0.728 116,439
HighFor/HighDef 6.38 0.784 55,124
HighFor/LowDef 12.29 0.407 2,602
USD 10
All Countries 9.94 1.001 89,381
HighFor/HighDef 9.08 1.101 44,910
HighFor/LowDef 26.44 0.378 7,995
USD 20
All Countries 17.37 1.151 213,315
HighFor/HighDef 17.74 1.127 108,233
HighFor/LowDef 58.58 0.341 19,646
USD 30
All Countries 26.02 1.153 303,935
HighFor/HighDef 27.10 1.107 154,234
HighFor/LowDef 88.13 0.340 28,176

��
REDD Working Papers
3.1.3.4 Overall conclusions for stock and flow (Cattaneo) approach These analyses have shown the advantages of this approach in terms of project effectiveness, which, averaged across all the four carbon prices considered, is higher than one for all three withholding factors. High-deforestation countries have compared to low-deforestation countries considering, for instance, project effectiveness (Chart 4). This is due to Cattaneo’s approach on stock-flow prioritising countries with high carbon stock.
Chart 4. Comparing Cattaneo’s models regarding average project effectiveness (average for all four carbon prices)
In line with this, the cost-efficiency has decreased as the withholding grows in all the commitment periods (Chart 5). Thus, it is possible to conclude that Cattaneo’s 0.4 scenario is preferable for cost efficiency and project effectiveness. Nevertheless, regarding NPV of gross REDD revenue there is a significant increase at both global level and national level in Brazil.
Chart 5. The average cost-efficiency of each Cattaneo model (left axis, bars) and the average cost-efficiency for these when applied to Brazil (right axis, dots)

��
REDD and Sustainable Development – Perspective from Brazil
3.1.4 Cap and trade based on Eliasch (2008)l considering project effectiveness, it is higher for low deforestation countries, but as
the carbon price rises, the differences between high-deforestation countries and low-deforestation countries are reduced
l considering the NPV of gross REDD revenues, high-deforestation countries have advantages in relation to low-deforestation countries
CapandTrade Cost-efficiency($/tCO
2e)
Projecteffectiveness(CO
2price/Cost($/tCO
2e))
NPVofgrossREDDrevenue(2008USDmillion/yr)
USD 5
ALL COUNTRIES 4.16 1.202 5,029,294
High Forest/High Defor 4.11 1.217 2,511,006
High Forest/Low Defor 2.79 1.792 657,666
USD 10
ALL COUNTRIES 8.54 1.171 10,908,906
High Forest/High Defor 8.55 1.170 5,336,371
High Forest/Low Defor 6.10 1.639 1,399,524
USD 20
ALL COUNTRIES 17.18 1.164 22,546,321
High Forest/High Defor 17.14 1.167 10,948,954
High Forest/Low Defor 12.61 1.586 2,883,204,
USD 30
ALL COUNTRIES 25.81 1.162 31,288,980
High Forest/High Defor 25.71 1.167 15,154,763
High Forest/Low Defor 18.93 1.585 3,995,592
Table 10. Main results for cap-and-trade approaches regarding financial issues
3.1.4.1 Overall conclusion for the cap-and-trade analysisThe cap-and-trade system shows advantages to high-deforestation countries over low-deforestation countries regarding NPV of gross REDD revenues but not for cost-efficiency and project effectiveness (Chart 6).
Chart 6. Cap-and-trade results regarding cost-efficiency (US$/t CO2e)
3.1.5 Mixed mechanism (attributed to Busch, personal communication, 2009) (see 2.1.2.5)l mixed mechanism can be defined as an intermediary point between Strassburg’s and
Cattaneo’s approachesl regarding cost-efficiency, the lower the a-factor the better the results are (Chart 7)

��
REDD Working Papers
Chart 7. The average cost-efficiency of each mixed model (left axis, bars) and the average cost-efficiency of these when applied to Brazil (right axis, dots)
Table 11. Main results for mixed approaches (a = 0.4) regarding financial issues
Mixeda=0.4 Cost-efficiency($/tCO
2e)
Projecteffectiveness(CO
2price/Cost($/tCO
2e))
NPVofgrossREDDrevenue(2008USDmillion/yr)
USD 5
All Countries 6.22 0.804 23,456
HighFor/HighDef 5.05 0.990 12,128
HighFor/LowDef 17.87 0.280 2,655
USD 10
All Countries 10.88 0.919 61,868
HighFor/HighDef 9.66 1.035 31,605
HighFor/LowDef 34.29 0.292 6,114
USD 20
All Countries 20.95 0.956 134,881
HighFor/HighDef 19.26 1.038 65,908
HighFor/LowDef 67.52 0.296 12,815
USD 30
All Countries 28.86 1.040 186,579
HighFor/HighDef 28.89 1.038 91,145
HighFor/LowDef 101.36 0.296 17,714
��
REDD and Sustainable Development – Perspective from Brazil
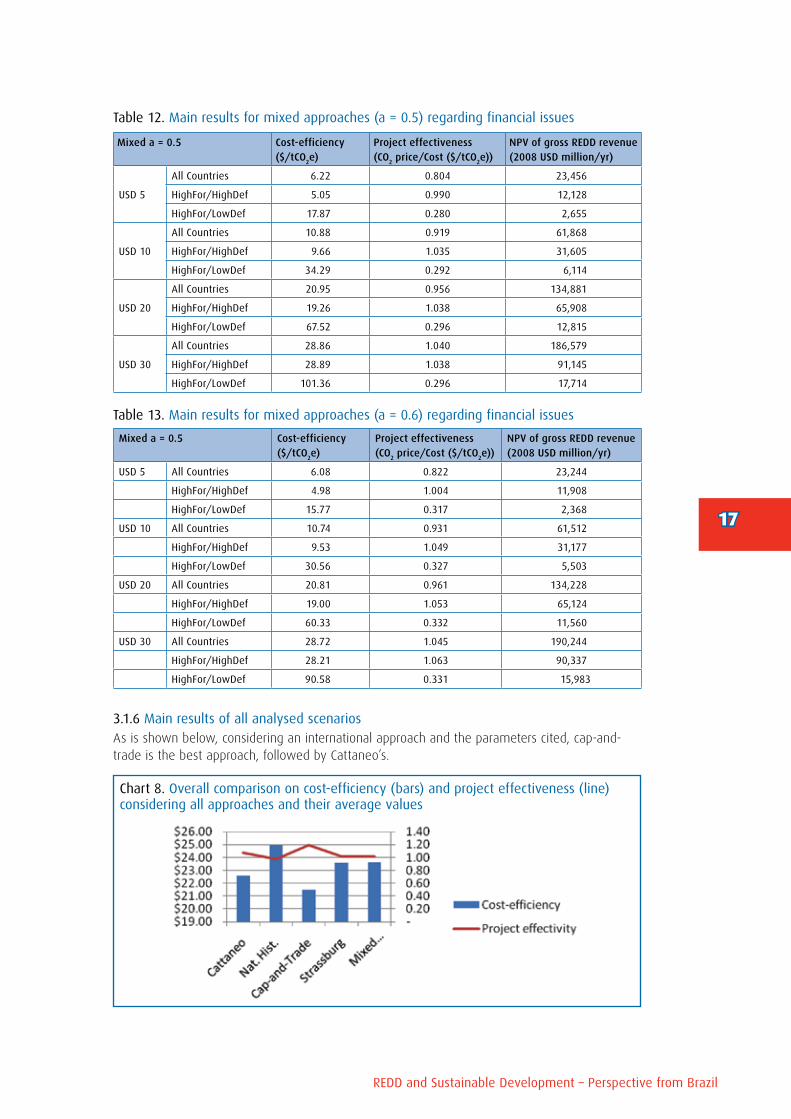
Table 12. Main results for mixed approaches (a = 0.5) regarding financial issues
Mixeda=0.5 Cost-efficiency($/tCO
2e)
Projecteffectiveness(CO
2price/Cost($/tCO
2e))
NPVofgrossREDDrevenue(2008USDmillion/yr)
USD 5
All Countries 6.22 0.804 23,456
HighFor/HighDef 5.05 0.990 12,128
HighFor/LowDef 17.87 0.280 2,655
USD 10
All Countries 10.88 0.919 61,868
HighFor/HighDef 9.66 1.035 31,605
HighFor/LowDef 34.29 0.292 6,114
USD 20
All Countries 20.95 0.956 134,881
HighFor/HighDef 19.26 1.038 65,908
HighFor/LowDef 67.52 0.296 12,815
USD 30
All Countries 28.86 1.040 186,579
HighFor/HighDef 28.89 1.038 91,145
HighFor/LowDef 101.36 0.296 17,714
Mixeda=0.5 Cost-efficiency($/tCO
2e)
Projecteffectiveness(CO
2price/Cost($/tCO
2e))
NPVofgrossREDDrevenue(2008USDmillion/yr)
USD 5 All Countries 6.08 0.822 23,244
HighFor/HighDef 4.98 1.004 11,908
HighFor/LowDef 15.77 0.317 2,368
USD 10 All Countries 10.74 0.931 61,512
HighFor/HighDef 9.53 1.049 31,177
HighFor/LowDef 30.56 0.327 5,503
USD 20 All Countries 20.81 0.961 134,228
HighFor/HighDef 19.00 1.053 65,124
HighFor/LowDef 60.33 0.332 11,560
USD 30 All Countries 28.72 1.045 190,244
HighFor/HighDef 28.21 1.063 90,337
HighFor/LowDef 90.58 0.331 15,983
Table 13. Main results for mixed approaches (a = 0.6) regarding financial issues
3.1.6 Main results of all analysed scenariosAs is shown below, considering an international approach and the parameters cited, cap-and-trade is the best approach, followed by Cattaneo’s.
Chart 8. Overall comparison on cost-efficiency (bars) and project effectiveness (line) considering all approaches and their average values

��
REDD Working Papers
3.2 Results for BrazilThe different options for reference levels in REDD already analysed from an international perspective, are now applied specifically to Brazil.
3.2.1 National historical reference approach (Santilli)The majority of the data regarding Brazil seem to be close to those of the high-deforestation group of countries in Table 3. As carbon prices increase, project effectiveness barely changes, but cost-efficiency and NPV almost double their values (Table 14).
Brazil Cost-efficiency($/tCO
2e)
Projecteffectiveness(CO
2price/Cost($/tCO
2e))
NPVofgrossREDDrevenue(2008USDmillion/yr)
Santilli (USD 5) 4.35 (6.09) 1.157 (0.821) 6,805 (23,132)
Santilli (USD 10) 8.11 (11.25) 1.245 (0.888) 15,607 (57,623)
Santilli (USD 20) 16.22 (19.81) 1.245 (1.001) 32,013 (123,213)
Santilli (USD 30) 24.32 (29.26) 1.245 (1.025) 44,318 (174,746)
Table 14. Data from the Brazilian scenario regarding Santilli’s model in comparison with All Countries (in brackets) for all analysed commitment periods
3.2.2 Combined incentives approach (Strassburg)The three adjustment factor scenarios analysed are very similar when applied to Brazil.As the adjustment factor increases, cost-efficiency and project effectiveness improve slightly but the NPV of gross REDD revenue is reduced by a small amount. As the carbon price increases, project effectiveness is reduced slightly (Table 15).
Strassburg’s approach achieved an average of 1.16 regarding project effectiveness – a = 0.4 (1.14), a = 0.5 (1.15), and a = 0.6 (1.17). Thus, a = 0.6-scheme appears most suitable to Brazilian reality (Chart 9).
Chart 9. Carbon-efficiency (left axis, bars) versus project effectiveness (right axis, lines) applying Strassburg to Brazil

��
REDD and Sustainable Development – Perspective from Brazil
Table 15. Data from the Brazilian scenario regarding Strassburg’s model for all analysed commitment periods
Brazil Cost-efficiency($/tCO
2e)
Projecteffectiveness(CO
2price/Cost($/tCO
2e))
NPVofgrossREDDrevenue(2008USDmillion/yr)
USD 5
a = 0.4 4.41 (6.24) 1.147 (0.801) 7,562 (23,021)
a = 0.5 4.34 (6.00) 1.165 (0.833) 7,442 (22,872)
a = 0.6 4.26 (5.87) 1.186 (0.852) 7,321 (25,583)
USD 10
a = 0.4 8.89 (10.94) 1.136 (0.914) 17,106 (57,654)
a = 0.5 8.76 (10.80) 1.153 (0.926) 16,856 (57,863)
a = 0.6 8.63 (10.76) 1.170 (0.929) 16,606 (57,616)
USD 20
a = 0.4 17.77 (21.05) 1.136 (0.950) 35,087 (124,911)
a = 0.5 17.51 (20.87) 1.153 (0.958) 34,574 (124,496)
a = 0.6 17.25 (20.67) 1.170 (0.986) 34,062 (123.944)
USD 30
a = 0.4 26.66 (28.78) 1.136 (1.042) 48,572 (177,684)
a = 0.5 26.27 (28.44) 1.153 (1.054) 47,863 (173,733)
a = 0.6 25.88 (27.91) 1.170 (1.075) 47,154 (171,647)
3.2.3 Stock and flow (Cattaneo)The three Cattaneo scenarios are also similar regarding Brazil (Table 16). With the 0.6-scenario there is an emission rate of about 1.6 billion tCO2e/year; the 0.5-scenario is at 1.5 billion; and the 0.4-scenario at 1.2 billion.
As to project effectiveness, Cattaneo’s approach achieved an average of 1.11 over all the withholding factors and carbon prices considered. Comparing withholding factors, the highest average score across the four carbon prices was for w = 0.4 (1.21), followed by w = 0.5 (1.08), and w = 0.6 (1.04).
Thus, Cattaneo’s 0.4-scenario appears the most suitable to Brazilian reality.
Table 16. Data from the Brazilian scenario regarding Cattaneo’s model
Brazil Cost-efficiency($/tCO
2e)
Projecteffectiveness(CO
2price/Cost($/tCO
2e))
NPVofgrossREDDrevenue(2008USDmillion/yr)
USD 5
a = 0.4 4.66 (5.55) 1.192 (0.901) 6,930 (25,260)
a = 0.5 15.31 (6,48) 0.534 (0.772) 7,852 (27,398)
a = 0.6 26.39 (6.88) 0.429 (0.728) 8,377 (116,439)
USD 10
a = 0.4 8.14 (10.11) 1.241 (0.989) 23,448 (75,965)
a = 0.5 6.69 (10.13) 1.246 (0.987) 27,173 (85,613)
a = 0.6 8.76 (9.94) 1.171 (1.001) 28,908 (89,381)
USD 20
a = 0.4 16.76 (19.00) 1.204 (1.053) 50,373 (169,120)
a = 0.5 16.79 (18.44) 1.202 (1.085) 58,975 (189,907)
a = 0.6 16.50 (17.31) 1.225 (1.151) 69,347 (213,315)
USD 30
a = 0.4 25.12 (26.22) 1.206 (1.114) 69,591 (261,963)
a = 0.5 25.17 (26.22) 1.203 (1.140) 81,752 (261,963)
a = 0.6 25.39 (26.02) 1.208 (1.153) 98,590 (303,935)

�0
REDD Working Papers
Table 17. Data from the Brazilian scenario regarding Cap-and-Trade’s model for all analysed commitment periods
Brazil $perreducedCO2
emission($/tonCO2e)
Projecteffectiveness(CO
2price/Cost($/tCO
2e))
NPVofgrossREDDrevenue(2008USDmillion/yr)
Cap&Trade (USD 5) 3.79 (4.16) 1.345 (1.202) 1,463,924 (5,029,294)
Cap&Trade (USD 10) 8.09 (8.54) 1.248 (1.171) 3,120,142 (10,908,906)
Cap&Trade (USD 20) 16.22 (17.18) 1.245 (1.164) 6,402,747 (22,546,321)
Cap&Trade (USD 30) 24.32 (25.81) 1.245 (1.162) 8,863,647 (31,288,980)
3.2.5 MixedThe mixed mechanism has similar scores for cost-efficiency to those of the combined incentive (Strassburg) approach. A slightly greater difference between this approach and the stock and flow (Cattaneo) approach can be observed, particularly at a US$5 carbon price (Table 18).
Across the commitment periods, an increase on the cost-efficiency scores is verifiable. However, the NPV of gross REDD revenue showed a slight decrease (around 0.10 per cent).
Considering the Brazilian deforestation profile, the mixed approach achieved good scores.
Table 18. Data from the Brazilian scenario regarding the mixed model for all analysed commitment periods
Brazil $perreducedCO2
emission($/tonCO2e)
Projecteffectiveness(CO
2price/Cost($/tCO
2e))
NPVofgrossREDDrevenue(2008USDmillion/yr)
USD 5
a = 0.4 4.38 (6.22) 1.161 (0.804) 7,247 (23,456)
a = 0.5 4.30 (6.08) 1.186 (0.822) 7,110 (23,244)
a = 0.6 4.21 (5.76) 1.212 (0.868) 6,958 (23,926)
USD 10
a = 0.4 8.88 (10.88) 1.136 (0.919) 19,019 (61,868)
a = 0.5 8.76 (10.74) 1.152 (0.931) 18,758 (61,512)
a = 0.6 8.64 (10.61) 1.168 (0.943) 18,521 (61,490)
USD 20
a = 0.4 17.85 (20.95) 1.131 (0.956) 39,376 (134,881)
a = 0.5 17.62 (20.81) 1.146 (0.961) 38,874 (134,228)
a = 0.6 17.38 (20.67) 1.161(0.968) 38,373 (133,640)
USD 30
a = 0.4 26.80 (28.86) 1.130 (1.040) 54,402 (186,579)
a = 0.5 26.45 (28.72) 1.145 (1.045) 53,730 (190,244)
a = 0.6 26.09 (28.36) 1.161 (1.058) 53,028 (186,359)
3.2.4 Cap-and-tradeWithin Brazil’s deforestation profile, cap-and-trade would generate significant emission reductions in a short timeframe.

��
REDD and Sustainable Development – Perspective from Brazil
Conclusions 4
This report is intended to increase understanding of the impact of different REDD design options for reference level setting, at international, national, and sub-national levels, and hence how these REDD schemes can help the global struggle against climate change – as well as fostering sustainable development for local people.
4.1 International level resultsThis report has analysed some financial aspects that may assist the choice of reference level approach. As already indicated, the cap-and-trade approach would be the most suitable international approach, followed by the stock and flow approach as set out by Cattaneo (Chart 5).
Comparing the best result for the national historical reference (Santilli) approach (all Countries at US$30) (Table 3) against that of the stock and flow (Cattaneo) approach (all Countries, at US$30, and w = 0.6) (Table 9), it is clear that the latter performs better on project effectiveness than the former (1.153 vs. 1.025, respectively). In line with this, considering the best result for project effectiveness (1.075) from the combined incentives (Strassburg) approach (a = 0.6 at US$30) (Table 6), the superiority of the stock and flow approach (1.153) regarding project effectiveness is clear.
However, the cap-and-trade has the highest scores for project effectiveness at all carbon prices considered here (Table 10).
Finally, the mixed model’s best result (a = 0.6 at USD 30) is similar to Strassburg’s (1.058 vs. 1.075, respectively).
Thus, globally speaking, the most cost-effective REDD reference level approach can be cap-and-trade, followed by the stock and flow (Cattaneo) approach with a withholding factor of 0.6.
4.2 Results for Brazil and their implications Prioritising project effectiveness, the best reference level approach for Brazil with its high-forest cover and high deforestation rate, is cap-and-trade (US$5); followed by stock and flow (Cattaneo) approach with w = 0.5 at US$10; national historical reference Santilli’s (US$30); mixed mechanism approach (a = 0.6 at US$5); and then combined incentives (Strassburg) approach (a = 0.6 at US$5).
The negotiations on REDD schemes in the post-2012 climate regime will be crucial in curbing GHG emissions globally (Eliasch, 2008).
In line with this, in Copenhagen last December, REDD was one of the most discussed issues, with some important REDD funds presented (such as US$3.5 billion by Australia, France, Japan, Norway, the UK and the US). It was clear that:
l several countries have endorsed the importance of REDD in helping to slow climate change;l several countries have accepted the importance of REDD in curbing GHG emissions as well as
in improving biodiversity status.

��
REDD Working Papers
The final assumptions on REDD during COP-15 were positive and innovative, especially concerning forest conservation within the Climate Convention, however, it is important to clarify that nothing was decided. At the national level, for Brazil, a three-phase approach (shown in figure 3) has been proposed in the report from the Brazilian Task Force on REDD and climate change: incentives to accommodate (i) the diverse capabilities and circumstances of REDD countries; (ii) an expanded scope of REDD to include conservation, sustainable management of forests, and enhancement of forest carbon stocks; and (iii) the near-term constraints of the current global financial crisis. It should be noted that this figure was approved for the Task Force by the Amazon governors. A summary of the Brazilian Task Force on REDD and Climate Change is available at the FAS website (http://www.fas-amazonas.org/pt/secao/publicacoes) and in Annex 1 of this document.
The importance of such decisions will rely on targeting several issues within REDD schemes; such as the types of forests that are eligible, how to involve local people, payment mechanisms, and additionality. This will depend on national contexts – internal policies, particular scenarios set, and so on – as well as international agreements on emission reduction trading and how to verify emission reductions.
All the reference level approaches considered have benefits for Brazil. Moreover, Brazil plays an important role from the global perspective, as indicated by its percentage of global NPV of REDD revenues, which is high for most of the approaches and scenarios considered (Table 19).
Table 19. Comparison over the REDD schemes and carbon price (USD) of the global NPV vs. Brazil NPV
REDDScheme USD5 USD10 USD20 USD30
Santilli’s 29% 27% 26% 25%
Strassburg’s 32% 29% 28% 27%
Cattaneo’s 14% 32% 31% 31%
Cap-and-Trade’s 29% 29% 28% 28%
Mixed’s 30% 30% 29% 29%
Figure 3. Recommendations for REDD funding – Task Force on REDD and Climate Change, 2009
Governments/Funds Non-Annex 1
Governmental funds (Annex 1)
Kyoto Carbon Market
National and subnational
governments
% PIB % AAUs
NAMAs
Non-REDD activities
REDD activities
Non-compensatory Mechanisms Compensatory Mechanisms
QU
OTA
(%
)REDD Carbon
Market
Registry and certification
Forest areas
REDD projects
Support
Fees

��
REDD and Sustainable Development – Perspective from Brazil
In this context it is worth mentioning the Juma Project. Established in 2008, and validated by the Climate, Community and Biodiversity Alliance, this project preserves around 330,000 hectares within the Juma Reserve (home to 370 families), generating over 3 million carbon credits to be issued until 2016 (Viana et al., 2009). After almost two years, the Juma Project has generated considerable data and conclusions on the costs of avoiding deforestation (as shown in table 20), which can be compared with other estimates. According to Economia do Clima (2009), opportunity costs in the Brazilian Amazon have been estimated at US$402 per hectare for cattle ranching and US$2,051 per hectare for soy beans. A carbon price of US$3 (about US$450 per hectare) would foster REDD actions, and would be competitive with cattle ranching initiatives. The data from Juma suggest, however, that developing a sub-national REDD scheme in the Brazilian Amazon is likely to cost more than the amounts indicated by the opportunity costs shown above, as substantial amounts are required for transactions costs.
Table 20. Total costs data from the Juma project (adapted from Viana et al., 2009)
Presentvaluefrom2005-2050(5%discountrate)(2009USD)
Presentvaluefrom2005-2050(2%discountrate)(2009USD)
Project preparation 306,449 293,190
Bolsa Floresta payments 7,110,769 12,500,817
Support programmes 6,362,066 11,142,729
Carbon monitoring (including the PDD)
2,262,189 3,568,819
Another issue is land tenure. The Brazilian Amazon has a significant area of unoccupied land, unofficial land occupation, and non-regular land tenure. According to Economia do Clima (2009), tenure in half of those lands could be formalised within 30 years. The remaining land would be part of the Brazilian federation and would still be eligible for REDD. This would promote an outstanding avoided deforestation initiative – curbing GHG emissions and fostering the livelihoods of local communities within a REDD payment scheme.
In addition to this, REDD could address both poverty alleviation and emissions reduction (Viana, 2009). In other words, smallholders could benefit from the schemes presented in this report. With higher NPV considering REDD revenues, there will be more money for distribution to local people; as already happens in the Bolsa Floresta Programme (Viana, 2009).
Summing up, all the REDD reference level approaches examined in this report have something to offer Brazil, taking into account both international and national approaches. What might be necessary to decide the best approach would be to run a consultation with national stakeholders, such as major national NGOs, local associations that are directly impacted, and local people – since considering such socio-political aspects will give clearer answers and perhaps raise other issues that need to be taken into consideration.
l Other than the cap-and-trade scheme, the most suitable REDD mechanism to be applied globally in regard to financial aspects (cost-efficiency, project effectiveness, and NPV) would be Cattaneo’s 0.6-approach.
l In the Brazilian context, the most suitable mechanism, using the same criteria, would be Cattaneo’s 0.5-approach.

��
REDD Working Papers
As already indicated, Brazil plays an important role within the international REDD mechanism – mainly due to its extensive forest cover and its high deforestation rate over the past 20 years.REDD not only can prevent GHG emissions from deforestation but also offer local people an alternative income. Instead of illegal logging and unsustainable agriculture, local communities can benefit from their help in conserving forest, fauna, water, and so on, as indicated by Viana (2009), Eliasch (2008) and others.

��
REDD and Sustainable Development – Perspective from Brazil
BibliographyAmazon Fund (2008) What is the Amazon Fund? Retrieved 7 January 2010 from http://www.
amazonfund.gov.br/Angelsen, A., Brown, S., Loisel, C., Peskett, L., Streck, C., and Zarin, D. (2009) Reducing
Emissions from Deforestation and Forest Degradation (REDD): An options assessment report. Government of Norway.
Angelsen, A., Brown, S., Loisel, C., Peskett, L., Streck, C., and Zarin, D. (2009) Reducing Emissions from Deforestation and Forest Degradation (REDD): An options assessment report. Retrieved 5 January 2010 from: http://www.redd-oar.org/IOA.html.
Armstrong, J. (2006) The value of formal planning for strategic decisions: review of empirical research, Strategic Management Journal, pp 197–211.
Armstrong, M. (2006) A Handbook of Human Resource Management Practice. Kogan Page, London.
Busch, J., Strassburg, B., Cattaneo, A., Lubowski, R., Boltz, F., Ashton, R. et al. (2009a) Comparing climate and cost impacts of reference levels for reducing emissions from deforestation, Environmental Research Letters, pp 1–11.
Busch, J., Strassburg, B., Cattaneo, A., Lubowski, R., Boltz, F., Ashton, R. et al. (2009b) Open Source Impacts of REDD Incentives Spreadsheet – Collaborative Modelling Initiative on REDD. Conservation International.
Cattaneo, A. (2009) A ‘stock-flow-with targets’ mechanism for distributing incentive payments to reduce emissions from deforestation. The Woods Hole Research Center.
Cattaneo, A., Lubowski, R., Busch, J., Creed, A., Strassburg, B., Boltz, F. et al. (in press). On International Equity in Reducing Emissions from Deforestation.
Chan, M. (2009) Subprime carbon? Re-thinking the world’s largest new derivatives market. Friends of the Earth from http://www.foe.org/subprimecarbon Clémençon, R. (2008) The Bali Road Map: A first step on the difficult journey to a post-Kyoto protocol agreement, The Journal of Environmental Development, pp 70–94.
Economia do Clima (2009) Economia das Mudanças Climáticas. Retrieved 18 January 2010, from Documentos-Chave: http://economiadoclima.org.br/files/biblioteca/RESUMO_FINAL.pdf.
Eliasch, J. (2008) Climate Change: Financing global forests. Office of Climate Change, London.FAO (2005) Global Forest Resources Assessment 2005: Progress towards sustainable forest
management. FAO, Rome.FAO (2007) Obstacles and Opportunities for Afforestation and Reforestation Projects under the
Clean Development Mechanism of the Kyoto Protocol. FAO, Shanghai.Fonseca, G., Rodriguez, C., Midgley, G., Busch, J., Hannah, L., and Mittermeier, R. (2007) No
forest left behind, Public Library of Science Biology, p 216.Global Soil Data Task Group (2000) Global Gridded Surfaces of Selected Soil Characteristics (IGBP-
DIS). Oak Ridge National Laboratory Distributed Active Archive Center, Oak Ridge.Griscom, B., Shoch, D., Stanley, B., Cortez, R., and Virgilio, N. (2009) Implications of REDD
Baseline Methods for Different Country Circumstances During an Initial Performance Period. The Nature Conservancy, Arlington.
IIASA (2008) Global Forest Biomass. Retrieved 13 December, 2009 from http://www.iiasa.ac.at/Research/FOR/biomass.html.
Intergovernmental Panel on Climate Change (IPCC) (2007) Forth Assessment Report. United Nations.
IPCC (2006) IPCC Guidelines for National Greenhouse Gas Inventories. Institute for Global Environmental Strategies, Hayama.
Keller, S. (2008) A systematic analysis of mechanisms for reducing emissions from deforestation and degration, Master Thesis in Environmental Science. Swiss Federal Institute of Technology, Zürich, October.

��
REDD Working Papers
Lima, A. S. (2009) Target, Stock and Deforestation Reduction: A system proposal for financial benefit sharing from REDD in the Brazilian Amazon. IPAM, Manaus.
Lohamann, L. (2009) Regulatory challenges for financial and carbon markets, The Carbon and Climate Law Review, pp 161–71.
MCT (2009) Desenvolvimento Sustentável: responsabilidade e compromisso de todos. Retrieved 18 January 2010, from Desenvolvimento Sustentável: responsabilidade e compromisso de todos: http://www.cop15brasil.gov.br/en-US/.
Moutinho, P., Schwartzman, S., and Santilli, S. (2005) Introduction in P. Moutinho and S. Schwartzman, Tropical Deforestation and Climate Change (pp 7–13). Instituto de Pesquisas Ambiental da Amazônia, Pará.
Murray, B. (2008) Leakage from an Avoided Deforestation Compensation Policy: Concepts, empirical evidences and corrective policy options. Nicholas Institute for Environmental Policy Solutions, Durham.
Ruesch, A. and Gibbs, H. (2008) New IPCC Tier-1 Global Biomass Carbon Map for the Year 2000. Carbon Dioxide Information Analysis Center, Oak Ridge.
Santilli, M., Moutinho, P., Schwartzman, S., Nepstad, D., Curran, L. and Nobre, C. (2005) Tropical deforestation and the Kyoto Protocol, Climate Change, pp 267–76.
Sarkar, A. and Manoharan, T. (2009) Benefits of carbon markets to small and medium enterprises (SMEs) in haversted wood products: A case study from Saharanpur, Uttra Pradesh, India, African Journal of Environmental Science and Technology, pp 219–28.
Schlamadinger, B., Bird, N., Johns, T., Brown, S., Canadell, J., Ciccarese, L. et al. (2007) A synopsis of land use, land-use change and forestry (LULUCF) under the Kyoto Protocol and Marrakech Accords, Environmental Sciences and Policy, pp 271–82.
Soares-Filho, B., Nepstad, D., Curran, L., Voll, E., Cerqueira, G., Garcia, R. et al. (2006) Modelling conservation in the Amazon basin, Nature, pp 520–23.
Sohngen, B. and Tennity, C. (2004) Country Specific Global Forest Data Set Volume.1. Department of Agriculture, Environment, and Development Economics of Ohio State University, Columbus.
Stern, N. (2007) Stern Review on the Economics of Climate Change. H.M. Treasury, London.Stott, P. (2003. Attribution of regional-scale temperature changes to anthropogenic and natural
causes, Geophysical Research Letters.Strassburg, B., Turner, R., Fisher, B., Schaeffer, R. and Lovett, A. (2009) Reducing emissions
from deforestation – The ‘combined incentives’ mechanism and empirical simulations, Global Environmental Changes, pp 265–78.
United Nations Framework Convention on Climate Change (UNFCCC) (2010) Report of the Conference of the Parties on its fifteenth session, held in Copenhagen from 7 to 19 December 2009. Retrieved 30 July 2010 from http://unfccc.int/resource/docs/2009/cop15/eng/11a01.pdf.
UNFCCC (2009) CDM Stats. Retrieved 12 December 2009 from http://cdm.unfccc.int/Statistics/Registration/RegisteredProjByScopePieChart.html.
UNFCCC (2008) Report of the Conference of the Parties on its Thirteenth Session, held in Bali 3–15 December 2007. Retrieved 7 January 2010 from http://unfccc.int/resource/docs/2007/cop13/eng/06a01.pdf.
UNFCCC. (2006) UNFCCC. Retrieved 12 December 2009 from UNFCCC Documents: http://unfccc.int/resource/docs/2005/cmp1/eng/08a03.pdf.
Viana, V. (2009) Financing REDD: Meshing markets with government funds. IIED, London.Viana, V. (2009) Seeing REDD in the Amazon: A win for people, trees, and climate. IIED, London.Viana, V., Grieg-Gran, M., Mea, R. and Ribenboim, G. (2009) The Costs of REDD: Lessons from
Amazonas. IIED, London.World Bank (2007) Quick Reference Tables. Retrieved from Data and Statistics: http://web.
worldbank.org/WBSITE/EXTERNAL/DATASTATISTICS,,contentMDK:20399244~menuPK:1504474~pagePK:64133150~piPK:64133175~theSitePK:239419,00.html.
World Resources Initiative (2007) Climate Analysis Indicators Tool. Retrieved 12 December 2009 from Climate Analysis Indicators Tool: http://cait.wri.org/.
World Resources Institute (2000) Climate Analysis Indicators Tool (CAIT). Retrieved 12 December 2009 from World GHG Emissions Flowchart: http://cait.wri.org/figures.php?page=/World-FlowChart.

��
REDD and Sustainable Development – Perspective from Brazil
Annex: Executive summary of the Brazilian Task Force on REDD and Climate Change
A. General considerations1. This is the final version of the report on REDD2 and Climate Change by the Task Force established with the support of the Office of the President of the Republic and proposed by the Forum of Amazonian Governors. This version includes contributions from the Brazilian Forum on Climate Change (Workshop 14/10/2009) and was adopted at the IV Amazon States Governors’ Forum, in Macapá, Amapá, Brazil (16/10/2009).
2. It is considered to be in the national interest to explore an range of options for expanding financing opportunities for REDD in order to improve the standard of living of the inhabitants of the Amazon, maintain standing forests, reduce emissions from deforestation and forest degradation, and widen REDD financing opportunities by exploring and balancing options.
3. It is recommended in the UNFCCC negotiation processes that the Brazilian Government should support: (i) governmental financing mechanisms, (ii) non–compensatory market mechanisms, and (iii) compensatory market mechanisms for the emissions of Annex I countries.
4. The proposition of market compensating mechanisms for REDD would be an innovation to the Brazilian position in the UNFCCC negotiations.
B. Compensatory market mechanisms for REDD5. It is recommended that REDD be included in the growing carbon market as a way to make forest worth more standing, in the form of additional commitments for Annex I countries. This could be done by means of an additional quota to be exclusively fulfilled by REDD.
6. These mechanisms can be used to compensate part of the mandatory emissions reduction of the Annex I countries within defined quantitative limits.
7. The possible inclusion of REDD as a compensatory market mechanism should occur outside the scope of the Kyoto Protocol, without fungibility with other carbon credits, and by means of a specific instrument that has yet to be defined.
8. These mechanisms cannot be used to lessen the domestic efforts of Annex I countries to reduce emissions.
C. Governmental funding mechanisms9. The public financing generated by Annex I countries to support NAMAs (Nationally Appropriate Mitigation Actions) of the non-Annex I countries could support federal, state, and municipal government programmes for the prevention and control of deforestation and the promotion of sustainable development and scientific and technology investment. These resources could also be used to support the work of universities, NGOs, private sector initiatives and other institutions.
��
REDD Working Papers
10. The position of G-77, which is supported by the Brazilian Government, is a positive one in that it defends the allocation of 0.5 to a 1.0% of GNP of Annex I countries to finance these programs and public polices of non-Annex I countries. This allocation should result in a significant sums and predictable and measurable, reportable, verifiable flows of resources.
D. Non-compensatory Market Mechanisms for REDD11. These mechanisms cannot be used to compensate or diminish domestic emissions reduction efforts by Annex I countries.
12. The position of the Brazilian Government is a positive one in that it defends the use of an auction of AAUs (permitted emissions) and other instruments to allocate the funds collected from the Annex I countries for REDD. This allocation should result in significant sums and predictable flows of resources by designating a specific percentage for REDD activities.
E. Recommendations of the Brazilian Government in the International Negotiations13. Lead the efforts to include REDD, and the use of all the possible financing mechanisms that have been discussed, at the UNFCCC negotiations, including the creation of a new compensatory market mechanism for REDD, taking into account the guiding principles presented in this Report.
14. Take advantage of, as appropriate, all opportunities for cooperation between the Amazonian State Governments and State Governments of other countries.
15. To take advantage, as appropriate, of opportunities for bilateral cooperation between countries interested in REDD.
16. Participation of the President in the COP-15, leading the mission of the Amazonian Governors, with the proper international articulation, setting a position on the forests and climate issue.
F. Positive Perspectives for Financing Mechanism for REDD17. Increase of funding for the reduction of emissions from deforestation and forest degradation, eradication of poverty, and promotion of sustainable development and the improvement of the standard of living of the inhabitants of the Amazon.
18. Financial support for the consolidation of a sustainable model for the Amazon, which allows Brazil to achieve the internal goals it has set for reducing deforestation.
19. Incentive for the Annex I countries to set targets for, and make the additional financial commitments to, the goal of reducing emissions by at least 40% by 2020 compared to 1990.
20. Consolidation of Brazil as a global environmental leader, especially joint with the group of tropical forested countries, developing nations and with its continental Amazonian South American neighbours.
21. Intensification of efforts with the environmental sector, social movements, universities and Brazilian companies committed to climate change mitigation.

��
REDD and Sustainable Development – Perspective from Brazil
G. Precautions in international negotiation for REDD financial mechanism22. The efforts of the negotiations for a compensatory mechanism for REDD should not interfere with the negotiations for non-compensatory market mechanisms and for governmental financing of nationally appropriate mitigation activities (NAMAs).
23. The creation of legal instruments for REDD within the scope of the UNFFCC should ensure the maintenance of the environmental integrity of global mitigation efforts and guarantee the rigour of the appropriate methodology, and therefore should not decrease the domestic emission reduction efforts of developed nations.
24. The approach to REDD should include simple and agile mechanisms and processes, avoiding the complexity and the costs observed in projects within the scope of the Kyoto Protocol. Additionally, it should: (i) maintain the environmental integrity established by the UNFCCC, and (ii) provide effectiveness with sufficient and predictable financing.
25. The approach to REDD should guarantee the improvement of the standard of living of forest peoples, and the transparency and the equitable distribution and use of funds generated.
26. As a condition for including REDD as a compensatory mechanism, the Annex I countries should: (i) assume compulsory commitments to support the emissions mitigation actions of non-Annex I countries, and (ii) take charge of compulsory nature in the form of minimum national domestic emission targets, respecting the differences among Annex I countries.
H. Other recommendations and final considerations27. In the Amazon, REDD programmes and projects could coincide with forest restoration activities in degraded areas. Temporary credits in the reforestation activities need to be evaluated.
The content of this document does not necessarily reflect the official positions of the Brazilian Government and the institutions involved.