Embed Size (px)
Citation preview
Red Grouper (Epinephelus morio) age - length structure and description of growth
from the eastern Gulf of Mexico: 1992-2001
Lombardi-Carlson, L. A., Fitzhugh, G. R., and Mikulas, J. J.
National Marine Fisheries Service Southeastern Fisheries Science Center
3500 Delwood Beach Road Panama City, FL 32408
Panama City Laboratory
Contribution Series 2002 - 06

Abstract
Red grouper (Epinephelus morio) are classified as a shallow water grouper, distributed
throughout the Gulf of Mexico but primarily harvest occurs along the West Florida Shelf. Red
grouper were fully recruited to the fishery by age 5-7 and became rare by age 12. Three
dominant year classes were identified (1989, 1990, and 1996), each of these year classes
represented over 30% of the age structure for at least one year and was the most abundant age
class for at least two years within the 10 year period: 1992-2001. Dominant year classes were
apparent across the 10-year span due to good aging precision; overall APE was 3.4%, reflecting
relatively low reader error. Commercial hand-line and long-line samples were harvested from
similar depth distributions, however, a slight difference in growth rate was detected based on
samples specific to these gears. The von Bertalanffy growth model was fitted to biological ages
and lengths at capture and similar asymptotic lengths (L∞ = 923 mm TL), but lower k (0.11), and
lower to values (-3.21) compared to past studies in the eastern Gulf of Mexico and southeastern
Atlantic. Because of problems with the distributions of data, an ad hoc fit was calculated for the
von Bertalanffy function (L∞= 920mm TL, k = 0.16, and to = zero) that may be useful as a simple
representation of average growth.
1
Introduction
Red Grouper (Epinephelus morio) are widely distributed throughout the Gulf of Mexico,
Caribbean, and U.S. South Atlantic. Adults are fished from North Carolina to Brazil (Moe 1969,
Stiles and Burton 1994) and in U.S. Gulf waters, red grouper are classified as the major
component (about 69%) of the shallow water grouper complex (Schirripa and Legault 1997,
Schirripa et al. 1999). Although primarily fished along the inner to mid- continental shelf, the
species ranges in depth from 2 to over 120 m (65 fathoms), mainly inhabiting reefs and hard
bottom areas (Moe 1969). Recognized as one the most valuable fishes from the Gulf of Mexico,
red grouper are a highly sought target species and during the last stock assessment were
classified as overfished and undergoing overfishing (Schirripa et al. 1999).
Because age and growth information is critical to stock assessment, our goal is to
characterize age structure over time, by gear type and by depth/location based on a continuous
decade of otolith samples from 1992-2001. This includes newer un-analyzed samples from
1997-2001 and re-aged samples from earlier collections archived at this laboratory (1992-1996;
Johnson and Collins 1994, Johnson et al. 1997). We provide age-length keys, meristic
conversion equations, updated growth curves, a comparison of the old and updated age estimates
and compare results with previous studies.
Methods
Collection of Samples
Port agents from numerous federal and state funded sources (Trip Interview Program –
TIP, Beaufort Head Boat Survey – HB, Marine Recreational Fishery Statistical Survey- MRFSS,
scientific sampling surveys – SS) collected red grouper otoliths from the eastern Gulf of Mexico
2
from 1992 to 2001. Measurements of fish lengths (total and/or fork), weights (whole or gutted),
and removal of otoliths were completed in the field, and corresponding otolith weights were
recorded per sample at the NMFS/SEFSC in Panama City, Florida. Information describing catch
location (latitude, longitude, depth, or statistical reporting grid) was often reported with the
samples. Trip Interview Program, Beaufort Head Boat Survey, and Marine Recreational
Fisheries Statistical Survey port agents randomly collected red grouper from the landings of both
recreational and commercial fisheries, reflecting all gear types (e.g. hand-line, bandit, power-
lines, long-lines, trap).
Otolith preparation, sectioning, and aging technique
As described in Moe (1969), the sagittal otolith was used as the ageing structure. Red
grouper ages were successfully read from both whole and sectioned otoliths (Johnson and
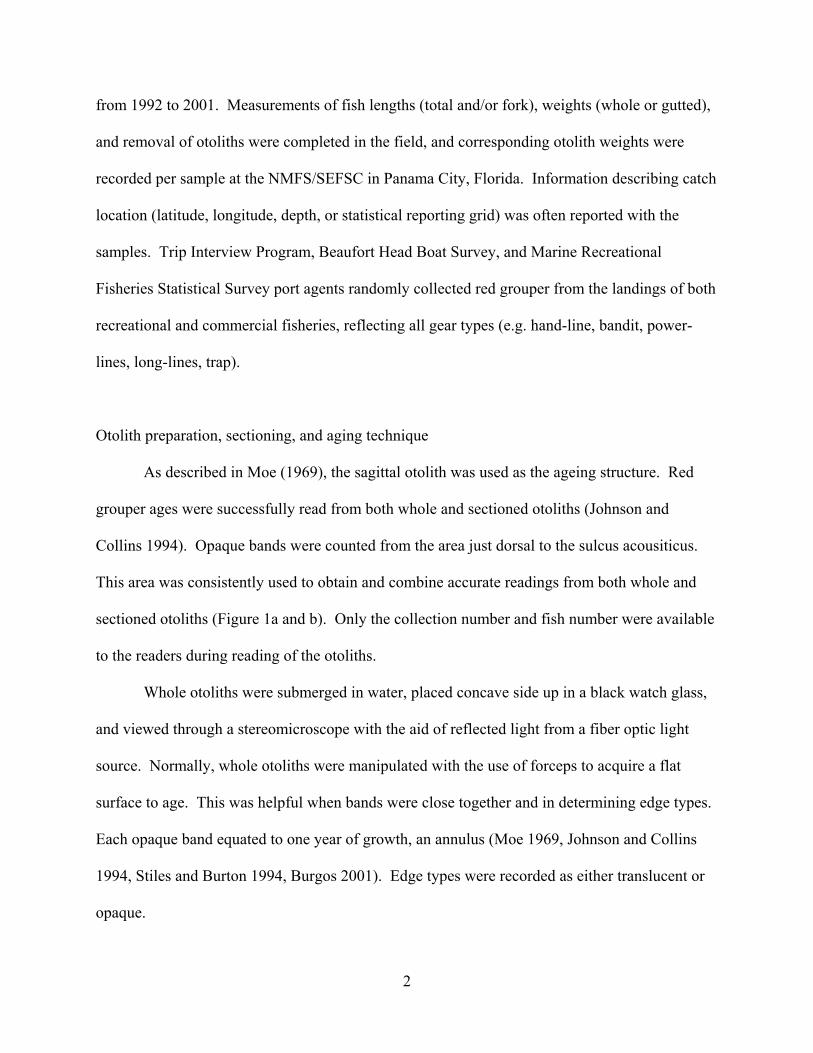
Collins 1994). Opaque bands were counted from the area just dorsal to the sulcus acousiticus.
This area was consistently used to obtain and combine accurate readings from both whole and
sectioned otoliths (Figure 1a and b). Only the collection number and fish number were available
to the readers during reading of the otoliths.
Whole otoliths were submerged in water, placed concave side up in a black watch glass,
and viewed through a stereomicroscope with the aid of reflected light from a fiber optic light
source. Normally, whole otoliths were manipulated with the use of forceps to acquire a flat
surface to age. This was helpful when bands were close together and in determining edge types.
Each opaque band equated to one year of growth, an annulus (Moe 1969, Johnson and Collins
1994, Stiles and Burton 1994, Burgos 2001). Edge types were recorded as either translucent or
opaque.
3
Otoliths that were difficult to interpret either due to otolith thickness or opaqueness were
sectioned using a Hillquist diamond-cutting saw (Cowan et al. 1995). Otolith sections were 0.7
mm in width. The sections were polished, sanded, and mounted on a slide. As otoliths were read
the number of opaque bands plus the edge type was recorded. The decision to section was based
on the primary readers judgment. By aging a considerable number of otoliths whole, processing
time and costs were reduced.
Age and Growth Analysis
The band count, edge type and capture date were used to calculate the annual age of a
fish based on a calendar year (Jearld 1983). Otoliths were advanced a year in age between the
period of January 1st to June 30th if their edge-type was translucent. Typically, marine fish in the
southeastern U.S. complete annulus formation (opaque zone formation) by late-spring to early
summer. Therefore an otolith with two completed annuli and a large translucent zone would be
classified as age 3 if the fish was caught during spring in expectation that a 3rd (opaque) annulus
would have soon formed. Any fish caught before June 30th with an opaque edge type, the
calculated annual age was equal to the band count. After June 30, when opaque zone formation
is underway or complete for red grouper in the Gulf of Mexico (Moe 1969, Johnson et al. 1993),
all fish were assigned an age equal to the band count by convention. There were a few
instances when an opaque edge was detected from fish caught late in the year (November and
December). We assumed these fish were depositing the next year’s band early and one year was
subtracted from their band count to calculate an annual age.
In addition to annual or cohort age, biological age was determined for use in growth
curves. A fractional period of a year was determined as the difference from peak spawning and

4
capture date (red grouper peak spawning = May 15th; Moe 1969, Collins et al. 2002). If capture
date was later in the year than the peak spawning date, the fractional period was added to annual
age. If capture date was before the peak spawning date, the fractional period was subtracted
from annual age to yield an estimate of biological age.
Two readers participated in aging the otoliths. The primary reader (L.L.C.) read all
samples and the secondary reader (J.M.) read at least 20% of the samples from each year. Three
indices of ageing error were calculated per year and for all samples combined for those otoliths
read by both readers: (1) Average Percent Error (APE), (2) Coefficient of variation, and (3)
Percent of Readings in Agreement within ±1 or ± 2 band counts (Beamish and Fournier 1981,
Chang 1982). The secondary reader mean age ± 95 % confidence intervals were calculated
given the primary reader’s age to detect any age bias between readers (Campana et al. 1995).
Although whole and sectioned ages were not explicitly compared for individual fish, reader
precision estimates for both whole and sectioned ages were compared to investigate whether any
differences were apparent between these two methods.
The samples previously aged, 1992 through 1996, by Johnson (1994, 1997) were re-read
by the primary reader (1, 597 sections, 514 whole otoliths). As processing techniques and
equipment have improved over time, the sections (n = 1597) were re-sanded, polished, and
sealed with cyto-seal and re-read by the primary reader. The same 3 indices of ageing error were
calculated for those otoliths read by the primary reader and Johnson (see above). Johnson’s mean
age ± 95% confidence intervals were determined given the primary reader’s age to detect any
age bias between readers (Campana et al. 1995).
Age-length frequencies were produced for each year with all modes and gears combined.
This was performed in order to detect any apparent trends in age structure during the 10-year
5
period. Annual age and observed length at capture were used to construct age-length keys. The
age-at-length data were aggregated into 50 mm (~2 inch) intervals for all years combined and for
each year separately (Bartoo and Parker 1983).
Meristic relationships were calculated for lengths, body weights, and otolith weights for
all red grouper caught from 1992 to 2001. Conversions from fork length (mm) to total length
(mm) and for age (years) to otolith weight (g) were calculated through a linear regression (S plus
2000, Math Soft, Inc). Conversions from total length (mm) to whole weight (kg) and gutted
weight (kg) and from fork length (mm) to whole weight (kg) and gutted weight (kg) were
calculated through a non-linear regression (S plus 2000, Math Soft, Inc).
Growth curves, based on biological ages were constructed using the von Bertalanffy
growth function
where
Lt = length at time t,
L∞ = asymptotic length,
k = growth coefficient,
t = time, and
to = age at time zero
) e - (1 LL ) t- t (-k t
o
∞=
6
and the Schnute and Richard’s function
where
yt = size at time t,
y∞= average maximum value of variable y,
t = age,
a, b, c, and α = fitted parameters (Haddon 2000).
Growth curve model fits were accomplished using the Solver routine in Microsoft Excel 2000.
These parameters were estimated using a least square non-linear regression. Different fits of the
von Bertalanffy growth function were compared for different gear types using a maximum
likelihood ratio approach (Haddon 2000) and executed using SAS code. This method assigns a
degree of freedom for each parameter (L∞, k, to) and does not assume equal variances.
Results
Red groupers have been sampled and aged at the National Marine Fisheries Service-
Southeastern Fisheries Science Center in Panama City, Florida, since 1979 (Johnson and Collins
1994). Although there have been periods of low sampling effort, there is a continuous decade of
otolith samples from 1992 through 2001. A total of 6,438 red grouper otoliths were collected
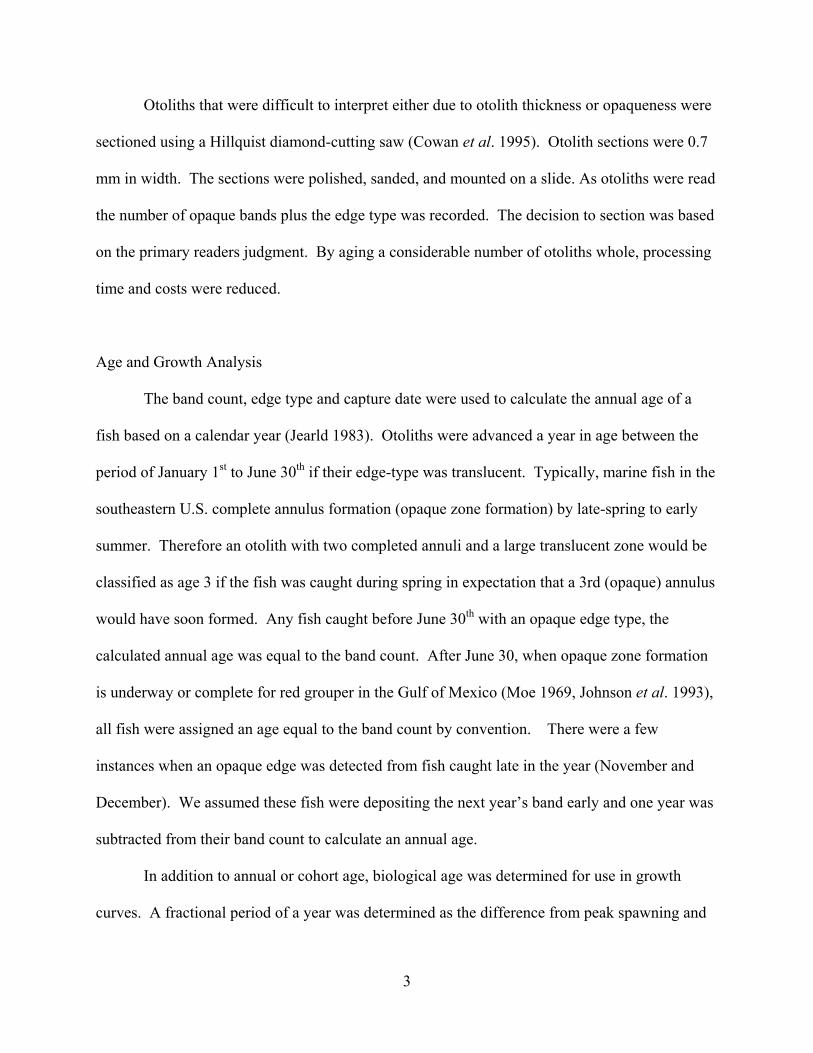
from commercial, recreational, and scientific survey landings during this period. A majority of
the red grouper otoliths were collected by Trip Interview Program port agents at 87% (annual
range: 60-95%), followed by Scientific Survey (NMFS-Panama City, FL and Pascagoula, MS
laboratory personal) at 9% (annual range: 1-40%), 3% (annual range: 0-13%) from the Beaufort
)/1()1( batt
c
eyy −−∞ += α

7
Head Boat Survey, and 1% (annual range: 0-4%) from MRFSS port agents/contractors (Figure
2a). Seventy-eight percent of the samples were randomly selected from commercial landings,
16% of the samples were randomly selected from recreational landings, and 6% were collected
by scientific survey with the use of hand-line, long-line or trap gear types (Figure 2b). The
commercial samples comprised of 62% from long-line, 33% from hand-line, and 5% caught in
traps (Figure 2c). A majority of the samples (60%) were sampled from the last 3 years of
sampling (1999-2001: Table 1). In 2001, the greatest number of samples were received (n =
2008), representing about 0.1% of the total red grouper harvested by number.
Of the total otoliths collected, the primary reader aged 6,353 red grouper otoliths (3,081
sections and 3,272 whole). A total of 6,073 samples (96% of all samples) were used in this
analysis and those eliminated included samples that could not be read, mostly due to problems
associated with processing (off-angle sections and over polishing). The second reader read 57%
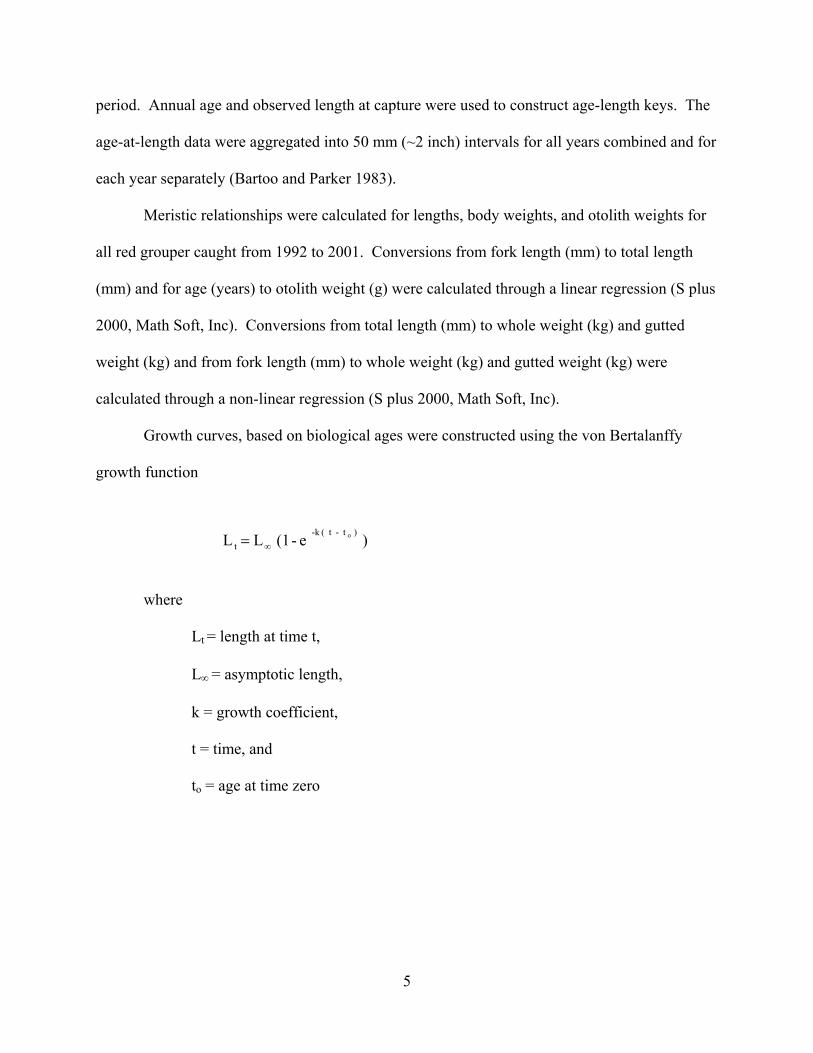
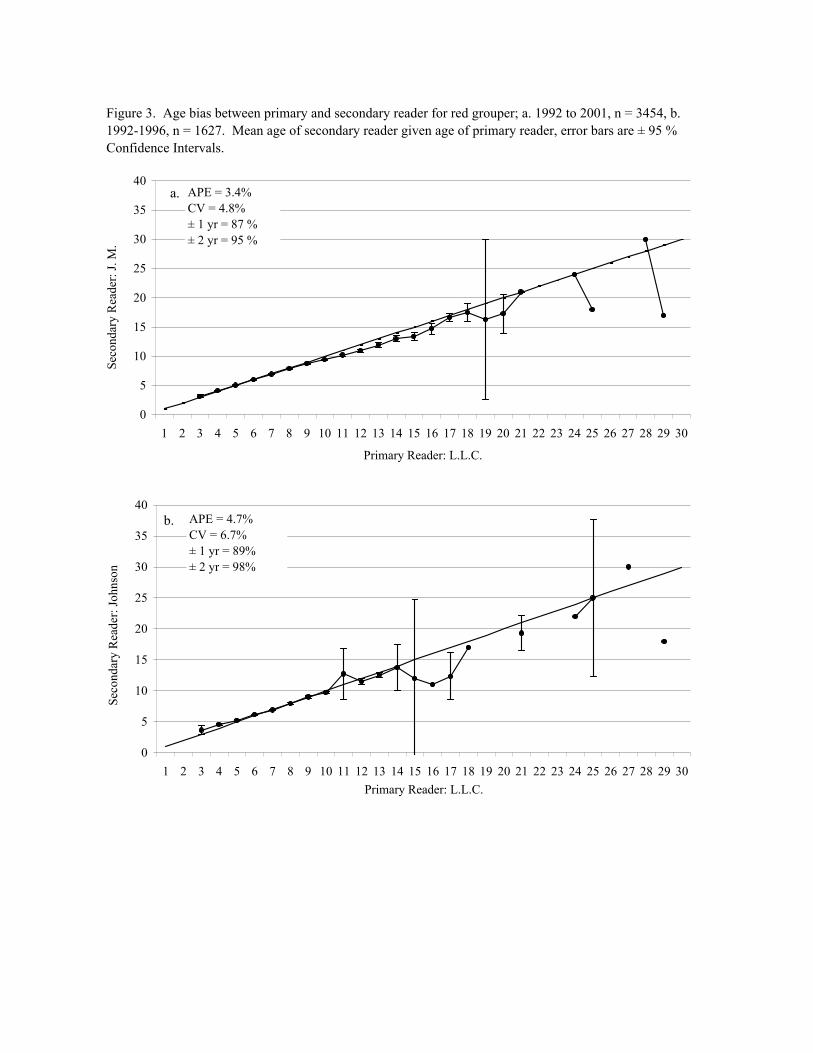
(n = 3454) of the otolith collection. An overall APE of 3.4% was calculated between the readers
with an annual range from 2.1 to 4.9%. A coefficient of variation was calculated at 4.8%. The
overall percent of readings in agreement ±1 year was 87% (annual range: 81-99%) and ±2 years
were 95% (annual range: 91-100%). No age bias was detected for fish aged 10 years or younger,
however, after age 10 there was a slight difference between readers, the secondary reader tending
to age low (Figure 3a). A comparison of reader precision for whole versus sectioned ages
revealed that agreements were higher for whole otolith ages (APE = 2.4%) than for sectioned
ages (APE = 4.3%).
The primary reader aged 1,627 (1,182 sections, 445 whole) red grouper otoliths
previously aged by Johnson (1994, 1997). An overall APE of 4.7% was calculated between the
readers with an annual range from 2.1 to 5.8% throughout the archive years (1992 – 1996). A
8
coefficient of variation was calculated at 6.7%. The overall percent of readings in agreement ±1
year was 89% (annual range: 86-93%) and ±2 years were 98% (annual range: 98-100%). In
addition, no age bias was estimated for fish aged 10 years or younger, however, after age 10
there was a slight difference with the primary reader and Johnson; the primary reader tending to
age higher (Figure 3b).
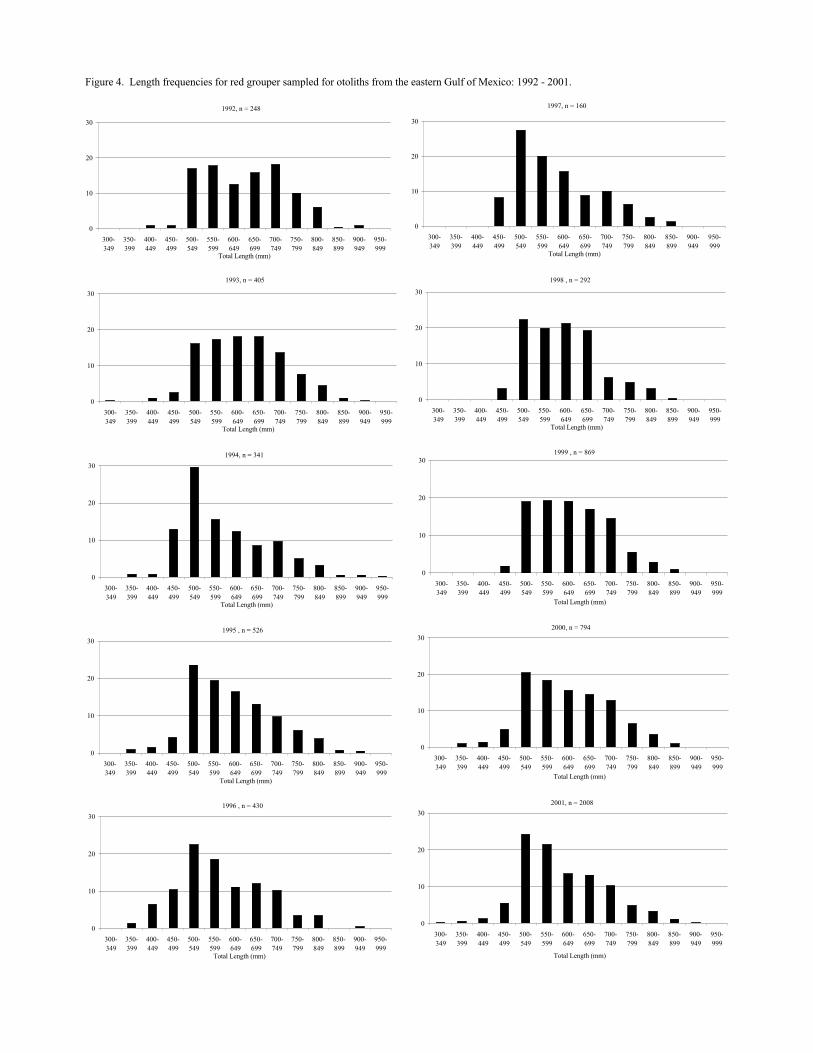
Length frequencies throughout the 10-year period were affected by the 20-inch size limit
(508 mm) established in 1990 (Figure 4). However, samples of undersized by-catch in 1994 and
1996 (Johnson et al. 1997) and increasing undersized scientific survey samples in 2000 and 2001
(Figure 4) increased the percentage of red grouper less than 500 mm, which was useful for
growth analysis. We observed that the size structure changed slightly over the 10-year period
apparently corresponding to changes in age structure. In general, the size structure from our
otolith sampled fish, was similar in comparison to length frequencies (1992 – 1997) reported in
the last assessment (Schirripa et al. 1999).
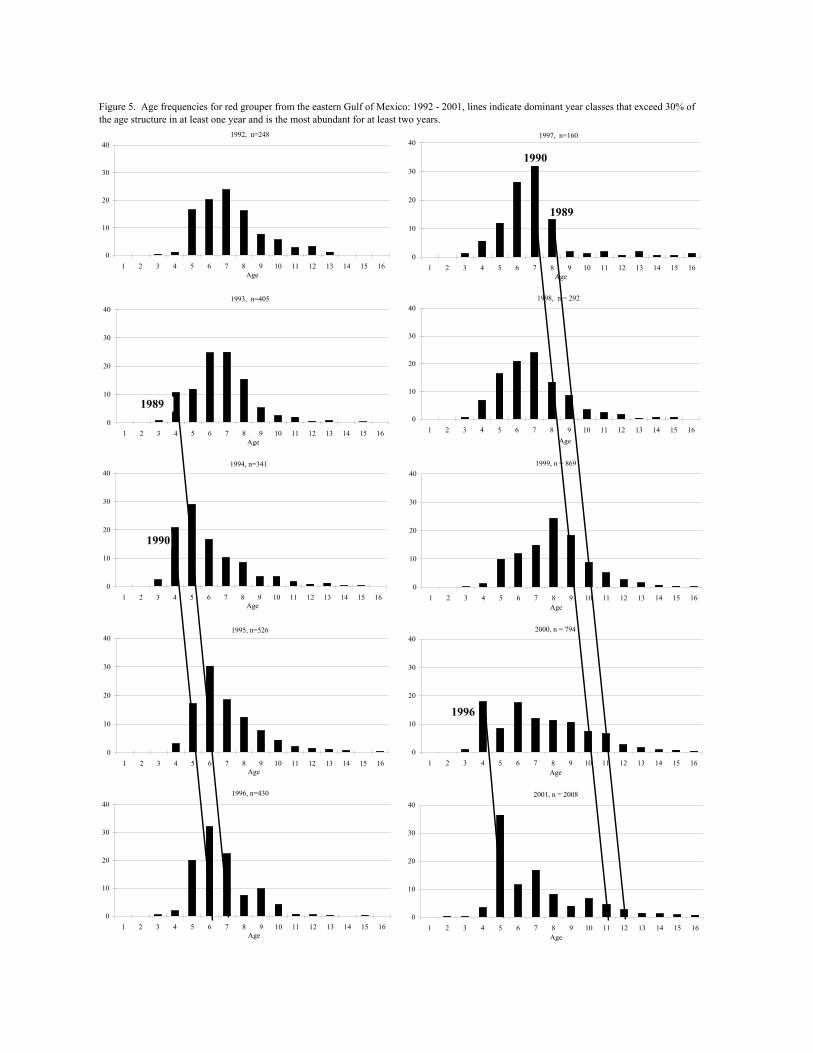
Red grouper fully recruited to the fishery by age 5 to 7 and became rare by age 12 to 14
(< 3% of the total annual age structure; Figure 5). Dominant age classes were apparent and
exceeded 30% of the total age structure during at least one year and dominated the age structure
for two years or more within the 10-year period. Three dominant year classes were present over
the decade (Figure 5). The 1989 cohort dominated in 1994 and 1995 corresponding to the 5 and
6 year old fish. The 1990 cohort dominated in 1996 and 1997 as 6 and 7 year old fish. The only
other year class to show age-structure domination for two successive years or more and exceed
30% of all the ages was the 1996 age cohort, observed as age 4 and 5 year old fish in 2000 and
2001.

9
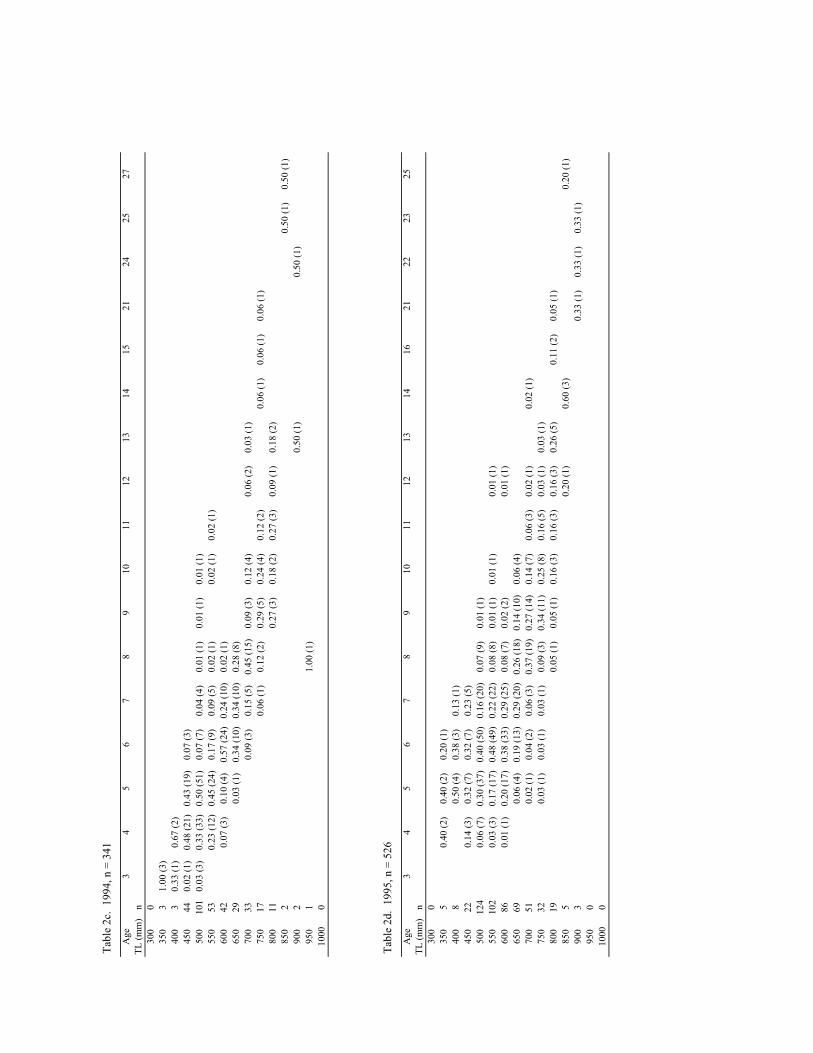
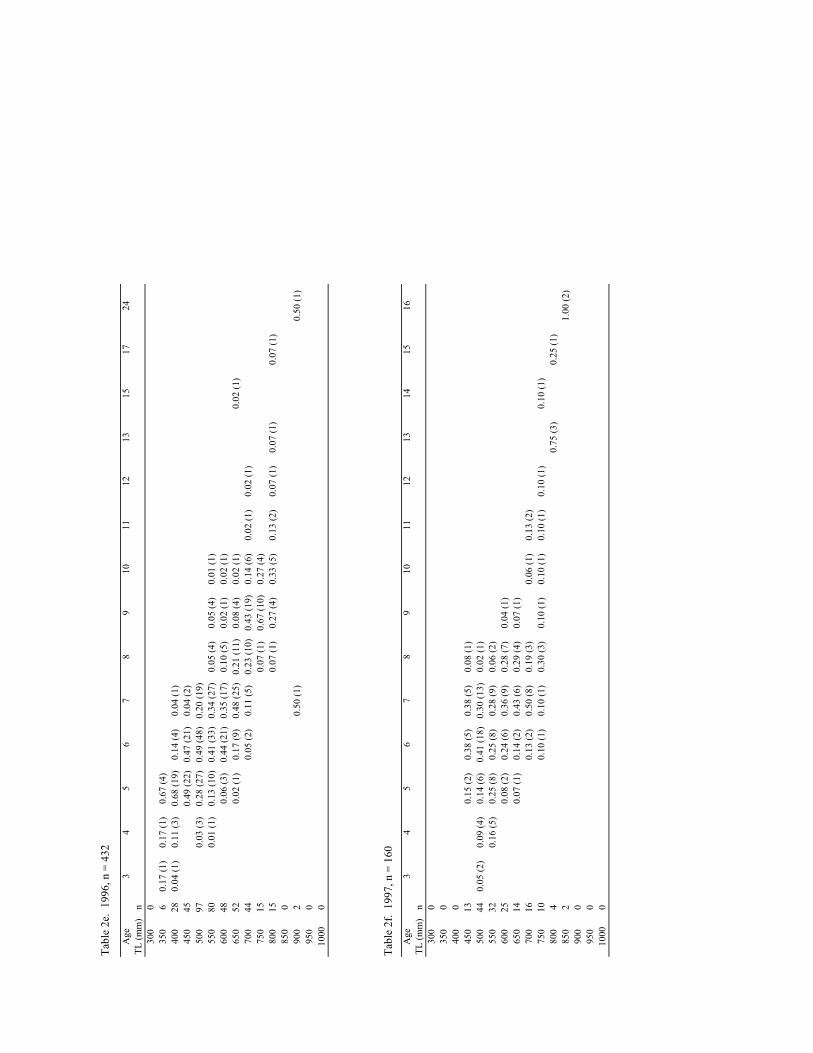
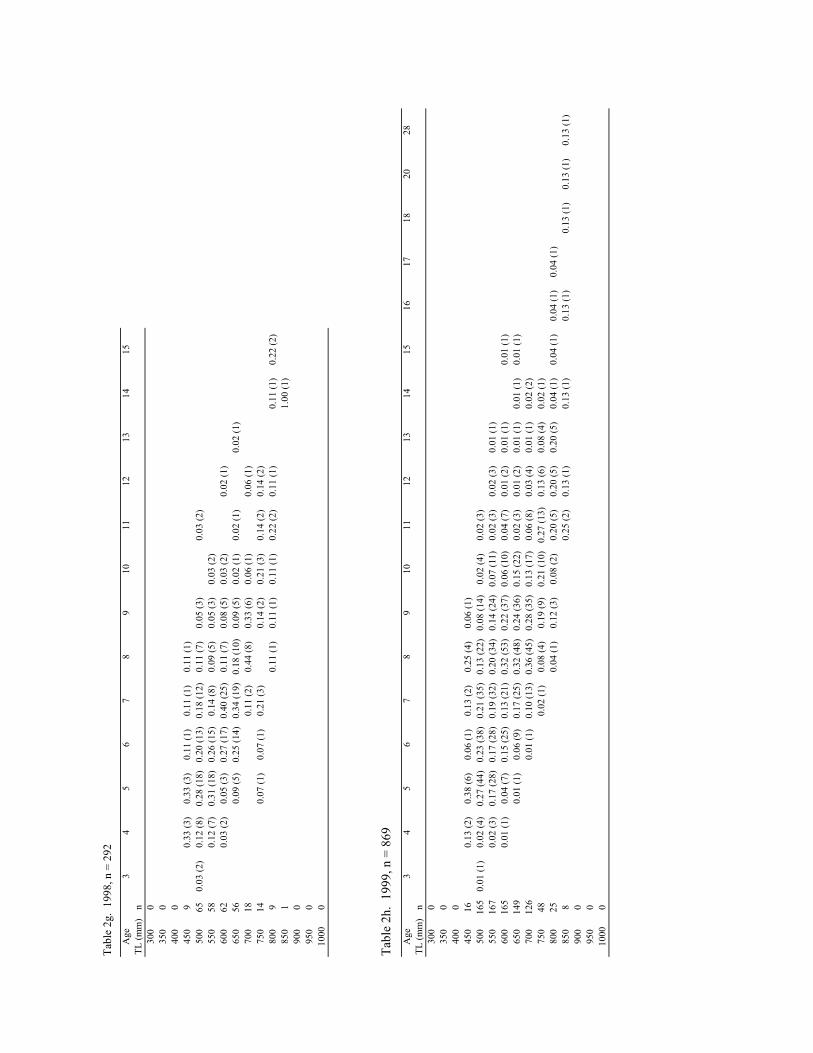
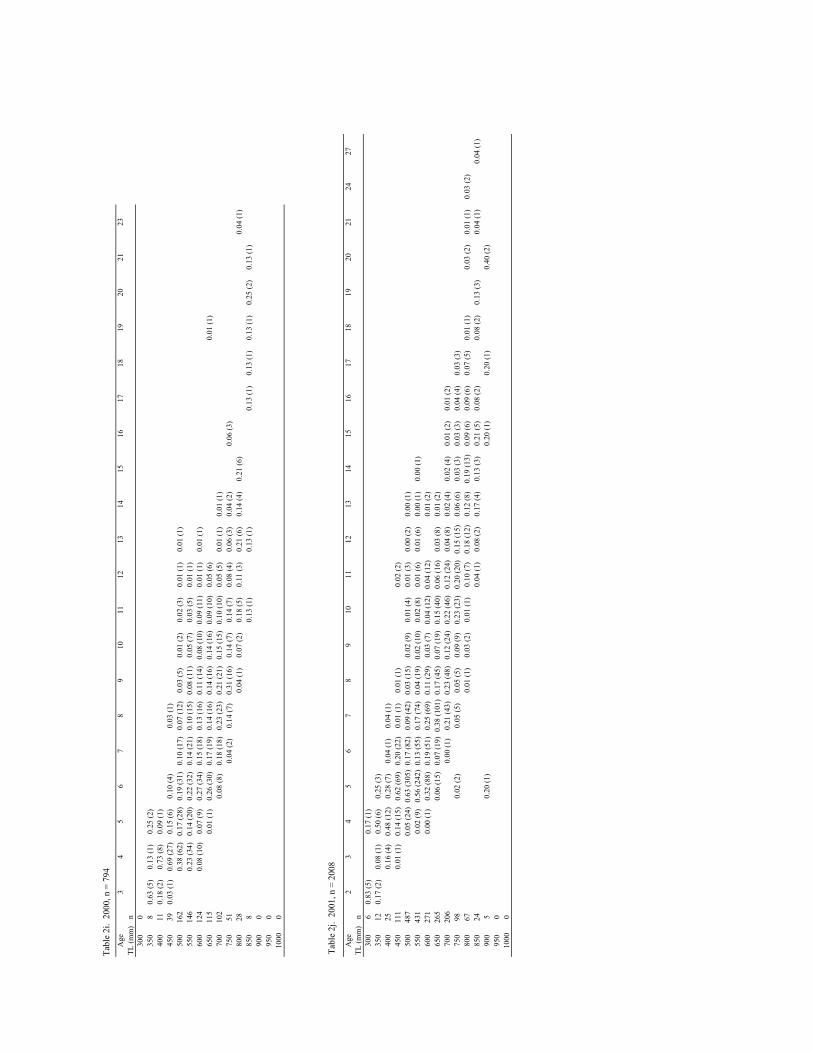
The age-length keys reflected the annual age structure and further show the break down
by size class (Table 2a – 2j). For example, the year 1999 has the oldest age structure of the 10-
year period. This is the only year that fish in the 600-649 mm size class were predominately 8
years old (Table 2h).
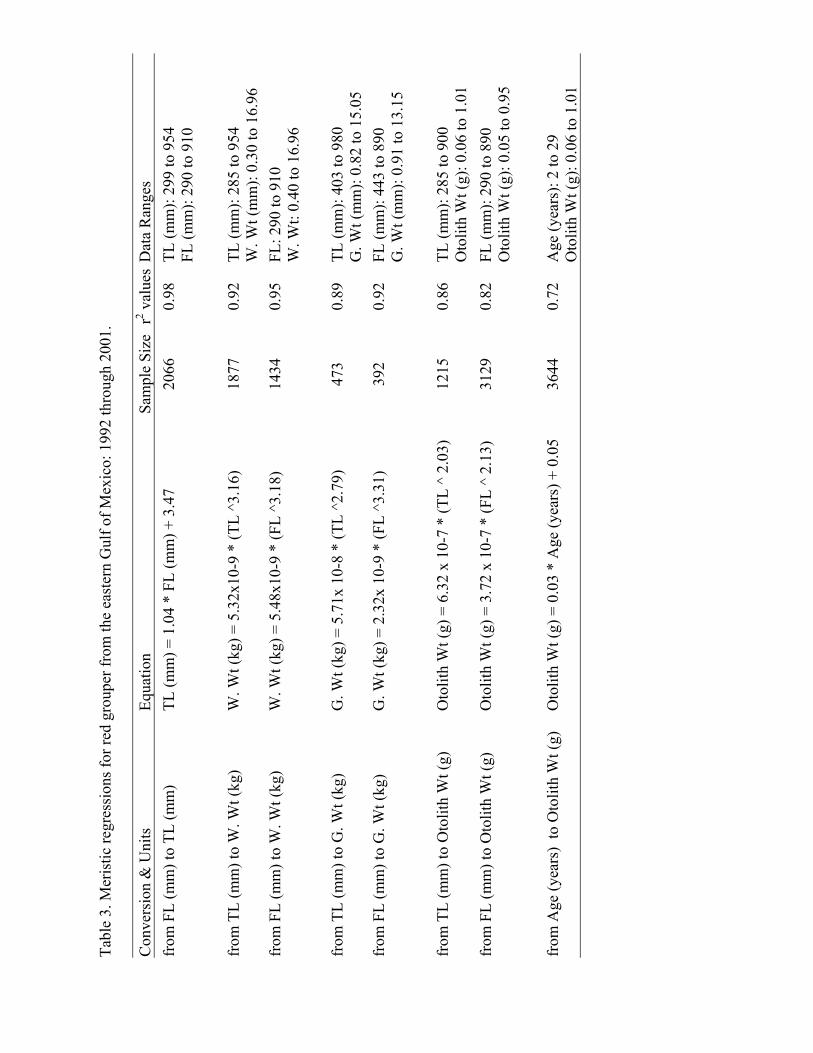
Most regressions for converting units of length, whole body weights, otolith weights and
age contained at least 1200 samples (Table 3). The equation converting from fork length (mm)
to total length (mm) was calculated with an r2 value of 0.98 with a sample size of 2066. The
regression for age (years) and otolith weight was estimated with an r2 value of 0.72.
The von Bertalanffy growth model was fitted to observed lengths and biological ages for
combined data and for each mode and gear separately (Table 4, Figure 6). The highest
asymptotic length (L∞) was estimated from commercial long-line samples (L∞ = 1026 mm),
whereas the lowest asymptotic length was calculated from all the data combined (L∞ = 923 mm).
Similar growth coefficient (k) values were detected among all data combined (k = 0.11),
commercial hand-line (k = 0.10), and recreational samples (k = 0.11). Size at time zero (to)
values were different among the comparisons, however these values may be unreasonable due to
the lack of smaller sized fish (less than 300mm TL) in the age data set (Figure 6). Maximum
likelihood test ratios detected differences among all pairs of comparisons (Table 5).
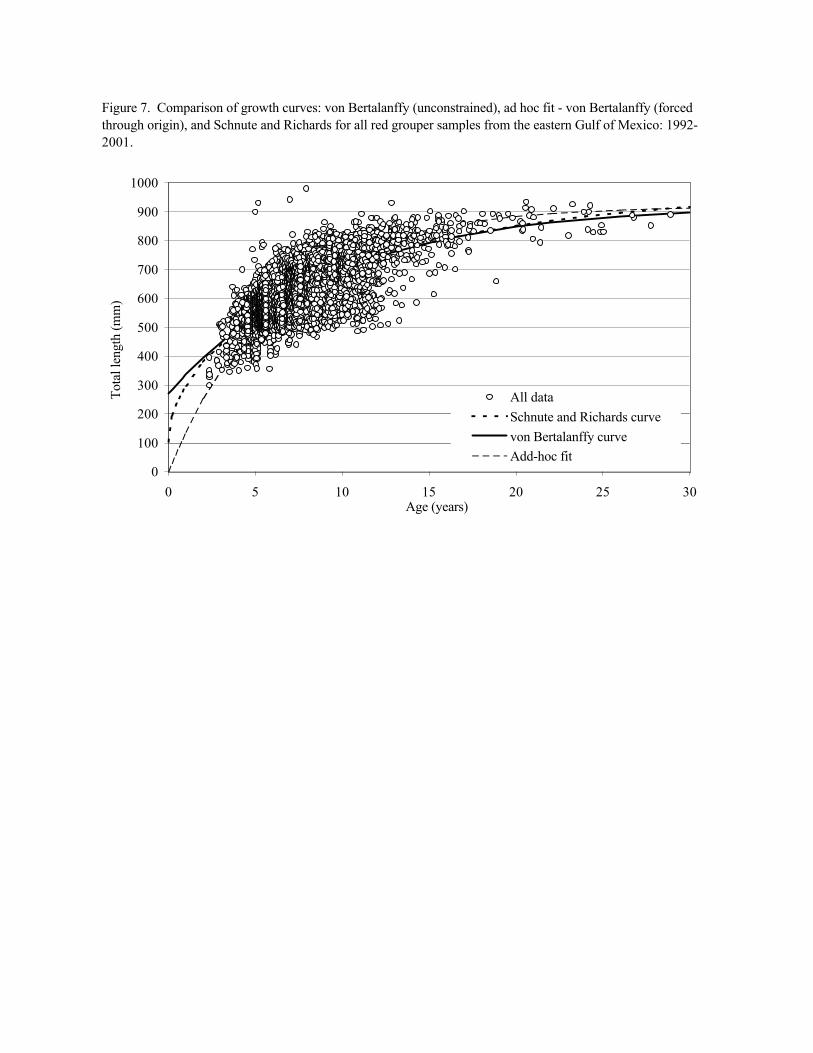
Since the von Bertalanffy growth curve is limited in it’s flexibility to mimic average fish
growth through an entire life span, a Schnute and Richard’s 5-parameter growth function (Craig
1999, Haddon 2000) and an ad-hoc “best estimate” growth curve were also fitted to the observed
lengths and biological ages for all data combined. The Schnute and Richard’s 5-parameter
growth function projected a higher asymptotic length (1009mm TL) and a lower size at the
origin, compared to the unconstrained von Bertalanffy growth function (Table 4, Figure 7). The
10
ad-hoc growth curve was constructed by manipulating 2 of the 3 parameters from the von
Bertalanffy growth function, L∞ was set to 920mm (based on the original fit with all data), to was
restricted to zero, and k was unconstrained in the curve fit. The result was that k was
intermediate to values estimated in previous studies (k = 0.16; Table 6).
Discussion
Moe (1969) completed the first in-depth investigation on the biology, including age and
growth estimates, of the red grouper. Continued efforts have been conducted in the southeastern
Atlantic (Stiles and Burton 1994), northeastern Gulf of Mexico (Johnson and Collins 1994), and
in the southwest Gulf of Mexico and in the Bay of Campeche (Doi et al. 1981). Our
investigation both adds to the historical data and provides a comparison to results obtained over a
period of 40 years (1960s – 1990s).
Dominant year classes were observed and identified from the age structure from the 10-
years of continuous data (1992-2001). A dominant year class typically appeared early (age 4) in
the age structure, composing at least 10% of the age structure at this early age (cohorts: 1989,
1990, 1996; Figure 5). It may be noteworthy that we observed (and arbitrarily defined) dominant
red grouper age classes as those that exceeded 30% of annual age structure in a given year. Also,
noteworthy is that two sequential year classes of red grouper (1989 and 1990) appeared to be
distinguishable as dominant cohorts. But for gag, we observed dominant ages that exceeded
40% of annual age structure (Fitzhugh et al. in press). Both groupers were relatively easy to age
and for both species, dominant year classes were apparent for several years among the age
distributions. Our observation that “dominant” red grouper cohorts tended not to achieve as high
11
an age proportion as “dominant” gag cohorts, may indicate that red grouper recruitment is less
episodic.
Studies show that when otoliths appear easy to interpret and age, and reader precision is
high (Morrison et al. 1998), year class patterns are often more evident across years (Campana
2001). This appears to be the case for red grouper compared to many species. An APE of 3.4%
between the primary and secondary reader was below the median value of 5.5% determined from
a review of 117 studies (Campana 2001). An APE of 4.7% was calculated in comparison to an
earlier ager (A. Johnson) and was also below the median. Differences detected for the older
samples (pre – 1997) could be due to differences in sectioning techniques. We also found that
the APE from ages of whole otoliths (APE = 2.4%) were lower than the APE from sectioned
otoliths (APE = 4.3%), which appears counter-intuitive given the problems that have resulted
when aging programs were devoted to using whole otoliths (Campana 2001). Our finding that
whole otoliths were easier to interpret with greater precision may be due to the fact that the
youngest fish (majority less than 10 bands) were aged whole.
There is always concern that limited sampling of otoliths will not enable adequate
representation of the catch. While our sample size (n > 6,000) far exceeds that of previous
studies, annual representation is still rather low (about 0.1% harvest by number in 2001). There
were fluctuations in the sample sizes over the years, but we noted consistent patterns in the age
structure from 1992 to 2001. For example, common ages for red grouper consisted of fish from
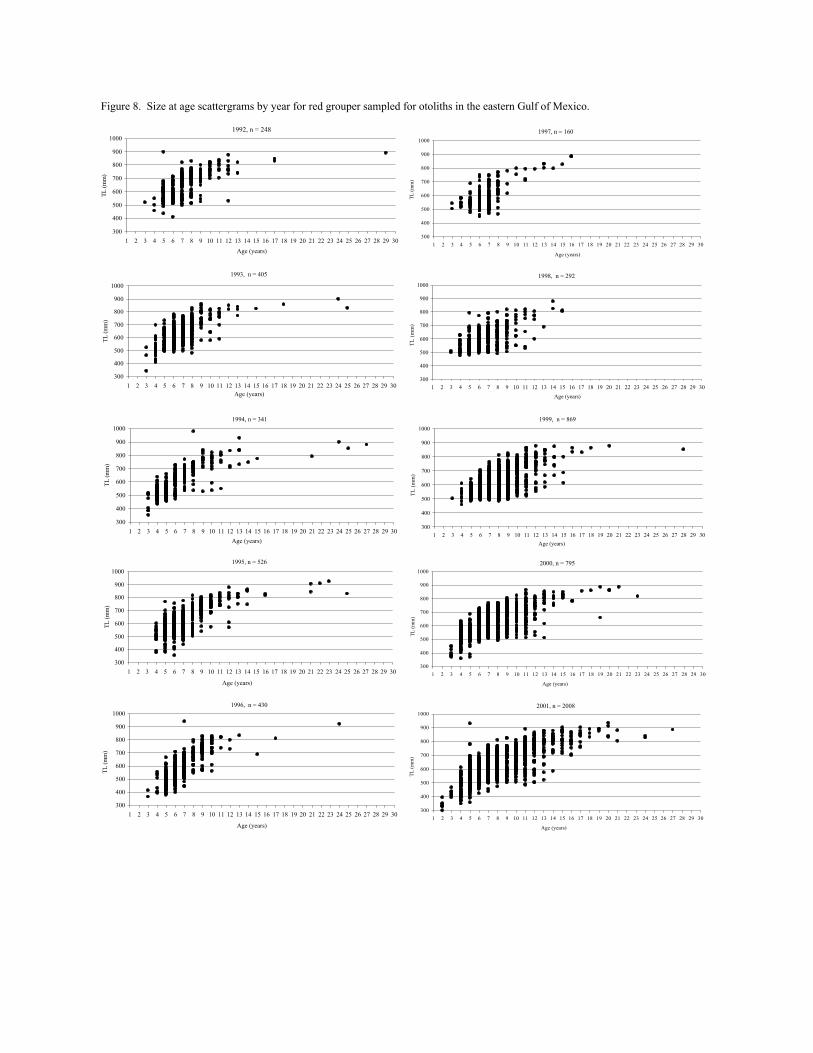
4 to 8 years old every year. Annual sample size variations seem to affect the older age classes –
late teens and twenties (Figure 8). During those years of increased sample sizes (greater than
800 individual fish; 1999, 2000, and 2001), at least 20% of the age structure was comprised of
fish older than 10 years of age. But we have some confidence that the age-sampled red grouper
12
are representative of the catch for the common sizes and ages. Our size structure was similar in
comparison to the length frequencies (1992 – 1997) reported in the last stock assessment
(Schirripa et al. 1999). We also have some confidence that red grouper are reasonably well
sampled since the primary area of harvest is the West Florida shelf, which is relatively small in
comparison to other fisheries that encompass larger geographical areas. However, commercial
trap samples were under represented and may be an exception.
Since the otolith samples were obtained from several gear types, it is often of interest to
examine if gear selectivity might result in different growth curves and independent reviewers
have asked for these comparisons (Kenchington 2001). A maximum likelihood approach
(Haddon 2000) was used to test for coincident curves comparing recreational hook and line,
commercial hook and line, commercial long-line and commercial trap gears (Figure 6, Table 4).
In every comparison, the curves were not coincident. Further examination of the parameters
revealed the cause of the gear-based differences, which were usually either asymptotic length
(L∞) or to, relating back to the problems with rare observations at the extremes of the curves
affecting the fit. Haddon (2000) cautions against drawing ill-reasoned conclusions in growth
curve comparisons because of the nature of the data fitting problems.
Although gear-specific curves were not coincident, the differences may not reflect
meaningful biological differences based on observations of how and where red grouper are
harvested. In other fisheries, such as red snapper and gag, the differences in the size and age
structure between hook and line and long-line gears are very notable and are probably related to
the different depths and habitats where the gears are fished (Cass-Calay et al. 2001, Allman et al.
in press, Fitzhugh et al. in press). But the gear-specific size and age differences are not as
pronounced for red grouper. Commercial long-line and hook and line gears targeting red

13
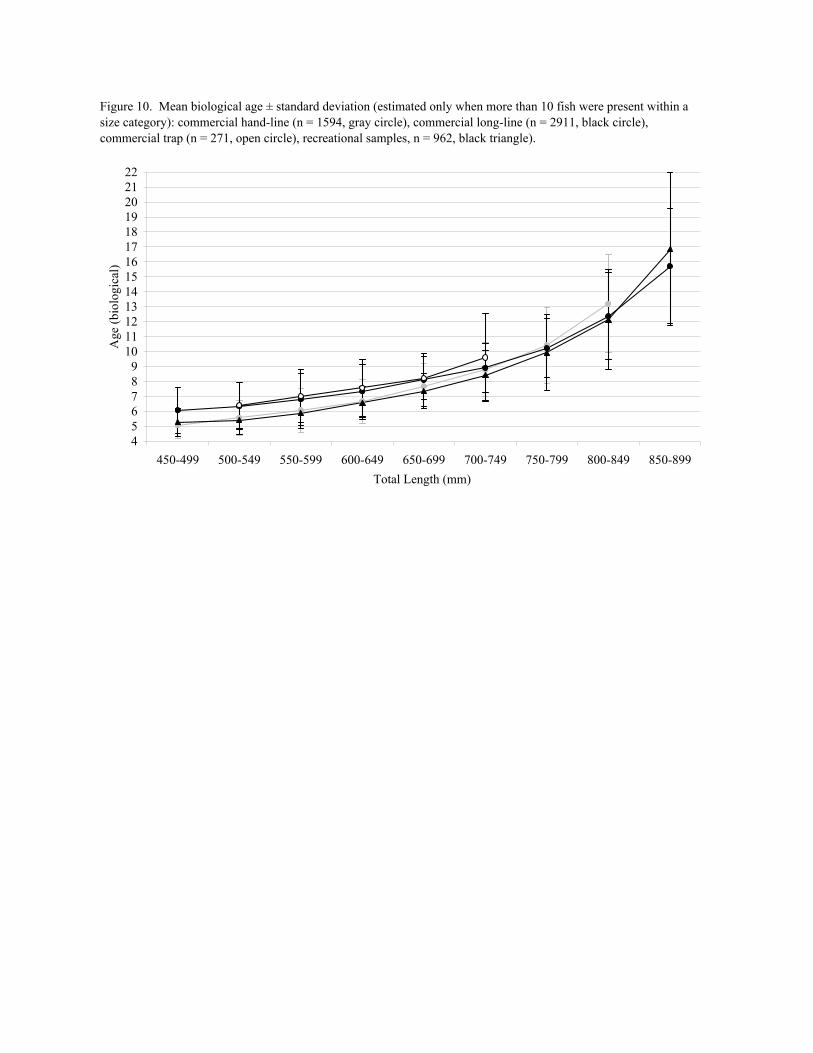
grouper overlap a great deal in the depth zones fished (Figure 9). Never-the-less, red grouper
caught by recreational and commercial hook and lines in shallower water depths were slightly
younger at size compared to fish caught by the commercial long-lines in deeper water depths
(Figure 10). We feel that age/size characterization by depth and habitat is an area of work that
requires further attention. But if the need is for a simple representation of average growth, then
combining as much of the data as possible from the different gears, across years, to yield a single
growth curve may be justified.
Two growth functions were produced using all of the data available: a von Bertalanffy
function and an Schnute and Richard’s function (Figure 7). These produced generally best fits
for comparison to earlier results and for comparing the differences between the typical 3-
parameter and higher-parameter curve fits. The original von Bertalanffy fit resulted in an
estimate of t0 of –3.21 years at zero size. This degree of difference from the origin has been
criticized in a stock assessment review for gag because the curve would inflate the average size-
at-age for the first two years, before the fish are recruited to the fishery (Kenchington 2001).
Therefore, we again fit the von Bertalanffy function with a common constraint of to equal to
zero. This in effect, forced the curve through the size-age origin, which in principal would
better mimic the average growth trajectory for young fish. However, when the constraint of to
equal to zero was applied to the complete red grouper data set, k increased to 0.23 and
asymptotic length (L∞) became unrealistically low (785 mm TL). Our final ad-hoc approach of
constraining asymptotic length to 920mm TL based on the original fit, and to to zero resulted in a
value of k of 0.16, which was intermediate to values from other studies (Table 6) and may be the
most biologically reasonable result for our von Bertalanffy fit to our overall data set. Several red
grouper otolith-based age studies, as well as these results, confirm that asymptotic length (L∞) is
14
about 900-1000 mm TL for the von Bertalanffy function since the 1980s (Table 6; Johnson and
Collins 1994, Stiles and Burton 1994, Fuentes et al. cited in Contreras et al. 1994). This was
also confirmed by tag and recapture estimates (Schirripa and Burns 1997) and makes sense when
viewing size-at-age scattergrams (Figure 8).
Although the two different growth functions cannot be explicitly tested for coincident
curves, the 5-parameter Schnute and Richards (SR) curve resulted in sum of squares error only
slightly less than the von Bertalanffy growth function (VBGF) for the same data set
(SR=27,587,227 versus VBGF=27,596,183). Also, as expected because of it’s increased
flexibility, the Schnute and Richard’s curve approached a size-age origin closer to zero than did
the original fit of the von Bertalanffy function (Figure 7). Although Schnute and Richard’s
function is more difficult to fit (5-parameter vs. 3), is less well known, less commonly used, and
perhaps less biologically intuitive, it may be useful if it is important to model growth during the
first few years as well as after recruitment to the fishery.
Two of the earlier Gulf of Mexico age studies are noteworthy in that few large red
grouper (>800 mm TL) were captured, leading to speculation that growth and/or longevity has
changed between the 1960s-1980s compared to the 1990s (Moe 1969, Johnson and Collins
1994). In both studies, red grouper from the earlier time period resulted in a low asymptotic
length (L∞; 789–792 mm TL) compared to studies in the 1990s. Both studies from the earlier
time period sampled proportionally more young fish (Moe, 15% ≤ age-3; Johnson and Collins
Time period 1, 14% ≤ age-3) compared to this study (0.09% ≤ age-3) and also resulted in a size-
age origin much closer to zero than this study. Again this highlights the importance in data
sources and distribution (Johnson and Collins 1994). That the growth difference over time is
real is best supported by Moe’s (1969) assertion that “although sampling was not completely

15
random, no obvious bias for age or size of adult fish was apparent”. Moe sampled the
commercial hook and line fishery (1963-1964) similar to our samples taken from 1992 to 2001.
In general, our results differ from previous studies due to the distribution of the data as
mentioned earlier. Because of the size limits and dependence on fishery-dependent sources, and
increased sample size, our data is characterized by a low proportion of young red grouper (age-3
and less) and a much higher number of older individuals (ages in the teens and 20s). Previous
studies rarely reported red grouper older than age-16 (Moe 1969, Johnson and Collins 1994,
Stiles and Burton 1994, Schirripa and Burns 1997).
Future Research
We recommend that further in-depth investigations should be completed to increase our
understanding of the life history of red grouper, Epinephelus morio, from the northeastern Gulf
of Mexico. Habitat specific data, such as depth, location, and bottom topography, should be
collected and correlated to the red grouper caught in those areas. An increase in annual otolith
samples more representative of the harvest by fishing mode is recommended. Although, there
was no reader bias for ages commonly harvested, (≤ age 10) and reader precision was relatively
high, more effort concerning age corroboration and absolute age validation for the oldest ages
(e.g., radiocarbon analysis) is also a priority.

16
Acknowledgements
This research was possible through the assistance of samplers from the Trip Interview
Program (TIP), NMFS Beaufort Head Boat, and the Marine Recreational Fisheries Statistical
Survey. In particular, we would like to acknowledge and extend our gratitude to the continued
efforts of past and present Trip Interview Program (TIP) port agents, especially, Tim Brandt,
Lew Bullock, Debbie Fable, Greg Fairclough, Lisa Hallock, Tom Herbert, Ed Little, Guy Pizzoti,
Renee Roman, and June Weeks. Financial support was received in part by the U.S. Department
of Commerce Marine Fisheries Initiative Program (MARFIN).
17
References
Allman, R. J., Lombardi-Carlson, L. A., Fitzhugh, G. R., and W. A. Fable. In press. Age
Structure of red snapper (Lutjanus campechanus) in the Gulf of Mexico by fishing mode
and region. Proc. Gulf Caribb. Fish. Inst.
Bartoo, N. W. and K. R. Parker. 1983. Stochastic age-frequency estimation using the von
Bertalanffy growth equation. Fish. Bull. 81(1): 91-96.
Beamish, R. J. and D. A. Fournier. 1981. A method for comparing the precision of a set of age
determinations. Can. J. Fish. Aquat. Sci. 38: 982-983.
Burgos, J. M. 2001. Life history of the red grouper (Epinephelus morio) off the North Carolina
and South Carolina coast. Master’s Thesis. University of Charleston, South Carolina.
Campana, S. E. 2001. Accuracy, precision and quality control in age determination, including a
review of the use and abuse of age validation methods. Jour. Fish Bio. 59: 197-242.
Campana, S. E., Annand, M. C., and J. I. McMillan. 1995. Graphical and statistical methods for
determining the consistency of age determinations. Trans. Am. Fish. Soc. 124: 131-138.
Cass-Calay, S. L., Turner, S. C., Fitzhugh, G. R., and L. A. Lombardi-Carlson. 2001. An
examination of gear specific variability in the growth of gag (Mycteroperca microlepis)
in the eastern Gulf of Mexico. SFSC, SFD Contr. SFD 00/01-136.
Chang, W. Y. 1982. A statistical method for evaluating the reproducibility of age
determinations. Can. J. Aquat. Sci. 39: 1208-1210.
Collins, L. A., Lombardi, L.A., Fitzhugh, G. R., Lyon, H. M., Walling, W. T., and D. W. Oliver.
Characterization of red grouper (Serranidae: Epinephelus morio) reproduction from the
eastern Gulf of Mexico. 2002. SEFSC- Panama City Laboratory. Contr. 2002-07.
18
Contreras, M., Arreguin-Sanchez, F., Sanchez, J. A., Moreno, V., and M. A. Cabrera. 1994.
Mortality and population size of the red grouper (Epinephelus morio) fishery from the
Campeche Bank. Proc. Gulf Caribb. Fish. Inst. 43: 392-401.
Cowan, J. H., Ship, R. L., Bailey, H. K., and D. W. Hawick. 1995. Procedure for rapid
processing of large otoliths. Trans. Am. Fish. Soc. 124: 280-282.
Craig, P.C. 1999. The von Bertalanffy growth curve: When a good fit is not good enough. Naga,
the ICLARM quarterly 22(4): 28-29.
Doi, T., Mendizabal, D., and M. Contreras. 1981. Analisis preliminar de la poblacion de mero,
Epinephelus morio (Valenciennes) en el Banco de Campeche. Ciencia Pesquera. 1: 1-15.
Fitzhugh, G. R., Lombardi-Carlson, L. A., and N. M. Evou. In press. Age structure of gag
(Mycteroperca microlepis) in the eastern Gulf of Mexico by year, fishing mode and
region. Proc. Gulf. Caribb. Fish. Inst.
Haddon, M. 2000. Modelling and quantitative methods in fisheries. Chapman and Hall/CRC
press. Boca Ratton, Florida, USA.
Jearld, A. Jr. 1983. Age determination. pp 301-324 In: L.A. Nielsen and D.L. Johnson (eds.),
Fisheries Techniques. Am. Fish. Soc. Bethesda, Maryland. USA.
Johnson, A. G. and L. A. Collins. 1994. Age-size structure of red grouper, (Epinephelus morio),
from the eastern Gulf of Mexico. NE Gulf Science. 13 (2): 101-106.
Johnson, A. G., Baker, M. S. Jr., and L. A. Collins. 1997. Magnitude and composition of
undersized grouper bycatch. Proc. Gulf Carib. Fish. Inst. 49: 161-172.
Johnson, A. G., Collins, L. A., and J. J. Isley. 1993. Age-size structure of gag, Mycteroperca
microlepis, from the northeastern Gulf of Mexico. NE Gulf Science. 13(1): 59-63.
19
Kenchington, T. J. 2001. Gag Grouper in the Gulf of Mexico: Comments on the 2001
assessment. 22 p. Prepared for Southeastern Fisheries Association and Southern Offshore
Fishing Association. Available from the Gulf of Mexico Fisheries Management Council,
Tampa, Florida.
Moe, M. A. 1969. Biology of the red grouper Epinephelus morio (Valenciennes) from the
eastern Gulf of Mexico. FL Dept. Nat. Mar. Res. Pro. Paper Series 10: 1-95.
Morrison, A. K., Coutin, P. C., and S. G. Robertson. 1998. Age determination of black bream,
Acanthopagrus butcheri (Sparidae), from the Gippsland Lakes of south-eastern Australia
indicates slow growth and episodic recruitment. Mar Freshwater Res. 49: 491-498.
Schirripa, M. J. and K. M. Burns. 1997. Growth estimates for three species of reef fish in the
eastern Gulf of Mexico. Bull. Mar. Sci. 61(3): 581-591.
Schirripa, M. J. and C. M. Legault. 1997. Status of the gag stocks of the Gulf of Mexico:
assessment 2.0. SEFSC, SFD.
Schirripa, M. J., Legault, C. M., and M. Ortiz. 1999. The red grouper fishery of the Gulf of
Mexico: assessment 3.0. SEFSC, SFD. Contribution No. SFD – 98/99- 56.
Stiles, T. C. and M. L. Burton. 1994. Age, growth, and mortality of red grouper, Epinephelus
morio, from the southeastern U.S. Proc. Gulf Carib. Fish. Inst. 43: 124-137.

List of Table Captions 1 Samples sizes of red grouper otoliths collected from the eastern Gulf of Mexico divided
by mode and gear for each year.
2 Age-length keys for red grouper from the eastern Gulf of Mexico for each year: 1992 to 2001, sample sizes are in parenthesis (size bins are in 50mm increments, for example 500 mm includes 500 to 549mm in total length).
3 Meristic regressions for red grouper from the eastern Gulf of Mexico: 1992 through 2001.
4 Growth curve parameters for biological ages and lengths at capture for red grouper by different gear types and for different growth curves from the eastern Gulf of Mexico: 1992-2001 (scientific survey samples, n = 334, added to all data to calculate von Bertalanffy parameters).
5
Maximum likelihood test ratios, chi-square values, and p values for comparisons of the von Bertalanffy growth curves between pairs of different modes and gears for red grouper from the eastern Gulf of Mexico: 1992-2001.
6 Growth parameters from the von Bertalanffy growth curve from previous studies on the red grouper.
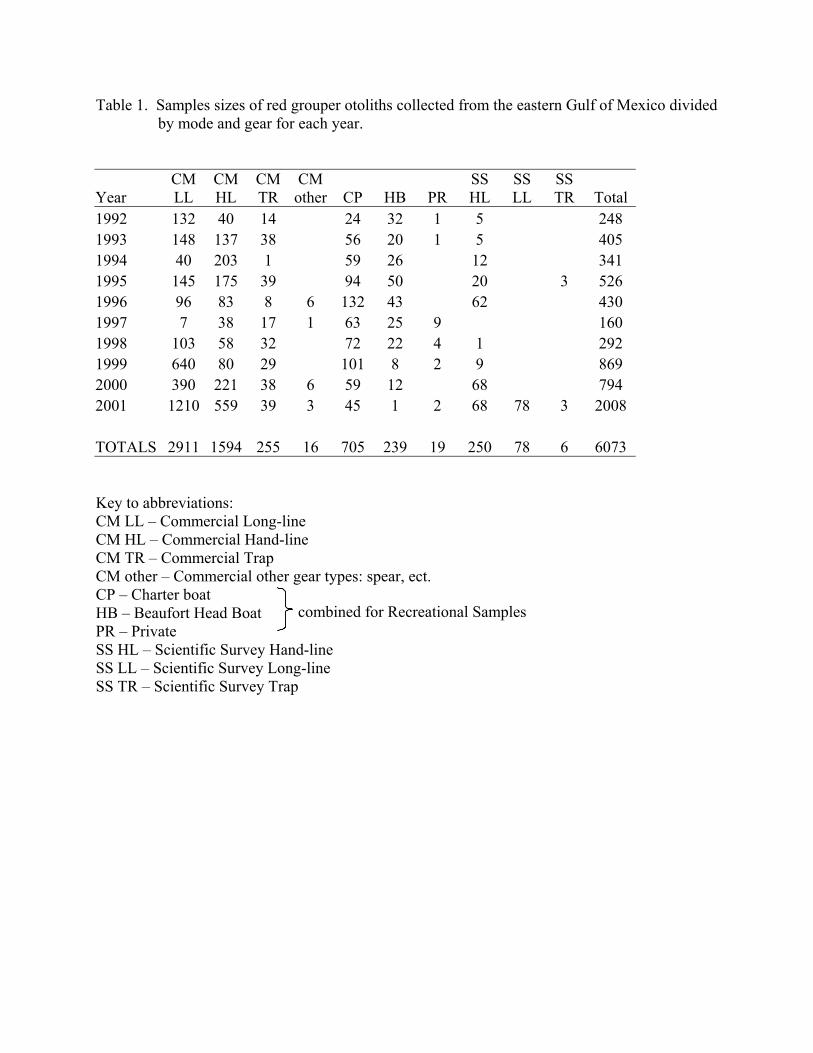
Table 1. Samples sizes of red grouper otoliths collected from the eastern Gulf of Mexico divided by mode and gear for each year.
Year CM LL
CM HL
CM TR
CM other CP HB PR
SS HL
SS LL
SS TR Total
1992 132 40 14 24 32 1 5 248 1993 148 137 38 56 20 1 5 405 1994 40 203 1 59 26 12 341 1995 145 175 39 94 50 20 3 526 1996 96 83 8 6 132 43 62 430 1997 7 38 17 1 63 25 9 160 1998 103 58 32 72 22 4 1 292 1999 640 80 29 101 8 2 9 869 2000 390 221 38 6 59 12 68 794 2001 1210 559 39 3 45 1 2 68 78 3 2008 TOTALS 2911 1594 255 16 705 239 19 250 78 6 6073 Key to abbreviations: CM LL – Commercial Long-line CM HL – Commercial Hand-line CM TR – Commercial Trap CM other – Commercial other gear types: spear, ect. CP – Charter boat HB – Beaufort Head Boat PR – Private SS HL – Scientific Survey Hand-line SS LL – Scientific Survey Long-line SS TR – Scientific Survey Trap
combined for Recreational Samples

Age
34
56
78
910
1112
1317
29TL
(mm
)n
300
035
00
400
20.
50 (1
)0.
50 (1
)45
02
0.50
(1)
0.50
(1)
500
420.
02 (1
)0.
02 (1
)0.
31 (1
3)0.
31 (1
3)0.
21 (9
)0.
05 (2
)0.
05 (2
)0.
02 (1
)55
044
0.02
(1)
0.18
(8)
0.39
(17)
0.20
(9)
0.18
(8)
0.02
(1)
600
310.
42 (1
3)0.
29 (9
)0.
23 (7
)0.
06 (2
)65
039
0.10
(4)
0.18
(7)
0.38
(15)
0.18
(7)
0.15
(6)
700
450.
07 (3
)0.
33 (1
5)0.
29 (1
3)0.
13 (6
)0.
09 (4
)0.
02 (1
)0.
02 (1
)0.
04 (2
)75
025
0.12
(3)
0.28
(7)
0.12
(3)
0.20
(5)
0.12
(3)
0.16
(4)
800
150.
07 (1
)0.
07 (1
)0.
07 (1
)0.
33 (5
)0.
20 (3
)0.
07 (1
)0.
07 (1
)0.
13 (2
)85
01
1.00
(1)
900
20.
50 (1
)0.
50 (1
)95
00
1000
0
Age
34
56
78
910
1112
1315
1824
25TL
(mm
)n
300
11.
00 (1
)35
00
400
41.
00 (4
)45
010
0.10
(1)
0.70
(7)
0.10
(1)
0.1
0 (1
)50
065
0.02
(1)
0.32
(21)
0.28
(18)
0.25
(16)
0.11
(7)
0.03
(2)
550
700.
07 (5
)0.
13 (9
)0.
36 (2
5)0.
29 (2
0)0.
11 (8
)0.
01 (1
)0.
01 (1
)0.
01 (1
)60
073
0.07
(5)
0.16
(12)
0.40
(29)
0.25
(18)
0.10
(7)
0.03
(2)
650
730.
10 (7
)0.
26 (1
9)0.
42 (3
1)0.
19 (1
4)0.
03 (2
)70
055
0.02
(1)
0.04
(2)
0.11
(6)
0.36
(20)
0.31
(17)
0.11
(6)
0.04
(2)
0.02
(1)
750
310.
13 (4
)0.
16 (5
)0.
35 (1
1)0.
10 (3
)0.
10 (3
)0.
13 (4
)0.
03 (1
)80
018
0.11
(2)
0.39
(7)
0.11
(2)
0.11
(2)
0.06
(1)
0.11
(2)
0.06
(1)
0.06
(1)
850
40.
50 (2
)0.
25 (1
)0.
25 (1
)90
01
1.00
(1)
950
010
000
Tabl
e 2a
. 19
92, n
= 2
48
Tabl
e 2b
. 19
93, n
= 4
05
Tabl
e 2a
- 2j
. A
ge-le
ngth
key
s for
red
grou
per f
rom
the
east
ern
Gul
f of M
exic
o fo
r eac
h ye
ar: 1
992
to 2
001,
sam
ple
size
s are
in
pare
nthe
sis (
size
bin
s are
in 5
0mm
incr
emen
ts, f
or e
xam
ple
500m
m in
clud
es 5
00 to
549
mm
in to
tal l
engt
h).
Age
34
56
78
910
1112
1314
1521
2425
27TL
(mm
)n
300
035
03
1.00
(3)
400
30.
33 (1
)0.
67 (2
)45
044
0.02
(1)
0.48
(21)
0.43
(19)
0.07
(3)
500
101
0.03
(3)
0.33
(33)
0.50
(51)
0.07
(7)
0.04
(4)
0.01
(1)
0.01
(1)
0.01
(1)
550
530.
23 (1
2)0.
45 (2
4)0.
17 (9
)0.
09 (5
)0.
02 (1
)0.
02 (1
)0.
02 (1
)60
042
0.07
(3)
0.10
(4)
0.57
(24)
0.24
(10)
0.02
(1)
650
290.
03 (1
)0.
34 (1
0)0.
34 (1
0)0.
28 (8
)70
033
0.09
(3)
0.15
(5)
0.45
(15)
0.09
(3)
0.12
(4)
0.06
(2)
0.03
(1)
750
170.
06 (1
)0.
12 (2
)0.
29 (5
)0.
24 (4
)0.
12 (2
)0.
06 (1
)0.
06 (1
)0.
06 (1
)80
011
0.27
(3)
0.18
(2)
0.27
(3)
0.09
(1)
0.18
(2)
850
20.
50 (1
)0.
50 (1
)90
02
0.50
(1)
0.50
(1)
950
11.
00 (1
)10
000
Age
34
56
78
910
1112
1314
1621
2223
25TL
(mm
)n
300
035
05
0.40
(2)
0.40
(2)
0.20
(1)
400
80.
50 (4
)0.
38 (3
)0.
13 (1
)45
022
0.14
(3)
0.32
(7)
0.32
(7)
0.23
(5)
500
124
0.06
(7)
0.30
(37)
0.40
(50)
0.16
(20)
0.07
(9)
0.01
(1)
550
102
0.03
(3)
0.17
(17)
0.48
(49)
0.22
(22)
0.08
(8)
0.01
(1)
0.01
(1)
0.01
(1)
600
860.
01 (1
)0.
20 (1
7)0.
38 (3
3)0.
29 (2
5)0.
08 (7
)0.
02 (2
)0.
01 (1
)65
069
0.06
(4)
0.19
(13)
0.29
(20)
0.26
(18)
0.14
(10)
0.06
(4)
700
510.
02 (1
)0.
04 (2
)0.
06 (3
)0.
37 (1
9)0.
27 (1
4)0.
14 (7
)0.
06 (3
)0.
02 (1
)0.
02 (1
)75
032
0.03
(1)
0.03
(1)
0.03
(1)
0.09
(3)
0.34
(11)
0.25
(8)
0.16
(5)
0.03
(1)
0.03
(1)
800
190.
05 (1
)0.
05 (1
)0.
16 (3
)0.
16 (3
)0.
16 (3
)0.
26 (5
)0.
11 (2
)0.
05 (1
)85
05
0.20
(1)
0.60
(3)
0.20
(1)
900
30.
33 (1
)0.
33 (1
)0.
33 (1
)95
00
1000
0
Tabl
e 2c
. 19
94, n
= 3
41
Tabl
e 2d
. 19
95, n
= 5
26
Age
34
56
78
910
1112
1315
1724
TL (m
m)
n30
00
350
60.
17 (1
)0.
17 (1
)0.
67 (4
)40
028
0.04
(1)
0.11
(3)
0.68
(19)
0.14
(4)
0.04
(1)
450
450.
49 (2
2)0.
47 (2
1)0.
04 (2
)50
097
0.03
(3)
0.28
(27)
0.49
(48)
0.20
(19)
550
800.
01 (1
)0.
13 (1
0)0.
41 (3
3)0.
34 (2
7)0.
05 (4
)0.
05 (4
)0.
01 (1
)60
048
0.06
(3)
0.44
(21)
0.35
(17)
0.10
(5)
0.02
(1)
0.02
(1)
650
520.
02 (1
)0.
17 (9
)0.
48 (2
5)0.
21 (1
1)0.
08 (4
)0.
02 (1
)0.
02 (1
)70
044
0.05
(2)
0.11
(5)
0.23
(10)
0.43
(19)
0.14
(6)
0.02
(1)
0.02
(1)
750
150.
07 (1
)0.
67 (1
0)0.
27 (4
)80
015
0.07
(1)
0.27
(4)
0.33
(5)
0.13
(2)
0.07
(1)
0.07
(1)
0.07
(1)
850
090
02
0.50
(1)
0.50
(1)
950
010
000
Age
34
56
78
910
1112
1314
1516
TL (m
m)
n30
00
350
040
00
450
130.
15 (2
)0.
38 (5
)0.
38 (5
)0.
08 (1
)50
044
0.05
(2)
0.09
(4)
0.14
(6)
0.41
(18)
0.30
(13)
0.02
(1)
550
320.
16 (5
)0.
25 (8
)0.
25 (8
)0.
28 (9
)0.
06 (2
)60
025
0.08
(2)
0.24
(6)
0.36
(9)
0.28
(7)
0.04
(1)
650
140.
07 (1
)0.
14 (2
)0.
43 (6
)0.
29 (4
)0.
07 (1
)70
016
0.13
(2)
0.50
(8)
0.19
(3)
0.06
(1)
0.13
(2)
750
100.
10 (1
)0.
10 (1
)0.
30 (3
)0.
10 (1
)0.
10 (1
)0.
10 (1
)0.
10 (1
)0.
10 (1
)80
04
0.75
(3)
0.25
(1)
850
21.
00 (2
)90
00
950
010
000
Tabl
e 2e
. 19
96, n
= 4
32
Tabl
e 2f
. 19
97, n
= 1
60
Age
34
56
78
910
1112
1314
15TL
(mm
)n
300
035
00
400
045
09
0.33
(3)
0.33
(3)
0.11
(1)
0.11
(1)
0.11
(1)
500
650.
03 (2
)0.
12 (8
)0.
28 (1
8)0.
20 (1
3)0.
18 (1
2)0.
11 (7
)0.
05 (3
)0.
03 (2
)55
058
0.12
(7)
0.31
(18)
0.26
(15)
0.14
(8)
0.09
(5)
0.05
(3)
0.03
(2)
600
620.
03 (2
)0.
05 (3
)0.
27 (1
7)0.
40 (2
5)0.
11 (7
)0.
08 (5
)0.
03 (2
)0.
02 (1
)65
056
0.09
(5)
0.25
(14)
0.34
(19)
0.18
(10)
0.09
(5)
0.02
(1)
0.02
(1)
0.02
(1)
700
180.
11 (2
)0.
44 (8
)0.
33 (6
)0.
06 (1
)0.
06 (1
)75
014
0.07
(1)
0.07
(1)
0.21
(3)
0.14
(2)
0.21
(3)
0.14
(2)
0.14
(2)
800
90.
11 (1
)0.
11 (1
)0.
11 (1
)0.
22 (2
)0.
11 (1
)0.
11 (1
)0.
22 (2
)85
01
1.00
(1)
900
095
00
1000
0
Age
34
56
78
910
1112
1314
1516
1718
2028
TL (m
m)
n30
00
350
040
00
450
160.
13 (2
)0.
38 (6
)0.
06 (1
)0.
13 (2
)0.
25 (4
)0.
06 (1
)50
016
50.
01 (1
)0.
02 (4
)0.
27 (4
4)0.
23 (3
8)0.
21 (3
5)0.
13 (2
2)0.
08 (1
4)0.
02 (4
)0.
02 (3
)55
016
70.
02 (3
)0.
17 (2
8)0.
17 (2
8)0.
19 (3
2)0.
20 (3
4)0.
14 (2
4)0.
07 (1
1)0.
02 (3
)0.
02 (3
)0.
01 (1
)60
016
50.
01 (1
)0.
04 (7
)0.
15 (2
5)0.
13 (2
1)0.
32 (5
3)0.
22 (3
7)0.
06 (1
0)0.
04 (7
)0.
01 (2
)0.
01 (1
)0.
01 (1
)65
014
90.
01 (1
)0.
06 (9
)0.
17 (2
5)0.
32 (4
8)0.
24 (3
6)0.
15 (2
2)0.
02 (3
)0.
01 (2
)0.
01 (1
)0.
01 (1
)0.
01 (1
)70
012
60.
01 (1
)0.
10 (1
3)0.
36 (4
5)0.
28 (3
5)0.
13 (1
7)0.
06 (8
)0.
03 (4
)0.
01 (1
)0.
02 (2
)75
048
0.02
(1)
0.08
(4)
0.19
(9)
0.21
(10)
0.27
(13)
0.13
(6)
0.08
(4)
0.02
(1)
800
250.
04 (1
)0.
12 (3
)0.
08 (2
)0.
20 (5
)0.
20 (5
)0.
20 (5
)0.
04 (1
)0.
04 (1
)0.
04 (1
)0.
04 (1
)85
08
0.25
(2)
0.13
(1)
0.13
(1)
0.13
(1)
0.13
(1)
0.13
(1)
0.13
(1)
900
095
00
1000
0
Tabl
e 2g
. 19
98, n
= 2
92
Tabl
e 2h
. 19
99, n
= 8
69
Age
34
56
78
910
1112
1314
1516
1718
1920
2123
TL (m
m)
n30
00
350
80.
63 (5
)0.
13 (1
)0.
25 (2
)40
011
0.18
(2)
0.73
(8)
0.09
(1)
450
390.
03 (1
)0.
69 (2
7)0.
15 (6
)0.
10 (4
)0.
03 (1
)50
016
20.
38 (6
2)0.
17 (2
8)0.
19 (3
1)0.
10 (1
7)0.
07 (1
2)0.
03 (5
)0.
01 (2
)0.
02 (3
)0.
01 (1
)0.
01 (1
)55
014
60.
23 (3
4)0.
14 (2
0)0.
22 (3
2)0.
14 (2
1)0.
10 (1
5)0.
08 (1
1)0.
05 (7
)0.
03 (5
)0.
01 (1
)60
012
40.
08 (1
0)0.
07 (9
)0.
27 (3
4)0.
15 (1
8)0.
13 (1
6)0.
11 (1
4)0.
08 (1
0)0.
09 (1
1)0.
01 (1
)0.
01 (1
)65
011
50.
01 (1
)0.
26 (3
0)0.
17 (1
9)0.
14 (1
6)0.
14 (1
6)0.
14 (1
6)0.
09 (1
0)0.
05 (6
)0.
01 (1
)70
010
20.
08 (8
)0.
18 (1
8)0.
23 (2
3)0.
21 (2
1)0.
15 (1
5)0.
10 (1
0)0.
05 (5
)0.
01 (1
)0.
01 (1
)75
051
0.04
(2)
0.14
(7)
0.31
(16)
0.14
(7)
0.14
(7)
0.08
(4)
0.06
(3)
0.04
(2)
0.06
(3)
800
280.
04 (1
)0.
07 (2
)0.
18 (5
)0.
11 (3
)0.
21 (6
)0.
14 (4
)0.
21 (6
)0.
04 (1
)85
08
0.13
(1)
0.13
(1)
0.13
(1)
0.13
(1)
0.13
(1)
0.25
(2)
0.13
(1)
900
095
00
1000
0
Age
23
45
67
89
1011
1213
1415
1617
1819
2021
2427
TL (m
m)
n30
06
0.83
(5)
0.17
(1)
350
120.
17 (2
)0.
08 (1
)0.
50 (6
)0.
25 (3
)40
025
0.16
(4)
0.48
(12)
0.28
(7)
0.04
(1)
0.04
(1)
450
111
0.01
(1)
0.14
(15)
0.62
(69)
0.20
(22)
0.01
(1)
0.01
(1)
0.02
(2)
500
487
0.05
(24)
0.63
(305
)0.
17 (8
2)0.
09 (4
2)0.
03 (1
5)0.
02 (9
)0.
01 (4
)0.
01 (3
)0.
00 (2
)0.
00 (1
)55
043
10.
02 (9
)0.
56 (2
42)
0.13
(55)
0.17
(74)
0.04
(19)
0.02
(10)
0.02
(8)
0.01
(6)
0.01
(6)
0.00
(1)
0.00
(1)
600
271
0.00
(1)
0.32
(88)
0.19
(51)
0.25
(69)
0.11
(29)
0.03
(7)
0.04
(12)
0.04
(12)
0.01
(2)
650
265
0.06
(15)
0.07
(19)
0.38
(101
)0.
17 (4
5)0.
07 (1
9)0.
15 (4
0)0.
06 (1
6)0.
03 (8
)0.
01 (2
)70
020
60.
00 (1
)0.
21 (4
3)0.
23 (4
8)0.
12 (2
4)0.
22 (4
6)0.
12 (2
4)0.
04 (8
)0.
02 (4
)0.
02 (4
)0.
01 (2
)0.
01 (2
)75
098
0.02
(2)
0.05
(5)
0.05
(5)
0.09
(9)
0.23
(23)
0.20
(20)
0.15
(15)
0.06
(6)
0.03
(3)
0.03
(3)
0.04
(4)
0.03
(3)
800
670.
01 (1
)0.
03 (2
)0.
01 (1
)0.
10 (7
)0.
18 (1
2)0.
12 (8
)0.
19 (1
3)0.
09 (6
)0.
09 (6
)0.
07 (5
)0.
01 (1
)0.
03 (2
)0.
01 (1
)0.
03 (2
)85
024
0.04
(1)
0.08
(2)
0.17
(4)
0.13
(3)
0.21
(5)
0.08
(2)
0.08
(2)
0.13
(3)
0.04
(1)
0.04
(1)
900
50.
20 (1
)0.
20 (1
)0.
20 (1
)0.
40 (2
)95
00
1000
0
Tabl
e 2j
. 20
01, n
= 2
008
Tabl
e 2i
. 20
00, n
= 7
94
Tabl
e 3.
Mer
istic
regr
essi
ons f
or re
d gr
oupe
r fro
m th
e ea
ster
n G
ulf o
f Mex
ico:
199
2 th
roug
h 20
01.
Con
vers
ion
& U
nits
Eq
uatio
n Sa
mpl
e Si
ze r
2 val
ues
Dat
a R
ange
s fr
om F
L (m
m) t
o TL
(mm
)
TL (m
m) =
1.0
4 *
FL (m
m) +
3.4
7
2066
0.98
TL (m
m):
299
to 9
54
FL (m
m):
290
to 9
10
fr
om T
L (m
m) t
o W
. Wt (
kg)
W
. Wt (
kg) =
5.3
2x10
-9 *
(TL
^3.1
6)
18
77
0.
92
TL
(mm
): 28
5 to
954
W
. Wt (
mm
): 0.
30 to
16.
96
from
FL
(mm
) to
W. W
t (kg
)
W. W
t (kg
) = 5
.48x
10-9
* (F
L ^3
.18)
1434
0.95
FL: 2
90 to
910
W
. Wt:
0.40
to 1
6.96
from
TL
(mm
) to
G. W
t (kg
)
G. W
t (kg
) = 5
.71x
10-
8 *
(TL
^2.7
9)
47
3 0.
89
TL
(mm
): 40
3 to
980
G
. Wt (
mm
): 0.
82 to
15.
05
from
FL
(mm
) to
G. W
t (kg
)
G. W
t (kg
) = 2
.32x
10-
9 *
(FL
^3.3
1)
39
2 0.
92
FL
(mm
): 44
3 to
890
G
. Wt (
mm
): 0.
91 to
13.
15
fr
om T
L (m
m) t
o O
tolit
h W
t (g)
Oto
lith
Wt (
g) =
6.3
2 x
10-7
* (T
L ^
2.03
)
1215
0.86
TL (m
m):
285
to 9
00
Oto
lith
Wt (
g): 0
.06
to 1
.01
from
FL
(mm
) to
Oto
lith
Wt (
g)
O
tolit
h W
t (g)
= 3
.72
x 10
-7 *
(FL
^ 2.
13)
31
29
0.
82
FL
(mm
): 29
0 to
890
O
tolit
h W
t (g)
: 0.0
5 to
0.9
5
from
Age
(yea
rs)
to O
tolit
h W
t (g)
Oto
lith
Wt (
g) =
0.0
3 *
Age
(yea
rs) +
0.0
5
3644
0.72
Age
(yea
rs):
2 to
29
Oto
lith
Wt (
g): 0
.06
to 1
.01

Table 4. Growth curve parameters for biological ages and lengths at capture for red grouper by
different gear types and for different growth curves from the eastern Gulf of Mexico: 1992 – 2001 (scientific survey samples, n = 334, added to all data to calculate von Bertalanffy parameters).
Mode and Gear Sample Size L∞ k to
All data 6073 923 0.11 -3.21
Long-line 2911 1026 0.07 -6.44 Hand-line 1594 943 0.10 -3.51
Trap 271 944 0.07 -8.50
Recreational 963 960 0.11 -2.45
Ad-hoc 6073 920 0.16 0.00
Schnute and Richards: y∞ = 1009, a = 1.52, b = 1.26, c = 0.34, α = 16.77 Table 5. Maximum likelihood test ratios, chi-square values, and p values for comparisons of the
von Bertalanffy growth curves between pairs of different modes and gears for red grouper from the eastern Gulf of Mexico: 1992-2001.
Comparison
Maximum Likelihood Ratio
Chi-Square
Value
p value
Commercial long-line vs. hand-line
17.70
5.07x 10⁻⁴
p < 0.0001
Commercial hand-line vs trap
42.67
2.89 x 10⁻⁹
p < 0.0001
Commercial Hand-line vs. Recreational
27.48
4.67 x 10⁻⁶
p < 0.0001
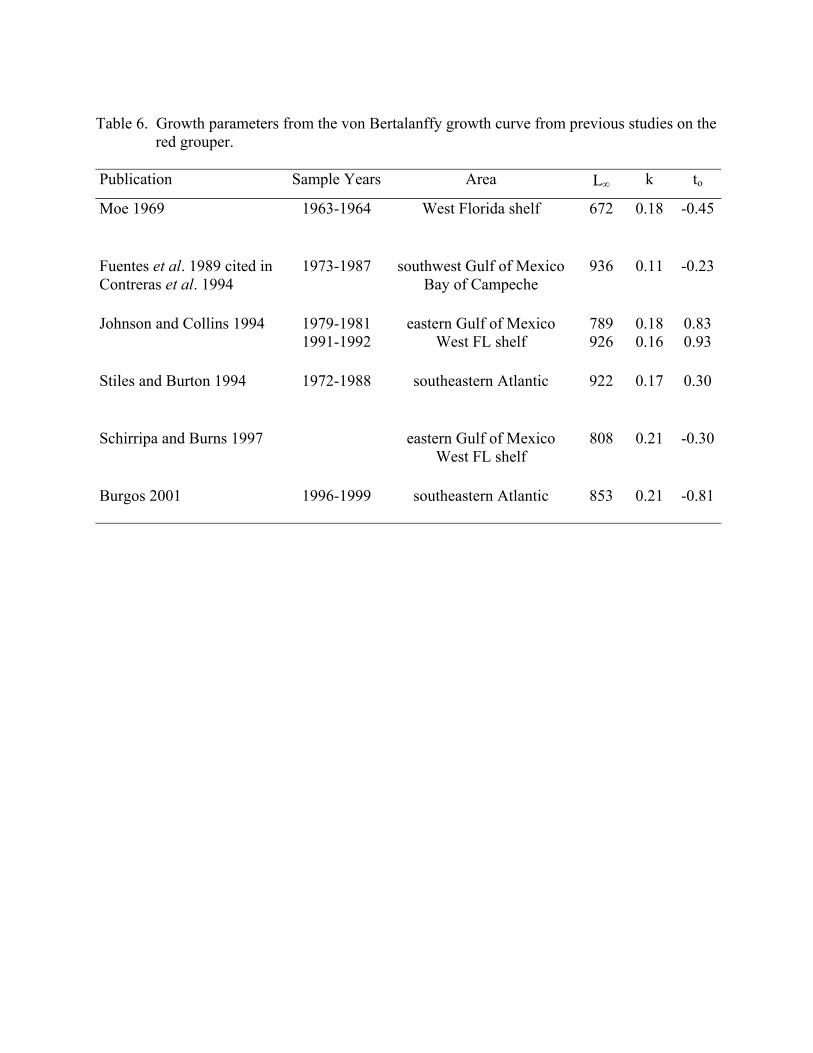
Table 6. Growth parameters from the von Bertalanffy growth curve from previous studies on the
red grouper. Publication Sample Years Area L∞ k to
Moe 1969
1963-1964 West Florida shelf 672 0.18 -0.45
Fuentes et al. 1989 cited in Contreras et al. 1994
1973-1987 southwest Gulf of Mexico Bay of Campeche
936 0.11 -0.23
Johnson and Collins 1994 1979-1981
1991-1992 eastern Gulf of Mexico
West FL shelf 789 926
0.18 0.16
0.83 0.93
Stiles and Burton 1994
1972-1988 southeastern Atlantic 922 0.17 0.30
Schirripa and Burns 1997 eastern Gulf of Mexico
West FL shelf 808 0.21 -0.30
Burgos 2001
1996-1999 southeastern Atlantic 853 0.21 -0.81

List of Figure Captions 1 Examples of the ageing structure from a red grouper (a) whole otolith and (b) sectioned
otolith. The core (c), sulcus acousiticus (d), band counts, edge type, and age are identified for each example.
2 Percentages of red grouper otolith samples collected from 1992 to 2001 (n = 6075) by (a) sampling programs, (b) fishing modes, and (c) commercial fishing sector by gear type.
3 Age bias between primary and secondary reader for red grouper; a. 1992 to 2001, n = 3454, b. 1992-1996, n = 1627. Mean age of secondary reader given age of primary reader, error bars are ± 95 % Confidence Intervals.
4 Length frequencies for red grouper sampled for otoliths from the eastern Gulf of Mexico: 1992 - 2001.
5 Age frequencies for red grouper from the eastern Gulf of Mexico: 1992 - 2001, lines indicate dominant year classes that exceed 30% of the age structure in at least one year and is the most abundant for at least two years.
6 Comparisons of growth curves by mode and gear (commercial long-line, n = 2911; commercial hand-line, n = 1594; commercial trap, n = 271; recreational: n = 962) for red grouper sampled from the eastern Gulf of Mexico: 1992 - 2001.
7 Comparison of growth curves: von Bertalanffy (unconstrained), ad hoc fit - von Bertalanffy (forced through origin), and Schnute and Richards for all red grouper samples from the eastern Gulf of Mexico: 1992-2001.
8 Size at age scattergrams by year for red grouper sampled for otoliths in the eastern Gulf of Mexico.
9 Comparison of depths fished by mode and gear for red grouper from the eastern Gulf of Mexico from 1992 to 2001: a. commercial long-line, n = 1851; b. commercial hand-line, n = 750; c. commercial trap, n = 97; and d. recreational, n = 37.
10 Mean biological age ± standard deviation (estimated only when more than 10 fish were present within a size category): commercial hand-line (n = 1594, gray circle), commercial long-line (n = 2911, black circle), commercial trap (n = 271, open circle), recreational samples, n = 962, black triangle).
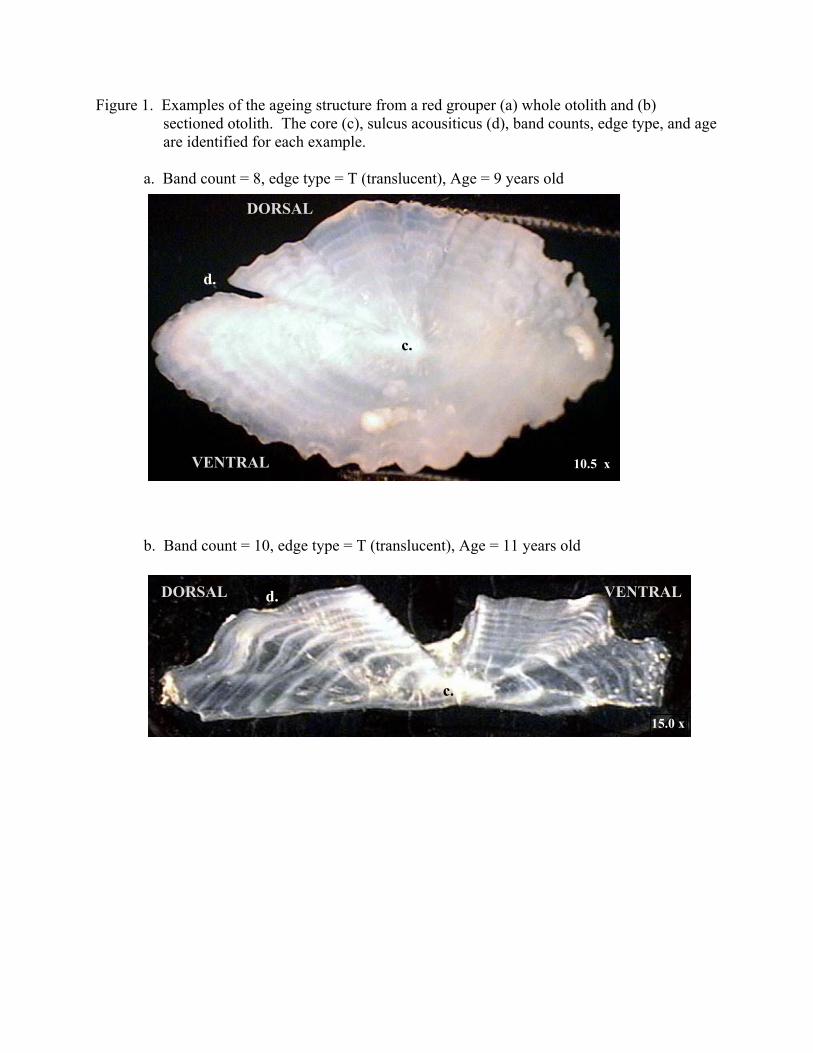
Figure 1. Examples of the ageing structure from a red grouper (a) whole otolith and (b) sectioned otolith. The core (c), sulcus acousiticus (d), band counts, edge type, and age are identified for each example.
a. Band count = 8, edge type = T (translucent), Age = 9 years old
b. Band count = 10, edge type = T (translucent), Age = 11 years old
15.0 x
c.
10.5 x
c.
d.
d.
DORSAL
VENTRAL
DORSAL VENTRAL

Figure 2. Percentages of red grouper otolith samples collected from 1992 to 2001 (n = 6075) by (a) sampling programs, (b) fishing modes, and (c) commercial fishing sector by gear type.
a. Sampling program
Scientific Survey9%
Beaufort Head Boat3%
MRFSS1%Trip Interview
Program87%
b. Fishing modes Recreational
16%
Scientific Survey6%
Commercial78%
c. Commercial mode by gear
Hand-Line33%
Trap5%
Long-Line62%
0
5
10
15
20
25
30
35
40
1 2 3 4 5 6 7 8 9 10 11 12 13 14 15 16 17 18 19 20 21 22 23 24 25 26 27 28 29 30
Primary Reader: L.L.C.
Seco
ndar
y R
eade
r: J.
M.
APE = 3.4%CV = 4.8%± 1 yr = 87 %± 2 yr = 95 %
a.
0
5
10
15
20
25
30
35
40
1 2 3 4 5 6 7 8 9 10 11 12 13 14 15 16 17 18 19 20 21 22 23 24 25 26 27 28 29 30Primary Reader: L.L.C.
Seco
ndar
y R
eade
r: Jo
hnso
nFigure 3. Age bias between primary and secondary reader for red grouper; a. 1992 to 2001, n = 3454, b. 1992-1996, n = 1627. Mean age of secondary reader given age of primary reader, error bars are ± 95 % Confidence Intervals.
APE = 4.7%CV = 6.7%± 1 yr = 89%± 2 yr = 98%
b.
1997, n = 160
0
10
20
30
300-349
350-399
400-449
450-499
500-549
550-599
600-649
650-699
700-749
750-799
800-849
850-899
900-949
950-999
Total Length (mm)
1999 , n = 869
0
10
20
30
300-349
350-399
400-449
450-499
500-549
550-599
600-649
650-699
700-749
750-799
800-849
850-899
900-949
950-999
Total Length (mm)
2000, n = 794
0
10
20
30
300-349
350-399
400-449
450-499
500-549
550-599
600-649
650-699
700-749
750-799
800-849
850-899
900-949
950-999
Total Length (mm)
1993, n = 405
0
10
20
30
300-349
350-399
400-449
450-499
500-549
550-599
600-649
650-699
700-749
750-799
800-849
850-899
900-949
950-999
Total Length (mm)
1994, n = 341
0
10
20
30
300-349
350-399
400-449
450-499
500-549
550-599
600-649
650-699
700-749
750-799
800-849
850-899
900-949
950-999
Total Length (mm)
1998 , n = 292
0
10
20
30
300-349
350-399
400-449
450-499
500-549
550-599
600-649
650-699
700-749
750-799
800-849
850-899
900-949
950-999
Total Length (mm)
1995 , n = 526
0
10
20
30
300-349
350-399
400-449
450-499
500-549
550-599
600-649
650-699
700-749
750-799
800-849
850-899
900-949
950-999
Total Length (mm)
1996 , n = 430
0
10
20
30
300-349
350-399
400-449
450-499
500-549
550-599
600-649
650-699
700-749
750-799
800-849
850-899
900-949
950-999
Total Length (mm)
1992, n = 248
0
10
20
30
300-349
350-399
400-449
450-499
500-549
550-599
600-649
650-699
700-749
750-799
800-849
850-899
900-949
950-999
Total Length (mm)
2001, n = 2008
0
10
20
30
300-349
350-399
400-449
450-499
500-549
550-599
600-649
650-699
700-749
750-799
800-849
850-899
900-949
950-999
Total Length (mm)
Figure 4. Length frequencies for red grouper sampled for otoliths from the eastern Gulf of Mexico: 1992 - 2001.
1992, n=248
0
10
20
30
40
1 2 3 4 5 6 7 8 9 10 11 12 13 14 15 16Age
1993, n=405
0
10
20
30
40
1 2 3 4 5 6 7 8 9 10 11 12 13 14 15 16Age
1994, n=341
0
10
20
30
40
1 2 3 4 5 6 7 8 9 10 11 12 13 14 15 16Age
1995, n=526
0
10
20
30
40
1 2 3 4 5 6 7 8 9 10 11 12 13 14 15 16Age
1996, n=430
0
10
20
30
40
1 2 3 4 5 6 7 8 9 10 11 12 13 14 15 16Age
1997, n=160
0
10
20
30
40
1 2 3 4 5 6 7 8 9 10 11 12 13 14 15 16Age
1998, n = 292
0
10
20
30
40
1 2 3 4 5 6 7 8 9 10 11 12 13 14 15 16Age
1999, n = 869
0
10
20
30
40
1 2 3 4 5 6 7 8 9 10 11 12 13 14 15 16Age
2000, n = 794
0
10
20
30
40
1 2 3 4 5 6 7 8 9 10 11 12 13 14 15 16Age
2001, n = 2008
0
10
20
30
40
1 2 3 4 5 6 7 8 9 10 11 12 13 14 15 16Age
1990
1989
1996
1990
1989
Figure 5. Age frequencies for red grouper from the eastern Gulf of Mexico: 1992 - 2001, lines indicate dominant year classes that exceed 30% of the age structure in at least one year and is the most abundant for at least two years.
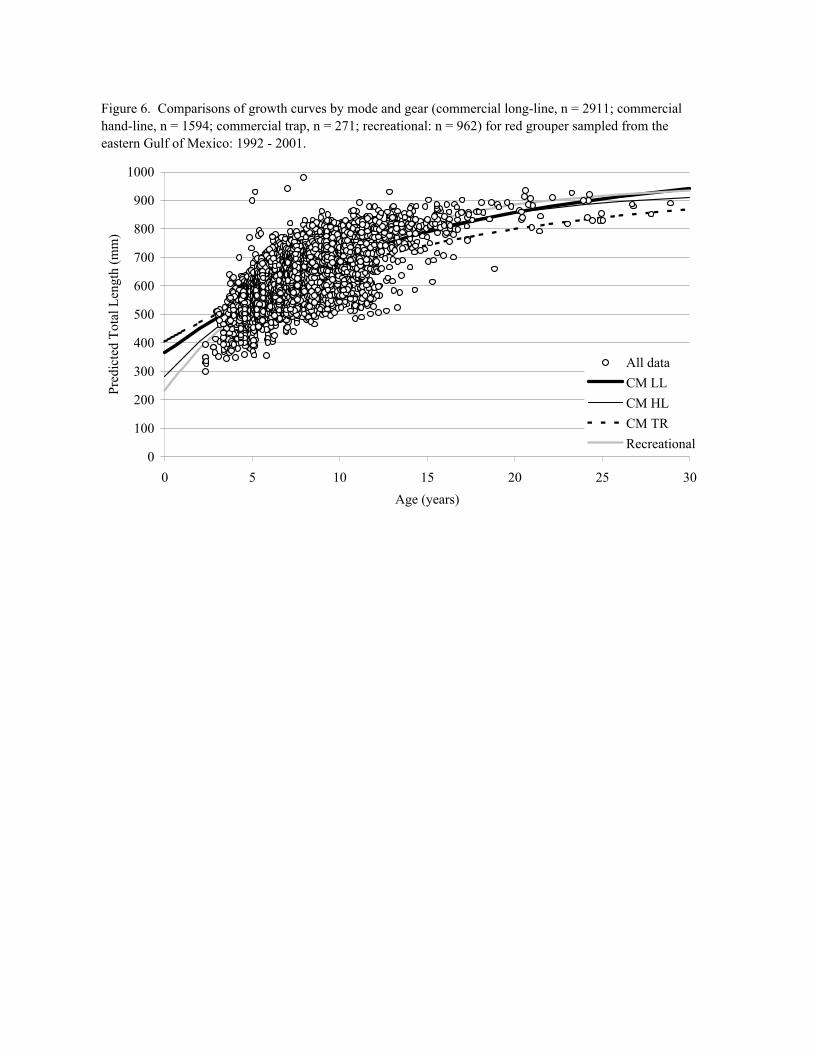
Figure 6. Comparisons of growth curves by mode and gear (commercial long-line, n = 2911; commercial hand-line, n = 1594; commercial trap, n = 271; recreational: n = 962) for red grouper sampled from the eastern Gulf of Mexico: 1992 - 2001.
0
100
200
300
400
500
600
700
800
900
1000
0 5 10 15 20 25 30Age (years)
Pred
icte
d To
tal L
engt
h (m
m)
All dataCM LLCM HLCM TRRecreational
0
100
200
300
400
500
600
700
800
900
1000
0 5 10 15 20 25 30Age (years)
Tota
l len
gth
(mm
)
All dataSchnute and Richards curvevon Bertalanffy curveAdd-hoc fit
Figure 7. Comparison of growth curves: von Bertalanffy (unconstrained), ad hoc fit - von Bertalanffy (forced through origin), and Schnute and Richards for all red grouper samples from the eastern Gulf of Mexico: 1992-2001.
1997, n = 160
300
400
500
600
700
800
900
1000
1 2 3 4 5 6 7 8 9 10 11 12 13 14 15 16 17 18 19 20 21 22 23 24 25 26 27 28 29 30
Age (years)
TL (m
m)
1999, n = 869
300
400
500
600
700
800
900
1000
1 2 3 4 5 6 7 8 9 10 11 12 13 14 15 16 17 18 19 20 21 22 23 24 25 26 27 28 29 30Age (years)
TL (m
m)
1998, n = 292
300
400
500
600
700
800
900
1000
1 2 3 4 5 6 7 8 9 10 11 12 13 14 15 16 17 18 19 20 21 22 23 24 25 26 27 28 29 30Age (years)
TL (m
m)
2000, n = 795
300
400
500
600
700
800
900
1000
1 2 3 4 5 6 7 8 9 10 11 12 13 14 15 16 17 18 19 20 21 22 23 24 25 26 27 28 29 30
Age (years)
TL (m
m)
1996, n = 430
300
400
500
600
700
800
900
1000
1 2 3 4 5 6 7 8 9 10 11 12 13 14 15 16 17 18 19 20 21 22 23 24 25 26 27 28 29 30
Age (years)
TL (m
m)
1993, n = 405
300
400
500
600
700
800
900
1000
1 2 3 4 5 6 7 8 9 10 11 12 13 14 15 16 17 18 19 20 21 22 23 24 25 26 27 28 29 30Age (years)
TL (m
m)
1994, n = 341
300
400
500
600
700
800
900
1000
1 2 3 4 5 6 7 8 9 10 11 12 13 14 15 16 17 18 19 20 21 22 23 24 25 26 27 28 29 30Age (years)
TL (m
m)
1995, n = 526
300
400
500
600
700
800
900
1000
1 2 3 4 5 6 7 8 9 10 11 12 13 14 15 16 17 18 19 20 21 22 23 24 25 26 27 28 29 30
Age (years)
TL (m
m)
1992, n = 248
300
400
500
600
700
800
900
1000
1 2 3 4 5 6 7 8 9 10 11 12 13 14 15 16 17 18 19 20 21 22 23 24 25 26 27 28 29 30Age (years)
TL (m
m)
2001, n = 2008
300
400
500
600
700
800
900
1000
1 2 3 4 5 6 7 8 9 10 11 12 13 14 15 16 17 18 19 20 21 22 23 24 25 26 27 28 29 30
Age (years)
TL (m
m)
Figure 8. Size at age scattergrams by year for red grouper sampled for otoliths in the eastern Gulf of Mexico.

a. Commercial long-line, n = 1851
0102030405060
0- 5
6-10
11-15
16-20
21-25
26-30
31-35
36-40
41-45
46-50
51-55
56-60
61-65
66-70
71-75
76-80
81-85
86-90
91-95
96-100
101-105
106-110
Depth (meters)
Perc
ent F
requ
ency
Figure 9. Comparison of depths fished by mode and gear for red grouper from the eastern Gulf of Mexico from 1992 to 2001: a. commercial long-line, b. commercial hand-line, c. commercial trap, and d. recreational.
b. Commercial hand-line , n = 750
0102030405060
0- 5
6-10
11-15
16-20
21-25
26-30
31-35
36-40
41-45
46-50
51-55
56-60
61-65
66-70
71-75
76-80
81-85
86-90
91-95
96-100
101-105
106-110
Depth (meters)
Perc
ent F
requ
ency
c. Commercial trap, n = 97
0102030405060
0- 5
6-10
11-15
16-20
21-25
26-30
31-35
36-40
41-45
46-50
51-55
56-60
61-65
66-70
71-75
76-80
81-85
86-90
91-95
96-100
101-105
106-110
Depth (meters)
Perc
ent F
requ
ency
37 m = 20 ftm
37 m = 20 ftm
73 m = 40 ftm
37 m = 20 ftm
73 m = 40 ftm
d. Recreational, n = 37
0102030405060
0- 5
6-10
11-15
16-20
21-25
26-30
31-35
36-40
41-45
46-50
51-55
56-60
61-65
66-70
71-75
76-80
81-85
86-90
91-95
96-100
101-105
106-110
Depth (meters)
Perc
ent F
requ
ency
456789
10111213141516171819202122
450-499 500-549 550-599 600-649 650-699 700-749 750-799 800-849 850-899Total Length (mm)
Age
(bio
logi
cal)
Figure 10. Mean biological age ± standard deviation (estimated only when more than 10 fish were present within a size category): commercial hand-line (n = 1594, gray circle), commercial long-line (n = 2911, black circle), commercial trap (n = 271, open circle), recreational samples, n = 962, black triangle).


![Bridled grouper; Fr - Mérou bride; Sp - Mero embridado.164 FAO Species Catalogue Vol. 16 Epinephelus heniochus Fowler, 1904:522, pl. 18 (type locality: Padang, Sumatra [Sumatera])](https://img.pdfslide.us/doc/110x75/5fddd46682155475ff159cc0/bridled-grouper-fr-mrou-bride-sp-mero-164-fao-species-catalogue-vol-16.jpg)