Embed Size (px)
Citation preview

Ann Oper ResDOI 10.1007/s10479-011-0925-0
Red Blood Cell Transfusion Safety: Probabilistic RiskAssessment and Cost/ Benefits of Risk ReductionStrategies
Anthony D. Slonim · Ebru K. Bish · Ryan S. Xie
© Springer Science+Business Media, LLC 2011
Abstract While transfusion safety, particularly with respect to transfusion-transmitted in-fectious diseases, has improved dramatically over the past several decades, progress in otherclinical processes of blood product transfusion continue with highly variable practices andhuman errors that contribute to adverse outcomes. In this paper, we study the adverse out-come risk in red blood cell (RBC) transfusion in the United States using Probabilistic RiskAssessment (PRA). PRA allows us to map, in a comprehensive manner, the various typesof events that may contribute to an adverse outcome, including socio-technical factors suchas the risk coming from human error; and allows us to formalize the logical relationshipsamong those events and the adverse outcome risk. We utilize the PRA model to assess therisk to the patient from RBC transfusion in the United States, to identify the major riskpoints in the transfusion process, and to evaluate the costs and benefits of several risk reduc-tion strategies. Our data come from published studies in the medical literature.
We find that the risk of a potentially severe outcome (e.g., mortality, major injury or otherserious long-term consequences, a life threatening incident) from RBC transfusion lies inthe interval [10.4327,511.2] per 100,000 units of RBC transfused, with a point estimate of25.4527. The leading causes of severe outcomes include circulatory overload and bacterialinfection. Acute hemolytic reactions, which are mainly caused by erroneous administrationof the blood, also contribute significantly to severe outcomes of transfusion. Interestingly,our analysis indicates that an intervention that is targeted at reducing the risk of the erro-neous administration of blood (through training programs or technology investments) hasa higher potential impact in reducing the severe outcome risk from RBC transfusion than
A.D. SlonimCarilion Medical Center, 1906 Belleview Avenue, Roanoke, VA 24014, USAe-mail: [email protected]
E.K. Bish (�) · R.S. XieGrado Department of Industrial and Systems Engineering, Virginia Polytechnic Institute and StateUniversity, Blacksburg, VA 24061-0118, USAe-mail: [email protected]
R.S. Xiee-mail: [email protected]
Ann Oper Res
additional screening to further reduce the risk of transfusion-transmitted viral infections, ofHIV 1-2, hepatitis B, and hepatitis C, which the lay public fears most. Furthermore, suchan error reduction program will be more cost-effective than the additional screening of do-nated blood. Our study provides guidelines for public policy to improve the safety of RBCtransfusion in the United States.
Keywords Transfusion · Patient safety · Risk · Probabilistic risk assessment
1 Introduction and Motivation
Modern blood transfusion therapy started in 1901, with the discovery of the major bloodgroups by Landsteiner; and for over 50 years, the United States (US) has had an organizedblood collection system. Approximately 10–14 million red blood cell (RBC) units and 1.5million platelet transfusions are administered in the US annually (Despotis et al. 2008).These transfusions are provided to patients across all age groups, multiple diagnoses, and ina variety of settings. Unfortunately, today there remains a definable risk associated with thetransfusion of blood and blood products. These risks may occur in both the pre-clinical andclinical dimensions of the transfusion process, from blood collection from a donor throughblood administration to a patient.
Transfusion safety is concerned with identifying and mitigating the hazards associatedwith delivering transfusion care to patients. The potential hazards of blood transfusion canbe grouped into several broad categories including infections, immune reactions, humanand testing errors (Kleinman et al. 2003a, 2003b). In the last several decades, tremendousconcern about blood safety has arisen both from the lay public and among professionals.As a result, dramatic improvements in transfusion safety and a reduction of transfusionrelated human immunodeficiency virus (HIV 1-2) and hepatitis C virus (HCV), the two mostsubstantial transfusion-transmitted infections of the 20th century, have occurred (Dzik andCooley 2003). However, progress in other areas of transfusion safety has lagged behind. Inparticular, the clinical processes of blood product transfusion continue with highly variablepractices and human errors that may contribute, albeit rarely, to adverse outcomes. Theseevent types occur infrequently and randomly. As a result, it is extremely difficult to identifythese events and understand their individual impact on an adverse outcome in transfusionwithout a comprehensive quantitative model that draws upon data that encompasses multipleinstitutions. Previous research regarding transfusion risks has been limited by descriptivestudies that investigate one or another type of risk, focusing on a small number of casesand without considering the interactions among these risks and their relationship, if any,to human errors (see Dodd 1994; Despotis et al. 2008; Goodnough 2003; Goodnough etal. 2003; Greenwalt 1997, and Kleinman et al. 2003a, 2003b for reviews, as well as thereferences therein). The result is what seems to be an endless array of mandated screeningtests and procedures focused on the collection of blood to reduce what are already very lowfrequency risk events to even lower occurrence rates.
In this paper, we develop and analyze a comprehensive logical model designed to quan-tify the risk from transfusion of RBC in the United States. In particular, we use an engineer-ing methodology known as Probabilistic Risk Assessment (PRA) or Fault Tree Analysis,which is a quantitative and deductive process analysis tool that can be used for risk assess-ment and management. While PRA has been commonly used in high-risk industries, suchas nuclear power, aviation, and aerospace, to investigate rare events that have potentiallydevastating outcomes (see, for instance, Kumamoto and Henley 2000), its use in healthcarehas been limited (see Stockwell and Slonim 2006 for related discussion).

Ann Oper Res
Utilizing PRA, we develop a comprehensive risk model of RBC transfusion by consider-ing the relationship between the various risk points (events) and an adverse transfusion out-come. We determine the contribution of each event to an adverse transfusion outcome andidentify the “critical points” that are the major contributors to the overall risk. This analysisthen allows us to identify targeted interventions and evaluate their costs and benefits for riskreduction within a systematic framework.
Our work brings to public attention that a more rigorous testing scheme would have littleimpact on the overall transfusion risk, as we find the current testing scheme in the US to bequite effective. In other words, none of the viral infections for transfusion that the lay publicfears, including HIV 1-2, and the hepatitis B and C viruses, contribute significantly to thecurrent transfusion risk. While most leading causes of transfusion risks (i.e., febrile non-hemolytic reactions, allergic reactions, and RBC alloimmunization) result in clinically mildoutcomes, the severe transfusion risks are caused mostly by circulatory overload and bac-terial infection. In addition, acute reactions, caused by errors in various stages of the bloodtransfusion process, also contribute significantly to transfusion risk. Our study shows thatinterventions targeted at reducing the erroneous administration of blood will have a higherimpact on the adverse outcome risk from RBC transfusion than aggressive screening that canfurther reduce the prevalence of viral infections, including HIV 1-2, hepatitis B and hepatitisC, in donated blood. Furthermore, there are error reduction programs for administration ofblood, such as training/process improvement programs, or technology investments, such asbarcode identification systems for compatibility testing and administration, that have beenshown to be quite effective in various pilot studies; and such programs will be more cost-effective than a more aggressive screening of donated blood. Consequently, attention andresources that are focused on the blood administration process, rather than the blood screen-ing process, will provide the highest risk reduction in RBC transfusion in the US, especiallywhen limited resources are an important factor in the selection of transfusion safety pro-grams. Thus, our study provides guidelines to improve the safety of RBC transfusion in theUnited States, which, we hope, future transfusion safety researchers and practitioners willfind valuable. These are the main contributions of this paper.
The remainder of this paper is organized as follows. In Sect. 2, we provide the detailsof our PRA models. Then Sect. 3 discusses the quantitative results obtained from the PRAanalysis, including estimates of an adverse outcome risk from RBC transfusion in the US,and identifies the critical risk points in the transfusion process. Motivated by these criticalrisk points, in Sect. 4, we compare various risk reduction strategies that are aimed at variousprocesses of transfusion, including blood screening and blood administration, and analyzetheir costs and effectiveness in reducing the transfusion risk. Finally, in Sect. 5 we provideour conclusions and suggestions for improving transfusion safety, and present ideas for fu-ture research in this area. To facilitate the exposition, some mathematical derivations, tables,and data-related discussions are relegated to the Appendix.
2 The blood transfusion risk analysis model
2.1 Study scope
We focus on the RBC transfusion risk in the United States and consider all broad cate-gories of transfusion risk, including infections, immune reactions, human and testing errors(Kleinman et al. 2003a, 2003b), as detailed in Sect. 2.2. We utilize the Probabilistic RiskAssessment (PRA) methodology, and construct two PRA models of transfusion risk: (i) the

Ann Oper Res
“overall risk” model, which includes both the mild outcomes and the severe outcomes, astransfusion risk; and (ii) the “severe risk” model, which only includes risks that result ina severe outcome (e.g., mortality, major injury or other serious long-term consequences, alife threatening incident). The findings from both models, taken together, can be valuable inreducing the risk of an adverse transfusion outcome and in improving the health outcome oftransfusion in general.
Possible events that may lead to an adverse transfusion outcome, their causes, and re-lationships used in the PRA models are carefully derived from the medical literature bycapitalizing on the various types of information available for blood transfusion practices. Inaddition, the data for the PRA models come from a synthesis of many peer-reviewed studiespublished in the medical literature that provide estimates of RBC transfusion risks in theUnited States.
Our agenda in the remainder of this section is as follows. In Sect. 2.2, we detail thetransfusion-transmitted infections and transfusion reactions that we include in our models;in Sect. 2.3, we present the PRA models; and in Sect. 2.4, we discuss the sources of the riskestimates for each transfusion infection and reaction considered.
2.2 Transfusion risks
Our model considers all broad categories of RBC transfusion risks, as detailed below.
2.2.1 Transfusion infections
As of 2007, infectious disease testing of donated blood in the US includes the routine useof conventional serologic tests for antigens or antibodies to human immunodeficiency virus(HIV), type 1 and type 2 (HIV-1 and HIV-2); hepatitis B virus (HBV); hepatitis C Virus(HCV); human t-cell lymphotropic viruses (HTLV), type 1 and type 2 (HTLV-1 and HTLV-2); and syphilis. In addition, mini-pool nucleic acid amplification testing (MP-NAT) is usedfor HIV-1, HCV, and West Nile virus (WNV) (in pools of 16 samples obtained from multipledonors). Finally, Enzyme-linked immunoassay (ELISA) test is performed for trypanosomacruzi (Chagas disease) (Stramer et al. 2007). Nevertheless, viral infection is still possibledue to “window-period transmissions,” which are the main contributors of transmission ofthese diseases in transfusion (Kleinman et al. 2003a, 2003b), as well as a chronic carrierstate, viral variants not detectable by screening assays, or laboratory error.
When the only significant transfusion risk comes from window-period transmissions,mathematical models known as the incidence/window-period models (e.g., Glynn et al.2002; Kleinman et al. 1997) become appropriate to estimate the viral infection risks. Thesemathematical models typically take into account the window period, and incidence rate inrepeat donors and first-time donors, together with their estimated weights in the population.1
Our data for viral infection risks in transfusion come mainly from incidence/window-periodmodels published in the literature, see Appendix C for details.
The medical literature indicates that the following types of infections can be transmittedin transfusion (see Appendix C for a detailed discussion of each of these infections), all ofwhich we include in our PRA models.
1As such, these mathematical models do not consider human errors occurring during the blood collection pro-cess (i.e., processing, labeling, and storage of blood). Nevertheless, given the new technology implemented atmany blood collection centers (e.g., the American Red Cross), such human errors can be considered to havea small influence on the risk of viral infections.

Ann Oper Res
(I) Viral infections
• Retroviruses: HIV 1-2 and HTLV 1-2,• Hepatitis viruses: Hepatitis A (HAV), Hepatitis B (HBV), Hepatitis C (HCV), Non-A-E
Hepatitis (Non-A-E HV) viruses,• West Nile virus (WNV),• Cytomegalovirus (CMV).
(II) Bacterial infections
• Sepsis,• Treponema pallidum (syphilis).
(III) Protozoal infections
• Plasmodium (malaria),• Babesiosis,• Chagas disease,• Toxoplasmosis.
2.2.2 Transfusion reactions
Transfusion-related reactions the medical literature indicates include the following (see Ap-pendix C for a detailed discussion of each reaction), all of which we include in our PRAmodels:
• Hemolytic reaction (acute or delayed),• Febrile nonhemolytic reaction,• Allergic reaction,• Anaphylaxis,• Transfusion-associated Graft-versus-host disease (TA-GvHD),• RBC alloimmunization,• Transfusion-related acute lung injury (TRALI),• Circulatory (volume) overload
2.3 The PRA model
We next motivate the use of the PRA in our analysis, and then discuss the development ofthe PRA models, one for the overall risk (both minor and severe outcome) and the other forthe severe risk of RBC transfusion.
Various engineering techniques can be utilized for risk analysis and management. Thetechniques most commonly used in high-risk industries include the PRA (or Fault TreeAnalysis) and the Failure Mode and Effect Analysis (FMEA) (e.g., Lyons et al. 2004;Rausand and Høyland 2004; Trammell and Wright 1999). Lyons et al. (2004) provides areview of the techniques for the analysis of human reliability in healthcare, while Rausandand Høyland (2004) and Trammell and Wright (1999) provide comparisons of a varietyof methods in systems reliability and risk assessment. The PRA is a “top-down,” deductiveapproach, which starts with an adverse outcome (the “top event;” in our case, the RBC trans-fusion risk) and identifies all possible causes of this top event from a systems perspective.It is capable of modeling complex relationships between the causes and their joint effects.On the other hand, the FMEA is a “bottom-up,” inductive approach, which considers single-point failures. The FMEA typically focuses on components of the system, rather than the

Ann Oper Res
entire system itself, and performs a more detailed analysis by systematically examining allways in which a failure can occur. As such, these two approaches are complementary, ratherthan substitutable. Once the PRA identifies the components of the system that are the majorcontributors to the top event, the FMEA nicely complements the PRA by focusing on the se-lected component(s) and performing a more detailed analysis; see, for example, Burgmeier(2002) for an FMEA of the bed-side blood administration process.
Our research objective in this paper is to identify all major contributors to the hazard,“adverse outcome in RBC transfusion,” throughout the system so that interventions can beprioritized. As such, our analysis requires a top-down approach that identifies all causes ofthis top event. Consequently, we use the PRA to construct fault tree models of the RBCtransfusion risk. Each fault tree consists of a set of “basic events,” each of which representsthe lowest level event that needs no further development (e.g., HIV risk); a “top event,”which represents the primary undesired event of interest (e.g., a mild or a severe transfusionoutcome for the overall risk model; a major transfusion outcome for the severe risk model);and a set of “intermediate events,” which are connected through logical operators. All events
are represented by the symbol “ .” The following logical operators are used in our faulttrees:
• AND gate ( ) indicates that the output event occurs if and only if all the input eventsoccur.
• OR Gate ( ) indicates that the output event occurs if and only if at least one of theinput events occurs.
• Inhibit Gate and Conditional Event ( ) indicates that the output event oc-curs if and only if all input events occur and an additional conditional event occurs, thatis, it is equivalent to an AND gate with a conditional event.
In what follows, we detail the development of the overall risk PRA model; the severerisk PRA model is similar. In the PRA model, each transfusion-transmittable infection andeach transfusion reaction discussed in Sect. 2.2 are connected to the top event by an “OR”gate, i.e., an adverse transfusion outcome will occur if the screening tests fail to detect atleast one of the infections in donated RBC, or if one of these reactions occurs during orafter transfusion, see Fig. 1 for the PRA model. As such, our risk estimates of transfusion-transmitted infections are slightly conservative, because not every unit of infected blood willcause a transfusion-transmitted infection. For example, for HIV-infected blood that is usedin transfusion, the risk of a transfusion-transmitted infection is 80–90% (e.g., Dodd et al.2002); in addition, not every unit of donated blood will be used in transfusion.
Of particular importance to our study, in terms of intervention design, are the acutehemolytic reactions, which are mainly caused by the erroneous administration of blood,i.e., by the transfusion of ABO-incompatible RBCs (e.g., transfusing a B+ blood group toan A+ blood group individual), also called “mistransfusion.” This error remains the leadingcause of fatal transfusion reactions. As such, we model this error and its consequences indetail in our PRA model, as we describe next.
2.3.1 Modeling of acute hemolytic reactions in the PRA model
Acute hemolytic reactions are mainly caused by the transfusion of ABO-incompatibleRBCs. There are also other, less common, causes that may cause acute hemolytic reac-tions, which have not been well understood in the medical literature; for completeness in

Ann Oper Res
Fig
.1T
hePR
Am
odel
ofth
eov
eral
lRB
Ctr
ansf
usio
nri
sk

Ann Oper Res
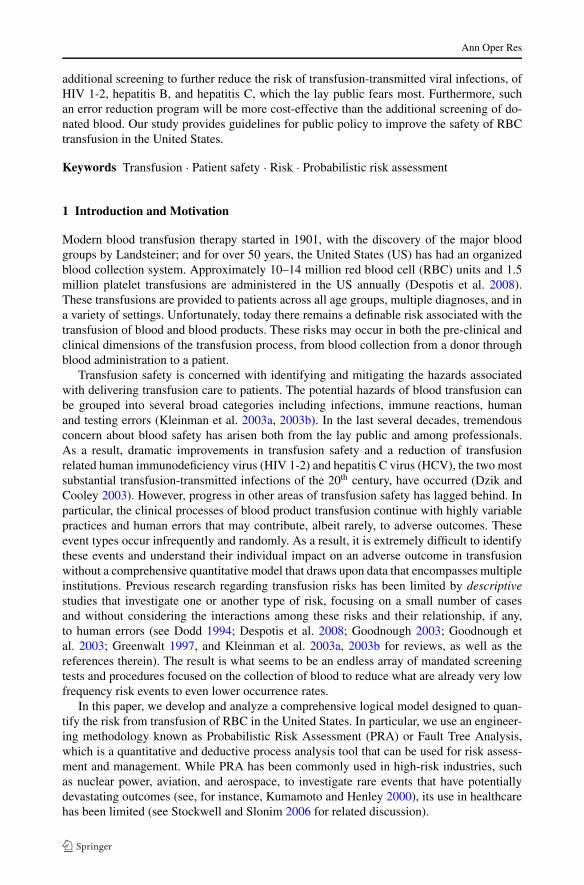
Fig. 1a The acute hemolytic reaction sub-tree
our analysis, we include those causes in our model, and refer to them as “other types ofincompatibility.”
Let events A,E, and I respectively denote the events of an acute hemolytic reaction,erroneous administration of blood, and ABO incompatibility. Throughout, we denote thecomplement of an event by the superscript c. We attribute all ABO incompatibility to theerroneous administration of RBCs, as is done in the relevant literature (e.g., Linden et al.2000). Only a portion of these erroneous administration incidents will lead to ABO incom-patibility, as a “wrong” blood group may still be compatible with the patient’s blood group(see Table 5 in Appendix A for the relationship between blood groups in terms of compat-ibility), that is, I ⊆ E. Furthermore, only a portion of the ABO incompatibility incidenceswill lead to acute hemolytic reactions2; and only a portion of these acute hemolytic reactionswill be symptomatic (asymptotic acute hemolytic reactions can only be detected through labtests). As discussed above, an acute hemolytic reaction remains possible even without ABOincompatibility (event I ), due to unexplained causes, which we refer to as “other types ofincompatibility” (event I c); see Fig. 2 for a depiction of these relationships, and the acutehemolytic reaction sub-tree in Fig. 1a for the modeling of these events and relationships inthe fault tree.
2We assume that if ABO incompatibility incidences lead to adverse effects, then these hemolytic reactionswill be acute. We did not find any study that relates ABO incompatibility to a delayed hemolytic reaction.

Ann Oper Res
Fig. 2 The relationship between events A,E, and I
We assume that the probability of an acute hemolytic reaction due to other causes (i.e.,without ABO incompatibility) remains the same whether or not there is blood administrationerror that does not lead to ABO incompatibility, i.e., P (A∩E∩I c) = P (A∩Ec) (see Fig. 2).In other words, an administration error, as long as it does not lead to ABO incompatibility,does not change the probability of an acute hemolytic reaction due to other (unexplained)causes.
Erroneous administration of blood (event E) can occur due to either non-blood bankerrors (e.g., identification error, phlebotomy error, incorrect order sent), blood bank errors(e.g., testing wrong sample, technical testing error, wrong unit issued, clerical/transcriptiontesting error, wrong unit tagged, clerical error recorded on wrong slip), or compound errorsthat occur both at the blood bank and outside the blood bank (e.g., wrong unit issued &identification error, wrong unit tagged & not detected) (Linden et al. 2000). Hence, if welet events BE, NE, and CE respectively denote the blood bank error alone, non-bloodbank error alone, and compound error (which are all mutually exclusive by definition), thenE = BE ∪ NE ∪ CE, see the acute hemolytic reaction sub-tree in Fig. 1a.
At this point, it is appropriate to compare our work with Chen et al. (2006), which con-structs a PRA tree for the top-event, “blood unit to perform transfusion is wrong,” focusingon the process of ordering and receiving of the blood from the Blood Bank. Chen et al.(2006) provides a detailed representation of this process in their PRA. Our acute hemolyticreaction sub-tree can be seen as an extension of the Chen et al. (2006) PRA model to goone level up, from an erroneous administration of RBC (or in Chen et al.’s terminology, theevent that “blood unit to perform transfusion is wrong”) to an acute hemolytic reaction, i.e.,as we state above, not every erroneous administration of RBC will lead to an acute hemolyticreaction, and we detail this relationship in our sub-tree of Fig. 1a. On the other hand, ourtreatment of a Blood Bank shipment error is not as detailed as Chen et al.’s for Blood Bankerrors. Rather, we use the results of the Linden et al. (2000) study, and focus our efforts onlinking the Blood Bank errors to acute hemolytic reactions, mainly because our objectiveis to identify the “critical” points in the entire blood transfusion process and suggest areasfor improvement from a cost-benefit point of view. The exact nature of the improvementaction could then be derived via a more detailed analysis, such as the blood order shipment

Ann Oper Res
process PRA in Chen et al. (2006) or the bed-side blood administration process FMEA inBurgmeier (2002). As such, these two studies, Chen et al. (2006) and Burgmeier (2002), arecomplementary to our study.
2.4 Risk estimates in the PRA model
Risk estimates for transfusion infections and reactions are most often calculated based ontransfusion of a single unit, rather than considering the total number of units transfusedto a patient. While this is a reasonable assumption for some risks (e.g., infection risks),it is somewhat problematic for others (e.g., risks that are dependent entirely on recipientcharacteristics, such as volume overload). Nevertheless, in our study we use the risk per unitof RBC transfused, mainly due to data availability and also because these risks can then becompared with other risks that are to be expressed on a per unit basis. Similar approacheshave been commonly used in the previous literature to study the risks associated with bloodtransfusion (e.g., Kleinman et al. 2003a, 2003b and the references therein). The analyticfocus is on the RBC transfusion in the US. As such, the data estimates, detailed below,come from published literature that is associated with the RBC transfusion in the US.
In summary, the rate of transfusion-transmitted infectious diseases are determined byincidence/window-period models commonly used in the literature; the rate of transfusionreactions come from mostly descriptive studies available in the medical literature (see Ap-pendix C for the specific data sources), with the exception of acute hemolytic reactions,which are mainly caused by the erroneous administration of blood. As such, the study ofthe risk of this particular transfusion reaction is especially important, because its rate can besignificantly reduced by interventions targeted at reducing system and/or human errors. Inthe following, we first discuss how we estimate this risk, and then provide a summary of therisks of all basic events in our fault tree.
2.4.1 Estimating the acute hemolytic reaction risk in PRA
In this section we estimate the relevant risks in the acute hemolytic reaction sub-tree in thePRA model (Fig. 1a), which is summarized in Table 7. We have,
P (A) = P ((A∩ I )∪ (A∩E ∩ I c)∪ (A∩Ec)) = P (A∩ I )+P (A∩E ∩ I c)+P (A∩Ec),
(1)where
P (A ∩ I ) = P (I)P (A | I ) = P (E)P (I | E)P (A | I,E)
= P (E)P (I | E)P (A | I )(since I ⊆ E) (2)
with P (E) = P (BE) + P (NE) + P (CE) (since events BE, NE, and CE are mutuallyexclusive).
To estimate these probabilities, we use the dataset in Linden et al. (2000), which is thelargest study on the erroneous administration of RBC in the US. In particular, Linden etal. (2000) collect data on RBC transfusions in the State of New York from 1990 through1999, corresponding to a total of 9,000,000 transfusions, and report the number of erroneousadministration of RBC, along with the underlying reasons for each case (i.e., in terms ofevents BE, NE, or CE) (see Table 6 in Appendix B for a summary of the Linden et al.2000 data). In order to adjust for the underreporting of erroneous administration cases withno ABO incompatibility, Linden et al. suggest using the compatible-to-incompatible ratio,

Ann Oper Res
P (I c | E)/P (I | E) (> 1), as an “adjustment factor,” i.e., adjusting up the number of ABO-compatible cases with erroneous administration by multiplying it with the adjustment factor.
To determine the adjustment factor, we use the blood incidence data in the US (seeTable 5 in Appendix A) to calculate the probability that the transfused unit will be com-patible with the patient’s blood group given erroneous administration, and we find thatP (I c | E) = 0.5651, leading to an adjustment factor of 0.5651/0.4349 = 1.30. We note herethat this adjustment factor is slightly different from the adjustment factor of 1.78, derived inGreenwalt (1997) and used in Linden et al. (2000). While the methodology we use to derivethis adjustment factor (see Appendix A) is exactly the same as Greenwalt’s methodology,the difference arises due to the data we use and the level of detail in the data. While Green-walt uses the blood group incidence in the US for the White race only, we use the overallblood group incidence in the US, derived by the American Red Cross from the blood groupincidences for the four major ethnic groups in the US population (White, Black, Latino, andAsian) [American Red Cross (2008)]. Furthermore, we distinguish between the presenceor absence of the D antigen in red blood cells, which leads to the designation of the bloodgroup as Rh+ or Rh−, respectively (Greenwalt aggregates Rh+ and Rh− into one numberfor each group), as this designation has further implications on compatibility. While patientswith an Rh− blood group can receive blood only from a donor with an Rh− group, patientswith an Rh+ group can receive blood from donors with either Rh+ or Rh− group. In sum-mary, while our methodology does not differ from Greenwalt’s, the more detailed data weuse provides a more accurate estimation of the compatibility-to-incompatibility ratio, andwe use this ratio (of 1.30) in our analysis. [As a note, using Linden’s adjustment factor of1.78 in our PRA models did not change our results (within four decimal point accuracy) andour conclusions remained the same.]
Our analysis leads to P (E) = 545/9,000,000, with
P (BE) = P (BE | E)P (E) = (135/461) × (545/9,000,000) = 1.773 × 10⁻⁵,
P (NE) = (259/461) × (545/9,000,000) = 3.402 × 10⁻⁵, and
P (CE) = (67/461) × (545/9,000,000) = 8.801 × 10⁻⁶.
Linden et al. (2000) further report that 117 (out of the 237 ABO incompatible casesreported) have led to acute hemolytic reactions (either symptomatic or asymptomatic). Usingthis data, and noting again that I ⊆ E, we can calculate the required probabilities for ourfault tree as follows. From (2), we have
P (A ∩ I ) = P (E)P (I | E)P (A | I ) = (545/9,000,000) × (235/545) × (117/237)
= 1.300 × 10⁻⁵.
The overall risk of acute hemolytic reaction, P (A) is estimated at 1 in 18,000 in Kleinet al. (2007). Then, from (1), and using our assumption that P (A ∩ Ec) = P (A ∩ E ∩ I c) itfollows that
P (A ∩ I c) = P (A) = P (A ∩ I ) = 1.18,000 − 1.300 × 10−5 = 4.256 × 10⁻⁵.
2.5 Summary of risk estimates in the PRA models
A summary of the risk estimates in the overall risk PRA model are provided in Table 1,where N/E refers to nonexistent.

Ann Oper Res
Table 1 Summary of transfusion-transmitted infection and reaction risks
Type of Infection/Reaction Risk of Infection/ReactionData Source
Viral Infection
HIV 1 & 2 1 in 2,000,000–3,000,000 Klein et al. (2007)
HTLV 1 & 2 1 in 1,923,000 Klein et al. (2007), Kleinman et al. (2003a, 2003b)
Hepatitis Virus
HAV 1 in 10,000,000 Dodd (1994)
HBV 1 in 100,000–200,000 Klein et al. (2007)
1 in 205,000–488,000 Dodd et al. (2002)
hence, an interval of
1 in 50,000–400,000
is considered
HCV 1 in 1,000,000–2,000,000 Klein et al. (2007)
Non-A-E HVa Probably N/E Kleinman et al. (2003a, 2003b)
WNVa Extremely low to N/E Stramer (2007)
CMVb Extremely low to N/E Kleinman et al. (2003a, 2003b)
Bacterial Infection
Sepsis 1 in 75,100 Stramer (2007)
Treponema pallidum (syphilis)aExtremely low to N/E Kleinman et al. (2003a, 2003b)
Protozoal Infection
Plasmodium (malaria) 1 in 4,000,000 Klein et al. (2007)
Chagas diseasea Extremely low to N/E Kleinman et al. (2003a, 2003b)
Babesiosis 1 in 10,000,000 Kleinman et al. (2003a, 2003b)
Toxoplasmosisa Extremely low to N/E Despotis et al. (2008)
Transfusion-related Reactions
Hemolytic reaction
Acute hemolytic reaction due to1.300 × 10−5 [see Sect. 2.4 and Appendix B]
ABO incompatibility (A ∩ I )
Acute hemolytic reaction due to4.256 × 10−5 [see Sect. 2.4 and Appendix B]
other types of incompatibility
(A ∩ I c)
Delayed hemolytic reaction 1 in 4,000 to 9,000 Klein et al. (2007), Pineda et al. (1999)
Febrile non-hemolytic reaction 1 in 300 Klein et al. (2007)
Allergic reaction 1 in 330 to 1,000 Despotis et al. (2008)
Anaphylaxis 1 in 20,000—50,000 Klein et al. (2007)
TA-GvHD Extremely low to N/E Klein et al. (2007)
RBC alloimmunization 62.1 in 100,000 Kleinman et al. (2003a, 2003b)
TRALI 1.4 to 20 in 100,000 Klein et al. (2007)
Circulatory overload 1 in 200 to 10,000 Klein et al. (2007)
aThe risks of these infections are estimated to be extremely low to nonexistent in the United States. Forcompleteness, we still keep them in our fault tree and assign them a negligible riskbWhile the true risk remains unknown, it is reasonable to conclude that it is extremely low, as discussed inAppendix C

Ann Oper Res
Table 2 Summary of serious outcome risksa
Serious Outcome Risk Note Source
Transfusion Infection
Viral Infection
HIV 1 & 2 1 in 2,000,000– all infected cases may (Klein et al. 2007)
3,000,000 suffer serious long-term
complications
HBV 1 in 2,000,000– 1 in 40 of transfusion- Klein et al. (2007),
16,000,000 transmitted HBV Kleinman et al. (2003a, 2003b)
infections lead to the
serious outcome of a
chronic carrier state
HCV 1 in 5,000,000– 20% develop significant Alter and Seeff (2000),
10,000,000 liver disease Busch (2001),
Kleinman et al. (2003a, 2003b)
Bacterial Infection 2–100 in 1,000,000 Despotis et al. (2008)
Protozoal Infection
Plasmodium (malaria) 1 in 36,363,636 fatality rate of 11% Kleinman et al. (2003a, 2003b)
Transfusion Reaction
TRALI 0.4 per million Despotis et al. (2008)
Circulatory overload 1 in 200 to 10,000 Klein et al. (2007)
Acute hemolytic 0.8–1.2 per million results of published studies Despotis et al. (2008)
reaction and FDA adverse-event
reporting
MISC (allergic 0.5–10 per million Despotis et al. (2008)
reaction, anaphylaxis,
TA-GvHD)
aTransfusion infections and reactions that are extremely unlikely to lead to a severe risk are not included
2.5.1 Serious/life threatening risks
Table 2 presents the serious outcome risk for transfusion-related infections and reactions(events that are reported in Table 1 as having extremely low to nonexistent risk are notincluded). Observe that we combine several events, including allergic reactions, anapylaxis,and TA-GvHD, into one event we refer to as “MISC:” The combined mortality rate due tothe events included in MISC is derived, via mathematical models, as 0.5 to 10 per million(Despotis et al. 2008).
3 Risk assessment
Minimal cut sets and importance measures of events play an important role in the reliabilityanalysis of fault trees. A minimal cut set is a minimal set of basic events whose failureensures the failure of the system (i.e., causes the top event to occur) (e.g., Ross 2007). Dueto the special structure of our fault tree (i.e., with each basic event directly leading to thetop event, with the exception of blood bank errors, non-blood bank errors, and compound

Ann Oper Res
errors), each basic event (with the exception of blood bank errors, non-blood bank errors, andcompound errors) constitutes a minimal cut set on its own. Nevertheless, for completeness,we report the minimal cut sets and their risk (see Appendix D).
At the basic event level, we determine the importance of each basic event, k ∈ K , which isthe conditional probability that the top event (i.e., an adverse transfusion outcome) is a resultof event k, given that the top event occurs, i.e., P (event k occurs | top event occurs). Thismeasure is also known as the criticality importance measure of the event, and is commonlyused in risk assessment of fault trees (e.g., Haimes 1998).
3.1 Overall transfusion risk (major and minor risks)
Tables 8a and 9a (in Appendix D) respectively report the importance measures and the mini-mal cut sets for the overall transfusion risk model in the “base case” (i.e., using the mid-pointwhen the risk is of interval form). Using the lower and upper bounds of the risk intervals,we find that the overall risk of RBC transfusion lies in the interval [539.9800,1233.3000]per 100,000 units of RBC transfused, with a point estimate of 600.7770 for the base case.
Specifically, this risk is mainly due to febrile non-hemolytic reactions, with a point es-timate of 333 in 100,000 units of RBC transfused, mild allergic reactions, with a pointestimate of 150.38, and RBC alloimmunization, with a point estimate of 62.10, followedby circulatory overload, delayed hemolytic reaction, and TRALI, with a combined point es-timate of 45.69 (Table 9a). Acute hemolytic reactions also contribute significantly, with apoint estimate of 5.36 in 100,000 RBC units transfused. In other words, given that a trans-fusion hazard has occurred, 50% of the time it is in the form of a febrile non-hemolyticreaction, 25% of the time it is an allergic reaction, and 10% of the time RBC alloimmu-nization. The somewhat more serious risks, of TRALI, circulatory overload, and delayedor acute hemolytic reactions, represent around 9.9% of the cause of an adverse transfusionevent. Interestingly, our analyses indicate that none of the viral infections that the lay publicfears of transfusion (e.g., HIV and HCV) is a major source of transfusion risk.
3.2 The severe outcome risk (major risk)
Tables 8b and 9b (in Appendix D) respectively report the importance measures and theminimal cut sets for the severe risk model in the “base case” (i.e., using the mid-pointwhen the risk is of interval form). The range for severe transfusion risk in the US is[10.4327,511.2055] per 100,000 units of RBC transfused, with a point estimate of 25.4527for the base case.
Specifically, the critical factors leading to mortality or other severe outcome in RBCtransfusion include circulatory overload, with a point estimate of 19.61 in 100,000 RBCunits transfused, and bacterial infection, with a point estimate of 5.10. This is followed byMISC (allergic reaction, anapylaxis, TA-GvHD), with a point estimate of 0.53, and acutehemolytic reaction, with a point estimate of 0.10. Alternatively stated, given that a serioustransfusion hazard has occurred, 77% of the time it is due to circulatory overload, 20% dueto bacterial infection, and 2% due to MISC. Acute hemolytic reactions, which are mainlycaused by erroneous administration of blood, also contribute significantly to severe out-comes of transfusion. Given that a serious transfusion hazard has occurred, 0.39% of thetime it is due to an acute hemolytic reaction. On the other hand, the two most dreadedtransfusion-transmitted infections, HIV and HCV, do not contribute significantly to the se-vere outcome risk.

Ann Oper Res
Table 3 The effect of the elimination of various risks on the overall risk and severe outcome risk of transfu-sion
Overall risk Severe outcome risk
per 100,000 units transfused per 100,000 units transfused
Current 600.7770 25.4527
HBV risk eliminated 600.3550 25.4277
HIV 1-2 and HCV risks 600.6935 25.3994
eliminated
HIV 1-2, HBV, and HCV risks 600.2498 25.3744
eliminated
All erroneous transmissions 599.5380 25.3527
eliminated
4 Risk reduction policies: cost-benefit analyses
Importance measures assist with identifying the basic level events that have the highest risksof occurrence for the outcome of interest so that improvement actions can be targeted at theseevents, provided there is room for improvement. To give an example, consider the overallrisk model, where the main contributor to the overall risk is the febrile non-hemolytic re-action, with a point estimate of 333 per 100,000 units transfused. However, while this doeshelp, from an analytic perspective in understanding what patients are suffering from, it isnot particularly helpful from a clinical perspective because clinicians already recognize howcommon this adverse event is, what needs to be done to improve its occurrence, and how un-likely it is to cause the type of safety problems that leads to significant adverse occurrences.On the other hand, as discussed below in detail, much can be done to reduce the erroneousadministration rate of blood, and there is also some room for further improving the safety ofblood. In fact, there is huge public pressure on the decision makers to allocate the majorityof the available resources into the blood safety area; and so far this has been the case. “Enor-mous resources (financial, intellectual, technological, and governmental) have been investedin improving the purity, potency, and safety of blood that is collected, tested, packaged, andlabeled as suitable for transfusion. . . . [These include] increased scrutiny of donors, highlysensitive screening testing, NAT [technology], the wide spread application of good manu-facturing practices. . . However, overall transfusion safety, largely the province of hospitals,has received far less attention” (Dzik and Cooley 2003). Consequently, in what follows,we focus our discussion on these two particular areas that have potential for improvement:blood administration and donated blood screening processes.
We first quantify the improvement potential in each of these areas using our PRA models.Table 3 provides the resulting overall risk and severe outcome risk from transfusion if (i)hepatitis B virus were eliminated, (ii) HIV 1-2 and hepatitis C virus were eliminated, (iii)HIV 1-2, hepatitis B virus, and hepatitis C virus were eliminated in the blood supply, and(iv) erroneous administrations (in terms of giving the wrong blood unit to the patient) wereeliminated.
As Table 3 demonstrates, eliminating erroneous transmissions leads to a higher potentialreduction, both in the overall risk and severe outcome risk of transfusion, than the combinedeffects of eliminating HIV 1-2, HBV, and HCV risks. These numbers demonstrate the “po-tential” for improvement if it were possible to totally eliminate these risks. While this may

Ann Oper Res
not be currently feasible, known solutions and FDA-approved technology already exist forreducing these risks, as we discuss below.
The current blood testing scheme utilizes the MP-NAT technology (in addition to anti-bodies) for HIV and HCV screening; the MP-NAT pools 16 blood samples together. Whilepooling reduces costs, it also slightly reduces the sensitivity of the test because of its dilutingeffect on virus-containing units. It is, however, possible to replace the MP-NAT for HIV andHCV with single-donation NAT (SD-NAT) (e.g., Jackson et al. 2003), increasing costs, butalso increasing the sensitivity of the test. On the other hand, for the blood administrationprocess, the decision maker can invest in new technology and/or process improvement pro-grams at blood collection centers or hospitals so as to bring down the rate of the erroneousadministration of blood (mistransfusion); some specific examples of such interventions arediscussed below. Suppose the decision maker is interested in comparing the following sce-narios:
1. The current testing scheme: MP-NAT for HIV and HCV (in addition to antibodies forHIV and HCV).
2. A less aggressive testing scheme: Replace MP-NAT for HIV and HCV with HIV p24antigen (and continue to include the antibodies for HIV and HCV)—this was the FDAapproved testing scheme before MP-NAT was licensed.
3. A more aggressive testing scheme: Replace MP-NAT for HIV and HCV with SD-NAT(and continue to include the antibodies for HIV and HCV).
4. Error reduction strategy: Perform improvement actions so that a 10-fold reduction inthe erroneous administration risk (over the current erroneous administration risk of 1 in16,500 (Linden et al. 2000)) can be achieved.
5. A more aggressive error reduction strategy: Perform improvement actions so that a 50-fold reduction in the erroneous administration risk (over the current erroneous adminis-tration risk of 1 in 16,500 (Linden et al. 2000)) can be achieved.
Scenario 1 is the current scenario studied. For the other scenarios, we rerun the PRAmodels with the modified risks,3 see Table 4 for results.
Recent studies indicate that drastic reductions in the erroneous administration risk areindeed possible through investments in technology, training, or process improvement pro-grams (see Dzik and Cooley 2003; Dzik 2005 for detailed discussion). For example, Davieset al. (2006) and Turner et al. (2003) study the benefits of a barcode patient identification sys-tem involving hand-held computers for blood sample collection, compatibility testing, andthe administration of blood in cardiac surgery and hematology outpatient and inpatient clin-ics in the United Kingdom. After the new technology was introduced and staff was trained,significant improvements were realized in checking that the blood group and unit number onthe blood pack matched the compatibility label (from 8% to 100%), and in the correct ver-bal identification of the patients (from 11.8% to 100%); similar improvements were found inother related measures. Saxena et al. (2004) describes how quality improvement efforts thatinvolve nurse training and auditing in the Los Angeles County and University of SouthernCalifornia Medical Center led to 100-percent compliance for all transfusion processes overa period of nine months; during this period no mistransfusions or blood administration near-misses have been reported. Burgmeier (2002) describes an FMEA that was implemented forthe blood transfusion process at the Good Samaritan Hospital in Dayton, Ohio. The system
3For Scenario 2, the HIV risk is estimated at 1 in 1.2 million and HCV risk at 1 in 230,000; for Scenario 3,the HIV risk is estimated at 1 in 2.8 million and HCV risk at 1 in 2.3 million (Jackson et al. 2003).

Ann Oper Res
Table 4 A cost-benefit analyses of the various interventions for blood screening and administration
Scenario Overall risk per100,000 unitstransfused
Severe outcome riskper 100,000 unitstransfused
Estimated additional cost(over the current system)
Scenario 1—current 600.7770 25.4527 –
Scenario 2—lessaggressive testing
601.1863 26.3466 — $117.8 milliona
Scenario 3—moreaggressive testing
600.5155 25.5178 $273 millionb
Scenario 4—errorreduction programwith a 10-foldreduction inmistransfusion rate
599.5843 25.4191 e.g., training/processimprovementprograms—the cost ofphysician and nursetraining, other educationalefforts, and continuedmonitoring (Burgmeier2002; Saxena et al. 2004)
Scenario 5—moreaggressive errorreduction programwith a 50-foldreduction inmistransfusion rate
599.5267 25.4064 e.g., barcode patientidentification system forblood sample collection,compatibility testing, andthe administration ofblood—the investmentcost for a 1500-bedhospital is $0.75 million(Turner et al. 2003).
aWe assume that (i) each unit of the HIV p24 antigen testing costs $4 (Jackson et al. 2003), (ii) a whole-blooddonation yields, on average, 1.5 units transfused (Jackson et al. 2003), and (iii) the annual blood donation inthe US is 14 million units (Despotis et al. 2008). Then the total HIV p24 antigen testing costs around $37.2million. The total cost of MP-NAT for HIV and HCV is estimated as $155 million (Jackson et al. 2003)bBased on the assumption that the total cost of SD-NAT for HIV and HCV is $428 million (Jackson et al.2003)
was redesigned successfully, leading to zero serious, avoidable errors during blood transfu-sion over a period of eight months.
Finally, we note that similar analysis is possible using other methods. For example, Jack-son et al. (2003) analyzes the cost-effectiveness of NAT for HIV, HCV, and HBV (in termsof improvement to quality-adjusted life years (QALYs)4) using a Markov Decision Model(MDM), see Schaefer et al. (2004) for an in-depth treatment of MDMs for medical treatmentproblems. While MDMs allow for more details to the model, this comes at the expense ofa huge increase in tractability. As the problem size increases, MDMs become increasinglymore difficult to solve exactly. Therefore, it becomes computationally prohibitive to analyzeall transfusion risks and their interactions or multiplicative effects on the patient’s outcome,as we do here using PRA.
4We note that similar analysis using QALYs (instead of the probability of a transfusion hazard, as we do here)is also possible with fault trees, which form the basis of the PRA.

Ann Oper Res
5 Conclusions
In this paper, we develop a comprehensive risk model of RBC transfusion using the PRAmethodology. Using our model, we quantify the current risk (both overall and severe trans-fusion risks), to the patient, coming from RBC transfusion in the United States, and identifythe major “critical points” in the transfusion process. This analysis allows us to identifytargeted interventions and evaluate their costs and benefits for risk reduction within a sys-tematic framework.
Our work brings to public attention that a more rigorous testing scheme would have littleimpact on the overall transfusion risk, as we find the current testing scheme in the US to bequite effective. In other words, none of the viral infections for transfusion that the lay publicfears, including HIV 1-2, and the hepatitis B and C viruses, contribute significantly to thecurrent transfusion risk. While most leading causes of transfusion risks (i.e., febrile non-hemolytic reactions, allergic reactions, and RBC alloimmunization) result in clinically mildoutcomes, the severe transfusion risks are caused mostly by circulatory overload and bac-terial infection. In addition, acute reactions, caused by errors in various stages of the bloodtransfusion process, also contribute significantly to transfusion risk. Our study indicates thatattention and resources that are focused on the blood administration process, rather than theblood screening process, will provide the highest risk reduction in RBC transfusion in theUS, especially when limited resources are an important factor in the selection of transfusionsafety programs. Blood transfusion processes are already heavily regulated. Hence, the real“win” from a clinical perspective in improving blood transfusion safety may not be in fur-ther implementing health policy decisions that lead to more regulation, but be focused on thefundamentals of patient care like the elimination of adverse events (through the eliminationof erroneous administration of blood), as our analysis suggests, as well as the eliminationof other events like febrile reactions or circulatory overload, which have till now been con-sidered an element of quality, but nonetheless affect the safe delivery of transfusions. Suchguidelines derived from quantitative and objective analyses are important, because the mainfocus of the lay public for transfusion safety still remains on HIV transmissions throughtransfusion, mostly due to an excessive fear of HIV as well as a lack of information on othermajor risk factors in transfusion and their frequencies. Our analysis illustrates that the ad-verse event risk of mistransfusion (blood administration errors) is real and non-negligiblein the US. More importantly, this analysis allows us to quantify the effectiveness (in termsof risk reduction and cost) of improvement strategies focused on the blood administrationprocess, and shows that they can add real value towards transfusion safety. We hope anadditional benefit of our analysis will be that it will inform the lay public of the real riskof mistransfusion and help put things in perspective with respect to the not-so-low risk ofmistransfusion, compared with the already-low risk of HIV transmission in transfusion. Aninteresting direction would be to construct models that incorporate the behavioral issues in-volved in public decision making (such as how the decision maker would/should react to thelay public’s subjective and excessive fear of an HIV transmission in transfusion). Such be-havioral issues are outside the scope of this paper, but would constitute an interesting avenuefor future research.
While we focus our attention for improvement actions to two main transfusion processes,of blood screening and administration, it is an important future research direction to use ourmodel, risk estimates, and risk points for prioritizing interventions that focus on yet othertransfusion processes. In particular, system level improvements can be classified into threeseparate operational areas. First, there is the guidance provided in law, which establishesminimal requirements for healthcare providers and institutions based upon licensure stan-dards. Second, there are standards, regulations, and certification, which provides the next

Ann Oper Res
level of oversight. Within transfusion care, there are standards from the College of Amer-ican Pathologists (CAP), the Centers for Medicare and Medicaid Services (CMS), and theJoint Commission. These standards provide the guiding principles to assure the safe andeffective delivery of blood to patients. Certification of institutions and providers helps todemonstrate that expectations exceed the thresholds established in law. Finally, there areinformal mechanisms for ensuring best practices and evidence-based medicine. These ap-proaches usually include comparative benchmarking. Taken together, these options providea menu of interventions to improve transfusion care. The PRA performed in this body ofwork helps to inform interventions at each of these levels.
While the performance measures and concepts we use may be unfamiliar to the averageclinician, they are important to consider since they can help provide an understanding ofwhat needs to be done at various levels of the healthcare system to improve transfusion care,as we discuss above. In addition, it is important for clinicians to know the highest risk eventsso that providers are reminded on how to improve them in providing transfusion care.
This work is not without limitations. Modeling exercises like PRA only represent a viewof reality through a particular lens. If the lens is incorrect or misaligned, the reality willbe distorted. Second, while the risks identified here can assist in informing licensing, reg-ulatory, and certification standards, they represent only one piece of information that canassist in this arena, and broader representation through other data sources and experts needto inform decision making.
While recognizing these important limitations, this work also has significant strengths.First, the PRA performed here represents an integration of the current estimates of bloodtransfusion risks. Second, the model provides an analysis of the current landscape of transfu-sion safety in the US based upon the prevailing evidence base in the peer reviewed literature.Third, the model can be easily updated as risks are eliminated and new risks are identified,thereby providing a methodology that produces a working document, which can be regu-larly updated as the evidence base matures. Finally, the model provides an opportunity toapply a method used in other industries to an important category of low frequency, high riskevents in healthcare and serves as the template for performing analyses on other healthcareproblems, such as wrong site surgeries, patient falls, and healthcare associated infections.
Probabilistic risk assessment is an important tool with implications for transfusion safetyas well as healthcare safety in general. It provides another method for visualizing and ana-lyzing the risks related to the transfusion of blood and blood products, and can be integratedwith other elements and tools to determine the best way to advance transfusion care andsafety in the US.
Acknowledgements We would like to thank the Guest Editors of this Special Issue and two anonymousReviewers, whose insightful comments and suggestions have led to improvements in the presentation of thepaper. We are also grateful to Dr. Susan Stramer and Mr. David Smith of the American Red Cross, withwhom we had many fruitful discussions that greatly benefited our research. Dr. Slonim was supported in partby AHRQ HS-14009.
Appendix A
The incidence of major blood groups in the United States and their ABO compatibilityrelationship [American Red Cross (2008)] lead to the following table.
We make two assumptions: (1) The blood group distribution of blood donors and transfu-sion patients follow that of the general population. (2) Erroneous blood administration ratesare similar among the different blood groups. According to Linden et al. (2000), the first

Ann Oper Res
Table 5 The relationship between blood groups in terms of ABO compatibility
Donor Blood Group (Incidence)
O− O+ B− B+ A− A+ AB− AB+(7%) (40%) (1.5%) (11%) (5%) (32%) (0.5%) (3%)
RecipientBloodGroup(Incidence)
O−(7%)
0.49% X X X X X X X
O+(40%)
2.8% 16% X X X X X X
B−(1.5%)
0.1050% X 0.0225% X X X X X
B+(11%)
0.77% 4.4% 0.1650% 1.21% X X X X
A−(5%)
0.35% X X X 0.25% X X X
A+(32%)
2.24% 12.8% X X 1.6% 10.24% X X
AB−(0.5%)
0.035% X 0.0075% X 0.025% X 0.0025% X
AB+(3%)
0.21% 1.2% 0.045% 0.33% 0.15% 0.96% 0.015% 0.09%
X means the corresponding donor and recipient blood groups are ABO incompatible
assumption may slightly overestimate the probability of incompatibility, as being the “uni-versal donor”, group O blood is collected (hence, transfused) more frequently than what itsincidence indicates.
As defined in Sect. 2, I denotes the event of ABO incompatibility in case of anerroneous administration of blood. Let D and R denote the random variables repre-senting the blood groups of the donor and the patient, respectively, for D,R ∈ S ≡{AB+,AB−,A+,A−,B+,B−,O+,O−}. We can derive the probability that the bloodgroup of a randomly selected donor will be compatible with a randomly selected recipientas follows:
Pr(Compatible when randomly chosen)
=∑
x∈S
∑
y∈S
P (I c | D = x,R = y)P (D = x,R = y)
= (0.07 × 0.03) + (0.4 × 0.03) + · · · + (0.03 × 0.03) + (0.07 × 0.005) + · · ·+ (0.005 × 0.005) + · · · + (0.007 × 0.07)
= 0.565125.
Thus, given error (i.e., units are randomly chosen), ABO incompatibility happens with prob-ability 0.434875, that is, P (I | E) = 0.434875.
We use the ratio of compatible-to-incompatible, given by P(Ic |E)
P (I |E)= 1.30, as an adjust-
ment factor to adjust up the number of ABO compatible cases with erroneous administrationin Table 6, as explained in Sect. 2.4.1, in the same way as Linden et al. (2000) does. Lindenet al. (2000) uses 1.78 for the ratio of compatible-to-incompatible, which they take from theanalysis in Greenwalt (1997). We use the same methodology as Greenwalt (1997) uses tocalculate this ratio (see Greenwalt’s Table 1). The only differences are in the data, as weexplain below:

Ann Oper Res
(i) Greenwalt uses the blood type incidence in the US for the white race only, whereas weuse the overall blood type incidence in the US corresponding to the four main ethnicgroups having the highest proportions in the US population (white, black, Latino, andAsian), taken from the American Red Cross (2008). As such, our blood group incidencedata represent the entire US population, rather than the white race only.
(ii) In his analysis, Greenwalt does not distinguish between Rh+ and Rh−, and aggregatesall Rh+ and Rh− blood for a certain blood type into one number. For example, forthe white race that Greenwalt uses, the O Rh+ percentage is 37%, whereas the O Rh−percentage is 8% (from the American Red Cross (2008) or from the reference citedin Greenwalt, which is the American Association of Blood Banks’ Technical Manual),adding up to 45%, which is the number Greenwalt uses for group O. However, thisaggregation distorts the results somewhat, because while a patient with Rh+ can receiveblood from both Rh+ and Rh− donors, a patient with Rh− can only receive blood fromRh− donors. As an example, consider the O group, which is the “universal” donor.While the blood of an O Rh− donor can be used for patients of all blood groups, theblood of an O Rh+ donor can only be used for patients with blood groups AB Rh+, ARh+, B Rh+, and O Rh+, and this does make a difference in the result.
In summary, while our methodology for calculating this ratio is the same as Greenwalt’s, thedata we use is more detailed, and represents the overall incidence of blood groups in the US(taking into account the proportions of the different races in the US as well as the differentblood group incidences in those races). Thus, our result, of 1.30, is more accurate than the1.78 that Linden et al. (2000) uses.
Appendix B
Table 6 Frequency of erroneous administration of RBCs in the State of New York, 1990 through 1999 outof 9,000,000 transfusions, based on the Linden et al. (2000) study
Number
ABO-incompatible (I ) 237
Reported ABO-compatible 221
Adjusted ABO-compatible (I c) 308
Total number of erroneous 462a Blood Bank Error Alone 135
administration of RBC Non-blood Bank Error Alone 259
Compound Error 67
Adjusted total number of 545
erroneous administration of
RBC
aOut of the 462 cases having erroneous administration of RBC reported in Linden et al. (2000), the error typeof one case could not be determined

Ann Oper Res
Table 7 Event probabilities in the acute hemolytic reaction sub-tree
Event description Probability
P(E) Erroneous Administration of RBC 545/9,000,000
P(BE) Blood Bank Error Alone 135461 × 545
9,000,000 = 1.773 × 10⁻⁵
P(NE) Nonblood Bank Error Alone 259461 × 545
9,000,000 = 3.402 × 10⁻⁵
P(CE) Compound Error 67461 × 545
9,000,000 = 8.801 × 10⁻⁶
P(A ∩ I ) Acute Hemolytic Reaction and ABO 1.300 × 10⁻⁵
Incompatibility
P(A ∩ I c) Acute Hemolytic Reaction and ABO 4.256 × 10⁻⁵
Compatibility
P(I | E) ABO Incompatibility given Erroneous 0.434875
Administration
Appendix C
C.1 Viral infections
As mentioned above, when the only significant transfusion risk comes from window-periodtransmissions, mathematical models known as the incidence/window-period models (Glynnet al. 2002; Kleinman et al. 1997) become appropriate to estimate the viral infection risks.These mathematical models typically take into account the window period, and incidencerate in repeat donors and first-time donors, together with their estimated weights in thepopulation.
Retroviruses
• Human Immunodeficiency Virus—HIV
Although transmission risks have been estimated at 80–90% for HIV and HCV evenin the presence of the virus, most of these models assume a worst-case scenario of 100%transmission risk. In a 2007 publication, Klein et al. (2007) estimated this risk to be 1 in2,000,000 to 3,000,000 per unit transfused in the US. The research by Dodd et al. (2002)5
provides a similar estimate, of 1 in 2,135,000. Despotis et al. (2008) also provide a similarconclusion about HIV risk, at 1 in 2,100,000, in their review. Thus, we will consider this riskto be in the interval, 1 in 2,000,000 to 3,000,000. All transfusion-transmitted HIV cases maysuffer serious long-term complications based on the chronicity of HIV infection and the po-tential for the infected recipient to either develop disease or require long-term antiretroviraltherapy. Thus, we will also consider the severe outcome risk related to HIV transmission as1 in 2,000,000 to 3,000,000.
• Human T-Lymphotropic Virus—HTLV
The HTLV virus group includes two retroviruses (HTLV-1 and HTLV-2) that can causehuman disease. Schreiber et al. (1996) use the incidence/window-period model, applied toUS blood donor data between 1991 and 1993, and estimate the risk of HTLV transfusion to
5Based on observed incidence (of 1 in 1,525,000 for HIV-1) calculated for repeat donors (80% of total donors)and an adjusted rate (of three times higher) for first-time donors (20% of total donors).

Ann Oper Res
be 1 in 641,000. This is mainly due to the 51-day window period before the development ofthe HTLV antibody. This number is also adopted in the review paper by Klein et al. (2007).Since only 1/3 of cellular units transmit HTLV infection (Kleinman et al. 2003a, 2003b),this translates into an approximate risk of 1 in 1,923,000.
Hepatitis viruses
• Hepatitis A Virus (HAV)
In a transfusion, HAV can only be transmitted during the brief several week period ofasymptomatic HAV viremia (Brower et al. 2000). In Dodd (1994) and Goodnough (2003),the transfusion risk of HAV is estimated as 1 in 10,000,000 units. We will use this estimatein our study.
• Hepatitis B virus HBV
The overall HBV risk from transfusion is the sum of the window-period transmis-sion (i.e., before infected donors develop a positive HBsAg level) and transmission bychronic carriers who have undetectable levels of HBsAg. The first risk, from window-periodtransmission, is estimated to be 1 in 82,000 units in a Canadian study (Kleinman et al.2003a, 2003b).6 For the second risk (i.e., transmission from chronic carriers with unde-tectable HBsAg on blood donor screening assays), there are two US studies, both of whichassume that HBV chronic carriers who are HBsAg negative, yet still capable of transmit-ting HBV, will test positive for anti-HBC and have HBV DNA that is detectable by verysensitive HBV NAT techniques (Kleinman and Busch 2001; Kleinman et al. 2003a, 2003b).The resulting estimate is 1 in 49,000 units. An American Red Cross study in 2003 sug-gests a similar rate of potentially infectious units in their donor population (Kleinman etal. 2003a, 2003b). Therefore, the overall risk of HBV transmission can range from approx-imately 1 in 31,000 (if all chronic carriers transmit) to 1 in 82,000 (if no chronic carriertransmits). Klein et al. (2007) report this risk as 1 in 100,000 to 200,000 units. The cor-responding estimate in Dodd et al. (2002)7 is slightly lower, at 1 in 205,000 to 488,000.Because the estimates found in the literature lie within a wide range, in our study we willconsider this risk to belong to the interval of 1 in 50,000 to 400,000. Data suggest that 1 in 40transfusion-transmitted HBV infections will lead to the serious outcome of a chronic carrierstate (with or without severe liver disease) (Kleinman et al. 2003a, 2003b). Consequently,we will consider the severe outcome risk related to HBV transmission as 1 in 2,000,000 to16,000,000.
• Hepatitis C Virus (HCV)
The estimate for transfusion-transmitted HCV infection in the US is reported in Kleinet al. (2007) as 1 in 1,000,000 to 2,000,000 units. Furthermore, Dodd et al. (2002) report asimilar estimate, 1 in 1,935,000, using the incidence/window-period model.8 Despotis et al.
6This estimate is obtained for a window period of 59 days and after adjusting for the fact that measuringHBsAg incidence will underestimate the true HBV incidence. This is because HBsAg is usually a transientmarker, and disappears several months after infection.7After the observed incidence of HBsAg is multiplied by a factor of 2.38, to adjust for the transient nature ofthe HBsAg marker, as noted above.8Based on observed incidence (of 1 in 390,000) calculated for repeat donors (80% of total donors) and anadjusted rate (of three times higher) for first-time donors (20% of total donors).

Ann Oper Res
(2008) also report a similar estimate, of 1 in 1,800,000, in their review. Thus, it is reasonableto use the interval estimate in Klein et al. (2007) in our study.
It is estimated that 20% of HCV infected individuals resolve their infection, 60% developchronic infection without severe liver disease, and 20% develop significant liver disease suchas cirrhosis (e.g., Alter and Seeff 2000; Busch 2001; Kleinman et al. 2003a, 2003b). Then,based on the transfusion-transmission risk of HCV of 1 in 1,000,000 to 2,000,000, the riskof a severe outcome is calculated as 1 in 5,000,000 to 10,000,000 units.
• Non-A-E Hepatitis Virus
Studies indicate that approximately 20% of acute community-acquired hepatitis cases inthe US cannot be attributed to A-E hepatitis viruses or other known causes; these transmis-sion cases are likely due to a viral agent that is not yet discovered (Alter and Bradley 1995).However, cases of chronic hepatitis are infrequently associated with this agent (Kleinman atal. 2003a, 2003b). Based on these and other studies (including a retrospective evaluation of a1970 US study, see Kleinman et al. 2003a, 2003b), it is concluded that this risk is extremelylow or nonexistent in the US. As a result, a very small probability, of 10−9, is assigned tothis event (and other such negligible events, as discussed below) in our study.
West Nile Virus (WNV) The WNV epidemic in 2002 in the US saw over 3,300 reportedhuman cases of WNV disease, with over 2,300 reported cases of WNV encephalitis andmeningitis. The first documented cases of transfusion transmission of WNV through volun-tary blood donation also occurred (Biggerstaff and Petersen 2003). Since the risk was highlygeographically and temporally variable, computation of geographically localized estimateshas been recommended (Biggerstaff and Petersen 2003). In response to these documentedcases, routine blood screening of WNV (a combination of MP NAT during the “non-season”and a more sensitive ID NAT in epidemic locations during epidemic times) started in July2003 in the US (Stramer 2007). This testing scheme has been so effective that no transfusion-transmitted WNV has been observed in the US after that date (Stramer 2007). Consequently,it is reasonable to treat this risk as extremely low to nonexistent in our study.
Cytomegalovirus—CMV It is mostly in immunosuppressed patients that a Cytomegalovirus(CMV) transmission leads to important consequences, such as acute, severe clinical diseasesmanifested by pneumonia, hepatitis, and other symptoms that can even lead to death (Lau-pacis et al. 2001; Preiksaitis 2000). Although the true risk of CMV transmission remainsunknown, it is reasonable to infer, from the conclusion in Kleinman et al. (2003a, 2003b),that the risk of significant CMV clinical disease from transfusion of cellular blood compo-nents in the United States is extremely low to nonexistent
C.2 Bacterial infection
Sepsis The American Red Cross reports a risk from a septic transfusion reaction from aculture-negative apheresis unit (predominantly due to skin flora) at 1 in 75,100 (Stramer2007). In addition, in their review, Despotis et al. (2008) give a similar estimate of this risk,at 1 in 75,000. Thus, 1 in 75,100 would be an appropriate estimation of the transfusion riskof sepsis.
Treponema Pallidum (Syphilis) The storage of RBCs at refrigerator temperature preventsthe growth of many bacterial species. This, together with the routine testing of donated bloodfor serologic evidence of syphilis, has eliminated the syphilis cases. There have been only

Ann Oper Res
two cases of syphilis since 1950, and no incidence was reported since 1978 (Kleinman et al.2003a, 2003b). Thus, it is safe to conclude that the current risk of transfusion-transmittedsyphilis in the United States is extremely low to nonexistent.
C.3 Protozoal infection
Plasmodium (Malaria) Although rare in North America, transfusion-transmitted malariais common in some parts of the world (Despotis et al. 2008). In the US, there has been 2–3transfusion-transmitted malaria cases per year over the 40-year period from 1958 through1998, resulting in an occurrence rate of 1 case per 4,000,000 red cells transfused during thisperiod (Guerrero et al. 1983; Mungai et al. 2001). The same estimate is also given in Kleinet al. (2007). Furthermore, the overall fatality rate of malaria is estimated as 11% (Kleinmanet al. 2003a, 2003b). Hence, for a transfusion risk of 1 in 4,000,000, its mortality rate is 1 in36,363,636 units.
Babesiosis After malaria, babesiosis is the second most commonly reported transfusion-transmitted parasitic infection in the US (Kleinman et al. 2003a, 2003b). There have beenslightly over 40 cases reported in the US in the last two decades (Leiby 2001). Hence, theclinical case reporting data suggests an incidence of approximately 1 per 10,000,000 red cellunits transfused in the US. The fatality rate of babesiosis is estimated to be very low; mosttransfusion-transmitted babesiosis infections will result in mild clinical disease (Kleinmanet al. 2003a, 2003b).
Chagas disease Chagas disease is caused by a protozoan parasite, Trypanosome cruzi,which establishes a chronic, asymptomatic carrier state in most infected persons (Kleinmanet al. 2003a, 2003b). Although large numbers of transfusion-transmitted cases have beendocumented in Mexico and Central and South America, only 6 cases of acute transfusion-transmitted Chagas disease have been reported in North America since the mid-1980s(Kleinman et al. 2003a, 2003b). However, the numbers of infections are expected to beon the rise as a result of immigration from Mexico and Central and South America (Ameri-can Red Cross 2008). As such, the risk is higher in regions that face high immigration rates.Given these, we conclude that the risk of Chagas disease from transfusion of cellular bloodcomponents in the United States is extremely low to nonexistent for the time being, but thisis likely to change in the future.
Toxoplasmosis We were not able to find a clinical study that estimates the risk oftransfusion-transmitted toxoplasmosis in the US. However, Despotis et al. (2008) state thattoxoplasmosis is rarely transmitted via transfusion in the US. Therefore, we conclude thatthe risk is extremely low to nonexistent.
C.4 Transfusion reactions
Hemolytic reaction The overall risk of a hemolytic reaction (acute or delayed) is estimatedat 1 in 6,000 units (Klein et al. 2007). In what follows, we discuss the risk for each type ofhemolytic reaction.
Acute hemolytic reaction The frequency of acute hemolytic reactions is reported at 1 in18,000, with a mortality rate between 1 in 600,000 and 1 in 1,800,000 per unit transfused(Klein et al. 2007; Linden et al. 2000; Mayer 1982). Results of published studies and FDAadverse-event reporting suggest a similar mortality rate of hemolytic reactions, at around0.8–1.2 per one million units transfused (Despotis et al. 2008).

Ann Oper Res
• Other Types of Incompatibility
Acute hemolytic reactions occur due to causes other than ABO incompatibility, and thenature of these causes is not well understood in the medical literature. In our model, we referto these unknown causes of acute hemolytic reactions as “other types of incompatibility,”and estimate the probability that an acute hemolytic reaction occurs due to other types ofincompatibility, (A ∩ I c), by deducting the risk of an acute hemolytic reaction due to ABOincompatibility from the total risk of an acute hemolytic reaction, as detailed in Sect. 2.4.
Delayed hemolytic reaction
Since the risk of a hemolytic reaction is 1 in 6,000 units of red blood cells transfused and therisk of acute hemolytic reaction is 1 in 18,000 units (Klein et al. 2007), the risk of delayedhemolytic reactions can be inferred as 1/6,000 − 1/18,000 = 1/9,000, assuming that thetwo incidents are mutually exclusive, that is, the probability that a patient will have bothacute hemolytic reaction and delayed hemolytic reaction is extremely low.
It is also stated, in Pineda et al. (1999), that delayed hemolytic reactions caused by RBCalloantibodies occur in 1 in 4,000 to 6,000 units. As a result, we will consider an interval ofthis risk, from 1 in 4,000 to 9,000 units.
Febrile non-hemolytic reaction Klein et al. (2007) provide the estimated risk of febrilereaction as 1 in 300, which we will use in our study.
Allergic reaction Allergic reactions can occur in 0.1 to 0.3 percent of the transfused units(Mazzei et al. 2002). This estimate is also consistent with that in Kleinman et al. (2003a,2003b). More significant allergic reactions are analyzed below, as “anaphylaxis.”
Anaphylaxis The transfusion risk of anaphylaxis in the United States is reported as 1 in20,000 to 50,000 in Klein et al. (2007). In addition, Despotis et al. (2008) provide the sameestimate for this risk in their review. Hence we conclude that it is reasonable to use theestimate of 1 in 20,000 to 50,000 units. This interval is also consistent with that in Kleinmanet al (2003a, 2003b).
Transfusion-associated graft-versus-host disease (TA-GvHD) TA-GvHD leads to a combi-nation of symptoms, including fever, skin rash, diarrhea, liver dysfunction, and bone marrowfailure, typically occurring 7 to 10 days after transfusion (Williamson and Warwick 1995).The risk in the United States is stated as uncommon in Klein et al. (2007), although 90% ofthe time it could be fatal. Thus, we consider this risk to be extremely low to nonexistent inour analysis.
RBC alloimmunization The risk of RBC alloimmunization in transfusion is stated at a rateof about 62.1 in 100,000 transfused red cell units (Kleinman et al. 2003a, 2003b).
Transfusion-related acute lung injury (TRALI) TRALI is a serious blood transfusion com-plication, characterized by acute respiratory distress, noncardiogenic bilateral pulmonaryedema, and hypoxemia that occur within 1 to 6 hours (more usually within 1–2 hours) aftertransfusion of plasma-containing blood components.
The incidence of TRALI is reported as 2 per 10,000 transfused units (or 16 per 10,000transfused patients) in a study by Popovsky and Moore (1985). The study is conducted inhospitals associated with the Mayo Clinic from June 1982 to October 1984, and all cases

Ann Oper Res
of acute respiratory distress that occurred within 4 hours of transfusion are reported. Manyreviews, including Klein et al. (2007), use this estimate. Kleinman et al. (2003a, 2003b)state that the rate of TRALI from red cell transfusion has reduced since 1980. For example,the point estimate for TRALI risk in Canada, calculated from the data collected by HealthCanada (1998), is 1.4 per 100,000 red cell units transfused. However, it is also stated thatunderrecognition and/or underreporting of TRALI could be a problem mainly because ofthe lack of a uniformly applied set of criteria for the diagnosis of TRALI. Many mild casesof TRALI may go unrecognized or may be misdiagnosed. Consequently, we will consideran interval for this risk, ranging from 1.4 to 20 in 100,000 units. Furthermore, a recent studyestimates the fatality rate from TRALI as 0.4 per 1 million RBC units (Despotis et al. 2008).
Circulatory (volume) overload The risk of circulatory (volume) overload results from theincapacity of the heart to adequately pump the additional blood volume (introduced by trans-fusion) through the circulation. As a result, congestive heart failure and acute pulmonaryedema occur. The risk estimates in the literature vary from 141 (Popovsky and Taswell1985) to 6,220 (Bierbaum et al. 1999) per 100,000 recipients in different studies reviewedin Kleinman et al. (2003a, 2003b). As stated above, this risk is expressed per recipient andit is difficult to convert this risk into per unit transfused. Hence, we will use this risk as is inour study. Furthermore, since the range reported in the literature is wide, we will consideran interval of this risk, from 1 in 200 to 10,000.
Appendix D
Table 8a Importance measures for the overall transfusion risk—base case
Event Importance measure Event Importance measure
Febrile nonhemolytic reaction 0.552557 Sepsis 0.002207
Allergic reaction 0.249274 Blood bank error alone 0.001264
RBC alloimmunisation 0.102941 HBV 0.000737
Circulatory overload 0.032503 Compound error 0.000654
Delayed hemolytic reaction 0.025503 HCV 0.000111
TRALI 0.017737 HTLV-1 & 2 0.000086
Acute hemolytic reaction and 0.007107 HIV-1 & 2 0.000066
other types of incompatibility
Anaphylaxis 0.004736 Plasmodium 0.000041
Acute hemolytic reaction 0.004359 HAV 0.000017
when error
Nonblood bank error alone 0.002441 Babesiosis 0.000017

Ann Oper Res
Table 8b Importance measures for the severe outcome risk—base case
Event Importance measure Event Importance measure
Circulatory Overload 0.632592 TRALI 0.00129
Acute Hemolytic Reaction 0.179249 HIV 0.00129
Bacterial Infection 0.164537 HCV 0.00043
MISC 0.016938 Malaria 0.000089
Table 9a Minimal cut sets for the overall transfusion risk—base case
Cut Sets Events of the Cut Set Risk
1 Febrile nonhemolytic reaction 3.330000 × 10⁻³
2 Allergic reaction 1.503759 × 10⁻³
3 RBC alloimmunization 6.210000 × 10⁻⁴
4 Circulatory overload 1.960784 × 10⁻⁴
5 Delayed hemolytic reaction 1.538462 × 10⁻⁴
6 TRALI 1.070000 × 10⁻⁴
7 Acute hemolytic reaction, other types of incompatibility 4.287400 × 10⁻⁵
8 Anaphylaxis 2.857143 × 10⁻⁵
9 Sepsis 1.331558 × 10⁻⁵
10 Nonblood bank error alone, acute hemolytic reaction when error 1.472630 × 10⁻⁵
11 Blood bank error alone, acute hemolytic reaction when error 7.626117 × 10⁻⁶
12 Compound error, acute hemolytic reaction when error 9.090909 × 10⁻⁶
13 HBV 4.444444 × 10⁻⁶
14 HCV 3.9445454 × 10⁻⁷
15 HTLV-1 &2 5.200000 × 10⁻⁷
16 HIV-1 & 2 4.000000 × 10⁻⁷
17 Plasmodium (malaria) 2.500000 × 10⁻⁷
18 Babesiosis 1.000000 × 10⁻⁷
19 HAV 1.000000 × 10⁻⁷
Table 9b Minimal cut sets for severe outcome risk—base case
Cut Sets Events of the Cut Set Risk
1 Circulatory overload 1.96078 × 10⁻⁴
2 Bacterial infection 5.10000 × 10⁻⁵
3 MISC 5.25000 × 10⁻⁶
4 Acute hemolytic reaction 1.00000 × 10⁻⁶
5 TRALI 4.00000 × 10⁻⁷
6 HIV 4.00000 × 10⁻⁷
7 HBV 3.33333 × 10⁻⁶
8 HCV 1.33333 × 10⁻⁷
9 Malaria 2.75000 × 10⁻⁸

Ann Oper Res
References
Alter, H. J., & Bradley, D. W. (1995). Non-A, non-B hepatitis unrelated to hepatitis C virus (non-ABC).Seminars in Liver Disease, 15, 110–120.
Alter, H. J., & Seeff, L. B. (2000). Recovery, persistence, and sequelae in HCV infection: A perspective onlong-term outcome. Seminars in Liver Disease, 20, 17–35.
Bierbaum, B. E., Callaghan, J. J., & Galante, J. O. (1999). An analysis of blood management in patientshaving a total hip or knee arthroplasty. Journal of Bone and Joint Surgery. American Volume, 81A,2–10.
Biggerstaff, B. J., & Petersen, L. R. (2003). Estimated risk of transmission of the West Nile virus throughblood transfusion in the US. Transfusion, 43, 1007–1017.
Brower, W. A., Nainan, O. V., & Han, X. (2000). Duration of viremia in hepatitis A virus infection. TheJournal of Infectious Diseases, 182, 12–17.
Burgmeier, J. (2002). Failure mode and effect analysis: An application in reducing risk in blood transfusion.Journal of Quality Improvement, 28, 331–339.
Busch, M. P. (2001). Insights into the epidemiology, natural history, and pathogenesis of hepatitis C infectionfrom studies of infected donors and blood-product recipients. Transfusion Clinique Et Biologique, 8,200–206.
Chen, B., Avrunin, G. S., Clarke, L. A., & Osterweil, L. J. (2006). Automatic fault tree derivation from little-JIL process definitions. In Q. Wang, D. Pfahl, D. Raffo, & P. Wernick (Eds.), Lecture notes in computerscience: Vol. 3966. Software process change (pp. 150–158). Berlin: Springer.
Davies, A., Staves, J., Kay, J., Casbard, A., & Murphy, M. F. (2006). End-to-end electronic control of the hos-pital transfusion process to increase the safety of blood transfusion: Strengths and weaknesses. Trans-fusion, 46, 352–364.
Despotis, G., Eby, C., & Lublin, D. M. (2008). A review of tansfusion risks and optimal management ofperioperative bleeding with cardiac surgery. Transfusion, 48, 1S–30S.
Dodd, R. Y. (1994). Adverse Consequences of blood transfusion: Quantitative risk estimates. In S. T. Nance(Ed.), Blood supply: Risks perceptions, and prospects for the future (pp. 1–24). Bethesda: AmericanAssociation of Blood Banks.
Dodd, R. Y., Notari, E. P., & Stramer, S. L. (2002). Current prevalence and incidence of infectious diseasemarkers and estimated window-period risk in the American Red Cross blood donor population. Trans-fusion, 42, 975–979.
Dzik, W. H. (2005). Technology for enhanced transfusion safety. American Society of Hematology (pp. 476–482).
Dzik, W. H., & Cooley, E. (2003). Lecture 2002: Transfusion safety in the hospital. Transfusion, 1190–1198.Glynn, S. A., Kleinman, S., & Wright, D. J. (2002). International application of the incidence rate/window
period model. Transfusion, 42, 966–972.Goodnough, L. T. (2003). Risk of blood transfusion. Critical Care Medicine, 31(12 (Suppl.)), 680–686.Goodnough, L. T., Shander, A., & Brecher, M. E. (2003). Transfusion medicine: Looking to the future.
Lancet, 361, 161–169.Greenwalt, T. J. (1997). A short history of transfusion medicine. Transfusion, 37, 550–563.Guerrero, I. C., Weniger, B. C., & Schultz, M. G. (1983). Transfusion malaria in the United States, 1972–
1981. Annals of Internal Medicine, 99, 221–226.Haimes, Y. Y. (1998). Risk modeling, assessment, and management. New York: Wiley.Jackson, B. R., Busch, M. P., Stramer, S. L., & AuBuchon, J. P. (2003). The cost-effectiveness of NAT for
HIV, HCV, and HBV in whole-blood donations. Transfusion, 43, 721–729.Klein, H. G., Spahn, D. R., & Carson, J. L. (2007). Red blood cell transfusion in clinical practice. Lancet,
370, 415–426.Kleinman, S. H., & Busch, M. (2001). Hepatitis B virus amplified and back in the blood safety spotlight.
Transfusion, 41, 1081–1085.Kleinman, S., Busch, M. P., & Korelitz, J. J. (1997). The incidence/window period model and its use to
assess the risk of transfusion-transmitted HIV and HCV infection. Transfusion Medicine Reviews, 11,155–172.
Kleinman, S., Chan, P., & Robillard, P. (2003a). Risks associated with transfusion of cellular blood compo-nents in Canada. Transfusion Medicine Reviews, 17(2), 120–162.
Kleinman, S. H., Kuhns, M. C., & Todd, D. S. (2003b). Frequency of HBV DNA detection in US blooddonors positive for anti-HBC: Implications for transfusion transmission and donor screening. Transfu-sion, 43(6), 696–704.
Kumamoto, H., & Henley, E. J. (2000). Probabilistic risk assessment and management for engineers andscientists (2nd ed.). New York: Wiley-IEEE Press.

Ann Oper Res
Laupacis, A., Brown, J., & Costello, B. (2001). Prevention of posttransfusion CMV in the era of universalleukoreduction: A consensus statement. Transfusion, 41, 560–569.
Leiby, D. A. (2001). Parasites and other emergent infectious agents. In S. Stramer (Ed.), Blood safety in thenew millenium (pp. 55–78). Bethesda: American Association of Blood Banks.
Linden, J. V., Wagner, K., & Voytovich, A. E. (2000). Transfusion errors in New York State: An analysis of10 years’ experience. Transfusion, 40, 1207–1213.
Lyons, M., Adams, S., Woloshynowych, M., & Vincent, C. (2004). Human reliability analysis in healthcare:A review of techniques. The International Journal of Risk and Safety in Medicine 16, 223–237.
Mayer, K. (1982). A Different view of transfusion safety—Type and screen, transfusion of Coombs incom-patible cells, and fatal transfusion induced graft versus host disease. In H. F. Polesky & R. H. Walker(Eds.), Safety in transfusion practices. Skokie: College of American Pathologists.
Mazzei, C. A., Popovsky, M. A., & Kopko, P. M. (2002). Noninfectious complications of blood transfusion. InM. E. Brecher (Ed.), AABB technical manual (14th ed.) (pp. 586–587). Bethesda: American Associationof Blood Banks.
Mungai, M., Tegtmeier, G., & Chamberland, M. (2001). Transfusion-transmitted malaria in the United Statesfrom 1963 through 1999. The New England Journal of Medicine, 344, 1973–1978.
Pineda, A. A., Vamvakas, E. C., & Gorden, L. D. (1999). Trends in the incidence of delayed hemolytic anddelayed serologic transfusion reactions. Transfusion, 39, 1097–1103.
Popovsky, M. A., & Moore, S. B. (1985). Diagnostic and pathogenetic considerations in transfusion-relatedacute lung injury. Transfusion, 25, 573–577.
Popovsky, M. A., & Taswell, H. F. (1985). Circulatory overload: An underdiagnosed consequence of trans-fusion. Transfusion, 25, 469.
Preiksaitis, J. K. (2000). The cytomegalovirus “safe” blood product: Is leukoreduction equivalent to antibodyscreening? Transfusion Medicine Reviews, 14, 112–136.
Rausand, M., & Høyland, A. (2004). Wiley series in probability and statistics. System reliability theory:Models, statistical methods, and applications (2nd ed.). Hoboken: Wiley-Interscience.
Ross, S. M. (2007). Introduction to probability models. Amsterdam: Academic Press.Saxena, S., Ramer, L., & Shulman, I. A. (2004). A comprehensive assessment program to improve blood-
administering practices Using the FOCUS–PDCA model. Transfusion, 44, 1350–1356.Schaefer, A. J., Bailey, M. D., Shechter, S. M., & Roberts, M. S. (2004). Modeling medical treatment us-
ing Markov decision processes. In M. L. Brandeau, F. Sainfort, & W. P. Pierskalla (Eds.), Kluwer’sInternational Series Operations research and health care (pp. 593–612). Berlin: Springer.
Schreiber, G. B., Busch, M. P., & Kleinman, S. H. (1996). The risk of transfusion-transmitted viral infection.The New England Journal of Medicine, 334, 1685–1690.
Stockwell, D. C., & Slonim, A. D. (2006). Quality and safety in the intensive care unit. Journal of IntensiveCare Medicine, 21(4), 199–210.
Stramer, S. L. (2007). Current risks of transfusion-transmitted agents: A review. Archives of Pathology &Laboratory Medicine, 131, 702–707.
Stramer, S. L., Dodd, R. Y., & Leiby, D. A. (2007). Blood donor screening for Chagas disease—UnitedStates, 2006–2007. Morbidity and Mortality Weekly Report, 56, 141–143.
Trammell, S. R., & Wright, R. D. (1999). Integrating risk assessment into management systems. In Electron-ics manufacturing technology symposium twenty-fourth IEEE/CPMT (pp. 156–159).
Turner, C. L., Casbard, A. C., & Murphy, M. F. (2003). Barcode technology: Its role in increasing the safetyof blood transfusion. Transfusion, 43, 1200–1209.
Williamson, L. M., & Warwick, R. M. (1995). Transfusion-associated graft-versus-host disease and its pre-vention. The Blood Review, 9, 251–261.


![B. Why Invest in Probabilistic Risk Assessment?1].pdf · Beyond highlighting the risk – by undertaking probabilistic risk analysis – the study made concrete recommendations based](https://img.pdfslide.us/doc/110x75/5ecae787cb8b5d212c4efc86/b-why-invest-in-probabilistic-risk-assessment-1pdf-beyond-highlighting-the.jpg)