Embed Size (px)
Citation preview
8/7/2019 Red Apple Summary RISD
http://slidepdf.com/reader/full/red-apple-summary-risd 1/3
of;
lrie> JLed dpple*iI IEIICUI MI
ED U CA TIO N ACU-:NCf5/2) 476-5905
ome | District Locator | Index A-Z I Divisions | School Directory
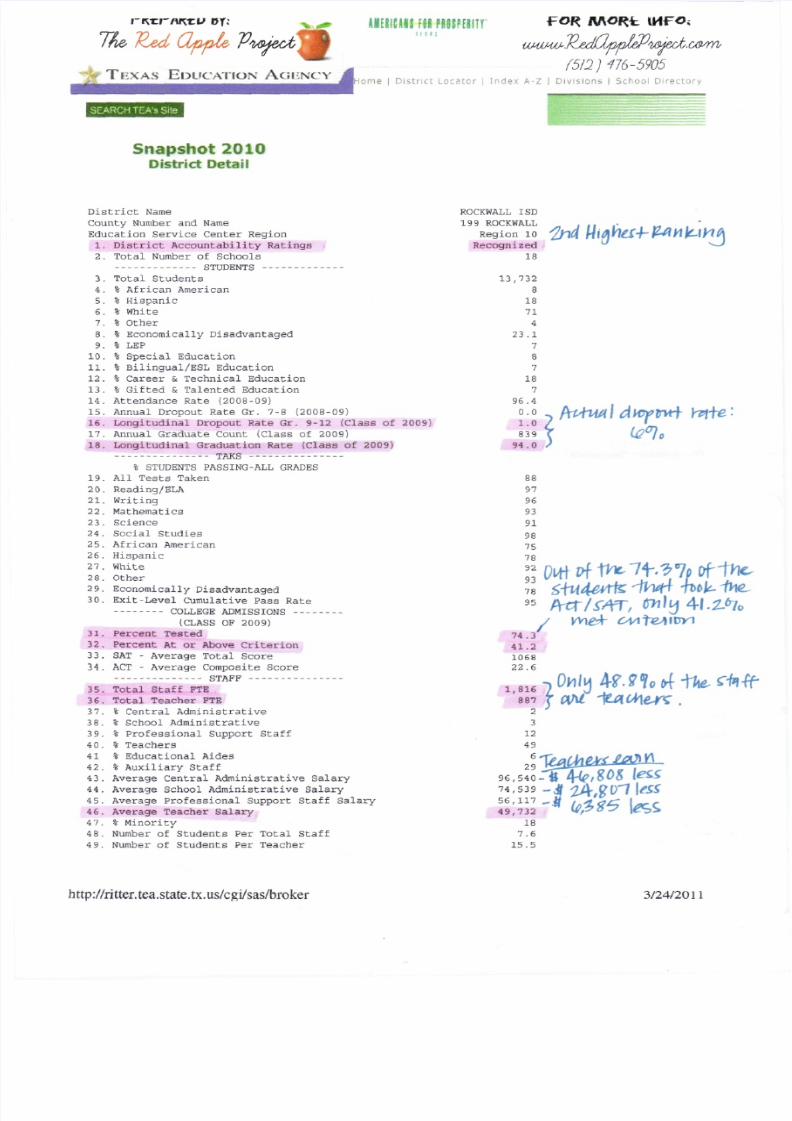
Snapshot 2010
District Detail
District Name
County Number and Name
Education Service Center Region
1.
2.
3.
4 .
5.
6.
7.
8.
9.
10.11.
12 .
13.
14.
15.
16.
17.
18.
19.
20.
21.
22.
23.
24.25.
26.
27.
28.
29.
30.
31.
32.
33.
34.
35.
36.
37.38.
39.
40.
41
42 .
43.
44.
45.
46.
47.
48.
49.
District Accountability Ratings
Total Number of SchoolsQTTTPlTrWPCo 1 UUGINID
Total Students
% African American
% Hispanic
% White
% Other
% Economically Disadvantaged
% LEP
% Special Education% Bilingual/ESL Education
% Career & Technical Education
% Gifted & Talented Education
Attendance Rate (2008-09)
Annual Dropout Rate Gr. 7-8 (2008-09)
Longitudinal Dropout Rate Gr. 9-12 (Class of 2009)
Annual Graduate Count (Class of 2009)
Longitudinal Graduation Rate (Class of 2009)
% STUDENTS PASSING-ALL GRADES
All Tests Taken
Reading/ELA
Writing
Mathematics
Science
Social StudiesAfrican American
Hispanic
White
Other
Economically Disadvantaged
Exit -Level Cumulative Pass Rate_ mtT T'P
1anMTQc AMOwijJjlLVjcj t\iJVl .o o -L V _ J 1 N o — _ _ _ _
(CLASS OF 2009)
Percent Tested
Percent At or Above Criterion
SAT - Average Total Score
ACT - Average Composite ScoreQTaFK*o i/irr
Total Staff FTE
Total Teacher FTE
% Central Administrative% School Administrative
% Professional Support Staff
% Teachers
% Educational Aides
% Auxiliary Staff
Average Central Administrative Salary
Average School Administrative Salary
Average Professional Support Staff Salary
Average Teacher Salary
% Minority
Number of Students Per Total Staff
Number of Students Per Teacher
ROCKWALL ISO
199 ROCKWALL
Region 10 0T̂|H(AY\l£-)-p+
Recognized
18
13,732
8
18
71
4
23 .1
7
87
18
7
96 .4
° - ° - > p t i s f o m l dbvyvi . o 7839T (£°lo
94.0 /
88
97
96
93
91
9875
7892
Di>f r>f \V\& "74" ' 'Q "5 V i
78 £tH4̂*ffe ito*9 5
Aict/^fT/ e n/ w&c cw'te;
74./
41.2
1068
22.6
1, 816 ) \ J
88? 7 OM ' T S L A C t l e j *
23
12
49
6T f t t f j t fw
a j* K
96,54o-"«?5/̂ 05 \ e z s .
74,539 -jf 2A/£P~7\£&
56,11' _||U)4>$^ \0£&
18
7.6
15 .5
http://ritter.tea.state.tx.us/cgi/sas/broker 3/24/2011
8/7/2019 Red Apple Summary RISD
http://slidepdf.com/reader/full/red-apple-summary-risd 2/3
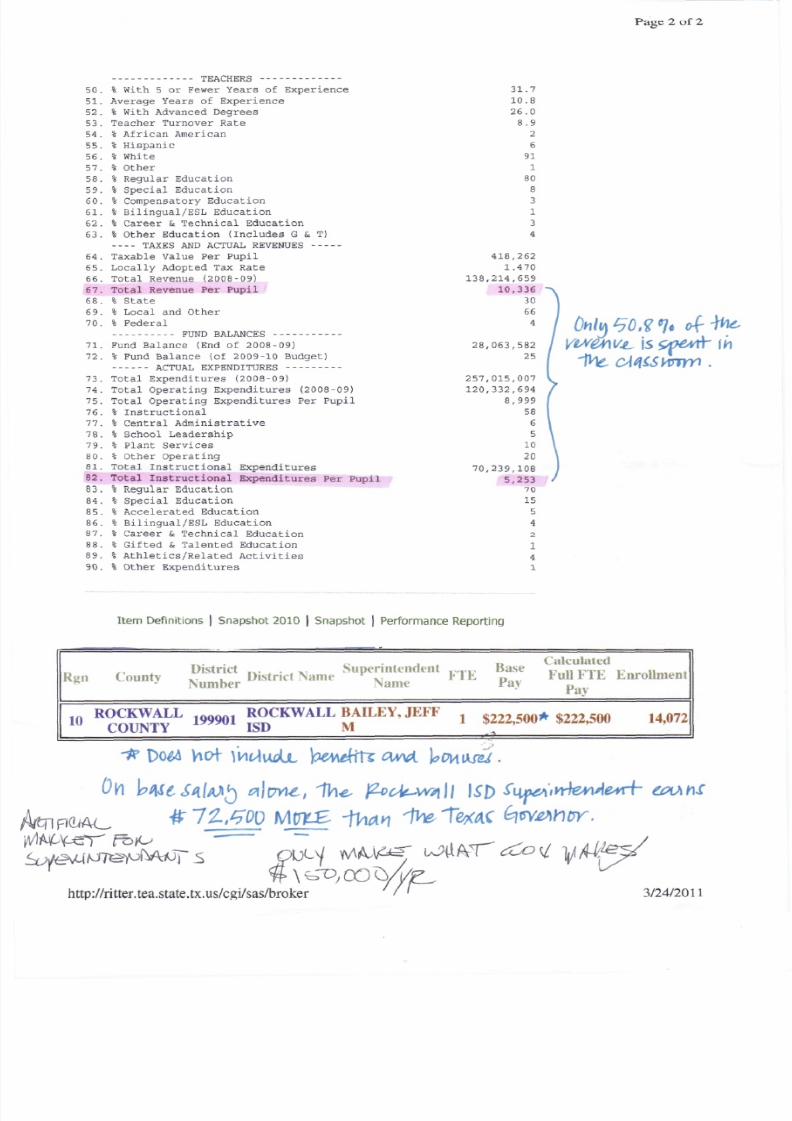
Page 2 uf 2
TEACHERS
50. % With 5 or Fewer Years of Experience
51. Average Years of Experience
52. % with Advanced Degrees
53. Teacher Turnover Rate
54. % African American
55. % Hispanic
56. % White
57. % Other
58. % Regular Education59. % Special Education
60. % Compensatory Education
61. % Bilingual/ESL Education
62. % Career & Technical Education
63. % Other Education (Includes G & T)
TAXES AND ACTUAL REVENUES
64. Taxable Value Per Pupil
65. Locally Adopted Tax Rate
66. Total Revenue (2008-09)
67. Total Revenue Per Pupil
68. % State
69. % Local and Other
70. % Federal
- FUND BALANCES
71. Fund Balance (End of 2008-09)
72. % Fund Balance (of 2009-10 Budget)ACTUAL EXPENDITURES
73. Total Expenditures (2008-09)
74. Total Operating Expenditures (2008-09)
75. Total Operating Expenditures Per Pupil
76. % Instructional
77. % Central Administrative
78. % School Leadership
79. % Plant Services
80. % Other Operating
81. Total Instructional Expenditures
82. Total Instructional Expenditures Per Pupil
83. % Regular Education
84. % Special Education
85. % Accelerated Education
86. % Bilingual/ESL Education
87. % Career & Technical Education88. % Gifted & Talented Education
89. % Athletics/Related Activities
90. % Other Expenditures
31.7
10.8
26.0
8 .9
2
6
91
1
808
3
1
3
4
418,262
1 .470
138,214,659
10,336
30
66
4
28,063,582
25
257,015,007
120,332,694
8, 999
58
6
5
10
20
70,239,108
5,253
70
15
5
4
2
1
4
1
On ly *f -fofris
Item Definitions | Snapshot 2010 | Snapshot | Performance Reporting
CalculatedDistrict „. . . . K1 Superintendent vrfv Base ,, „
vrrv vDistrict Namer
XT FTE „ ruHMh EnrollmentN u mb e r Name Pay Drl\
R gn County
10 199901 BAILEY, JI $222,500* $222,500 14,072
http://ritter.tea.state.tx.us/cgi/sas/broker 3/24/2011
8/7/2019 Red Apple Summary RISD
http://slidepdf.com/reader/full/red-apple-summary-risd 3/3
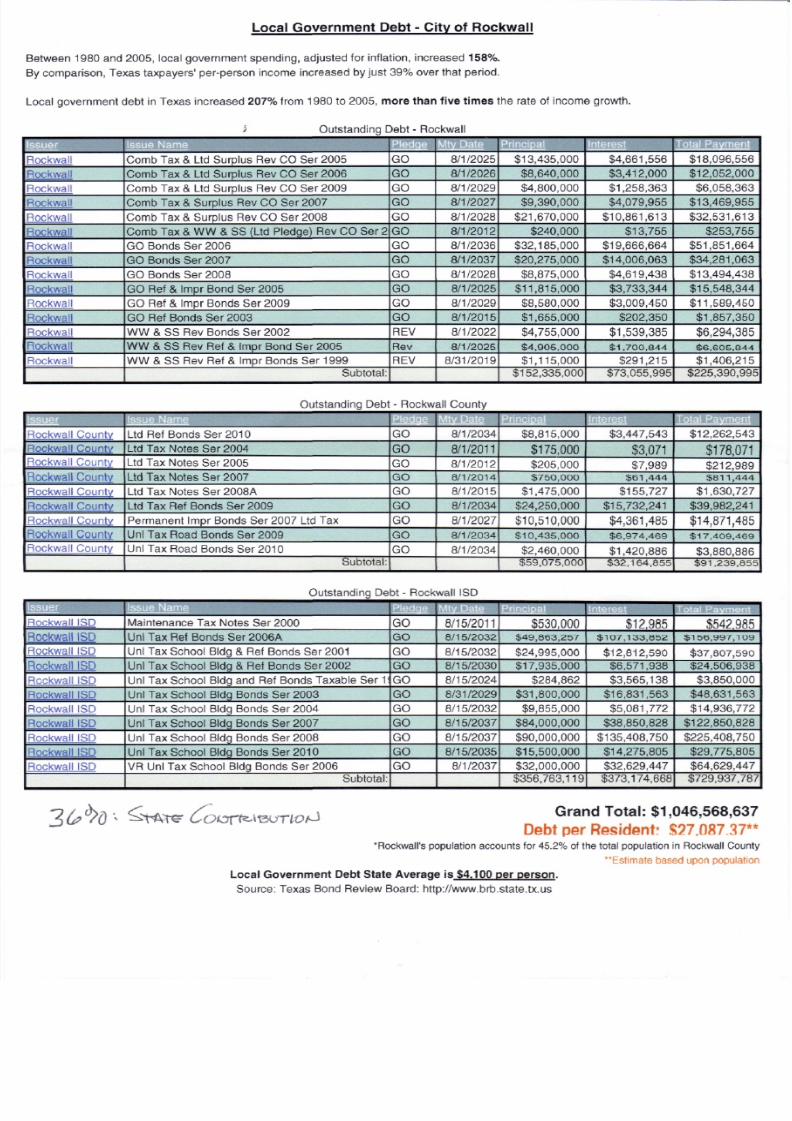
Local Governm ent Debt - City of Rockwall
1980 and 2005, local government spending, adjusted for inflation, increased 158%.
comparison, Texas taxpayers' per-person income increased by just 39 % over that period.
07% fro m 1980 to 2005, more than five times the rate of income growth.
Outstanding Debt - Rockwall
Comb Tax & Ltd Surplus Rev CO Ser 2005
Comb Tax & Ltd Surplus Rev CO Ser 2006Comb Tax & Ltd Surplus Rev CO Ser 2009
Comb Tax & Surplus Rev CO Ser 2007
Comb Tax & Surplus Rev CO Ser 2008
Comb Tax & WW & SS (Ltd Pledge) Rev CO Ser 2
GO Bonds Ser 2006
GO Bonds Ser 2007
GO Bonds Ser 2008
GO Ref & Impr Bond Se r 2005
GO Ref & Impr Bonds Se r 2009
GO Ref Bonds Ser 2003
WW & SS Rev Bonds Se r 2002
WW & SS Rev Ref & Impr Bond Se r 2005
WW & SS Rev Ref & Impr Bonds Ser 1999Subtotal:
GO
GOGO
GO
GO
GO
GO
GO
GO
GO
GO
GO
RE V
Re v
RE V
8/1/2025
8/1/20268/1/2029
8/1/2027
8/1/2028
8/1/2012
8/1/2036
8/1/2037
8/1/2028
8/1/2025
8/1/2029
8/1/2015
8/1/2022
8/1/2025
8/31/2019
$13,435,000
$8,640,000$4,800,000
$9,390,000
$21,670,000
$240,000
$32,185,000
$20,275,000
$8,875,000
$11,815,000
$8,580,000
$1,655,000
$4,755,000
$4,905,000
$1,115,000$152,335,000
$4,661,556
$3,412,000$1,258,363
$4,079,955
$10,861,613
$13,755
$19,666,664
$14,006,063
$4,619,438
$3,733,344
$3,009,450
$202,350
$1,539,385
$1,700,644
$291,215$73,055,995
$18,096,556
$12,052,000$6,058,363
$13,469,955
$32,531,613
$253,755
$51,851,664
$34,281,063
$13,494,438
$15,548,344
$11,589,450
$1,857,350
$6,294,385
$e,eos,Q44
$1,406,215$225,390,995
Outstanding Debt - Rockwall County
County
Countv
Countv
Countv
Countv
Countv
CountvCountv
Ltd Ref Bonds Se r 2010
Ltd Tax Notes Se r 2004
Ltd Tax Notes Se r 2005
Ltd Tax Notes Ser 2007
Ltd Tax Notes Ser 2008A
Ltd Tax Ref Bonds Se r 2009
Permanent Impr Bonds Se r 2007 Ltd Tax
Unl Tax Road Bonds Ser 2009Unl Tax Road Bonds Ser 2010
Subtotal:
GO
GO
GO
GO
GO
GO
GO
GOGO
8/1/2034
8/1/2011
8/1/20128/1/2014
8/1/2015
8/1/2034
8/1/2027
8/1/2034
8/1/2034
$8,815,000
$175,000
$205,000$750,000
$1,475,000
$24,250,000
$10,510,000
$10,435,000
$2,460,000$59,075,000
$3,447,543
$3,071
$7,989$61 444
$155,727
$15,732,241
$4,361,485
$6,974,469
$1,420,886$32,164,855
$12,262,543
$178,071
$212 989$811,444
$1,630,727
$39,982,241
$14,871,485
$17,409,469
$3,880,886$91 ,239,855
Outstanding Debt - Rockwall ISP
ISD
iS D
ISD
K w a l l ISD
ISD
Maintenance Tax Notes Ser 2000
Unl Tax Ref Bonds Ser 2006A
Unl Tax School Bldg & Ref Bonds Ser 2001
Unl Tax School Bldg & Ref Bonds Ser 2002
Unl Tax School Bldg and Ref Bonds Taxable Se r 1 (
Unl Tax School Bldg Bonds Ser 2003
Unl Tax School Bldg Bonds Ser 2004Unl Tax School Bldg Bonds Ser 2007
Unl Tax School Bldg Bonds Ser 2008
Unl Tax School Bldg Bonds Ser 2010
VR Unl Tax School Bldg Bonds Se r 2006Subtotal:
GO
GO
GO
GO
GO
GO
GOGO
GO
GO
GO
8/15/20118/15/2032
8/1 5/2032
8/1 5/2030
8/1 5/2024
8/31/2029
8/15/20328/15/2037
8/1 5/2037
8/15/2035
8/1/2037
$530,000$49,863,257
$24,995,000
$17,935,000
$284,862
$31,800,000
$9,855,000$84,000,000
$90,000,000
$15,500,000
$32,000,000$356,763,119
$12,985$107,133,852
$12,812,590
$6,571,938
$3,565,138
$16,831,563
$5,081,772$38,850,828
$135,408,750
$14,275,805
$32,629,447$373,174,668
$542,985$156,937,103
$37,807,590
$24,506,938
$3,850,000
$48,631,563
$14,936,772$122,850,828
$225,408,750
$29,775,805
$64,629,447$729,937,787
Grand Total: $1,046,568,637
Debt per Resident! $27,087.37***Rockwall's population accounts for 45.2% of the total population in Rockwall County
"Estimate based upon population
Local Government Debt State Average is $4.100 per person.
Source: Texas Bond Review Board: http://www.brb.state.tx.us