Embed Size (px)
Citation preview
RECREATIONAL BOAT TRAFFIC SURVEYS OF BROWARD COUNTY, FLORIDA
FLORIDA FISH AND WILDLIFE CONSERVATION COMMISSION CONTRACT 03193
FINAL REPORT
Submitted to: Dr. Elsa M. Haubold Florida Fish and Wildlife Conservation Commission
Fish and Wildlife Research Institute (FWRI) 100 8th Avenue Southeast St. Petersburg, FL 33701
Submitted by: Mote Marine Laboratory
Center for Marine Mammal and Sea Turtle Research 1600 Ken Thompson Parkway
Sarasota, FL 34236 (941) 388-4441
(941) 388-4223 FAX
Jay F. Gorzelany
Mote Marine Laboratory, 1600 Ken Thompson Pkwy, Sarasota, FL 34236
6 June 2005
Mote Marine Laboratory Technical Report Number 1017
1
Title Of Project: Boat Traffic Surveys of Broward County, Florida
Principal Investigator: Jay Gorzelany, Mote Marine Laboratory, 1600 Ken Thompson
Parkway, Sarasota, FL 34236
Goals Of The Project: To characterize boating patterns in Broward County, Florida and
provide information leading to the completion of the Broward County Boat Facility Siting Plan
and Manatee Protection Plan (MPP).
Introduction:
Assessments of recreational boating activity and boater compliance have been identified
as important tools for both waterway management and manatee protection (USFWS, 2001). In
spite of the fact that watercraft-related deaths still account for 25 to 30 percent of the annual
manatee mortality, (FWC Fish and Wildlife Research Institute data), information regarding on-
water boating activity is lacking during the development process of county-wide manatee
protection plans. Counties typically rely upon the numbers of registered vessels, and the quantity
and distribution of boat facilities (marinas, boat ramps, etc) within the county in order to
“characterize” boat use. Spatial and temporal patterns of boating use, however, are frequently
unavailable. Where regulatory speed zones have been established, either no determination of
boater compliance has been performed, or information is limited to data provided by law
enforcement agencies during on-water activities. Recent studies of recreational boating activity
and boater compliance (Gorzelany, 1996, 1998, 2000; Morris, 1994; Shapiro, 2001; Tyson and
Combs, 1999) have provided valuable information that has lead to improved management of
Florida waterways.
2
With more than 266 miles of fresh and estuarine waterways and thousands of natural and
man-made lakes, Broward County, Florida has an abundance of surface waters used for many
purposes by residents and visitors, and by the fish and wildlife that depend on these waters for
survival. With the exception of a few natural, freshwater ponds and remnant rivers, the majority
of waterways in Broward County are comprised of hardened shoreline and man-made canals.
The extensive canal network throughout Broward was constructed in the early 1900s for flood
control and drainage to facilitate land development (Broward County DPEP). Recreational
boating is a significant business in Broward County, representing an estimated $8.8 billion
economic impact. Estimated at 1,000 marine businesses, Broward County is the leading
contributor of marine sales in Florida with 29 percent of all marine-related sales (Marine
Industries Association of Florida data). Approximately 1,400 megayachts visit South Florida
annually, relying upon area boatyards for service, refit, and repair. Of the 46,347 registered
vessels in Broward County, 30 percent are designated as greater than 26 feet in length (Florida
Department of Highway Safety and Motor Vehicles data).
Manatee use in Broward County is well-documented, and this area has been designated as
one of 13 “key” counties in Florida required to develop a comprehensive Manatee Protection
Plan (MPP). Information on the distribution of manatees throughout the county is available from
a series of aerial survey projects which were conducted by the Florida Department of Natural
Resources (now FWC) in 1988-90 and by Broward County DPEP in 1991-92. Additional aerial
survey information on winter season distribution is available from a series of statewide manatee
synoptic surveys that are managed by the State of Florida, and from aerial surveys funded by
Florida Power and Light Company (FPL). Synoptic survey data from Broward County extends
back to 1991, while FPL surveys in proximity to Broward County power plants have also been
3
conducted annually since 1977 (Reynolds, 2004). These studies provide a long term database of
information on manatee abundance and trends in the Ft. Lauderdale area. Radio and satellite
telemetry data from tagged manatees utilizing Broward County waters has also been collected
(Reid et al., 1991, Deutsch et al., 2003). Finally, a database of information on manatee mortality
in Broward County extends back to 1974 (FWC Fish and Wildlife Research Institute data).
While evidence suggests that some manatees are found in Broward County year-round, the
population is essentially seasonally migratory, with large winter aggregations of animals
occupying the areas adjacent to two power plants (Mezich, 2001).
A total of 144 manatee deaths have been reported in Broward County between 1974 and
2003. Of these, 66 deaths were attributed to human-related causes (54 watercraft-related deaths,
6 flood gate / lock deaths, and 6 deaths from other human-related causes). While the absolute
number of human-related manatee deaths in Broward County is relatively low (ranked 8th among
the 13 key Florida counties), the relative proportion of deaths from human causes (47%) is
relatively high (ranked 3rd among the 13 key counties). By comparison, human-related deaths
account for 35% of all manatee deaths among the 13 key Florida counties and, and 30% among
all Florida counties combined. The counties with the highest proportion of human-related
deaths are all located in southeast Florida (Dade, Martin, Broward, and Palm Beach). This is an
indication that areas of conflict between manatees and human-related activity are particularly
common in some of the most highly developed areas of the state and suggests an ongoing
resource conflict between human activity (boating) and manatee use in these areas.
While significant progress has been identified, the Broward County MPP remains
incomplete. One component that has been identified as lacking is a better understanding of boat
traffic patterns within the county. This report summarizes a one-year study of boating activity in
4
Broward County conducted during 2004 and 2005. The purpose of this work was to provide
critical information necessary for the development and implementation of a comprehensive MPP
for Broward County.
Methods:
Task 1: Aerial Surveys
County-wide low-level aerial surveys were performed using a Cessna 172 fixed-wing
aircraft. The single observer/videographer method, used successfully during similar boating
surveys (Gorzelany, 1998, Gorzelany and Flamm, 2004) was employed. For this method, a
single observer / videographer was seated in the right front seat of the survey aircraft. A
standard survey route was flown over the entire county, and an image-stabilizing Digital 8 Sony
camcorder with date and time imprint was used to record all vessels in-use. A vessel “in-use”
was defined as either 1) a vessel underway, or 2) a stationary vessel in the process of being used.
This included fishing, picnicking, sightseeing, or similar recreational activities, along with
vessels at short-term dockage or anchorage sites such as waterside restaurants, fuel docks,
waterside bait and tackle shops, fishing piers, boat ramps, beaches, spoil islands, or sand bars.
“In-use” did not include stationary vessels located at long-term storage facilities such as
anchorages, wet and dry storage marinas, or yacht clubs. Stationary (moored) vessels located at
single family or multi-family residential docks also were not considered “in use”. The observer
also provided voice-over audio recording of both location information and vessel information
through a remote microphone attached to an aircraft headset.
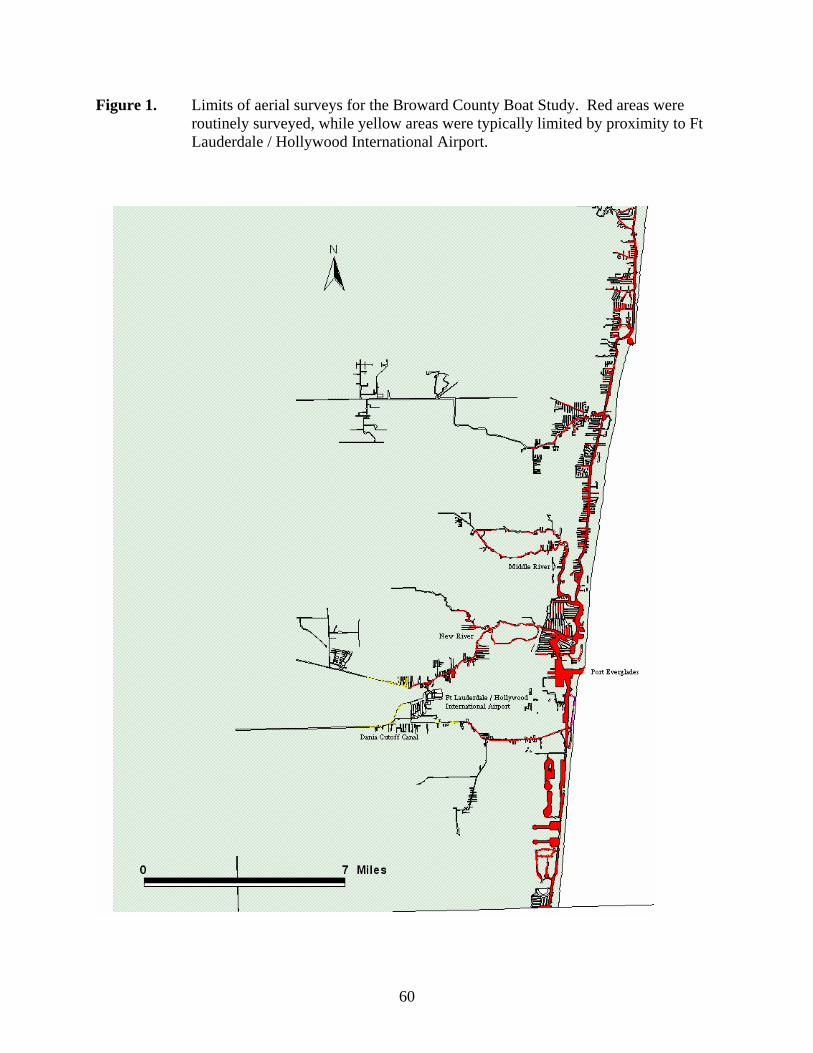
Aerial surveys were typically flown at an altitude of 1000 feet (304m), however altitude
was occasionally modified (either higher or lower) when instructed by local air traffic control
towers. All major waterways in Broward County were surveyed, including the entire length of
5
the Intracoastal Waterway (ICW), Hillsboro Inlet, Port Everglades, Stranahan River, Dania
Cutoff Canal, New River, Middle River, Cypress Creek, Pompano Canal, and all adjacent
residential canals. The typical survey area is provided in Figure 1. The flight path was also
modified at times in order to avoid air traffic conflicts with both Fort Lauderdale International
Airport and Fort Lauderdale Executive Airport. Due to occasional air traffic conflicts, the upper
portions of the Dania Cutoff Canal, New River, and Middle River were inaccessible at times and
surveys of these areas were somewhat limited.
A total of 17 county-wide aerial surveys (four surveys per quarter plus one holiday
weekend survey) were conducted. Two weekday and two weekend day surveys were conducted
during each quarter. Two individual surveys were flown per day (morning and afternoon). Start
times were also varied between flights. Pre-flight coordination with Port Everglades Security,
Broward County Law Enforcement, and Fort Lauderdale / Hollywood International Tower was
necessary in order to gain accessibility to restricted airspace within Broward County.
Once completed, original Digital 8mm aerial survey footage was transferred to DVD-R
format and analyzed for GIS mapping. Each recorded vessel in use was hand plotted onto a
series of digital orthophotos using ArcView GIS 8.3®. Data were linked to a Microsoft Excel
2002® spreadsheet, which provided vessel type, size, activity, relative speed, direction of travel
(if any) and a unique alphanumeric code for each vessel in- use observed.
Vessel type categories were identified as:
• Small Powerboat (SP) • Large Powerboat (LP) • Sail Boat (SA) • Personal Watercraft (PS) • Other (OT)
6
Vessel size categories were identified as:
• less than 11 feet • 12 feet –15 feet • 16 feet - 25 feet • 26 feet – 39 feet • 40 feet – 64 feet • 65 feet – 109 feet • greater than 110 feet
Vessel activity was identified as:
• Anchor / Drift (A) • Travel (T) • Ski / Sport (S) • Commercial (C)
Vessel speeds were identified as:
• Idle / Slow (SL) • Plowing (PW) • Cruising (CR) • Planing (PL) • Under Sail (US)
Along with vessel data, environmental conditions including weather, wind speed and
direction, and surface conditions, were recorded. Boating conditions were also qualitatively
evaluated as (Poor, Fair, Good, Excellent). To ensure accuracy, a minimum of 50 percent of all
plotted data were rechecked against the original video footage.
All GIS data, including .shp, .shx, .txt files, and associated metadata and dictionary files
were provided as a deliverable to the FWC Fish and Wildlife Research Institute. All original
video footage (in both Digital 8 and DVD-R format) was retained and archived.
7
Task 2: Fixed Point Surveys
Three fixed point boat traffic survey sites were established. Survey sites were located
along the Hugh Taylor Birch State Park, along the lower New River at Colee Hammock Park,
and at John U. Lloyd State Park (Figures 2 and 3). The Colee Hammock site provided
observation of all vessel traffic along the New River. The Hugh Taylor Birch survey site
provided observation along the ICW between Port Everglades and Hillsboro Inlet, and the John
Lloyd site provided observation of vessel traffic along the ICW south of Port Everglades, and of
all vessel traffic entering and exiting the Dania Cutoff Canal.
Four days of summer surveys (two weekdays and two weekend days) were conducted
during July and August 2004, and four days of winter surveys (two weekday and two weekend
day) were conducted during February 2005 at each survey site. Summer and winter surveys
were conducted in order to capture any potential changes in boat traffic patterns and boater
compliance resulting from changes in seasonal manatee speed zone regulations affecting portions
of the county during the winter. All three sites were surveyed on the same days. Both morning
(0900-1200hrs) and afternoon (1300-1600hrs) survey intervals were conducted at each site.
Teams of observers stationed at each site recorded each vessel transitioning within an established
viewing area. For each boat observation, the time of day, vessel type, size, origin, destination,
registration number (when possible) and qualitative speed were recorded on standard field data
sheets. Survey parameters were recorded using standard boat survey methods established for
previous compliance studies conducted in southwest Florida (Gorzelany, 1996, 1998, 1999).
8
Vessel size categories, taken from standard FWC Law Enforcement size classes, were
designated as:
• Less than 12 feet • 12 to 15 feet • 16 to 25 feet • 26 to 39 feet • 40 to 64 feet • 65 to 109 feet • Greater than 109 feet
Vessel type classes were designated as follows:
• Open Fisherman (OF) • Ski / Sport / Runabout (SK) • Deck Boat (DK) • Yacht / Cruiser (YT) • Pontoon Boat (PT) • Personal Watercraft (PS) • Scarab / Cigarette (SC) • Jonboat (JN) • Sail Boat (SA) • Other (OT)
In addition, each vessel was further designated as either private, commercial, rental, or
enforcement.
Vessel speed definitions were taken from Gorzelany (1999, 2000) and were originally
adapted from the Florida Administrative Code 62N-22. Individual speed categories are described
as follows:
• Idle Speed: The minimum speed that maintains steerage of a vessel, or the speed at
which a vessel is normally docked. Little or no displacement of water is observable from
either the bow or stern, and the vessel remains level in the water at all times. This speed
has also been defined as approximately 1 to 3 miles per hour (Sarasota County, 1994).
9
• Slow Speed: The speed at which all vessels are completely off plane and fully settled in
the water. Some minimal water displacement at either the bow or stern (or both) may be
observed. This speed has also been defined as approximately 5 to 7 miles per hour
(Sarasota County, 1994).
• Plowing Speed: An intermediate speed between planing speed and slow speed. The bow of
the vessel typically rides higher than the stern, and substantial displacement of water occurs.
Depending on the size and type of vessel, plowing may occur at a variety of speeds, but is
most often observed between 10-20 miles per hour (Gorzelany, 2000). This speed
designation is used specifically for vessels with planing-type hulls.
• Cruising Speed: A qualitative speed designation uniquely applied to a relatively fast-
moving vessel with a non-planing-type hull (e.g.; a pontoon boat or displacement hull
vessel). It is identified by noticeable water displacement from the bow and/or stern and
an observed speed faster than the previously defined Slow Speed designation. Similar to
those at Plowing Speed, vessels at Cruising Speed most often travel at speeds between
10-20 miles per hour (Gorzelany, 2000).
• Planing Speed: A vessel traveling at sufficient speed to partially raise the bow out of the
water during travel. Vessel planing speeds vary widely depending upon vessel size and hull
design; however the majority of planing vessels travel at speeds in excess of 15 miles per
hour (Gorzelany, 1996).
Standard criteria for boater compliance were established and defined as follows:
• Compliance: Any vessel in-use that was observed to maintain a speed that was consistent
with the posted speed restriction in the study area.
• Technical Non-Compliance: A vessel that was observed to be in violation of the posted
speed at a study site, as defined by:
10
1) A vessel transitioning at one speed category faster than the posted speed limit (Example:
a vessel traveling at slow speed in an Idle Speed Zone, or a vessel traveling at plowing or
cruising speed in a Slow Speed Zone); or
2) A vessel at any excessive speed, but only for a relatively short distance within the posted
area (Example: a speeding vessel which extends a short distance into a Slow Speed Zone or
Idle Speed Zone before settling off plane, or a vessel which accelerates out of a Slow Speed
Zone or Idle Speed Zone before leaving the posted area).
• Blatant Non-Compliance: A vessel transitioning at a speed greater than one speed category
faster than the posted limit through a significant portion of a speed-restricted area (Example:
a vessel traveling at planing speed in a Slow Speed Zone or a vessel traveling at plowing or
planing speed through an Idle Speed Zone).
Because of the subjective nature of these definitions, clear distinctions between boat
speeds were difficult in certain instances. On occasions when observers were undecided between
two speed categories, they were instructed to select the more conservative, or slower speed. This
provided a potential underestimate rather than an overestimate of non-compliance (Gorzelany,
1996). By potentially underestimating the number of non-compliant boaters, results will
essentially provide a “best-case” estimate of speed zone effectiveness in a given area.
Along with vessel data, environmental conditions including weather, wind speed and
direction, and wave height were recorded. Boating conditions were also qualitatively evaluated
as Poor, Fair, Good, or Excellent. Additional comments related to vessel identification, type, or
specific activity were also recorded as needed. Incidental marine mammal sightings were also
noted for each survey location.
11
Data Management and Analysis
In order to standardize field data collection, each field observer was briefed on proper use of field
data codes and definitions prior to sampling. Experienced observers who had participated in
previous boat traffic studies were initially paired with new observers in order to provide on-site
training and consistency in data collection. The Principal Investigator participated in all field data
collection. At the completion of each sampling event, the team leader for each observation site was
required to review all original field data for accuracy and completeness. Any observations having
incomplete data were eliminated. After computer data entry, a minimum of 10 percent of data from
each survey site was rechecked against the original data sheets in order to ensure accuracy in
computer data entry. Backup copies of all data were maintained. Original field data sheets were
archived for future reference. Fixed point survey data was compiled and entered in spreadsheet
format, sorted, tabulated, and analyzed graphically using Microsoft Excel 2002®.
Results:
Aerial Surveys
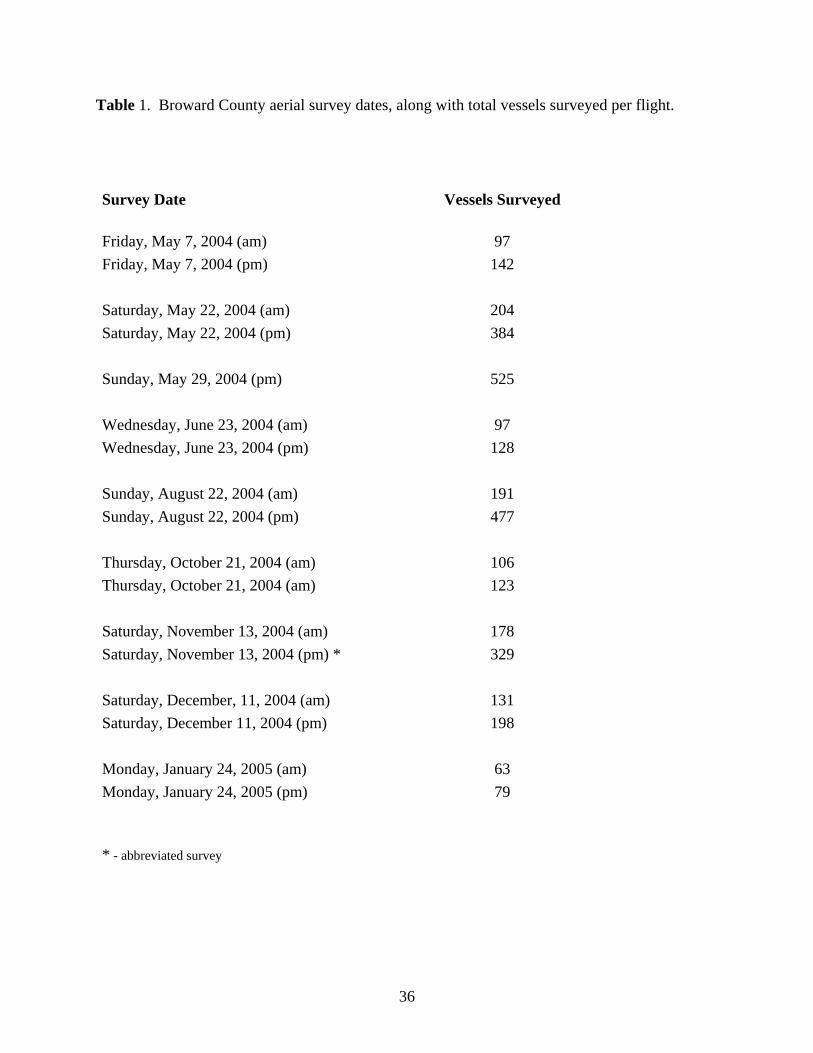
A total of 17 aerial surveys of Broward County was completed, including eight weekday surveys,
eight weekend surveys, and one survey conducted over Memorial Day weekend (May 24, 2003).
Boating conditions were evaluated as either “Good” or “Excellent” during each flight. A total of
2,927 vessels in-use was surveyed over 16 regular flights. An additional 525 vessels were
surveyed during the 5/29/04 Memorial Day Weekend flight. A list of aerial survey dates, along
with total vessels surveyed and plotted, is provided in Table 1. Due to conflicts with air traffic
in proximity to both Fort Lauderdale International Airport and Fort Lauderdale Executive
Airport, portions of Broward County could not be surveyed at times. In particular, surveys along
12
the upper portion of the Dania Cutoff Canal were limited due to close proximity to the approach
and departure runways at Fort Lauderdale / Hollywood International Airport. Similar problems
occurred at times when attempting to survey the upper portions of the Middle River (near Fort
Lauderdale Executive Airport).
Boating conditions were evaluated as “Good” or “Excellent” for all flights. The highest
non-holiday vessel count was observed during the afternoon survey on August 22, 2004 (n=477).
The lowest vessel count was observed during the morning survey on January 24, 2005 (n=63).
Overall highest survey count occurred during the Memorial Day weekend survey on May 29,
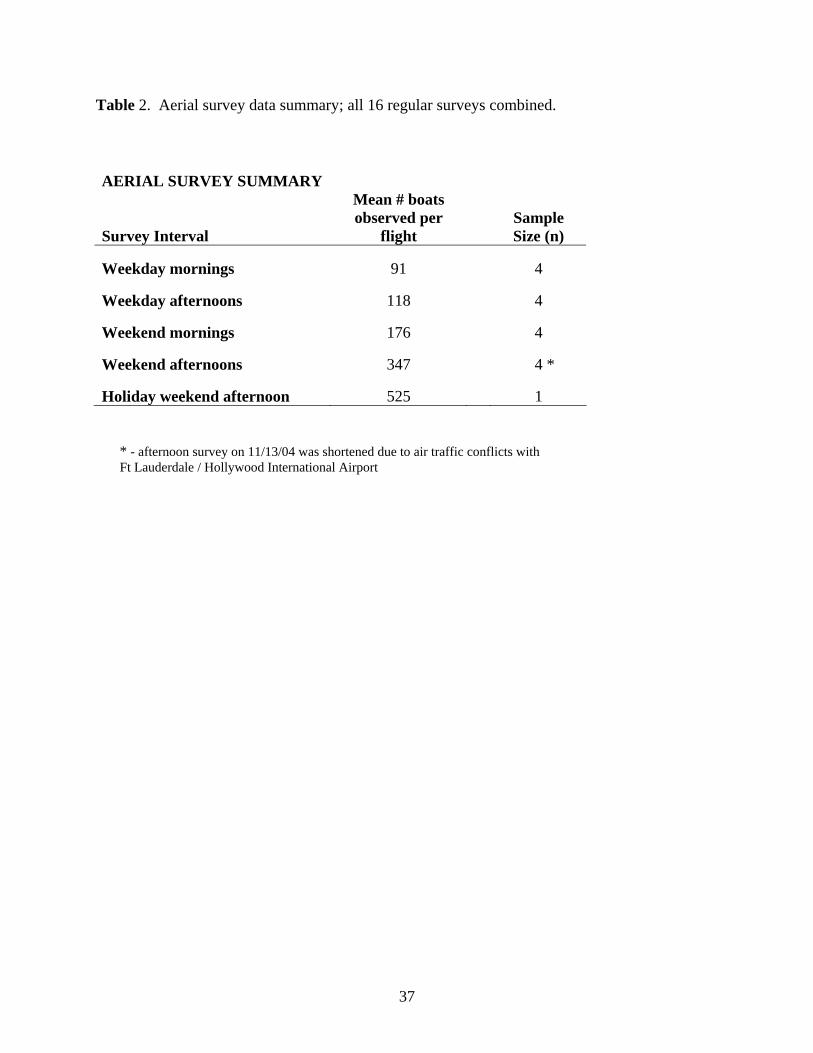
2004 (n=525). An average of 104 boats in use per survey were observed during weekdays, and
an average of 261 boats in use per survey were observed during weekends (2.51:1 ratio). A
larger number of boats in use were also typically observed during afternoon survey intervals
(Table 2). Lowest vessel counts in general were observed during winter surveys (December and
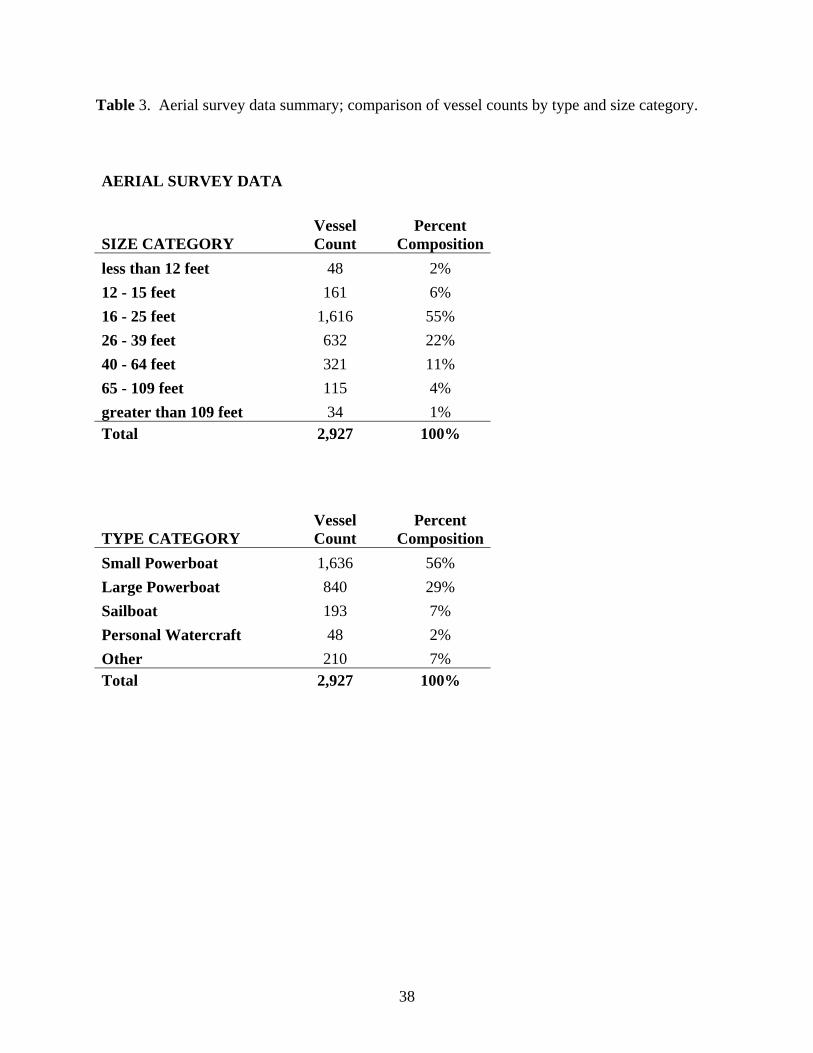
January). Of the 2,927 vessels surveyed, 1,102 (38%) were identified as greater than 25 feet in
length, and 149 (5%) were identified as greater than 64 feet in length. The most common size
category was vessels from 16 to 25 feet in length (55% of all vessels observed). Small
powerboats comprised 5 percent of all vessels surveyed. Sailboats comprised 7 percent, and
personal watercraft comprised 2 percent. Vessels identified as “Commercial”, including barges,
cargo vessels, tug boats, tenders, water taxis and buses, and sightseeing/tour boats, comprised
5% of all vessels observed during aerial surveys. Rental boats could not be reliably identified
from aerial surveys. A summary of aerial survey data by type and size category is provided in
Table 3.
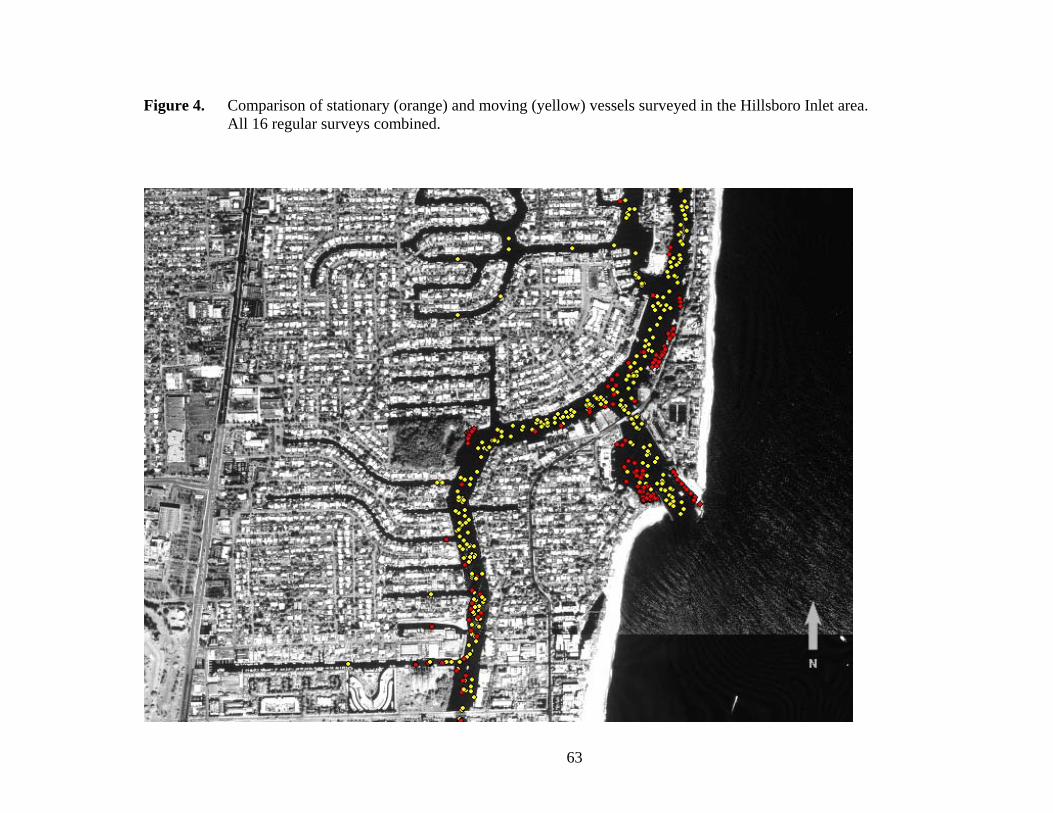
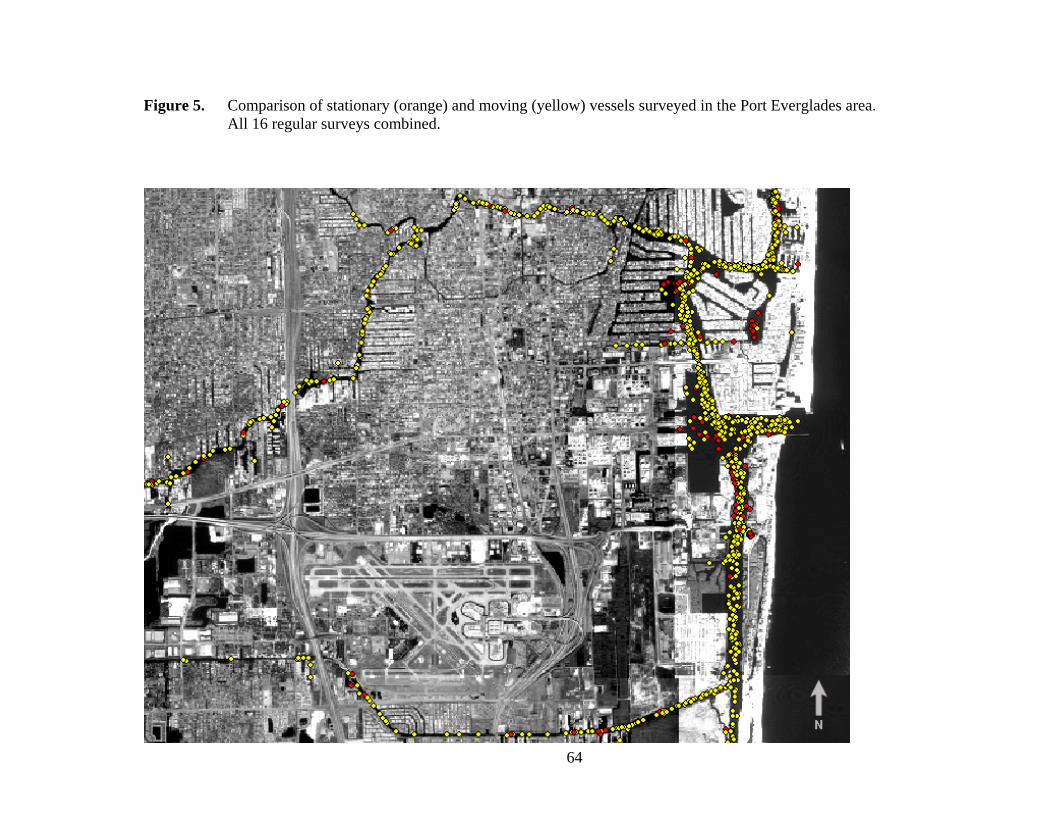
A composite GIS map depicting moving (all speeds) versus stationary (anchored/drifting)
boat traffic (all 16 regular survey flights combined) in two key areas (Hillsboro Inlet and Port
13
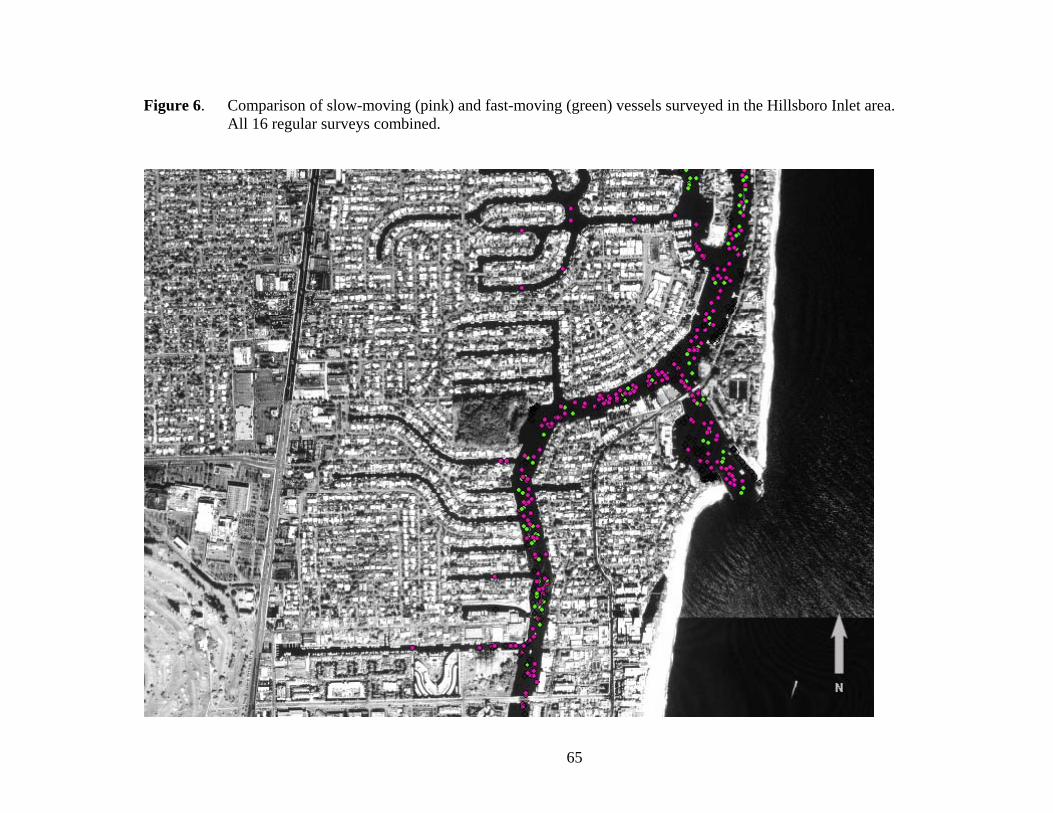
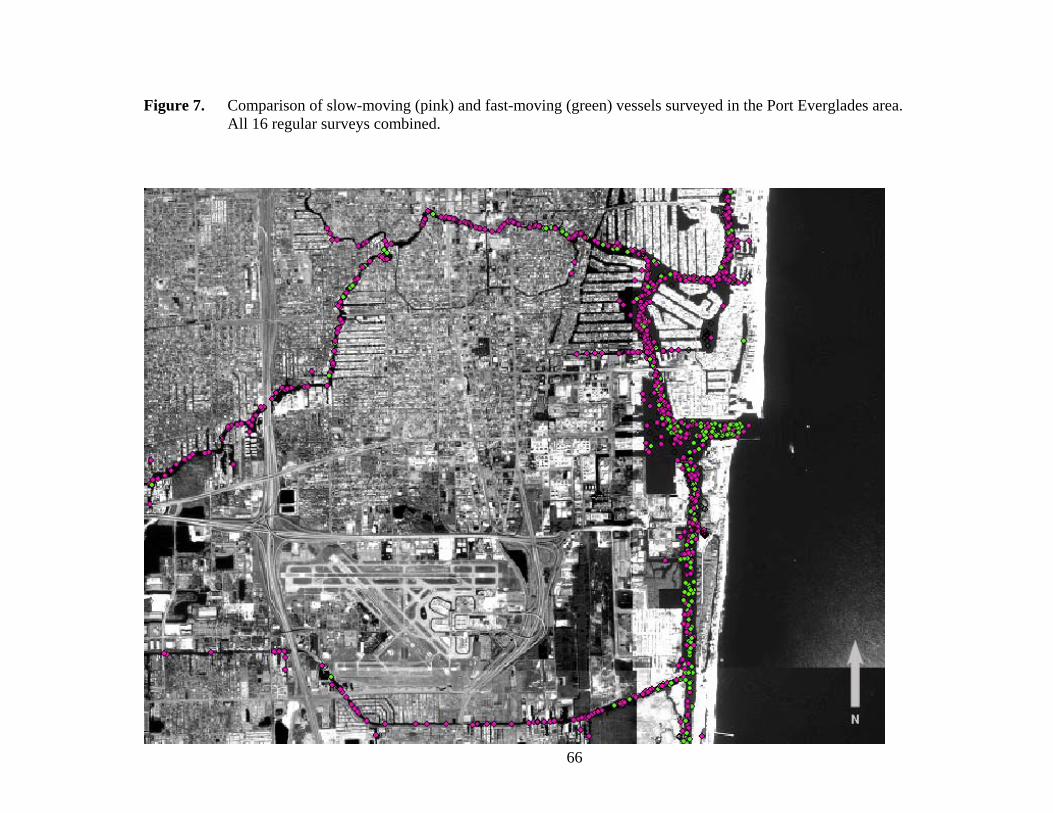
Everglades) is shown in Figures 4 and 5. A composite GIS map comparing slow-moving (idle,
slow) boat traffic with fast-moving (plowing, cruising, planing) boat traffic in the same two areas
is shown in Figures 6 and 7. Anchored / drifting vessels were relatively common in proximity
to Hillsboro Inlet and less common in proximity to Port Everglades Inlet. With the exception of
Hillsboro Inlet, few areas in Broward County were identified with aggregations of stationary
vessels. The majority of boat traffic in the County was comprised of vessels which were
underway. Fast-moving vessels were more common along the ICW and near the mouths of both
inlets. Slower-moving traffic was more common along other inshore waterways, such as the
New River and Dania Cutoff Canal.
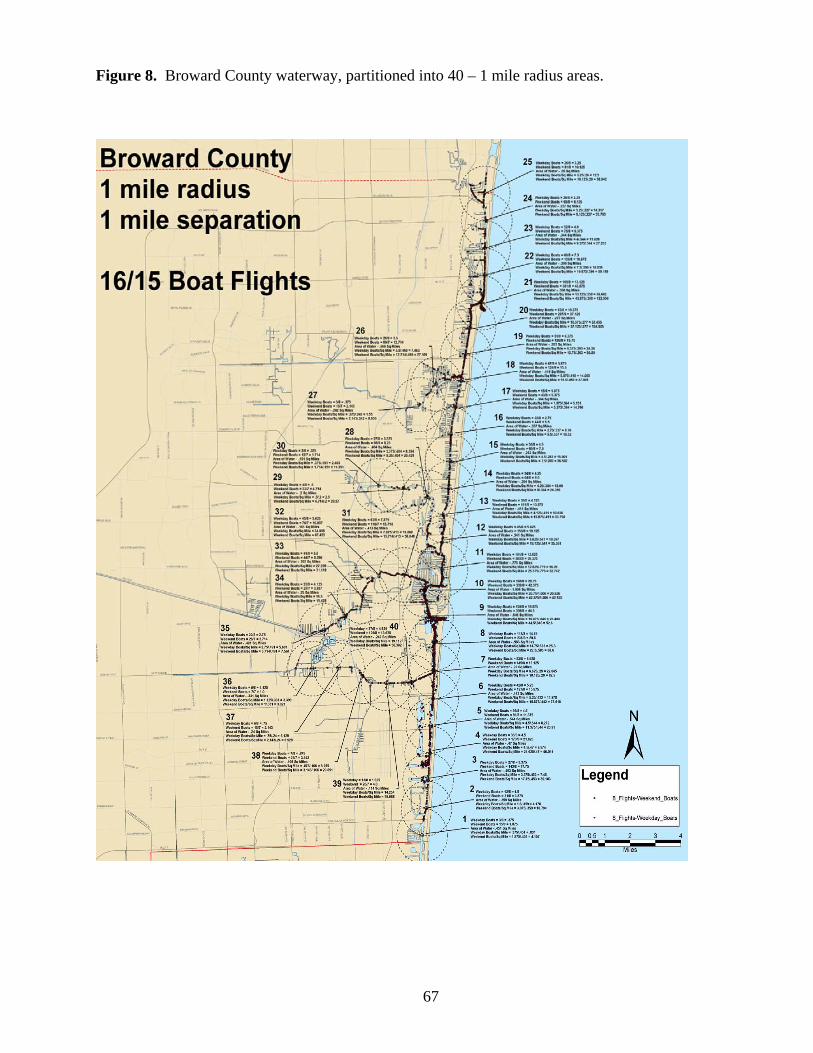
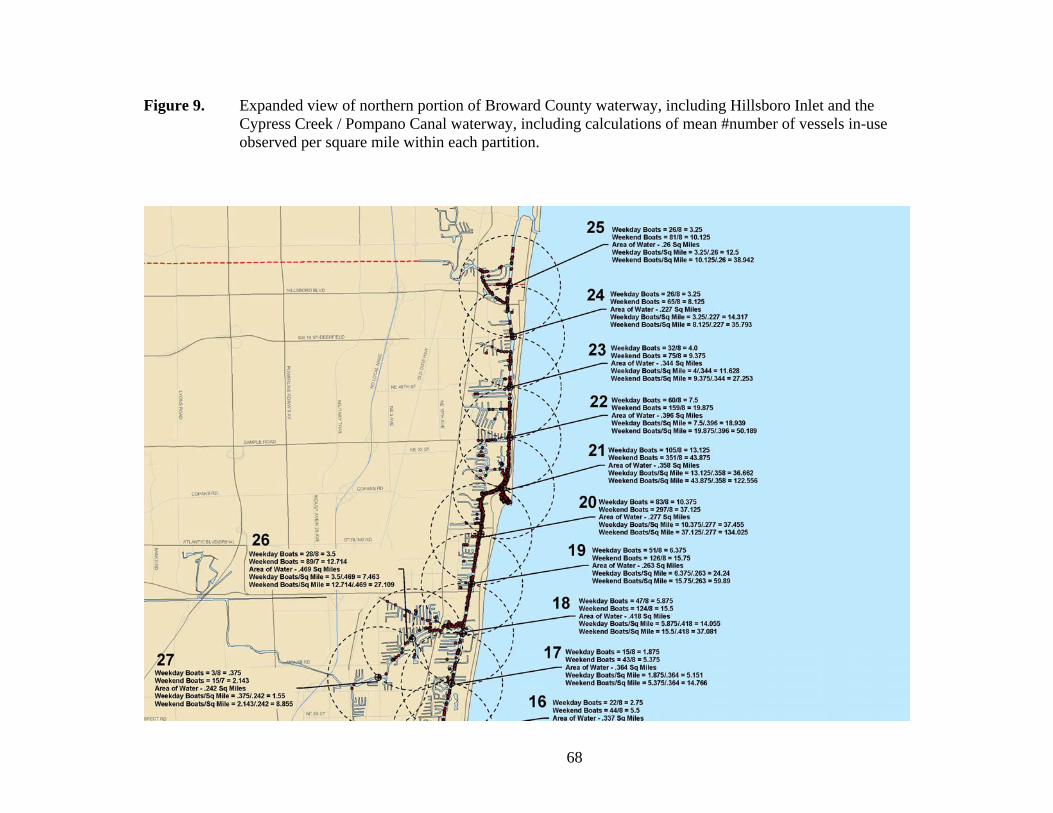
Aerial survey data were also standardized and examined quantitatively. First, a series of
40 - one mile radius circles were placed along the entire survey area. The area of inshore water
(Atlantic Ocean not included) was then calculated within each circle. Finally, the number of
vessels observed within each circle was counted in order to calculate the mean number of vessels
observed per survey flight (Figures 8 – 11). Results are summarized in Figures 12 and 13.
Areas with the highest concentrations of vessels in use were located in proximity to both tidal
inlets (Hillsboro Inlet and Port Everglades Inlet). Relatively high concentrations of vessels were
also located along the lower portion of the New River and Stranahan River. Lowest
concentrations of vessels were found along the upper portions of the Middle River, Cypress
Creek, Pompano Canal, and Dania Cutoff Canal. Relatively low concentrations of vessels were
also observed along the ICW near the south County line. Results were consistent for both
weekend and weekday aerial survey data. It should be noted that aerial surveys along the upper
portions of the Dania Cutoff canal were incomplete due to limited access to this area.
14
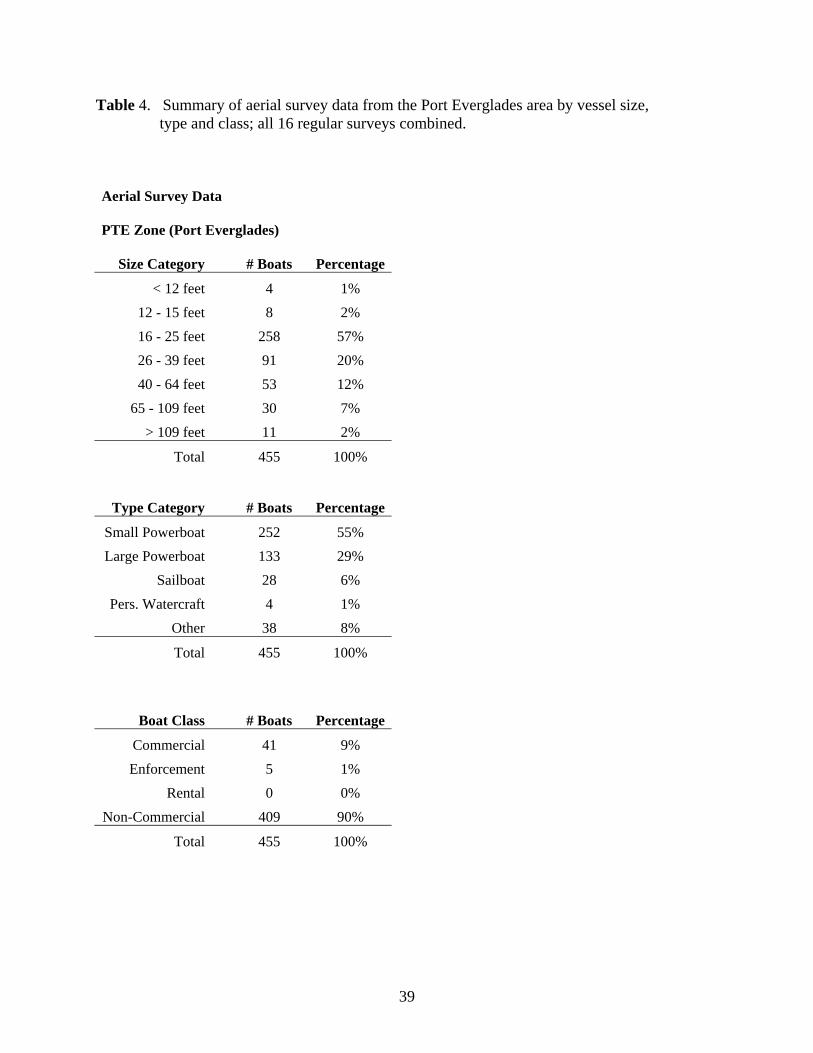
Port Everglades
Boat traffic in proximity to Port Everglades was also examined separately. For the purposes of
analysis the Port Everglades “area” was defined as all navigable waters between the Brooks
Memorial Causeway and the Dania Cutoff Canal. A composite plot of all vessels in use
observed in the Port Everglades area (all 16 regular surveys combined) is provided in Figure 14.
Overall, non-commercial boat traffic comprised 90 percent of all vessels in use observed in the
Port Everglades area. Commercial boat traffic comprised 9 percent of all boat traffic, and
enforcement vessels comprised the remaining 1 percent.
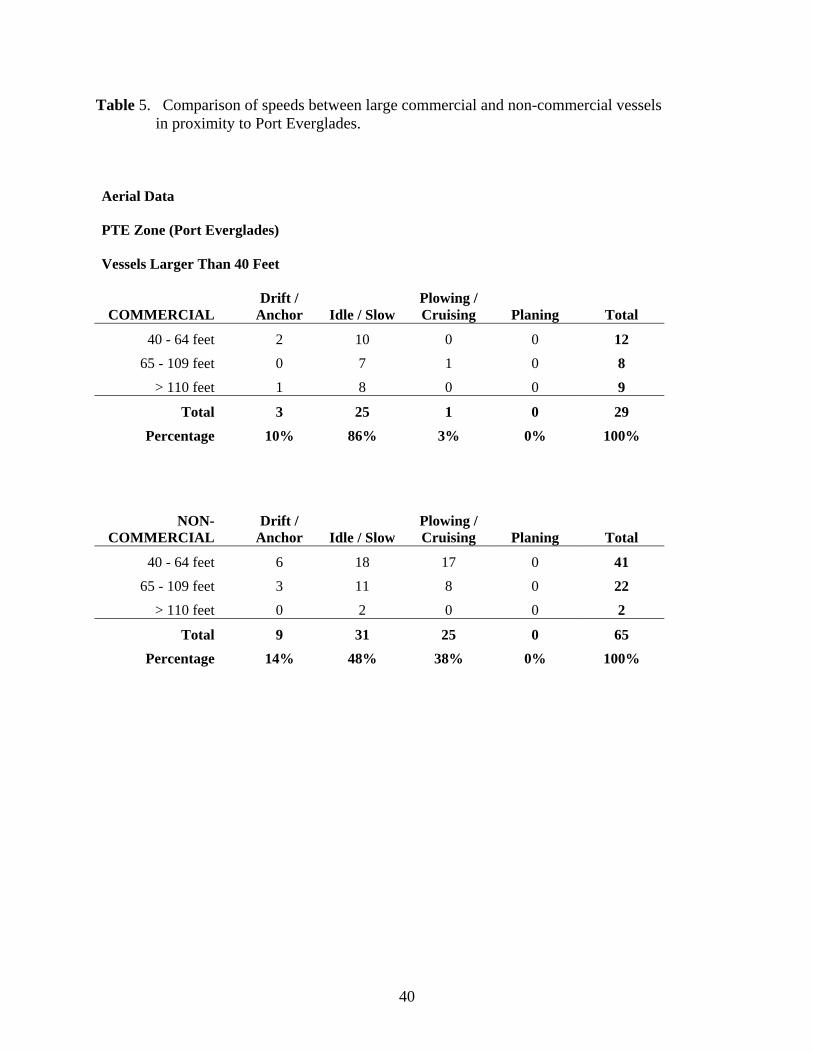
Large vessels (40 feet in length and greater) comprised 21 percent of all vessels observed
in the Port Everglades area. Smaller vessels (less than 26 feet in length) comprised 60 percent of
all vessels in use. Of the vessels observed in the Port Everglades area which were larger than 40
feet in length, 31percent were identified as commercial and 69 percent were identified as non-
commercial. A summary of vessels in use in the Port Everglades area is provided in Tables 4
and 5. For all large commercial vessels, 96 percent were identified as either at anchor, drifting,
or traveling at slow speed. For all large non-commercial vessels, 62 percent were identified as
either at anchor, drifting, or traveling at slow speed. The remainder (38%) were traveling at
either plowing or cruising speed.
Metadata and data dictionaries for Broward County aerial surveys are provided in
Appendix A and B.
Fixed Point Surveys
A total of 48 survey hours was conducted at each fixed point survey site (8 survey days x
6 hours per day). Afternoon intervals were modified slightly during summer surveys in order to
compensate for severe thunderstorms on July 30. A total of 5,489 vessel passes was recorded,
15
including 2,001 vessel passes at the Colee Hammock (CH) site, 1,419 vessel passes at the Hugh
Taylor Birch (HTB) site, and 2,069 vessel passes at the John Lloyd (JL) site. Because the same
vessel may have been observed multiple times, vessel counts are expressed as “vessel passes”, in
order to more accurately describe the number of times which any vessel (whether the same or
not), transitioned through the survey area.
Survey dates, along with total vessels surveyed per date, are provided in Table 6.
Comparisons By Vessel Size
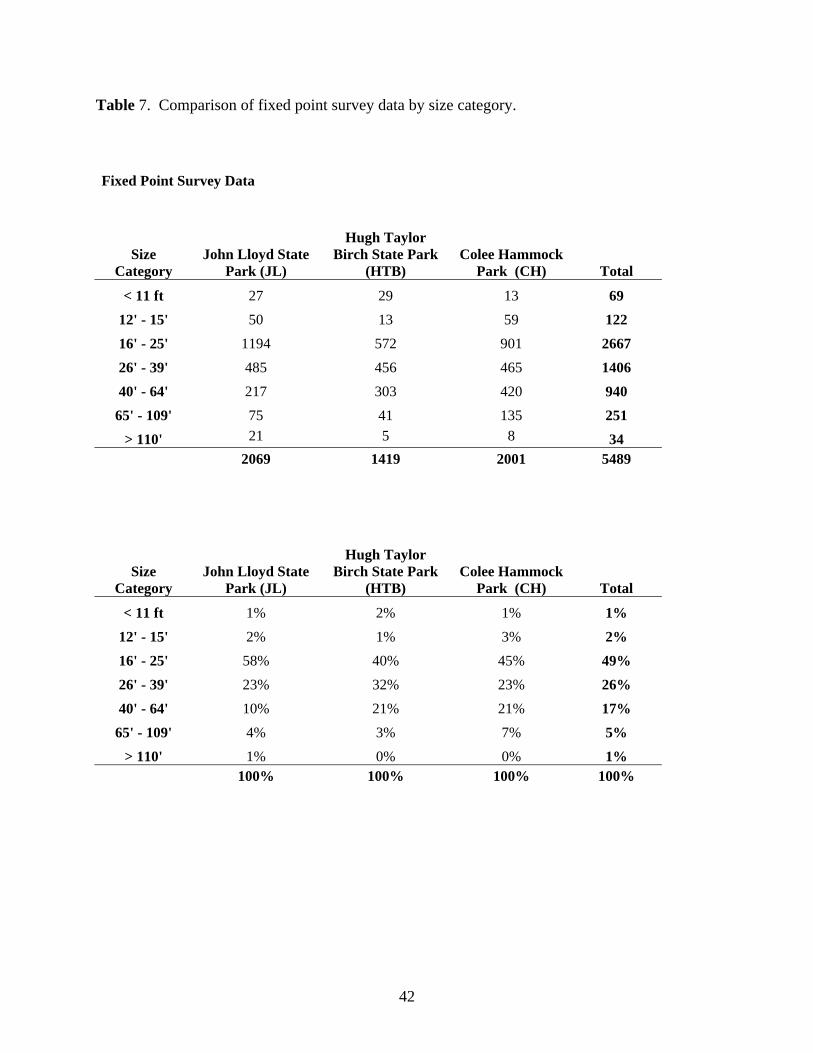
A summary of boat traffic composition by vessel size category is provided in Figures 15-17.
Vessels ranging from 16’-25’ in length comprised the single largest size category at all three
sites. Vessels larger than 25 feet in length comprised greater than 50 percent of all vessels
observed at both the CH and HTB sites. The largest proportion of very large vessels (greater
than 64 feet in length) was observed at the CH site (7%). While a higher proportion of smaller
vessels was observed at the JL site, this site also had the largest proportion of vessels greater than
109 feet in length. Small vessels (less than 16 feet in length) comprised less than 5 percent of
boat traffic at all three survey sites. Comparisons of boat traffic by size category are also
summarized in Table 7.
Comparisons By Vessel Type
Vessel composition was somewhat similar among the three survey sites. The most common
vessel types at all three sites were Yacht/Cruiser and Open Fisherman, which comprised more
than two-thirds of all boat traffic (Figures 18-20). Sailboats comprised less than 5% of all
vessels observed at each site, and personal watercraft comprised less than 3% of all vessels
observed at each site. Vessels identified as “Other” comprised a relatively large proportion at the
CH site (19%). These vessels were primarily comprised of water taxis or similar transport
16
vessels which were regularly seen along the New River. These vessels were also relatively
common (9% of all vessel types) at the HTB site.
Vessels were also classified as either Commercial, Non-Commercial (Private), Rental, or
Enforcement. Results are summarized in Figure 21. The CH survey site had the largest
proportion of commercial boat traffic (16%), followed by the HTB Site (9%) and the JL site
(3%). As stated above, commercial traffic at both the CH and HTB sites was largely comprised
of water taxis, transports, and sightseeing boats. Commercial traffic at the JL site had a smaller
proportion of water transport boats, and a higher proportion of fishing charters, dive boats, tow
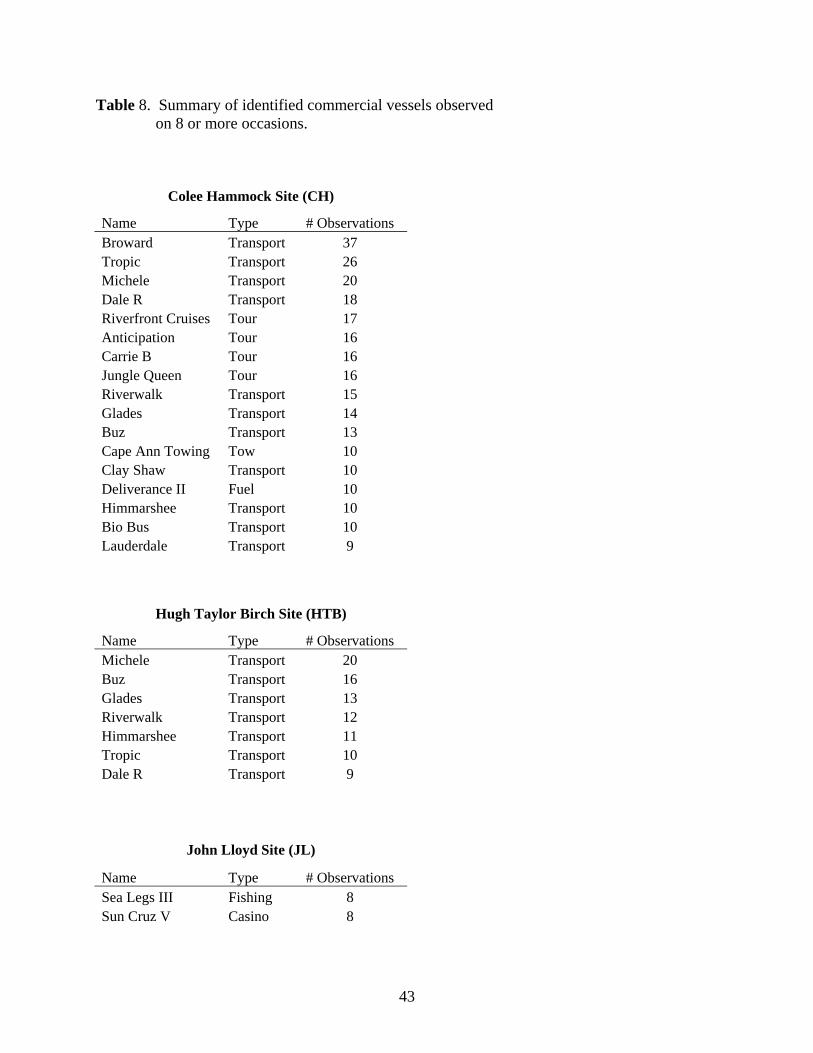
boats, and cargo vessels related to Port Everglades activities. A summary of common-observed
commercial vessels are provided in Table 8. Several commercial vessels, particularly water
taxis, were observed at multiple sites (CH and HTB). On-water enforcement agencies observed
included the Broward County Sheriff, Ft. Lauderdale Police, Florida Fish and Wildlife
Conservation Commission, Homeland Security, and Hollywood Police. Enforcement vessels
were observed most often at the JL and HTB sites (2% of all boat traffic). Enforcement vessels
comprised less than 1% of all boat traffic at the CH site. Vessels identified as rental boats
comprised a relatively small proportion of boat traffic at all three sites (1.3% at the CH site, 0.8%
at the HTB site, and 0% at the JL site).
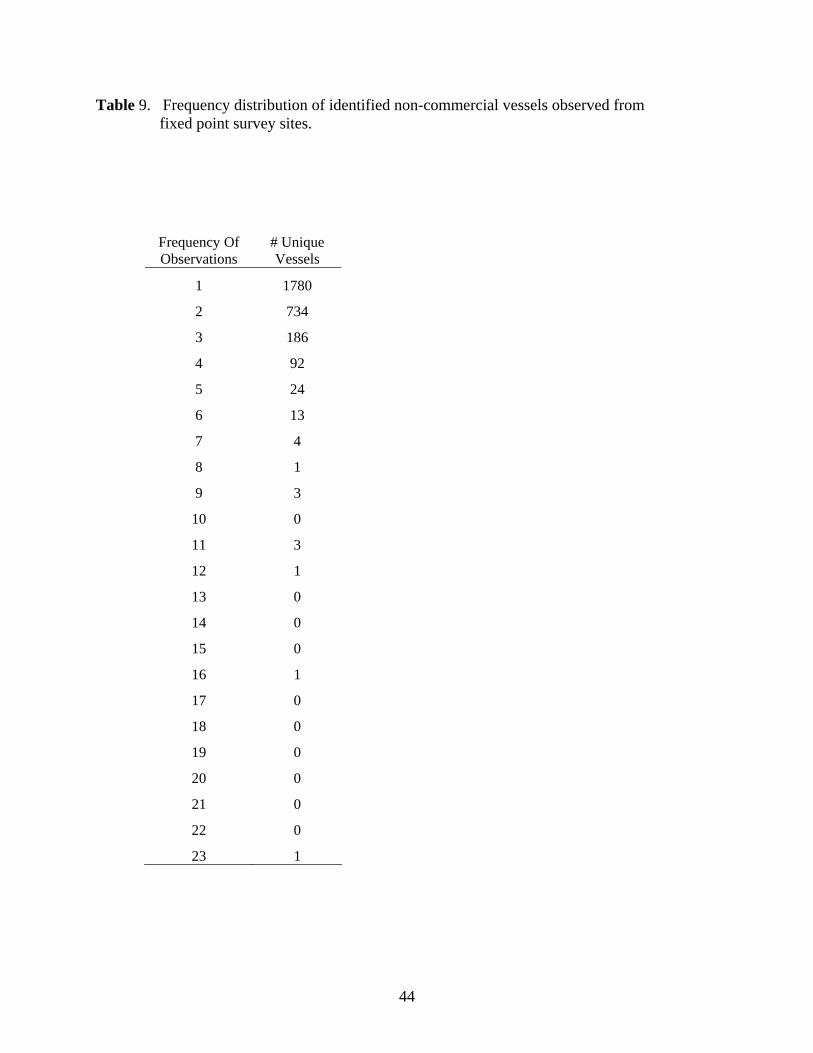
A vessel registration number or identifiable name was collected from 4,934 out of 5,489
vessel observations (90%). The remaining 10% of vessels were either recorded as NRD (no
registration displayed) or UNK (registration unknown). In many of these cases, the registration
number was either missing or unreadable. Of the 2,843 vessel passes with recorded non-
commercial registration numbers, 1,063 (37%) were observed more than once, 329 (12%) were
observed more than twice, and 143 (5%) were observed more than three times (Table 9).
17
Multiple sightings of the same vessel were also recorded at multiple survey sites. 150 vessels
were observed at both the CH and HTB sites, 114 vessels were observed at both the CH and JL
sites, 94 vessels were observed at both the HTB and JL sites, and 29 vessels were observed at all
three fixed point sites. Of the 2,843 vessel passes with recorded non-commercial registration
numbers, 249 (8.8%) were out-of-state registrations. Vessel registrations from 23 different states
were observed.
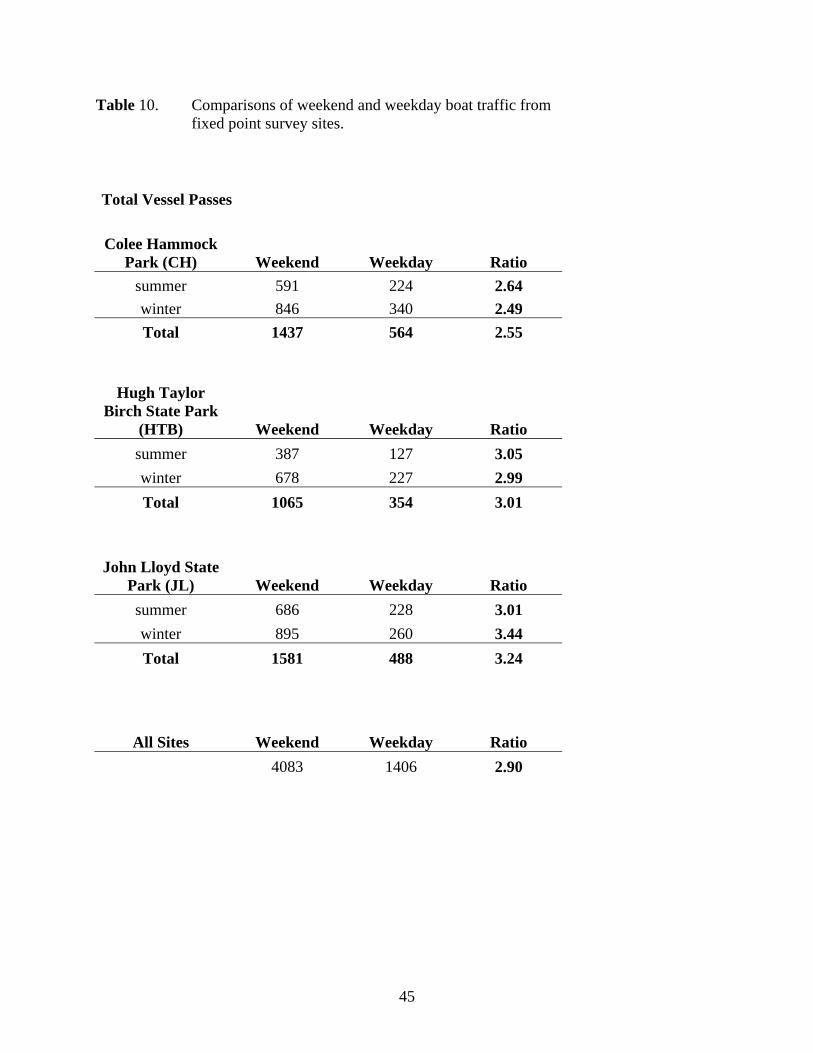
Weekday / Weekend Comparisons
As expected, a significant increase in traffic volume occurred on weekends at all three
sites. This trend was similar for both winter and summer surveys. At the CH Site, the number of
vessel passes increased from 23.5 per hour on weekdays to 59.9 per hour on weekends (a ratio of
2.55 to 1). At the HTB Site, an average of 14.8 vessel passes per hour were observed on
weekdays versus 44.4 vessel passes per hour on weekends (a ratio of 2.55 to 1). At the JL Site,
an average of 20.3 vessel passes per hour were observed on weekdays versus 65.9 vessel passes
per hour on weekends (a ratio of 3.24 to 1). For all three sites combined, the mean ratio between
weekend and weekday traffic volume was 2.90 to 1. Other boat parameters (type, size, activity)
remained essentially the same between weekday and weekend surveys. Comparisons between
weekday and weekend boat traffic are summarized in Table 10.
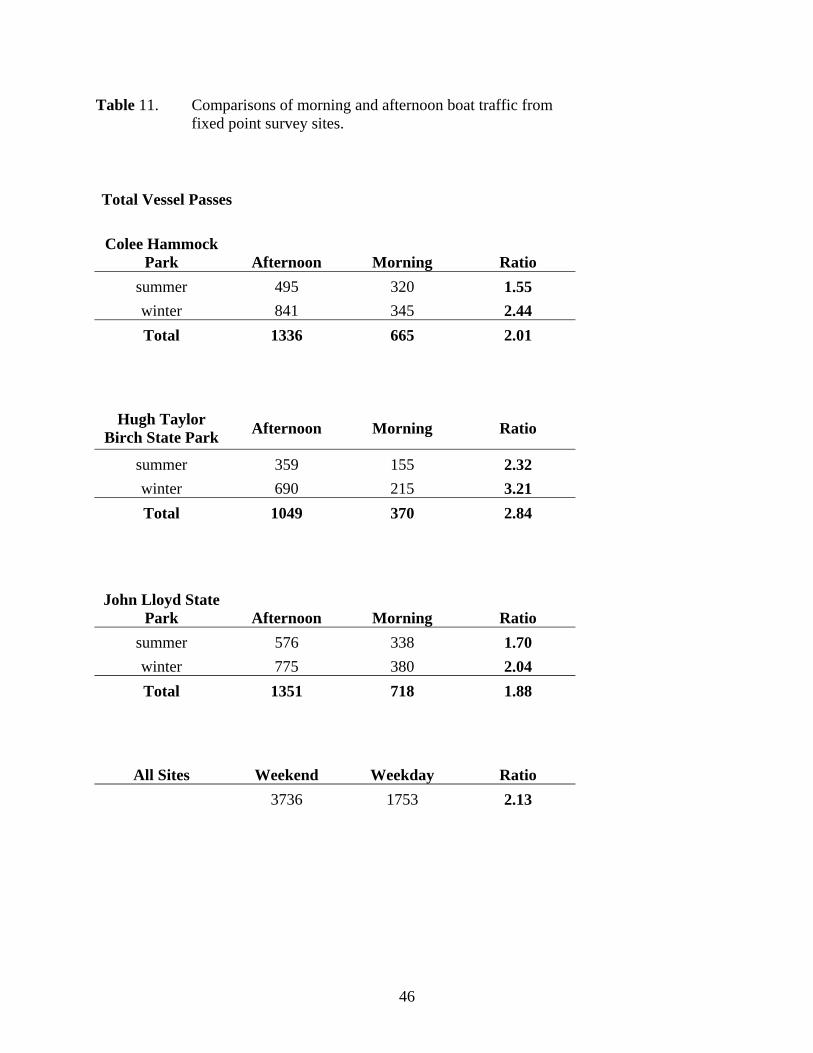
Daily Variations In Boat Traffic
Morning surveys were conducted from 0900 to 1200 hours. Afternoon survey intervals
were typically conducted from 1300 to 1600 hours, though surveys began at 1230 hours on two
occasions during summer surveys in order to compensate for afternoon thunderstorms. While
there was some variation, the volume of boat traffic approximately doubled during afternoon
surveys at all three survey sites. Greater differences between morning and afternoon vessel
18
traffic were observed during winter surveys. At the HTB Site, afternoon boat traffic was greater
than three times the volume observed during morning surveys. A comparison between morning
and afternoon boat traffic data is provided in Table 11.
In general levels of traffic increased throughout the day at both the CH and HTB sites.
At the JL site, traffic levels “peaked” in early afternoon (1300-1359 hrs) then decreased slightly
between 1400 hrs and 1600 hrs. Highest volume of traffic (greater than 100 vessel passes per
hour) were observed during winter surveys at the JL site (1300 to 1500 hrs), during winter
surveys at the CH site (1400 to 1600 hrs), and during winter surveys at the HTB site between
(1400 to 1500 hrs). Lowest volumes of traffic (less than 20 vessel passes per hour) were
observed at all three sites between 0900 and 1000 hrs. Hourly comparisons of vessel traffic
from each survey site are provided in Figures 22-27.
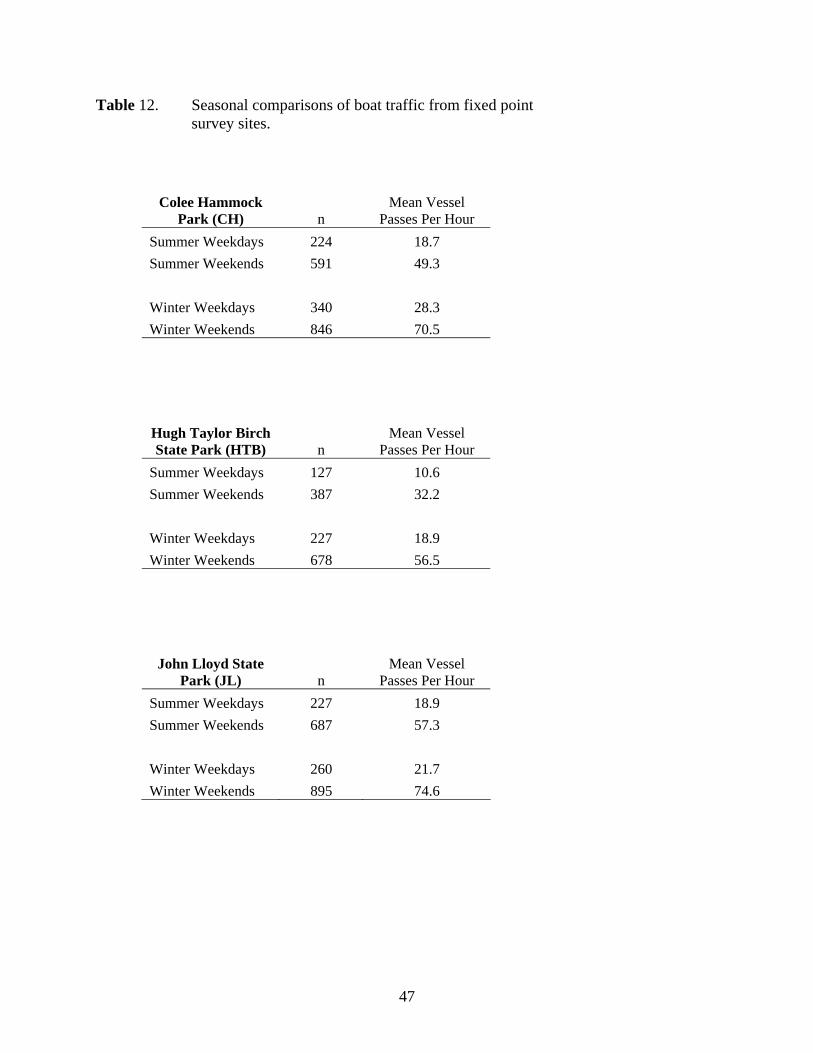
Seasonal Comparisons
Four survey days (two weekdays and two weekend days) were conducted at each site
during the summer (July-August 2004) and winter (February 2005). Traffic volume was
consistently greater during winter surveys at all three sites. Differences between summer and
winter vessel counts were most noticeable at the HTB site. Winter counts at this site were more
than 75 percent greater than summer counts for both weekday and weekend survey intervals.
Levels of commercial activity did not appear to significantly contribute to seasonal differences in
vessel counts. A summary of seasonal comparisons is provided in Table 12.
Direction of Travel
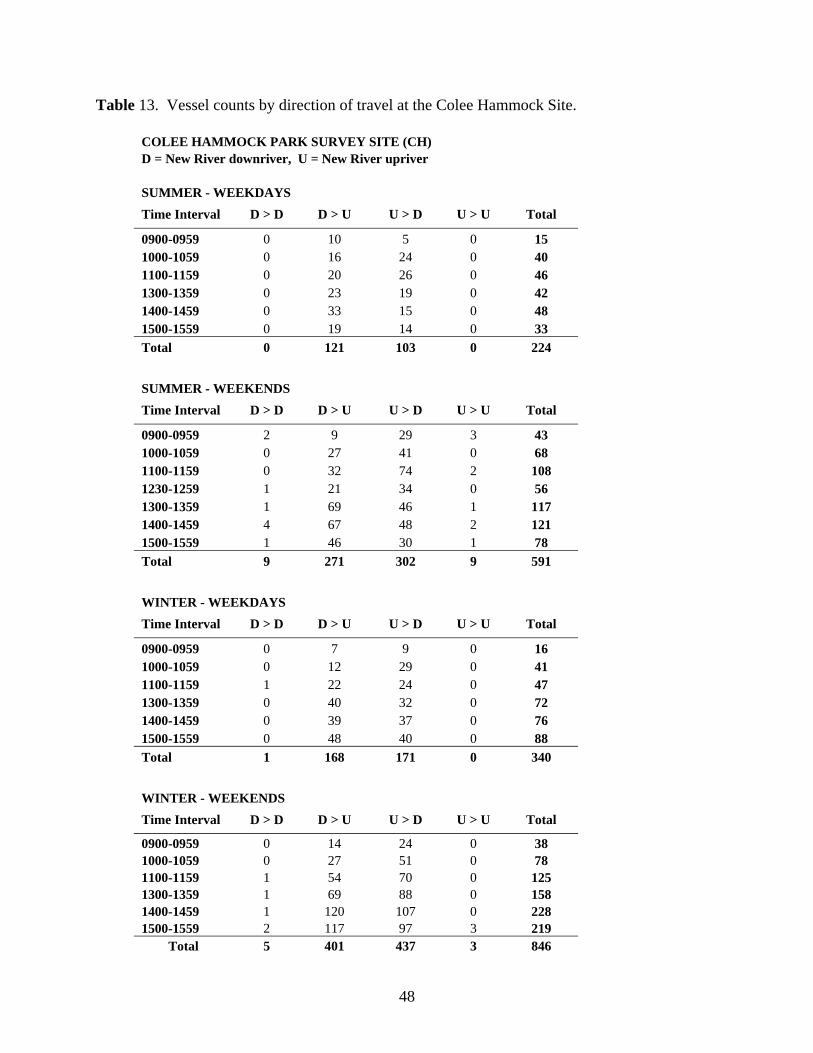
Colee Hammock Park Site
Direction of travel at the Colee Hammock Park Site was essentially limited to vessels
traveling either upstream (U) or downstream (D) along the New River. A summary of vessel
19
traffic by direction of travel is provided in Table 13. In general, a higher proportion of boat
traffic exited the New River (heading downriver) in the morning, and returned upriver later in the
day. The same trend was observed during both summer and winter surveys, and for both
weekend and weekday surveys. While these morning / afternoon travel patterns were fairly
consistent, the relative proportion of boats traveling in different directions rarely exceeded a 2:1
ratio. Highest levels of traffic in one direction during a one-hour interval were observed for
boats traveling upriver (D > U) between 1400hrs and 1500hrs on winter weekends (an average of
60 vessel passes per hour).
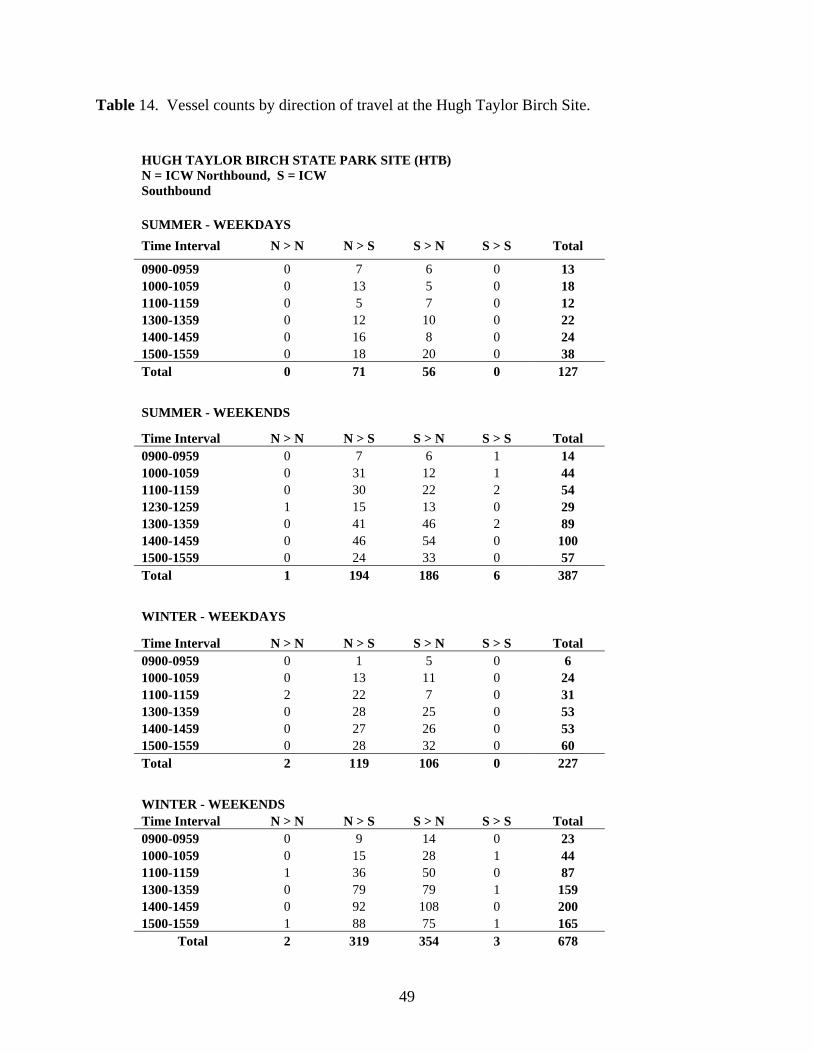
Hugh Taylor Birch State Park Site
Direction of travel at this site was essentially limited to vessels either traveling
northbound along the ICW towards Hillsboro Inlet or southbound along the ICW towards the
New River and Port Everglades. While traffic volume generally increased later in the day, no
clear daily travel patterns were observed at this site. The relative proportion of boats traveling
north or south along the ICW was somewhat variable throughout the day. Highest levels of
traffic in one direction during a one-hour interval were observed for boats traveling northward (S
>N) along the ICW between 1400hrs and 1500hrs on winter weekends (an average of 54 vessel
passes per hour). A summary of vessel traffic by direction of travel is provided in Table 14.
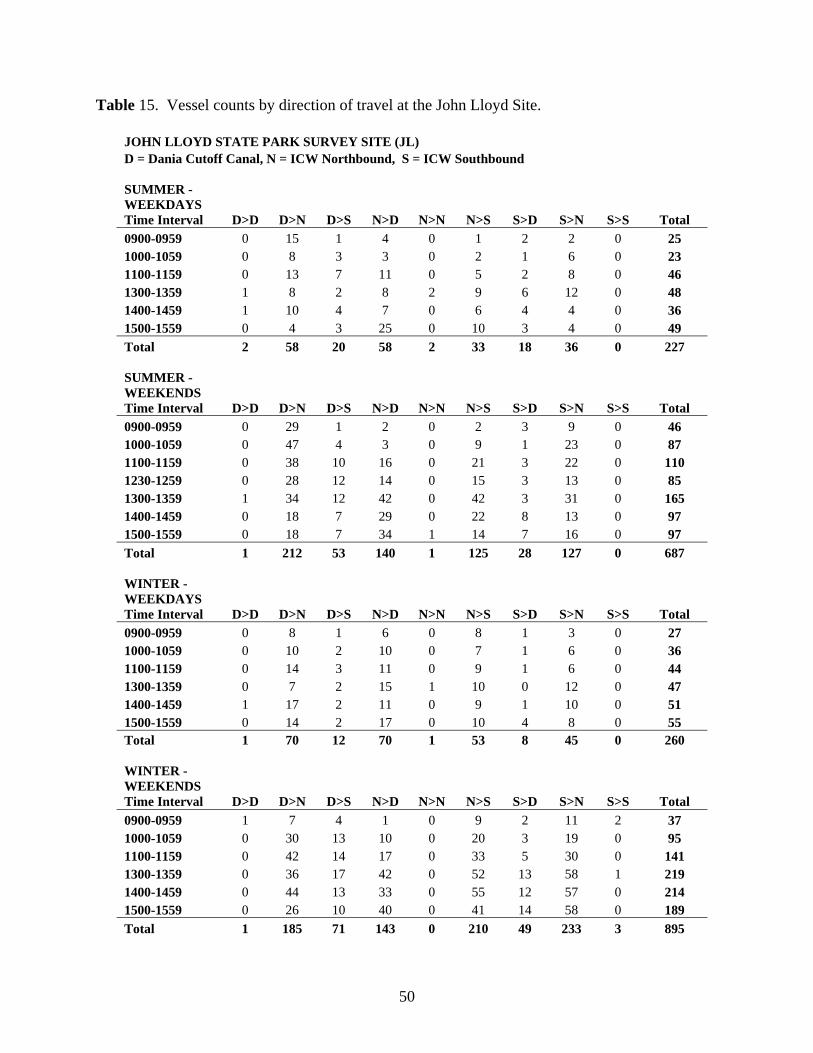
John Lloyd State Park Site
Traffic patterns at the JL site were more complex, with three possible original /
destinations. These three directions were 1) southbound along the ICW toward the south
Broward County line and Dade County, 2) Northbound along the ICW toward Port Everglades,
or 3) Eastbound or westbound to and from the Dania Cutoff Canal. Of the 2,069 vessel passes
20
recorded at this site, 1,200 (58%) either originated or terminated at the Dania Cutoff Canal. Of
the 681 vessels observed departing from the Dania Cutoff Canal, 525 (77%) turned north
towards Port Everglades. For all vessels observed traveling in the direction of Port Everglades
(n=966), 54 percent originated from the Dania Cutoff Canal. Hourly observations indicated a
consistent pattern of vessels departing from the Dania Cutoff Canal during morning hours, and
returning later in the day. Between 1300 and 1500 hours, traffic flow was essentially the same in
both directions. Overall, a higher proportion of boats was observed traveling northward towards
Port Everglades in the morning, and traveling southward from Port Everglades later in the day.
An average of more than 50 boats per hour were observed entering and departing the Dania
Cutoff Canal between 1100 hours and 1500 hours during winter weekend surveys. A summary
of vessel traffic by direction of travel is provided in Table 15.
Vessels Speeds and Boater Compliance
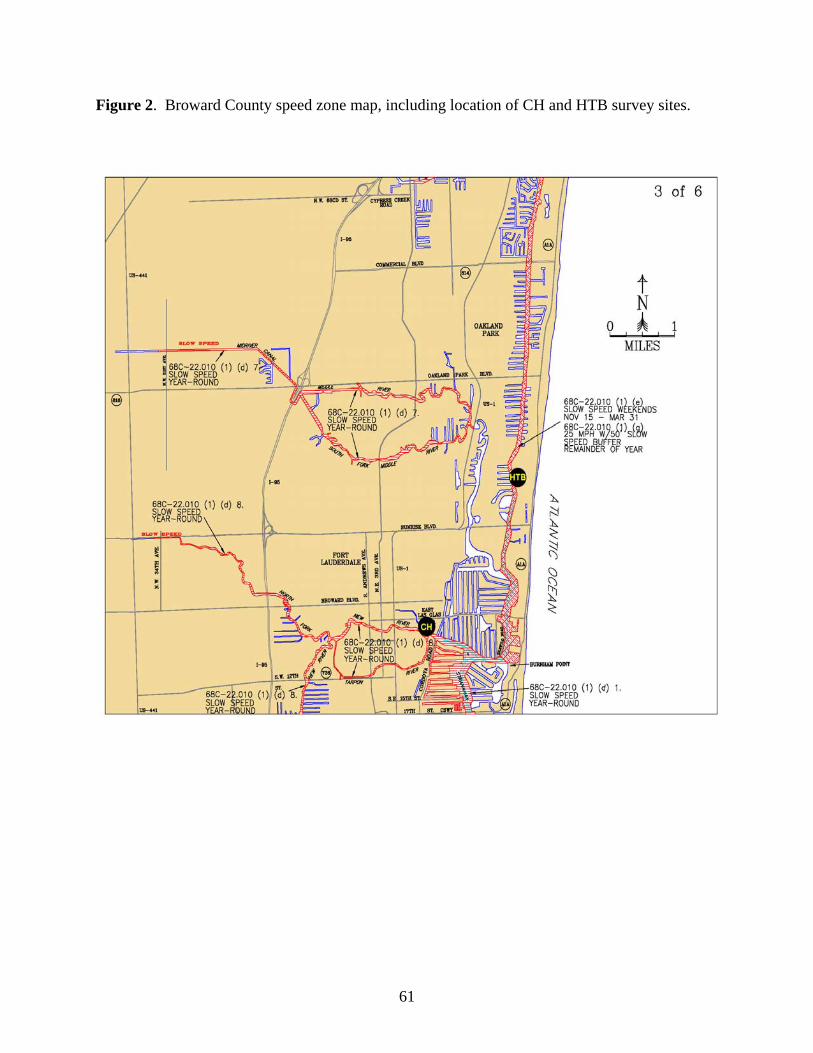
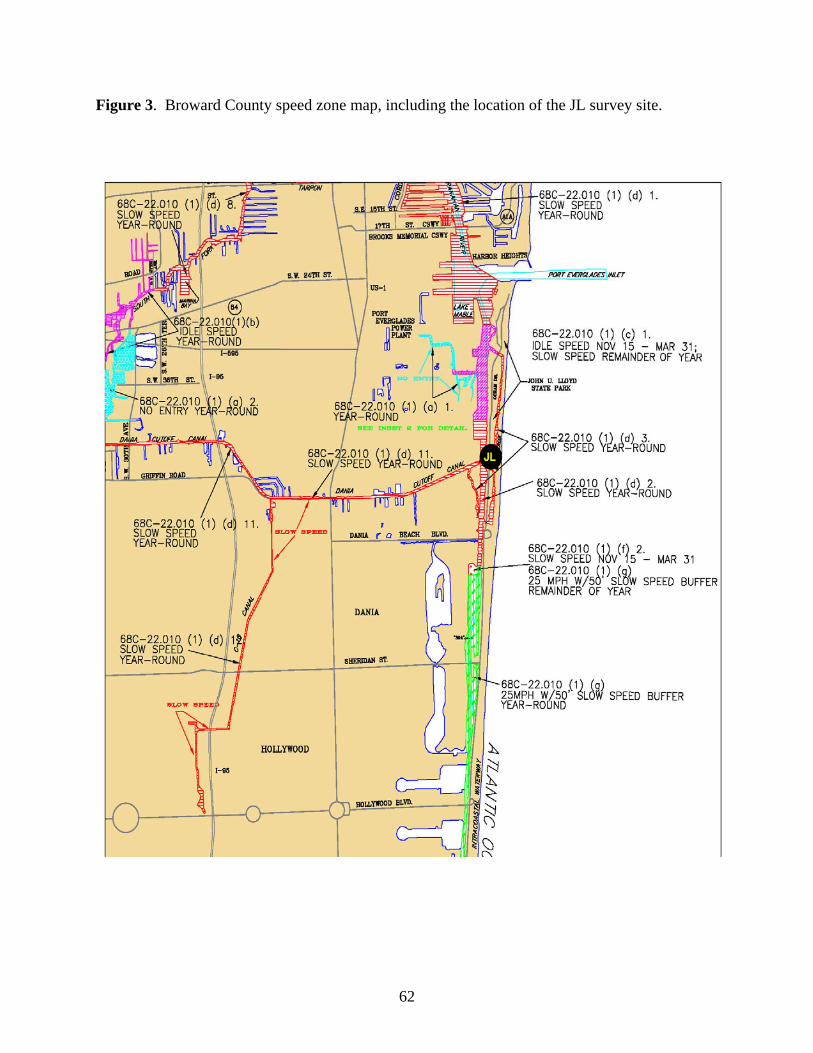
All three survey sites were located within manatee speed zones. Speed zone maps
corresponding to the three survey sites are provided in Figures 2 and 3. The CH and JL sites
were located within year-round Slow Speed zones. The HTB site was located within a seasonal,
weekend-only Slow Speed zone. A year-round 50 foot shoreline buffer Slow Speed zone is also
established in this area. Vessel speed and boater compliance data were recorded from each
vessel and are summarized for each site below:
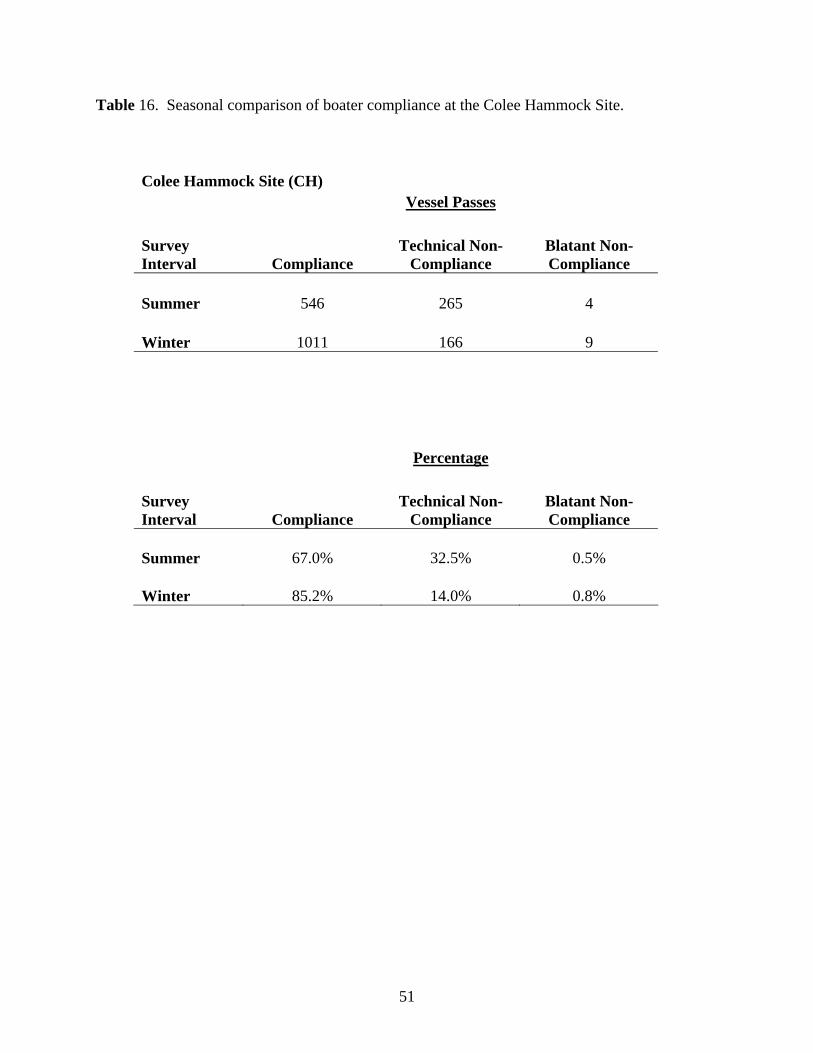
Colee Hammock Site (CH)
Compliance data from the CH site is summarized in Figure 28. Relatively high levels of
boater compliance were observed at this site (78%), with a total of 1,557 out of 2,001
observations of vessels traveling at either idle speed or slow speed. Only 13 out of 2,001
observations (less than 1%) were of vessels traveling at planing speed (blatantly non-compliant).
21
The remaining 21 percent of observations were of vessels traveling at either plowing or cruising
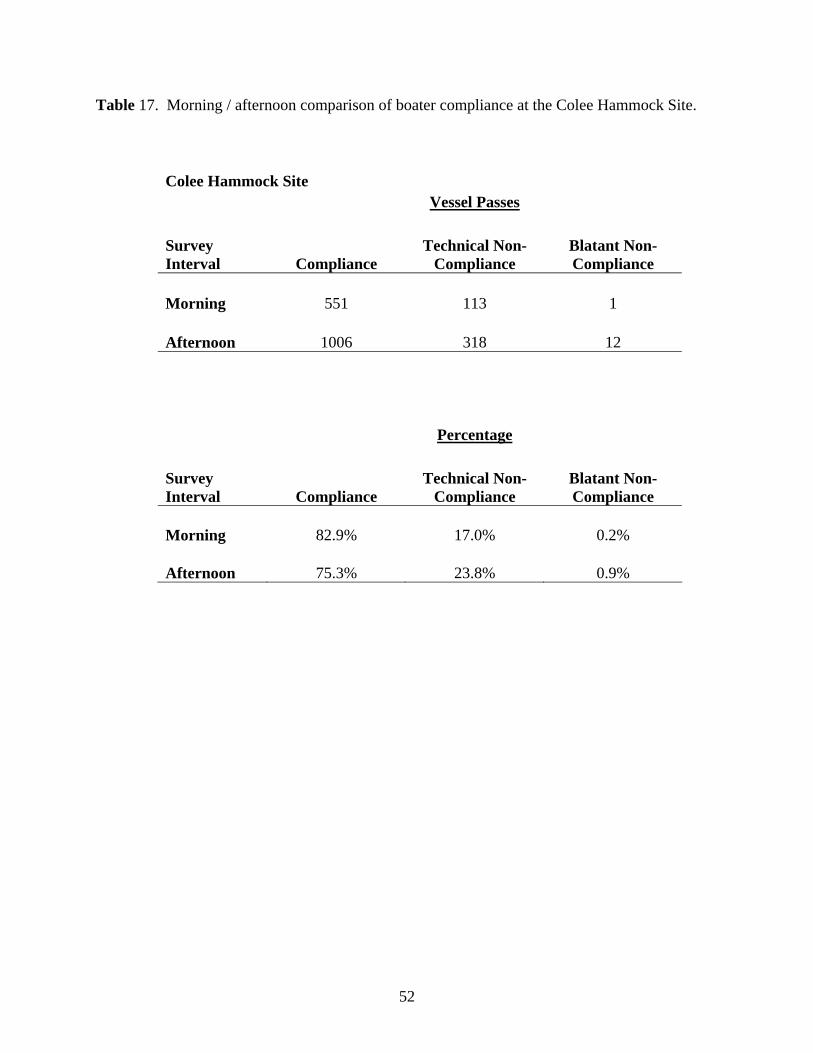
speed (technically non-compliant). Levels of compliance were noticeably higher during winter
surveys (85.2%) as opposed to summer surveys (67.0%). Levels of compliance were also
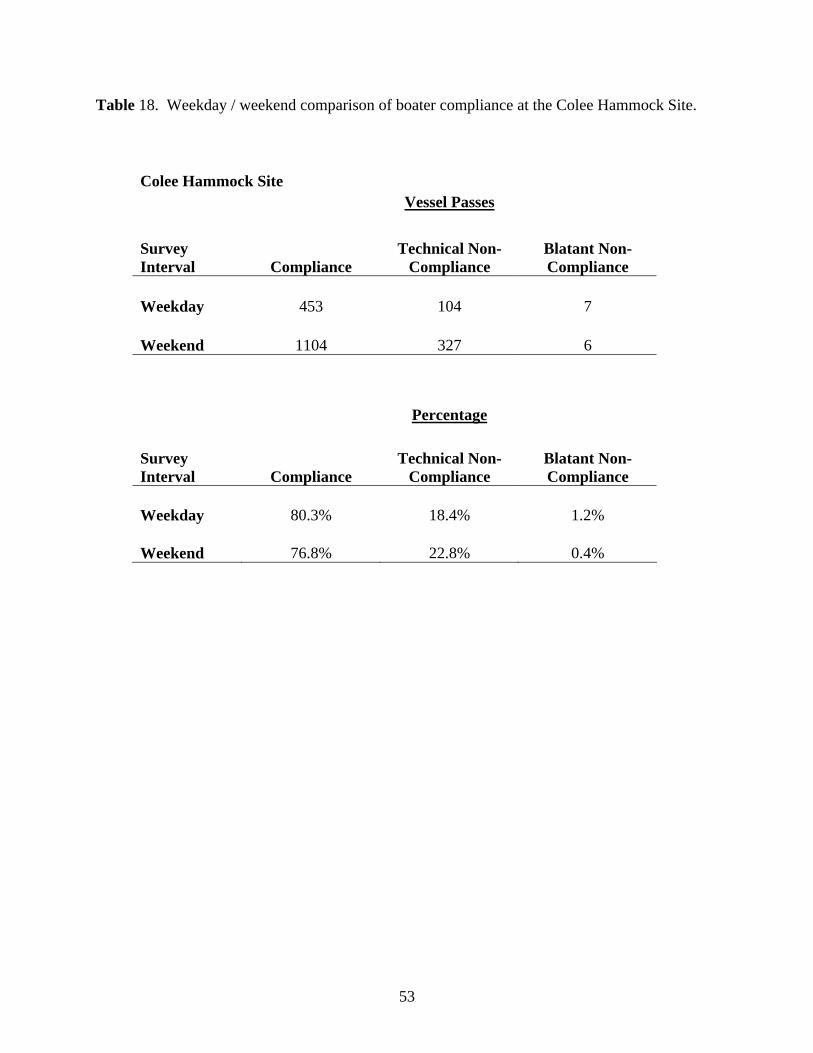
somewhat higher during morning survey intervals and during weekdays (Tables 16-18).
Enforcement vessels comprised less than 1 percent of all observations at this site (10 out of 2001
vessel passes).
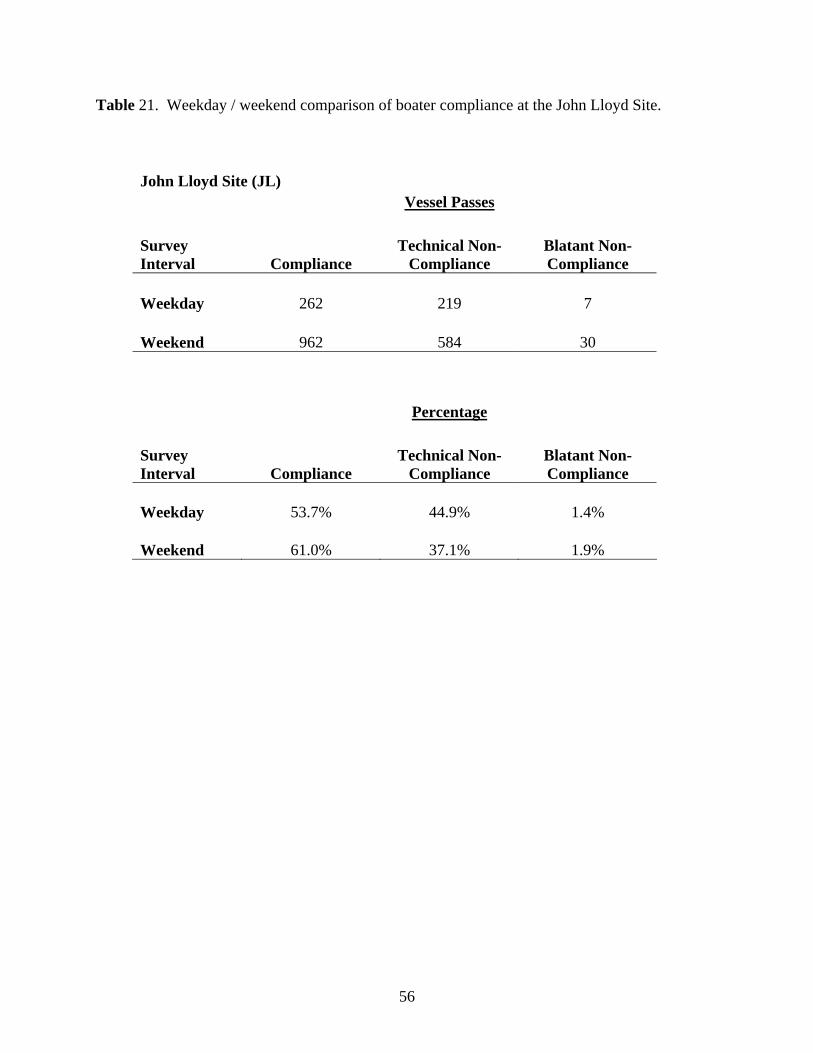
John Lloyd Site (JL)
Overall boater compliance at the JL site was 59% (Figure 29). Technically non-
compliant vessels (vessels traveling at either plowing or cruising speed) comprised percent of all
vessels observed, and blatantly non-compliant vessels (vessels at planing speed) comprised
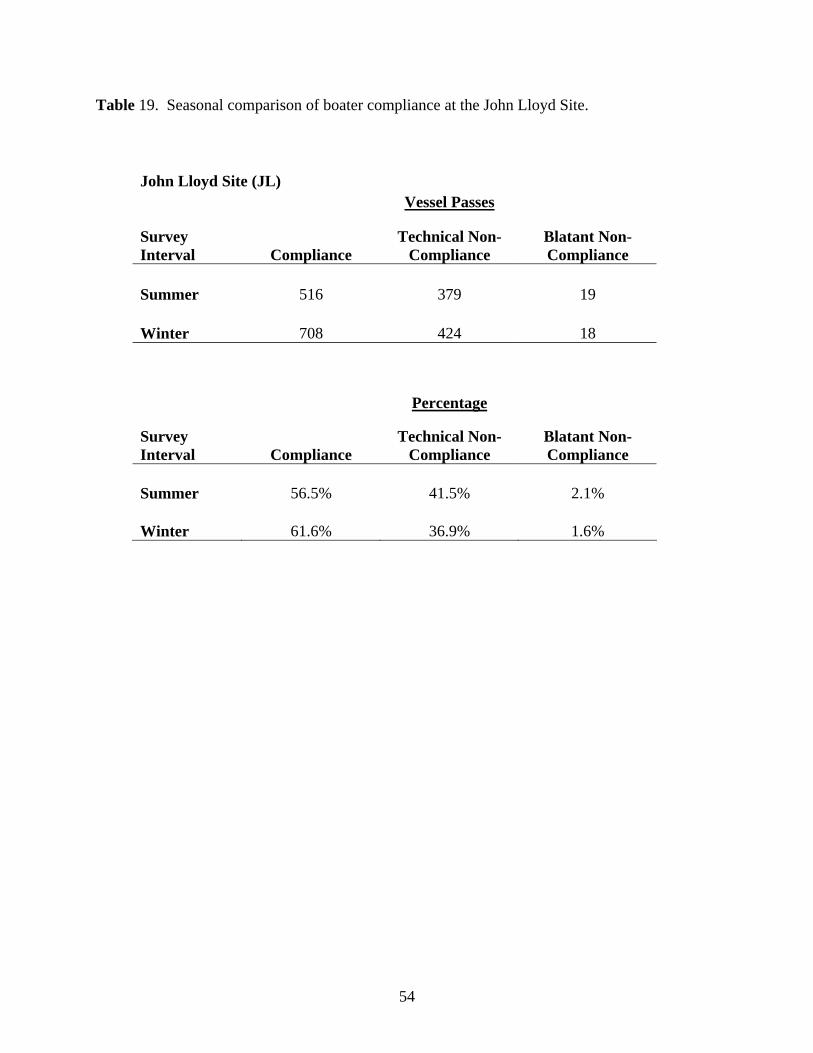
percent of all vessels observed. Differences in compliance between summer and winter surveys
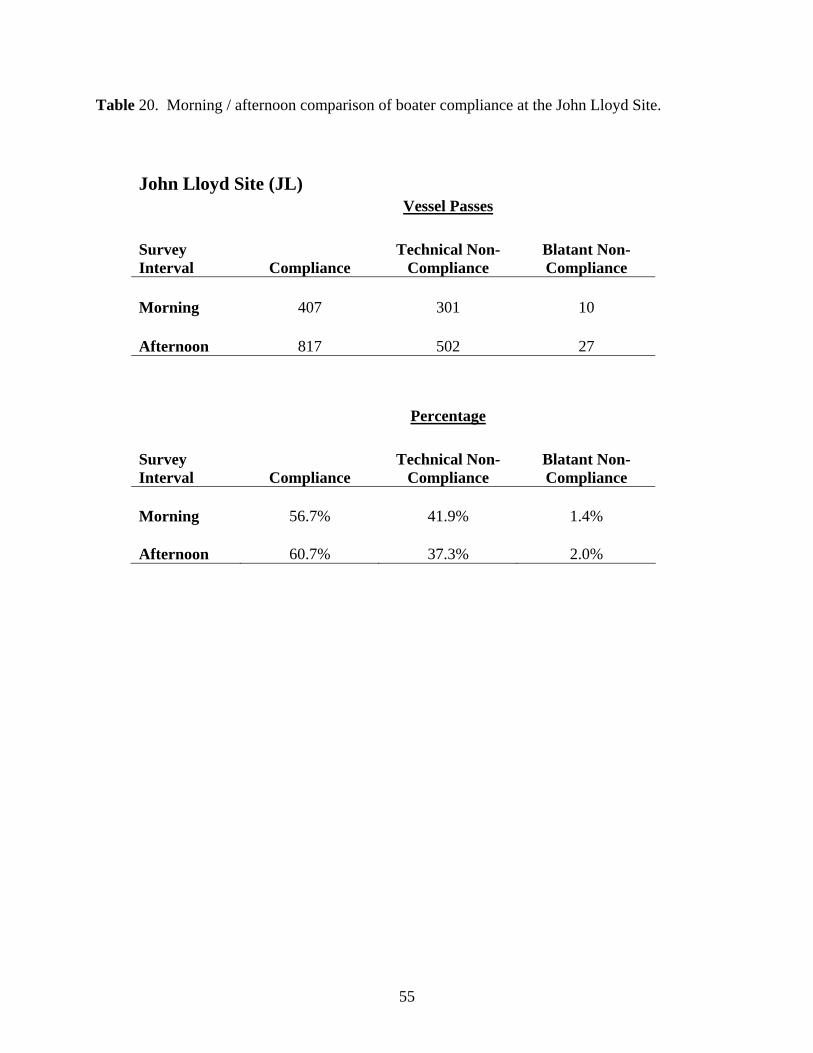
was not as significant as it was at the CH site (61.6% compliance in winter vs. 56.5%
compliance in summer). Levels of compliance were also somewhat higher during afternoon
intervals and on weekends (Tables 19-21). Enforcement vessels comprised approximately 2
percent of all observations at the JL site (40 out of 2,069 vessel passes).
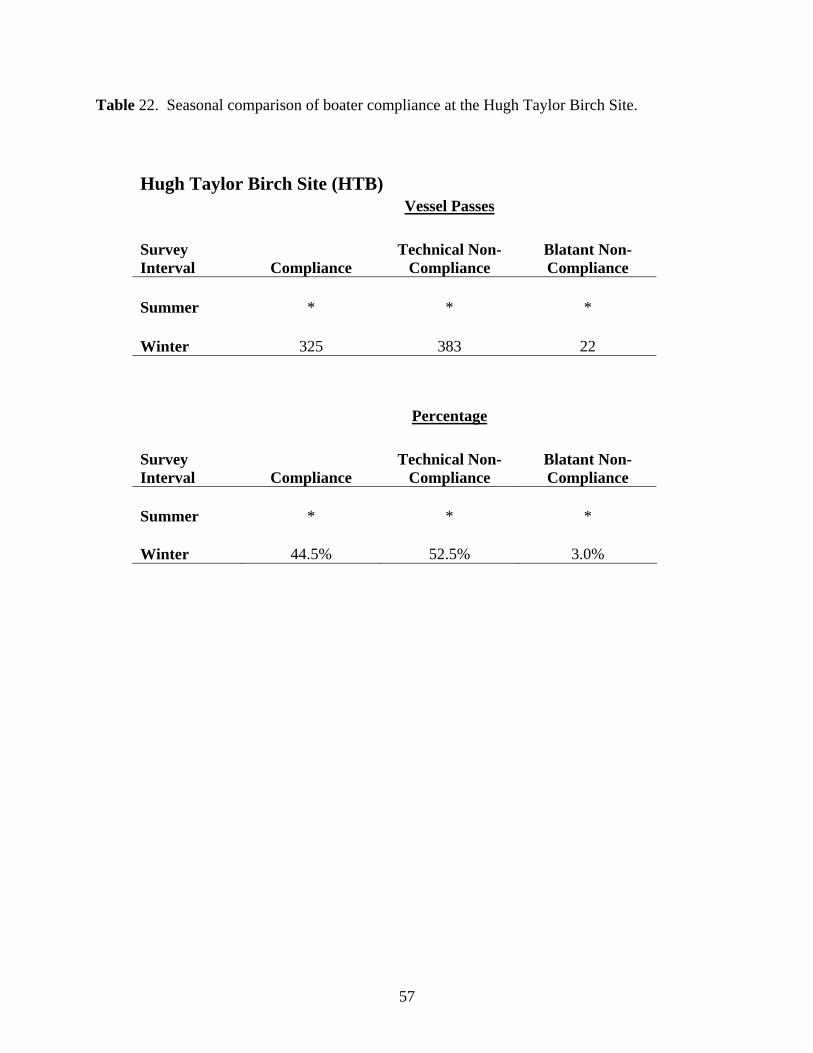
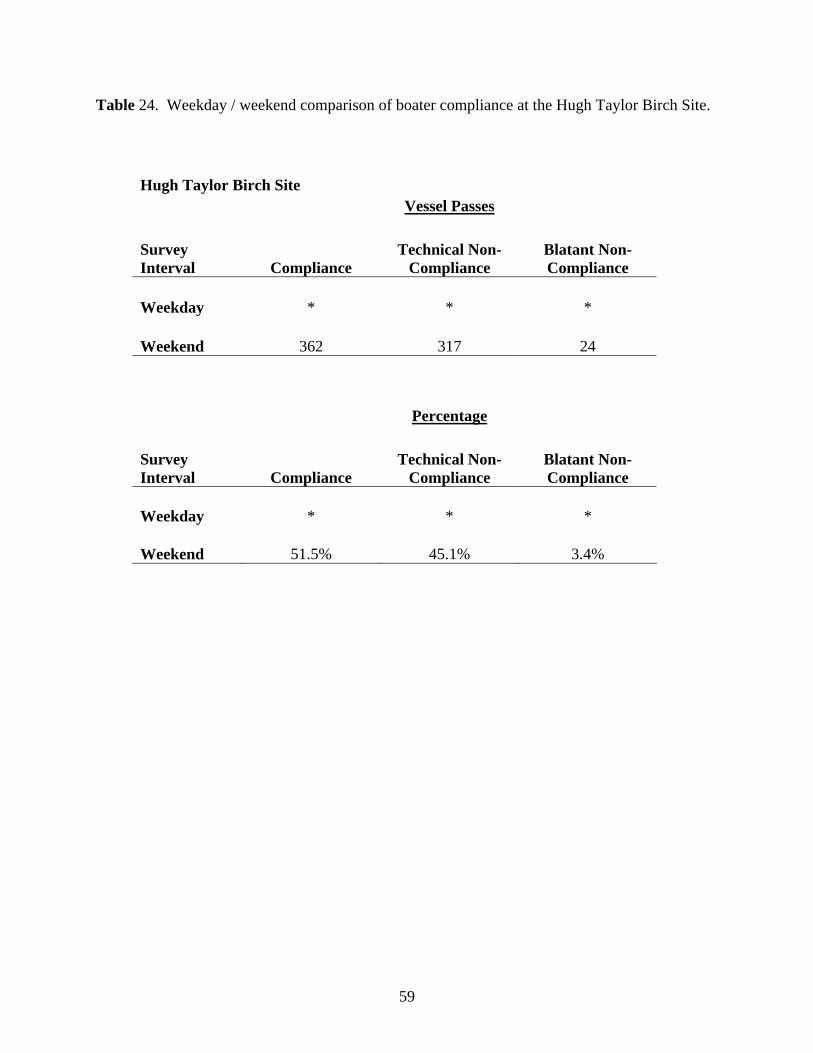
Hugh Taylor Birch Site (HTB)
Boater compliance at the HTB site was only evaluated during winter weekend survey
days, when slow speed shore-to-shore regulations are in effect. During this period, overall
compliance was 52 percent. Technically non-compliant (plowing or cruising) vessels comprised
45 percent of all vessels observed, and blatantly non-complaint vessels (planing) comprised 3
percent of all vessels observed (Figure 30). There were no seasonal comparisons made
because the Slow Speed shore-to-shore restriction is not in place during the summer. Levels of
compliance were slightly higher during morning survey intervals, however levels of blatant non-
22
compliance were also higher (Tables 22-24). Enforcement vessels comprised 1.7 percent of all
observations at this site (24 out of 1,419 vessel passes).
For all three survey sites, the operators of smaller vessels (less than 26 feet in length)
tended to be less compliant than the operators of larger vessels (26 feet in length and greater).
The single exception was vessels in the 40’ to 64’ size category, which tended to have relatively
low levels of compliance in particular at the HTB site. This was attributed primarily to a large
number of vessel passes by large commercial water taxis, many of which were evaluated as
technically non-compliant.
Discussion
The composition of boat traffic in Broward County differs substantially from recently-
studied counties in southwest Florida. Compared with Lee and Sarasota Counties, Broward
County is comprised of a substantially higher proportion of larger boats, particularly those
greater than 40 feet in length. In Lee and Sarasota Counties, the proportion of vessel traffic
larger than 40 feet in length was less than 5 percent. In Broward County by comparison, the
proportion of vessel traffic larger than 40 feet in length was greater than 20 percent. In addition,
vessels larger than 64 feet in length comprised greater than 5 percent of all boat traffic in
Broward County, compared with less than 1 percent of all traffic in either Lee or Sarasota
Counties. While Florida Department of Highway Safety and Motor Vehicles data indicates that
30 percent of all registered vessels in Broward County are greater than 26 feet in length, vessels
larger than 26 feet in length comprised 48 percent of all vessels observed from fixed point sites
and 38 percent of all vessels observed during aerial surveys.
Along with differences in vessel type and size, the relative proportion of commercial
vessels observed was also substantially higher in Broward County. Commercial vessels
23
comprised approximately 2 percent of all boat traffic observed in Lee and Sarasota Counties
(Gorzelany, 1996, 2002), and greater than 9 percent of all boat traffic in Broward County. The
larger proportion of commercial traffic in Broward County is essentially due to two factors
which do not exist in either Lee or Sarasota Counties. First, Broward County is the location of a
major shipping port (Port Everglades) which contributes a significant amount of commercial
traffic through Port Everglades Inlet. Secondly, Broward County has a well-established network
of water transport vessels (water taxis, water buses, etc.) which Lee and Sarasota Counties do
not. These vessels significantly contributed to the number of commercial vessel passes observed
in particular from the Colee Hammock and Hugh Taylor Birch survey sites.
Broward County is also unique with regard to the nature of the waterway itself. Unlike
recently-studied areas along the Florida west coast which include large expanses of open water
such as Pine Island Sound, Gasparilla Sound, Estero Bay, and Charlotte Harbor, the inshore
waters of Broward County are essentially comprised of a network of man-made canals that
function essentially as a travel corridor. Because of the uniqueness of the Broward waterway,
the identification of travel routes is relatively simple due to the fact that boat traffic is essentially
limited a relatively narrow waterway for passage to and from their destinations. Popular boating
destinations exist in Broward County, including Hillsboro Inlet, the lower portion the Middle
River, portions of the ICW south of Port Everglades, and West Lake Park; however the majority
of boat traffic in Broward County appears to utilize the inland waterway for travel to and from
other areas. This includes travel either to and from the Atlantic Ocean via Hillsboro Inlet and
Port Everglades Inlet, or simply travel along the ICW to and from adjacent counties (Palm Beach
or Miami-Dade).
24
A significant number of recreational vessels are docked along seawalls throughout the
entire waterway in Broward County. As a result, some temporarily moorings and short-term
boating destinations in the downtown Ft. Lauderdale area may have been underestimated
because they could not be distinguished from long-term moorings. This likely resulted in an
underestimate of boats in-use, but docked, in certain locations.
Aerial survey results identified several high traffic areas in Broward County. These areas
include both Hillsboro Inlet and Port Everglades, along with the lower portion of the New River
system and Stranahan River. Moderate levels of boat traffic were observed along the majority of
the Intracoastal Waterway, with heaviest concentrations of vessels in closest proximity to both
tidal inlets. Moderate levels of boat traffic were also observed along the lower portion of the
Dania Cutoff Canal. Boat counts in along the upper portion of the Dania Cutoff Canal is likely
an underestimate due to the fact that aerial surveys of this area were somewhat limited.
Vessel counts from aerial surveys were incomplete in certain areas due to aerial survey
limitations in proximity to Ft Lauderdale Hollywood International airport. As a result, boat
counts along the upper portions of the Dania Cutoff Canal and New River system are likely
underestimated. Because fixed point survey sites were located along the lower portions of both
the New River and Dania Cutoff Canal, these data should more accurately represent the amount
of boat traffic utilizing these areas.
Fixed point survey data provides additional insight into boat traffic patterns, however
these data should be considered only as general trends because the number of survey days were
somewhat limited (n=8). As a result, seasonal, weekly, and daily comparisons in boat traffic are
based upon a fairly small sample size. In spite of this, results fairly consistently showed higher
25
volume of boat traffic on weekdays versus weekends, afternoons versus mornings, and during
winter versus summer survey intervals.
Fixed point survey data indicate that the Dania Cutoff Canal contributes a significant
number of vessels to the Port Everglades area. The volume of vessel traffic to and from the
Dania Cutoff canal typically exceeds the volume of vessel traffic traveling along the ICW in the
same area. During peak boating periods (weekends) several hundred boats originate from the
Dania Cutoff Canal on a daily basis. The majority of these vessels travel northward towards Port
Everglades.
While levels of boater compliance were relatively low in certain locations (52% overall
compliance at the Hugh Taylor Birch site and 59 percent overall compliance at the John Lloyd
Site), the levels of blatant non-compliance were also relatively low (3% blatant non-compliance
at the Hugh Taylor Birch site and 2 % blatant non-compliance at the John Lloyd site). Levels of
compliance at the Colee Hammock site were significantly higher (78% overall). The
narrowness of the waterway in this area, along with high concentrations of traffic at times, may
contribute to higher levels of compliance. Similarly, low levels of blatant non-compliance along
the ICW at both the Hugh Taylor Birch and John Lloyd sites may also be due in part to the
relatively high levels of traffic and narrowness of the waterway system. In these instances,
vessel speed and levels of compliance may be self-limiting, and related to boating safety due to
the high levels of boat traffic at times. A similar situation was encountered in Lee County
(Gorzelany, 2000), where a strong negative correlation between numbers of vessels and vessel
speed was determined, indicating that high levels of compliance are related to the high volume of
boat traffic.
26
While the majority of non-compliant boaters were evaluated as technically non-
compliant, these boats may still pose a significant risk to manatees. This is because technical
non-compliance within a Slow Speed zone refers to vessels traveling at either plowing or
cruising speed, which can potentially cause significant harm to animals. In high traffic areas
such as the Stranahan River and Port Everglades, the levels of technical non-compliance will
result in a substantial number of vessels traveling at plowing and cruising speeds at times.
Because these areas are also known to be high use areas for manatees, there is a potentially
greater risk of adverse interaction with boats.
Data for enforcement vessels are likely an underestimate of enforcement effort, because
observers only count vessel passes (number of times an enforcement vessel transitions through a
study area). This does not account for the amount of time an enforcement vessel remains in a
given area. For this reason, enforcement activity in Broward County may be a more significant
contributing factor to the low levels of blatant non-compliance than was observed from fixed
point survey data. A more accurate representation of enforcement activity may be from an
examination of duty logs, or examination of warnings and citations issued by various law
enforcement agencies.
Conservation benefits:
The primary purpose of this work will be as a reference tool for waterways management
in Broward County, by providing new information on boat traffic patterns and boater
compliance. Data acquired on human use can be integrated with natural resources information
in order to better provide for better planning and management of coastal resources in Broward
County. Immediate benefits of this project will include an assessment of recreational boating
27
patterns which will aid in the development of the Broward County Boat Facility Siting Plan and
Manatee Protection Plan.
Anticipated publications:
The most immediate and obvious published product from this work will be the Broward
County Boat Facility Siting Plan and Manatee Protection Plan. Other peer-reviewed scientific
publications may be possible, though more likely as a compilation of recreational boat traffic
data from other Florida counties.
Public presentations at which the project results were described:
Portions of these data were presented at the Marine Mammal Health Conference II in
Gainesville, FL on April 9, 2005. In addition, portions of this project were presented at the
Manatee Forum IV in St. Petersburg on June 7, 2005.
28
Acknowledgements
Many thanks to staff and volunteers of Mote Marine Laboratory, particularly Mina Innes,
Kerri Scolardi, and Teresa Kessenich, for their assistance in both the data collection and data
processing phases of this study. Thanks also to aerial survey pilots Bud Freeman, Greg Baker,
and Lew Lawrence for their expertise under occasionally difficult aerial survey conditions, along
with special thanks also to FAA supervisor Harley Mumma and air traffic controllers at Ft
Lauderdale Hollywood International Tower for their cooperation and assistance. Thanks also to
both John Lloyd State Park and Hugh Taylor Birch State Park for their cooperation. Finally,
thanks to Richard Flamm and Hope White for their invaluable assistance with the GIS analysis,
interpretation, and presentation of project results.
29
Literature Cited:
Deutsch, C.J. 2000. Winter movements and use of warm water refugia by radio-tagged West Indian manatees along the Atlantic coast of the United States. Final report prepared for Florida Power and Light Company and the U.S. Geological Survey. 133pp.
Mezich, R.R. 2001. Manatees and Florida Power & Light’s Lauderdale and Port Everglades
Power Plants. Report developed for the Florida Fish and Wildlife Conservation Commission. 24pp.
Reid, J.P., G.B. Rathbun, and J.R. Wilcox. 1991. Distribution patterns of individually
identifiable West Indian manatees (Trichechus manatus) in Florida. Marine Mammal Science 7:180-190.
Reynolds III, J.E. 2004. Distribution and Abundance of Florida Manatees (Trichechus manatus
latirostris) around selected power plants following winter cold fronts: 2003-2004. Prepared for Florida Power & Light Company. Mote Marine Laboratory Technical Report No. 967.
Gorzelany, J.F, and R.O. Flamm. 2004. A characterization of recreational boat traffic patterns
prior to the establishment of speed restrictions in Lemon Bay, Florida. Final Report submitted to the U.S. Fish and Wildlife Service, 62 pp. Mote Marine Laboratory Technical Report Number 966.
Gorzelany, J.F. 2003. A Characterization Of Boat Traffic In Terra Ceia Bay, Florida. Final
Report submitted to the Florida Dept. of Environmental Protection, 42 pp. Gorzelany, J.F. 2000. Evaluation of vessel traffic and boater compliance in association with new
boat speed regulations in the lower Caloosahatchee River. Final report submitted to the Florida Fish and Wildlife Conservation Commission, Office of Environmental Services, Protected Species Management. 42 pp + appendices.
Gorzelany, J.F. 1998. Evaluation of boat traffic patterns and boater compliance in Lee County,
Florida. Final Report submitted to the Florida Dept. of Environmental Protection, 109 pp + appendices.
Gorzelany, J.F. 1996. Evaluation of boater compliance with speed regulations in Sarasota County,
Florida. Final Report submitted to the Florida Dept. of Environmental Protection, 106 pp + appendices.
Morris, J.G. 1994. An investigation of compliance to boat speed regulations in manatee
protection zones in Brevard County, Florida. Final report submitted to the Florida Department of Environmental Protection. 74 pp.
30
Shapiro, S.L. 2001. Assessing boater compliance with manatee speed zones in Florida. Final report submitted to the U.S. Fish and Wildlife Service. Project No. 9322-1602280. 75pp + appendices.
Tyson, S, and L.R. Combs. 1999. Canaveral Barge Canal boater activity and compliance
study, Brevard County, Florida. Final report submitted to the Florida Department of Environmental Protection. 87 pp.
U.S. Fish and Wildlife Service. 2001. Florida Manatee Recovery Plan (Trichechus manatus
latirostris), Third Revision. U.S. Fish and Wildlife Service. Atlanta, Georgia. 144 pp. + appendices.
31
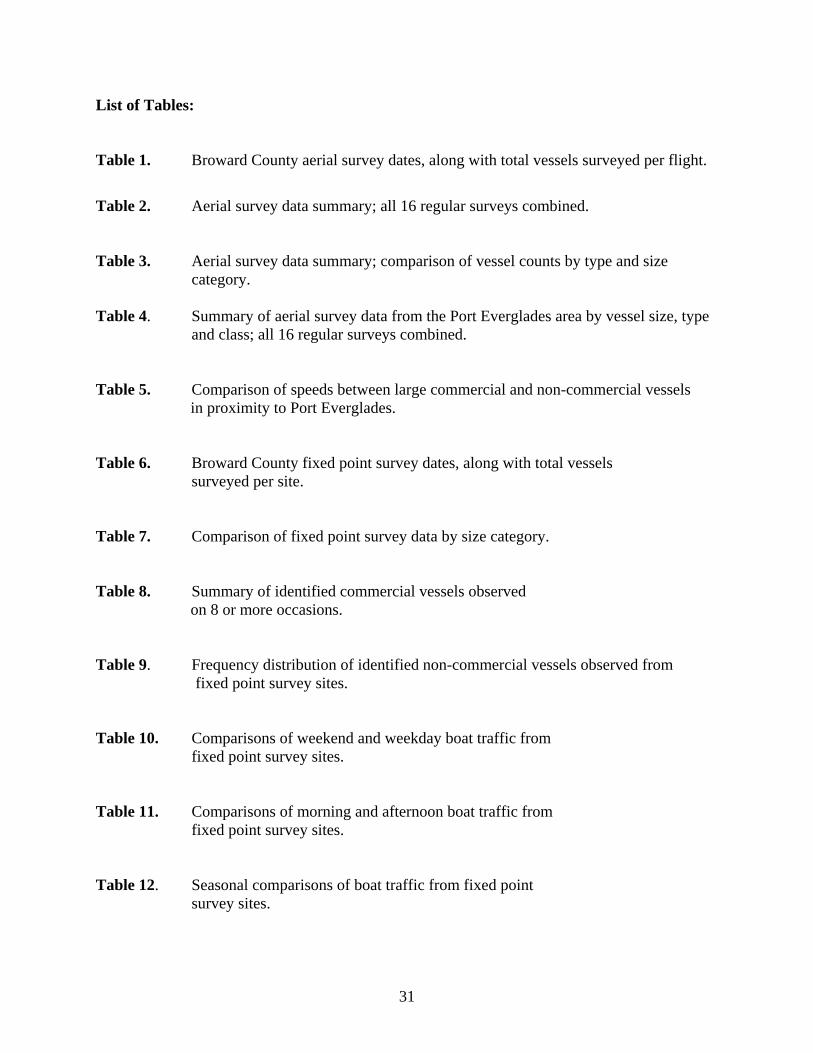
List of Tables:
Table 1. Broward County aerial survey dates, along with total vessels surveyed per flight.
Table 2. Aerial survey data summary; all 16 regular surveys combined.
Table 3. Aerial survey data summary; comparison of vessel counts by type and size category.
Table 4. Summary of aerial survey data from the Port Everglades area by vessel size, type
and class; all 16 regular surveys combined.
Table 5. Comparison of speeds between large commercial and non-commercial vessels in proximity to Port Everglades.
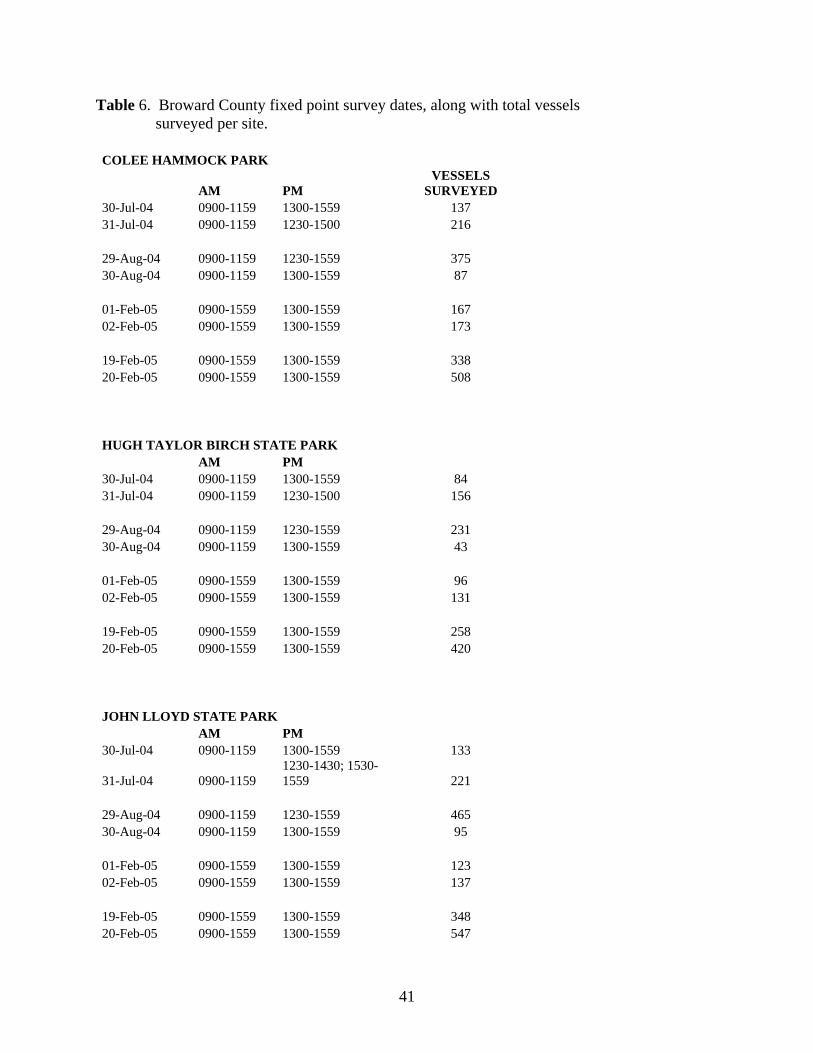
Table 6. Broward County fixed point survey dates, along with total vessels surveyed per site.
Table 7. Comparison of fixed point survey data by size category.
Table 8. Summary of identified commercial vessels observed on 8 or more occasions.
Table 9. Frequency distribution of identified non-commercial vessels observed from fixed point survey sites.
Table 10. Comparisons of weekend and weekday boat traffic from fixed point survey sites.
Table 11. Comparisons of morning and afternoon boat traffic from fixed point survey sites.
Table 12. Seasonal comparisons of boat traffic from fixed point survey sites.
32
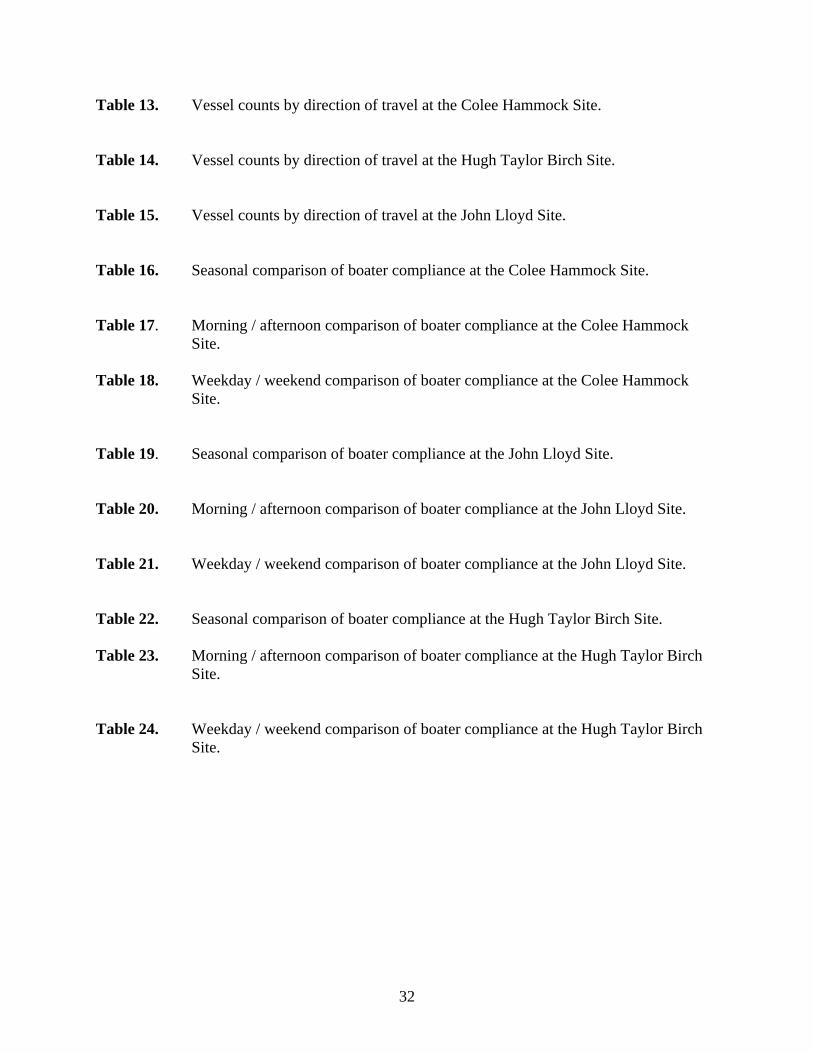
Table 13. Vessel counts by direction of travel at the Colee Hammock Site.
Table 14. Vessel counts by direction of travel at the Hugh Taylor Birch Site.
Table 15. Vessel counts by direction of travel at the John Lloyd Site.
Table 16. Seasonal comparison of boater compliance at the Colee Hammock Site.
Table 17. Morning / afternoon comparison of boater compliance at the Colee Hammock Site.
Table 18. Weekday / weekend comparison of boater compliance at the Colee Hammock
Site.
Table 19. Seasonal comparison of boater compliance at the John Lloyd Site.
Table 20. Morning / afternoon comparison of boater compliance at the John Lloyd Site.
Table 21. Weekday / weekend comparison of boater compliance at the John Lloyd Site.
Table 22. Seasonal comparison of boater compliance at the Hugh Taylor Birch Site. Table 23. Morning / afternoon comparison of boater compliance at the Hugh Taylor Birch
Site.
Table 24. Weekday / weekend comparison of boater compliance at the Hugh Taylor Birch Site.

33
List of Figures:
Figure 1. Limits of aerial surveys for the Broward County Boat Study. Red areas were routinely surveyed, while yellow areas were typically limited by proximity to Ft Lauderdale / Hollywood International Airport.
Figure 2. Broward County speed zone map, including location of CH and HTB survey sites.
Figure 3. Broward County speed zone map, including the location of the JL survey site.
Figure 4. Comparison of stationary (orange) and moving (yellow) vessels surveyed in the Hillsboro Inlet area. All 16 regular surveys combined.
Figure 5. Comparison of stationary (orange) and moving (yellow) vessels surveyed in the Port Everglades area. All 16 regular surveys combined.
Figure 6. Comparison of slow-moving (pink) and fast-moving (green) vessels surveyed in the Hillsboro Inlet area. All 16 regular surveys combined.
Figure 7. Comparison of slow-moving (pink) and fast-moving (green) vessels surveyed in the Port Everglades area. All 16 regular surveys combined.
Figure 8. Broward County waterway, partitioned into 40 – 1 mile radius areas.
Figure 9. Expanded view of northern portion of Broward County waterway, including Hillsboro Inlet and the Cypress Creek / Pompano Canal waterway, including calculations of mean #number of vessels in-use observed per square mile within each partition.
Figure 10. Expanded view of central portion of Broward County waterway, including the Middle River, New River, and Port Everglades, including calculations of mean #number of vessels in-use observed per square mile within each partition.
Figure 11. Expanded view of southern portion of Broward County waterway, including the Dania Cutoff Canal and southern portion of the Intracoastal Waterway, including
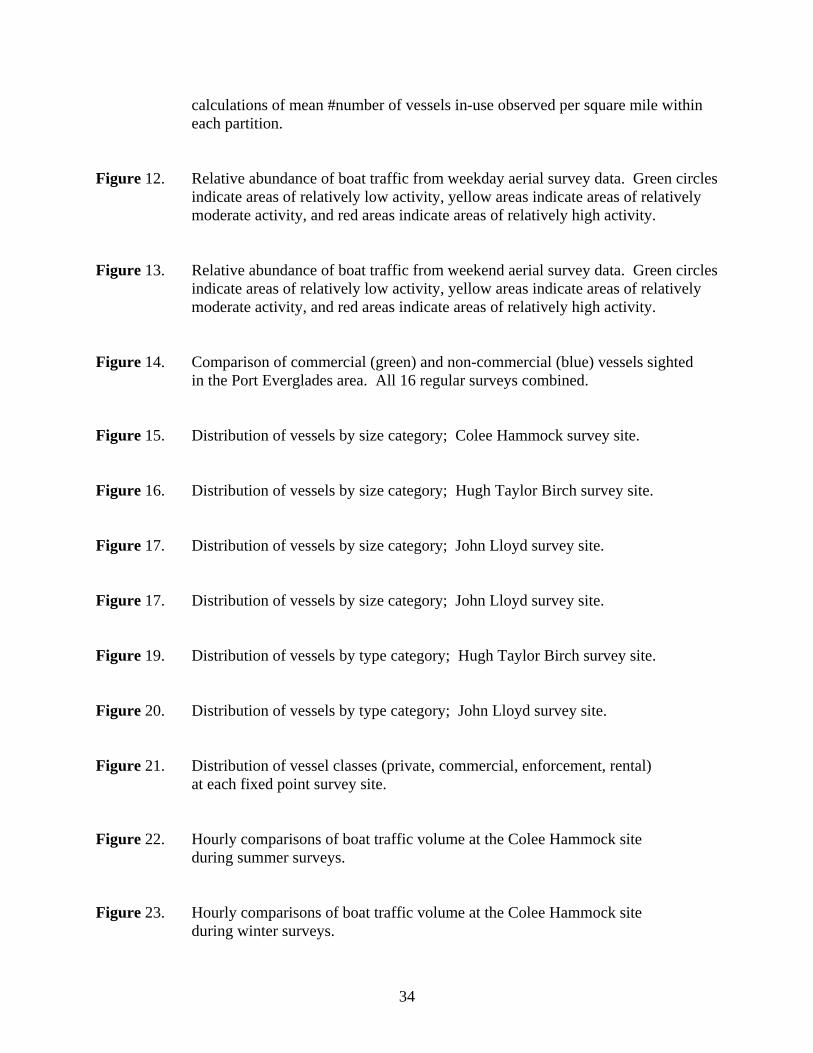
34
calculations of mean #number of vessels in-use observed per square mile within each partition.
Figure 12. Relative abundance of boat traffic from weekday aerial survey data. Green circles indicate areas of relatively low activity, yellow areas indicate areas of relatively
moderate activity, and red areas indicate areas of relatively high activity.
Figure 13. Relative abundance of boat traffic from weekend aerial survey data. Green circles indicate areas of relatively low activity, yellow areas indicate areas of relatively
moderate activity, and red areas indicate areas of relatively high activity.
Figure 14. Comparison of commercial (green) and non-commercial (blue) vessels sighted in the Port Everglades area. All 16 regular surveys combined.
Figure 15. Distribution of vessels by size category; Colee Hammock survey site.
Figure 16. Distribution of vessels by size category; Hugh Taylor Birch survey site.
Figure 17. Distribution of vessels by size category; John Lloyd survey site.
Figure 17. Distribution of vessels by size category; John Lloyd survey site.
Figure 19. Distribution of vessels by type category; Hugh Taylor Birch survey site.
Figure 20. Distribution of vessels by type category; John Lloyd survey site.
Figure 21. Distribution of vessel classes (private, commercial, enforcement, rental) at each fixed point survey site.
Figure 22. Hourly comparisons of boat traffic volume at the Colee Hammock site during summer surveys.
Figure 23. Hourly comparisons of boat traffic volume at the Colee Hammock site during winter surveys.
35
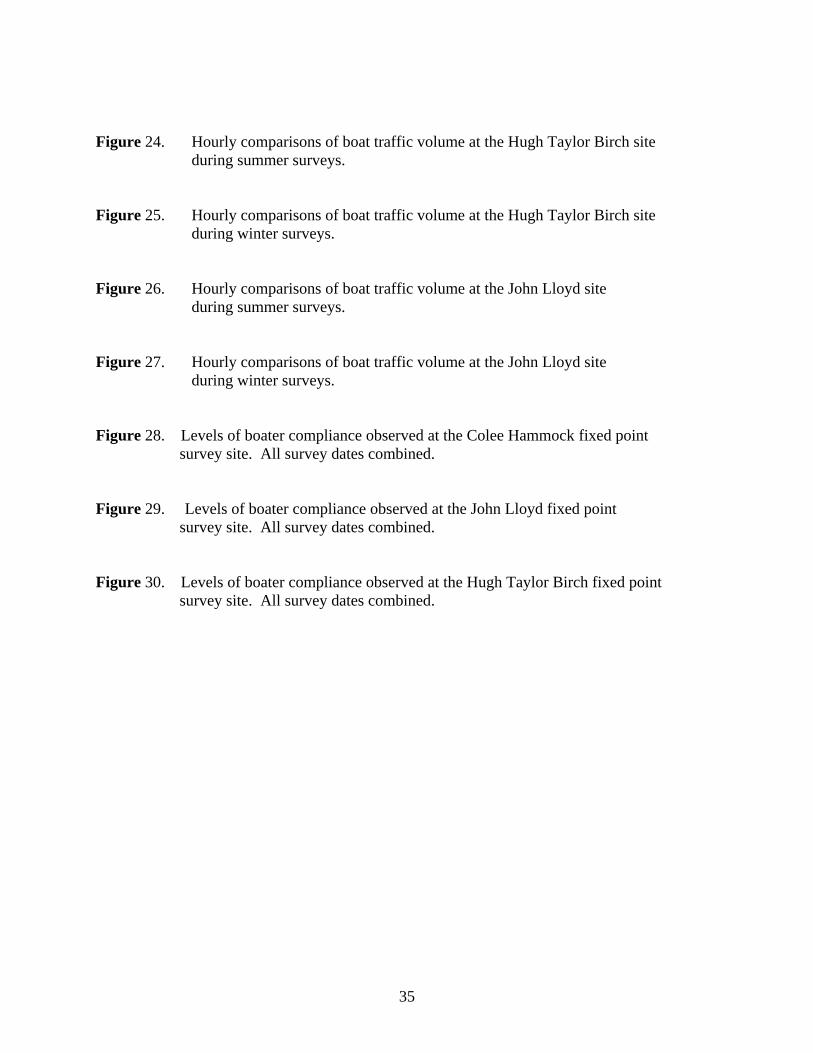
Figure 24. Hourly comparisons of boat traffic volume at the Hugh Taylor Birch site during summer surveys.
Figure 25. Hourly comparisons of boat traffic volume at the Hugh Taylor Birch site during winter surveys.
Figure 26. Hourly comparisons of boat traffic volume at the John Lloyd site during summer surveys.
Figure 27. Hourly comparisons of boat traffic volume at the John Lloyd site during winter surveys.
Figure 28. Levels of boater compliance observed at the Colee Hammock fixed point survey site. All survey dates combined.
Figure 29. Levels of boater compliance observed at the John Lloyd fixed point survey site. All survey dates combined.
Figure 30. Levels of boater compliance observed at the Hugh Taylor Birch fixed point survey site. All survey dates combined.
36
Table 1. Broward County aerial survey dates, along with total vessels surveyed per flight.
Survey Date Vessels Surveyed
Friday, May 7, 2004 (am) 97 Friday, May 7, 2004 (pm) 142 Saturday, May 22, 2004 (am) 204 Saturday, May 22, 2004 (pm) 384 Sunday, May 29, 2004 (pm) 525 Wednesday, June 23, 2004 (am) 97 Wednesday, June 23, 2004 (pm) 128 Sunday, August 22, 2004 (am) 191 Sunday, August 22, 2004 (pm) 477 Thursday, October 21, 2004 (am) 106 Thursday, October 21, 2004 (am) 123 Saturday, November 13, 2004 (am) 178 Saturday, November 13, 2004 (pm) * 329 Saturday, December, 11, 2004 (am) 131 Saturday, December 11, 2004 (pm) 198 Monday, January 24, 2005 (am) 63 Monday, January 24, 2005 (pm) 79 * - abbreviated survey
37
Table 2. Aerial survey data summary; all 16 regular surveys combined. AERIAL SURVEY SUMMARY
Survey Interval
Mean # boats observed per
flight Sample Size (n)
Weekday mornings 91 4
Weekday afternoons 118 4
Weekend mornings 176 4
Weekend afternoons 347 4 *
Holiday weekend afternoon 525 1
* - afternoon survey on 11/13/04 was shortened due to air traffic conflicts with Ft Lauderdale / Hollywood International Airport
38
Table 3. Aerial survey data summary; comparison of vessel counts by type and size category. AERIAL SURVEY DATA
SIZE CATEGORY Vessel Count
Percent Composition
less than 12 feet 48 2% 12 - 15 feet 161 6% 16 - 25 feet 1,616 55% 26 - 39 feet 632 22% 40 - 64 feet 321 11% 65 - 109 feet 115 4% greater than 109 feet 34 1% Total 2,927 100%
TYPE CATEGORY Vessel Count
Percent Composition
Small Powerboat 1,636 56% Large Powerboat 840 29% Sailboat 193 7% Personal Watercraft 48 2% Other 210 7% Total 2,927 100%
39
Table 4. Summary of aerial survey data from the Port Everglades area by vessel size, type and class; all 16 regular surveys combined. Aerial Survey Data
PTE Zone (Port Everglades)
Size Category # Boats Percentage
< 12 feet 4 1%
12 - 15 feet 8 2% 16 - 25 feet 258 57% 26 - 39 feet 91 20% 40 - 64 feet 53 12%
65 - 109 feet 30 7% > 109 feet 11 2%
Total 455 100%
Type Category # Boats Percentage
Small Powerboat 252 55% Large Powerboat 133 29%
Sailboat 28 6% Pers. Watercraft 4 1%
Other 38 8%
Total 455 100%
Boat Class # Boats Percentage
Commercial 41 9% Enforcement 5 1%
Rental 0 0% Non-Commercial 409 90%
Total 455 100%
40
Table 5. Comparison of speeds between large commercial and non-commercial vessels in proximity to Port Everglades.
Aerial Data
PTE Zone (Port Everglades) Vessels Larger Than 40 Feet
COMMERCIAL Drift /
Anchor Idle / Slow Plowing / Cruising Planing Total
40 - 64 feet 2 10 0 0 12 65 - 109 feet 0 7 1 0 8
> 110 feet 1 8 0 0 9
Total 3 25 1 0 29 Percentage 10% 86% 3% 0% 100%
NON- COMMERCIAL
Drift / Anchor Idle / Slow
Plowing / Cruising Planing Total
40 - 64 feet 6 18 17 0 41 65 - 109 feet 3 11 8 0 22
> 110 feet 0 2 0 0 2
Total 9 31 25 0 65 Percentage 14% 48% 38% 0% 100%
41
Table 6. Broward County fixed point survey dates, along with total vessels surveyed per site.
COLEE HAMMOCK PARK
AM PM VESSELS
SURVEYED 30-Jul-04 0900-1159 1300-1559 137 31-Jul-04 0900-1159 1230-1500 216 29-Aug-04 0900-1159 1230-1559 375 30-Aug-04 0900-1159 1300-1559 87 01-Feb-05 0900-1559 1300-1559 167 02-Feb-05 0900-1559 1300-1559 173 19-Feb-05 0900-1559 1300-1559 338 20-Feb-05 0900-1559 1300-1559 508 HUGH TAYLOR BIRCH STATE PARK
AM PM 30-Jul-04 0900-1159 1300-1559 84 31-Jul-04 0900-1159 1230-1500 156 29-Aug-04 0900-1159 1230-1559 231 30-Aug-04 0900-1159 1300-1559 43 01-Feb-05 0900-1559 1300-1559 96 02-Feb-05 0900-1559 1300-1559 131 19-Feb-05 0900-1559 1300-1559 258 20-Feb-05 0900-1559 1300-1559 420 JOHN LLOYD STATE PARK
AM PM 30-Jul-04 0900-1159 1300-1559 133
31-Jul-04 0900-1159 1230-1430; 1530-1559 221
29-Aug-04 0900-1159 1230-1559 465 30-Aug-04 0900-1159 1300-1559 95 01-Feb-05 0900-1559 1300-1559 123 02-Feb-05 0900-1559 1300-1559 137 19-Feb-05 0900-1559 1300-1559 348 20-Feb-05 0900-1559 1300-1559 547
42
Table 7. Comparison of fixed point survey data by size category. Fixed Point Survey Data
Size Category
John Lloyd State Park (JL)
Hugh Taylor Birch State Park
(HTB) Colee Hammock
Park (CH) Total
< 11 ft 27 29 13 69 12' - 15' 50 13 59 122 16' - 25' 1194 572 901 2667 26' - 39' 485 456 465 1406 40' - 64' 217 303 420 940
65' - 109' 75 41 135 251 > 110' 21 5 8 34
2069 1419 2001 5489
Size Category
John Lloyd State Park (JL)
Hugh Taylor Birch State Park
(HTB) Colee Hammock
Park (CH) Total
< 11 ft 1% 2% 1% 1% 12' - 15' 2% 1% 3% 2% 16' - 25' 58% 40% 45% 49% 26' - 39' 23% 32% 23% 26% 40' - 64' 10% 21% 21% 17%
65' - 109' 4% 3% 7% 5% > 110' 1% 0% 0% 1%
100% 100% 100% 100%
43
Table 8. Summary of identified commercial vessels observed on 8 or more occasions.
Colee Hammock Site (CH)
Name Type # Observations Broward Transport 37 Tropic Transport 26 Michele Transport 20 Dale R Transport 18 Riverfront Cruises Tour 17 Anticipation Tour 16 Carrie B Tour 16 Jungle Queen Tour 16 Riverwalk Transport 15 Glades Transport 14 Buz Transport 13 Cape Ann Towing Tow 10 Clay Shaw Transport 10 Deliverance II Fuel 10 Himmarshee Transport 10 Bio Bus Transport 10 Lauderdale Transport 9
Hugh Taylor Birch Site (HTB)
Name Type # Observations Michele Transport 20 Buz Transport 16 Glades Transport 13 Riverwalk Transport 12 Himmarshee Transport 11 Tropic Transport 10 Dale R Transport 9
John Lloyd Site (JL)
Name Type # Observations Sea Legs III Fishing 8 Sun Cruz V Casino 8
44
Table 9. Frequency distribution of identified non-commercial vessels observed from fixed point survey sites.
Frequency Of Observations
# Unique Vessels
1 1780
2 734
3 186
4 92
5 24
6 13
7 4
8 1
9 3
10 0
11 3
12 1
13 0
14 0
15 0
16 1
17 0
18 0
19 0
20 0
21 0
22 0
23 1
45
Table 10. Comparisons of weekend and weekday boat traffic from fixed point survey sites. Total Vessel Passes
Colee Hammock
Park (CH) Weekend Weekday Ratio summer 591 224 2.64 winter 846 340 2.49 Total 1437 564 2.55
Hugh Taylor Birch State Park
(HTB) Weekend Weekday Ratio summer 387 127 3.05 winter 678 227 2.99 Total 1065 354 3.01
John Lloyd State Park (JL) Weekend Weekday Ratio summer 686 228 3.01 winter 895 260 3.44 Total 1581 488 3.24
All Sites Weekend Weekday Ratio
4083 1406 2.90
46
Table 11. Comparisons of morning and afternoon boat traffic from fixed point survey sites. Total Vessel Passes Colee Hammock
Park Afternoon Morning Ratio summer 495 320 1.55 winter 841 345 2.44 Total 1336 665 2.01
Hugh Taylor Birch State Park Afternoon Morning Ratio
summer 359 155 2.32 winter 690 215 3.21 Total 1049 370 2.84
John Lloyd State Park Afternoon Morning Ratio
summer 576 338 1.70 winter 775 380 2.04 Total 1351 718 1.88
All Sites Weekend Weekday Ratio 3736 1753 2.13
47
Table 12. Seasonal comparisons of boat traffic from fixed point survey sites.
Colee Hammock
Park (CH) n Mean Vessel
Passes Per Hour Summer Weekdays 224 18.7 Summer Weekends 591 49.3 Winter Weekdays 340 28.3 Winter Weekends 846 70.5
Hugh Taylor Birch State Park (HTB) n
Mean Vessel Passes Per Hour
Summer Weekdays 127 10.6 Summer Weekends 387 32.2 Winter Weekdays 227 18.9 Winter Weekends 678 56.5
John Lloyd State
Park (JL) n Mean Vessel
Passes Per Hour Summer Weekdays 227 18.9 Summer Weekends 687 57.3 Winter Weekdays 260 21.7 Winter Weekends 895 74.6
48
Table 13. Vessel counts by direction of travel at the Colee Hammock Site. COLEE HAMMOCK PARK SURVEY SITE (CH) D = New River downriver, U = New River upriver SUMMER - WEEKDAYS Time Interval D > D D > U U > D U > U Total
0900-0959 0 10 5 0 15 1000-1059 0 16 24 0 40 1100-1159 0 20 26 0 46 1300-1359 0 23 19 0 42 1400-1459 0 33 15 0 48 1500-1559 0 19 14 0 33 Total 0 121 103 0 224
SUMMER - WEEKENDS Time Interval D > D D > U U > D U > U Total
0900-0959 2 9 29 3 43 1000-1059 0 27 41 0 68 1100-1159 0 32 74 2 108 1230-1259 1 21 34 0 56 1300-1359 1 69 46 1 117 1400-1459 4 67 48 2 121 1500-1559 1 46 30 1 78 Total 9 271 302 9 591
WINTER - WEEKDAYS Time Interval D > D D > U U > D U > U Total
0900-0959 0 7 9 0 16 1000-1059 0 12 29 0 41 1100-1159 1 22 24 0 47 1300-1359 0 40 32 0 72 1400-1459 0 39 37 0 76 1500-1559 0 48 40 0 88 Total 1 168 171 0 340
WINTER - WEEKENDS Time Interval D > D D > U U > D U > U Total
0900-0959 0 14 24 0 38 1000-1059 0 27 51 0 78 1100-1159 1 54 70 0 125 1300-1359 1 69 88 0 158 1400-1459 1 120 107 0 228 1500-1559 2 117 97 3 219 Total 5 401 437 3 846
49
Table 14. Vessel counts by direction of travel at the Hugh Taylor Birch Site. HUGH TAYLOR BIRCH STATE PARK SITE (HTB)
N = ICW Northbound, S = ICW Southbound
SUMMER - WEEKDAYS Time Interval N > N N > S S > N S > S Total
0900-0959 0 7 6 0 13 1000-1059 0 13 5 0 18 1100-1159 0 5 7 0 12 1300-1359 0 12 10 0 22 1400-1459 0 16 8 0 24 1500-1559 0 18 20 0 38 Total 0 71 56 0 127
SUMMER - WEEKENDS
Time Interval N > N N > S S > N S > S Total 0900-0959 0 7 6 1 14 1000-1059 0 31 12 1 44 1100-1159 0 30 22 2 54 1230-1259 1 15 13 0 29 1300-1359 0 41 46 2 89 1400-1459 0 46 54 0 100 1500-1559 0 24 33 0 57 Total 1 194 186 6 387
WINTER - WEEKDAYS
Time Interval N > N N > S S > N S > S Total 0900-0959 0 1 5 0 6 1000-1059 0 13 11 0 24 1100-1159 2 22 7 0 31 1300-1359 0 28 25 0 53 1400-1459 0 27 26 0 53 1500-1559 0 28 32 0 60 Total 2 119 106 0 227
WINTER - WEEKENDS Time Interval N > N N > S S > N S > S Total 0900-0959 0 9 14 0 23 1000-1059 0 15 28 1 44 1100-1159 1 36 50 0 87 1300-1359 0 79 79 1 159 1400-1459 0 92 108 0 200 1500-1559 1 88 75 1 165 Total 2 319 354 3 678
50
Table 15. Vessel counts by direction of travel at the John Lloyd Site. JOHN LLOYD STATE PARK SURVEY SITE (JL) D = Dania Cutoff Canal, N = ICW Northbound, S = ICW Southbound
SUMMER - WEEKDAYS
Time Interval D>D D>N D>S N>D N>N N>S S>D S>N S>S Total 0900-0959 0 15 1 4 0 1 2 2 0 25 1000-1059 0 8 3 3 0 2 1 6 0 23 1100-1159 0 13 7 11 0 5 2 8 0 46 1300-1359 1 8 2 8 2 9 6 12 0 48 1400-1459 1 10 4 7 0 6 4 4 0 36 1500-1559 0 4 3 25 0 10 3 4 0 49 Total 2 58 20 58 2 33 18 36 0 227
SUMMER - WEEKENDS
Time Interval D>D D>N D>S N>D N>N N>S S>D S>N S>S Total 0900-0959 0 29 1 2 0 2 3 9 0 46 1000-1059 0 47 4 3 0 9 1 23 0 87 1100-1159 0 38 10 16 0 21 3 22 0 110 1230-1259 0 28 12 14 0 15 3 13 0 85 1300-1359 1 34 12 42 0 42 3 31 0 165 1400-1459 0 18 7 29 0 22 8 13 0 97 1500-1559 0 18 7 34 1 14 7 16 0 97 Total 1 212 53 140 1 125 28 127 0 687
WINTER - WEEKDAYS
Time Interval D>D D>N D>S N>D N>N N>S S>D S>N S>S Total 0900-0959 0 8 1 6 0 8 1 3 0 27 1000-1059 0 10 2 10 0 7 1 6 0 36 1100-1159 0 14 3 11 0 9 1 6 0 44 1300-1359 0 7 2 15 1 10 0 12 0 47 1400-1459 1 17 2 11 0 9 1 10 0 51 1500-1559 0 14 2 17 0 10 4 8 0 55 Total 1 70 12 70 1 53 8 45 0 260
WINTER - WEEKENDS
Time Interval D>D D>N D>S N>D N>N N>S S>D S>N S>S Total 0900-0959 1 7 4 1 0 9 2 11 2 37 1000-1059 0 30 13 10 0 20 3 19 0 95 1100-1159 0 42 14 17 0 33 5 30 0 141 1300-1359 0 36 17 42 0 52 13 58 1 219 1400-1459 0 44 13 33 0 55 12 57 0 214 1500-1559 0 26 10 40 0 41 14 58 0 189 Total 1 185 71 143 0 210 49 233 3 895
51
Table 16. Seasonal comparison of boater compliance at the Colee Hammock Site. Colee Hammock Site (CH) Vessel Passes
Survey Interval Compliance
Technical Non-Compliance
Blatant Non-Compliance
Summer 546 265 4
Winter 1011 166 9 Percentage
Survey Interval Compliance
Technical Non-Compliance
Blatant Non-Compliance
Summer 67.0% 32.5% 0.5%
Winter 85.2% 14.0% 0.8%
52
Table 17. Morning / afternoon comparison of boater compliance at the Colee Hammock Site. Colee Hammock Site Vessel Passes
Survey Interval Compliance
Technical Non-Compliance
Blatant Non-Compliance
Morning 551 113 1
Afternoon 1006 318 12 Percentage
Survey Interval Compliance
Technical Non-Compliance
Blatant Non-Compliance
Morning 82.9% 17.0% 0.2%
Afternoon 75.3% 23.8% 0.9%
53
Table 18. Weekday / weekend comparison of boater compliance at the Colee Hammock Site. Colee Hammock Site Vessel Passes
Survey Interval Compliance
Technical Non-Compliance
Blatant Non-Compliance
Weekday 453 104 7
Weekend 1104 327 6 Percentage
Survey Interval Compliance
Technical Non-Compliance
Blatant Non-Compliance
Weekday 80.3% 18.4% 1.2%
Weekend 76.8% 22.8% 0.4%
54
Table 19. Seasonal comparison of boater compliance at the John Lloyd Site. John Lloyd Site (JL) Vessel Passes
Survey Interval Compliance
Technical Non-Compliance
Blatant Non-Compliance
Summer 516 379 19
Winter 708 424 18 Percentage
Survey Interval Compliance
Technical Non-Compliance
Blatant Non-Compliance
Summer 56.5% 41.5% 2.1%
Winter 61.6% 36.9% 1.6%
55
Table 20. Morning / afternoon comparison of boater compliance at the John Lloyd Site. John Lloyd Site (JL) Vessel Passes
Survey Interval Compliance
Technical Non-Compliance
Blatant Non-Compliance
Morning 407 301 10
Afternoon 817 502 27 Percentage
Survey Interval Compliance
Technical Non-Compliance
Blatant Non-Compliance
Morning 56.7% 41.9% 1.4%
Afternoon 60.7% 37.3% 2.0%
56
Table 21. Weekday / weekend comparison of boater compliance at the John Lloyd Site. John Lloyd Site (JL) Vessel Passes
Survey Interval Compliance
Technical Non-Compliance
Blatant Non-Compliance
Weekday 262 219 7
Weekend 962 584 30 Percentage
Survey Interval Compliance
Technical Non-Compliance
Blatant Non-Compliance
Weekday 53.7% 44.9% 1.4%
Weekend 61.0% 37.1% 1.9%
57
Table 22. Seasonal comparison of boater compliance at the Hugh Taylor Birch Site. Hugh Taylor Birch Site (HTB) Vessel Passes
Survey Interval Compliance
Technical Non-Compliance
Blatant Non-Compliance
Summer * * *
Winter 325 383 22 Percentage
Survey Interval Compliance
Technical Non-Compliance
Blatant Non-Compliance
Summer * * *
Winter 44.5% 52.5% 3.0%

58
Table 23. Morning / afternoon comparison of boater compliance at the Hugh Taylor Birch Site. Hugh Taylor Birch Site Vessel Passes
Survey Interval Compliance
Technical Non-Compliance
Blatant Non-Compliance
Morning 96 71 11
Afternoon 287 275 19 Percentage
Survey Interval Compliance
Technical Non-Compliance
Blatant Non-Compliance
Morning 53.9% 39.9% 6.2%
Afternoon 49.4% 47.3% 3.3%
59
Table 24. Weekday / weekend comparison of boater compliance at the Hugh Taylor Birch Site. Hugh Taylor Birch Site Vessel Passes
Survey Interval Compliance
Technical Non-Compliance
Blatant Non-Compliance
Weekday * * *
Weekend 362 317 24 Percentage
Survey Interval Compliance
Technical Non-Compliance
Blatant Non-Compliance
Weekday * * *
Weekend 51.5% 45.1% 3.4%
60
Figure 1. Limits of aerial surveys for the Broward County Boat Study. Red areas were routinely surveyed, while yellow areas were typically limited by proximity to Ft Lauderdale / Hollywood International Airport.
61
Figure 2. Broward County speed zone map, including location of CH and HTB survey sites.
62
Figure 3. Broward County speed zone map, including the location of the JL survey site.
63
Figure 4. Comparison of stationary (orange) and moving (yellow) vessels surveyed in the Hillsboro Inlet area. All 16 regular surveys combined.
64
Figure 5. Comparison of stationary (orange) and moving (yellow) vessels surveyed in the Port Everglades area. All 16 regular surveys combined.
65
Figure 6. Comparison of slow-moving (pink) and fast-moving (green) vessels surveyed in the Hillsboro Inlet area. All 16 regular surveys combined.
66
Figure 7. Comparison of slow-moving (pink) and fast-moving (green) vessels surveyed in the Port Everglades area. All 16 regular surveys combined.
67
Figure 8. Broward County waterway, partitioned into 40 – 1 mile radius areas.
68
Figure 9. Expanded view of northern portion of Broward County waterway, including Hillsboro Inlet and the Cypress Creek / Pompano Canal waterway, including calculations of mean #number of vessels in-use observed per square mile within each partition.
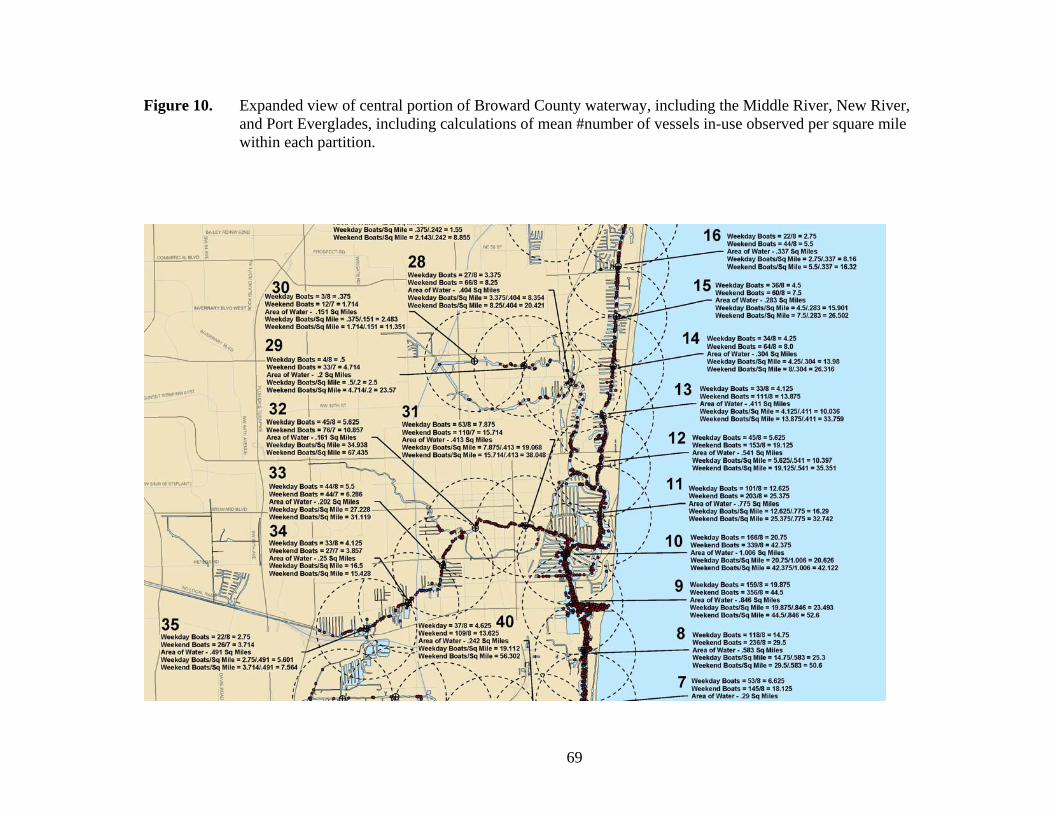
69
Figure 10. Expanded view of central portion of Broward County waterway, including the Middle River, New River, and Port Everglades, including calculations of mean #number of vessels in-use observed per square mile within each partition.
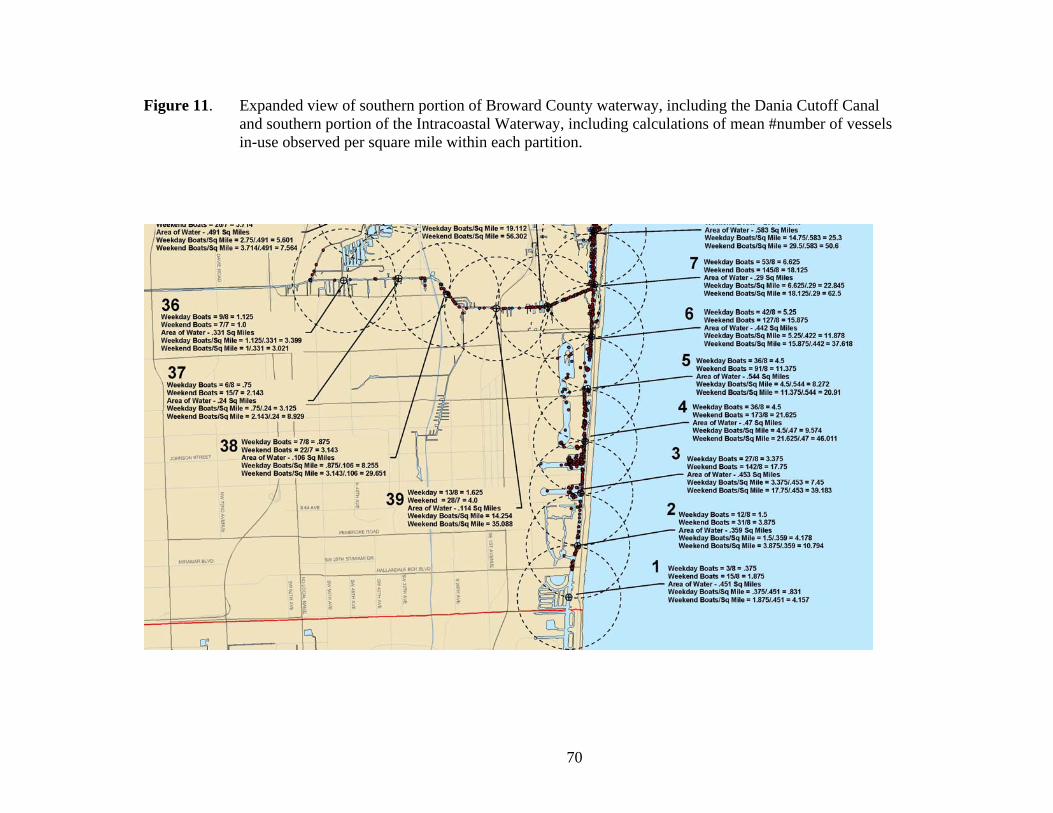
70
Figure 11. Expanded view of southern portion of Broward County waterway, including the Dania Cutoff Canal and southern portion of the Intracoastal Waterway, including calculations of mean #number of vessels in-use observed per square mile within each partition.
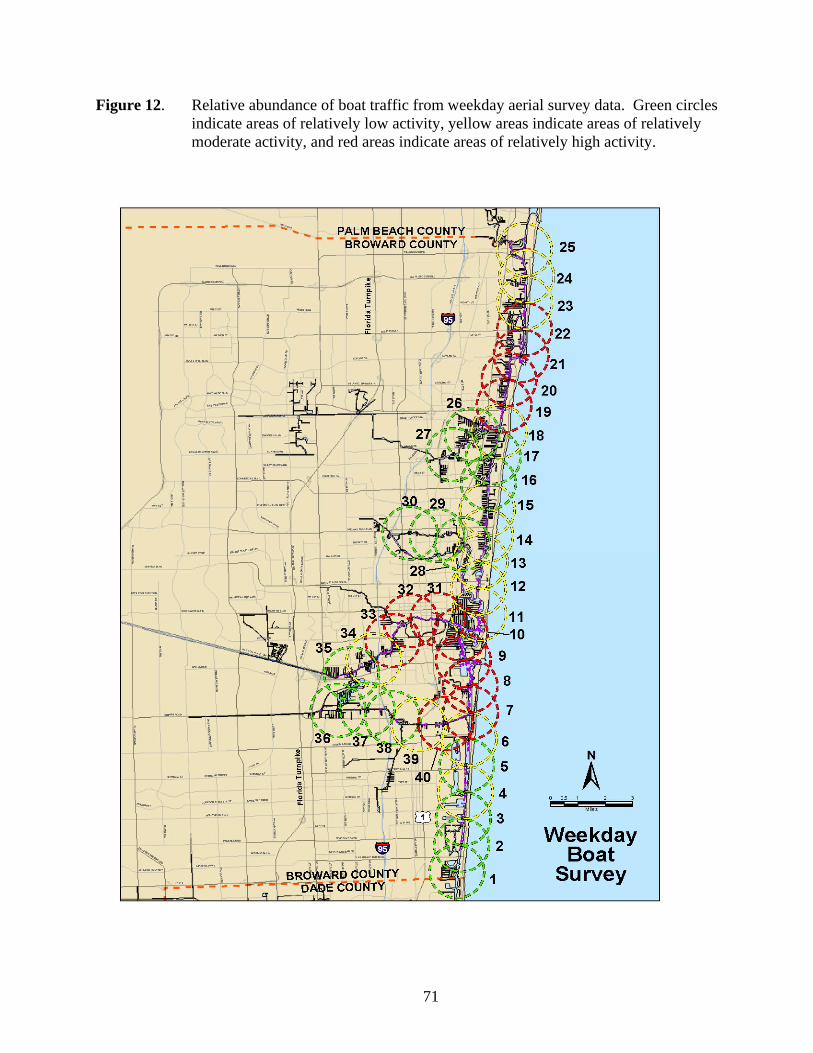
71
Figure 12. Relative abundance of boat traffic from weekday aerial survey data. Green circles indicate areas of relatively low activity, yellow areas indicate areas of relatively
moderate activity, and red areas indicate areas of relatively high activity.
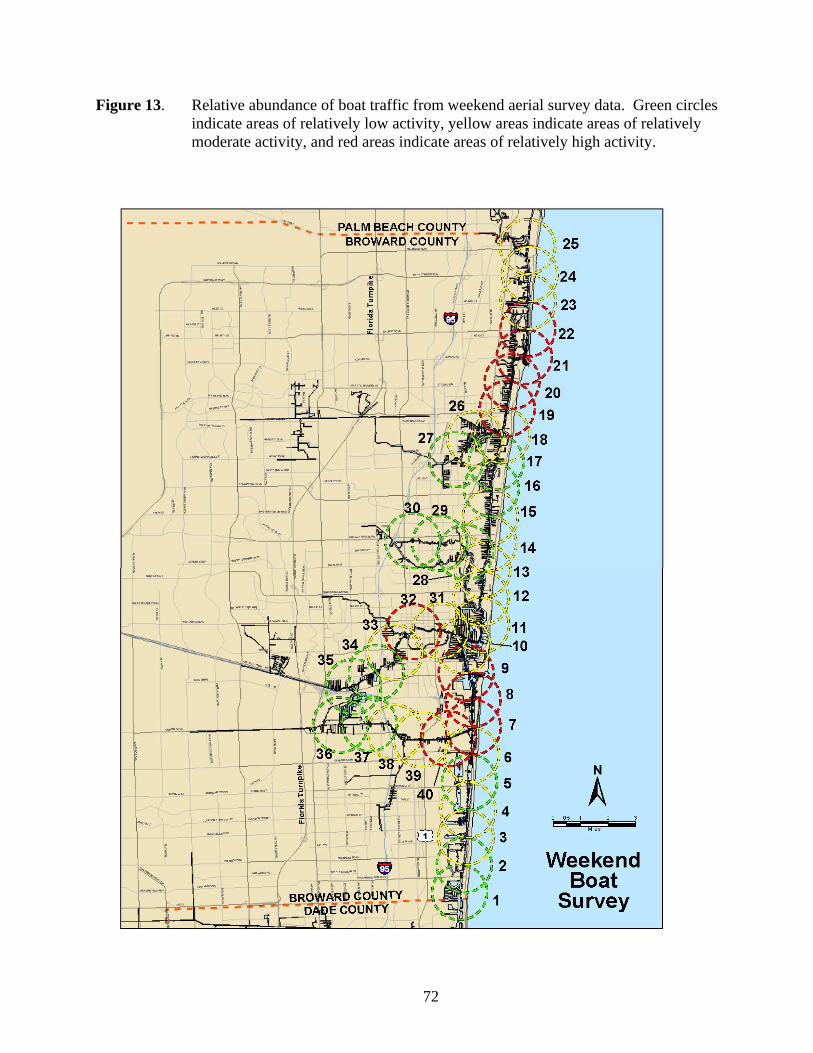
72
Figure 13. Relative abundance of boat traffic from weekend aerial survey data. Green circles indicate areas of relatively low activity, yellow areas indicate areas of relatively
moderate activity, and red areas indicate areas of relatively high activity.
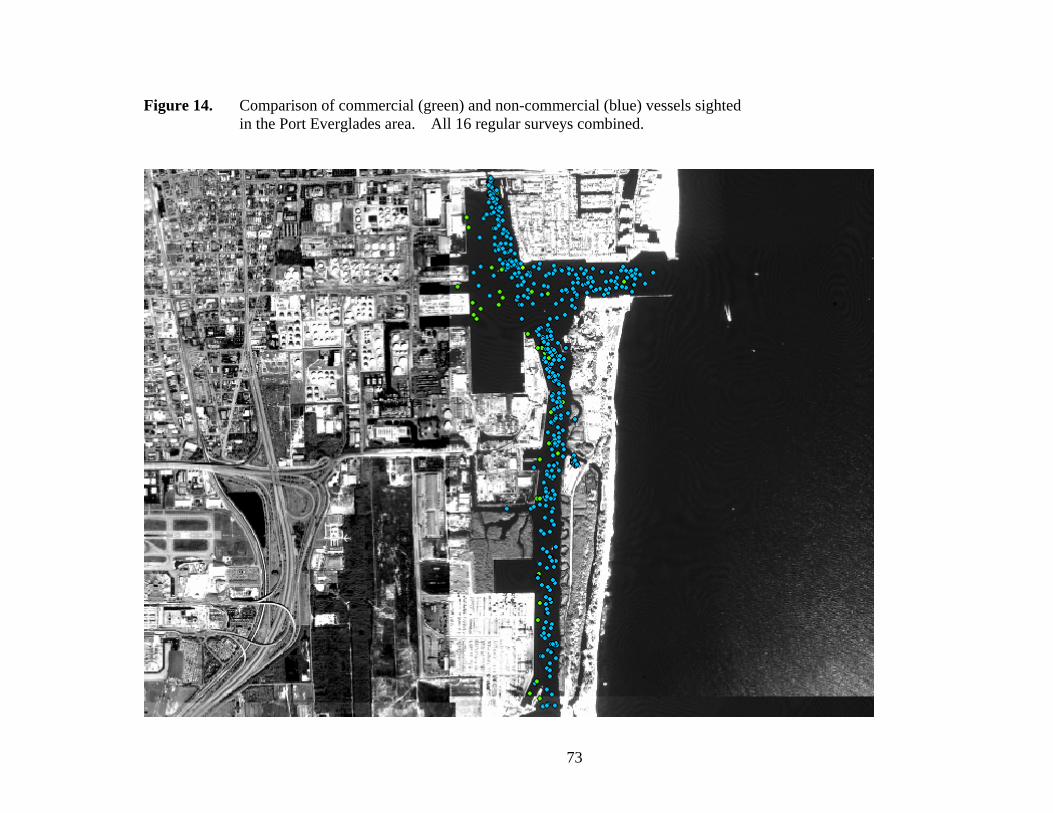
73
Figure 14. Comparison of commercial (green) and non-commercial (blue) vessels sighted in the Port Everglades area. All 16 regular surveys combined.
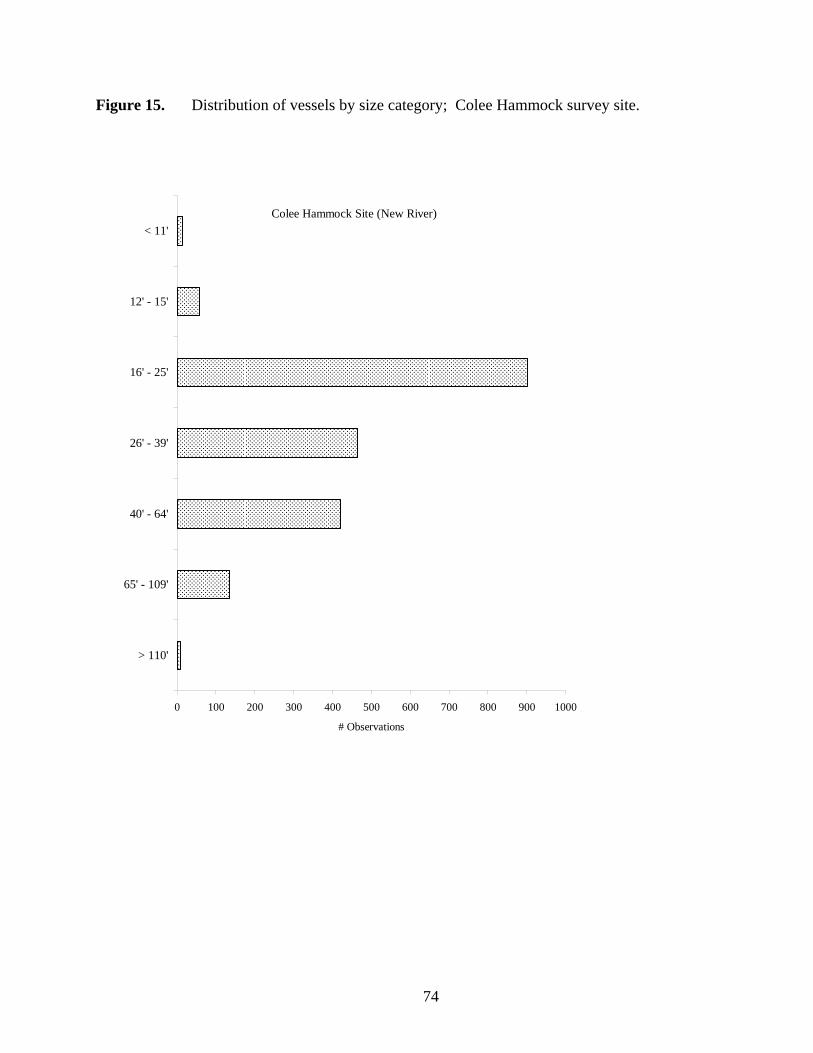
74
Figure 15. Distribution of vessels by size category; Colee Hammock survey site.
Colee Hammock Site (New River)
0 100 200 300 400 500 600 700 800 900 1000
> 110'
65' - 109'
40' - 64'
26' - 39'
16' - 25'
12' - 15'
< 11'
# Observations
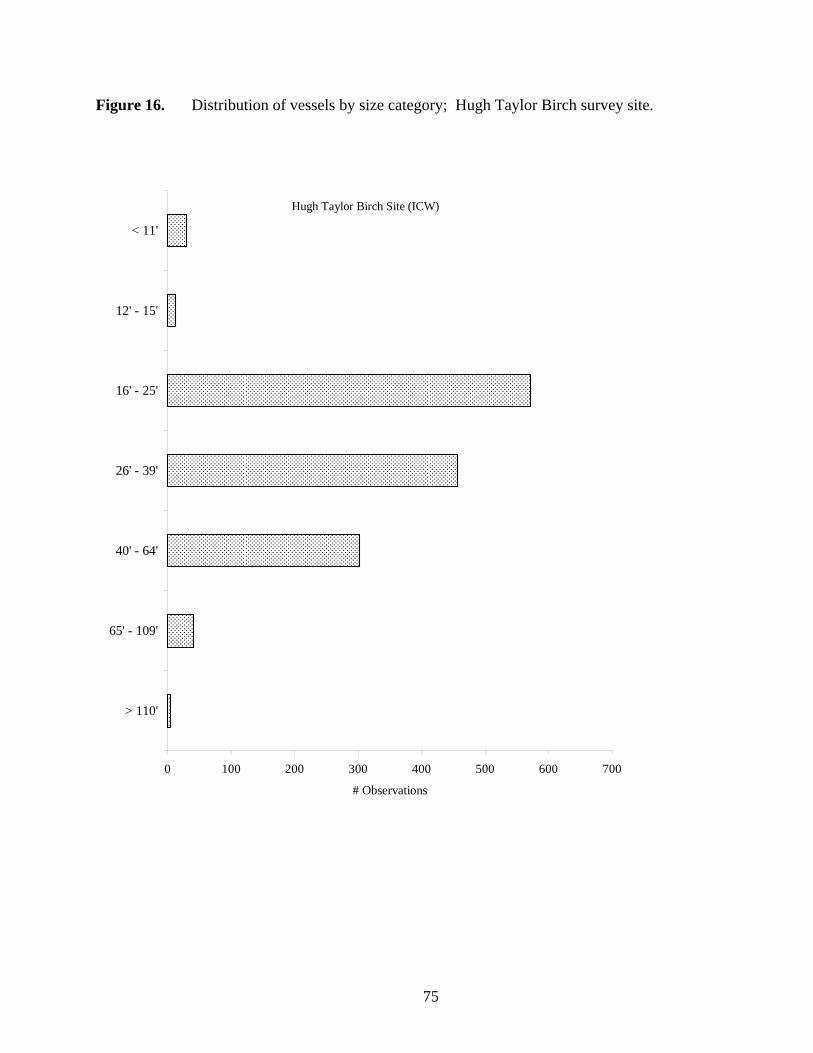
75
Figure 16. Distribution of vessels by size category; Hugh Taylor Birch survey site.
Hugh Taylor Birch Site (ICW)
0 100 200 300 400 500 600 700
> 110'
65' - 109'
40' - 64'
26' - 39'
16' - 25'
12' - 15'
< 11'
# Observations
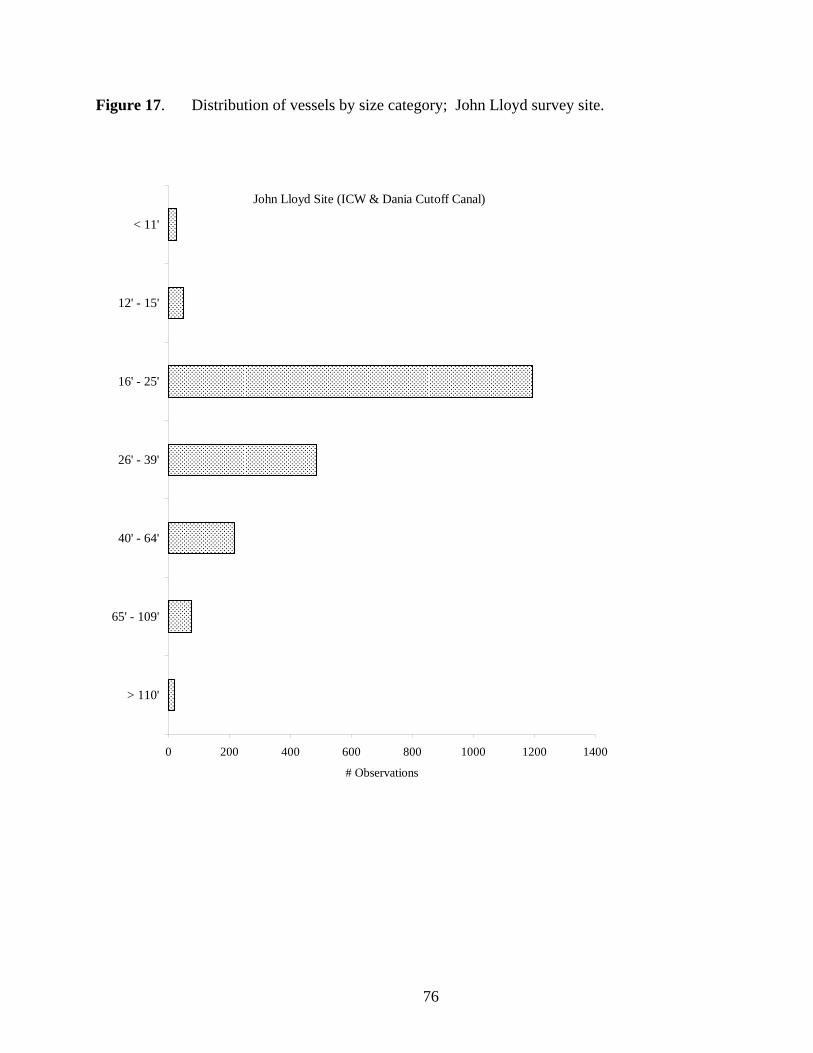
76
Figure 17. Distribution of vessels by size category; John Lloyd survey site.
John Lloyd Site (ICW & Dania Cutoff Canal)
0 200 400 600 800 1000 1200 1400
> 110'
65' - 109'
40' - 64'
26' - 39'
16' - 25'
12' - 15'
< 11'
# Observations
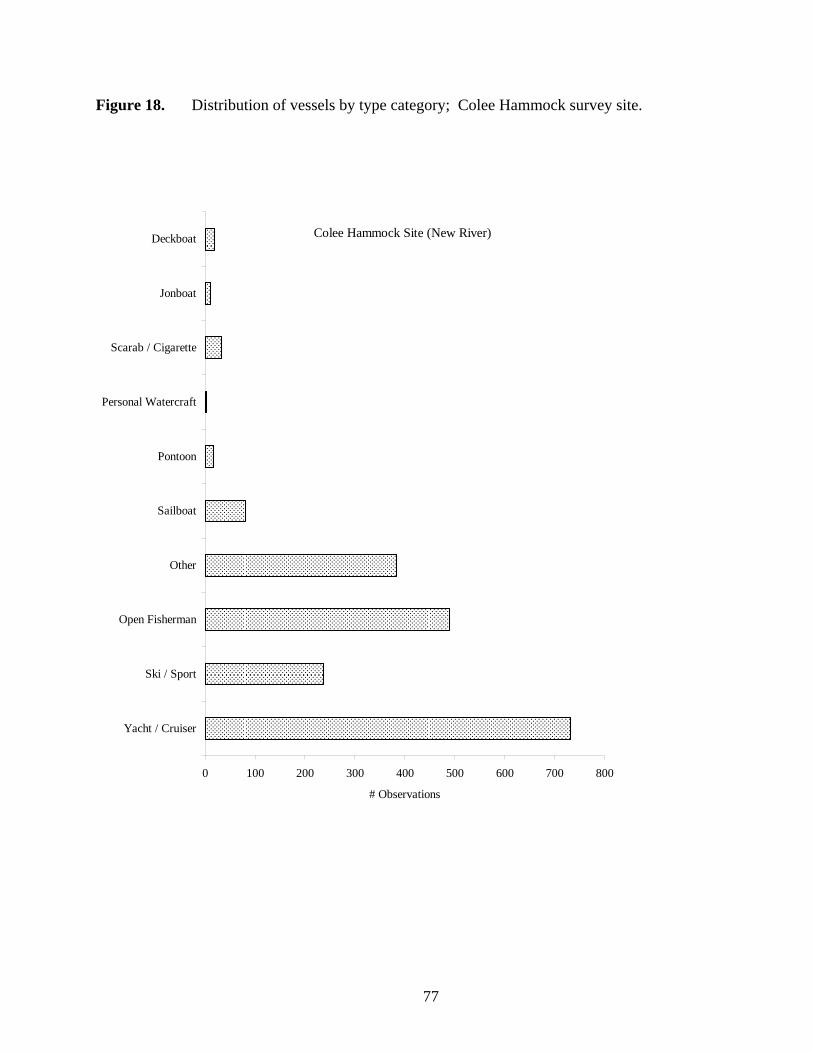
77
Figure 18. Distribution of vessels by type category; Colee Hammock survey site.
Colee Hammock Site (New River)
0 100 200 300 400 500 600 700 800
Yacht / Cruiser
Ski / Sport
Open Fisherman
Other
Sailboat
Pontoon
Personal Watercraft
Scarab / Cigarette
Jonboat
Deckboat
# Observations
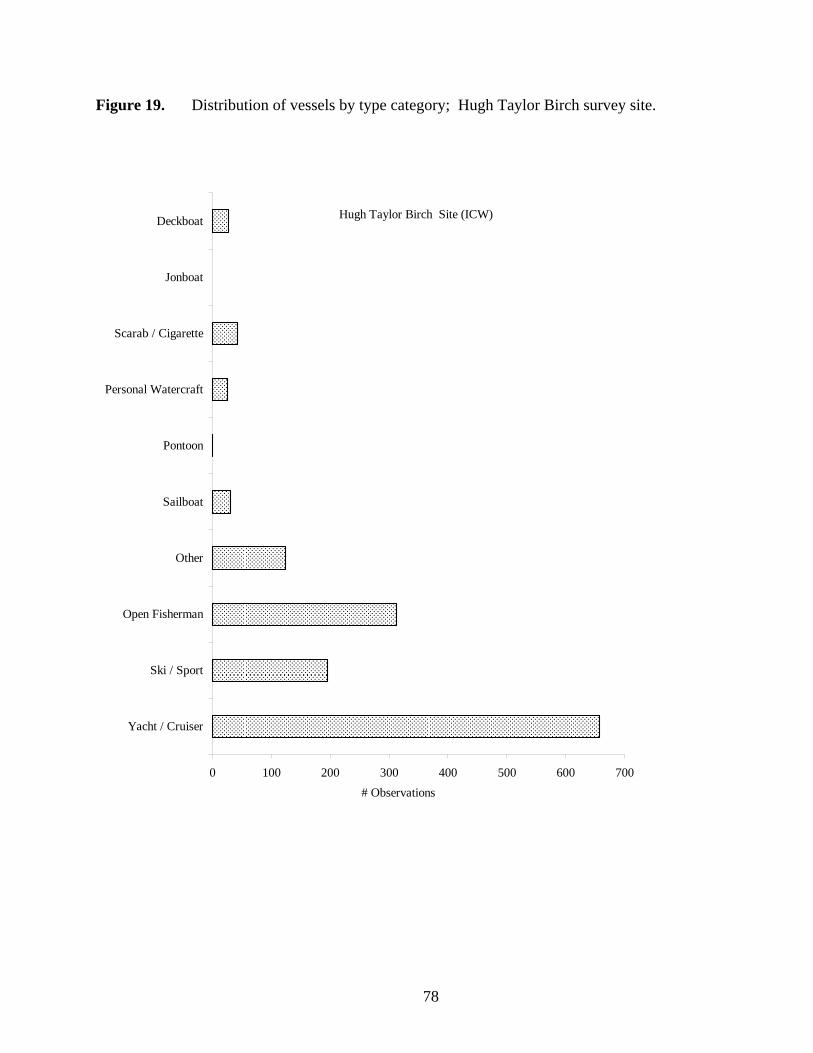
78
Figure 19. Distribution of vessels by type category; Hugh Taylor Birch survey site.
Hugh Taylor Birch Site (ICW)
0 100 200 300 400 500 600 700
Yacht / Cruiser
Ski / Sport
Open Fisherman
Other
Sailboat
Pontoon
Personal Watercraft
Scarab / Cigarette
Jonboat
Deckboat
# Observations
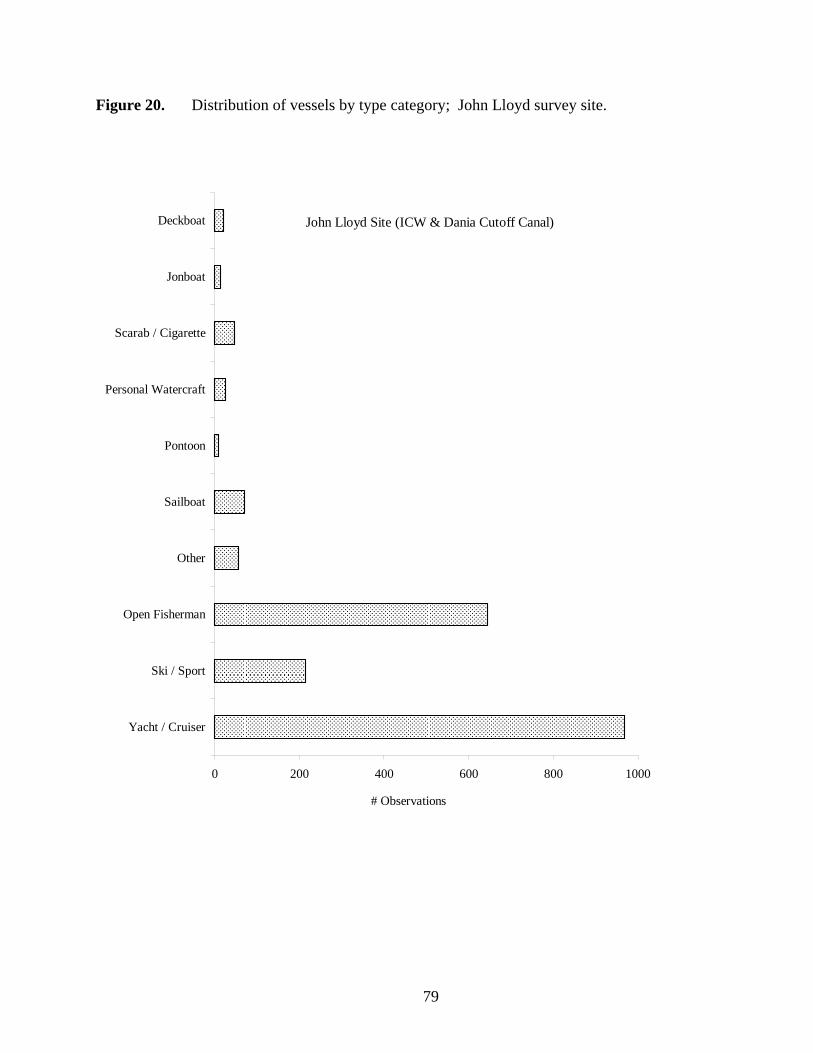
79
Figure 20. Distribution of vessels by type category; John Lloyd survey site.
John Lloyd Site (ICW & Dania Cutoff Canal)
0 200 400 600 800 1000
Yacht / Cruiser
Ski / Sport
Open Fisherman
Other
Sailboat
Pontoon
Personal Watercraft
Scarab / Cigarette
Jonboat
Deckboat
# Observations
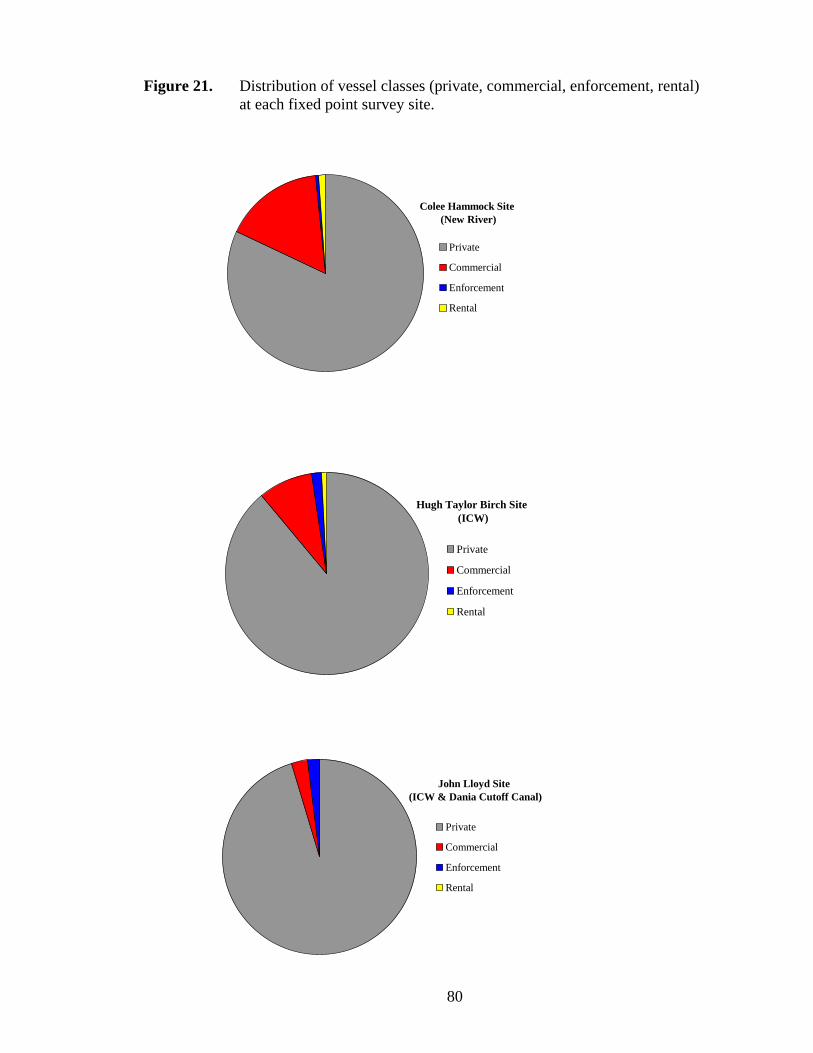
80
Figure 21. Distribution of vessel classes (private, commercial, enforcement, rental) at each fixed point survey site.
Colee Hammock Site (New River)
Private
Commercial
Enforcement
Rental
Hugh Taylor Birch Site (ICW)
Private
Commercial
Enforcement
Rental
John Lloyd Site (ICW & Dania Cutoff Canal)
Private
Commercial
Enforcement
Rental
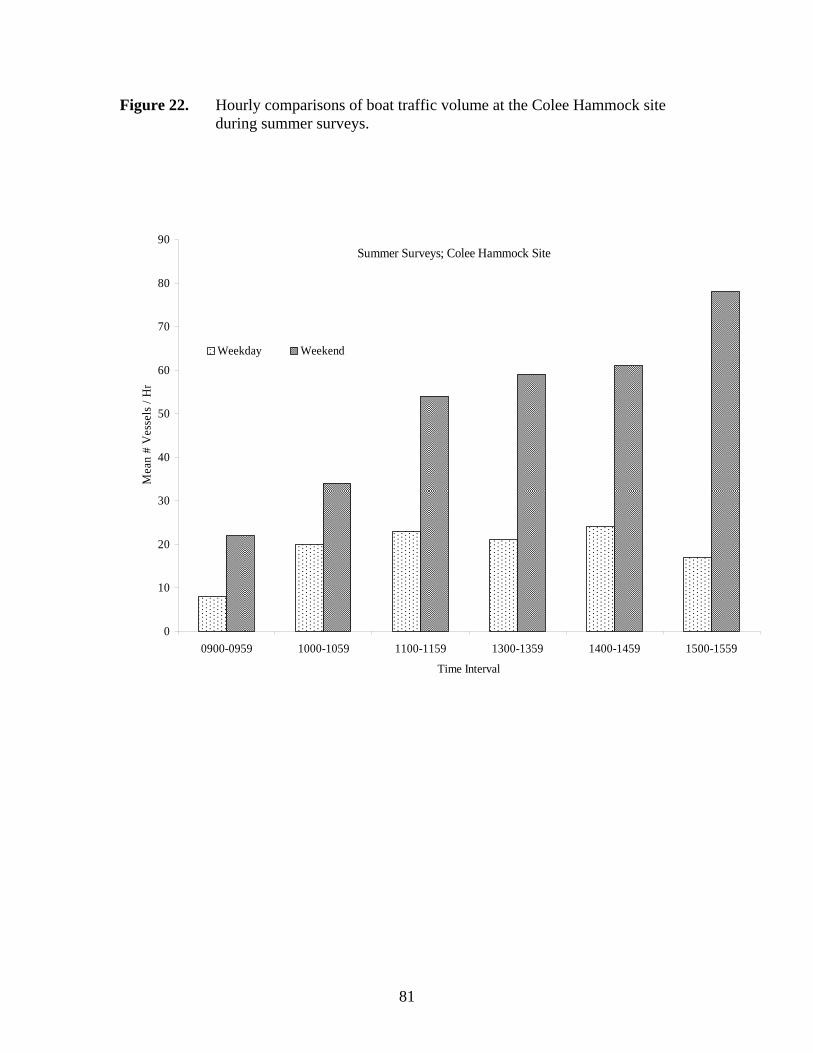
81
Figure 22. Hourly comparisons of boat traffic volume at the Colee Hammock site during summer surveys.
0
10
20
30
40
50
60
70
80
90
0900-0959 1000-1059 1100-1159 1300-1359 1400-1459 1500-1559
Time Interval
Mea
n #
Ves
sels
/ H
r
Weekday Weekend
Summer Surveys; Colee Hammock Site
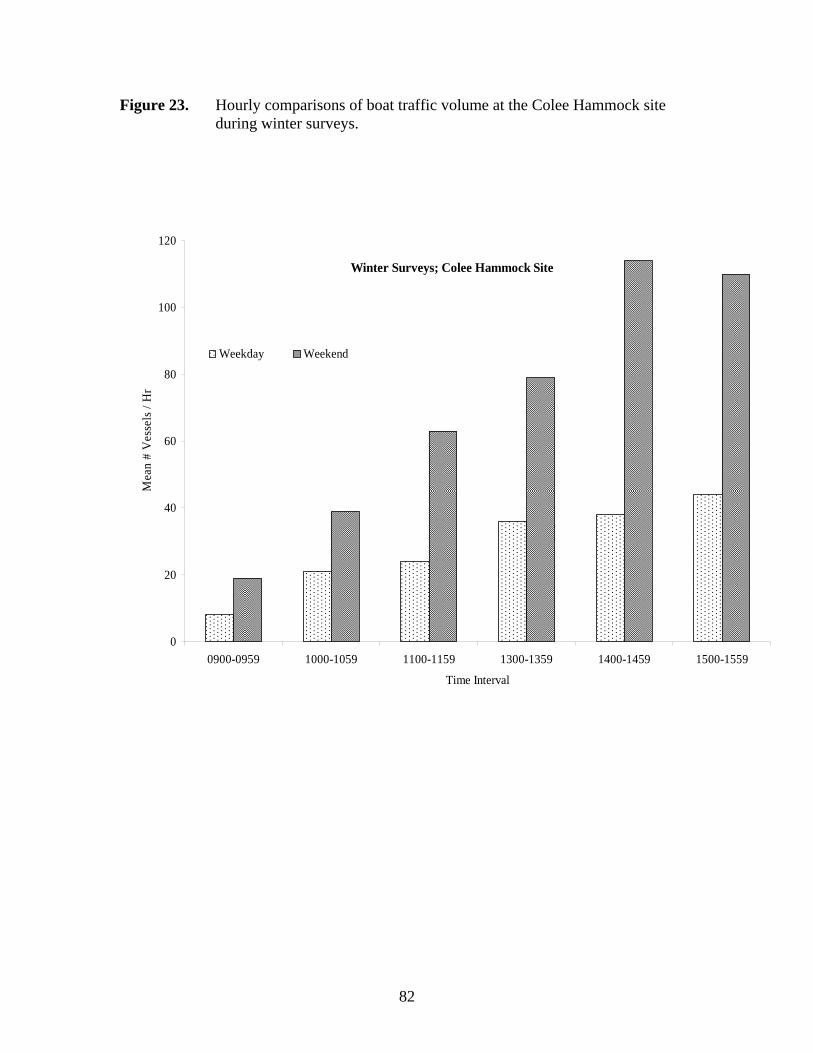
82
Figure 23. Hourly comparisons of boat traffic volume at the Colee Hammock site during winter surveys.
0
20
40
60
80
100
120
0900-0959 1000-1059 1100-1159 1300-1359 1400-1459 1500-1559
Time Interval
Mea
n #
Ves
sels
/ H
r
Weekday Weekend
Winter Surveys; Colee Hammock Site
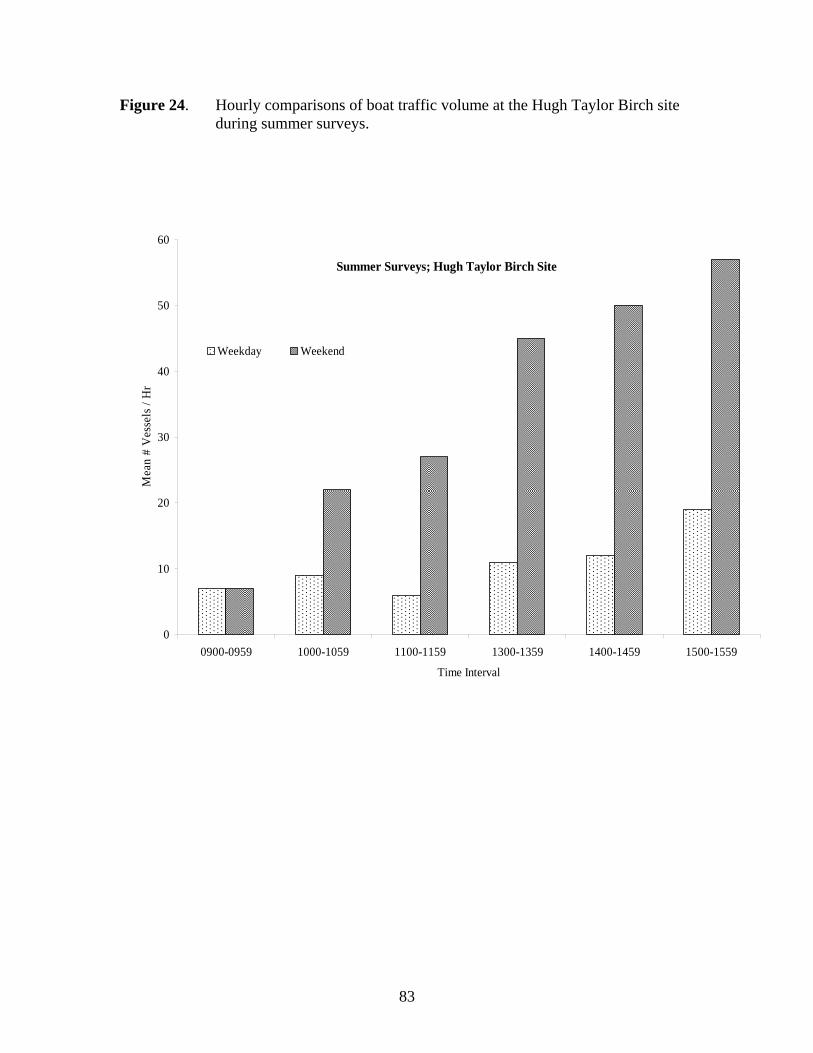
83
Figure 24. Hourly comparisons of boat traffic volume at the Hugh Taylor Birch site during summer surveys.
0
10
20
30
40
50
60
0900-0959 1000-1059 1100-1159 1300-1359 1400-1459 1500-1559
Time Interval
Mea
n #
Ves
sels
/ H
r
Weekday Weekend
Summer Surveys; Hugh Taylor Birch Site
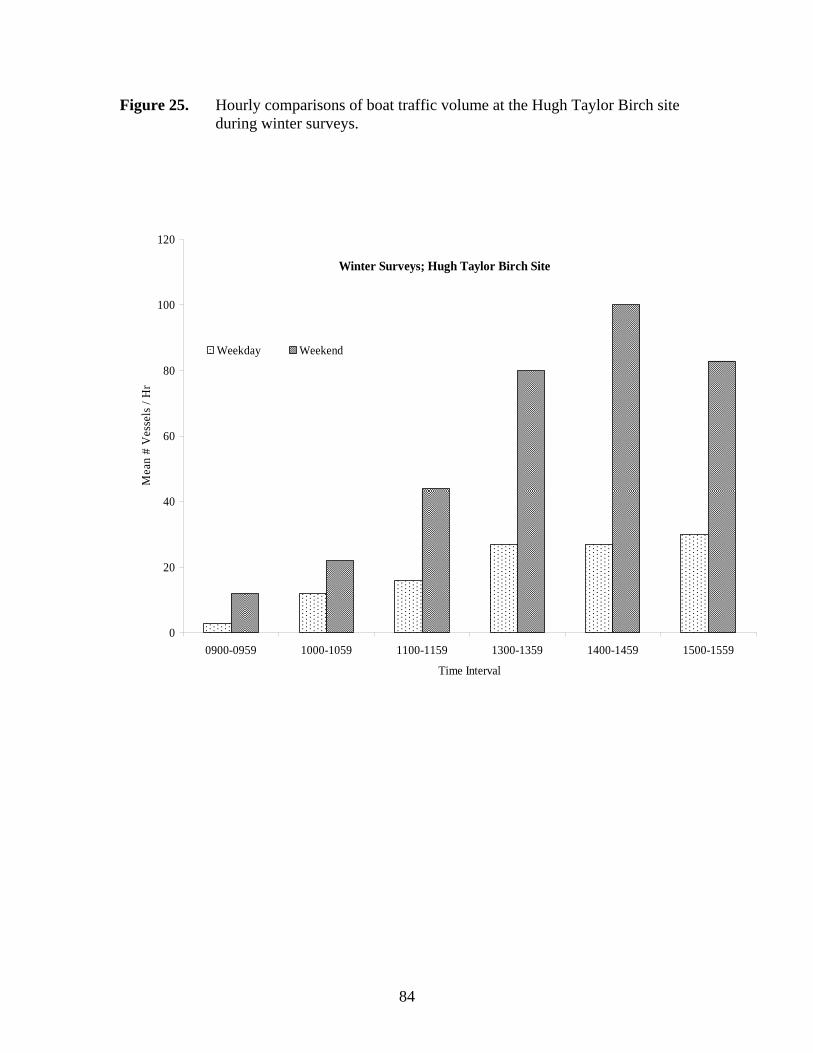
84
Figure 25. Hourly comparisons of boat traffic volume at the Hugh Taylor Birch site during winter surveys.
0
20
40
60
80
100
120
0900-0959 1000-1059 1100-1159 1300-1359 1400-1459 1500-1559
Time Interval
Mea
n #
Ves
sels
/ H
r
Weekday Weekend
Winter Surveys; Hugh Taylor Birch Site
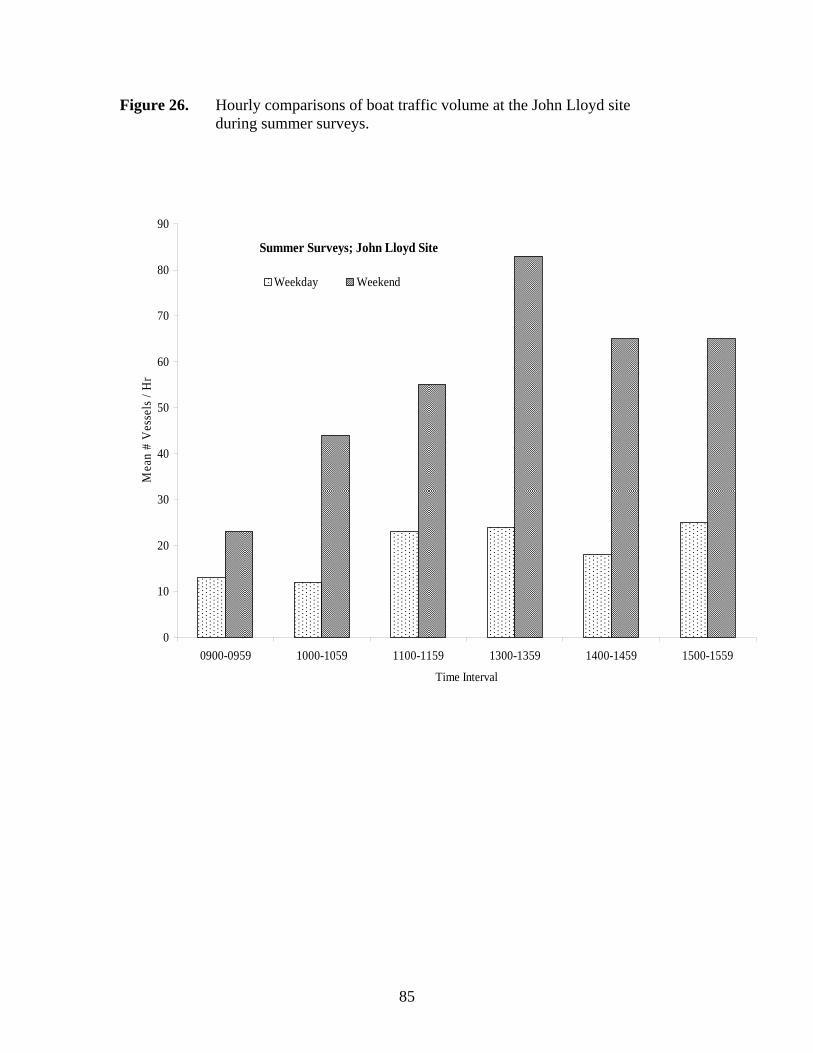
85
Figure 26. Hourly comparisons of boat traffic volume at the John Lloyd site during summer surveys.
0
10
20
30
40
50
60
70
80
90
0900-0959 1000-1059 1100-1159 1300-1359 1400-1459 1500-1559
Time Interval
Mea
n #
Ves
sels
/ H
r
Weekday Weekend
Summer Surveys; John Lloyd Site
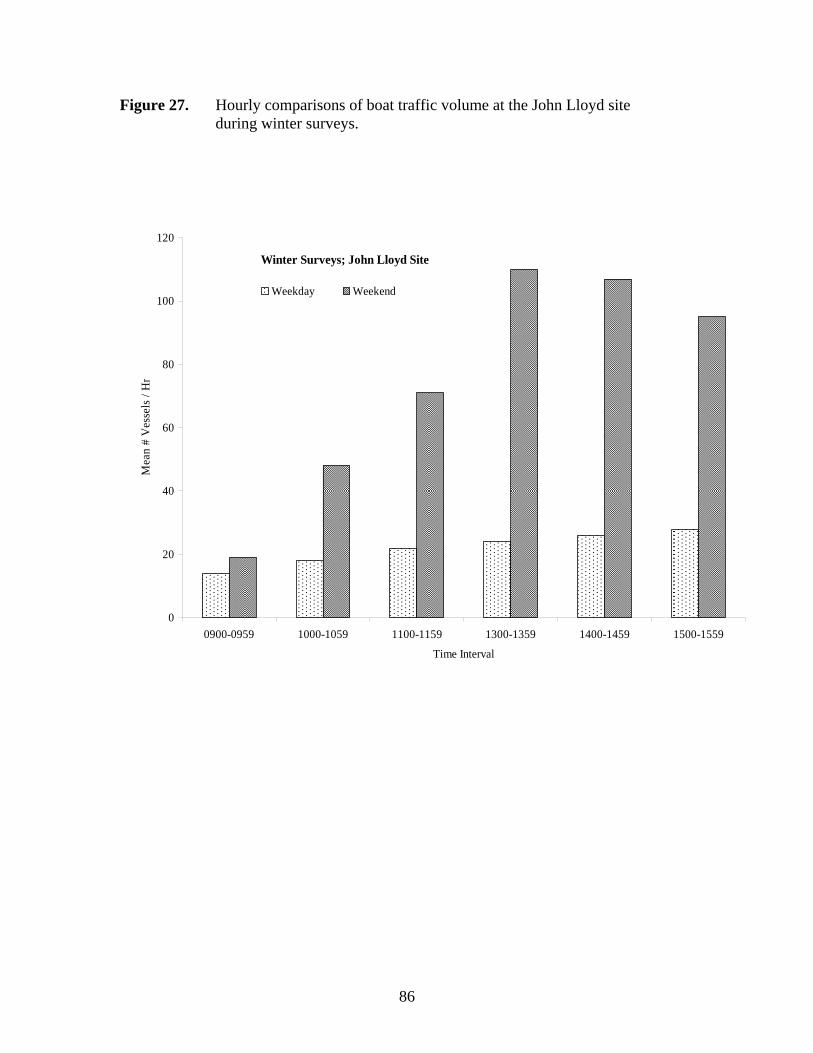
86
Figure 27. Hourly comparisons of boat traffic volume at the John Lloyd site during winter surveys.
0
20
40
60
80
100
120
0900-0959 1000-1059 1100-1159 1300-1359 1400-1459 1500-1559
Time Interval
Mea
n #
Ves
sels
/ H
r
Weekday Weekend
Winter Surveys; John Lloyd Site
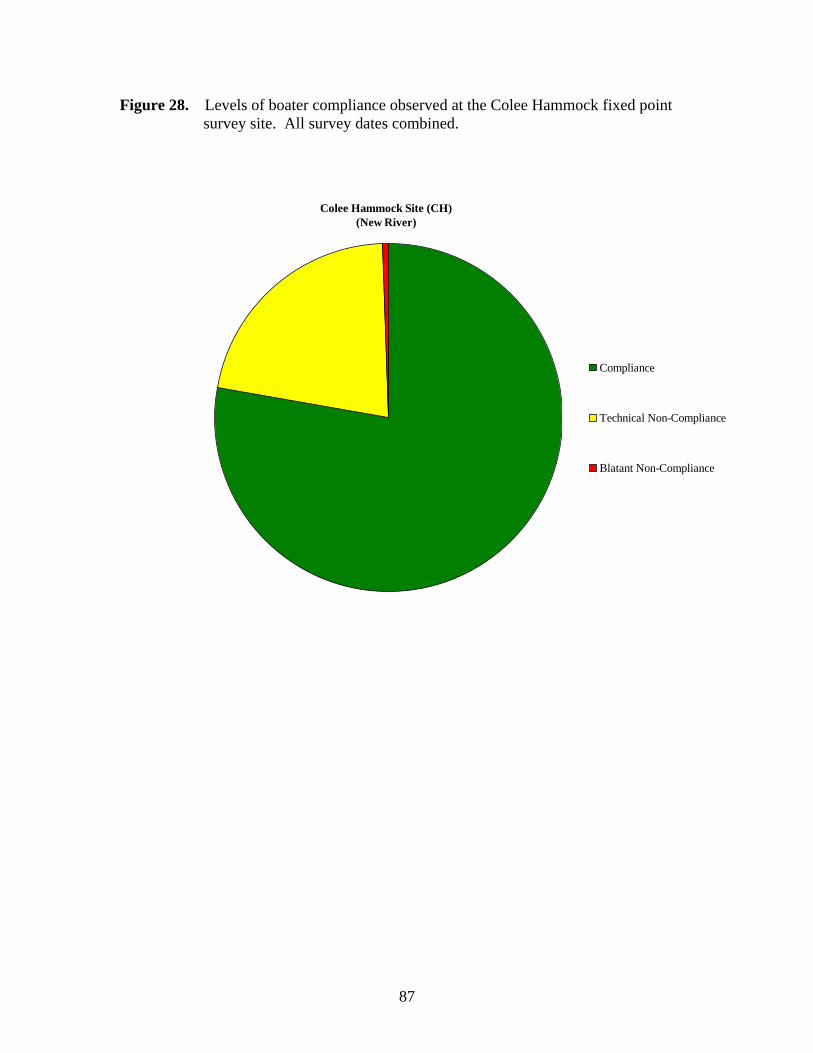
87
Figure 28. Levels of boater compliance observed at the Colee Hammock fixed point survey site. All survey dates combined.
Colee Hammock Site (CH)(New River)
Compliance
Technical Non-Compliance
Blatant Non-Compliance
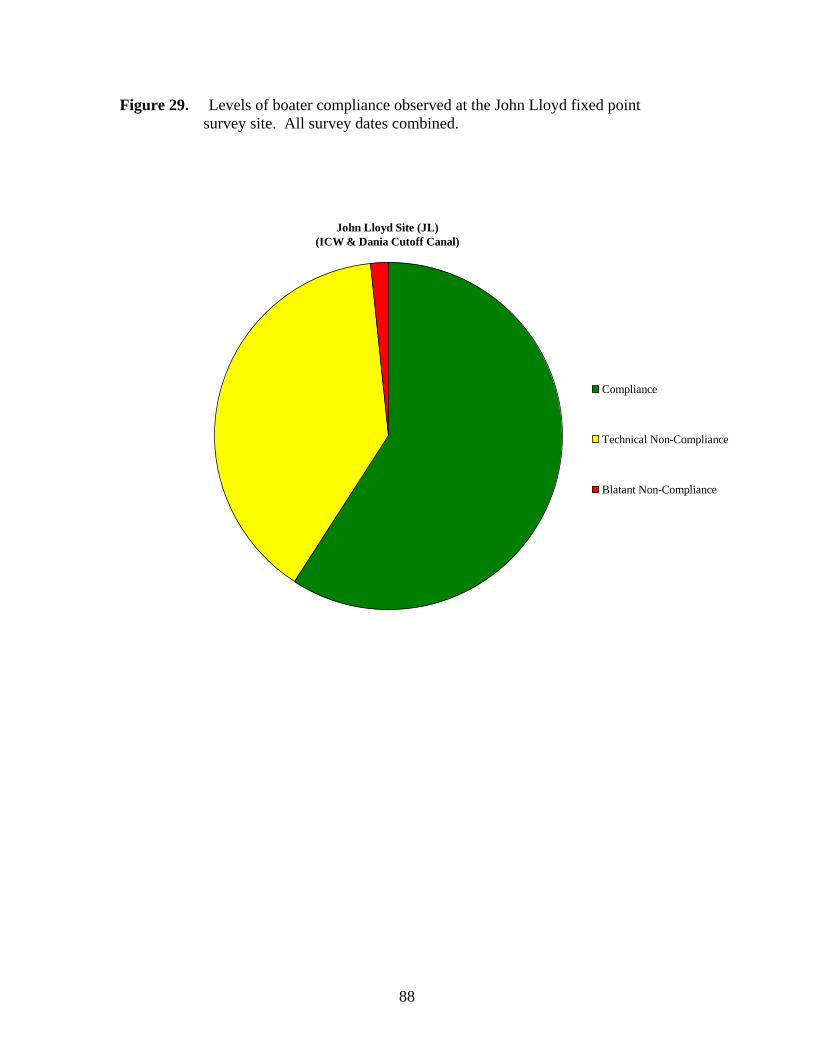
88
Figure 29. Levels of boater compliance observed at the John Lloyd fixed point survey site. All survey dates combined.
John Lloyd Site (JL)(ICW & Dania Cutoff Canal)
Compliance
Technical Non-Compliance
Blatant Non-Compliance
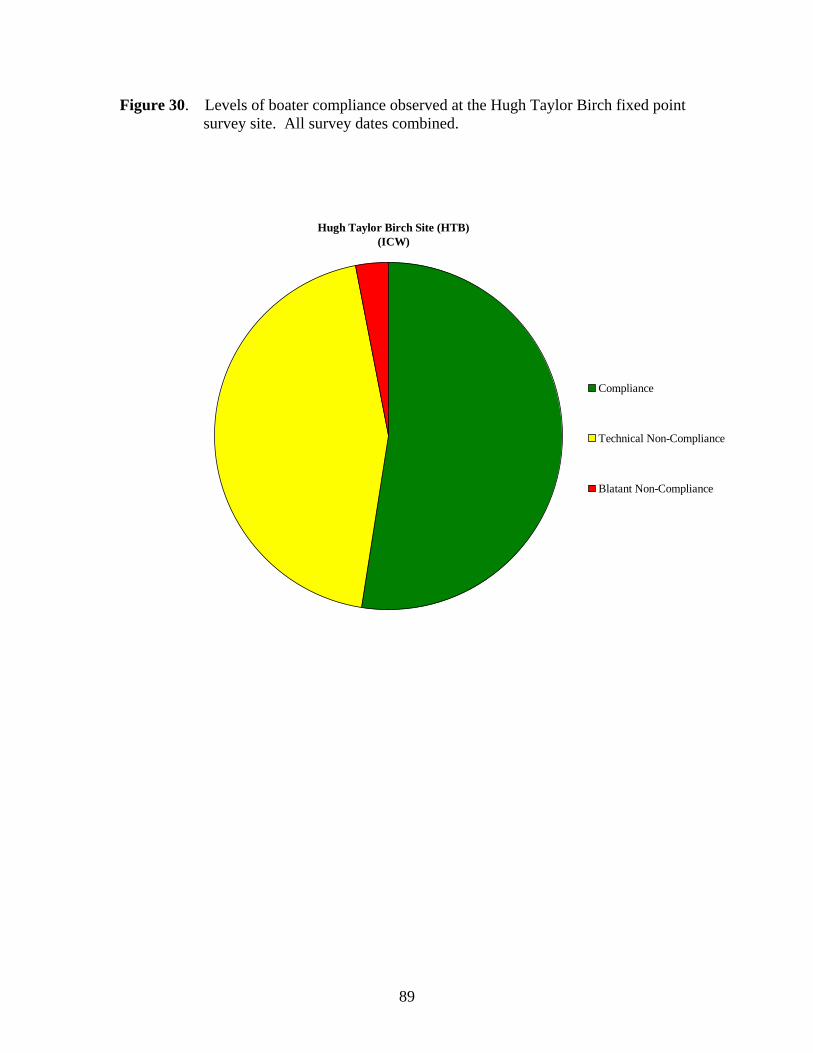
89
Figure 30. Levels of boater compliance observed at the Hugh Taylor Birch fixed point survey site. All survey dates combined.
Hugh Taylor Birch Site (HTB) (ICW)
Compliance
Technical Non-Compliance
Blatant Non-Compliance
90
Appendix A. Metadata for Broward County Aerial Surveys
NAME: 050704am DESCRIPTION: Broward County Boat Traffic Aerial Survey FEATURE-TYPE: Point VINTAGE: 05/07/04 PRECISION: Single PROJECTION: Albers DATUM: HPGN (NAD83) OWNER: Florida Fish and Wildlife Conservation Commission and Mote
Marine Laboratory SOURCE: Jay Gorzelany SOURCE CONTACT: Jay Gorzelany SOURCE ADDRESS: Mote Marine Laboratory, 1600 Ken Thompson Parkway, Sarasota, FL 34236 SOURCE PHONE: (941) 388-4441 SOURCE FAX: (941) 388-4312 SOURCE EMAIL: [email protected] SOURCE SCALE: meters STATUS: verification in progress MAIN SURVEYOR: Jay Gorzelany FLIGHT TIME: 1018 – 1113 hrs SURVEY TYPE: Single observer / videographer method ALTITUDE: 1000 ft (500 ft in proximity to FLL) TOTAL BOATS: 97 TOTAL FLIGHTS: 1 INC. FLIGHT DATES: 0 FLIGHTS W/O BOATS: 0 ADD’L INFORMATION: Limited survey of upper portions of the Dania Cutoff Canal and
New River due to conflicts with Ft Lauderdale (FLL) air traffic. NAME: 050704pm DESCRIPTION: Broward County Boat Traffic Aerial Survey FEATURE-TYPE: Point VINTAGE: 05/07/04 PRECISION: Single PROJECTION: Albers DATUM: HPGN (NAD83) OWNER: Florida Fish and Wildlife Conservation Commission and Mote
Marine Laboratory SOURCE: Jay Gorzelany SOURCE CONTACT: Jay Gorzelany SOURCE ADDRESS: Mote Marine Laboratory,1600 Ken Thompson Parkway, Sarasota, FL 34236 SOURCE PHONE: (941) 388-4441 SOURCE FAX: (941) 388-4312 SOURCE EMAIL: [email protected]
91
SOURCE SCALE: meters STATUS: verification in progress MAIN SURVEYOR: Jay Gorzelany FLIGHT TIME: 1247 – 1338 hrs SURVEY TYPE Single observer / videographer method ALTITUDE: 1000 ft (500 ft in proximity to FLL) TOTAL BOATS: 142 TOTAL FLIGHTS: 1 INC. FLIGHT DATES: 0 FLIGHTS W/O BOATS 0 ADD’L INFORMATION: Limited survey of upper portions of the Dania Cutoff Canal and
New River due to conflicts with Ft Lauderdale (FLL) air traffic. NAME: 052204am DESCRIPTION: Broward County Boat Traffic Aerial Survey FEATURE-TYPE: Point VINTAGE: 05/22/04 PRECISION: Single PROJECTION: Albers DATUM: HPGN (NAD83) OWNER: Florida Fish and Wildlife Conservation Commission and Mote
Marine Laboratory SOURCE: Jay Gorzelany SOURCE CONTACT: Jay Gorzelany SOURCE ADDRESS: Mote Marine Laboratory,1600 Ken Thompson Parkway, Sarasota, FL 34236 SOURCE PHONE: (941) 388-4441 SOURCE FAX: (941) 388-4312 SOURCE EMAIL: [email protected] SOURCE SCALE: meters STATUS: verification in progress MAIN SURVEYOR: Jay Gorzelany FLIGHT TIME: 0949 – 1036 hrs SURVEY TYPE Single observer / videographer method ALTITUDE: 1000 ft (500 ft in proximity to FLL) TOTAL BOATS: 204 TOTAL FLIGHTS: 1 INC. FLIGHT DATES: 0 FLIGHTS W/O BOATS: 0 ADD’L INFORMATION: Limited survey of upper portions of the Dania Cutoff Canal and
New River due to conflicts with Ft Lauderdale (FLL) air traffic. NAME: 052204pm DESCRIPTION: Broward County Boat Traffic Aerial Survey FEATURE-TYPE: Point VINTAGE: 05/22/04 PRECISION: Single
92
PROJECTION: Albers DATUM: HPGN (NAD83) OWNER: Florida Fish and Wildlife Conservation Commission and Mote
Marine Laboratory SOURCE: Jay Gorzelany SOURCE CONTACT: Jay Gorzelany SOURCE ADDRESS: Mote Marine Laboratory, 1600 Ken Thompson Parkway, Sarasota, FL 34236 SOURCE PHONE: (941) 388-4441 SOURCE FAX: (941) 388-4312 SOURCE EMAIL: [email protected] SOURCE SCALE: meters STATUS: verification in progress MAIN SURVEYOR: Jay Gorzelany FLIGHT TIME: 1238 - 1327 hrs SURVEY TYPE Single observer / videographer method ALTITUDE: 1000 ft (500 ft in proximity to FLL) TOTAL BOATS: 384 TOTAL FLIGHTS: 1 INC. FLIGHT DATES: 0 FLIGHTS W/O BOATS: 0 ADD’L INFORMATION: Limited survey of upper portions of the Dania Cutoff Canal and
New River due to conflicts with Ft Lauderdale (FLL) air traffic. NAME: 052904pm DESCRIPTION: Broward County Boat Traffic Aerial Survey FEATURE-TYPE: Point VINTAGE: 05/29/04 PRECISION: Single PROJECTION: Albers DATUM: HPGN (NAD83) OWNER: Florida Fish and Wildlife Conservation Commission and Mote
Marine Laboratory SOURCE: Jay Gorzelany SOURCE CONTACT: Jay Gorzelany SOURCE ADDRESS: Mote Marine Laboratory, 1600 Ken Thompson Parkway, Sarasota, FL 34236 SOURCE PHONE: (941) 388-4441 SOURCE FAX: (941) 388-4312 SOURCE EMAIL: [email protected] SOURCE SCALE: meters STATUS: verification in progress MAIN SURVEYOR: Jay Gorzelany FLIGHT TIME: 1247 - 1333 hrs SURVEY TYPE Single observer / videographer method ALTITUDE: 1000 ft (500 ft in proximity to FLL) TOTAL BOATS: TBD TOTAL FLIGHTS: 1 INC. FLIGHT DATES: 0
93
FLIGHTS W/O BOATS: 0 ADD’L INFORMATION: Holiday weekend survey. Limited survey of upper portions of
the Dania Cutoff Canal due to conflicts with Ft Lauderdale (FLL) air traffic.
NAME: 062304am DESCRIPTION: Broward County Boat Traffic Aerial Survey FEATURE-TYPE: Point VINTAGE: 06/23/04 PRECISION: Single PROJECTION: Albers DATUM: HPGN (NAD83) OWNER: Florida Fish and Wildlife Conservation Commission and Mote
Marine Laboratory SOURCE: Jay Gorzelany SOURCE CONTACT: Jay Gorzelany SOURCE ADDRESS: Mote Marine Laboratory, 1600 Ken Thompson Parkway, Sarasota, FL 34236 SOURCE PHONE: (941) 388-4441 SOURCE FAX: (941) 388-4312 SOURCE EMAIL: [email protected] SOURCE SCALE: meters STATUS: verification in progress MAIN SURVEYOR: Kerri Scolardi FLIGHT TIME: 1018 - 1105 hrs SURVEY TYPE Single observer / videographer method ALTITUDE: 1000 ft (1500 ft in proximity to FLL) TOTAL BOATS: 97 TOTAL FLIGHTS: 1 INC. FLIGHT DATES: 0 FLIGHTS W/O BOATS: 0 ADD’L INFORMATION: Limited survey of upper portions of the Dania Cutoff Canal due
to conflicts with Ft Lauderdale (FLL) air traffic. NAME: 062304pm DESCRIPTION: Broward County Boat Traffic Aerial Survey FEATURE-TYPE: Point VINTAGE: 06/23/04 PRECISION: Single PROJECTION: Albers DATUM: HPGN (NAD83) OWNER: Florida Fish and Wildlife Conservation Commission and Mote
Marine Laboratory SOURCE: Jay Gorzelany SOURCE CONTACT: Jay Gorzelany
94
SOURCE ADDRESS: Mote Marine Laboratory, 1600 Ken Thompson Parkway, Sarasota, FL 34236 SOURCE PHONE: (941) 388-4441 SOURCE FAX: (941) 388-4312 SOURCE EMAIL: [email protected] SOURCE SCALE: meters STATUS: verification in progress MAIN SURVEYOR: Kerri Scolardi FLIGHT TIME: 1018 - 1105 hrs SURVEY TYPE Single observer / videographer method ALTITUDE: 1000 ft (1500 ft in proximity to FLL) TOTAL BOATS: 128 TOTAL FLIGHTS: 1 INC. FLIGHT DATES: 0 FLIGHTS W/O BOATS: 0 ADD’L INFORMATION: Limited survey of upper portions of the Dania Cutoff Canal due
to conflicts with Ft Lauderdale (FLL) air traffic. NAME: 082204am DESCRIPTION: Broward County Boat Traffic Aerial Survey FEATURE-TYPE: Point VINTAGE: 08/22/04 PRECISION: Single PROJECTION: Albers DATUM: HPGN (NAD83) OWNER: Florida Fish and Wildlife Conservation Commission and Mote
Marine Laboratory SOURCE: Jay Gorzelany SOURCE CONTACT: Jay Gorzelany SOURCE ADDRESS: Mote Marine Laboratory, 1600 Ken Thompson Parkway, Sarasota, FL 34236 SOURCE PHONE: (941) 388-4441 SOURCE FAX: (941) 388-4312 SOURCE EMAIL: [email protected] SOURCE SCALE: meters STATUS: verification in progress MAIN SURVEYOR: Jay Gorzelany FLIGHT TIME: 0938 - 1026 hrs SURVEY TYPE Single observer / videographer method ALTITUDE: 1000 ft (1500 ft in proximity to FLL) TOTAL BOATS: 191 TOTAL FLIGHTS: 1 INC. FLIGHT DATES: 0 FLIGHTS W/O BOATS: 0 ADD’L INFORMATION: No significant problems NAME: 082204pm
95
DESCRIPTION: Broward County Boat Traffic Aerial Survey FEATURE-TYPE: Point VINTAGE: 08/22/04 PRECISION: Single PROJECTION: Albers DATUM: HPGN (NAD83) OWNER: Florida Fish and Wildlife Conservation Commission and Mote
Marine Laboratory SOURCE: Jay Gorzelany SOURCE CONTACT: Jay Gorzelany SOURCE ADDRESS: Mote Marine Laboratory, 1600 Ken Thompson Parkway, Sarasota, FL 34236 SOURCE PHONE: (941) 388-4441 SOURCE FAX: (941) 388-4312 SOURCE EMAIL: [email protected] SOURCE SCALE: meters STATUS: verification in progress MAIN SURVEYOR: Jay Gorzelany FLIGHT TIME: 1231 - 1329 hrs SURVEY TYPE Single observer / videographer method ALTITUDE: 1000 ft (1500 ft in proximity to FLL) TOTAL BOATS: 477 TOTAL FLIGHTS: 1 INC. FLIGHT DATES: 0 FLIGHTS W/O BOATS: 0 ADD’L INFORMATION: Limited survey of upper portions of the Dania Cutoff Canal due
to air traffic conflicts with FLL. NAME: 102104am DESCRIPTION: Broward County Boat Traffic Aerial Survey FEATURE-TYPE: Point VINTAGE: 10/21/04 PRECISION: Single PROJECTION: Albers DATUM: HPGN (NAD83) OWNER: Florida Fish and Wildlife Conservation Commission and Mote
Marine Laboratory SOURCE: Jay Gorzelany SOURCE CONTACT: Jay Gorzelany SOURCE ADDRESS: Mote Marine Laboratory, 1600 Ken Thompson Parkway, Sarasota, FL 34236 SOURCE PHONE: (941) 388-4441 SOURCE FAX: (941) 388-4312 SOURCE EMAIL: [email protected] SOURCE SCALE: meters STATUS: verification in progress MAIN SURVEYOR: Kerri Scolardi FLIGHT TIME: 1046 - 1145 hrs SURVEY TYPE Single observer / videographer method
96
ALTITUDE: 1000 ft (1500 ft in proximity to FLL) TOTAL BOATS: 106 TOTAL FLIGHTS: 1 INC. FLIGHT DATES: 0 FLIGHTS W/O BOATS: 0 ADD’L INFORMATION: No video of seaward portion of Hillsboro Inlet and portions of
the New River, however observer states that no boats were present in these areas.
NAME: 102104pm DESCRIPTION: Broward County Boat Traffic Aerial Survey FEATURE-TYPE: Point VINTAGE: 10/21/04 PRECISION: Single PROJECTION: Albers DATUM: HPGN (NAD83) OWNER: Florida Fish and Wildlife Conservation Commission and Mote
Marine Laboratory SOURCE: Jay Gorzelany SOURCE CONTACT: Jay Gorzelany SOURCE ADDRESS: Mote Marine Laboratory, 1600 Ken Thompson Parkway, Sarasota, FL 34236 SOURCE PHONE: (941) 388-4441 SOURCE FAX: (941) 388-4312 SOURCE EMAIL: [email protected] SOURCE SCALE: meters STATUS: verification in progress MAIN SURVEYOR: Kerri Scolardi FLIGHT TIME: 1443 - 1536 hrs SURVEY TYPE Single observer / videographer method ALTITUDE: 1000 ft (1500 ft in proximity to FLL) TOTAL BOATS: 123 TOTAL FLIGHTS: 1 INC. FLIGHT DATES: 0 FLIGHTS W/O BOATS: 0 ADD’L INFORMATION: No significant problems. NAME: 111304am DESCRIPTION: Broward County Boat Traffic Aerial Survey FEATURE-TYPE: Point VINTAGE: 11/13/04 PRECISION: Single PROJECTION: Albers DATUM: HPGN (NAD83) OWNER: Florida Fish and Wildlife Conservation Commission and Mote
Marine Laboratory SOURCE: Jay Gorzelany
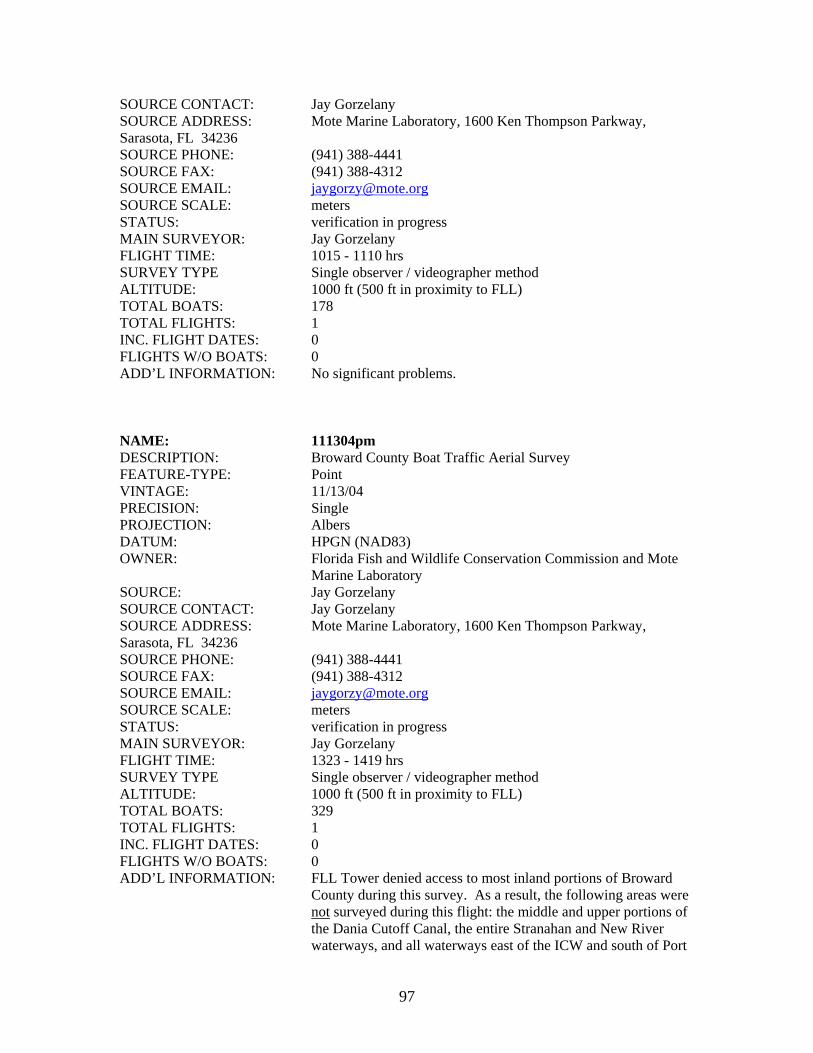
97
SOURCE CONTACT: Jay Gorzelany SOURCE ADDRESS: Mote Marine Laboratory, 1600 Ken Thompson Parkway, Sarasota, FL 34236 SOURCE PHONE: (941) 388-4441 SOURCE FAX: (941) 388-4312 SOURCE EMAIL: [email protected] SOURCE SCALE: meters STATUS: verification in progress MAIN SURVEYOR: Jay Gorzelany FLIGHT TIME: 1015 - 1110 hrs SURVEY TYPE Single observer / videographer method ALTITUDE: 1000 ft (500 ft in proximity to FLL) TOTAL BOATS: 178 TOTAL FLIGHTS: 1 INC. FLIGHT DATES: 0 FLIGHTS W/O BOATS: 0 ADD’L INFORMATION: No significant problems. NAME: 111304pm DESCRIPTION: Broward County Boat Traffic Aerial Survey FEATURE-TYPE: Point VINTAGE: 11/13/04 PRECISION: Single PROJECTION: Albers DATUM: HPGN (NAD83) OWNER: Florida Fish and Wildlife Conservation Commission and Mote
Marine Laboratory SOURCE: Jay Gorzelany SOURCE CONTACT: Jay Gorzelany SOURCE ADDRESS: Mote Marine Laboratory, 1600 Ken Thompson Parkway, Sarasota, FL 34236 SOURCE PHONE: (941) 388-4441 SOURCE FAX: (941) 388-4312 SOURCE EMAIL: [email protected] SOURCE SCALE: meters STATUS: verification in progress MAIN SURVEYOR: Jay Gorzelany FLIGHT TIME: 1323 - 1419 hrs SURVEY TYPE Single observer / videographer method ALTITUDE: 1000 ft (500 ft in proximity to FLL) TOTAL BOATS: 329 TOTAL FLIGHTS: 1 INC. FLIGHT DATES: 0 FLIGHTS W/O BOATS: 0 ADD’L INFORMATION: FLL Tower denied access to most inland portions of Broward
County during this survey. As a result, the following areas were not surveyed during this flight: the middle and upper portions of the Dania Cutoff Canal, the entire Stranahan and New River waterways, and all waterways east of the ICW and south of Port
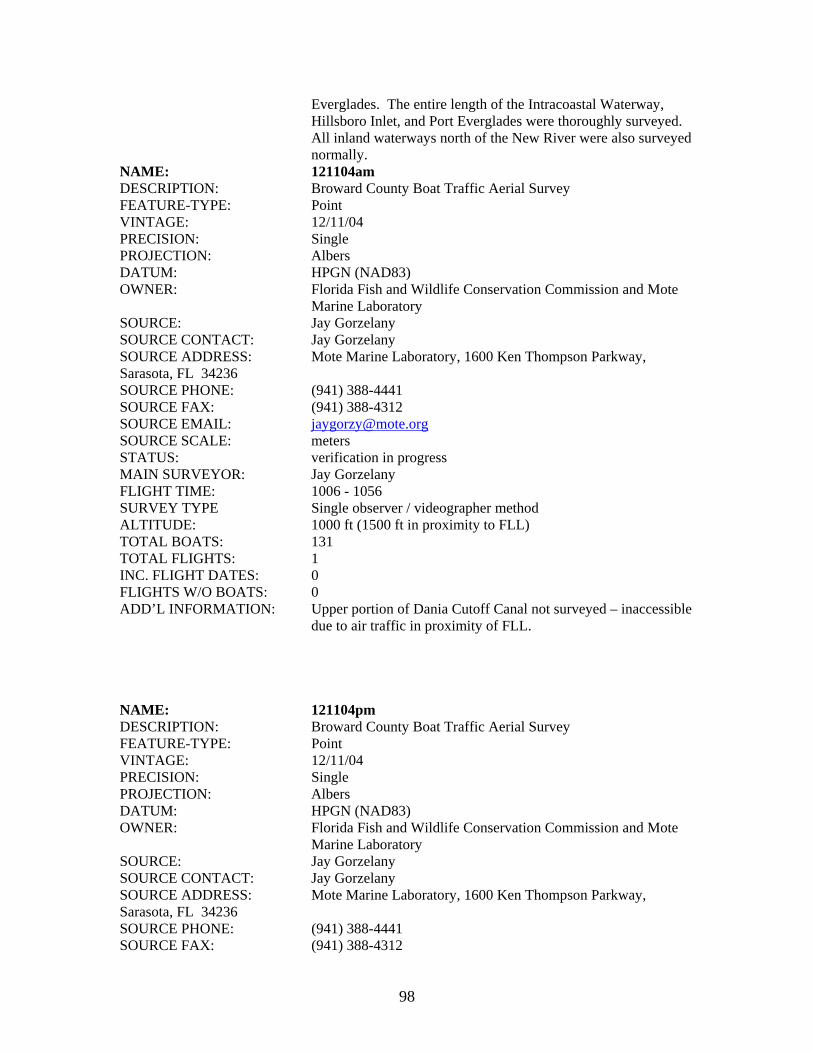
98
Everglades. The entire length of the Intracoastal Waterway, Hillsboro Inlet, and Port Everglades were thoroughly surveyed. All inland waterways north of the New River were also surveyed normally.
NAME: 121104am DESCRIPTION: Broward County Boat Traffic Aerial Survey FEATURE-TYPE: Point VINTAGE: 12/11/04 PRECISION: Single PROJECTION: Albers DATUM: HPGN (NAD83) OWNER: Florida Fish and Wildlife Conservation Commission and Mote
Marine Laboratory SOURCE: Jay Gorzelany SOURCE CONTACT: Jay Gorzelany SOURCE ADDRESS: Mote Marine Laboratory, 1600 Ken Thompson Parkway, Sarasota, FL 34236 SOURCE PHONE: (941) 388-4441 SOURCE FAX: (941) 388-4312 SOURCE EMAIL: [email protected] SOURCE SCALE: meters STATUS: verification in progress MAIN SURVEYOR: Jay Gorzelany FLIGHT TIME: 1006 - 1056 SURVEY TYPE Single observer / videographer method ALTITUDE: 1000 ft (1500 ft in proximity to FLL) TOTAL BOATS: 131 TOTAL FLIGHTS: 1 INC. FLIGHT DATES: 0 FLIGHTS W/O BOATS: 0 ADD’L INFORMATION: Upper portion of Dania Cutoff Canal not surveyed – inaccessible
due to air traffic in proximity of FLL. NAME: 121104pm DESCRIPTION: Broward County Boat Traffic Aerial Survey FEATURE-TYPE: Point VINTAGE: 12/11/04 PRECISION: Single PROJECTION: Albers DATUM: HPGN (NAD83) OWNER: Florida Fish and Wildlife Conservation Commission and Mote
Marine Laboratory SOURCE: Jay Gorzelany SOURCE CONTACT: Jay Gorzelany SOURCE ADDRESS: Mote Marine Laboratory, 1600 Ken Thompson Parkway, Sarasota, FL 34236 SOURCE PHONE: (941) 388-4441 SOURCE FAX: (941) 388-4312
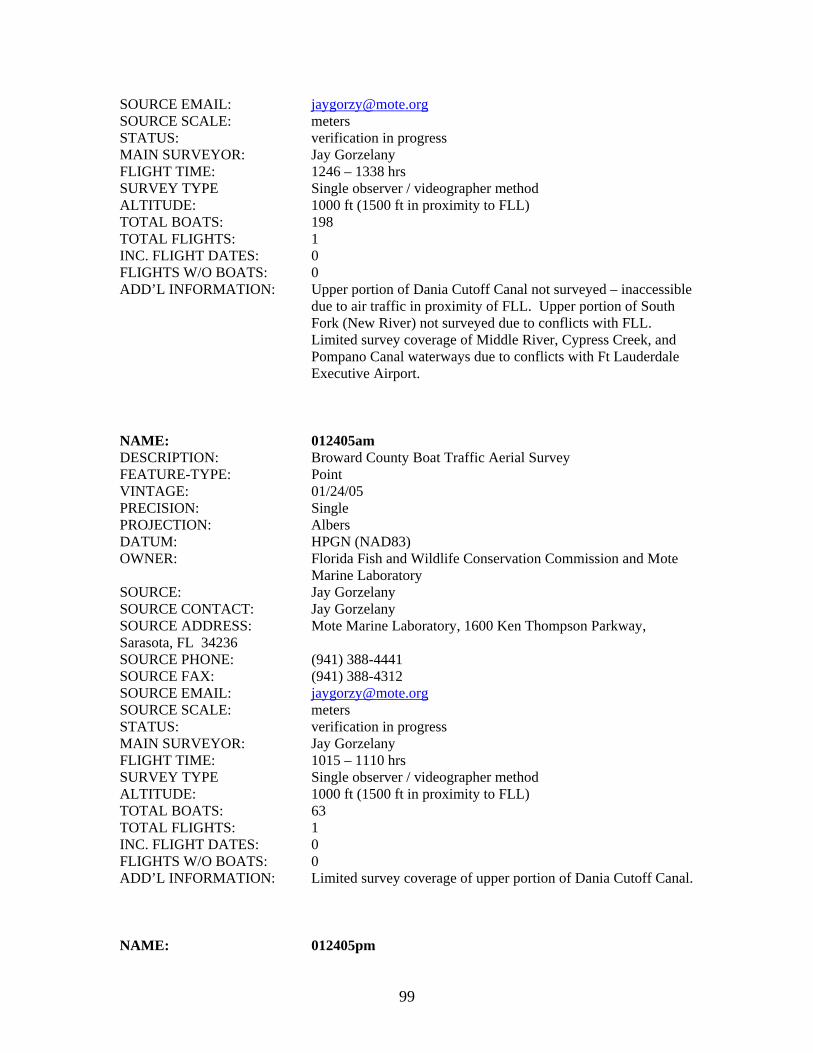
99
SOURCE EMAIL: [email protected] SOURCE SCALE: meters STATUS: verification in progress MAIN SURVEYOR: Jay Gorzelany FLIGHT TIME: 1246 – 1338 hrs SURVEY TYPE Single observer / videographer method ALTITUDE: 1000 ft (1500 ft in proximity to FLL) TOTAL BOATS: 198 TOTAL FLIGHTS: 1 INC. FLIGHT DATES: 0 FLIGHTS W/O BOATS: 0 ADD’L INFORMATION: Upper portion of Dania Cutoff Canal not surveyed – inaccessible
due to air traffic in proximity of FLL. Upper portion of South Fork (New River) not surveyed due to conflicts with FLL. Limited survey coverage of Middle River, Cypress Creek, and Pompano Canal waterways due to conflicts with Ft Lauderdale Executive Airport.
NAME: 012405am DESCRIPTION: Broward County Boat Traffic Aerial Survey FEATURE-TYPE: Point VINTAGE: 01/24/05 PRECISION: Single PROJECTION: Albers DATUM: HPGN (NAD83) OWNER: Florida Fish and Wildlife Conservation Commission and Mote
Marine Laboratory SOURCE: Jay Gorzelany SOURCE CONTACT: Jay Gorzelany SOURCE ADDRESS: Mote Marine Laboratory, 1600 Ken Thompson Parkway, Sarasota, FL 34236 SOURCE PHONE: (941) 388-4441 SOURCE FAX: (941) 388-4312 SOURCE EMAIL: [email protected] SOURCE SCALE: meters STATUS: verification in progress MAIN SURVEYOR: Jay Gorzelany FLIGHT TIME: 1015 – 1110 hrs SURVEY TYPE Single observer / videographer method ALTITUDE: 1000 ft (1500 ft in proximity to FLL) TOTAL BOATS: 63 TOTAL FLIGHTS: 1 INC. FLIGHT DATES: 0 FLIGHTS W/O BOATS: 0 ADD’L INFORMATION: Limited survey coverage of upper portion of Dania Cutoff Canal. NAME: 012405pm
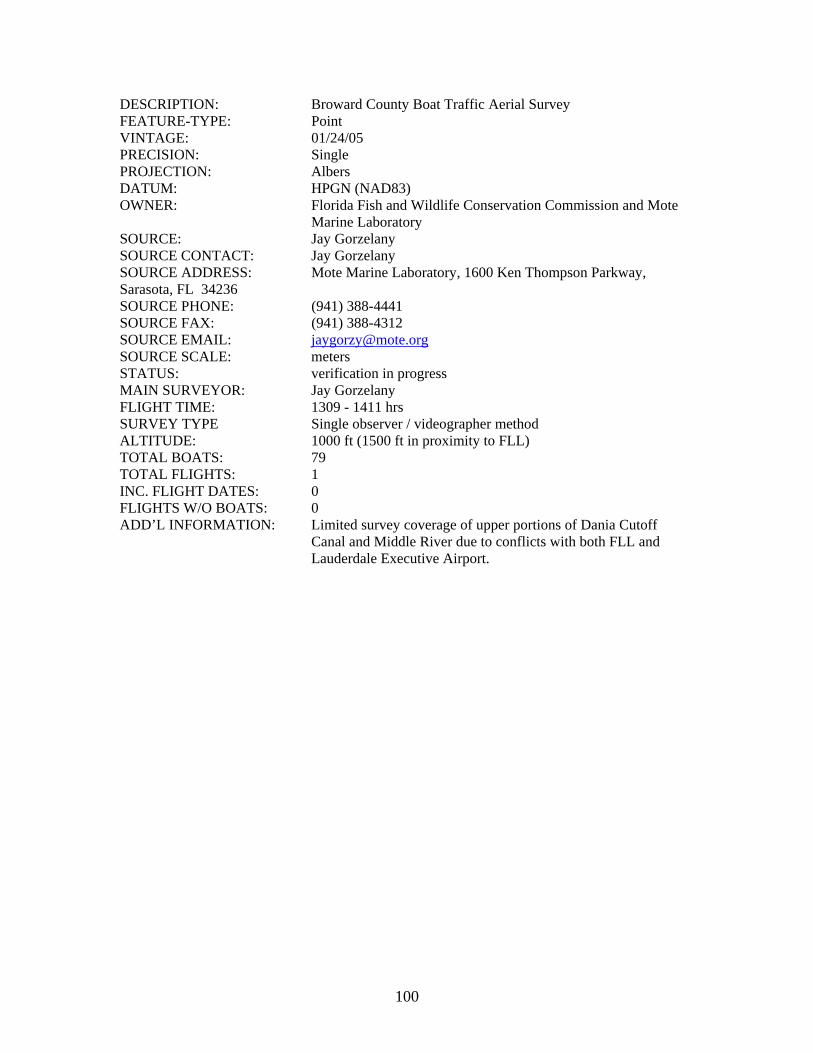
100
DESCRIPTION: Broward County Boat Traffic Aerial Survey FEATURE-TYPE: Point VINTAGE: 01/24/05 PRECISION: Single PROJECTION: Albers DATUM: HPGN (NAD83) OWNER: Florida Fish and Wildlife Conservation Commission and Mote
Marine Laboratory SOURCE: Jay Gorzelany SOURCE CONTACT: Jay Gorzelany SOURCE ADDRESS: Mote Marine Laboratory, 1600 Ken Thompson Parkway, Sarasota, FL 34236 SOURCE PHONE: (941) 388-4441 SOURCE FAX: (941) 388-4312 SOURCE EMAIL: [email protected] SOURCE SCALE: meters STATUS: verification in progress MAIN SURVEYOR: Jay Gorzelany FLIGHT TIME: 1309 - 1411 hrs SURVEY TYPE Single observer / videographer method ALTITUDE: 1000 ft (1500 ft in proximity to FLL) TOTAL BOATS: 79 TOTAL FLIGHTS: 1 INC. FLIGHT DATES: 0 FLIGHTS W/O BOATS: 0 ADD’L INFORMATION: Limited survey coverage of upper portions of Dania Cutoff
Canal and Middle River due to conflicts with both FLL and Lauderdale Executive Airport.
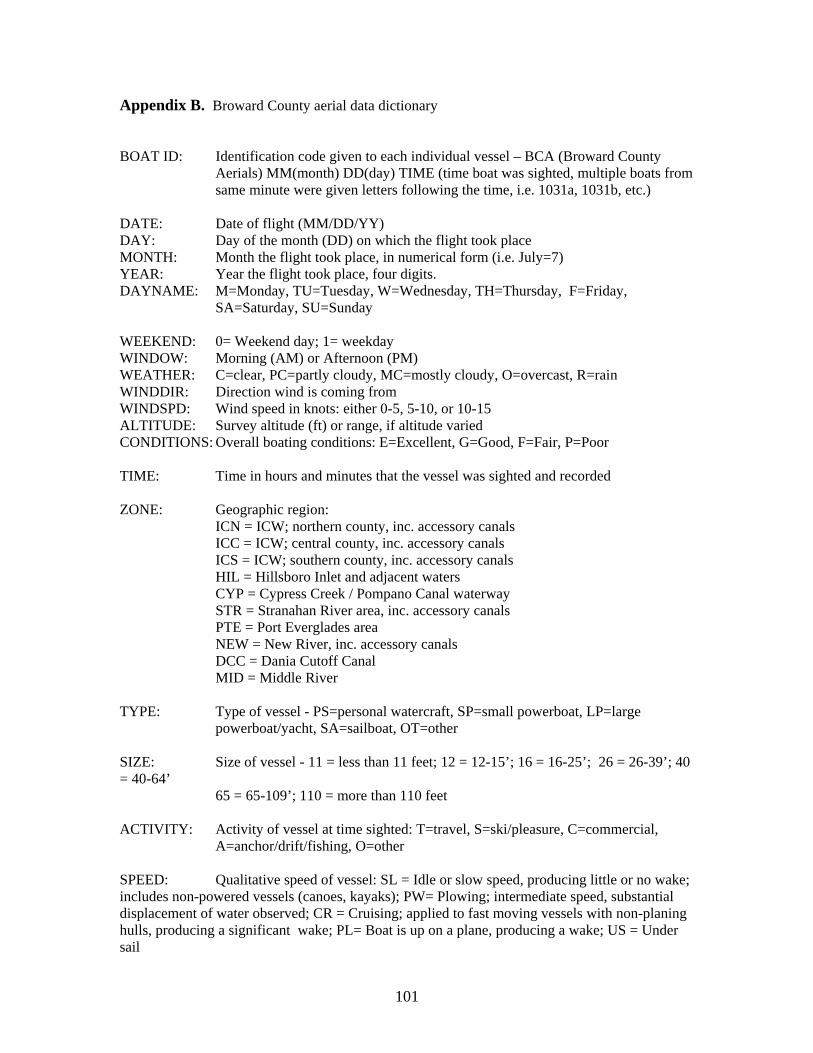
101
Appendix B. Broward County aerial data dictionary BOAT ID: Identification code given to each individual vessel – BCA (Broward County
Aerials) MM(month) DD(day) TIME (time boat was sighted, multiple boats from same minute were given letters following the time, i.e. 1031a, 1031b, etc.)
DATE: Date of flight (MM/DD/YY) DAY: Day of the month (DD) on which the flight took place MONTH: Month the flight took place, in numerical form (i.e. July=7) YEAR: Year the flight took place, four digits. DAYNAME: M=Monday, TU=Tuesday, W=Wednesday, TH=Thursday, F=Friday, SA=Saturday, SU=Sunday WEEKEND: 0= Weekend day; 1= weekday WINDOW: Morning (AM) or Afternoon (PM) WEATHER: C=clear, PC=partly cloudy, MC=mostly cloudy, O=overcast, R=rain WINDDIR: Direction wind is coming from WINDSPD: Wind speed in knots: either 0-5, 5-10, or 10-15 ALTITUDE: Survey altitude (ft) or range, if altitude varied CONDITIONS: Overall boating conditions: E=Excellent, G=Good, F=Fair, P=Poor TIME: Time in hours and minutes that the vessel was sighted and recorded ZONE: Geographic region: ICN = ICW; northern county, inc. accessory canals ICC = ICW; central county, inc. accessory canals ICS = ICW; southern county, inc. accessory canals HIL = Hillsboro Inlet and adjacent waters CYP = Cypress Creek / Pompano Canal waterway STR = Stranahan River area, inc. accessory canals PTE = Port Everglades area NEW = New River, inc. accessory canals DCC = Dania Cutoff Canal MID = Middle River TYPE: Type of vessel - PS=personal watercraft, SP=small powerboat, LP=large
powerboat/yacht, SA=sailboat, OT=other SIZE: Size of vessel - 11 = less than 11 feet; 12 = 12-15’; 16 = 16-25’; 26 = 26-39’; 40 = 40-64’ 65 = 65-109’; 110 = more than 110 feet ACTIVITY: Activity of vessel at time sighted: T=travel, S=ski/pleasure, C=commercial,
A=anchor/drift/fishing, O=other SPEED: Qualitative speed of vessel: SL = Idle or slow speed, producing little or no wake; includes non-powered vessels (canoes, kayaks); PW= Plowing; intermediate speed, substantial displacement of water observed; CR = Cruising; applied to fast moving vessels with non-planing hulls, producing a significant wake; PL= Boat is up on a plane, producing a wake; US = Under sail