Embed Size (px)
Citation preview

EAST OF EXETER (PHASE 2) MAJOR SCHEME BID
REPORT OF SURVEYS AND LOCAL MODEL VALIDATION REPORT
First Draft
Document No. HPE91974A/13/A Report Issue Date: 12 February 2008
Prepared for Environment, Economy and Culture Devon County Council Lucombe House Topsham Road Exeter EX2 4QW
Prepared by PBThe Forum Barnfield Road Exeter, EX1 1QR
Tel: +44(0) 1392 229700 Fax: +44(0) 1392 229701 Email: [email protected]

Report Title : Report of Surveys and Local Model Validation
Report Status : Second Draft
Job No : HPE91974A
Date : February 2008
Prepared by : Holly Moon .......................................................
Checked by : Carl Goves........................................................
Check Cat : D Approved by : Ian Beavis .........................................................

AUTHORISATION SHEET
Client: Devon County Council Project: East of Exeter (Phase 2) Major Scheme Bid Address: Environment, Economy and Culture, Devon County Council, Lucombe House,
County Hall, Topsham Road, Exeter, Devon. EX2 4QD PREPARED BY
Name: Carl Goves Position: Senior Transportation Planner Date: February 2008
AGREED BY Name: Ian Beavis Position: Principal Transportation Planner Date: February 2008
AUTHORISED FOR ISSUE Name: Dave Black Position: Transportation Planning Director Date: February 2008
DISTRIBUTION ACCEPTED BY
Name: Phil Dent Position: Responsible Officer Date: February 2008
ACCEPTED BY Name: Position:Date:


EAST OF EXETER (PHASE 2) MAJOR SCHEME BID
REPORT OF SURVEYS AND LOCAL MODEL VALIDATION REPORT
(SECOND DRAFT)
February 2008 Prepared by PB for Devon County Council
CONTENTS Page
1 INTRODUCTION 1
1.1 Background 1
1.2 Aim of Report 1
1.3 Study Area 1
1.4 Layout of Report 2
2 TRAFFIC DATA 3
2.1 Background 3
2.2 Roadside Interviews 3
2.3 Automatic Traffic Counts 4
2.4 Manual Classified Counts 7
2.5 Urban Traffic Control Data 8
2.6 Journey Time Surveys 8
2.7 Bus Patronage Surveys 8
3 ACCIDENT ANALYSIS 10
3.1 General 10
3.2 Accident Severity 10
3.3 Accident Rates (Links) 12
3.4 Accident Rates (Junctions) 13
4 LOCAL AREA TRAFFIC MODEL 15
4.1 Previous Models 15
4.2 Model Requirements 15
4.3 Modelled Time Period 15
4.4 Zone System 15
5 MODIFICATIONS TO THE PREVIOUS MODEL 16
5.1 Introduction 16
5.2 Traffic Growth 16
5.3 RSI Data 17
5.4 Base Year 17
5.5 Road Network 18
5.6 Speed / Flow Curves 18
5.7 Model Calibration and Validation 19

EAST OF EXETER (PHASE 2) MAJORSCHEME BID
REPORT OF SURVEYS AND LOCALMODEL VALIDATION REPORT
(SECOND DRAFT)
February 2008 Prepared by PBfor Devon County Council
6 MODEL VALIDATION 20
6.1 Model Validation Methodology 20
6.2 Link Flows 20
6.3 Model Validation Criteria 20
6.4 Journey Times 23
6.5 Route Analysis 23
6.6 Convergence 24
7 CONCLUSIONS 25
7.1 Summary 25
FIGURES
Figure 1.1 – Model Study AreaFigure 2.1 – Locations of Traffic Survey SitesFigure 2.2 – Average Hourly Flow Profile: East of Junction 29 on the A30Figure 2.3 – Daily Flow Profile: East of Junction 29 on the A30Figure 2.4 – Monthly Flow Profile: East of Junction 29 on the A30Figure 2.5 – AADT Growth East of Junction 29 on the A30Figure 2.6 – Journey Time Survey RoutesFigure 2.7 – Bus Patronage Survey LocationsFigure 3.1 – East of Exeter Accident Link DetailsFigure 3.2 – 2001-2005 Accident Zone LocationsFigure 3.3 – 2001-2005 Accident locations to the East of ExeterFigure 3.4 – 2001-2005 Accident locations at Junction 29Figure 3.5 – 2001-2005 Accident locations at Junction 30Figure 3.6 – 2001-2005 Accident DetailsFigure 4.1 – Model Zone List and Exeter Zone PlanFigure 5.1 – Locations of Development Sites and Infrastructure ImprovementsFigure 5.2 – Link Calibration AM PeakFigure 5.3 – Link Calibration InterpeakFigure 5.4 – Link Calibration PM PeakFigure 5.5 – Cumulative Journey Time Plot (AM Peak)Figure 5.6 – Cumulative Journey Time Plot (Interpeak Inbound)Figure 5.7 – Cumulative Journey Time Plot (Interpeak Outbound)Figure 5.8 – Cumulative Journey Time Plot (PM Peak)Figure 5.9 – Total Journey Time Plot with Confidence IntervalsFigure 5.10 – Confidence Interval CalculationsFigure 5.11 – Analysis of AM Routes within the Study Area NetworkFigure 5.12 – Analysis of Interpeak Routes within the Study Area NetworkFigure 5.13 – Analysis of PM Routes within the Study Area NetworkFigure 5.14 – Select Link Analysis using AM Trip MatrixFigure 5.15 – Select Link Analysis using Interpeak Trip MatrixFigure 5.16 – Select Link Analysis using PM Trip MatrixFigure 6.1 – Sector Plan
TABLES
Table 1 – Location of RSIs 3Table 2 – Location of Automatic Traffic Counts 4Table 3 - 12 Hour to 16 Hour Conversion 2005 6Table 4 – A30 East of Exeter M-Factors 2005 6

EAST OF EXETER (PHASE 2) MAJOR SCHEME BID
REPORT OF SURVEYS AND LOCAL MODEL VALIDATION REPORT
(SECOND DRAFT)
February 2008 Prepared by PB for Devon County Council
Table 5 - 12 Hour to 18 Hour Conversion 2005 7Table 6– Location of Manual Classified Link Counts 8Table 7– Location of Urban Traffic Counts 8Table 8– Location of Journey Time Surveys 8Table 9– Location of Bus Patronage Surveys 9Table 10 – Observed accident severity by analysed link and junction 11Table 11 – National average PIA severity split by link / junction type 12Table 12 – Observed and default link accident rates 13Table 13 – Observed and default junction accident rates 14Table 14 – 1998-2004 TEMPRO factors 17Table 15 – 2004-2005 TEMPRO factors 18Table 16 - Calibration Link Flow Factors 19Table 17– DMRB Validation Criteria 20Table 18– Modelled Pass Rates (AM peak) 21Table 19– Modelled Pass Rates (Interpeak) 22Table 20– Modelled Pass Rates (PM peak) 22Table 21– Convergence Results 24
APPENDIX
Appendix A – Roadside Interview Note Appendix B – Exeter Traffic Model 1998 – Local Model Validation Report

EAST OF EXETER (PHASE 2) MAJOR SCHEME BID
REPORT OF SURVEYS AND LOCAL MODEL VALIDATION REPORT
(SECOND DRAFT)
February 2008 Prepared by PB Page 1 for Devon County Council
1 INTRODUCTION
1.1 Background
1.1.1 PB has been commissioned by Devon County Council to prepare a major scheme bid document for submission to the Department for Transport in order to achieve Programme Entry Status for the East of Exeter (Phase 2) A30 Junction Improvement to M5 Junction 29 and M5 Junction 30 Improvement. This package of improvements appears in the South West Regional Assembly’s Regional Funding Allocation table (September 2006)1 as a scheme which does not yet have approval.
1.1.2 PB has also been commissioned by Devon County Council to conduct the traffic and economics work for the Exeter Principal Urban Area Infrastructure major scheme bid. These proposed improvements also appear in the South West Regional Assembly’s Regional Funding Allocation table as a scheme which does not yet have approval.
1.1.3 The east of Exeter Phase 2 infrastructure proposals and improvements to Junction 30 are required in order to deliver Structure Plan development East of Exeter. By 2016, these developments will comprise:
� 3,500 dwelling new community;
� 30 Ha of employment at Skypark;
� 20 Ha of employment at a Science Park; and
� 40 Ha of employment at an inter-modal freight terminal (IMFT).
1.1.4 In addition to the above, Exeter has been identified as a growth area by the South West Regional Assembly and has achieved Growth Point status. The implications that this will have upon the transport network are, in part, being addressed through the major scheme bid process.
1.2 Aim of Report
1.2.1 This report aims to detail the traffic data collected, as part of the project, and to summarise the development of and validation statistics relating to base year local area models. These models have been developed to provide a platform for assessing major scheme proposals within and to the East of Exeter.
1.3 Study Area
1.3.1 The detailed study area incorporates the whole of Exeter and the strategic road network that surrounds it. This includes the M5 to the east of the city between Junctions 29 and 31 and the A30 to the south and west of the city, extending from Junction 31 of the M5 to the junction with the A377 (Alphington Road) and beyond. It also includes an area east of the M5 which has been designated for significant levels of development in future years.
1.3.2 The detailed study area, along with the majority of East Devon, is defined as the extended study area for this study. The modelled network itself includes the whole of Exeter and East Devon and extends along the M5/M4 as far as London. The
1 http://www.southwest-ra.gov.uk/media/SWRA/RSPTG/5%20October%202006/RSPTG-PaperF-Appendix2-10-06.pdf

EAST OF EXETER (PHASE 2) MAJOR SCHEME BID
REPORT OF SURVEYS AND LOCAL MODEL VALIDATION REPORT
(SECOND DRAFT)
February 2008 Prepared by PB Page 2 for Devon County Council
model has historically been this extensive and provides the opportunity for analysis of long distance trips. The study area is shown in Figure 1.1
1.4 Layout of Report
1.4.1 This report is divided into the following main sections:
� Traffic Data – this section identifies the traffic data used in the model calibration and validation processes;
� Local Area Traffic Model – this section details the methodology used in the development of the private vehicle model;
� Modifications to the Previous Model – this section details the procedures undertaken to update the previous local area traffic model including calibration techniques;
� Model Validation – this section details the model validation procedures;

EAST OF EXETER (PHASE 2) MAJOR SCHEME BID
REPORT OF SURVEYS AND LOCAL MODEL VALIDATION REPORT
(SECOND DRAFT)
February 2008 Prepared by PB Page 3 for Devon County Council
2 TRAFFIC DATA
2.1 Background
2.1.1 Traffic data from a range of sources was collected for use in the model calibration and validation process. The traffic data consists of traffic surveys carried out specifically for this study and previous available traffic survey data. Traffic data was collected from the following types of survey:
� Roadside Interviews (RSIs);
� Manual Classified Link and Junction Counts (MCCs);
� Automatic Traffic Counts (ATCs);
� Urban Traffic Control Data (UTCs);
� Journey Time Surveys; and
� Bus Patronage Surveys.
2.2 Roadside Interviews
2.2.1 A series of RSIs were carried out by PB in June 2004. These surveys were performed specifically for the Exeter Sub-Regional study, with the intention of using the RSI data in the Local Area Traffic Model development. RSIs were carried out for inbound traffic between 7am and 7pm at the locations detailed in the table below. The locations of the RSIs are also shown in Figure 2.1.
RSI Location Date SiteNumber
A377 Cowley Bridge June 2004 1 A379 Exminster June 2004 2 A379 Peamore June 2004 3
Alphington Road at Alphington Cross June 2004 4 B3212 Dunsford Road June 2004 5
Table 1 – Location of RSIs
2.2.2 A separate report detailing the roadside interview survey methodology and analysis has been produced and is contained in Appendix A.

EAST OF EXETER (PHASE 2) MAJOR SCHEME BID
REPORT OF SURVEYS AND LOCAL MODEL VALIDATION REPORT
(SECOND DRAFT)
February 2008 Prepared by PB Page 4 for Devon County Council
2.3 Automatic Traffic Counts
2.3.1 Automatic traffic count (ATC) data has been collected by Devon County Council and the Highways Agency on several links throughout the study area, as detailed in the table below. Figure 2.1 shows a precise numbered plan detailing locations of all ATC sites which have been used for analysis since they provide the best possible long term data which is representative of traffic flows in the study area. Data for the validation of the link flows was taken for a neutral day in the month shown in the table. For the majority of the analysis the ATC site located on the A30, east of m5 junction 29, has been used, as it is close to the proposed infrastructure improvements east of Exeter.
ATC Location Date SiteNumber
A377 Cowley Bridge May 2004 1 A379 Exminster May 2004 2
Topsham Road South of Countess Wear May 2004 6 A3015 Topsham Road (King George V) May 2005 7
A379 Bridge Road May 2004 8 B3212 Pinhoe Road May 2004 9 B3181 Broadclyst May 2004 10
A376 Clyst St Mary Rbt April 2002 11 M5 J28-J29 May 2005 12 M5 J29-J30 May 2005 13 M5 J30-J31 May 2005 14
A30 East of J29 May 2005 15 A30 J31 - Alphington May 2005 16
A30 West of Alphington May 2005 17 A38 Approach to M5 May 2005 18
M5 at J29 May 2005 19 Redhills June 2006 20
A377 Half Moon May 2005 21
Table 2 – Location of Automatic Traffic Counts
2.3.2 The available ATC data for the site on the A30, east of m5 junction 29 has been analysed in order to determine hourly, daily and monthly flow variations along the A30 link.
Hourly Flow Profile
2.3.3 Figure 2.2 shows the hourly flow profile at the A30 site east of junction 29. The flows shown are average Monday to Thursday flows, for the month of May. The graph shows high westbound traffic volumes between 07:00 and 10:00 and a large eastbound peak between 16:00 and 18:00. This is very likely to be due to work journeys to and from Exeter city centre. A smaller eastbound peak occurs between 08:00 and 09:00 with a corresponding westbound peak between 16:00 and 18:00.
Daily Flow Profile
2.3.4 Figure 2.3 shows the daily flow profile east of junction 29 on the A30. It can be seen that the weekday profile in May is consistent apart from a slight increase on Friday. This justifies that a weekday average taken from Monday to Thursday is representative of weekday flow on the A30.

EAST OF EXETER (PHASE 2) MAJOR SCHEME BID
REPORT OF SURVEYS AND LOCAL MODEL VALIDATION REPORT
(SECOND DRAFT)
February 2008 Prepared by PB Page 5 for Devon County Council
Monthly Flow Profile
2.3.5 Based on data from the A30 site, a monthly flow profile for the A30 can be determined in order to ensure that May is a neutral month in terms of traffic. This is necessary in order to show justification in using flows from May as being representative of the average flow along the A30.
2.3.6 Figure 2.4 displays the derived monthly flow profile at the A30 site for 2005. The graph shows that the average 12 hour Monday to Thursday flow for May is 44050, which is only slightly higher than the average 12 hour annual flow of 40711. Therefore, it can be considered that May is a neutral month.
Traffic Growth
2.3.7 Based on available data from the A30 site between 2000 and 2005, it can be seen in Figure 2.5 that traffic flow has increased over this period. The AADT for the A30 has increased from 31847 to 40711, an increase of 27.8%. Over the same period, national traffic forecasts for a major rural road indicates an increase of 9% (taken from ‘Road Traffic Statistics 2002’-Table 2.1b, Department for Transport). Therefore traffic increase on the A30 is considerably higher than the national average. This could to be due to development around junction 29 and Moor Lane roundabout improvements which have taken place over recent years.
Seasonal Variation
2.3.8 The monthly traffic flows in 2005 at the A30 site shown in Figure 2.5 indicate that there is seasonal variation on the A30. The Design Manual for Roads and Bridges (DMRB), Volume 13 states that a Seasonality coefficient between 1.00 and 1.50 would be expected for a non built-up trunk road such as the A30 (Part 4 Table 6/1). Using neutral month data and August data from the ATC East of junction 29 on the A30 for 2005, the Seasonality Index (SI) is calculated below. The average neutral month weekday 24 hour flow is the average of the April, May, June, September and October data.
SI = 1.14
2.3.9 DMRB Volume 13 states that the typical SI value for a non built-up trunk road is 1.10. This is close to the SI value calculated above and so demonstrates that there is a typical level of seasonal variation on the A30.
Conversion Factors
2.3.10 Using data from the ATC at the site east of junction 29 on the A30 the Annual Average Daily Traffic (AADT) for the A30 link can be calculated. This involves calculating Conversion Factors from 12 hour (07:00-19:00) to 16 hour (06:00-22:00) flows, and from 16 hour flows to AADT. Data used in the calculation of these conversion factors is from neutral months, i.e. April, May, June, September and October, in 2005.
EAST OF EXETER (PHASE 2) MAJOR SCHEME BID
REPORT OF SURVEYS AND LOCAL MODEL VALIDATION REPORT
(SECOND DRAFT)
February 2008 Prepared by PB Page 6 for Devon County Council
Conversion From 12 Hour Neutral Month ATC Flows To 16 Hour Flows:
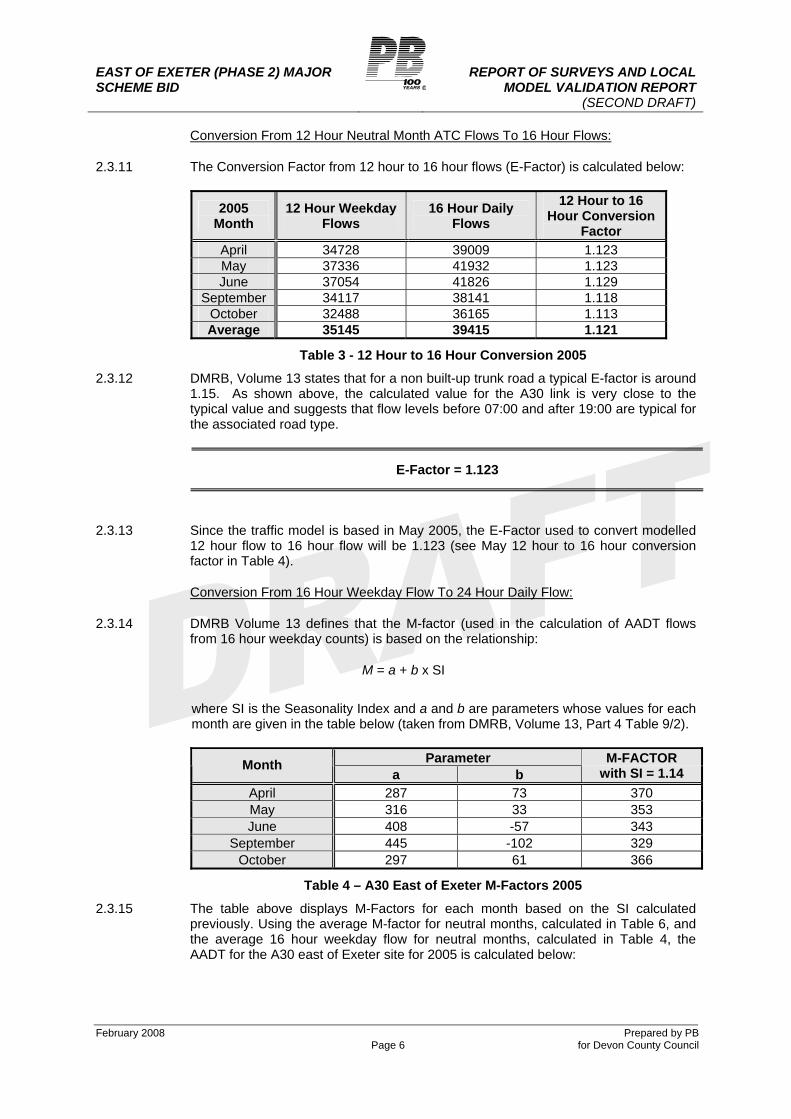
2.3.11 The Conversion Factor from 12 hour to 16 hour flows (E-Factor) is calculated below:
2005Month
12 Hour Weekday Flows
16 Hour Daily Flows
12 Hour to 16 Hour Conversion
FactorApril 34728 39009 1.123 May 37336 41932 1.123 June 37054 41826 1.129
September 34117 38141 1.118 October 32488 36165 1.113 Average 35145 39415 1.121
Table 3 - 12 Hour to 16 Hour Conversion 2005
2.3.12 DMRB, Volume 13 states that for a non built-up trunk road a typical E-factor is around 1.15. As shown above, the calculated value for the A30 link is very close to the typical value and suggests that flow levels before 07:00 and after 19:00 are typical for the associated road type.
E-Factor = 1.123
2.3.13 Since the traffic model is based in May 2005, the E-Factor used to convert modelled 12 hour flow to 16 hour flow will be 1.123 (see May 12 hour to 16 hour conversion factor in Table 4).
Conversion From 16 Hour Weekday Flow To 24 Hour Daily Flow:
2.3.14 DMRB Volume 13 defines that the M-factor (used in the calculation of AADT flows from 16 hour weekday counts) is based on the relationship:
M = a + b x SI
where SI is the Seasonality Index and a and b are parameters whose values for each month are given in the table below (taken from DMRB, Volume 13, Part 4 Table 9/2).
ParameterMontha b
M-FACTOR with SI = 1.14
April 287 73 370 May 316 33 353 June 408 -57 343
September 445 -102 329 October 297 61 366
Table 4 – A30 East of Exeter M-Factors 2005
2.3.15 The table above displays M-Factors for each month based on the SI calculated previously. Using the average M-factor for neutral months, calculated in Table 6, and the average 16 hour weekday flow for neutral months, calculated in Table 4, the AADT for the A30 east of Exeter site for 2005 is calculated below:

EAST OF EXETER (PHASE 2) MAJOR SCHEME BID
REPORT OF SURVEYS AND LOCAL MODEL VALIDATION REPORT
(SECOND DRAFT)
February 2008 Prepared by PB Page 7 for Devon County Council
16 Hour May Flow = 41932May M-Factor = 353
Calculated AADT =41932 x 353
365= 40553
AADT = 40553
2.3.16 This is just 0.39% different from the observed 2005 AADT, which is 40711 and demonstrates the method above is robust.
2.3.17 As the traffic model is representative of May 2005 traffic flows, an M-Factor of 353 (see May M-Factor in Table 6) will be used in the calculation of AADT flows.
Conversion From 12 Hour Flow To 18 Hour Flow:
2.3.18 In addition, an 18 hour (06:00-00:00) conversion factor has been calculated for use in noise calculations, and is shown in the table below:
Month 12 Hour Weekday Flows
18 Hour Weekday Flows
12 Hour-18 Hour Conversion
FactorApril 34728 40010 1.127 May 37336 42979 1.130 June 37054 42961 1.140
September 34117 39040 1.133 October 32488 37017 1.131 Average 35145 40401 1.132
Table 5 - 12 Hour to 18 Hour Conversion 2005
2.3.19 The factor converting the modelled 12 hour flow to 18 hour flow will be 1.130, since the traffic model is based in May 2005 (see May 12 hour – 18 hour conversion factor in Table 6).
2.4 Manual Classified Counts
2.4.1 12-hour manual classified counts (MCC) were undertaken by Devon County Council and PB on links within the study area, as detailed in the table below. Figure 2.1 shows a precise numbered plan detailing locations of all MCC sites.
MCC Location Date SiteNumber
A377 Cowley Bridge June 2004 1 A379 Exminster June 2004 2 A379 Peamore June 2004 3
Alphington Road at Alphington Cross November 2004 4 B3212 Dunsford Road June 2006 5
Station Road July 2004 22

EAST OF EXETER (PHASE 2) MAJOR SCHEME BID
REPORT OF SURVEYS AND LOCAL MODEL VALIDATION REPORT
(SECOND DRAFT)
February 2008 Prepared by PB Page 8 for Devon County Council
MCC Location Date SiteNumber
Fore St, Heavitree November 2005 23 Calthorpe Road May 2001 24
Table 6– Location of Manual Classified Link Counts
2.5 Urban Traffic Control Data
2.5.1 Urban traffic control (UTC) count data was collected from Devon County Council as detailed in the table below. Figure 2.1 shows a precise numbered plan detailing locations of all UTC sites.
UTC Location Date SiteNumber
B3212 Cowick Street May 2003 25 Alphington Road May 2003 26
Okehampton Street May 2003 27
Table 7– Location of Urban Traffic Counts
2.6 Journey Time Surveys
2.6.1 Journey time surveys were carried out on three routes throughout the study area. Figure 2.6 details which routes were travelled along to obtain this data and the locations of the checkpoints along the routes, where journey times were recorded. The routes chosen are the main corridors into Exeter city centre. Dates of when the surveys were carried out are detailed below. More information regarding the data collected from these surveys is included in the journey time validation section.
Location Date Route Number
Pinhoe Road September 2006 1 Heavitree Road September 2006 2 Topsham Road September 2006 3
Table 8– Location of Journey Time Surveys
2.7 Bus Patronage Surveys
2.7.1 Bus patronage surveys were carried out by PB in September 2006. These surveys were performed with the intention of using the survey data in the calibration of the public transport model. Surveys were carried out for inbound and outbound bus services between 8am and 9am, 12pm and 1pm and 5pm and 6pm at six locations detailed in the table below. The locations of the bus patronage surveys are on the six main bus routes into the centre of Exeter and are also shown in Figure 2.7.
Location Date Route Number
New North Road September 2006 28

EAST OF EXETER (PHASE 2) MAJOR SCHEME BID
REPORT OF SURVEYS AND LOCAL MODEL VALIDATION REPORT
(SECOND DRAFT)
February 2008 Prepared by PB Page 9 for Devon County Council
Location Date Route Number
Old Tiverton Road September 2006 29 Blackboy Road September 2006 30 Heavitree Road September 2006 31 Topsham Road September 2006 32 Cowick Street September 2006 33
Table 9– Location of Bus Patronage Surveys

EAST OF EXETER (PHASE 2) MAJOR SCHEME BID
REPORT OF SURVEYS AND LOCAL MODEL VALIDATION REPORT
(SECOND DRAFT)
February 2008 Prepared by PB Page 10 for Devon County Council
3 ACCIDENT ANALYSIS
3.1 General
3.1.1 Accident data in the vicinity of the M5 Junction 29 and M5 Junction 30 has been collected from Devon County Council. Specifically, accident records have been obtained for 5 consecutive years from 1st January 2001 to 31st December 2005 and cover three distinct areas:
� Along the A30, just west of M5 Junction 29 to just east of the A30 Airport junction;
� Along the Old A30 between the A30 Blackhorse Junction and just west of the junction with Station Road; and
� M5 Junction 30.
3.1.2 A plan showing the areas covered by the accident analysis and the subsequent links and junctions these areas have been sub-divided into to facilitate the analysis is shown in Figure 3.1 and Figure 3.2. Accidents have been defined as occurring at a junction if they occurred within 20 metres of a junction2, else they have been associated with a link. The A30 link has been sub-divided into 4 links in order to differentiate analysis between 40mph stretches and those which are unrestricted as accident rates differ between built up (up to 40mph) and non built-up (above 40mph) areas3.
3.1.3 Plots showing all accident data collected for this study are shown in Figure 3.3, Figure 3.4 and Figure 3.5. A lookup table which can be used to find more information on a specific accident given the accident reference shown in the accident plots, is contained with Figure 3.6.
3.2 Accident Severity
3.2.1 During the 5 year period a total of 70 personal injury accidents (PIAs) were recorded for the links and junctions identified in Figure 3.1 and Figure 3.2. Of these 70 accidents, 67 (95.7%) were slight in severity, 3 (4.3%) serious and 0 (0%) fatal. A full breakdown of PIA severity for each link and junction analysed is presented in Table 10. Also indicated in Table 10 is the classification of each link / junction according to accident types outlined in Table 4/1 and Table 5/1 of the DMRB Volume 13, Part 2.
2 DMRB Volume 13, Part 2, Paragraph 5.2 3 DMRB Volume 12, Part 2, Table 4/1

EAST OF EXETER (PHASE 2) MAJOR SCHEME BID
REPORT OF SURVEYS AND LOCAL MODEL VALIDATION REPORT
(SECOND DRAFT)
February 2008 Prepared by PB Page 11 for Devon County Council
Link / Junction Name
DMRB Vol 13 Link / Junction Classification
No.PIAs Fatal Serious Slight
LINKS
A30 EB 40mph Modern D2 Road with HS (30 / 40mph) 1 0 (0.0%) 0 (0.0%) 1 (100.0%)
A30 WB 40mph
Modern D2 Road with HS (30 / 40mph) 3 0 (0.0%) 0 (0.0%) 3 (100.0%)
A30 EB unrestricted
Modern D2 Road with HS (>40mph) 4 0 (0.0%) 0 (0.0%) 4 (100.0%)
A30 WB unrestricted
Modern D2 Road with HS (>40mph) 5 0 (0.0%) 0 (0.0%) 5 (100.0%)
Old A30 Older S2 A Road (>40mph) 7 0 (0.0%) 0 (0.0%) 7 (100.0%)
JUNCTIONS
J29 West 3 Arm Signals (30 / 40mph) 4 0 (0.0%) 1 (25.0%) 3 (75.0%)
J29 East 3 Arm Signals(30 / 40mph) 23 0 (0.0%) 1 (4.3%) 22 (95.7%)
Airport Junction North
Small Roundabout (>40mph) 1 0 (0.0%) 0 (0.0%) 1 (100.0%)
Airport Junction South
Small Roundabout (>40mph) 0 0 (0.0%) 0 (0.0%) 0 (0.0%)
J30 Signalised Roundabout (>40mph) 22 0 (0.0%) 1 (4.5%) 21 (95.5%)
ALL LINKS AND JUNCTIONS
All N/A 70 0 (0.0%) 3 (4.3%) 67 (95.7%)
Table 10 – Observed accident severity by analysed link and junction
3.2.2 For the purposes of comparison between locally collected data and accident data collected nationally, Table 11 shows national proportions of PIAs by severity and type of link / junction according to data taken from Table 3/2 and Table 3/3 of the DMRB Volume 13 part 2.

EAST OF EXETER (PHASE 2) MAJOR SCHEME BID
REPORT OF SURVEYS AND LOCAL MODEL VALIDATION REPORT
(SECOND DRAFT)
February 2008 Prepared by PB Page 12 for Devon County Council
DMRB Vol 13 Link / Junction classification Fatal Serious Slight
LINKS
Modern D2 Road with HS (30 / 40mph) 1.4% 14.0% 84.7%
Modern D2 Road with HS (>40mph) 2.8% 15.9% 81.3%
Older S2 A Road (>40mph) 5.0% 23.2% 71.8%
JUNCTIONS
3 Arm Signals (30 / 40mph) 0.6% 10.7% 88.7%
Small Roundabout (>40mph) 0.6% 9.1% 90.3%
Signalised Roundabout (>40mph) 0.4% 6.2% 93.4%
Table 11 – National average PIA severity split by link / junction type
3.2.3 In the majority of cases, comparisons between national statistics concerning the severity of PIA by link / junction type and those observed locally show that less severe accidents occur in the local area. In the case of the ‘J29 West’ junction, there are relatively more slight accidents occurring than the national average although the local statistics are exaggerated by the small number of PIAs observed.
3.3 Accident Rates (Links)
3.3.1 The observed accident rate for the links identified in this study can be calculated using the following equation:
TRNPA 610365�
�
Where A = Accident rate [PIAs/mvkm] N = Number of consecutive years accident data has been collected for
R = Link length [km]
T = Mean annual average daily traffic figure from the first year for which accidents were collected for to the final year of accident data [veh/day]
P = Number of PIAs recorded between 1Y and 11 �� NY
3.3.2 The calculated accident rate for each link analysed is shown in Table 12. AADT figures have been taken from data recorded at appropriately located ATC sites. In the instance of the old A30 no such ATC data is available. Therefore for this link a 12 hour MCC has been converted to an average AADT figure using local factors derived in section 2.3. For the purposes of comparison, the default accident rate for the associated link as assumed by COBA4 has also been indicated in Table 12.
4 DMRB Volume 13, Part 2, Table 4/1

EAST OF EXETER (PHASE 2) MAJOR SCHEME BID
REPORT OF SURVEYS AND LOCAL MODEL VALIDATION REPORT
(SECOND DRAFT)
February 2008 Prepared by PB Page 13 for Devon County Council
Link Name DMRB Vol 13 Link classification
LinkLength [km]
Average 2001-2005 AADT
No.PIAs
Calculated Accident Rate[pia/mvkm]
DMRB Vol 13 Accident Rate[pia/mvkm]
A30 EB 40mph
Modern D2 Road with HS (30 / 40mph) 0.7 17,392 1 0.046 0.295
A30 WB 40mph
Modern D2 Road with HS (30 / 40mph) 1.4 17,924 3 0.065 0.295
A30 EB unrestricted
Modern D2 Road with HS (>40mph) 2.4 15,036 4 0.060 0.089
A30 WB unrestricted
Modern D2 Road with HS (>40mph) 1.7 15,533 5 0.105 0.089
Old A30 Older S2 A Road (>40mph) 2.4 4,629 7 0.344 0.226
Table 12 – Observed and default link accident rates
3.3.3 Table 12 shows that the accident rate for both the Old A30 and the unrestricted section of the westbound carriageway of the A30 is greater than the default accident rate as assumed by COBA. All other observed accident rates are below default levels.
3.4 Accident Rates (Junctions)
3.4.1 For accidents classified as occurring at junctions, the accident rate is normally expressed as the annual average number of accidents. In order to compare this observed rate against a ‘typical’ rate, research has shown that accident rates at junctions follow the following mathematical model:
bfaA )(�
Where A = Accident rate [pia/year] a = Constant calibrated from research and varies depending on junction type
b = Constant calibrated from research and varies depending on junction type
f = Either: � the value produced by multiplying the combined inflows from the two major
opposing links by the sum of the inflows on the other one or two minor links (cross product, C, model); or
� the value of the total inflow from all links (inflow, I, model). [000’s veh/average day]
3.4.2 The use of either the cross product model (C) or the inflow model (I) for f is determined by the type of junction, number of arms and highest link standard entering the junction (dual or single). A table facilitating this lookup for various combinations of the determining parameters is provided in Table 5/1 in the DMRB, Volume 13, Part 2. This table also shows the appropriate values of a and b to use given the junction characteristics. Table 13 summaries the parameters used in calculating the typical accident rate for each of the junctions analysed. Traffic flow data has been derived from nearby ATCs where available, else it has been estimated from MCC data. The observed accident rate is also indicated in Table 13 to allow comparisons to be made. In the case of the roundabouts analysed, all one way outbound links (motorway / dual carriageway onslips) were discounted from the number of arms at the junction. In the cases where the cross product model has been used, major arms have been shaded red.

EAST OF EXETER (PHASE 2) MAJOR SCHEME BID
REPORT OF SURVEYS AND LOCAL MODEL VALIDATION REPORT
(SECOND DRAFT)
February 2008 Prepared by PB Page 14 for Devon County Council
AADT [000’s/day]
Junc
tion
Nam
e
DM
RB
Vol
13
Junc
tion
Cla
ssifi
catio
n
No.
Acc
iden
ts 2
001-
2005
No.
of A
rms
Hig
hest
Lin
k S
tand
ard
Form
ula
Type
Coe
ff 'a
'
Pow
er 'b
'
Arm
1
Arm
2
Arm
3
Arm
4
Arm
5
Pre
dict
ed A
ccid
ent R
ate
Obs
erve
d A
ccid
ent R
ate
J29 West 3 Arm Signals (30 / 40mph) 4 3 D C 0.29 0.51 8.7 1.8 7.3 1.6 0.8
J29 East 3 Arm Signals(30 / 40mph) 23 3 D C 0.29 0.51 15.7 3.6 4.2 2.6 4.6
Airport Junct North
Small Rdbt (>40mph) 1 4 D C 0.10 0.66 2.5 0.6 3.0 0.5 0.3 0.2
Airport Junct South
Small Rdbt (>40mph) 0 3 D C 0.03 0.76 0.5 0.1 2.2 0.0 0.0
J30SignalisedRdbt(>40mph)
22 5 D I 0.02 1.42 10.7 20.0 11.4 13.4 16.7 8.3 4.4
Table 13 – Observed and default junction accident rates

EAST OF EXETER (PHASE 2) MAJOR SCHEME BID
REPORT OF SURVEYS AND LOCAL MODEL VALIDATION REPORT
(SECOND DRAFT)
February 2008 Prepared by PB Page 15 for Devon County Council
4 LOCAL AREA TRAFFIC MODEL
4.1 Previous Models
4.1.1 A previous traffic study of the Exeter Sub-Region was carried out in 1989. As part of this study, a local area traffic model was developed using SATURN5 highway modelling software. The model consisted of a detailed network and zone system that encompassed the study area, as detailed in section 1.3. This model had some minor updates in 1995 and was then significantly updated in 1998 with a major traffic count and roadside interview (RSI) data collection exercise, to take into account of considerable changes in land use and travel characteristics since 1989. The Local Model Validation Report documenting the traffic surveys, data collection and base year modelling undertaken in 1998 is included in Appendix B of this report.
4.2 Model Requirements
4.2.1 For the current study, the requirement is for a model covering the detailed study area, consisting of a network and zone system to represent travel behaviour in order to aid in the assessment of a number of schemes. To achieve this, the network developed for the previous traffic model was used as the basis for the modelled network. This network includes the A30, A38, M5 and Exeter City Centre, with the central area (inside the A30 / M5 boundary) modelled to a high level of detail.
4.2.2 As the level of detail in the 1998 traffic model is considered sufficient for the requirements of this study, the 1998 model network and trip matrices were used as a basis for the local area traffic model used in this assessment. This model was updated using the 2004 RSI data and recalibrated and validated using recent traffic count data. The updated traffic model was re-based to May 2005. The modifications made to the model, including the updating of trip matrices, are detailed in the following section of this report.
4.3 Modelled Time Period
4.3.1 The traffic model will represent the AM peak hour (08:00 – 09:00), an Interpeak period (average hour from 10:00-16:00) and the PM peak hour (17:00-18:00).
4.4 Zone System
4.4.1 The model zone system is comprehensive and covers the entire country. Within Exeter, zones represent local housing and employment sites. The coarseness of the zone system increases outside of Exeter. Zones in East Devon and other nearby areas tend to represent major settlements. Further away from the detailed study area, zones represent districts, counties and regions. A zone plan for Exeter is shown in Figure 4.1 which also contains a complete list of all zones used in the local area model.
5 Simulation and Assignment of Traffic in Urban Road Networks

EAST OF EXETER (PHASE 2) MAJOR SCHEME BID
REPORT OF SURVEYS AND LOCAL MODEL VALIDATION REPORT
(SECOND DRAFT)
February 2008 Prepared by PB Page 16 for Devon County Council
5 MODIFICATIONS TO THE PREVIOUS MODEL
5.1 Introduction
5.1.1 In order to update the 1998 traffic model to ensure that it accurately models the existing traffic situation within Exeter, a number of modifications were made to the network and trip matrices. These modifications are detailed in this section of the report.
5.2 Traffic Growth
5.2.1 The 1998 traffic model was initially updated to a base year 2004. This was achieved by adding traffic growth due to residential and employment development within the study area between 1998 and 2004. The major development sites added to the traffic model are shown in Figure 5.1 and listed below.
� The Met Office; � EDF Energy; � Royal Devon and Exeter Hospital; � Residential development within the City.
5.2.2 The traffic generated from these developments was calculated using trip rates from the TRICS database for different development types, and distributed using a Furness model.
5.2.3 In addition to the developments, traffic demand travelling to and from the Park and Ride site situated on Honiton Road near the Met Office was accounted for in the model. The trip ends and distribution for this zone within the model was adopted from the AM peak hour model developed to assess the Phase 1 Access strategy to and from the developments proposed East of Exeter.
5.2.4 In addition to this development growth and incorporation of the Park and Ride site at Honiton Road, background traffic growth due to predicted increases in car ownership, car journeys and journey lengths was incorporated using growth factors from the TEMPRO6 model. TEMPRO growth factors were used as this provides a comprehensive database of traffic growth across different areas of the country. The specific methodology used to apply the TEMPRO growth was to extract origin and destination growth factors between 1998 and 2004 for the three TEMPRO time periods encapsulating those modelled:
� Weekday AM peak period (07:00-10:00); � Weekday interpeak period (10:00-16:00); and � Weekday PM peak period (16:00-19:00).
5.2.5 In order to take account of the varying level of growth which occurred across the modelled area, factors for 12 geographical areas were extracted. These geographical areas concentrated on authorities and counties within the south-west as well as factors for the whole of Great Britain. Since demand for the major development which has taken place in Exeter between 1998 and 2004 was already incorporated into the model (paragraph 5.2.1), all planning assumptions defined for the Exeter (Authority) TEMPRO zone were removed, therefore ensuring that trip generation from the development was not ‘double counted’. The TEMPRO factors were then altered to take account of changes in income and fuel price (TEMPRO ref). Zones in the model
6 Trip End Model Presentation Program produced by the ITEA division of the Department for Transport

EAST OF EXETER (PHASE 2) MAJOR SCHEME BID
REPORT OF SURVEYS AND LOCAL MODEL VALIDATION REPORT
(SECOND DRAFT)
February 2008 Prepared by PB Page 17 for Devon County Council
were then allocated a TEMPRO geographical area and their associated trip ends were multiplied by the associated TEMPRO factor. The matrix was subsequently furnessed to the revised trip ends. The factors used in this update process are shown in Table 14 below.
AM IP PMTEMPRO Zone Origin Dest. Origin Dest. Origin Dest.
GB 1.106 1.106 1.100 1.100 1.101 1.101 CORNWALL (County) 1.109 1.109 1.117 1.117 1.104 1.105 SOMERSET (County) 1.132 1.135 1.113 1.113 1.127 1.125 EAST DEVON (Authority) 1.108 1.114 1.109 1.109 1.107 1.103 EXETER (Authority) 1.067 1.036 1.041 1.043 1.035 1.054 MID DEVON (Authority) 1.105 1.114 1.111 1.110 1.107 1.102 NORTH DEVON (Authority) 1.102 1.113 1.109 1.108 1.106 1.099 PLYMOUTH (Authority) 1.120 1.115 1.107 1.108 1.110 1.111 TEIGNBRIDGE (Authority) 1.111 1.115 1.112 1.112 1.109 1.107 TORBAY (Authority) 1.120 1.115 1.113 1.113 1.110 1.113 TORRIDGE (Authority) 1.107 1.114 1.118 1.117 1.110 1.106 WEST DEVON (Authority) 1.093 1.114 1.103 1.102 1.105 1.092
Table 14 – 1998-2004 TEMPRO factors
5.3 RSI Data
5.3.1 The revised 2004 traffic model was then updated using the RSI data collected from the June 2004 surveys. The update involved creating a trip matrix of the traffic movements crossing the RSI screenline (detailed in Figure 2.1) to the west and south of the City Centre, using ERICA traffic modelling software. This trip matrix was then used to replace the trips crossing the RSI screenline in the revised 2004 trip matrix.
5.3.2 ERICA software was used in order to form a trip matrix from roadside interview records. ERICA is a trip database system, which builds trip matrices for county or regional models. The software takes origin-destination (O-D) trip records from roadside interviews and maintains them as a database. The database then allows the trips from individual sites to be combined so as to eliminate (or to compensate for the) double counting of trips.
5.4 Base Year
5.4.1 Following the modification of the 2004 traffic model, further traffic growth was applied, using growth factors from TEMPRO, to update the traffic model to a base of May 2005. This was done to ensure that the traffic model was as up-to-date as possible. The methodology to update the demand matrices at this stage is similar to that described in section 5.2 except that all planning assumptions were left unaltered. The growth factors used are shown in Table 15 below.

EAST OF EXETER (PHASE 2) MAJOR SCHEME BID
REPORT OF SURVEYS AND LOCAL MODEL VALIDATION REPORT
(SECOND DRAFT)
February 2008 Prepared by PB Page 18 for Devon County Council
AM IP PMTEMPRO Zone Origin Dest. Origin Dest. Origin Dest.
GB 1.014 1.014 1.016 1.016 1.014 1.014 CORNWALL (County) 1.014 1.014 1.019 1.019 1.014 1.014 SOMERSET (County) 1.019 1.019 1.019 1.019 1.019 1.018 EAST DEVON (Authority) 1.016 1.016 1.018 1.018 1.016 1.016 EXETER (Authority) 1.023 1.017 1.020 1.021 1.018 1.022 MID DEVON (Authority) 1.014 1.016 1.018 1.018 1.016 1.015 NORTH DEVON (Authority) 1.015 1.016 1.018 1.018 1.016 1.015 PLYMOUTH (Authority) 1.017 1.017 1.018 1.018 1.017 1.017 TEIGNBRIDGE (Authority) 1.015 1.016 1.018 1.018 1.016 1.015 TORBAY (Authority) 1.017 1.016 1.019 1.019 1.016 1.017 TORRIDGE (Authority) 1.013 1.016 1.019 1.019 1.016 1.014 WEST DEVON (Authority) 1.012 1.016 1.017 1.017 1.015 1.013
Table 15 – 2004-2005 TEMPRO factors
5.5 Road Network
5.5.1 The 1998 modelled network was updated to 2005 by adding infrastructure improvements constructed during this period as detailed below and shown in Figure 51:
� Junction 29 improvements; � Moor Lane Roundabout improvements; � Honiton Road Park and Ride site.
5.5.2 Further detail was added to Alphington Cross and Pinhoe Sainsburys junctions so as to more accurately represent the layout of these junctions.
5.5.3 In addition, further detail was added to the network in the Sowton area in order to incorporate the additional development sites detailed in section 4.2.
5.6 Speed / Flow Curves
5.6.1 The 1998 traffic model did not contain speed / flow curves on any of the modelled links. Speed / flow curves are mathematical functions used to represent the fact that vehicle speeds on links reduce as traffic flows increase and congestion starts to build. As a result of the absence of speed / flow curves, the model would have assumed that all vehicles on links travel at the allocated speed, and hence the model would only calculate junction delays, and not delays due to congestion on links. In order to ensure that all delays were modelled, speed / flow curves, formulated according to guidance in DMRB7 Volume 13, were added to the model for all links in the City Centre, and the main links within the study area (e.g. A30, M5, A38). The speed flow curves used as a basis to those employed in the model are shown graphically in Figure x which also includes a colour coded plot of the model network that indicates which relationships were applied to each link. For specific links, slight alterations were made to the base speed flow relationships in respect of the speed limit of the road or lane width for example. These slight alterations aided in the calibration of route choice within the model.

EAST OF EXETER (PHASE 2) MAJOR SCHEME BID
REPORT OF SURVEYS AND LOCAL MODEL VALIDATION REPORT
(SECOND DRAFT)
February 2008 Prepared by PB Page 19 for Devon County Council
5.7 Model Calibration and Validation
5.7.1 Once the 1998 traffic model had been updated to May 2005, the calibration and validation procedures were carried out. In terms of link flow calibration, an initial comparison was made between observed and modelled link flows entering the detailed study area of the model (Outer cordon in Figure 2.1). In order to ensure the correct order of traffic was entering / exiting the detailed study area, select link matrices for links on the outer cordon were factored accordingly in order that the total volume entering / exiting the outer cordon was in agreement with observed flows. This process ensured that if any over / underestimation was introduced by the modelling techniques used to update the trip matrices between 1998 and 2005 (as described in section 5.2) then this would be rectified. Since select link matrices were factored, the distribution within the model was not compromised and therefore retains the distribution characteristics exhibited by the RSI data which is embedded within the model.
5.7.2 Once the correct volume of traffic crossing the outer cordon was represented in the model, link flows within that cordon were calibrated. Since the overall traffic entering and exiting the outer cordon was in the correct order, calibration of the link flows within that cordon was undertaken by applying either small changes to the model network (to alter route choice) or by applying small factors (±10%) to select link matrices in order that modelled flows were in agreement with observed flows. The application of these small factors ensured that the distribution across the outer cordon was not significantly disrupted. The factors applied to the select link matrices for each time period within the outer cordon are detailed in Table 17 below. The site numbers shown cross-reference the count site locations as identified in Figure 2.1.
Site AM IP PM2 - 1.10 - 10 1.09 0.92 0.91 11 0.90 - - 12 - - 1.10 19 1.09 1.10 1.10 20 - 1.10 1.10 21 0.93 - 0.95 35 - 0.90 - 42 1.04 1.10 0.95 43 - 1.02 - 45 0.98 0.98 1.05 53 1.10 - - 54 - 0.90 - 56 - - 0.90 64 - 0.98 0.95
Table 16 - Calibration Link Flow Factors
5.7.3 Following the calibration of the model, a full validation was carried out. This process involved a direct comparison of modelled and observed link flows and assessment of the flows against DMRB validation criteria. The validation process and results are described in detail in the following section of this report.

EAST OF EXETER (PHASE 2) MAJOR SCHEME BID
REPORT OF SURVEYS AND LOCAL MODEL VALIDATION REPORT
(SECOND DRAFT)
February 2008 Prepared by PB Page 20 for Devon County Council
6 MODEL VALIDATION
6.1 Model Validation Methodology
6.1.1 Model validation involved a direct comparison of observed and modelled AM peak hour (08:00-09:00), interpeak (average hourly flow between 10:00 and 16:00) and PM peak hour (17:00-18:00) link flows against DRMB validation criteria, journey times and an analysis of route choice. Link flows and journey times were analysed by direct comparison with the survey data whereas route choice was investigated using analysis functions in the SATURN programme P1X.
6.2 Link Flows
6.2.1 In order for a direct comparison to be made between modelled and observed flows, traffic count data was modified in order to be representative of the base year and month (i.e. May 2005). This was achieved using TEMPRO growth factors to convert counts to 2005, and M-Factors from DMRB Volume 12 to convert the data to May levels.
6.2.2 In order to ensure that the levels of traffic entering and leaving the City boundaries and the City Centre are accurate, traffic flows were assessed across inner and outer cordons. The inner cordon consists of a cordon around the City Centre, whereas the outer cordon forms a cordon around the wider City boundary. Both the inner and outer cordons, and the specific traffic counts locations included in each, are detailed in Figure 2.1. In addition to the total traffic flows crossing each cordon, the accuracy of each individual site was assessed.
6.2.3 As well as the inner and outer cordons, traffic flows on the Trunk Road network were specifically assessed. This process ensured that modelled traffic flows on the A30, A38 and M5 within the study area were accurate.
6.3 Model Validation Criteria
6.3.1 The modelled and observed link flows were directly compared and assessed against DMRB validation criteria. DMRB Volume 12 states the criteria for acceptability guidelines with respect to link flows:
Criteria % Of Cases Acceptability Guideline
GEH8
Statistic LINK FLOWS
Individual Link Flows < 700 vph � 100 vehicles < 5 Individual Link Flows 700 – 2700 vph � 15% < 5 Individual Link Flows > 2700 vph
> 85% of cases
� 400 vehicles < 5 Cordon All � 5% < 4
Table 17– DMRB Validation Criteria Source: DMRB Volume 12, Section 2, Chapter 4, Table 4.2
8 GEH =
(M-C)212(M+C)
where M = Modelled Flow and C = Observed Flow. The GEH value is a form of Chi-squared statistic and
incorporates both relative and absolute errors, giving an overall measure of the accuracy of the modelled flow.

EAST OF EXETER (PHASE 2) MAJOR SCHEME BID
REPORT OF SURVEYS AND LOCAL MODEL VALIDATION REPORT
(SECOND DRAFT)
February 2008 Prepared by PB Page 21 for Devon County Council
6.3.2 All the modelled and observed link flows used in the validation process were assessed against the DMRB guidelines detailed above. In addition, the total inbound and outbound flows across the inner and outer cordons were also assessed.
AM Peak Period
6.3.3 The results of the validation process for the AM peak hour are shown in detail in Figure 5.2 and are summarised in the table below:
Cordon Pass Rate
AM PEAK HOUR All Flows Individual Sites 87.0%
Individual Sites 96.2% Inbound Flow Pass Outer Cordon
Outbound Flow Pass Individual Sites 83.3% Inbound Flow Fail Inner Cordon
Outbound Flow Pass Trunk Road Network Individual Sites 86.7%
Table 18– Modelled Pass Rates (AM peak)
6.3.4 Analysis of the performance of the model against the DRMB acceptability criteria shows that over all the validation sites, 87.0% pass the DMRB criteria. As the criteria states that >85% of all sites should pass, this demonstrates that the model meets the DMRB validation criteria.
6.3.5 Analysis of the total cordon traffic flows provides a very good measure of the performance and accuracy of the model, as it demonstrates that the overall level of traffic crossing the cordon in accurate. The DMRB criteria states that total flows crossing the cordon should be accurate to within 5%. Analysis of the total outer cordon flows shows that inbound flows are accurate to within 2.0% and outbound flows are accurate to within 2.3%. Analysis of the total inner cordon flows shows that inbound flows are accurate to within 4.7% and outbound flows are accurate to within 1.3%. The GEH value for the inbound flow is 4.4 and therefore does not pass DMRB criteria which states that cordon flows should have a GEH <4. This can be justified as it is due to a small number of links to the west of Exeter, well outside of the area to the east which the study will be focussing on. It was concluded that traffic flows crossing both the inner and outer are accurate and satisfy the DMRB criteria.
Interpeak
6.3.6 The results of the validation process for the interpeak are shown in detail in Figure 5.3 and are summarised in the table below:

EAST OF EXETER (PHASE 2) MAJOR SCHEME BID
REPORT OF SURVEYS AND LOCAL MODEL VALIDATION REPORT
(SECOND DRAFT)
February 2008 Prepared by PB Page 22 for Devon County Council
Cordon Pass Rate
INTERPEAK All Flows Individual Sites 92.6%
Individual Sites 96.2% Inbound Flow Pass Outer Cordon
Outbound Flow Pass Individual Sites 88.9% Inbound Flow Pass Inner Cordon
Outbound Flow Pass Trunk Road Network Individual Sites 93.3%
Table 19– Modelled Pass Rates (Interpeak)
6.3.7 Analysis of the performance of the model against the DRMB acceptability criteria shows that over all the validation sites, 92.6% pass the DMRB criteria. As the criteria states that >85% of all sites should pass, this demonstrates that the model meets the DMRB validation criteria.
6.3.8 Analysis of the total outer cordon flows shows that inbound flows are accurate to within 3.3% and outbound flows are accurate to within 0.7%. Analysis of the inner total cordon flows shows that inbound flows are accurate to within 3.0% and outbound flows are accurate to within 0.1%. This demonstrates that traffic flows crossing both the inner and outer are accurate and satisfy the DMRB criteria.
PM Peak Period
6.3.9 The results of the validation process for the PM peak hour are shown in detail in Figure 5.4 and are summarised in the table below:
Cordon Pass Rate
PM PEAK HOUR All Flows Individual Sites 85.2%
Individual Sites 88.5% Inbound Flow Pass Outer Cordon
Outbound Flow Pass Individual Sites 83.3% Inbound Flow Pass Inner Cordon
Outbound Flow Pass Trunk Road Network Individual Sites 86.7%
Table 20– Modelled Pass Rates (PM peak)
6.3.10 Analysis of the performance of the model against the DRMB acceptability criteria shows that over all the validation sites, 87.0% pass the DMRB criteria. As the criteria states that >85% of all sites should pass, this demonstrates that the model meets the DMRB validation criteria. Although the Trunk Road network does not pass these criteria, the links which fail are borderline cases.
6.3.11 Analysis of the total outer cordon flows shows that inbound flows are accurate to within 0.8% and outbound flows are accurate to within 0.8%. Analysis of the inner total cordon flows shows that inbound flows are accurate to within 3.4% and outbound
EAST OF EXETER (PHASE 2) MAJOR SCHEME BID
REPORT OF SURVEYS AND LOCAL MODEL VALIDATION REPORT
(SECOND DRAFT)
February 2008 Prepared by PB Page 23 for Devon County Council
flows are accurate to within 2.4%. This demonstrates that traffic flows crossing both the inner and outer are accurate and satisfy the DMRB criteria.
6.4 Journey Times
6.4.1 Journey time data collected across the study area and described in section 2.6 has been used in comparison with modelled data to validate the traffic model. By plotting the observed cumulative journey time against the modelled cumulative journey time, journey times along the route and at each checkpoint can be examined, to ensure they are reasonably similar. The total journey times can be verified by plotting the observed total journey time with 95% confidence intervals for this time, and the modelled total journey time and checking whether the modelled total journey time lies within the confidence intervals.
6.4.2 Cumulative journey time plots have been produced for the AM peak, Interpeak and PM peak periods and are shown in Figures 5.5 to 5.8. The majority of the modelled routes follow the observed routes very closely.
6.4.3 The total journey time plots are shown in Figure 5.9. Nearly all the modelled journey times lie within or very close to the confidence intervals. There are no confidence intervals for Route 3 – Topsham Road in the PM peak as only one journey time was recorded but it is evident that the modelled time is reasonably close to the observed time.
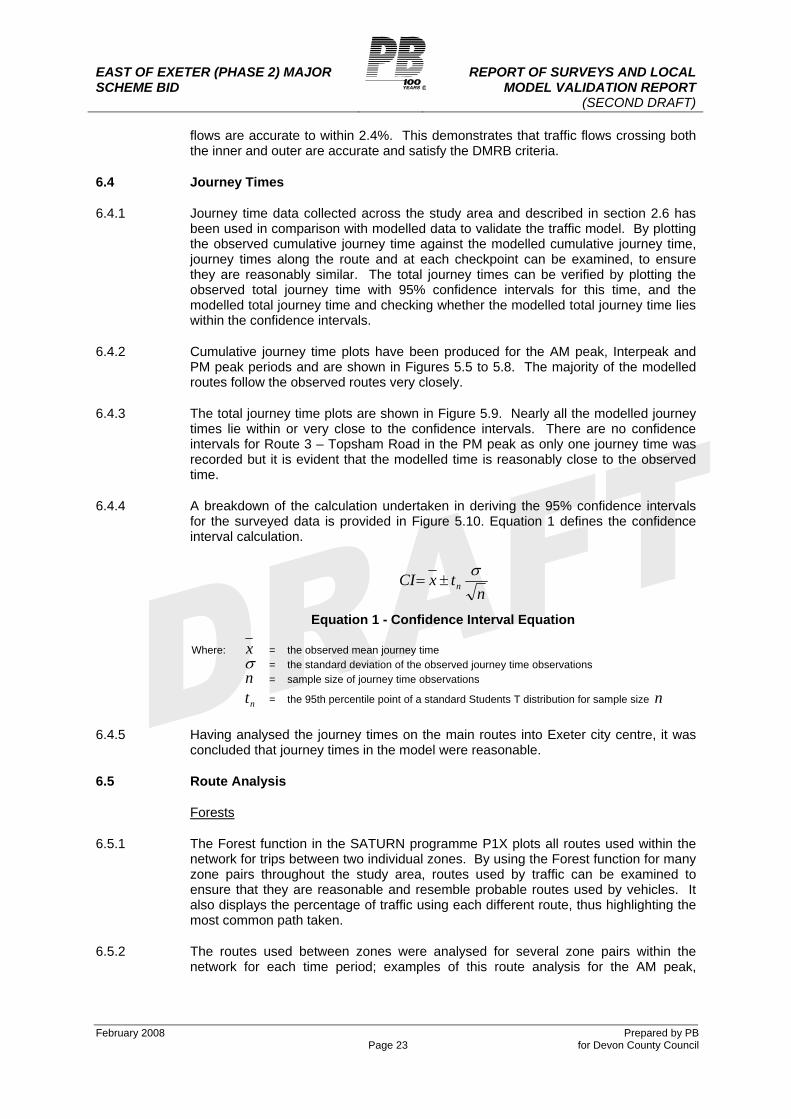
6.4.4 A breakdown of the calculation undertaken in deriving the 95% confidence intervals for the surveyed data is provided in Figure 5.10. Equation 1 defines the confidence interval calculation.
ntxCI n
���
Equation 1 - Confidence Interval Equation
Where: x = the observed mean journey time � = the standard deviation of the observed journey time observations n = sample size of journey time observations
nt = the 95th percentile point of a standard Students T distribution for sample size n
6.4.5 Having analysed the journey times on the main routes into Exeter city centre, it was concluded that journey times in the model were reasonable.
6.5 Route Analysis
Forests
6.5.1 The Forest function in the SATURN programme P1X plots all routes used within the network for trips between two individual zones. By using the Forest function for many zone pairs throughout the study area, routes used by traffic can be examined to ensure that they are reasonable and resemble probable routes used by vehicles. It also displays the percentage of traffic using each different route, thus highlighting the most common path taken.
6.5.2 The routes used between zones were analysed for several zone pairs within the network for each time period; examples of this route analysis for the AM peak,

EAST OF EXETER (PHASE 2) MAJOR SCHEME BID
REPORT OF SURVEYS AND LOCAL MODEL VALIDATION REPORT
(SECOND DRAFT)
February 2008 Prepared by PB Page 24 for Devon County Council
Interpeak and PM peak periods are shown in Figures 5.11, 5.12 and 5.13. Following the assessment, it was concluded that the routes used by the model appear reasonable.
Select Link Analysis
6.5.3 The Select Link Analysis function shows the links used by all vehicles that also use the selected link. This function allows an analysis of which routes use the selected link and whether they are logical.
6.5.4 Having analysed the major links in the study area, it was concluded that routeing in the model was reasonable. Proportional traffic use on major links within the study area for each time period is shown in Figures 5.14, 5.15 and 5.16.
6.6 Convergence
6.6.1 When running the local traffic model it was important to observe the level of convergence. Convergence is required in order to provide stable, consistent and robust model results and to differentiate between real changes and those associated with differing degrees of convergence. DMRB Volume 12 outlines the convergence criteria for a local area traffic model. To assess the level of convergence, the criteria uses ‘the percentage of links on which flows change by less than 5% between successive iterations’ (sometimes known as P) and ‘the difference between the costs along the chosen routes and those along the minimum cost routes, summed across the whole network, and expressed as a percentage of the minimum costs’ (sometimes known as �). Table 22 shows the criteria and the convergence results from the models.
Model Results Measure of Convergence
Acceptable Value(s) AM
PeakInterpeak PM
PeakAcceptability
% of Links with Flow Change
(P) < 5%
4 Consecutive Iterations >
90%
99.9%100.0%99.9%
100.0%
100.0%100.0%100.0%99.9%
99.8%100.0%100.0%100.0%
PASS
Delta (�) < 1% 0.12% 0.04% 0.16% PASS
Table 21– Convergence Results
6.6.2 The results produced by the model show that an excellent level of convergence has been achieved for the AM peak, Interpeak and PM peak matrices. This demonstrates the modelled flows to be stable, robust and consistent.

EAST OF EXETER (PHASE 2) MAJOR SCHEME BID
REPORT OF SURVEYS AND LOCAL MODEL VALIDATION REPORT
(SECOND DRAFT)
February 2008 Prepared by PB Page 25 for Devon County Council
7 CONCLUSIONS
7.1 Summary
7.1.1 This report has described the methodology used to update the previous 1998 Exeter Sub-Regional traffic model to a base year of May 2005.
7.1.2 The updated May 2005 traffic model has been shown to accurately represent the existing traffic situation within the Exeter Sub-Region. Modelled traffic flows have been shown to satisfy the DMRB criteria, with 87.0% of all link flows passing the acceptability criteria for the AM Peak model, 92.6% passing the criteria for the Interpeak model and 96.2% for the PM peak model. In addition, for all modelled time periods total traffic flows crossing both inner (City Centre) and outer (City boundary) cordons have been shown to be accurate to within 5% and hence satisfy the DMRB criteria.
7.1.3 Overall, the calibration and validation procedures have demonstrated that the traffic model accurately represents that existing traffic situation within the study area, and that the traffic model is suitable to take forward to the forecasting process.
7.1.4 The model achieved an excellent level of convergence, satisfying the DMRB criteria in all cases, demonstrating that model flows are robust, stable and consistent.

FIGURES

KEY
Detailed study area
Extended study area
LOCAL OVERVIEW
NATIONAL OVERVIEWREGIONAL OVERVIEW
CLIENT
Carnegie House, Western Way, Exeter. EX1 2DBTel: 01392 229700 Fax: 01392 229701
TITLE
PROJECTEast of Exeter (Phase 2) and M5 Junction 30 Major Scheme Bid
Model Study Area
PRODUCED
CHECKED
APPROVED
CG
IB
DB
DATE
SCALE
NOT TO SCALE
December 2006
Figure 1.1© Copyright Parsons Brinckerhoff Limited

Carnegie House, Western Way, Exeter. EX1 2DBTel: 01392 229700 Fax: 01392 229701
Parsons Brinckerhoff Ltd
FIGURE 2.1© Copyright Parsons Brinckerhoff Limited
JOBEast of Exeter (Phase 2) and M5 Junction 30 Major Scheme Bid
TITLELocations of Traffic Survey Sites
DESIGNEDZP
PRODUCEDZP
CHECKEDCG
APPROVEDIB
DATE December 2006
SCALE NTS
KEY
4
6
16
10
8
11
3
12
14
13
15
18
19
1
9
7
25
23
26
22
24
5
17
20
21
OuterCordon
InnerCordon
RSIScreen-
line
2
27
10 Count site number
Cordon / screenline boundary