Embed Size (px)
Citation preview
PS 525 © 2010 The Psychonomic Society, Inc.
Behavior Research Methods2010, 42 (2), 525-541doi:10.3758/BRM.42.2.525
PS
Raven’s Progressive Matrices and similar matrix prob-lems have been used in research and intelligence testing for decades. The matrix problems serve as a nonverbal test of analogical reasoning and are thought to measure analytical intelligence (Carpenter, Just, & Shell, 1990), also known as fluid intelligence (cf. Cattell, 1963). Although these matrix problems have a wide variety of research applications, the relatively small number of matrices in Raven’s original sets (108 total; Raven, Court, & Raven, 1998) limits their utility in several domains, including neuroimaging experiments and computational modeling of cognitive processes.
Our goal in the present study was to create and charac-terize a very large set of matrix problems that have prop-erties similar to those of Raven’s original matrices. We sought to create the matrix set in a systematic way that would allow researchers to have a great deal of control over the underlying structure, surface features, and dif-ficulty of the matrix problems. This in turn would allow researchers to systematically expand the range of diffi-culty in their stimulus sets beyond the range provided by the original Raven’s matrices. To accomplish these goals, we analyzed the underlying structures in Raven’s original Standard Progressive Matrices (SPMs) to determine what types and combinations of relations were used. On the basis of that analysis, we developed software that can use
the same underlying patterns to generate large numbers of unique matrix problems using parameters chosen by the researcher. Specifically, the software is designed so that researchers can choose the type, direction, and number of relations in a problem and create any number of unique matrices that share the same underlying structure (e.g., changes in numerosity in a diagonal pattern) but have dif-ferent surface features (e.g., shapes, colors).
Finally, we used the matrix generation software to pro-duce a representative set of matrix problems that cover the range of underlying structures that can be produced by the software. This set of matrices was compared with Raven’s SPMs in a norming study. The first goal of the norming study was to compare the difficulty of the generated matri-ces with the difficulty of the SPMs with the same underly-ing structure. The second goal was to assess the difficulty of specific structural features within the matrices and the range of problem difficulties that can be produced by the matrix generation software when those features are combined.
Analysis of Raven’s Progressive Matrix Structures
Previous studies have analyzed the factors that contrib-ute to the difficulty of Raven and Raven-like matrix prob-lems. The primary factors that have been identified are the
Recreating Raven’s: Software for systematically generating large numbers of Raven-like matrix
problems with normed properties
LAURA E. MATZEN, ZACHARY O. BENZ, AND KEVIN R. DIXONSandia National Laboratories, Albuquerque, New Mexico
JAMIE POSEY AND JAMES K. KROGERNew Mexico State University, Las Cruces, New Mexico
AND
ANN E. SPEEDSandia National Laboratories, Albuquerque, New Mexico
Raven’s Progressive Matrices is a widely used test for assessing intelligence and reasoning ability (Raven, Court, & Raven, 1998). Since the test is nonverbal, it can be applied to many different populations and has been used all over the world (Court & Raven, 1995). However, relatively few matrices are in the sets developed by Raven, which limits their use in experiments requiring large numbers of stimuli. For the present study, we ana-lyzed the types of relations that appear in Raven’s original Standard Progressive Matrices (SPMs) and created a software tool that can combine the same types of relations according to parameters chosen by the experimenter, to produce very large numbers of matrix problems with specific properties. We then conducted a norming study in which the matrices we generated were compared with the actual SPMs. This study showed that the generated matrices both covered and expanded on the range of problem difficulties provided by the SPMs.
L. E. Matzen, [email protected]
526 MATZEN ET AL.
Given this previous research, our goal was to create software that could produce a large number of matrix problems in which the number, type, and direction of relations could be chosen by the user. We conducted an analysis of the types of relations that appear in the SPMs (Raven et al., 1998) in order to identify relations that could be added to one another in any combination, to create ma-trices with a wide range of difficulty.
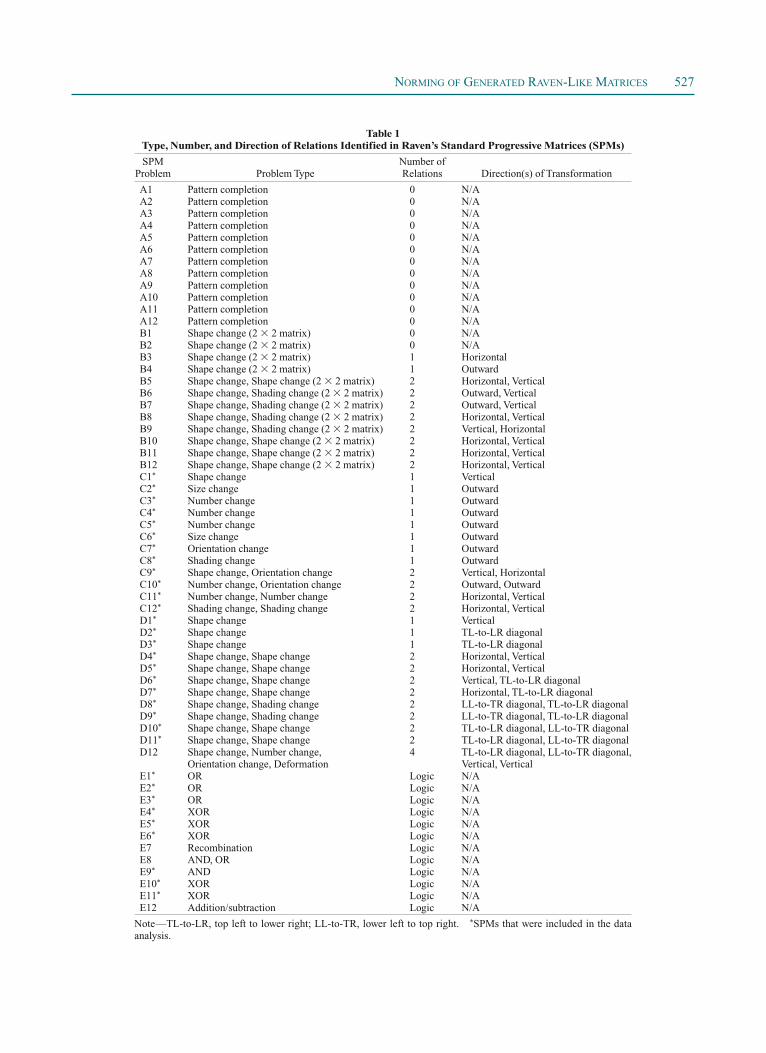
The SPM test includes a total of 60 matrices divided into five sets of 12, named Sets A, B, C, D, and E. The 12 matrices in Set A contain pattern completion tasks with six possible answer choices. The 12 matrices in Set B are 2 2 matrix problems with six possible answer choices for filling in the missing cell. The remaining 36 SPMs (Sets C, D, and E) all feature 3 3 matrices with eight possible choices for filling in the missing cell.
Within the SPM problem set, we identified two basic types of problems with features that could be used in the matrix generation software: problems involving object transformations, and logic problems. The object transfor-mation problems in the SPM set were primarily zero-, one-, or two-relation problems. The logic problems involved op-erations such as addition, conjunction (AND), disjunction (OR), or exclusive disjunction (XOR) relations across the rows and columns of a matrix problem. The type, number, and direction of relations that we identified for each SPM problem are shown in Table 1. It should be noted that some of the SPMs could have been classified in more than one
number, complexity, and direction of the rules that govern the changes within the matrix (see Primi, 2002, for a re-view). In a key study in this area, Carpenter et al. (1990) used measures of online processing to assess how people approached and solved Raven’s Advanced Progressive Ma-trices. Carpenter et al. found that participants consistently processed the problems in an incremental way—in other words, attempted to divide the problems into subproblems by searching for similarities between the cells in a matrix to determine which were governed by the same rule. In problems based on more than one rule, the participants investigated and described one rule at a time, and their error rates increased as the number of rules in the problem increased.
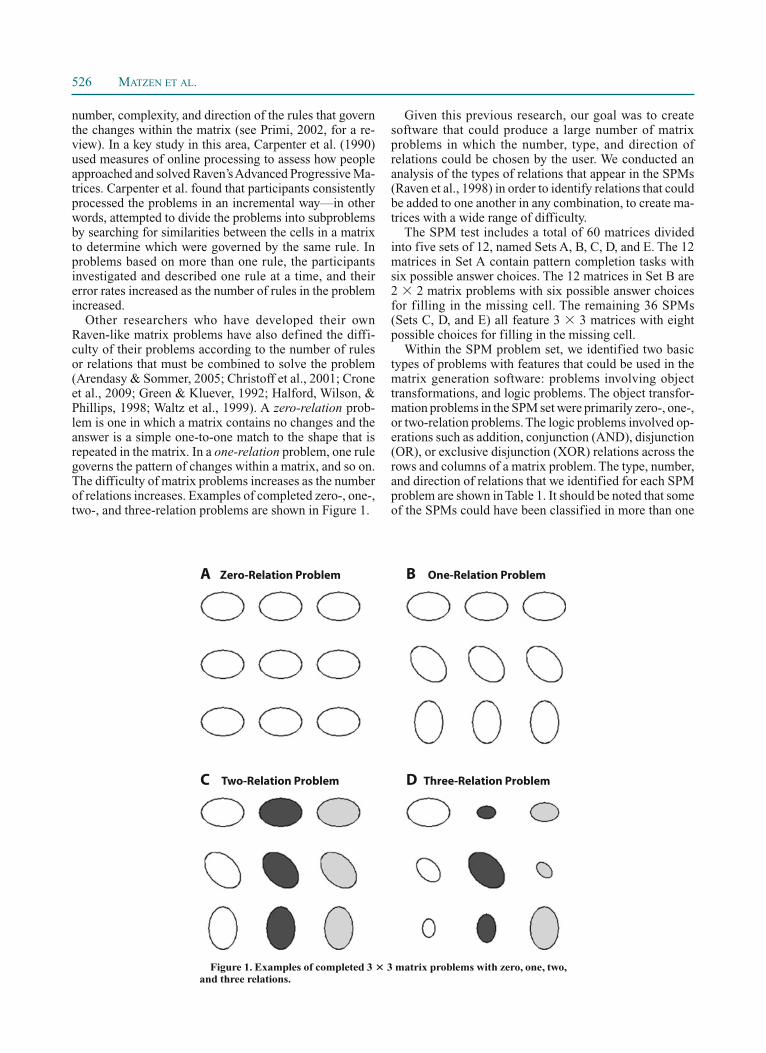
Other researchers who have developed their own Raven- like matrix problems have also defined the diffi-culty of their problems according to the number of rules or relations that must be combined to solve the problem (Arendasy & Sommer, 2005; Christoff et al., 2001; Crone et al., 2009; Green & Kluever, 1992; Halford, Wilson, & Phillips, 1998; Waltz et al., 1999). A zero-relation prob-lem is one in which a matrix contains no changes and the answer is a simple one-to-one match to the shape that is repeated in the matrix. In a one-relation problem, one rule governs the pattern of changes within a matrix, and so on. The difficulty of matrix problems increases as the number of relations increases. Examples of completed zero-, one-, two-, and three-relation problems are shown in Figure 1.
A Zero-Relation Problem B One-Relation Problem
C Two-Relation Problem D Three-Relation Problem
Figure 1. Examples of completed 3 3 matrix problems with zero, one, two, and three relations.
NORMING OF GENERATED RAVEN-LIKE MATRICES 527
Table 1 Type, Number, and Direction of Relations Identified in Raven’s Standard Progressive Matrices (SPMs)
SPM Problem
Problem Type
Number of Relations
Direction(s) of Transformation
A1 Pattern completion 0 N/AA2 Pattern completion 0 N/AA3 Pattern completion 0 N/AA4 Pattern completion 0 N/AA5 Pattern completion 0 N/AA6 Pattern completion 0 N/AA7 Pattern completion 0 N/AA8 Pattern completion 0 N/AA9 Pattern completion 0 N/AA10 Pattern completion 0 N/AA11 Pattern completion 0 N/AA12 Pattern completion 0 N/AB1 Shape change (2 2 matrix) 0 N/AB2 Shape change (2 2 matrix) 0 N/AB3 Shape change (2 2 matrix) 1 HorizontalB4 Shape change (2 2 matrix) 1 OutwardB5 Shape change, Shape change (2 2 matrix) 2 Horizontal, VerticalB6 Shape change, Shading change (2 2 matrix) 2 Outward, VerticalB7 Shape change, Shading change (2 2 matrix) 2 Outward, VerticalB8 Shape change, Shading change (2 2 matrix) 2 Horizontal, VerticalB9 Shape change, Shading change (2 2 matrix) 2 Vertical, HorizontalB10 Shape change, Shape change (2 2 matrix) 2 Horizontal, VerticalB11 Shape change, Shape change (2 2 matrix) 2 Horizontal, VerticalB12 Shape change, Shape change (2 2 matrix) 2 Horizontal, VerticalC1* Shape change 1 VerticalC2* Size change 1 OutwardC3* Number change 1 OutwardC4* Number change 1 OutwardC5* Number change 1 OutwardC6* Size change 1 OutwardC7* Orientation change 1 OutwardC8* Shading change 1 OutwardC9* Shape change, Orientation change 2 Vertical, HorizontalC10* Number change, Orientation change 2 Outward, OutwardC11* Number change, Number change 2 Horizontal, VerticalC12* Shading change, Shading change 2 Horizontal, VerticalD1* Shape change 1 VerticalD2* Shape change 1 TL-to-LR diagonalD3* Shape change 1 TL-to-LR diagonalD4* Shape change, Shape change 2 Horizontal, VerticalD5* Shape change, Shape change 2 Horizontal, VerticalD6* Shape change, Shape change 2 Vertical, TL-to-LR diagonalD7* Shape change, Shape change 2 Horizontal, TL-to-LR diagonalD8* Shape change, Shading change 2 LL-to-TR diagonal, TL-to-LR diagonalD9* Shape change, Shading change 2 LL-to-TR diagonal, TL-to-LR diagonalD10* Shape change, Shape change 2 TL-to-LR diagonal, LL-to-TR diagonalD11* Shape change, Shape change 2 TL-to-LR diagonal, LL-to-TR diagonalD12 Shape change, Number change,
Orientation change, Deformation4 TL-to-LR diagonal, LL-to-TR diagonal,
Vertical, VerticalE1* OR Logic N/AE2* OR Logic N/AE3* OR Logic N/AE4* XOR Logic N/AE5* XOR Logic N/AE6* XOR Logic N/AE7 Recombination Logic N/AE8 AND, OR Logic N/AE9* AND Logic N/AE10* XOR Logic N/AE11* XOR Logic N/AE12 Addition/subtraction Logic N/A
Note—TL-to-LR, top left to lower right; LL-to-TR, lower left to top right. *SPMs that were included in the data analysis.
528 MATZEN ET AL.
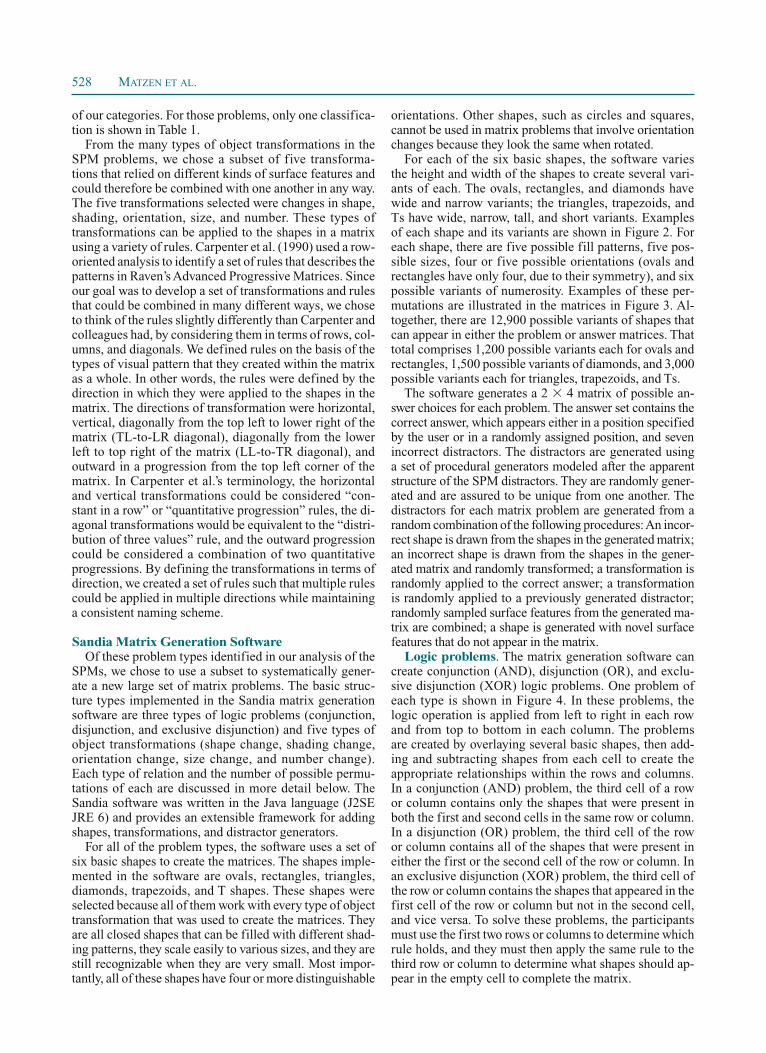
orientations. Other shapes, such as circles and squares, cannot be used in matrix problems that involve orientation changes because they look the same when rotated.
For each of the six basic shapes, the software varies the height and width of the shapes to create several vari-ants of each. The ovals, rectangles, and diamonds have wide and narrow variants; the triangles, trapezoids, and Ts have wide, narrow, tall, and short variants. Examples of each shape and its variants are shown in Figure 2. For each shape, there are five possible fill patterns, five pos-sible sizes, four or five possible orientations (ovals and rectangles have only four, due to their symmetry), and six possible variants of numerosity. Examples of these per-mutations are illustrated in the matrices in Figure 3. Al-together, there are 12,900 possible variants of shapes that can appear in either the problem or answer matrices. That total comprises 1,200 possible variants each for ovals and rectangles, 1,500 possible variants of diamonds, and 3,000 possible variants each for triangles, trapezoids, and Ts.
The software generates a 2 4 matrix of possible an-swer choices for each problem. The answer set contains the correct answer, which appears either in a position specified by the user or in a randomly assigned position, and seven incorrect distractors. The distractors are generated using a set of procedural generators modeled after the apparent structure of the SPM distractors. They are randomly gener-ated and are assured to be unique from one another. The distractors for each matrix problem are generated from a random combination of the following procedures: An incor-rect shape is drawn from the shapes in the generated matrix; an incorrect shape is drawn from the shapes in the gener-ated matrix and randomly transformed; a transformation is randomly applied to the correct answer; a transformation is randomly applied to a previously generated distractor; randomly sampled surface features from the generated ma-trix are combined; a shape is generated with novel surface features that do not appear in the matrix.
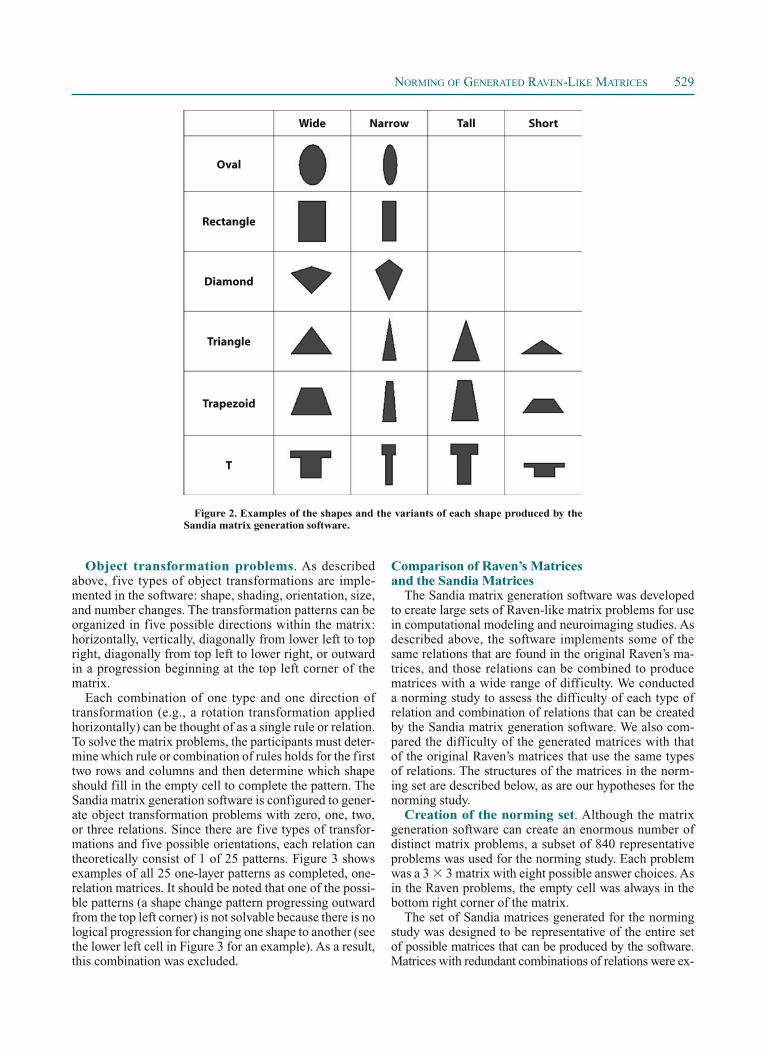
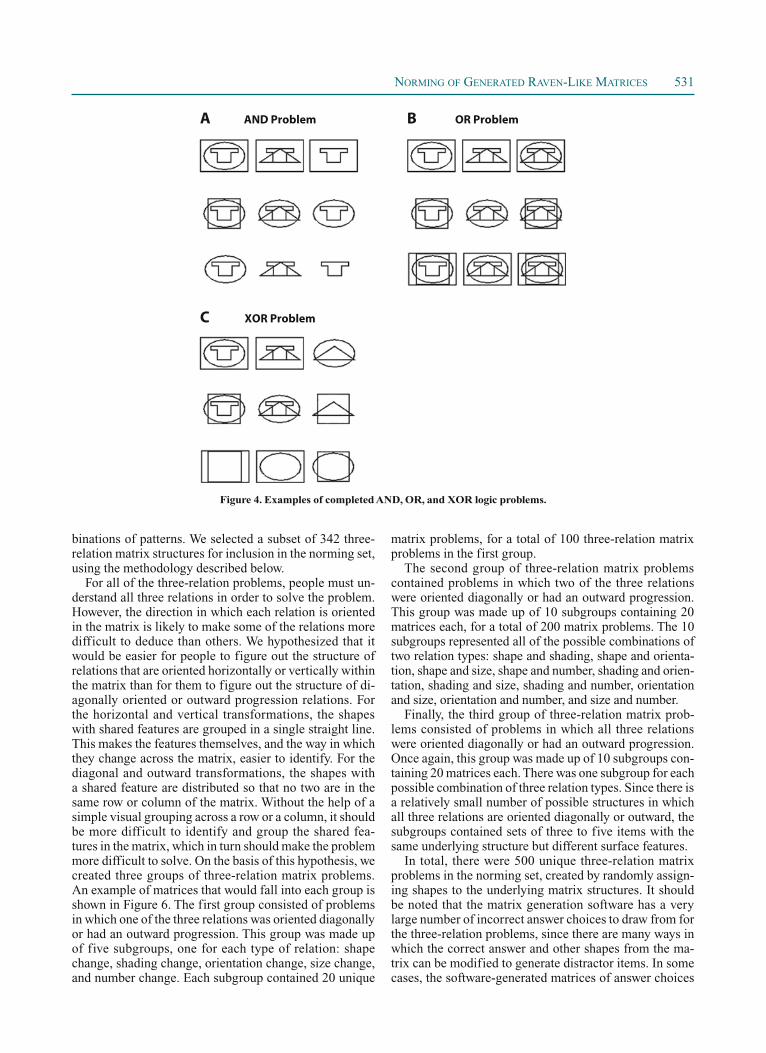
Logic problems. The matrix generation software can create conjunction (AND), disjunction (OR), and exclu-sive disjunction (XOR) logic problems. One problem of each type is shown in Figure 4. In these problems, the logic operation is applied from left to right in each row and from top to bottom in each column. The problems are created by overlaying several basic shapes, then add-ing and subtracting shapes from each cell to create the appropriate relationships within the rows and columns. In a conjunction (AND) problem, the third cell of a row or column contains only the shapes that were present in both the first and second cells in the same row or column. In a disjunction (OR) problem, the third cell of the row or column contains all of the shapes that were present in either the first or the second cell of the row or column. In an exclusive disjunction (XOR) problem, the third cell of the row or column contains the shapes that appeared in the first cell of the row or column but not in the second cell, and vice versa. To solve these problems, the participants must use the first two rows or columns to determine which rule holds, and they must then apply the same rule to the third row or column to determine what shapes should ap-pear in the empty cell to complete the matrix.
of our categories. For those problems, only one classifica-tion is shown in Table 1.
From the many types of object transformations in the SPM problems, we chose a subset of five transforma-tions that relied on different kinds of surface features and could therefore be combined with one another in any way. The five transformations selected were changes in shape, shading, orientation, size, and number. These types of transformations can be applied to the shapes in a matrix using a variety of rules. Carpenter et al. (1990) used a row- oriented analysis to identify a set of rules that describes the patterns in Raven’s Advanced Progressive Matrices. Since our goal was to develop a set of transformations and rules that could be combined in many different ways, we chose to think of the rules slightly differently than Carpenter and colleagues had, by considering them in terms of rows, col-umns, and diagonals. We defined rules on the basis of the types of visual pattern that they created within the matrix as a whole. In other words, the rules were defined by the direction in which they were applied to the shapes in the matrix. The directions of transformation were horizontal, vertical, diagonally from the top left to lower right of the matrix (TL-to-LR diagonal), diagonally from the lower left to top right of the matrix (LL-to-TR diagonal), and outward in a progression from the top left corner of the matrix. In Carpenter et al.’s terminology, the horizontal and vertical transformations could be considered “con-stant in a row” or “quantitative progression” rules, the di-agonal transformations would be equivalent to the “distri-bution of three values” rule, and the outward progression could be considered a combination of two quantitative progressions. By defining the transformations in terms of direction, we created a set of rules such that multiple rules could be applied in multiple directions while maintaining a consistent naming scheme.
Sandia Matrix Generation SoftwareOf these problem types identified in our analysis of the
SPMs, we chose to use a subset to systematically gener-ate a new large set of matrix problems. The basic struc-ture types implemented in the Sandia matrix generation software are three types of logic problems (conjunction, disjunction, and exclusive disjunction) and five types of object transformations (shape change, shading change, orientation change, size change, and number change). Each type of relation and the number of possible permu-tations of each are discussed in more detail below. The Sandia software was written in the Java language (J2SE JRE 6) and provides an extensible framework for adding shapes, transformations, and distractor generators.
For all of the problem types, the software uses a set of six basic shapes to create the matrices. The shapes imple-mented in the software are ovals, rectangles, triangles, diamonds, trapezoids, and T shapes. These shapes were selected because all of them work with every type of object transformation that was used to create the matrices. They are all closed shapes that can be filled with different shad-ing patterns, they scale easily to various sizes, and they are still recognizable when they are very small. Most impor-tantly, all of these shapes have four or more distinguishable
NORMING OF GENERATED RAVEN-LIKE MATRICES 529
Comparison of Raven’s Matrices and the Sandia Matrices
The Sandia matrix generation software was developed to create large sets of Raven-like matrix problems for use in computational modeling and neuroimaging studies. As described above, the software implements some of the same relations that are found in the original Raven’s ma-trices, and those relations can be combined to produce matrices with a wide range of difficulty. We conducted a norming study to assess the difficulty of each type of relation and combination of relations that can be created by the Sandia matrix generation software. We also com-pared the difficulty of the generated matrices with that of the original Raven’s matrices that use the same types of relations. The structures of the matrices in the norm-ing set are described below, as are our hypotheses for the norming study.
Creation of the norming set. Although the matrix generation software can create an enormous number of distinct matrix problems, a subset of 840 representative problems was used for the norming study. Each problem was a 3 3 matrix with eight possible answer choices. As in the Raven problems, the empty cell was always in the bottom right corner of the matrix.
The set of Sandia matrices generated for the norming study was designed to be representative of the entire set of possible matrices that can be produced by the software. Matrices with redundant combinations of relations were ex-
Object transformation problems. As described above, five types of object transformations are imple-mented in the software: shape, shading, orientation, size, and number changes. The transformation patterns can be organized in five possible directions within the matrix: horizontally, vertically, diagonally from lower left to top right, diagonally from top left to lower right, or outward in a progression beginning at the top left corner of the matrix.
Each combination of one type and one direction of transformation (e.g., a rotation transformation applied horizontally) can be thought of as a single rule or relation. To solve the matrix problems, the participants must deter-mine which rule or combination of rules holds for the first two rows and columns and then determine which shape should fill in the empty cell to complete the pattern. The Sandia matrix generation software is configured to gener-ate object transformation problems with zero, one, two, or three relations. Since there are five types of transfor-mations and five possible orientations, each relation can theoretically consist of 1 of 25 patterns. Figure 3 shows examples of all 25 one-layer patterns as completed, one-relation matrices. It should be noted that one of the possi-ble patterns (a shape change pattern progressing outward from the top left corner) is not solvable because there is no logical progression for changing one shape to another (see the lower left cell in Figure 3 for an example). As a result, this combination was excluded.
Wide Narrow Tall Short
Oval
Rectangle
Diamond
Triangle
Trapezoid
T
Figure 2. Examples of the shapes and the variants of each shape produced by the Sandia matrix generation software.
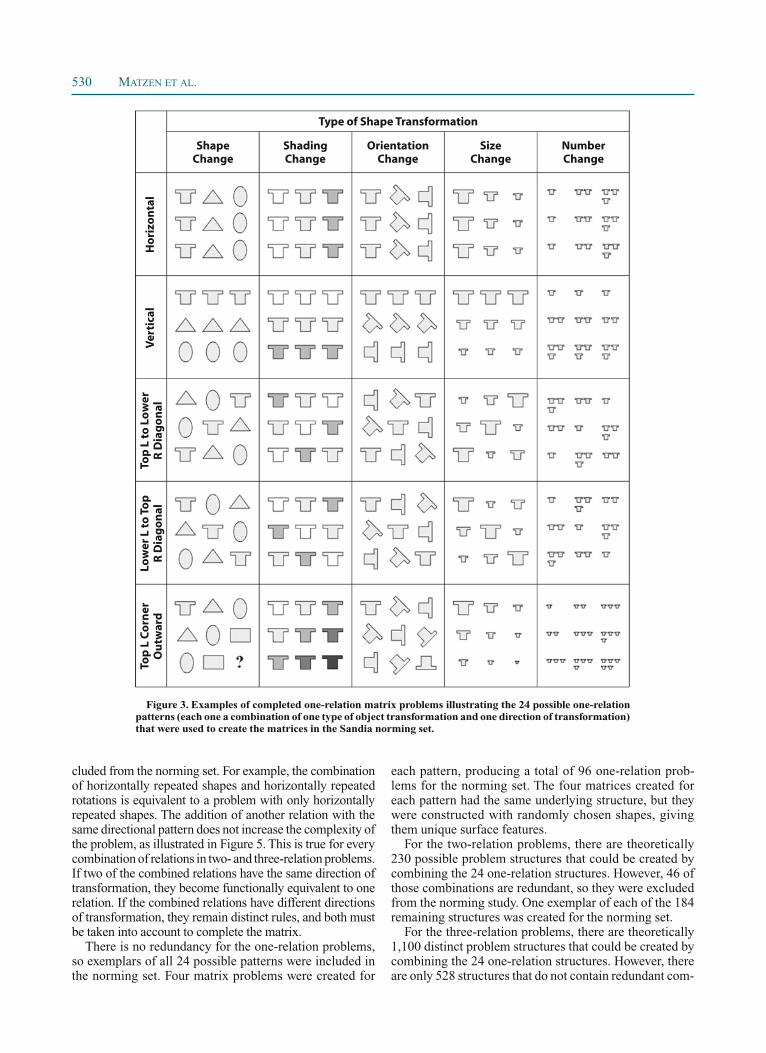
530 MATZEN ET AL.
each pattern, producing a total of 96 one-relation prob-lems for the norming set. The four matrices created for each pattern had the same underlying structure, but they were constructed with randomly chosen shapes, giving them unique surface features.
For the two-relation problems, there are theoretically 230 possible problem structures that could be created by combining the 24 one-relation structures. However, 46 of those combinations are redundant, so they were excluded from the norming study. One exemplar of each of the 184 remaining structures was created for the norming set.
For the three-relation problems, there are theoretically 1,100 distinct problem structures that could be created by combining the 24 one-relation structures. However, there are only 528 structures that do not contain redundant com-
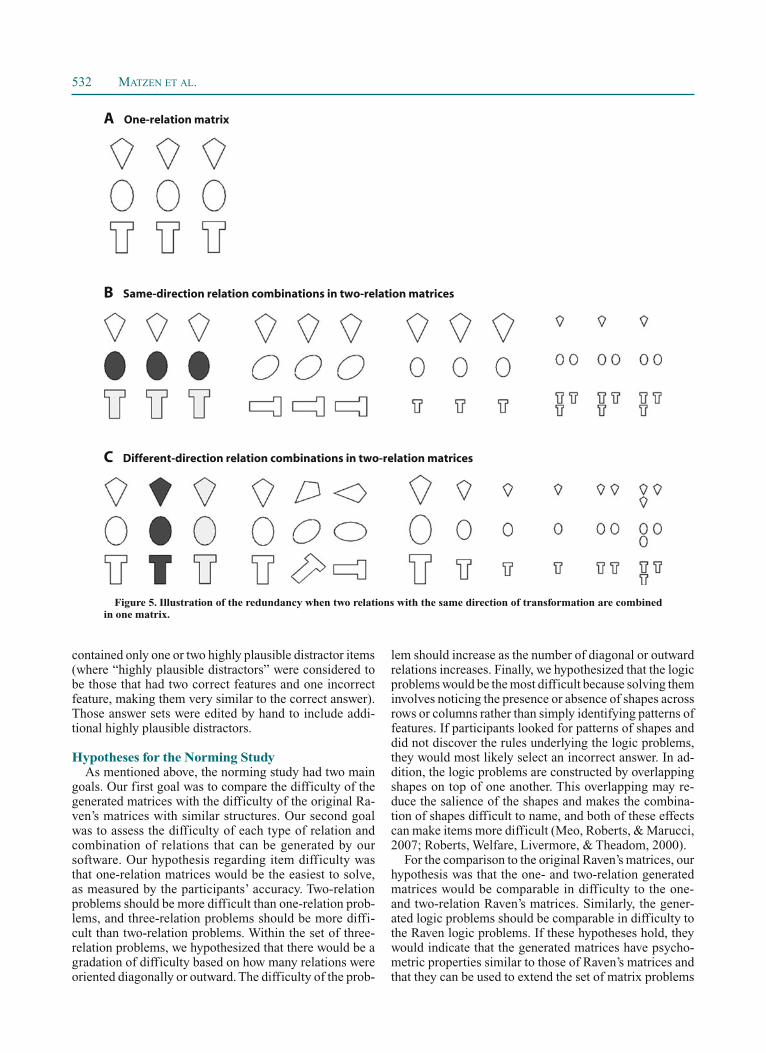
cluded from the norming set. For example, the combination of horizontally repeated shapes and horizontally repeated rotations is equivalent to a problem with only horizontally repeated shapes. The addition of another relation with the same directional pattern does not increase the complexity of the problem, as illustrated in Figure 5. This is true for every combination of relations in two- and three-relation problems. If two of the combined relations have the same direction of transformation, they become functionally equivalent to one relation. If the combined relations have different directions of transformation, they remain distinct rules, and both must be taken into account to complete the matrix.
There is no redundancy for the one-relation problems, so exemplars of all 24 possible patterns were included in the norming set. Four matrix problems were created for
Figure 3. Examples of completed one-relation matrix problems illustrating the 24 possible one-relation patterns (each one a combination of one type of object transformation and one direction of transformation) that were used to create the matrices in the Sandia norming set.
ShapeChange
ShadingChange
OrientationChange
SizeChange
NumberChange
Ho
rizo
nta
lV
erti
cal
Top
L t
o L
ow
erR
Dia
go
nal
Low
er L
to
To
pR
Dia
go
nal
Top
L C
orn
erO
utw
ard
Type of Shape Transformation
NORMING OF GENERATED RAVEN-LIKE MATRICES 531
matrix problems, for a total of 100 three-relation matrix problems in the first group.
The second group of three-relation matrix problems contained problems in which two of the three relations were oriented diagonally or had an outward progression. This group was made up of 10 subgroups containing 20 matrices each, for a total of 200 matrix problems. The 10 subgroups represented all of the possible combinations of two relation types: shape and shading, shape and orienta-tion, shape and size, shape and number, shading and orien-tation, shading and size, shading and number, orientation and size, orientation and number, and size and number.
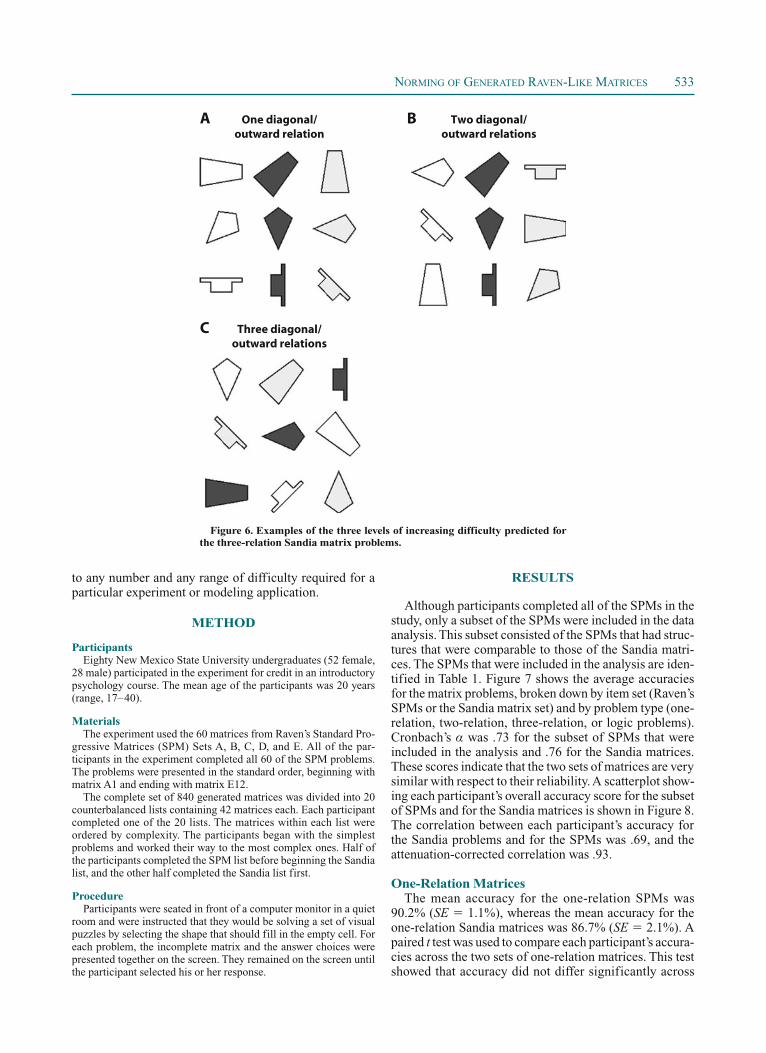
Finally, the third group of three-relation matrix prob-lems consisted of problems in which all three relations were oriented diagonally or had an outward progression. Once again, this group was made up of 10 subgroups con-taining 20 matrices each. There was one subgroup for each possible combination of three relation types. Since there is a relatively small number of possible structures in which all three relations are oriented diagonally or outward, the subgroups contained sets of three to five items with the same underlying structure but different surface features.
In total, there were 500 unique three-relation matrix problems in the norming set, created by randomly assign-ing shapes to the underlying matrix structures. It should be noted that the matrix generation software has a very large number of incorrect answer choices to draw from for the three-relation problems, since there are many ways in which the correct answer and other shapes from the ma-trix can be modified to generate distractor items. In some cases, the software-generated matrices of answer choices
binations of patterns. We selected a subset of 342 three-relation matrix structures for inclusion in the norming set, using the methodology described below.
For all of the three-relation problems, people must un-derstand all three relations in order to solve the problem. However, the direction in which each relation is oriented in the matrix is likely to make some of the relations more difficult to deduce than others. We hypothesized that it would be easier for people to figure out the structure of relations that are oriented horizontally or vertically within the matrix than for them to figure out the structure of di-agonally oriented or outward progression relations. For the horizontal and vertical transformations, the shapes with shared features are grouped in a single straight line. This makes the features themselves, and the way in which they change across the matrix, easier to identify. For the diagonal and outward transformations, the shapes with a shared feature are distributed so that no two are in the same row or column of the matrix. Without the help of a simple visual grouping across a row or a column, it should be more difficult to identify and group the shared fea-tures in the matrix, which in turn should make the problem more difficult to solve. On the basis of this hypothesis, we created three groups of three-relation matrix problems. An example of matrices that would fall into each group is shown in Figure 6. The first group consisted of problems in which one of the three relations was oriented diagonally or had an outward progression. This group was made up of five subgroups, one for each type of relation: shape change, shading change, orientation change, size change, and number change. Each subgroup contained 20 unique
AND ProblemA
XOR ProblemC
OR ProblemB
Figure 4. Examples of completed AND, OR, and XOR logic problems.
532 MATZEN ET AL.
lem should increase as the number of diagonal or outward relations increases. Finally, we hypothesized that the logic problems would be the most difficult because solving them involves noticing the presence or absence of shapes across rows or columns rather than simply identifying patterns of features. If participants looked for patterns of shapes and did not discover the rules underlying the logic problems, they would most likely select an incorrect answer. In ad-dition, the logic problems are constructed by overlapping shapes on top of one another. This overlapping may re-duce the salience of the shapes and makes the combina-tion of shapes difficult to name, and both of these effects can make items more difficult (Meo, Roberts, & Marucci, 2007; Roberts, Welfare, Livermore, & Theadom, 2000).
For the comparison to the original Raven’s matrices, our hypothesis was that the one- and two-relation generated matrices would be comparable in difficulty to the one- and two-relation Raven’s matrices. Similarly, the gener-ated logic problems should be comparable in difficulty to the Raven logic problems. If these hypotheses hold, they would indicate that the generated matrices have psycho-metric properties similar to those of Raven’s matrices and that they can be used to extend the set of matrix problems
contained only one or two highly plausible distractor items (where “highly plausible distractors” were considered to be those that had two correct features and one incorrect feature, making them very similar to the correct answer). Those answer sets were edited by hand to include addi-tional highly plausible distractors.
Hypotheses for the Norming StudyAs mentioned above, the norming study had two main
goals. Our first goal was to compare the difficulty of the generated matrices with the difficulty of the original Ra-ven’s matrices with similar structures. Our second goal was to assess the difficulty of each type of relation and combination of relations that can be generated by our software. Our hypothesis regarding item difficulty was that one-relation matrices would be the easiest to solve, as measured by the participants’ accuracy. Two-relation problems should be more difficult than one-relation prob-lems, and three-relation problems should be more diffi-cult than two-relation problems. Within the set of three-relation problems, we hypothesized that there would be a gradation of difficulty based on how many relations were oriented diagonally or outward. The difficulty of the prob-
A One-relation matrix
B Same-direction relation combinations in two-relation matrices
C Different-direction relation combinations in two-relation matrices
Figure 5. Illustration of the redundancy when two relations with the same direction of transformation are combined in one matrix.
NORMING OF GENERATED RAVEN-LIKE MATRICES 533
RESULTS
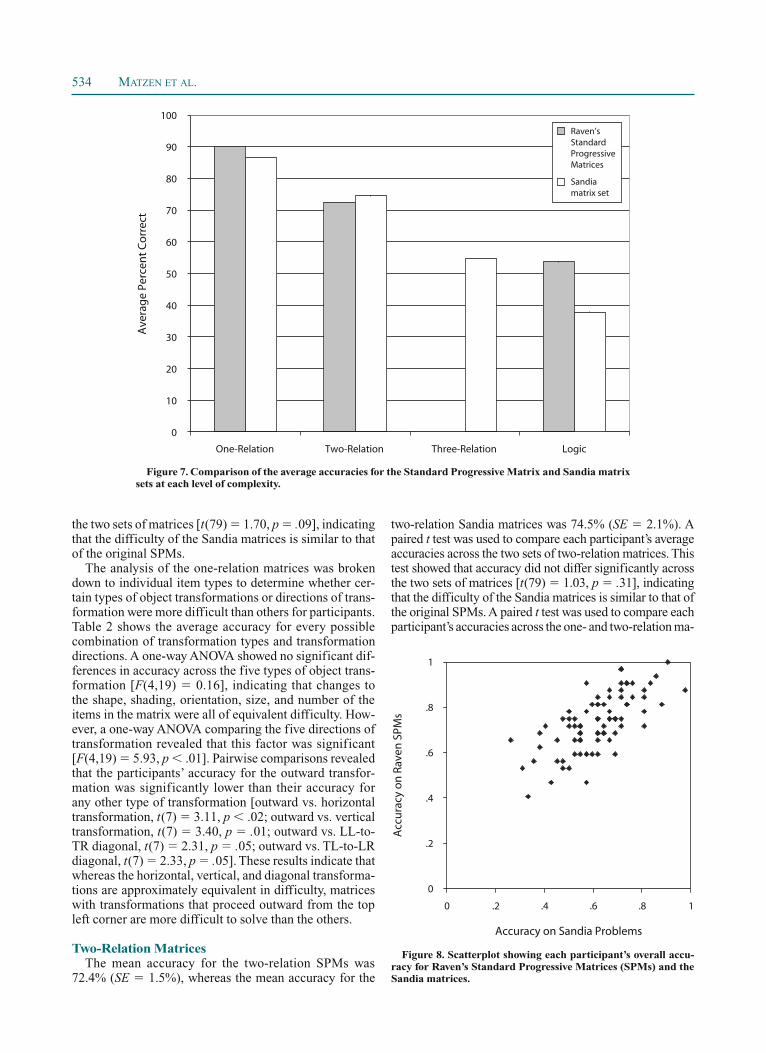
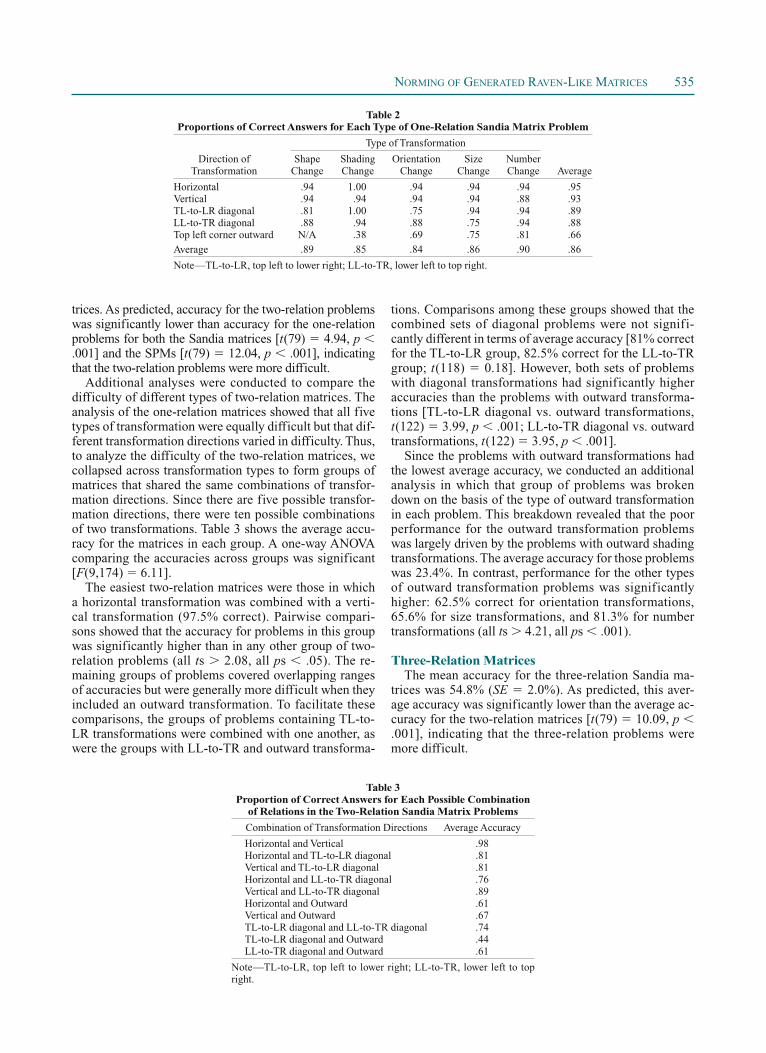
Although participants completed all of the SPMs in the study, only a subset of the SPMs were included in the data analysis. This subset consisted of the SPMs that had struc-tures that were comparable to those of the Sandia matri-ces. The SPMs that were included in the analysis are iden-tified in Table 1. Figure 7 shows the average accuracies for the matrix problems, broken down by item set (Raven’s SPMs or the Sandia matrix set) and by problem type (one-relation, two-relation, three-relation, or logic problems). Cronbach’s was .73 for the subset of SPMs that were included in the analysis and .76 for the Sandia matrices. These scores indicate that the two sets of matrices are very similar with respect to their reliability. A scatterplot show-ing each participant’s overall accuracy score for the subset of SPMs and for the Sandia matrices is shown in Figure 8. The correlation between each participant’s accuracy for the Sandia problems and for the SPMs was .69, and the attenuation-corrected correlation was .93.
One-Relation MatricesThe mean accuracy for the one-relation SPMs was
90.2% (SE 1.1%), whereas the mean accuracy for the one-relation Sandia matrices was 86.7% (SE 2.1%). A paired t test was used to compare each participant’s accura-cies across the two sets of one-relation matrices. This test showed that accuracy did not differ significantly across
to any number and any range of difficulty required for a particular experiment or modeling application.
METHOD
ParticipantsEighty New Mexico State University undergraduates (52 female,
28 male) participated in the experiment for credit in an introductory psychology course. The mean age of the participants was 20 years (range, 17–40).
MaterialsThe experiment used the 60 matrices from Raven’s Standard Pro-
gressive Matrices (SPM) Sets A, B, C, D, and E. All of the par-ticipants in the experiment completed all 60 of the SPM problems. The problems were presented in the standard order, beginning with matrix A1 and ending with matrix E12.
The complete set of 840 generated matrices was divided into 20 counterbalanced lists containing 42 matrices each. Each participant completed one of the 20 lists. The matrices within each list were ordered by complexity. The participants began with the simplest problems and worked their way to the most complex ones. Half of the participants completed the SPM list before beginning the Sandia list, and the other half completed the Sandia list first.
ProcedureParticipants were seated in front of a computer monitor in a quiet
room and were instructed that they would be solving a set of visual puzzles by selecting the shape that should fill in the empty cell. For each problem, the incomplete matrix and the answer choices were presented together on the screen. They remained on the screen until the participant selected his or her response.
One diagonal/outward relation
A
Three diagonal/outward relations
C
Two diagonal/outward relations
B
Figure 6. Examples of the three levels of increasing difficulty predicted for the three-relation Sandia matrix problems.
534 MATZEN ET AL.
two- relation Sandia matrices was 74.5% (SE 2.1%). A paired t test was used to compare each participant’s average accuracies across the two sets of two-relation matrices. This test showed that accuracy did not differ significantly across the two sets of matrices [t(79) 1.03, p .31], indicating that the difficulty of the Sandia matrices is similar to that of the original SPMs. A paired t test was used to compare each participant’s accuracies across the one- and two-relation ma-
the two sets of matrices [t(79) 1.70, p .09], indicating that the difficulty of the Sandia matrices is similar to that of the original SPMs.
The analysis of the one-relation matrices was broken down to individual item types to determine whether cer-tain types of object transformations or directions of trans-formation were more difficult than others for participants. Table 2 shows the average accuracy for every possible combination of transformation types and transformation directions. A one-way ANOVA showed no significant dif-ferences in accuracy across the five types of object trans-formation [F(4,19) 0.16], indicating that changes to the shape, shading, orientation, size, and number of the items in the matrix were all of equivalent difficulty. How-ever, a one-way ANOVA comparing the five directions of transformation revealed that this factor was significant [F(4,19) 5.93, p .01]. Pairwise comparisons revealed that the participants’ accuracy for the outward transfor-mation was significantly lower than their accuracy for any other type of transformation [outward vs. horizontal transformation, t(7) 3.11, p .02; outward vs. vertical transformation, t(7) 3.40, p .01; outward vs. LL-to-TR diagonal, t(7) 2.31, p .05; outward vs. TL-to-LR diagonal, t(7) 2.33, p .05]. These results indicate that whereas the horizontal, vertical, and diagonal transforma-tions are approximately equivalent in difficulty, matrices with transformations that proceed outward from the top left corner are more difficult to solve than the others.
Two-Relation MatricesThe mean accuracy for the two-relation SPMs was
72.4% (SE 1.5%), whereas the mean accuracy for the
Acc
ura
cy o
n R
aven
SPM
s
0
.2
.4
.6
.8
1
0 .2 .4 .6 .8 1
Accuracy on Sandia Problems
Figure 8. Scatterplot showing each participant’s overall accu-racy for Raven’s Standard Progressive Matrices (SPMs) and the Sandia matrices.
Ave
rag
e Pe
rcen
t C
orr
ect
0
10
20
30
40
50
60
70
80
90
100
One-Relation Two-Relation Three-Relation Logic
Raven’sStandardProgressiveMatrices
Sandiamatrix set
Figure 7. Comparison of the average accuracies for the Standard Progressive Matrix and Sandia matrix sets at each level of complexity.
NORMING OF GENERATED RAVEN-LIKE MATRICES 535
tions. Comparisons among these groups showed that the combined sets of diagonal problems were not signifi-cantly different in terms of average accuracy [81% correct for the TL-to-LR group, 82.5% correct for the LL-to-TR group; t(118) 0.18]. However, both sets of problems with diagonal transformations had significantly higher accuracies than the problems with outward transforma-tions [TL-to-LR diagonal vs. outward transformations, t(122) 3.99, p .001; LL-to-TR diagonal vs. outward transformations, t(122) 3.95, p .001].
Since the problems with outward transformations had the lowest average accuracy, we conducted an additional analysis in which that group of problems was broken down on the basis of the type of outward transformation in each problem. This breakdown revealed that the poor performance for the outward transformation problems was largely driven by the problems with outward shading transformations. The average accuracy for those problems was 23.4%. In contrast, performance for the other types of outward transformation problems was significantly higher: 62.5% correct for orientation transformations, 65.6% for size transformations, and 81.3% for number transformations (all ts 4.21, all ps .001).
Three-Relation MatricesThe mean accuracy for the three-relation Sandia ma-
trices was 54.8% (SE 2.0%). As predicted, this aver-age accuracy was significantly lower than the average ac-curacy for the two-relation matrices [t(79) 10.09, p .001], indicating that the three-relation problems were more difficult.
trices. As predicted, accuracy for the two-relation problems was significantly lower than accuracy for the one-relation problems for both the Sandia matrices [t(79) 4.94, p .001] and the SPMs [t(79) 12.04, p .001], indicating that the two-relation problems were more difficult.
Additional analyses were conducted to compare the difficulty of different types of two-relation matrices. The analysis of the one-relation matrices showed that all five types of transformation were equally difficult but that dif-ferent transformation directions varied in difficulty. Thus, to analyze the difficulty of the two-relation matrices, we collapsed across transformation types to form groups of matrices that shared the same combinations of transfor-mation directions. Since there are five possible transfor-mation directions, there were ten possible combinations of two transformations. Table 3 shows the average accu-racy for the matrices in each group. A one-way ANOVA comparing the accuracies across groups was significant [F(9,174) 6.11].
The easiest two-relation matrices were those in which a horizontal transformation was combined with a verti-cal transformation (97.5% correct). Pairwise compari-sons showed that the accuracy for problems in this group was significantly higher than in any other group of two- relation problems (all ts 2.08, all ps .05). The re-maining groups of problems covered overlapping ranges of accuracies but were generally more difficult when they included an outward transformation. To facilitate these comparisons, the groups of problems containing TL-to-LR transformations were combined with one another, as were the groups with LL-to-TR and outward transforma-
Table 2 Proportions of Correct Answers for Each Type of One-Relation Sandia Matrix Problem
Type of Transformation
Direction of Transformation
Shape Change
Shading Change
Orientation Change
Size Change
Number Change
Average
Horizontal .94 1.00 .94 .94 .94 .95Vertical .94 .94 .94 .94 .88 .93TL-to-LR diagonal .81 1.00 .75 .94 .94 .89LL-to-TR diagonal .88 .94 .88 .75 .94 .88Top left corner outward N/A .38 .69 .75 .81 .66
Average .89 .85 .84 .86 .90 .86
Note—TL-to-LR, top left to lower right; LL-to-TR, lower left to top right.
Table 3 Proportion of Correct Answers for Each Possible Combination
of Relations in the Two-Relation Sandia Matrix Problems
Combination of Transformation Directions Average Accuracy
Horizontal and Vertical .98Horizontal and TL-to-LR diagonal .81Vertical and TL-to-LR diagonal .81Horizontal and LL-to-TR diagonal .76Vertical and LL-to-TR diagonal .89Horizontal and Outward .61Vertical and Outward .67TL-to-LR diagonal and LL-to-TR diagonal .74TL-to-LR diagonal and Outward .44LL-to-TR diagonal and Outward .61
Note—TL-to-LR, top left to lower right; LL-to-TR, lower left to top right.
536 MATZEN ET AL.
test showed that accuracy was significantly lower for the Sandia logic problems than for the SPM logic problems [t(79) 5.00, p .001], indicating that the Sandia logic problems were more difficult than the original SPMs. As predicted, the average accuracy was significantly lower for the Sandia logic problems than for the three-relation matrices [t(79) 5.67, p .001].
For the Sandia logic problems, each participant com-pleted an AND problem, an OR problem, and an XOR problem. The participants’ average accuracy was highest for the OR problems (46.3% correct) and lower for the AND or XOR problems (both 33.8% correct). However, this difference in accuracy was not significant.
In the problems from Raven’s SPM set, each partici-pant completed one AND problem, three OR problems, and five XOR problems. Paired t tests were used to com-pare the participants’ performance for each type of logic problem across the Sandia and SPM matrices. The partici-pants’ performance on the OR problems from the SPM set (75.8% correct) was significantly higher than their perfor-mance on the OR problems from the Sandia set [t(79) 4.82, p .001]. The average accuracy for the AND prob-lems in the SPM set (28.8% correct) was not significantly different from that of the AND problems in the Sandia set [t(79) 0.81, p .42]. Finally, average accuracy was marginally higher for the XOR problems in the SPM set (45.3% correct) than for the XOR problems in the Sandia set [t(79) 1.99, p .05]. These results indicate that the overall differences in accuracy between the two sets of logic problems are largely driven by participants’ much higher average accuracy for the OR problems in the SPM set. This most likely occurred because the three OR prob-lems in the SPM set are quite simple, using only one or two shapes. Those in the Sandia set often have up to four shapes, making them visually more complex, and perhaps more difficult to solve as a result.
Analysis of Incorrect AnswersThe analyses of the participants’ accuracies for the
different types of matrix problems showed that their per-formance was quite similar for the Sandia and SPM one- relation problems. The performance was also very similar for the Sandia and SPM two-relation problems. We con-ducted an analysis of the participants’ incorrect answers to these problems to determine whether or not they were using the same strategies to solve problems from the San-dia and SPM sets.
We began by categorizing the participants’ incorrect responses to the one-relation matrix problems to deter-mine what types of distractors were chosen most often.
As discussed above, Raven’s SPMs have no counterpart of the three-relation matrices. Our goal in creating the San-dia matrix set was to produce a very large set of matrices with a wide range of difficulty levels, so the three-relation matrices were included to expand the range of difficulty for the matrix set in a systematic way. We hypothesized that the difficulty of the three-relation matrices would increase as the number of diagonal or outward transformations in the matrix increased. The three-relation matrices could have one, two, or three relations that consisted of diagonal or outward transformations. The average accuracy for each type of three-relation matrix is shown in Table 4. As pre-dicted, the accuracy for the problems with only one diago-nal or outward transformation (74.0%) was significantly higher than the accuracy for problems with two diagonal or outward transformations [53.0%; t(79) 6.74, p .001]. Similarly, the accuracy for the problems with two diagonal or outward transformations was significantly higher than the accuracy for problems with three diagonal or outward transformations [47.0%; t(79) 2.58, p .01].
Logic MatricesThe mean accuracy for the SPMs involving logic op-
erations was 53.6% (SE 2.9%), whereas the mean ac-curacy for the Sandia matrices involving logic operations was 37.9% (SE 3.0%). The mean accuracies for each type of logic problem within the two sets are shown in Table 5. A paired t test was used to compare each partici-pant’s accuracies across the two sets of logic matrices. This
Table 4 Proportion of Correct Answers for Each Type
of Three-Relation Sandia Matrix Problem
Direction of Transformation
Diagonal or Outward Transformation Types
Average Accuracy
One Diagonal Shape .70or Outward Shading .79Transformation Orientation .76
Size .63Number .83
Average .74
Two Diagonal Shape and Shading .50or Outward Shape and Orientation .56Transformations Shape and Size .49
Shape and Number .64Shading and Orientation .53Shading and Size .43Shading and Number .59Orientation and Size .44Orientation and Number .63Size and Number .51
Average .53
Three Diagonal Shape, Shading, and Orientation .31or Outward Shape, Shading, and Size .33Transformations Shape, Shading, and Number .65
Shape, Orientation, and Size .41Shape, Orientation, and Number .63Shape, Size, and Number .63Shading, Orientation, and Size .39Shading, Orientation, and Number .56Shading, Size, and Number .35Orientation, Size, and Number .45
Average .47
Table 5 Proportion of Correct Answers for Each Type
of Logic Matrix Problem
Logic Problem Type Raven’s SPMs Sandia Matrices
AND .29 .34OR .76 .46XOR .45 .34
Average .54 .38
NORMING OF GENERATED RAVEN-LIKE MATRICES 537
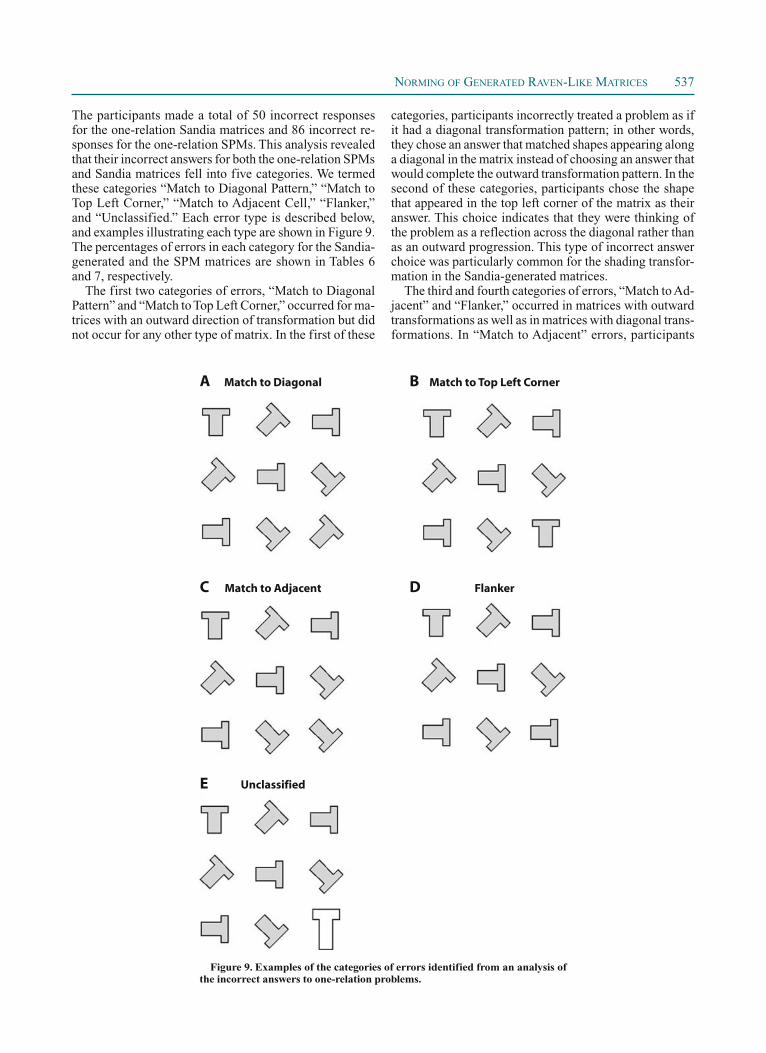
categories, participants incorrectly treated a problem as if it had a diagonal transformation pattern; in other words, they chose an answer that matched shapes appearing along a diagonal in the matrix instead of choosing an answer that would complete the outward transformation pattern. In the second of these categories, participants chose the shape that appeared in the top left corner of the matrix as their answer. This choice indicates that they were thinking of the problem as a reflection across the diagonal rather than as an outward progression. This type of incorrect answer choice was particularly common for the shading transfor-mation in the Sandia-generated matrices.
The third and fourth categories of errors, “Match to Ad-jacent” and “Flanker,” occurred in matrices with outward transformations as well as in matrices with diagonal trans-formations. In “Match to Adjacent” errors, participants
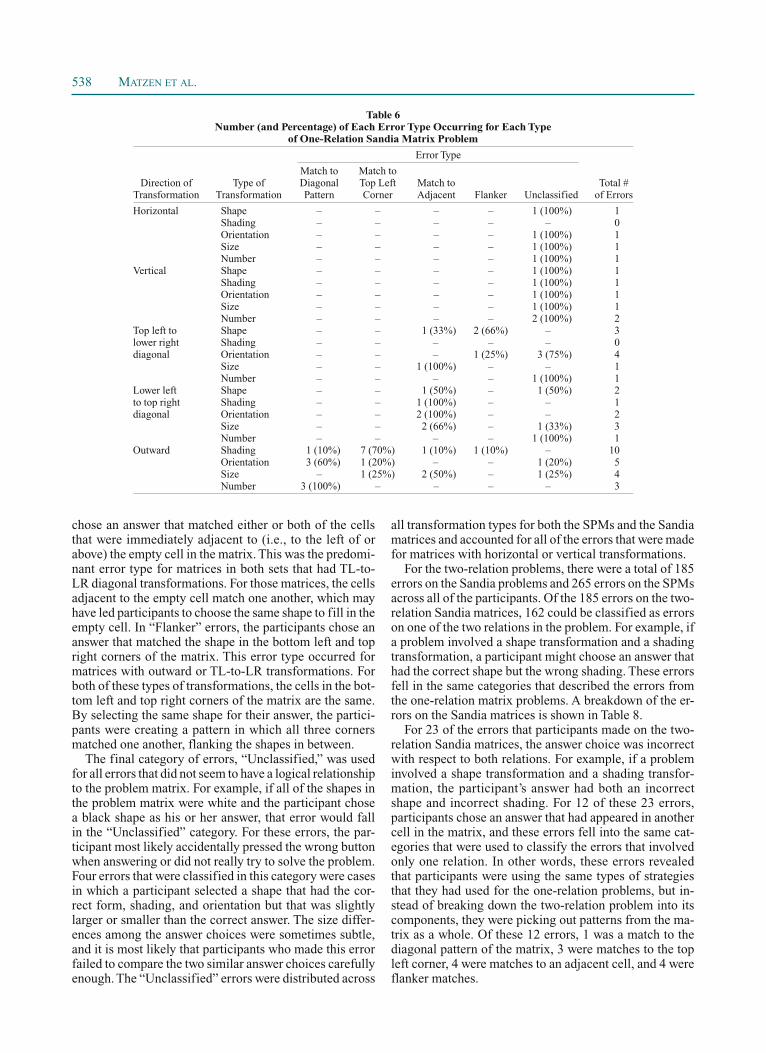
The participants made a total of 50 incorrect responses for the one-relation Sandia matrices and 86 incorrect re-sponses for the one-relation SPMs. This analysis revealed that their incorrect answers for both the one-relation SPMs and Sandia matrices fell into five categories. We termed these categories “Match to Diagonal Pattern,” “Match to Top Left Corner,” “Match to Adjacent Cell,” “Flanker,” and “Unclassified.” Each error type is described below, and examples illustrating each type are shown in Figure 9. The percentages of errors in each category for the Sandia-generated and the SPM matrices are shown in Tables 6 and 7, respectively.
The first two categories of errors, “Match to Diagonal Pattern” and “Match to Top Left Corner,” occurred for ma-trices with an outward direction of transformation but did not occur for any other type of matrix. In the first of these
A Match to Diagonal B Match to Top Left Corner
C Match to Adjacent
E Unclassified
D Flanker
Figure 9. Examples of the categories of errors identified from an analysis of the incorrect answers to one-relation problems.
538 MATZEN ET AL.
all transformation types for both the SPMs and the Sandia matrices and accounted for all of the errors that were made for matrices with horizontal or vertical transformations.
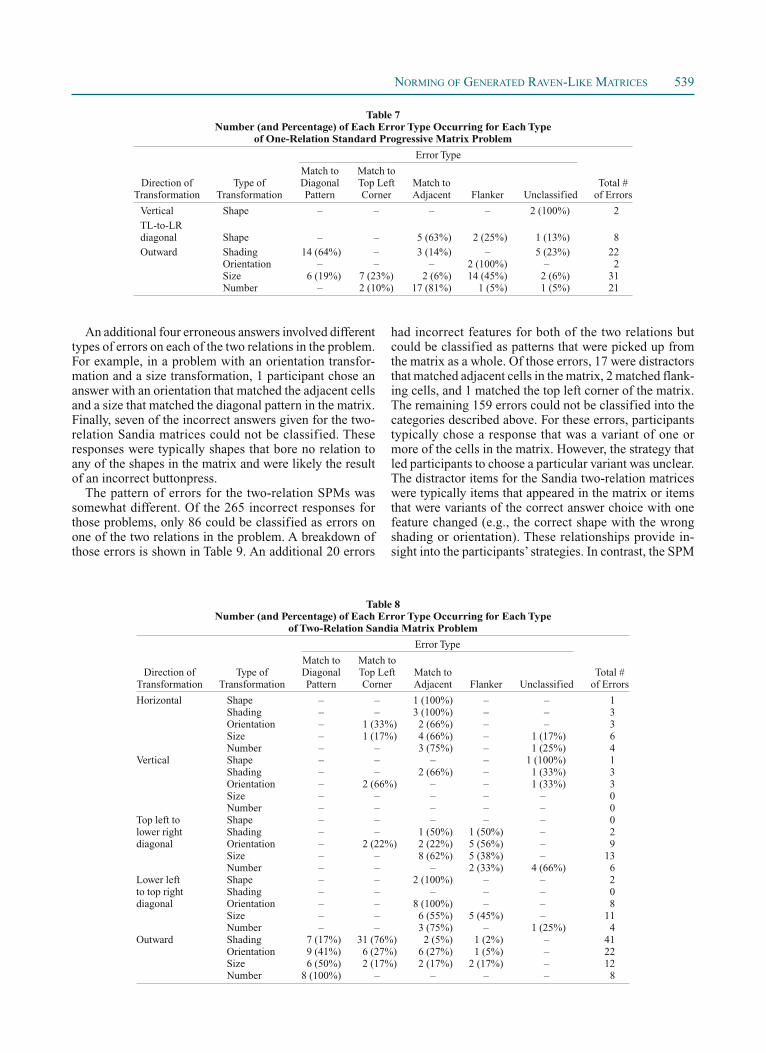
For the two-relation problems, there were a total of 185 errors on the Sandia problems and 265 errors on the SPMs across all of the participants. Of the 185 errors on the two-relation Sandia matrices, 162 could be classified as errors on one of the two relations in the problem. For example, if a problem involved a shape transformation and a shading transformation, a participant might choose an answer that had the correct shape but the wrong shading. These errors fell in the same categories that described the errors from the one-relation matrix problems. A breakdown of the er-rors on the Sandia matrices is shown in Table 8.
For 23 of the errors that participants made on the two-relation Sandia matrices, the answer choice was incorrect with respect to both relations. For example, if a problem involved a shape transformation and a shading transfor-mation, the participant’s answer had both an incorrect shape and incorrect shading. For 12 of these 23 errors, participants chose an answer that had appeared in another cell in the matrix, and these errors fell into the same cat-egories that were used to classify the errors that involved only one relation. In other words, these errors revealed that participants were using the same types of strategies that they had used for the one-relation problems, but in-stead of breaking down the two-relation problem into its components, they were picking out patterns from the ma-trix as a whole. Of these 12 errors, 1 was a match to the diagonal pattern of the matrix, 3 were matches to the top left corner, 4 were matches to an adjacent cell, and 4 were flanker matches.
chose an answer that matched either or both of the cells that were immediately adjacent to (i.e., to the left of or above) the empty cell in the matrix. This was the predomi-nant error type for matrices in both sets that had TL-to-LR diagonal transformations. For those matrices, the cells adjacent to the empty cell match one another, which may have led participants to choose the same shape to fill in the empty cell. In “Flanker” errors, the participants chose an answer that matched the shape in the bottom left and top right corners of the matrix. This error type occurred for matrices with outward or TL-to-LR transformations. For both of these types of transformations, the cells in the bot-tom left and top right corners of the matrix are the same. By selecting the same shape for their answer, the partici-pants were creating a pattern in which all three corners matched one another, flanking the shapes in between.
The final category of errors, “Unclassified,” was used for all errors that did not seem to have a logical relationship to the problem matrix. For example, if all of the shapes in the problem matrix were white and the participant chose a black shape as his or her answer, that error would fall in the “Unclassified” category. For these errors, the par-ticipant most likely accidentally pressed the wrong button when answering or did not really try to solve the problem. Four errors that were classified in this category were cases in which a participant selected a shape that had the cor-rect form, shading, and orientation but that was slightly larger or smaller than the correct answer. The size differ-ences among the answer choices were sometimes subtle, and it is most likely that participants who made this error failed to compare the two similar answer choices carefully enough. The “Unclassified” errors were distributed across
Table 6 Number (and Percentage) of Each Error Type Occurring for Each Type
of One-Relation Sandia Matrix Problem
Error Type
Direction of
Transformation
Type of
Transformation
Match to Diagonal Pattern
Match to Top Left Corner
Match to Adjacent
Flanker
Unclassified
Total #
of Errors
Horizontal Shape – – – – 1 (100%) 1Shading – – – – – 0Orientation – – – – 1 (100%) 1Size – – – – 1 (100%) 1Number – – – – 1 (100%) 1
Vertical Shape – – – – 1 (100%) 1Shading – – – – 1 (100%) 1Orientation – – – – 1 (100%) 1Size – – – – 1 (100%) 1Number – – – – 2 (100%) 2
Top left to lower right diagonal
Shape – – 1 (33%) 2 (66%) – 3Shading – – – – – 0Orientation – – – 1 (25%) 3 (75%) 4Size – – 1 (100%) – – 1Number – – – – 1 (100%) 1
Lower left to top right diagonal
Shape – – 1 (50%) – 1 (50%) 2Shading – – 1 (100%) – – 1Orientation – – 2 (100%) – – 2Size – – 2 (66%) – 1 (33%) 3Number – – – – 1 (100%) 1
Outward Shading 1 (10%) 7 (70%) 1 (10%) 1 (10%) – 10Orientation 3 (60%) 1 (20%) – – 1 (20%) 5Size – 1 (25%) 2 (50%) – 1 (25%) 4
Number 3 (100%) – – – – 3
NORMING OF GENERATED RAVEN-LIKE MATRICES 539
had incorrect features for both of the two relations but could be classified as patterns that were picked up from the matrix as a whole. Of those errors, 17 were distractors that matched adjacent cells in the matrix, 2 matched flank-ing cells, and 1 matched the top left corner of the matrix. The remaining 159 errors could not be classified into the categories described above. For these errors, participants typically chose a response that was a variant of one or more of the cells in the matrix. However, the strategy that led participants to choose a particular variant was unclear. The distractor items for the Sandia two-relation matrices were typically items that appeared in the matrix or items that were variants of the correct answer choice with one feature changed (e.g., the correct shape with the wrong shading or orientation). These relationships provide in-sight into the participants’ strategies. In contrast, the SPM
An additional four erroneous answers involved different types of errors on each of the two relations in the problem. For example, in a problem with an orientation transfor-mation and a size transformation, 1 participant chose an answer with an orientation that matched the adjacent cells and a size that matched the diagonal pattern in the matrix. Finally, seven of the incorrect answers given for the two-relation Sandia matrices could not be classified. These responses were typically shapes that bore no relation to any of the shapes in the matrix and were likely the result of an incorrect buttonpress.
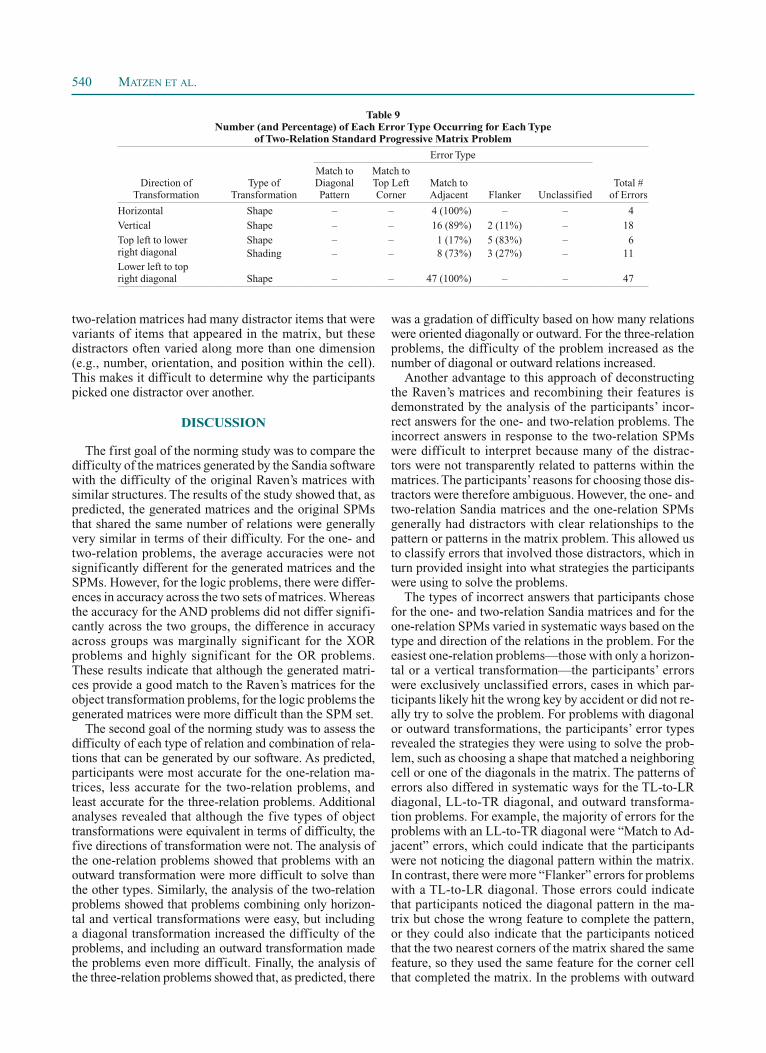
The pattern of errors for the two-relation SPMs was somewhat different. Of the 265 incorrect responses for those problems, only 86 could be classified as errors on one of the two relations in the problem. A breakdown of those errors is shown in Table 9. An additional 20 errors
Table 7 Number (and Percentage) of Each Error Type Occurring for Each Type
of One-Relation Standard Progressive Matrix Problem
Error Type
Direction of
Transformation
Type of
Transformation
Match to Diagonal Pattern
Match to Top Left Corner
Match to Adjacent
Flanker
Unclassified
Total #
of Errors
Vertical Shape – – – – 2 (100%) 2
TL-to-LR diagonal
Shape
–
–
5 (63%)
2 (25%)
1 (13%)
8
Outward Shading 14 (64%) – 3 (14%) – 5 (23%) 22Orientation – – – 2 (100%) – 2Size 6 (19%) 7 (23%) 2 (6%) 14 (45%) 2 (6%) 31
Number – 2 (10%) 17 (81%) 1 (5%) 1 (5%) 21
Table 8 Number (and Percentage) of Each Error Type Occurring for Each Type
of Two-Relation Sandia Matrix Problem
Error Type
Direction of
Transformation
Type of
Transformation
Match to Diagonal Pattern
Match to Top Left Corner
Match to Adjacent
Flanker
Unclassified
Total #
of Errors
Horizontal Shape – – 1 (100%) – – 1Shading – – 3 (100%) – – 3Orientation – 1 (33%) 2 (66%) – – 3Size – 1 (17%) 4 (66%) – 1 (17%) 6Number – – 3 (75%) – 1 (25%) 4
Vertical Shape – – – – 1 (100%) 1Shading – – 2 (66%) – 1 (33%) 3Orientation – 2 (66%) – – 1 (33%) 3Size – – – – – 0Number – – – – – 0
Top left to lower right diagonal
Shape – – – – – 0Shading – – 1 (50%) 1 (50%) – 2Orientation – 2 (22%) 2 (22%) 5 (56%) – 9Size – – 8 (62%) 5 (38%) – 13Number – – – 2 (33%) 4 (66%) 6
Lower left to top right diagonal
Shape – – 2 (100%) – – 2Shading – – – – – 0Orientation – – 8 (100%) – – 8Size – – 6 (55%) 5 (45%) – 11Number – – 3 (75%) – 1 (25%) 4
Outward Shading 7 (17%) 31 (76%) 2 (5%) 1 (2%) – 41Orientation 9 (41%) 6 (27%) 6 (27%) 1 (5%) – 22Size 6 (50%) 2 (17%) 2 (17%) 2 (17%) – 12
Number 8 (100%) – – – – 8
540 MATZEN ET AL.
was a gradation of difficulty based on how many relations were oriented diagonally or outward. For the three-relation problems, the difficulty of the problem increased as the number of diagonal or outward relations increased.
Another advantage to this approach of deconstructing the Raven’s matrices and recombining their features is demonstrated by the analysis of the participants’ incor-rect answers for the one- and two-relation problems. The incorrect answers in response to the two-relation SPMs were difficult to interpret because many of the distrac-tors were not transparently related to patterns within the matrices. The participants’ reasons for choosing those dis-tractors were therefore ambiguous. However, the one- and two-relation Sandia matrices and the one-relation SPMs generally had distractors with clear relationships to the pattern or patterns in the matrix problem. This allowed us to classify errors that involved those distractors, which in turn provided insight into what strategies the participants were using to solve the problems.
The types of incorrect answers that participants chose for the one- and two-relation Sandia matrices and for the one-relation SPMs varied in systematic ways based on the type and direction of the relations in the problem. For the easiest one-relation problems—those with only a horizon-tal or a vertical transformation—the participants’ errors were exclusively unclassified errors, cases in which par-ticipants likely hit the wrong key by accident or did not re-ally try to solve the problem. For problems with diagonal or outward transformations, the participants’ error types revealed the strategies they were using to solve the prob-lem, such as choosing a shape that matched a neighboring cell or one of the diagonals in the matrix. The patterns of errors also differed in systematic ways for the TL-to-LR diagonal, LL-to-TR diagonal, and outward transforma-tion problems. For example, the majority of errors for the problems with an LL-to-TR diagonal were “Match to Ad-jacent” errors, which could indicate that the participants were not noticing the diagonal pattern within the matrix. In contrast, there were more “Flanker” errors for problems with a TL-to-LR diagonal. Those errors could indicate that participants noticed the diagonal pattern in the ma-trix but chose the wrong feature to complete the pattern, or they could also indicate that the participants noticed that the two nearest corners of the matrix shared the same feature, so they used the same feature for the corner cell that completed the matrix. In the problems with outward
two-relation matrices had many distractor items that were variants of items that appeared in the matrix, but these distractors often varied along more than one dimension (e.g., number, orientation, and position within the cell). This makes it difficult to determine why the participants picked one distractor over another.
DISCUSSION
The first goal of the norming study was to compare the difficulty of the matrices generated by the Sandia software with the difficulty of the original Raven’s matrices with similar structures. The results of the study showed that, as predicted, the generated matrices and the original SPMs that shared the same number of relations were generally very similar in terms of their difficulty. For the one- and two-relation problems, the average accuracies were not significantly different for the generated matrices and the SPMs. However, for the logic problems, there were differ-ences in accuracy across the two sets of matrices. Whereas the accuracy for the AND problems did not differ signifi-cantly across the two groups, the difference in accuracy across groups was marginally significant for the XOR problems and highly significant for the OR problems. These results indicate that although the generated matri-ces provide a good match to the Raven’s matrices for the object transformation problems, for the logic problems the generated matrices were more difficult than the SPM set.
The second goal of the norming study was to assess the difficulty of each type of relation and combination of rela-tions that can be generated by our software. As predicted, participants were most accurate for the one-relation ma-trices, less accurate for the two-relation problems, and least accurate for the three-relation problems. Additional analyses revealed that although the five types of object transformations were equivalent in terms of difficulty, the five directions of transformation were not. The analysis of the one-relation problems showed that problems with an outward transformation were more difficult to solve than the other types. Similarly, the analysis of the two-relation problems showed that problems combining only horizon-tal and vertical transformations were easy, but including a diagonal transformation increased the difficulty of the problems, and including an outward transformation made the problems even more difficult. Finally, the analysis of the three-relation problems showed that, as predicted, there
Table 9 Number (and Percentage) of Each Error Type Occurring for Each Type
of Two-Relation Standard Progressive Matrix Problem
Error Type
Direction of
Transformation
Type of
Transformation
Match to Diagonal Pattern
Match to Top Left Corner
Match to Adjacent
Flanker
Unclassified
Total #
of Errors
Horizontal Shape – – 4 (100%) – – 4
Vertical Shape – – 16 (89%) 2 (11%) – 18
Top left to lower right diagonal
Shape – – 1 (17%) 5 (83%) – 6Shading – – 8 (73%) 3 (27%) – 11
Lower left to top right diagonal
Shape
–
–
47 (100%)
–
–
47
NORMING OF GENERATED RAVEN-LIKE MATRICES 541
The norming study showed that researchers will be able to vary the difficulty of their stimuli in a systematic way according to which of these features they choose. Once an underlying structure is selected, the software can generate an enormous number of problems that use the same struc-ture but have different surface features. This will produce stimulus sets that take advantage of the extensive research on Raven’s Progressive Matrices but expand the size of the set of available Raven-like problems to a number suitable for any application.
AUTHOR NOTE
This work was supported by the Laboratory Directed Research and Development program at Sandia National Laboratories. Sandia is a multiprogram laboratory operated by Sandia Corporation, a Lockheed Martin Company, for the United States Department of Energy’s National Nuclear Security Administration under Contract DE-AC04-94AL85000. Correspondence concerning this article should be addressed to L. E. Matzen, Sandia National Laboratories, P.O. Box 5800, Mail Stop 1188, Albuquerque, NM 87185-1188 (e-mail: [email protected]).
REFERENCES
Arendasy, M., & Sommer, M. (2005). The effect of different types of perceptual manipulations on the dimensionality of automatically generated figural matrices. Intelligence, 33, 307-324. doi:10.1016/j .intell.2005.02.002
Carpenter, P. A., Just, M. A., & Shell, P. (1990). What one intel-ligence test measures: A theoretical account of the processing in the Raven Progressive Matrices Test. Psychological Review, 97, 404-431. doi:10.1037/0033-295X.97.3.404
Cattell, R. B. (1963). Theory of fluid and crystallized intelligence: A critical experiment. Journal of Educational Psychology, 54, 1-22. doi:10.1037/h0046743
Christoff, K., Prabhakaran, V., Dorfman, J., Zhao, Z., Kroger, J. K., Holyoak, K. J., & Gabrieli, J. D. E. (2001). Rostrolateral pre-frontal cortex involvement in relational integration during reasoning. NeuroImage, 14, 1136-1149. doi:10.1006/nimg.2001.0922
Court, J. H., & Raven, J. (1995). Manual for Raven’s progressive ma-trices and vocabulary scales: Section 7, Research and references. San Antonio: Harcourt Assessment.
Crone, E. A., Wendelken, C., van Leijenhorst, L., Honomichl, R. D., Christoff, K., & Bunge, S. A. (2009). Neurocognitive devel-opment of relational reasoning. Developmental Science, 12, 55-66. doi:10.1111/j.1467-7687.2008.00743.x
Green, K. E., & Kluever, R. C. (1992). Components of item difficulty of Raven’s matrices. Journal of General Psychology, 119, 189-199.
Halford, G. S., Wilson, W. H., & Phillips, S. (1998). Processing ca-pacity defined by relational complexity: Implications for comparative, developmental, and cognitive psychology. Behavioral & Brain Sci-ences, 21, 803-831. doi:10.1017/S0140525X98001769
Meo, M., Roberts, M. J., & Marucci, F. S. (2007). Element salience as a predictor of item difficulty for Raven’s Progressive Matrices. Intel-ligence, 35, 359-368. doi:10.1016/j.intell.2006.10.001
Primi, R. (2002). Complexity of geometric inductive reasoning tasks: Contribution to the understanding of fluid intelligence. Intelligence, 30, 41-70. doi:10.1016/S0160-2896(01)00067-8
Raven, J. C., Court, J. H., & Raven, J. (1998). Raven’s progressive matrices. Oxford: Oxford Psychologists Press.
Roberts, M. J., Welfare, H., Livermore, D. P., & Theadom, A. M. (2000). Context, visual salience, and inductive reasoning. Thinking & Reasoning, 6, 349-374. doi:10.1080/135467800750038175
Waltz, J. A., Knowlton, B. J., Holyoak, K. J., Boone, K. B., Mish-kin, F. S., de Menezes Santoa, M., et al. (1999). A system for re-lational reasoning in human prefrontal cortex. Psychological Science, 10, 119-125. doi:10.1111/1467-9280.00118
(Manuscript received August 17, 2009; revision accepted for publication October 27, 2009.)
transformations, the majority of the errors were “Match to Diagonal Pattern” or “Match to Top Left Corner.” The “Match to Diagonal Pattern” errors indicate that partici-pants were thinking of the matrix as one with a TL-to-LR diagonal transformation. The “Match to Top Left Corner” errors indicate that the participants were thinking of the problem as a reflection across the diagonal. This type of error was particularly common for matrices with an out-ward shading transformation. The prevalence of this error indicates that most participants did not interpret the shad-ing changes as a progression from light to dark, as was intended. In fact, across all of the problems that included an outward shading transformation, participants answered incorrectly 67% of the time. This finding indicates that the selection of transformation patterns and surface features is critical, because in this case they interacted with one another in an unexpected way. Because of the low overall accuracy for the outward shading transformation, it may be necessary to exclude this type of transformation when constructing stimuli for future experiments.
The analysis of the errors for the two-relation Sandia matrices also revealed that the participants often made er-rors in which they chose a distractor that fit with one of the relations within the problem but not the other. This breakdown allowed us to determine which of two relations in a problem was more difficult. In addition, the errors on one of two relations generally fell into the same pat-tern as the errors from problems that contained only one relation to begin with. This indicates that the participants were breaking the problem down into smaller problems and attempting to solve them separately, supporting the findings of Carpenter et al. (1990).
Although the analysis of the incorrect answers did not determine what strategy the participants were using in all cases, it provided useful insight into the relationship be-tween different types of relations and different types of errors. This could be a fruitful area for future research. Information about the participants’ strategies could be very useful in a variety of experimental applications, and the systematic way in which the Sandia matrix generation software creates stimuli can help researchers take advan-tage of that information.
The results of the norming study indicate that the Sandia matrix generation software can successfully produce ma-trix problems with properties that are similar and compa-rable in difficulty to the properties of the original SPMs. In addition, the Sandia matrix generation software can expand the range of problem difficulty beyond that of the SPMs by producing three-relation problems and more difficult logic problems. Perhaps most importantly, the norming study provides insight into what aspects of a problem contribute most to its overall difficulty. In particular, the study showed that the direction of a transformation plays a key role in determining the problem’s difficulty.
In conclusion, the Sandia matrix generation software provides a useful tool for creating large numbers of ex-perimental stimuli. It allows researchers to select the num-ber, type, and direction of relations for object transforma-tion problems or the type of relation for logic problems.