Embed Size (px)
Citation preview
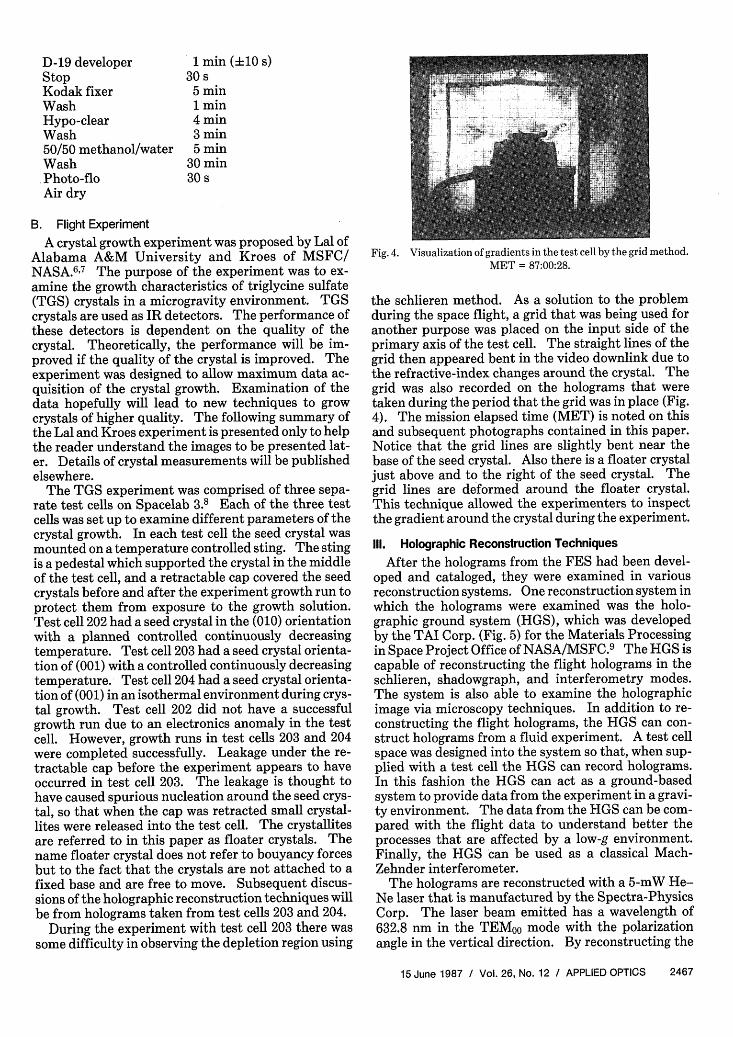
Reconstruction techniques of holograms from Spacelab 3
William K. Witherow
Fluid transport effects in a ground-based laboratory are fairly well known. Bouyancy driven transport occurswhen there is a local density change in the fluid. In a low-g environment these density changes become lessimportant, and other transport mechanisms dominate. To better understand fluid flows in a low-g environ-ment, a fluid experiment system (FES) was designed to fly aboard the Shuttle orbiter in Spacelab. The FESis a holographic system designed for acquisition of the maximum amount of data from an experiment. TheFES flew for the first time in May 1985 on Spacelab 3 for investigation of triglycine sulfate (TGS) crystalgrowth in low-g. This paper describes the FES optical system. The reconstruction techniques of theholograms are examined in detail, and the multiuser and reflight capabilities are discussed. Proposed futureexperiments are mentioned.
I. Introduction
Experiments onboard the Shuttle have been per-formed to study the effects of low-g on crystal growth.On earth a growing crystal will typically be affected byconvection. A crystal grows by depleting the growthsolution of crystal material. As the solution is deplet-ed of crystal material, the solution becomes less denseand rises from the crystal interface. In this way con-vection is initiated. In a low-g environment, however,convection is suppressed, and other growth mecha-nisms become more dominant.
The fluid experiment system (FES) is a multipur-pose holographic system used to investigate fluid ex-periments in low-g. Fluid experiments and crystalgrowth experiments typically utilize shadowgraphphotography, schlieren photography, and interferom-etry to obtain data. Shadowgraph photography givesthe second derivative of index of refraction changes,schlieren photography gives the first derivative of in-dex of refraction changes, and interferometry gives thedirect differences of index of refraction changes. Eachof these techniques takes a precise optical setup todeliver meaningful data. To maximize data collectionand minimize the optical setup, the decision was madeto make the FES a holographic system. During theexperiment a hologram records the wavefront coming'from the test cell. Reconstruction of the hologramrecreates the wavefront which can then be processed ina ground-based laboratory in an optimum shadow-graph, schlieren, or interferometric system. In addi-tion to these techniques, holographic double-exposureinterferometry is also available. In depth detail of the
The author is with NASA Marshall Space Flight Center, SpaceScience Laboratory, Huntsville, Alabama 35812.
Received 25 August 1986.
field of holography can be found elsewhere in the liter-ature.',2
11. Fluid Experiment System
A. Hardware
At its conception the FES was envisioned to be amultipurpose multiuser system. In this way the costof flight hardware could be kept to a minimum bydesigning a system that could be reflown with newexperiments with minimal modifications. The systemthat resulted from these experiments was a holograph-ic system that is capable of capturing the flight experi-ment on film for later detailed analysis.
The FES was designed and developed by the TRWCorp. under contract to the Materials Processing Pro-ject Office of Marshall Space Flight Center (MSFC)/NASA.3 The laser used in the FES is a 30-mW He-Nelaser that was built by the Spectra-Physics Corp. Thewavelength of the beam is 632.8 nm in the TEMoo modewith the polarization angle in the vertical direction.The laser was hardened by adding additional supportto the plasma tube so that the laser survives launchvibrations. The mirrors of the FES are made of BK-7glass, a borosilicate crown with a refractive index of1.5176. The mirrors have a X/10 flatness and are coat-ed with a multilayered dielectric film to provide maxi-mum reflection at the 632.8-nm wavelength. The win-dows of the test cell are made of BK-7A1 glass and havea X/4 flatness. The beam splitters of the FES are alsomade of BK-7A1 glass and have a flatness of X/10.The primary axis of the FES is capable of resolving afeature of 20 Am in size. The transverse axis canresolve a feature of 35 Am in size. The flight apparatusrequires a double rack space on the Shuttle (Fig. 1).This includes the optical bench and the test cell pre-heat section. The electronics for both the FES and acompanion experiment, the vapor growth crystal sys-tem (VCGS), are also included in the FES test rack.
The FES is capable of recording holograms of theexperiment and providing real-time schlieren informa-
15 June 1987 / Vol. 26, No. 12 / APPLIED OPTICS 2465
-AUTO-TRANSFORMERS
,PREHEAT
CONTROLPANEL
CELL
EXPERIMENT-ENCLOSURE ASSEMBLY
Fig. 1. Fluid experiment system rack assembly.
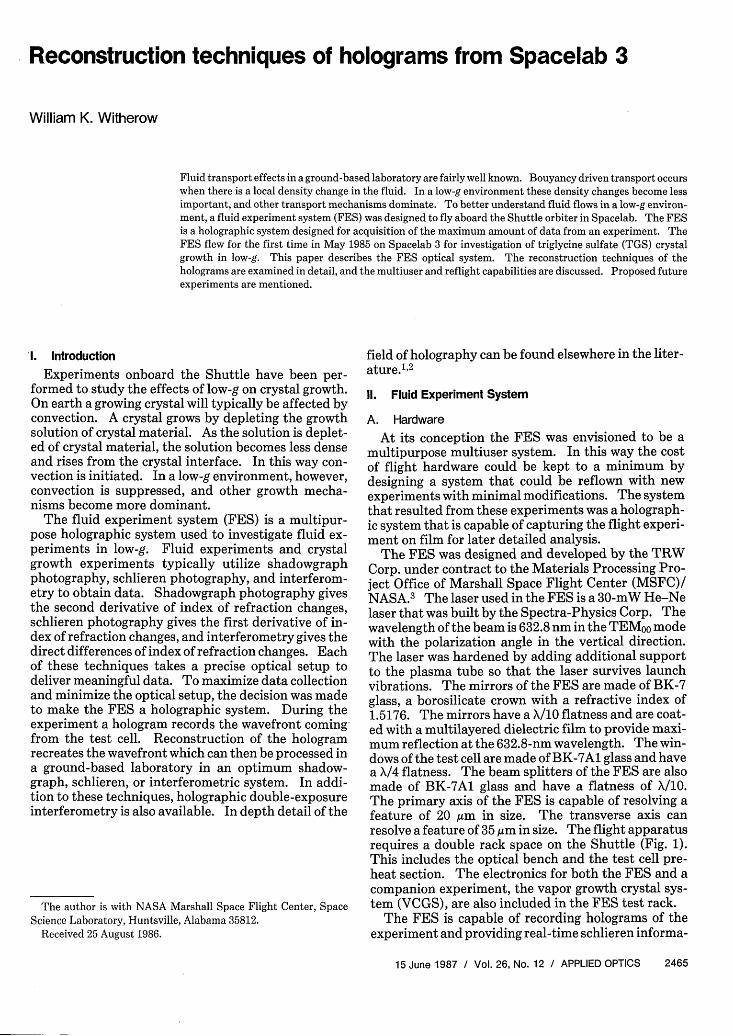
tion to the ground-based experiment team. The holo-grams of the test cell are taken from a primary andtransverse axis (Fig. 2). The primary axis is the por-tion of the beam that passes through the test cell, andthe transverse axis is the light that is scattered off theexperiment subject at right angles. The referencebeam used to construct the holograms is collimated. Acollimated reference beam simplifies reconstruction ofthe real and virtual images from the flight holograms.To construct a hologram the difference in path lengthsof the object and reference beams must be less than thecoherence length of the laser. The path lengths of theobject and reference beams have been adjusted to cor-rect for the different thicknesses of glass (beam split-ters and test cell windows) that the beams must passthrough.
There are four types of hologram taken on the pri-mary axis: single exposure with and without a diffuserplate and double exposure with and without a diffuserplate. The diffuser plate is an element that can bemoved in or out of the beam entering the test cell. Thepurpose of the diffuser plate is to provide a lightedbackground that the shadow of the crystal can be seenagainst. In this way measurements of the crystal sizecan be made. The double-exposure holograms aretaken to detect changes in the index of refractionaround the crystal as it grows. The time of separationof the two exposures can be adjusted from 8 to 32000 s(8.9 h) via an onboard computer. During the firstflight of the FES the separation of exposures was set at100 s. The single-exposure hologram without the dif-fuser plate is the hologram that is used to reconstructthe wavefront from the test cell for shadowgraph,schlieren, and interferometry data.
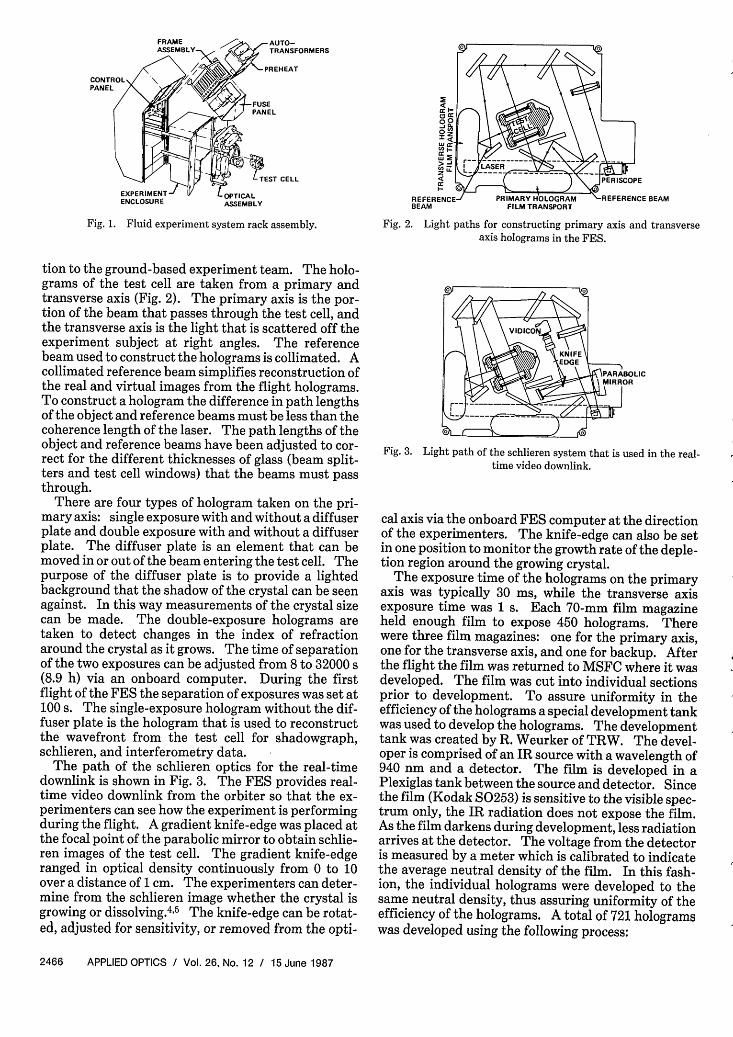
The path of the schlieren optics for the real-timedownlink is shown in Fig. 3. The FES provides real-time video downlink from the orbiter so that the ex-perimenters can see how the experiment is performingduring the flight. A gradient knife-edge was placed atthe focal point of the parabolic mirror to obtain schlie-ren images of the test cell. The gradient knife-edgeranged in optical density continuously from 0 to 10over a distance of 1 cm. The experimenters can deter-mine from the schlieren image whether the crystal isgrowing or dissolving.4 5 The knife-edge can be rotat-ed, adjusted for sensitivity, or removed from the opti-
REFERENCIBEAM
Fig. 2. Light paths for constructing primary axis and transverseaxis holograms in the FES.
Fig. 3. Light path of the schlieren system that is used in the real-time video downlink.
cal axis via the onboard FES computer at the directionof the experimenters. The knife-edge can also be setin one position to monitor the growth rate of the deple-tion region around the growing crystal.
The exposure time of the holograms on the primaryaxis was typically 30 ins, while the transverse axisexposure time was 1 s. Each 70-mm film magazineheld enough film to expose 450 holograms. Therewere three film magazines: one for the primary axis,one for the transverse axis, and one for backup. Afterthe flight the film was returned to MSFC where it wasdeveloped. The film was cut into individual sectionsprior to development. To assure uniformity in theefficiency of the holograms a special development tankwas used to develop the holograms. The developmenttank was created by R. Weurker of TRW. The devel-oper is comprised of an IR source with a wavelength of940 nm and a detector. The film is developed in aPlexiglas tank between the source and detector. Sincethe film (Kodak S0253) is sensitive to the visible spec-trum only, the IR radiation does not expose the film.As the film darkens during development, less radiationarrives at the detector. The voltage from the detectoris measured by a meter which is calibrated to indicatethe average neutral density of the film. In this fash-ion, the individual holograms were developed to thesame neutral density, thus assuring uniformity of theefficiency of the holograms. A total of 721 hologramswas developed using the following process:
2466 APPLIED OPTICS / Vol. 26, No. 12 / 15 June 1987
D-19 developer 1 min (+10 s)Stop 30 sKodak fixer 5 minWash 1 minHypo-clear 4 minWash 3 min50/50 methanol/water 5 minWash 30 minPhoto-flo 30 sAir dry
B. Flight Experiment
A crystal growth experiment was proposed by Lal ofAlabama A&M University and Kroes of MSFC/NASA.67 The purpose of the experiment was to ex-amine the growth characteristics of triglycine sulfate(TGS) crystals in a microgravity environment. TGScrystals are used as IR detectors. The performance ofthese detectors is dependent on the quality of thecrystal. Theoretically, the performance will be im-proved if the quality of the crystal is improved. Theexperiment was designed to allow maximum data ac-quisition of the crystal growth. Examination of thedata hopefully will lead to new techniques to growcrystals of higher quality. The following summary ofthe Lal and Kroes experiment is presented only to helpthe reader understand the images to be presented lat-er. Details of crystal measurements will be publishedelsewhere.
The TGS experiment was comprised of three sepa-rate test cells on Spacelab 3.8 Each of the three testcells was set up to examine different parameters of thecrystal growth. In each test cell the seed crystal wasmounted on a temperature controlled sting. The stingis a pedestal which supported the crystal in the middleof the test cell, and a retractable cap covered the seedcrystals before and after the experiment growth run toprotect them from exposure to the growth solution.Test cell 202 had a seed crystal in the (010) orientationwith a planned controlled continuously decreasingtemperature. Test cell 203 had a seed crystal orienta-tion of (001) with a controlled continuously decreasingtemperature. Test cell 204 had a seed crystal orienta-tion of (001) in an isothermal environment during crys-tal growth. Test cell 202 did not have a successfulgrowth run due to an electronics anomaly in the testcell. However, growth runs in test cells 203 and 204were completed successfully. Leakage under the re-tractable cap before the experiment appears to haveoccurred in test cell 203. The leakage is thought tohave caused spurious nucleation around the seed crys-tal, so that when the cap was retracted small crystal-lites were released into the test cell. The crystallitesare referred to in this paper as floater crystals. Thename floater crystal does not refer to bouyancy forcesbut to the fact that the crystals are not attached to afixed base and are free to move. Subsequent discus-sions of the holographic reconstruction techniques willbe from holograms taken from test cells 203 and 204.
During the experiment with test cell 203 there wassome difficulty in observing the depletion region using
Fig. 4. Visualization of gradients in the test cell by the grid method.MET = 87:00:28.
the schlieren method. As a solution to the problemduring the space flight, a grid that was being used foranother purpose was placed on the input side of theprimary axis of the test cell. The straight lines of thegrid then appeared bent in the video downlink due tothe refractive-index changes around the crystal. Thegrid was also recorded on the holograms that weretaken during the period that the grid was in place (Fig.4). The mission elapsed time (MET) is noted on thisand subsequent photographs contained in this paper.Notice that the grid lines are slightly bent near thebase of the seed crystal. Also there is a floater crystaljust above and to the right of the seed crystal. Thegrid lines are deformed around the floater crystal.This technique allowed the experimenters to inspectthe gradient around the crystal during the experiment.
111. Holographic Reconstruction Techniques
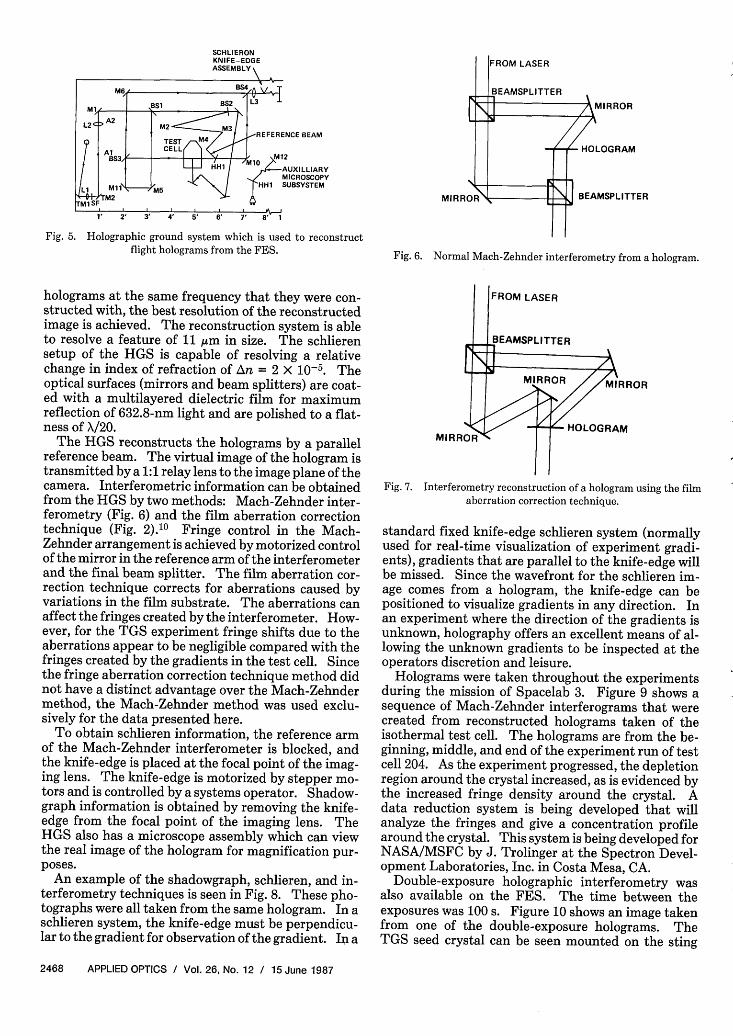
After the holograms from the FES had been devel-oped and cataloged, they were examined in variousreconstruction systems. One reconstruction system inwhich the holograms were examined was the holo-graphic ground system (HGS), which was developedby the TAI Corp. (Fig. 5) for the Materials Processingin Space Project Office of NASA/MSFC. 9 The HGS iscapable of reconstructing the flight holograms in theschlieren, shadowgraph, and interferometry modes.The system is also able to examine the holographicimage via microscopy techniques. In addition to re-constructing the flight holograms, the HGS can con-struct holograms from a fluid experiment. A test cellspace was designed into the system so that, when sup-plied with a test cell the HGS can record holograms.In this fashion the HGS can act as a ground-basedsystem to provide data from the experiment in a gravi-ty environment. The data from the HGS can be com-pared with the flight data to understand better theprocesses that are affected by a low-g environment.Finally, the HGS can be used as a classical Mach-Zehnder interferometer.
The holograms are reconstructed with a 5-mW He-Ne laser that is manufactured by the Spectra-PhysicsCorp. The laser beam emitted has a wavelength of632.8 nm in the TEMoo mode with the polarizationangle in the vertical direction. By reconstructing the
15 June 1987 / Vol. 26, No. 12 / APPLIED OPTICS 2467
SCHLIERONKNIFE-EDGEASSEMBLY \
Fig. 5. Holographic ground system which is used to reconstructflight holograms from the FES.
holograms at the same frequency that they were con-structed with, the best resolution of the reconstructedimage is achieved. The reconstruction system is ableto resolve a feature of 11 ,um in size. The schlierensetup of the HGS is capable of resolving a relativechange in index of refraction of An = 2 X 10⁻⁵. Theoptical surfaces (mirrors and beam splitters) are coat-ed with a multilayered dielectric film for maximumreflection of 632.8-nm light and are polished to a flat-ness of X/20.
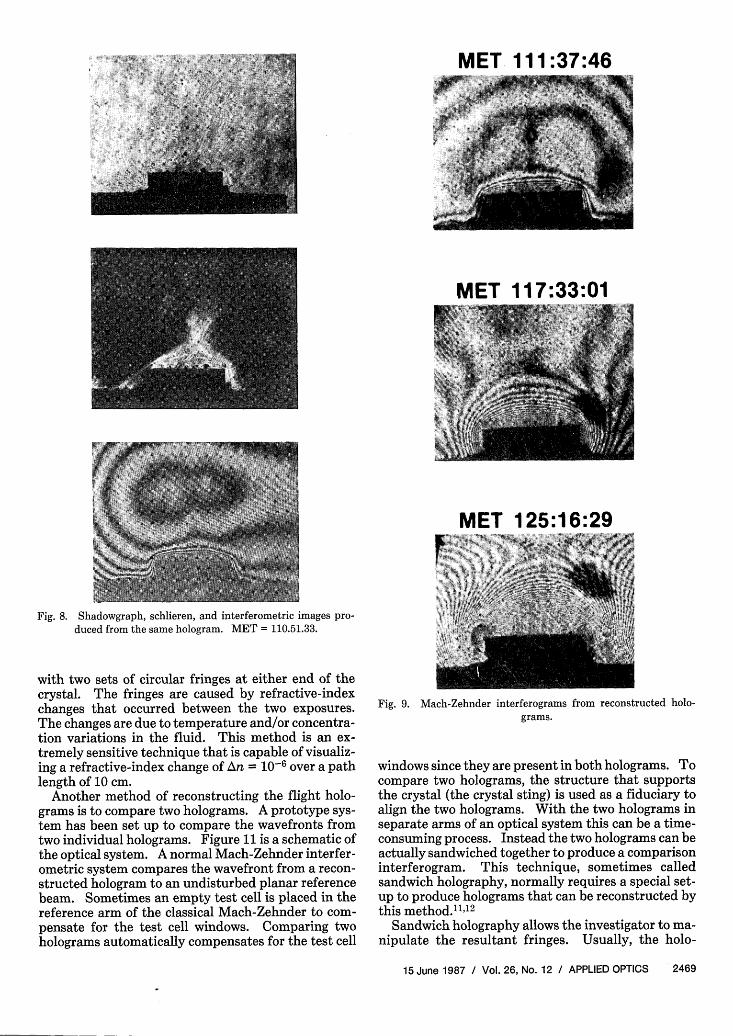
The HGS reconstructs the holograms by a parallelreference beam. The virtual image of the hologram istransmitted by a 1:1 relay lens to the image plane of thecamera. Interferometric information can be obtainedfrom the HGS by two methods: Mach-Zehnder inter-ferometry (Fig. 6) and the film aberration correctiontechnique (Fig. 2).10 Fringe control in the Mach-Zehnder arrangement is achieved by motorized controlof the mirror in the reference arm of the interferometerand the final beam splitter. The film aberration cor-rection technique corrects for aberrations caused byvariations in the film substrate. The aberrations canaffect the fringes created by the interferometer. How-ever, for the TGS experiment fringe shifts due to theaberrations appear to be negligible compared with thefringes created by the gradients in the test cell. Sincethe fringe aberration correction technique method didnot have a distinct advantage over the Mach-Zehndermethod, the Mach-Zehnder method was used exclu-sively for the data presented here.
To obtain schlieren information, the reference armof the Mach-Zehnder interferometer is blocked, andthe knife-edge is placed at the focal point of the imag-ing lens. The knife-edge is motorized by stepper mo-tors and is controlled by a systems operator. Shadow-graph information is obtained by removing the knife-edge from the focal point of the imaging lens. TheHGS also has a microscope assembly which can viewthe real image of the hologram for magnification pur-poses.
An example of the shadowgraph, schlieren, and in-terferometry techniques is seen in Fig. 8. These pho-tographs were all taken from the same hologram. In aschlieren system, the knife-edge must be perpendicu-lar to the gradient for observation of the gradient. In a
LSN . MIRROR
HOLOGRAM
MIRROR BEAMSPLITTER
Fig. 6. Normal Mach-Zehnder interferometry from a hologram.
FROM LASER
lBEAMSPLITTER
MIRROR
MIRROIHOLOGRAM
Fig. 7. Interferometry reconstruction of a hologram using the filmaberration correction technique.
standard fixed knife-edge schlieren system (normallyused for real-time visualization of experiment gradi-ents), gradients that are parallel to the knife-edge willbe missed. Since the wavefront for the schlieren im-age comes from a hologram, the knife-edge can bepositioned to visualize gradients in any direction. Inan experiment where the direction of the gradients isunknown, holography offers an excellent means of al-lowing the unknown gradients to be inspected at theoperators discretion and leisure.
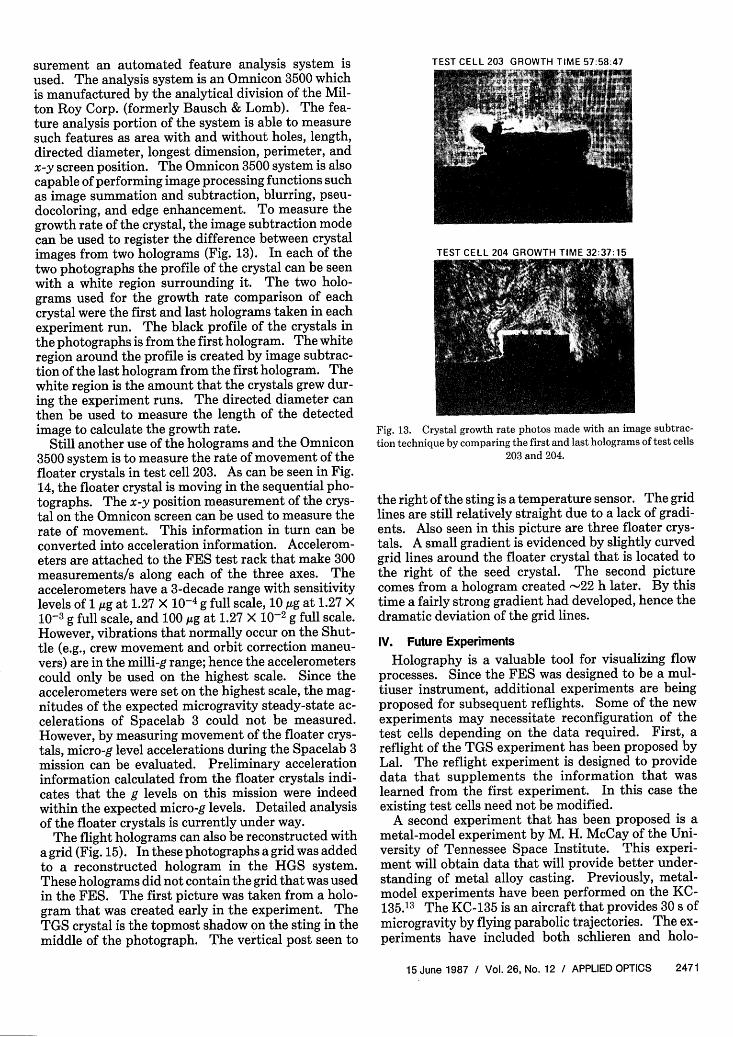
Holograms were taken throughout the experimentsduring the mission of Spacelab 3. Figure 9 shows asequence of Mach-Zehnder interferograms that werecreated from reconstructed holograms taken of theisothermal test cell. The holograms are from the be-ginning, middle, and end of the experiment run of testcell 204. As the experiment progressed, the depletionregion around the crystal increased, as is evidenced bythe increased fringe density around the crystal. Adata reduction system is being developed that willanalyze the fringes and give a concentration profilearound the crystal. This system is being developed forNASA/MSFC by J. Trolinger at the Spectron Devel-opment Laboratories, Inc. in Costa Mesa, CA.
Double-exposure holographic interferometry wasalso available on the FES. The time between theexposures was 100 s. Figure 10 shows an image takenfrom one of the double-exposure holograms. TheTGS seed crystal can be seen mounted on the sting
2468 APPLIED OPTICS / Vol. 26, No. 12 / 15 June 1987
MET 111:37:46
MET 117:33:01
MET 125:16:29
Fig. 8. Shadowgraph, schlieren, and interferometric images pro-duced from the same hologram. MET = 110.51.33.
with two sets of circular fringes at either end of thecrystal. The fringes are caused by refractive-indexchanges that occurred between the two exposures.The changes are due to temperature and/or concentra-tion variations in the fluid. This method is an ex-tremely sensitive technique that is capable of visualiz-ing a refractive-index change of An = 10-6 over a pathlength of 10 cm.
Another method of reconstructing the flight holo-grams is to compare two holograms. A prototype sys-tem has been set up to compare the wavefronts fromtwo individual holograms. Figure 11 is a schematic ofthe optical system. A normal Mach-Zehnder interfer-ometric system compares the wavefront from a recon-structed hologram to an undisturbed planar referencebeam. Sometimes an empty test cell is placed in thereference arm of the classical Mach-Zehnder to com-pensate for the test cell windows. Comparing twoholograms automatically compensates for the test cell
Fig. 9. Mach-Zehnder interferograms from reconstructed holo-grams.
windows since they are present in both holograms. Tocompare two holograms, the structure that supportsthe crystal (the crystal sting) is used as a fiduciary toalign the two holograms. With the two holograms inseparate arms of an optical system this can be a time-consuming process. Instead the two holograms can beactually sandwiched together to produce a comparisoninterferogram. This technique, sometimes calledsandwich holography, normally requires a special set-up to produce holograms that can be reconstructed bythis method."1 '1 2
Sandwich holography allows the investigator to ma-nipulate the resultant fringes. Usually, the holo-
15 June 1987 / Vol. 26, No. 12 / APPLIED OPTICS 2469
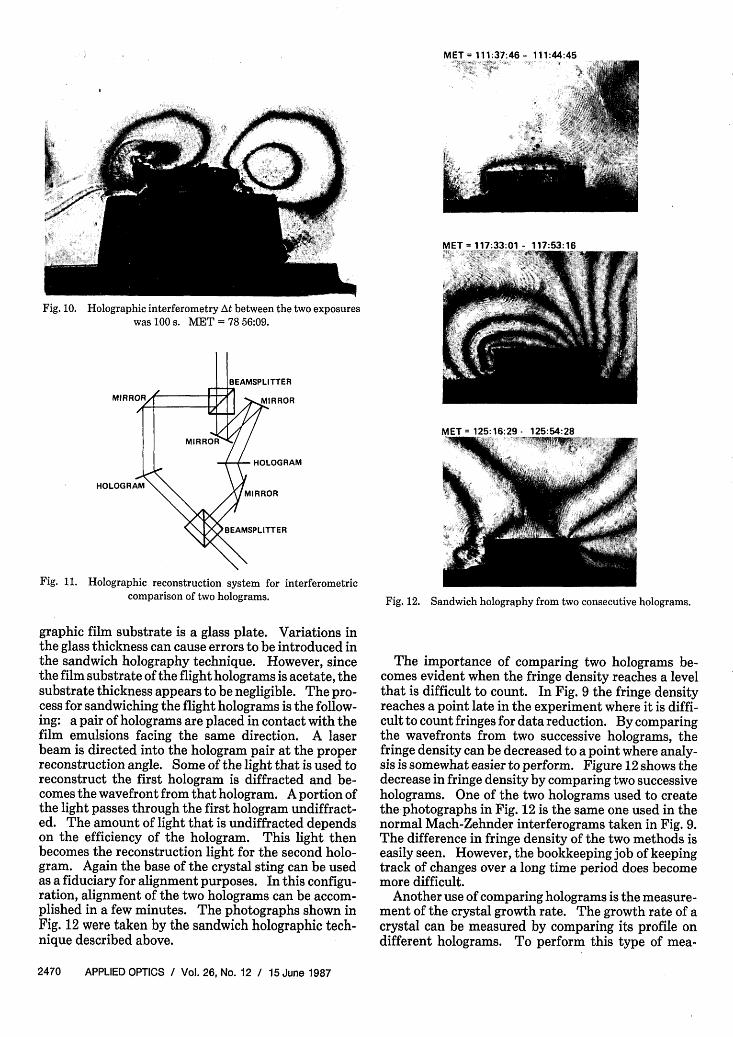
Fig. 10. Holographic interferometry At between the two exposureswas 100 s. MET = 78 56:09.
MIRROR >MIRROR
MIRROR
HOLOGRAM
HOLOGRAMMIRROR
B EAMSPLITTER
Fig. 11. Holographic reconstruction system for interferometriccomparison of two holograms.
graphic film substrate is a glass plate. Variations inthe glass thickness can cause errors to be introduced inthe sandwich holography technique. However, sincethe film substrate of the flight holograms is acetate, thesubstrate thickness appears to be negligible. The pro-cess for sandwiching the flight holograms is the follow-ing: a pair of holograms are placed in contact with thefilm emulsions facing the same direction. A laserbeam is directed into the hologram pair at the properreconstruction angle. Some of the light that is used toreconstruct the first hologram is diffracted and be-comes the wavefront from that hologram. A portion ofthe light passes through the first hologram undiffract-ed. The amount of light that is undiffracted dependson the efficiency of the hologram. This light thenbecomes the reconstruction light for the second holo-gram. Again the base of the crystal sting can be usedas a fiduciary for alignment purposes. In this configu-ration, alignment of the two holograms can be accom-plished in a few minutes. The photographs shown inFig. 12 were taken by the sandwich holographic tech-nique described above.
Fig. 12. Sandwich holography from two consecutive holograms.
The importance of comparing two holograms be-comes evident when the fringe density reaches a levelthat is difficult to count. In Fig. 9 the fringe densityreaches a point late in the experiment where it is diffi-cult to count fringes for data reduction. By comparingthe wavefronts from two successive holograms, thefringe density can be decreased to a point where analy-sis is somewhat easier to perform. Figure 12 shows thedecrease in fringe density by comparing two successiveholograms. One of the two holograms used to createthe photographs in Fig. 12 is the same one used in thenormal Mach-Zehnder interferograms taken in Fig. 9.The difference in fringe density of the two methods iseasily seen. However, the bookkeeping job of keepingtrack of changes over a long time period does becomemore difficult.
Another use of comparing holograms is the measure-ment of the crystal growth rate. The growth rate of acrystal can be measured by comparing its profile ondifferent holograms. To perform this type of mea-
2470 APPLIED OPTICS / Vol. 26, No. 12 / 15 June 1987
surement an automated feature analysis system isused. The analysis system is an Omnicon 3500 whichis manufactured by the analytical division of the Mil-ton Roy Corp. (formerly Bausch & Lomb). The fea-ture analysis portion of the system is able to measuresuch features as area with and without holes, length,directed diameter, longest dimension, perimeter, andx-y screen position. The Omnicon 3500 system is alsocapable of performing image processing functions suchas image summation and subtraction, blurring, pseu-docoloring, and edge enhancement. To measure thegrowth rate of the crystal, the image subtraction modecan be used to register the difference between crystalimages from two holograms (Fig. 13). In each of thetwo photographs the profile of the crystal can be seenwith a white region surrounding it. The two holo-grams used for the growth rate comparison of eachcrystal were the first and last holograms taken in eachexperiment run. The black profile of the crystals inthe photographs is from the first hologram. The whiteregion around the profile is created by image subtrac-tion of the last hologram from the first hologram. Thewhite region is the amount that the crystals grew dur-ing the experiment runs. The directed diameter canthen be used to measure the length of the detectedimage to calculate the growth rate.
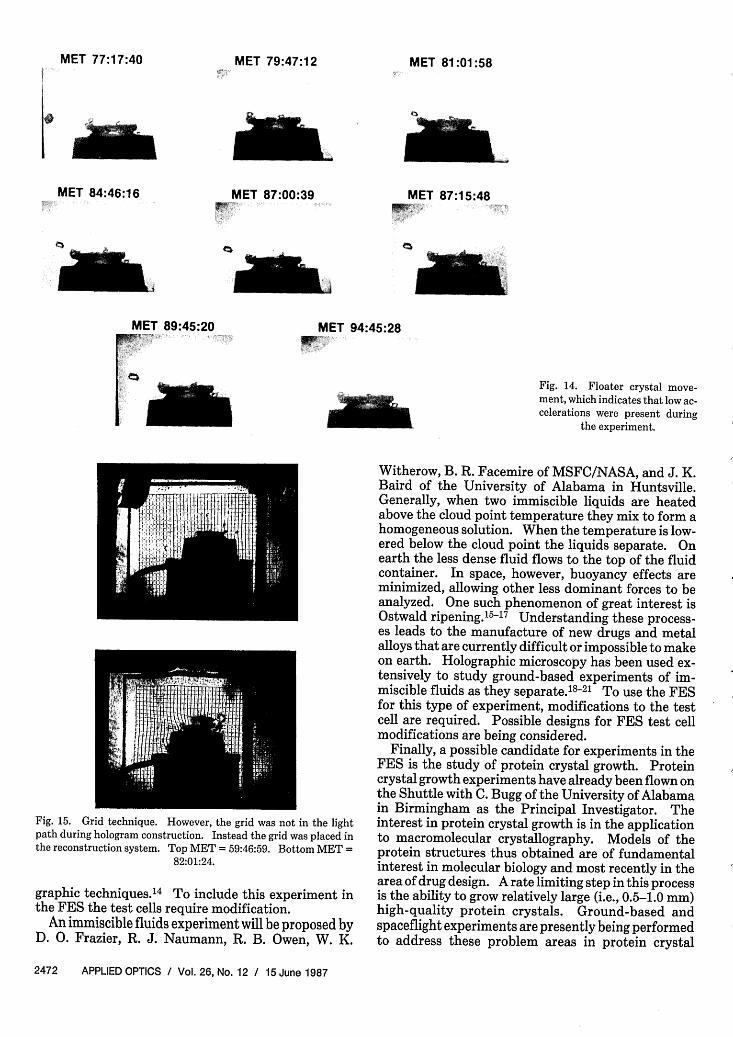
Still another use of the holograms and the Omnicon3500 system is to measure the rate of movement of thefloater crystals in test cell 203. As can be seen in Fig.14, the floater crystal is moving in the sequential pho-tographs. The x-y position measurement of the crys-tal on the Omnicon screen can be used to measure therate of movement. This information in turn can beconverted into acceleration information. Accelerom-eters are attached to the FES test rack that make 300measurements/s along each of the three axes. Theaccelerometers have a 3-decade range with sensitivitylevels of 1 ,g at 1.27 X 10⁻⁴ g full scale, 10 Mtg at 1.27 X10⁻³ g full scale, and 100 ,g at 1.27 X 10⁻² g full scale.However, vibrations that normally occur on the Shut-tle (e.g., crew movement and orbit correction maneu-vers) are in the milli-g range; hence the accelerometerscould only be used on the highest scale. Since theaccelerometers were set on the highest scale, the mag-nitudes of the expected microgravity steady-state ac-celerations of Spacelab 3 could not be measured.However, by measuring movement of the floater crys-tals, micro-g level accelerations during the Spacelab 3mission can be evaluated. Preliminary accelerationinformation calculated from the floater crystals indi-cates that the g levels on this mission were indeedwithin the expected micro-g levels. Detailed analysisof the floater crystals is currently under way.
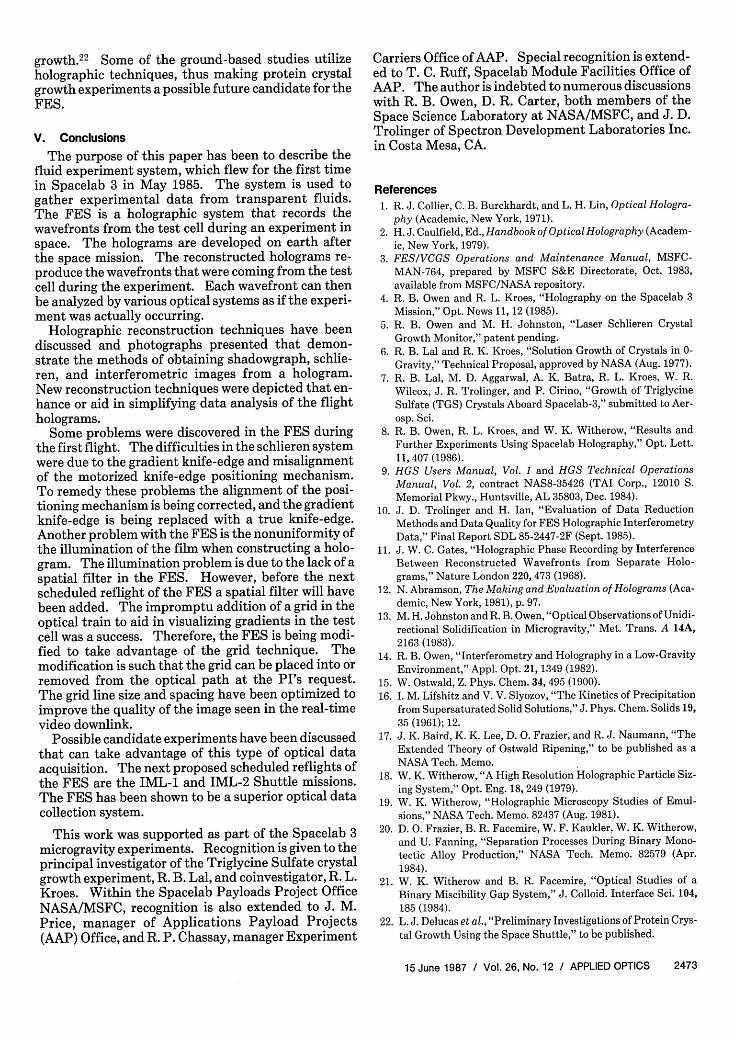
The flight holograms can also be reconstructed witha grid (Fig. 15). In these photographs a grid was addedto a reconstructed hologram in the HGS system.These holograms did not contain the grid that was usedin the FES. The first picture was taken from a holo-gram that was created early in the experiment. TheTGS crystal is the topmost shadow on the sting in themiddle of the photograph. The vertical post seen to
TEST CELL 203 GROWTH TIME 57:58:47
Fig. 13. Crystal growth rate photos made with an image subtrac-tion technique by comparing the first and last holograms of test cells
203 and 204.
the right of the sting is a temperature sensor. The gridlines are still relatively straight due to a lack of gradi-ents. Also seen in this picture are three floater crys-tals. A small gradient is evidenced by slightly curvedgrid lines around the floater crystal that is located tothe right of the seed crystal. The second picturecomes from a hologram created -22 h later. By thistime a fairly strong gradient had developed, hence thedramatic deviation of the grid lines.
IV. Future Experiments
Holography is a valuable tool for visualizing flowprocesses. Since the FES was designed to be a mul-tiuser instrument, additional experiments are beingproposed for subsequent reflights. Some of the newexperiments may necessitate reconfiguration of thetest cells depending on the data required. First, areflight of the TGS experiment has been proposed byLal. The reflight experiment is designed to providedata that supplements the information that waslearned from the first experiment. In this case theexisting test cells need not be modified.
A second experiment that has been proposed is ametal-model experiment by M. H. McCay of the Uni-versity of Tennessee Space Institute. This experi-ment will obtain data that will provide better under-standing of metal alloy casting. Previously, metal-model experiments have been performed on the KC-135.13 The KC-135 is an aircraft that provides 30 s ofmicrogravity by flying parabolic trajectories. The ex-periments have included both schlieren and holo-
15 June 1987 / Vol. 26, No. 12 / APPLIED OPTICS 2471
MET 77:17:40
E
MET 84:46:16
MET 79:47:12
MET 87:00:3977d' S :) i'1\N
MET 81:01:58
MET 87:15:48m? :
MET 89:45:20
v f: . t
4 t_
MET 94:45:28on U
Fig. 14. Floater crystal move-ment, which indicates that low ac-celerations were present during
the experiment.
Fig. 15. Grid technique. However, the grid was not in the lightpath during hologram construction. Instead the grid was placed inthe reconstruction system. Top MET = 59:46:59. Bottom MET =
82:01:24.
graphic techniques.14 To include this experiment inthe FES the test cells require modification.
An immiscible fluids experiment will be proposed byD. 0. Frazier, R. J. Naumann, R. B. Owen, W. K.
Witherow, B. R. Facemire of MSFC/NASA, and J. K.Baird of the University of Alabama in Huntsville.Generally, when two immiscible liquids are heatedabove the cloud point temperature they mix to form ahomogeneous solution. When the temperature is low-ered below the cloud point the liquids separate. Onearth the less dense fluid flows to the top of the fluidcontainer. In space, however, buoyancy effects areminimized, allowing other less dominant forces to beanalyzed. One such phenomenon of great interest isOstwald ripening.15-17 Understanding these process-es leads to the manufacture of new drugs and metalalloys that are currently difficult or impossible to makeon earth. Holographic microscopy has been used ex-tensively to study ground-based experiments of im-miscible fluids as they separate.18-21 To use the FESfor this type of experiment, modifications to the testcell are required. Possible designs for FES test cellmodifications are being considered.
Finally, a possible candidate for experiments in theFES is the study of protein crystal growth. Proteincrystal growth experiments have already been flown onthe Shuttle with C. Bugg of the University of Alabamain Birmingham as the Principal Investigator. Theinterest in protein crystal growth is in the applicationto macromolecular crystallography. Models of theprotein structures thus obtained are of fundamentalinterest in molecular biology and most recently in thearea of drug design. A rate limiting step in this processis the ability to grow relatively large (i.e., 0.5-1.0 mm)high-quality protein crystals. Ground-based andspaceflight experiments are presently being performedto address these problem areas in protein crystal
2472 APPLIED OPTICS / Vol. 26, No. 12 / 15 June 1987
growth.22 Some of the ground-based studies utilizeholographic techniques, thus making protein crystalgrowth experiments a possible future candidate for theFES.
V. Conclusions
The purpose of this paper has been to describe thefluid experiment system, which flew for the first timein Spacelab 3 in May 1985. The system is used togather experimental data from transparent fluids.The FES is a holographic system that records thewavefronts from the test cell during an experiment inspace. The holograms are developed on earth afterthe space mission. The reconstructed holograms re-produce the wavefronts that were coming from the testcell during the experiment. Each wavefront can thenbe analyzed by various optical systems as if the experi-ment was actually occurring.
Holographic reconstruction techniques have beendiscussed and photographs presented that demon-strate the methods of obtaining shadowgraph, schlie-ren, and interferometric images from a hologram.New reconstruction techniques were depicted that en-hance or aid in simplifying data analysis of the flightholograms.
Some problems were discovered in the FES duringthe first flight. The difficulties in the schlieren systemwere due to the gradient knife-edge and misalignmentof the motorized knife-edge positioning mechanism.To remedy these problems the alignment of the posi-tioning mechanism is being corrected, and the gradientknife-edge is being replaced with a true knife-edge.Another problem with the FES is the nonuniformity ofthe illumination of the film when constructing a holo-gram. The illumination problem is due to the lack of aspatial filter in the FES. However, before the nextscheduled reflight of the FES a spatial filter will havebeen added. The impromptu addition of a grid in theoptical train to aid in visualizing gradients in the testcell was a success. Therefore, the FES is being modi-fied to take advantage of the grid technique. Themodification is such that the grid can be placed into orremoved from the optical path at the PI's request.The grid line size and spacing have been optimized toimprove the quality of the image seen in the real-timevideo downlink.
Possible candidate experiments have been discussedthat can take advantage of this type of optical dataacquisition. The next proposed scheduled reflights ofthe FES are the IML-1 and IML-2 Shuttle missions.The FES has been shown to be a superior optical datacollection system.
This work was supported as part of the Spacelab 3microgravity experiments. Recognition is given to theprincipal investigator of the Triglycine Sulfate crystalgrowth experiment, R. B. Lal, and coinvestigator, R. L.Kroes. Within the Spacelab Payloads Project OfficeNASA/MSFC, recognition is also extended to J. M.Price, manager of Applications Payload Projects(AAP) Office, and R. P. Chassay, manager Experiment
Carriers Office of AAP. Special recognition is extend-ed to T. C. Ruff, Spacelab Module Facilities Office ofAAP. The author is indebted to numerous discussionswith R. B. Owen, D. R. Carter, both members of theSpace Science Laboratory at NASA/MSFC, and J. D.Trolinger of Spectron Development Laboratories Inc.in Costa Mesa, CA.
References1. R. J. Collier, C. B. Burckhardt, and L. H. Lin, Optical Hologra-
phy (Academic, New York, 1971).2. H. J. Caulfield, Ed., Handbook of Optical Holography (Academ-
ic, New York, 1979).3. FES/VCGS Operations and Maintenance Manual, MSFC-
MAN-764, prepared by MSFC S&E Directorate, Oct. 1983,available from MSFC/NASA repository.
4. R. B. Owen and R. L. Kroes, "Holography on the Spacelab 3Mission," Opt. News 11, 12 (1985).
5. R. B. Owen and M. H. Johnston, "Laser Schlieren CrystalGrowth Monitor," patent pending.
6. R. B. Lal and R. K. Kroes, "Solution Growth of Crystals in 0-Gravity," Technical Proposal, approved by NASA (Aug. 1977).
7. R. B. Lal, M. D. Aggarwal, A. K. Batra, R. L. Kroes, W. R.Wilcox, J. R. Trolinger, and P. Cirino, "Growth of TriglycineSulfate (TGS) Crystals Aboard Spacelab-3," submitted to Aer-osp. Sci.
8. R. B. Owen, R. L. Kroes, and W. K. Witherow, "Results andFurther Experiments Using Spacelab Holography," Opt. Lett.11,407 (1986).
9. HGS Users Manual, Vol. 1 and HGS Technical OperationsManual, Vol. 2, contract NAS8-35426 (TAI Corp., 12010 S.Memorial Pkwy., Huntsville, AL 35803, Dec. 1984).
10. J. D. Trolinger and H. Ian, "Evaluation of Data ReductionMethods and Data Quality for FES Holographic InterferometryData," Final Report SDL 85-2447-2F (Sept. 1985).
11. J. W. C. Gates, "Holographic Phase Recording by InterferenceBetween Reconstructed Wavefronts from Separate Holo-grams," Nature London 220, 473 (1968).
12. N. Abramson, The Making and Evaluation of Holograms (Aca-demic, New York, 1981), p. 97.
13. M. H. Johnston and R. B. Owen, "Optical Observations of Unidi-rectional Solidification in Microgravity," Met. Trans. A 14A,2163 (1983).
14. R. B. Owen, "Interferometry and Holography in a Low-GravityEnvironment," Appl. Opt. 21, 1349 (1982).
15. W. Ostwald, Z. Phys. Chem. 34, 495 (1900).16. I. M. Lifshitz and V. V. Slyozov, "The Kinetics of Precipitation
from Supersaturated Solid Solutions," J. Phys. Chem. Solids 19,35 (1961); 12.
17. J. K. Baird, K. K. Lee, D. 0. Frazier; and R. J. Naumann, "TheExtended Theory of Ostwald Ripening," to be published as aNASA Tech. Memo.
18. W. K. Witherow, "A High Resolution Holographic Particle Siz-ing System," Opt. Eng. 18, 249 (1979).
19. W. K. Witherow, "Holographic Microscopy Studies of Emul-sions," NASA Tech. Memo. 82437 (Aug. 1981).
20. D. 0. Frazier, B. R. Facemire, W. F. Kaukler, W. K. Witherow,and U. Fanning, "Separation Processes During Binary Mono-tectic Alloy Production," NASA Tech. Memo. 82579 (Apr.1984).
21. W. K. Witherow and B. R. Facemire, "Optical Studies of aBinary Miscibility Gap System," J. Colloid. Interface Sci. 104,185 (1984).
22. L. J. Delucas et al., "Preliminary Investigations of Protein Crys-
tal Growth Using the Space Shuttle," to be published.
15 June 1987 / Vol. 26, No. 12 / APPLIED OPTICS 2473

![The creation of colored holograms in digital holographyThe digital holography owns already a long tradi-tion [1]. ... Digital hologram recording, numerical reconstruction, and related](https://img.pdfslide.us/doc/110x75/5edb23b780170867277b7186/the-creation-of-colored-holograms-in-digital-holography-the-digital-holography-owns.jpg)
![Three-Dimensional Imagingspie.org/TOC/CDP34.pdf · Recording of large size holograms in photographic emulsion; image reconstruction [120-15] Stephen R. Black Experiences with large-scale](https://img.pdfslide.us/doc/110x75/5edb20bf80170867277b6ca5/three-dimensional-recording-of-large-size-holograms-in-photographic-emulsion-image.jpg)