Embed Size (px)
Citation preview

Reconstruction after a Major Disaster: Lessons from the Post-Tsunami Experience in Indonesia,
Sri Lanka, and Thailand
Sisira Jayasuriya and Peter McCawley
December 2008
ADB Institute Working Paper No. 125

The Working Paper series is a continuation of the formerly named Discussion Paper series; the numbering of the papers continued without interruption or change. ADBI’s working papers reflect initial ideas on a topic and are posted online for discussion. ADBI encourages readers to post their comments on the main page for each working paper (given in the citation below). Some working papers may develop into other forms of publication.
Suggested citation:
Jayasuriya, S. and P. McCawley. 2008. Reconstruction after a Major Disaster: Lessons from the Post-Tsunami Experience in Indonesia, Sri Lanka, and Thailand. ADBI Working Paper 125. Tokyo: Asian Development Bank Institute. Available: http://www.adbi.org/working-paper/2008/12/15/2766.reconstruction.post.tsunami.experience/
Asian Development Bank Institute Kasumigaseki Building 8F 3-2-5 Kasumigaseki, Chiyoda-ku Tokyo 100-6008, Japan Tel: +81-3-3593-5500 Fax: +81-3-3593-5571 URL: www.adbi.org E-mail: [email protected] © 2008 Asian Development Bank Institute
Sisira Jayasuriya is a professor of economics at La Trobe University in Melbourne, Australia, and Peter McCawley is a visiting fellow at Australian National University in Canberra, Australia.
The views expressed in this paper are the views of the authors and do not necessarily reflect the views or policies of ADBI, the Asian Development Bank (ADB), its Board of Directors, or the governments they represent. ADBI does not guarantee the accuracy of the data included in this paper and accepts no responsibility for any consequences of their use. Terminology used may not necessarily be consistent with ADB official terms.

Abstract This paper examines several aspects of the rehabilitation and reconstruction program that followed the 2004 tsunami in Asia. Almost 230,000 people died in the disaster. We focus on two main issues: aid delivery and reconstruction policy following the disaster. Although issues such as immediate relief activities in disaster management and the role of political, institutional, and social factors in post-disaster recovery are also very important, they are not discussed in detail here.
First, the effectiveness and financing of aid delivery arrangements following the tsunami are considered. The discussion aims to go beyond the headline figures on international aid to assess the level, composition, and quality of aid flows. Second, the challenges of designing reconstruction programs in the wake of the tsunami are surveyed. Questions of why there is often sharp escalation in construction costs and the implications for planning reconstruction are considered. These issues are often not discussed in the standard analytical literature about responses to disasters. It is argued that staggered disbursement of aid funds, although obviously highly undesirable in the case of urgent relief activities, may have benefits during the reconstruction phase by reducing inflationary pressures and leakage of aid funds. The pros and cons of alternative approaches are considered. Finally, it is suggested that a phased reconstruction program where the sequencing of activities is carefully prioritized will deliver better outcomes.
JEL Classifications: F35, H54, O19, Q54
Contents
I. Introduction .................................................................................................................. 1
II. Tsunami Reconstruction Assistance ........................................................................... 4
A. Terms, Composition, and “Additionality” of Aid ................................................... 8 B. Delivery, Disbursement, and Spending ............................................................. 10 C. Quality of Assistance ......................................................................................... 11
III. Impact of Fnancial Flows: Emergence of a Construction Boom ................................ 16
A. Construction Cost Escalation ............................................................................ 17 B. Dutch Disease and Reconstruction Following Disasters ................................... 18 C. Trade-Off: Pace and Amount of Reconstruction ............................................... 20
IV. Conclusion ................................................................................................................. 21
References ............................................................................................................................ 22
All “$” in US dollars unless otherwise noted.
ADBI Working Paper 125 Jayasuriya and McCawley
The most urgent questions concern how much humanitarian aid can be mustered by the world's richer countries and how it can be distributed. "The Economist", 1 January 2005, "The Tsunami" (editorial).
I. INTRODUCTION
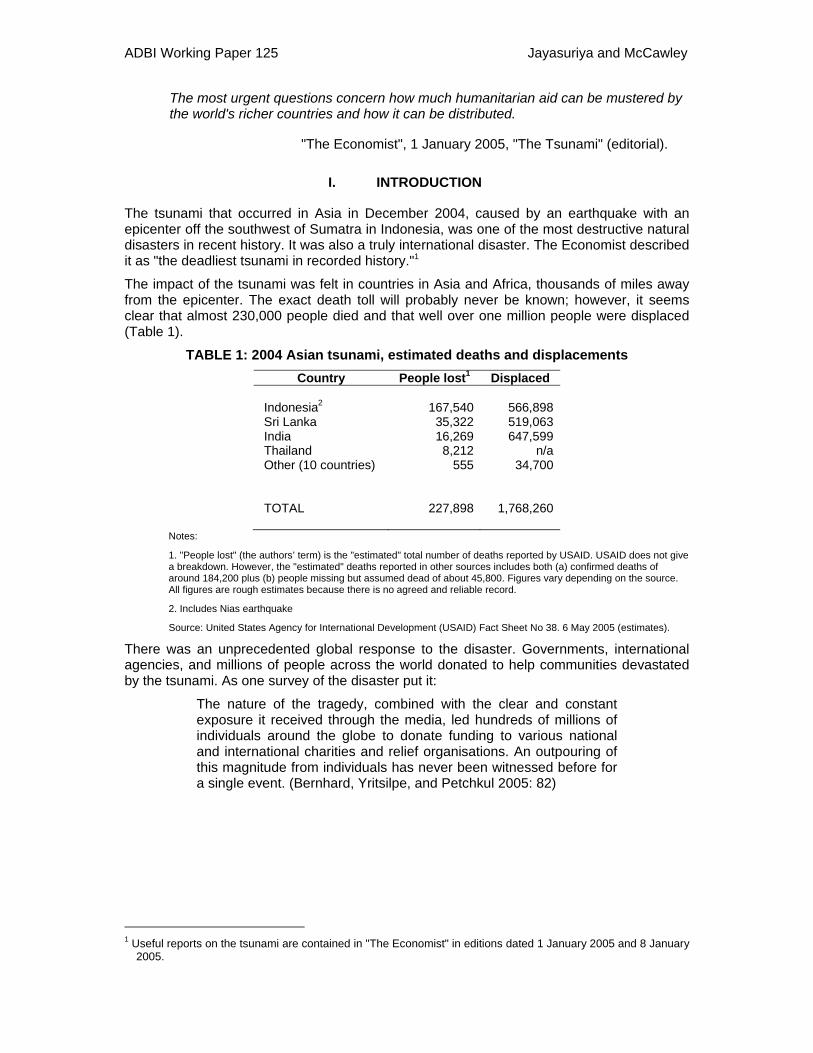
The tsunami that occurred in Asia in December 2004, caused by an earthquake with an epicenter off the southwest of Sumatra in Indonesia, was one of the most destructive natural disasters in recent history. It was also a truly international disaster. The Economist described it as "the deadliest tsunami in recorded history."1
The impact of the tsunami was felt in countries in Asia and Africa, thousands of miles away from the epicenter. The exact death toll will probably never be known; however, it seems clear that almost 230,000 people died and that well over one million people were displaced (Table 1).
TABLE 1: 2004 Asian tsunami, estimated deaths and displacements Country People lost1 Displaced
Indonesia2 Sri Lanka India Thailand Other (10 countries)
167,540
35,322 16,269 8,212
555
566,898 519,063 647,599
n/a 34,700
TOTAL
227,898
1,768,260
Notes:
1. "People lost" (the authors’ term) is the "estimated" total number of deaths reported by USAID. USAID does not give a breakdown. However, the "estimated" deaths reported in other sources includes both (a) confirmed deaths of around 184,200 plus (b) people missing but assumed dead of about 45,800. Figures vary depending on the source. All figures are rough estimates because there is no agreed and reliable record.
2. Includes Nias earthquake
Source: United States Agency for International Development (USAID) Fact Sheet No 38. 6 May 2005 (estimates).
There was an unprecedented global response to the disaster. Governments, international agencies, and millions of people across the world donated to help communities devastated by the tsunami. As one survey of the disaster put it:
The nature of the tragedy, combined with the clear and constant exposure it received through the media, led hundreds of millions of individuals around the globe to donate funding to various national and international charities and relief organisations. An outpouring of this magnitude from individuals has never been witnessed before for a single event. (Bernhard, Yritsilpe, and Petchkul 2005: 82)
1 Useful reports on the tsunami are contained in "The Economist" in editions dated 1 January 2005 and 8 January
2005.

2
Most of the affected countries were entirely unprepared for the disaster; this was not surprising. Countries like Sri Lanka had not experienced an event of this kind for millennia.2 Even Indonesia, which frequently experiences serious natural disasters, was caught unprepared. 3 The tsunami exposed the affected countries and communities to unprecedented stress in terms of disaster management. The initial relief effort was widely described as remarkably successful; local communities and national governments immediately organized emergency relief operations and, helped by international agencies, quickly provided food, clean water, basic health services, and temporary shelter to those affected by the disaster. The high-profile international effort to help reconstruction and recovery was also widely hailed for its scale and generosity:
[The t]sunami recovery represents the largest ever mobilisation of donor funds for an emergency and reconstruction effort. All over the world, governments, international agencies and multilateral donors, non-government organisations (NGOs) and individuals supported the provision of humanitarian relief and reconstruction to affected areas. NGOs and the Red Cross movements alone raised over $5 billion, alongside $8 billion pledged by governments and others for recovery and reconstruction. (Schwartz 2006).
The promised funding initially appeared to be more than adequate to cover both initial relief and reconstruction. Indeed, the expected flow of international assistance was such that—as incorporated explicitly into the reconstruction plans in Indonesia—the aim was not simply to replace destroyed housing and infrastructure but, to use a phrase that was commonly heard within the donor community in Aceh at the time, to “build back better.”
Towards the end of the first year after the tsunami, the rehabilitation and reconstruction effort supported by international aid programs seemed to have been a resounding success. There was satisfaction—and more than a whiff of euphoria—in many of the early assessments based on progress reports prepared by national agencies and major international organizations. The observation by Inderfurth, Fabrycky, and Cohen (2005) captured the mood of many of these reports:
While full reconstruction may take five years or longer, if the level of commitment demonstrated by the international community is maintained, the tsunami will be remembered as a model for effective global disaster response, not just as a disaster. Because of the speed and generosity of the response, its effectiveness compared to previous (and even subsequent) disasters, and its sustained focus on reconstruction and prevention, we give the overall aid effort a grade of “A.”
However, these early ultra-rosy assessments seemed unrealistic even then. They have, by now, certainly failed the test of time.
2 Sri Lanka was completely unprepared for the tsunami. In general, Sri Lanka experiences periodic droughts,
floods, landslides, and the occasional cyclone. But the nation had never experienced a tsunami or, indeed, any other type of natural disaster of this scale in recorded history. Even the tsunami generated by the great Krakatoa volcanic eruption of 1883 in Indonesia had lost much of its power by the time it reached Sri Lanka. While minor earth tremors are not uncommon in the country, no serious earthquake has occurred there for three centuries. Historical records indicate that a major earthquake in 1615 inflicted serious damage with large numbers of casualties (http://www.lankalibrary.com/geo/portu/earthquake.htm). Sri Lanka had no effective domestic hazard warning system, and had not felt the need to be part of international early warning systems, such as the Tsunami Warning System (TWS) in the Pacific (with 26 member countries) because the threat of a tsunami was not considered to be of sufficiently high priority to warrant attention to the matter.
3 Since the 2004 tsunami, Indonesia has experienced several seriously destructive natural disasters though not on the same scale as the tsunami.
3
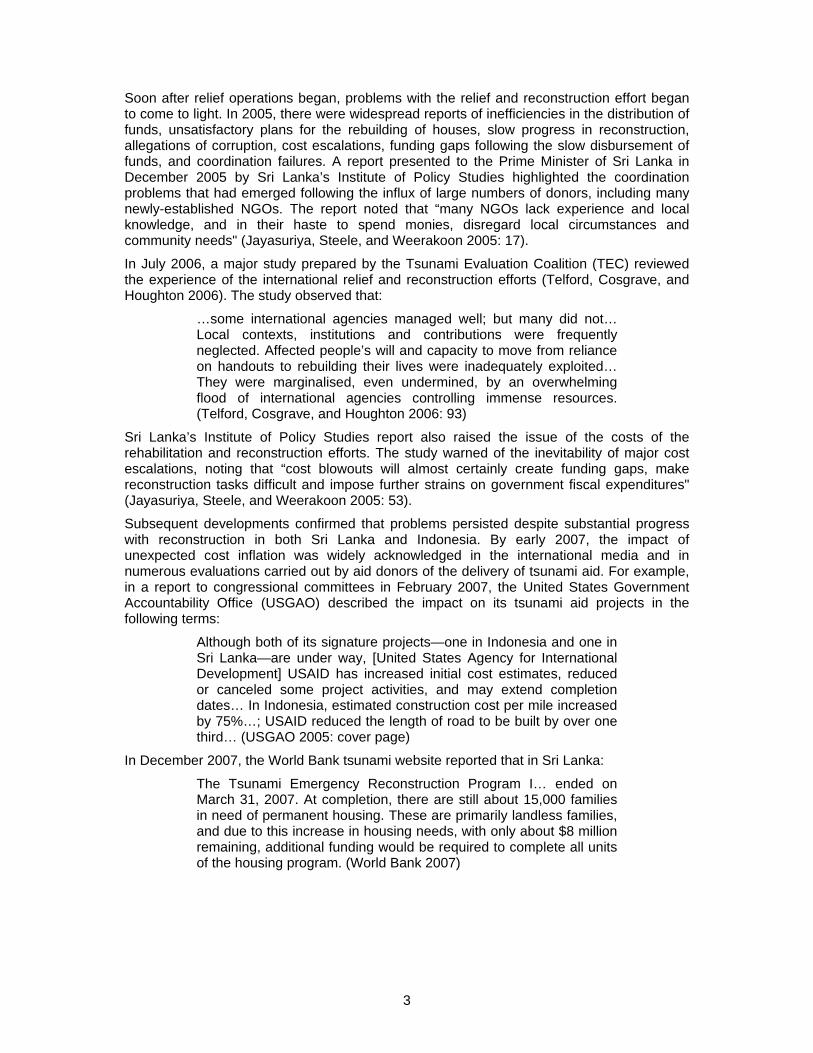
Soon after relief operations began, problems with the relief and reconstruction effort began to come to light. In 2005, there were widespread reports of inefficiencies in the distribution of funds, unsatisfactory plans for the rebuilding of houses, slow progress in reconstruction, allegations of corruption, cost escalations, funding gaps following the slow disbursement of funds, and coordination failures. A report presented to the Prime Minister of Sri Lanka in December 2005 by Sri Lanka’s Institute of Policy Studies highlighted the coordination problems that had emerged following the influx of large numbers of donors, including many newly-established NGOs. The report noted that “many NGOs lack experience and local knowledge, and in their haste to spend monies, disregard local circumstances and community needs" (Jayasuriya, Steele, and Weerakoon 2005: 17).
In July 2006, a major study prepared by the Tsunami Evaluation Coalition (TEC) reviewed the experience of the international relief and reconstruction efforts (Telford, Cosgrave, and Houghton 2006). The study observed that:
…some international agencies managed well; but many did not… Local contexts, institutions and contributions were frequently neglected. Affected people’s will and capacity to move from reliance on handouts to rebuilding their lives were inadequately exploited… They were marginalised, even undermined, by an overwhelming flood of international agencies controlling immense resources. (Telford, Cosgrave, and Houghton 2006: 93)
Sri Lanka’s Institute of Policy Studies report also raised the issue of the costs of the rehabilitation and reconstruction efforts. The study warned of the inevitability of major cost escalations, noting that “cost blowouts will almost certainly create funding gaps, make reconstruction tasks difficult and impose further strains on government fiscal expenditures" (Jayasuriya, Steele, and Weerakoon 2005: 53).
Subsequent developments confirmed that problems persisted despite substantial progress with reconstruction in both Sri Lanka and Indonesia. By early 2007, the impact of unexpected cost inflation was widely acknowledged in the international media and in numerous evaluations carried out by aid donors of the delivery of tsunami aid. For example, in a report to congressional committees in February 2007, the United States Government Accountability Office (USGAO) described the impact on its tsunami aid projects in the following terms:
Although both of its signature projects—one in Indonesia and one in Sri Lanka—are under way, [United States Agency for International Development] USAID has increased initial cost estimates, reduced or canceled some project activities, and may extend completion dates… In Indonesia, estimated construction cost per mile increased by 75%…; USAID reduced the length of road to be built by over one third… (USGAO 2005: cover page)
In December 2007, the World Bank tsunami website reported that in Sri Lanka:
The Tsunami Emergency Reconstruction Program I… ended on March 31, 2007. At completion, there are still about 15,000 families in need of permanent housing. These are primarily landless families, and due to this increase in housing needs, with only about $8 million remaining, additional funding would be required to complete all units of the housing program. (World Bank 2007)

4
The World Bank tsunami website also reported—citing sources from the Indonesian Reconstruction and Rehabilitation Agency (Badan Rekonstruksi dan Rehabilitasi, or BRR)—that 30,000 houses remained to be built (World Bank 2008a). In both Indonesia and Sri Lanka, there were reports not only of cost escalations producing funding gaps but also of institutional and procedural bottlenecks hindering the expenditure of available funds.4
This paper focuses on several aspects of the rehabilitation and reconstruction program following the 2004 tsunami in Asia. Of course, immediate relief activities are of critical importance in disaster management but they are not discussed in detail here. Neither are the political, institutional, and social factors that influence project programming in the aftermath of a massive disaster considered in any detail. Rather, the focus is on two main issues: aid delivery and reconstruction policy following a disaster.
First, the effectiveness and financing of aid delivery arrangements following the tsunami are considered. The discussion aims to go beyond the headline figures on international aid to assess the level, composition, and quality of aid flows. Second, the challenges of designing reconstruction programs in the wake of the tsunami are surveyed. Questions of why there is often inflation in construction costs and its implications are considered.5 These issues are often not discussed in the standard analytical literature.6 Our argument is that the slow disbursement of aid funds, although obviously highly undesirable in the case of urgent relief activities, may have benefits during the reconstruction phase by reducing inflationary pressures and leakage of aid funds. However, there are, of course, pros and cons to slow disbursement. We suggest that there is a need for a phased reconstruction program where the sequencing of activities is carefully prioritized.
II. TSUNAMI RECONSTRUCTION ASSISTANCE
Tsunami damage, as estimated on the basis of replacement costs of the physical assets and infrastructure and foregone income flows, was largest in Indonesia (4.4% of gross domestic product [GDP]) followed by Thailand (2.2% of GDP) and Sri Lanka (1.5% of GDP). Indonesia had the highest number of deaths (167,000), followed by Sri Lanka (almost 36,000 deaths). As a region, however, Aceh in Indonesia suffered the most destruction (97% of local GDP and 4% of population). Nias, a neighboring island, was also damaged by an earthquake in March 2005, though on a smaller scale. Despite the huge scale of the tragedy, the damage to physical assets as a percentage of the national capital stock in each country was relatively small. The overall impact on national GDP of the most-affected countries was also quite small. The regional impact, of course, was much larger.7
Much of the attention, particularly in the international media and in reports of major donor agencies, was focused on the international assistance effort. This was widely described as the "largest ever" international assistance effort in response to a natural disaster. But it should be noted that national governments and communities in the tsunami-affected countries also provided very considerable resources towards the relief effort. The value of these local activities is probably well above the US$3.6 billion minimum estimated in the 4 For several years following the tsunami, the BRR was under-spending its allocated budget. However according
to the same World Bank website, "disbursements have been steadily rising since November 2005 and were about US$4.2 billion (65% of allocated funds) by end of 2007” (World Bank 2008b) Additionally, in Sri Lanka,“ while individual agencies varied in performance, the bilateral and multilateral agencies had spent on average 29 per cent and 32 per cent respectively of committed funds by end 2006” (Weerakoon et al. 2007: 22).
5 We do not review many other economic issues related to natural disasters such as the appropriate size and type of government intervention following a disaster, equity issues, and the various types of market failure that can arise depending on the response chosen. For reviews of this literature, see Freeman, Keen, and Mani (2003), and Benson and Clay (2004).
6 See reviews by Freeman, Keen, and Mani (2003), and Benson and Clay (2004). 7 For detailed discussion of these issues, see Telford, Cosgrave, and Houghton (2006); for three country studies,
see Nazara and Resosudarmo (2007), Weerakoon et al (2007), and Nidhiprabha (2007).

5
TEC study (Telford, Cosgrave, and Houghton 2006) (Table 2). Indeed, national governments and residents later had to carry much of the burden of meeting funding gaps caused by both cost increases and unmet pledges. Anecdotal evidence suggests that (unrecorded) local self-help assistance provided by local communities and private remittances by nationals were not only sizeable but also timely and effective. If the individuals and community groups involved in these efforts had a stronger voice in the national and international media, their efforts would probably be more widely recognized.
TABLE 2: Overall estimates of assistance of tsunami relief
Source of funds US$ million International sources
Governments
6,481
Pledged by Development Assistance Committee (DAC) donor governments
5,888
Pledged by non-DAC governments 593
Private donations
5,490
Private donations to Non Government Organisations (NGOs):
3,214
Private donations to United Nations agencies 494 Private donations to Red Cross/Red Crescent 1,783
Pledges by multilateral banks (loans)
2,095 Private remittances n.a. Other private donations
n.a.
Total identifiable funds (international sources)
14,067
National sources
Affected governments (minimum estimate) 3,400 Private donations in affected countries (minimum
estimate) 190
Affected population n.a. Source: Flint and Goyder 2006.
Reports in the international media tended to suggest that the international community was prepared to bear most of the cost of post-tsunami reconstruction. Unfortunately, there is no reliable source of data which records the amount of aid provided by international donors. Different sources provide different estimates. It is not easy to reconcile the various estimates. According to perhaps the most reliable source, the TEC study, a total of around $14 billion was initially promised by international donors and a minimum of another $3.5 billion of financial support was likely to be forthcoming from domestic sources in the affected countries (Table 2). The figure of $14 billion became the headline figure most frequently mentioned in the year or so following the disaster. This level of assistance was unprecedented: “this was the most rapidly and generously funded disaster response in history” (Telford, Cosgrove, and Houghton 2006: 20). Amartya Sen (2005: 7) has spoken of the "celebration of the outburst of human sympathy" in the aftermath of the tsunami. However, as the authors of the TEC report noted, these figures are no more than broad estimates; they need to be adjusted in various ways to estimate the true level of international

6
assistance. 8 The extent to which the outburst of global sympathy was reflected in the provision of reliable funding by international governments and institutions may have been exaggerated. However, whatever the rhetoric, international aid is rarely motivated by humanitarian ideals alone. As can be seen by even a cursory scanning of statements on the various websites of the major donor agencies, there were multiple objectives in the case of tsunami assistance.9
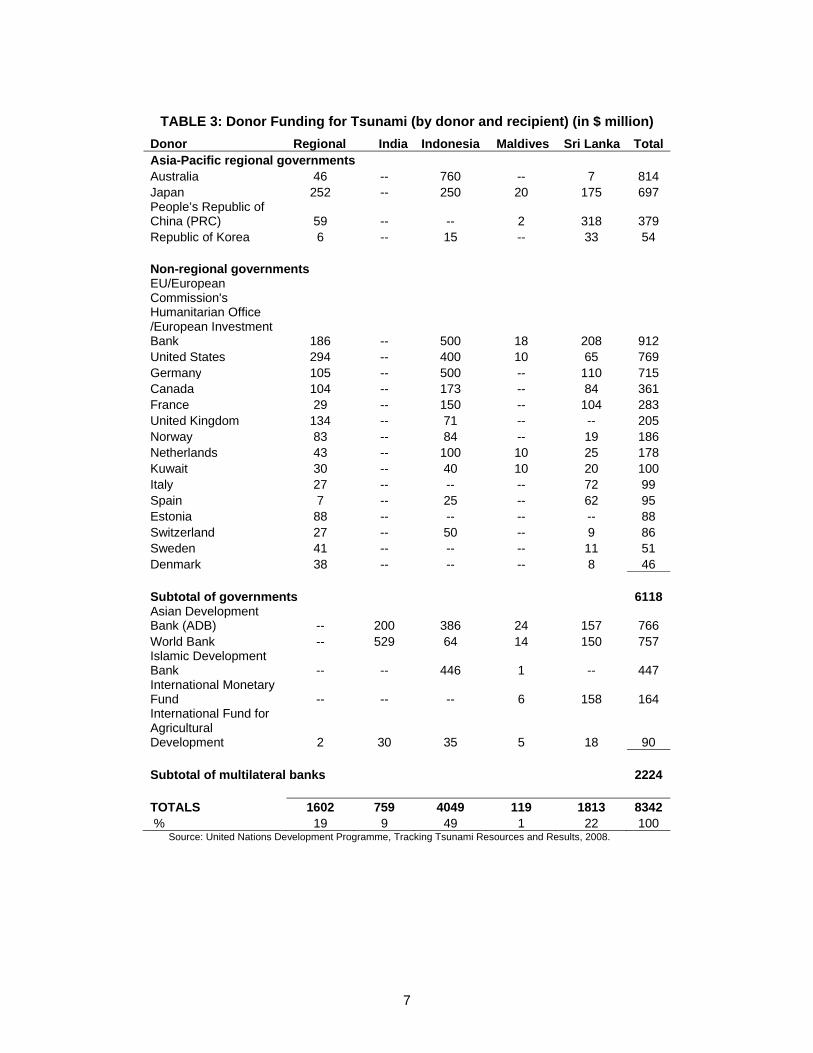
Information on aid flows shows that numerous countries provided assistance. Almost half of the total amount of aid was provided directly to Indonesia (Table 3). There was notable support from some Asia and Pacific regional donor countries supplemented by flows from European Union (EU) institutions, United States (US), European, and other nations as well as the major multilateral developments banks (e.g., World Bank and Asian Development Bank) and the Islamic Development Bank.
8 A careful set of adjustments to the data would provide information about the following: (i) flows by donor and
recipient country; (ii) terms of aid (time period covered by the funding, form of aid by grants and loans including conditions of loan terms, and conditionalities); (iii) national and local contributions as well as international contributions; (iv) an estimate of net additionality; and (v) other contributions not covered by these flows, including military contributions, resources provided in kind, and private remittances.
9 See, for example, the USGAO (2007) report.
7
TABLE 3: Donor Funding for Tsunami (by donor and recipient) (in $ million) Donor Regional India Indonesia Maldives Sri Lanka TotalAsia-Pacific regional governments Australia 46 -- 760 -- 7 814 Japan 252 -- 250 20 175 697 People’s Republic of China (PRC) 59 -- -- 2 318 379 Republic of Korea 6 -- 15 -- 33 54 Non-regional governments EU/European Commission's Humanitarian Office /European Investment Bank 186 -- 500 18 208 912 United States 294 -- 400 10 65 769 Germany 105 -- 500 -- 110 715Canada 104 -- 173 -- 84 361 France 29 -- 150 -- 104 283 United Kingdom 134 -- 71 -- -- 205 Norway 83 -- 84 -- 19 186 Netherlands 43 -- 100 10 25 178 Kuwait 30 -- 40 10 20 100 Italy 27 -- -- -- 72 99 Spain 7 -- 25 -- 62 95 Estonia 88 -- -- -- -- 88 Switzerland 27 -- 50 -- 9 86 Sweden 41 -- -- -- 11 51 Denmark 38 -- -- -- 8 46 Subtotal of governments 6118 Asian Development Bank (ADB) -- 200 386 24 157 766 World Bank -- 529 64 14 150 757 Islamic Development Bank -- -- 446 1 -- 447 International Monetary Fund -- -- -- 6 158 164 International Fund for Agricultural Development 2 30 35 5 18 90 Subtotal of multilateral banks 2224 TOTALS 1602 759 4049 119 1813 8342 % 19 9 49 1 22 100
Source: United Nations Development Programme, Tracking Tsunami Resources and Results, 2008.
8
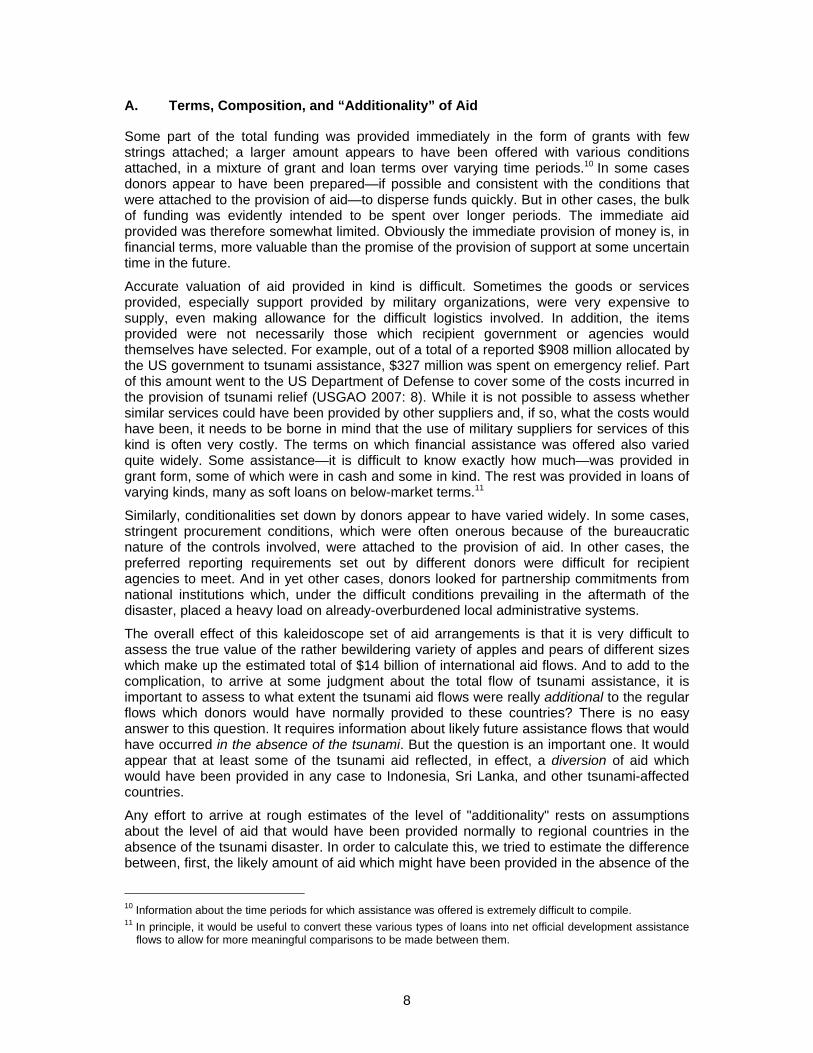
A. Terms, Composition, and “Additionality” of Aid
Some part of the total funding was provided immediately in the form of grants with few strings attached; a larger amount appears to have been offered with various conditions attached, in a mixture of grant and loan terms over varying time periods.10 In some cases donors appear to have been prepared—if possible and consistent with the conditions that were attached to the provision of aid—to disperse funds quickly. But in other cases, the bulk of funding was evidently intended to be spent over longer periods. The immediate aid provided was therefore somewhat limited. Obviously the immediate provision of money is, in financial terms, more valuable than the promise of the provision of support at some uncertain time in the future.
Accurate valuation of aid provided in kind is difficult. Sometimes the goods or services provided, especially support provided by military organizations, were very expensive to supply, even making allowance for the difficult logistics involved. In addition, the items provided were not necessarily those which recipient government or agencies would themselves have selected. For example, out of a total of a reported $908 million allocated by the US government to tsunami assistance, $327 million was spent on emergency relief. Part of this amount went to the US Department of Defense to cover some of the costs incurred in the provision of tsunami relief (USGAO 2007: 8). While it is not possible to assess whether similar services could have been provided by other suppliers and, if so, what the costs would have been, it needs to be borne in mind that the use of military suppliers for services of this kind is often very costly. The terms on which financial assistance was offered also varied quite widely. Some assistance—it is difficult to know exactly how much—was provided in grant form, some of which were in cash and some in kind. The rest was provided in loans of varying kinds, many as soft loans on below-market terms.11
Similarly, conditionalities set down by donors appear to have varied widely. In some cases, stringent procurement conditions, which were often onerous because of the bureaucratic nature of the controls involved, were attached to the provision of aid. In other cases, the preferred reporting requirements set out by different donors were difficult for recipient agencies to meet. And in yet other cases, donors looked for partnership commitments from national institutions which, under the difficult conditions prevailing in the aftermath of the disaster, placed a heavy load on already-overburdened local administrative systems.
The overall effect of this kaleidoscope set of aid arrangements is that it is very difficult to assess the true value of the rather bewildering variety of apples and pears of different sizes which make up the estimated total of $14 billion of international aid flows. And to add to the complication, to arrive at some judgment about the total flow of tsunami assistance, it is important to assess to what extent the tsunami aid flows were really additional to the regular flows which donors would have normally provided to these countries? There is no easy answer to this question. It requires information about likely future assistance flows that would have occurred in the absence of the tsunami. But the question is an important one. It would appear that at least some of the tsunami aid reflected, in effect, a diversion of aid which would have been provided in any case to Indonesia, Sri Lanka, and other tsunami-affected countries.
Any effort to arrive at rough estimates of the level of "additionality" rests on assumptions about the level of aid that would have been provided normally to regional countries in the absence of the tsunami disaster. In order to calculate this, we tried to estimate the difference between, first, the likely amount of aid which might have been provided in the absence of the
10 Information about the time periods for which assistance was offered is extremely difficult to compile. 11 In principle, it would be useful to convert these various types of loans into net official development assistance
flows to allow for more meaningful comparisons to be made between them.

9
tsunami and, second, the likely flow of tsunami aid (Table 4). Both estimates are highly speculative. Nevertheless, the exercise is instructive because of the light it throws on the impact of the tsunami on aid flows.
TABLE 4: Rough estimates of ‘Additionality’, 2005-2011
Year 2005 2006 2007 2008 2009 2010 2011 Total
Tsunami aid flow % 30 20 15 10 10 10 5 100
$ billion 4.2 2.8 2.1 1.4 1.4 1.4 0.7 14.0
Normal aid flow1 $ billion 1.5 1.5 1.5 1.5 1.5 1.5 1.5 10.5
Additionality (max.)2
Additionality (min.)3
Max $ 4.2 2.8 2.1 1.4 1.4 1.4 0.7 14.0
Min $ 2.7 1.3 0.6 -0.1 -0.1 -0.1 -0.8 3.5
Notes:
1. The average net official development assistance flow to Indonesia and Sri Lanka combined for 2002–2004 was approximately $1.5 billion (OECD 2008.
2. Maximum additionality assumes that the total amount of traditional aid flows continue to be provided in addition to the tsunami aid pledges.
3. Minimum additionality assumes that all tsunami pledges are met by reducing aid which would, in the absence of the tsunami, have been provided for other activities.
Source: Estimates prepared by authors.
A rough estimate of the possible distribution of tsunami aid flows is shown in the top line of Table 4. It is assumed, for example, that 30% of the $14 billion was spent in 2005 and that another 20% was spent in 2006. The resulting total expenditure flow for the seven-year period (2005–2011) of $14 billion is shown in the second line. But against this flow (which is a mixture of loans and grants and is therefore not net official development assistance ODA), it needs to be remembered that, in the absence of the tsunami, the affected countries would have received flows of perhaps $1.5 billion in net ODA per year or around $10.5 billion over a seven year period (compared with $14 billion for the tsunami flows).
What do these rough estimates indicate about additionality? Perhaps the main utility of the data is that they indicate rough limits of minimum and maximum likely aid flows to the main tsunami-affected countries over the 2005–2011 period. Two scenarios are shown:
• a "full additionality" scenario
• "no additionality" scenario
Under the full-additionality scenario, total assistance might be expected to reach around $24.5 billion over the seven-year period. However, under a no-additionality scenario, assistance flows would only amount to around $14 billion. The latter scenario, in turn, would imply that what might be called the "true additionality" of tsunami aid was around $3.5 billion. Weighing all of the various considerations, it is very difficult to reach firm conclusions about the real value of the additional total aid flows provided in response to the tsunami disaster. But it is likely to be markedly lower than the much-publicized headline figure of $14 billion.

10
B. Delivery, Disbursement, and Spending
It is hard enough to obtain an accurate picture of the mobilization of funds for tsunami assistance. It is even harder to track data on spending. The TEC study reports on developments up to the end of September 2005. The TEC estimates suggest that disbursements of promised funds had reached slightly over 30% of pledges at that time. But this, at best, is only indicative of spending levels. The TEC report notes that "disbursement by a donor does not necessarily mean that the funds have been spent" (Flint and Goyder 2006: 17). Funds are generally recorded as "disbursed" when they are transferred into the bank account of an implementing agency. In fact, "there is little information on how much has actually been spent." (Flint and Goyder 2006: 17).
Recent audit reports from the US and Australia on the use of tsunami funds provide thoughtful summaries of the practical challenges of implementing spending programs following the disaster. In the case of the US, in May 2005 Congress appropriated $908 million for relief and reconstruction. Of this, $327 million (36%) was allocated to the Department of Defense and USAID for emergency relief activities that have largely been completed. The remaining $581 million (64%) was budgeted for reconstruction and other post-emergency activities. Of this amount, $482 million (about 83%) was allocated to USAID. A summary of progress to December 2006 from the USGAO concluded that only 20% of funds allocated to USAID for reconstruction activities in Indonesia and Sri Lanka had been spent by the end of 2006, two years after the disaster (USGAO 2007).
In the case of the Australian assistance program, responding quickly to the tsunami disaster in early January 2005, the Australian Government announced a large (approximately US$800 million) contribution to a newly formed Australia-Indonesia Partnership for Reconstruction and Development (AIPRD). A report from the Australian National Audit Office provided a preliminary assessment of the framework established to manage the AIPRD rather than of the management of the program itself (Australian National Audit Office 2006). Nevertheless, the report canvassed some of the major issues that were likely to emerge in spending significant amounts of money across Indonesia.
Taken together, these two audit reports, along with many other reports about progress in spending tsunami monies during the two years including up through the end of 2006, pointed to a range of well-known challenges. These included the following:
• The need for proper controls, including risk management controls, over contract and tendering arrangements for the procurement of goods and services;
• The additional pressures that tsunami-related programs placed on already over-burdened Indonesian administrative systems;
• The high probability that final costs of construction programs would exceed initial estimates by considerable amounts because of the escalation of local construction costs;
• Working in regions with long-standing civil conflicts;
• Coordinating activities with host governments and with NGOs; and,
• Ensuring that the focus on tsunami-related programs did not hamper other, non-tsunami development programs.
In addition to these challenges, there is the apparent reluctance, of a growing number public officials (a topic much-discussed in Indonesia recently) to approve expenditures whenever there are any doubts about the legality of doing so.12
12 A similar set of issues attracted comment during the response to the earthquake in Yogyakarta in central Java,
Indonesia, in May 2006.
11
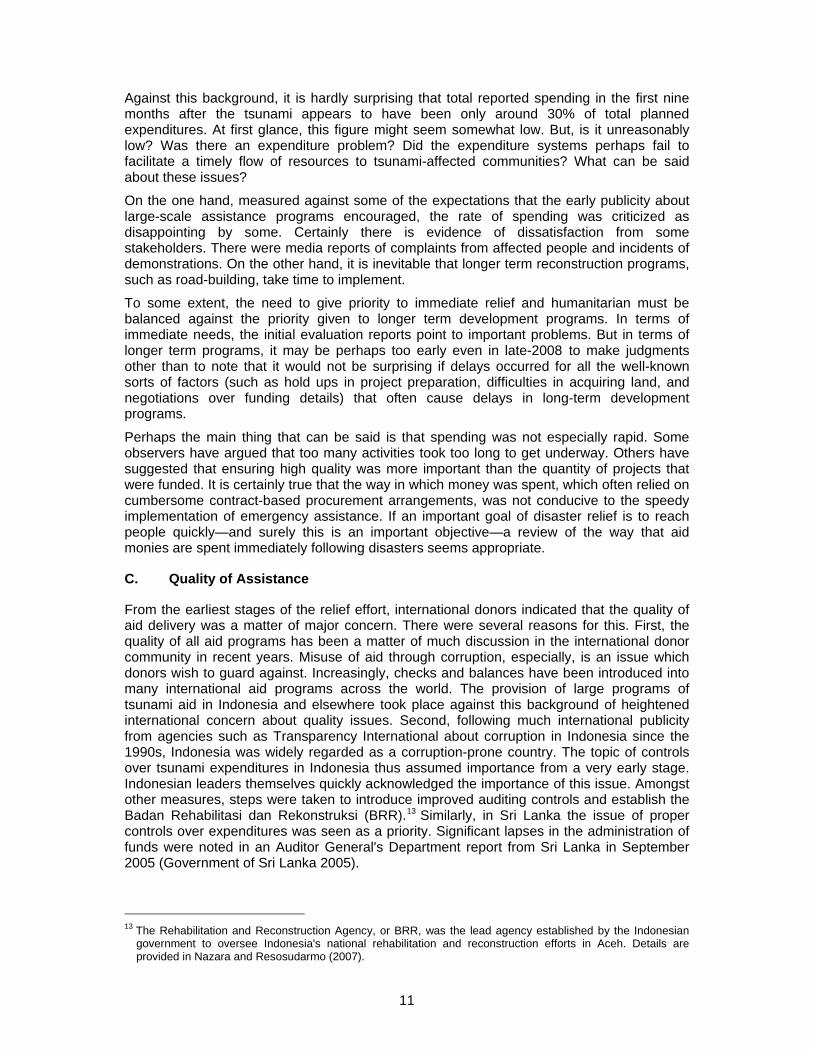
Against this background, it is hardly surprising that total reported spending in the first nine months after the tsunami appears to have been only around 30% of total planned expenditures. At first glance, this figure might seem somewhat low. But, is it unreasonably low? Was there an expenditure problem? Did the expenditure systems perhaps fail to facilitate a timely flow of resources to tsunami-affected communities? What can be said about these issues?
On the one hand, measured against some of the expectations that the early publicity about large-scale assistance programs encouraged, the rate of spending was criticized as disappointing by some. Certainly there is evidence of dissatisfaction from some stakeholders. There were media reports of complaints from affected people and incidents of demonstrations. On the other hand, it is inevitable that longer term reconstruction programs, such as road-building, take time to implement.
To some extent, the need to give priority to immediate relief and humanitarian must be balanced against the priority given to longer term development programs. In terms of immediate needs, the initial evaluation reports point to important problems. But in terms of longer term programs, it may be perhaps too early even in late-2008 to make judgments other than to note that it would not be surprising if delays occurred for all the well-known sorts of factors (such as hold ups in project preparation, difficulties in acquiring land, and negotiations over funding details) that often cause delays in long-term development programs.
Perhaps the main thing that can be said is that spending was not especially rapid. Some observers have argued that too many activities took too long to get underway. Others have suggested that ensuring high quality was more important than the quantity of projects that were funded. It is certainly true that the way in which money was spent, which often relied on cumbersome contract-based procurement arrangements, was not conducive to the speedy implementation of emergency assistance. If an important goal of disaster relief is to reach people quickly—and surely this is an important objective—a review of the way that aid monies are spent immediately following disasters seems appropriate.
C. Quality of Assistance
From the earliest stages of the relief effort, international donors indicated that the quality of aid delivery was a matter of major concern. There were several reasons for this. First, the quality of all aid programs has been a matter of much discussion in the international donor community in recent years. Misuse of aid through corruption, especially, is an issue which donors wish to guard against. Increasingly, checks and balances have been introduced into many international aid programs across the world. The provision of large programs of tsunami aid in Indonesia and elsewhere took place against this background of heightened international concern about quality issues. Second, following much international publicity from agencies such as Transparency International about corruption in Indonesia since the 1990s, Indonesia was widely regarded as a corruption-prone country. The topic of controls over tsunami expenditures in Indonesia thus assumed importance from a very early stage. Indonesian leaders themselves quickly acknowledged the importance of this issue. Amongst other measures, steps were taken to introduce improved auditing controls and establish the Badan Rehabilitasi dan Rekonstruksi (BRR).13 Similarly, in Sri Lanka the issue of proper controls over expenditures was seen as a priority. Significant lapses in the administration of funds were noted in an Auditor General's Department report from Sri Lanka in September 2005 (Government of Sri Lanka 2005).
13 The Rehabilitation and Reconstruction Agency, or BRR, was the lead agency established by the Indonesian
government to oversee Indonesia's national rehabilitation and reconstruction efforts in Aceh. Details are provided in Nazara and Resosudarmo (2007).
12
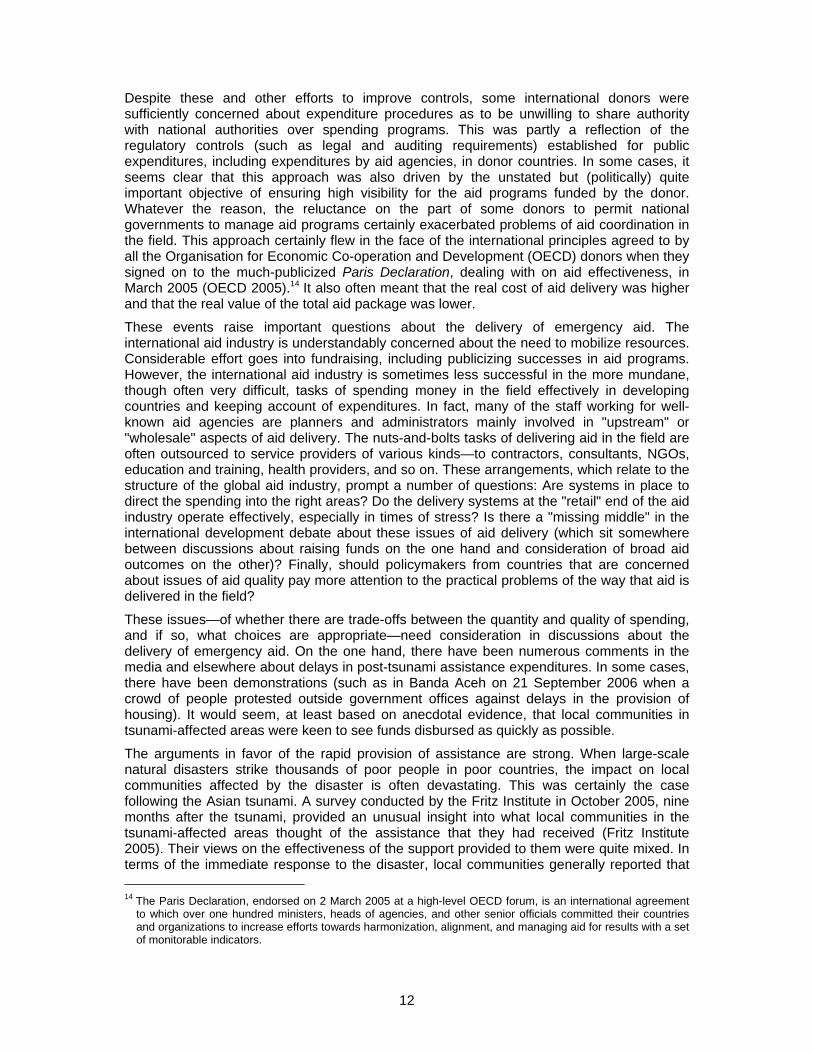
Despite these and other efforts to improve controls, some international donors were sufficiently concerned about expenditure procedures as to be unwilling to share authority with national authorities over spending programs. This was partly a reflection of the regulatory controls (such as legal and auditing requirements) established for public expenditures, including expenditures by aid agencies, in donor countries. In some cases, it seems clear that this approach was also driven by the unstated but (politically) quite important objective of ensuring high visibility for the aid programs funded by the donor. Whatever the reason, the reluctance on the part of some donors to permit national governments to manage aid programs certainly exacerbated problems of aid coordination in the field. This approach certainly flew in the face of the international principles agreed to by all the Organisation for Economic Co-operation and Development (OECD) donors when they signed on to the much-publicized Paris Declaration, dealing with on aid effectiveness, in March 2005 (OECD 2005).14 It also often meant that the real cost of aid delivery was higher and that the real value of the total aid package was lower.
These events raise important questions about the delivery of emergency aid. The international aid industry is understandably concerned about the need to mobilize resources. Considerable effort goes into fundraising, including publicizing successes in aid programs. However, the international aid industry is sometimes less successful in the more mundane, though often very difficult, tasks of spending money in the field effectively in developing countries and keeping account of expenditures. In fact, many of the staff working for well-known aid agencies are planners and administrators mainly involved in "upstream" or "wholesale" aspects of aid delivery. The nuts-and-bolts tasks of delivering aid in the field are often outsourced to service providers of various kinds—to contractors, consultants, NGOs, education and training, health providers, and so on. These arrangements, which relate to the structure of the global aid industry, prompt a number of questions: Are systems in place to direct the spending into the right areas? Do the delivery systems at the "retail" end of the aid industry operate effectively, especially in times of stress? Is there a "missing middle" in the international development debate about these issues of aid delivery (which sit somewhere between discussions about raising funds on the one hand and consideration of broad aid outcomes on the other)? Finally, should policymakers from countries that are concerned about issues of aid quality pay more attention to the practical problems of the way that aid is delivered in the field?
These issues—of whether there are trade-offs between the quantity and quality of spending, and if so, what choices are appropriate—need consideration in discussions about the delivery of emergency aid. On the one hand, there have been numerous comments in the media and elsewhere about delays in post-tsunami assistance expenditures. In some cases, there have been demonstrations (such as in Banda Aceh on 21 September 2006 when a crowd of people protested outside government offices against delays in the provision of housing). It would seem, at least based on anecdotal evidence, that local communities in tsunami-affected areas were keen to see funds disbursed as quickly as possible.
The arguments in favor of the rapid provision of assistance are strong. When large-scale natural disasters strike thousands of poor people in poor countries, the impact on local communities affected by the disaster is often devastating. This was certainly the case following the Asian tsunami. A survey conducted by the Fritz Institute in October 2005, nine months after the tsunami, provided an unusual insight into what local communities in the tsunami-affected areas thought of the assistance that they had received (Fritz Institute 2005). Their views on the effectiveness of the support provided to them were quite mixed. In terms of the immediate response to the disaster, local communities generally reported that 14 The Paris Declaration, endorsed on 2 March 2005 at a high-level OECD forum, is an international agreement
to which over one hundred ministers, heads of agencies, and other senior officials committed their countries and organizations to increase efforts towards harmonization, alignment, and managing aid for results with a set of monitorable indicators.

13
the fastest assistance was from local support groups (Table 5). In the medium term, issues of shelter and severe loss of income were rated of high importance for survivors of the disaster (Box 1).
Table 5: Recall About Service Providers by Affected Families (first 48 hours) (in percentage)1
Rescue Burial Food Water Clothes Shelter Medical
care CounselingIndonesia (Number of respondents = 500, in the five most affected areas) Private Individuals 91 88 88 93 86 87 74 78 Government 5 2 6 4 4 8 10 3
International non-governmental organization (NGO) 1 1 1 1 1 1 3 4
Local NGO 2 2 2 1 2 1 1 1 Religious organizations 1 7 2 1 7 2 13 1 Corporate sector 0 0 0 0 0 0 0 0 Total 100 100 100 100 100 100 100 100 Sri Lanka (Number of respondents = 800, from 98 villages) Private Individuals 72 60 52 48 57 24 11 30 Government 8 11 4 9 3 17 34 6 International NGO 6 5 11 14 11 15 26 22 Local NGO 8 10 10 9 8 12 13 13 Religious organizations 1 8 16 15 15 24 9 22 Corporate sector 4 3 5 4 3 5 4 3 Total 100 100 100 100 100 100 100 100 India (Number of respondents = 1,000, from 93 villages) Private Individual 4 3 11 8 16 8 5 5 Government 23 40 24 40 8 32 57 26 Local village community 47 24 26 18 20 20 1 7 International NGO 0 0 2 1 5 3 12 6 Local NGO 3 2 11 10 15 9 7 19 Religious organizations 5 5 17 12 9 11 5 15 Corporate sector 0 1 9 10 10 5 3 3 Total 100 100 100 100 100 100 100 100
Note: Not all columns add to 100% due to sampling procedures and rounding errors. For details of methodology, see the Fritz Institute report (2005).
Source: Fritz Institute 2005.

14
BOX: Aid Delivery as Seen by Tsunami-Affected Communities
1. Aid provided during the first 48 hours was overwhelmingly local; citizens played a critical role. In the recollections of the tsunami-affected people, the aid provided during the first 48 hours was mostly from private individuals or the local community. In Indonesia, 91% of the rescue services were provided by local individuals.
2. Satisfaction with the services provided during the first 48 hours varied widely; at the 60-day mark, satisfaction levels across countries were more similar. There was wide variation across countries in satisfaction with the immediate rescue and relief services provided. Overall, beneficiaries in India were most satisfied with the services provided in the first 48 hours. Their counterparts in Indonesia were the least satisfied. After the first 60 days, surveys indicated that there was less variation in satisfaction of services provided than was initially the case.
3. Nine months later life was far from normal: there were sharp decreases in household income in all the tsunami-affected areas. Among India, Indonesia, and Sri Lanka, the proportion of losses in income was greatest in Indonesia where an astounding 83% lost more than 50% of their income. In Sri Lanka and India, 59% and 47%, respectively, of those surveyed reported more than a 50% drop in income.
4. Livelihood restoration programs did not get high satisfaction scores. In all three countries, multiple programs to restore livelihoods were implemented. Overall, these programs were not well-rated by beneficiaries.
5. Permanent shelter was the most significant continuing challenge. Nine months after the tsunami the issue of permanent shelter continued to be mired in controversy. Safety and land were key issues. The great majority of affected families were still living in camps or temporary shelters nine months after the disaster. This hampered a return to normal lives and kept the disaster in the forefront of the minds of those affected.
6. Efforts to restore shelter were recognized. Beneficiaries recognized that efforts were being made to restore shelter. Asked about the services supplied, beneficiaries expressed the greatest satisfaction with international NGOs.
7. Psychosocial support, not widely provided, was seen as a critical service. Many aid providers supplied phycho-social support, including counseling. Services provided by international NGOs tended to rate the most highly.
8. Excellence in aid delivery was recognized. In Indonesia, international NGOs were seen as the best aid providers. In Sri Lanka, several local NGOs rated highly. In India, the central and state governments were seen as responsive, organized, and visible. SOURCE: Adapted from Fritz Institute report (2005).
15
On the other hand, as against these shorter term issues, some international observers have emphasized quality in responding to the impact of the tsunami. This approach is implicit in the "build back better" motto which attracted considerable support from international agencies in the tsunami assistance programs. Reflecting these views, Brusset et al (2006: ii) argued that:
Although the recovery period has taken time to move into high gear, there are many reasons for proceeding slowly, perhaps the most important being to get it right. The Government of Indonesia, leading the process, will ultimately be judged by its own people less for slowness and caution than on the quality and sustainability of final outcomes…
In a similar vein, Paul O'Callaghan (2006), Executive Director of the NGO group, Australian Council for International Development, said that:
It would be a mistake to rush projects and build shoddy structures simply to demonstrate rapid progress. We have aimed to 'build back better' through close consultation with local communities. The reconstruction of Darwin [in Australia] after Cyclone Tracy [in 1974] took over six years. For this more complex disaster, the process requires governments and international agencies to remain committed for a very long period in order to produce the necessary quality of results.
It would seem that there are significant differences of opinion about the priority that should be given to quantity versus quality. Local communities in the tsunami-affected areas (the consumers) have often said that they want aid to arrive quickly. But international providers of assistance (the suppliers) have emphasized that controls over quality are needed. In discussing these issues, some observers make comparisons with the way that resources are mobilized within rich nations when there are national disasters within western countries. But it is questionable whether comparisons between the delivery of disaster relief in rich countries and poor countries can be easily made. The numbers of people directly affected in affluent nations are usually relatively small and emergency agencies are generally relatively well-resourced; in contrast, in developing countries it is often the case that many thousands of people are affected and that relief systems are acutely under-resourced.
In any case, delays with reconstruction, shortfalls between initial pledges and actual delivery, and other issues of slow aid delivery are not new to the tsunami assistance effort.15 Arguably the degree to which commitments were met in the period following the tsunami may even be better than in many previous disaster episodes. But the post-tsunami experience certainly reinforces the need for national governments to be prepared for reconstruction funding shortfalls; the indications are that national governments must be ready to cover shortfalls that arise in meeting reconstruction costs if promised donor funding does not arrive.
Overall, the picture that emerges is that the post-tsunami aid program did provide a substantial additional flow of funds into the countries affected by the tsunami and, then, within those countries, into the specific, tsunami-affected regions. Even in the case of previously promised aid, in addition to the shift into tsunami reconstruction activities, there was probably some shift forward in the time profile, thus increasing total inflows in the aftermath of the disaster. The overall result was a significant surge of financial flows. These flows were concentrated both spatially and sectorally: spatially, into disaster affected locations and, sectorally, into the construction sector where the bulk of the replacement of physical assets and infrastructure occurred.
15 See, for example, Foreman and Patrick (eds.) (2000); also see Cuny (1983) for an earlier review of this issue.
16
III. IMPACT OF FINANCIAL FLOWS: EMERGENCE OF A CONSTRUCTION BOOM
A surge of financial flows is to be expected as aid arrives following a natural disaster. Physical asset replacement involving the supply of capital items (such as fishing boats and nets) that can be imported (either from overseas or from elsewhere within the country) is relatively easy and can be arranged as assistance in kind. This type of aid often does not involve financial transactions. Indeed, fishery equipment was replaced quite rapidly and, by and large, quite effectively in all three countries. However, large scale reconstruction is different. A large proportion of reconstruction usually involves the replacement of houses, buildings, bridges, roads, and other infrastructure. This effort leads to a sudden increase in demand in local markets for materials and labor inputs.16 Thus the negative economic shock due to the initial disaster is often followed by a positive “demand shock” in the construction sector. In other words, there is often a construction sector boom.
A boom of this nature usually leads to cost increases. The magnitude of the demand shock depends on the scale of the disaster and the consequent size and pace of the reconstruction program. The degree to which costs increase depends on both the size of this demand shock and on the supply responsiveness of the inputs needed in the construction sector.
If the effects of a disaster are small relative to the size of the national economy, the supply of inputs that the construction industry needs (both materials and labor) will tend to be relatively elastic. More generally, this will tend to be the case both for specific categories of construction materials in abundant supply and for relatively unskilled labor. If all the inputs in demand are internationally “tradable” and can be imported at more or less world prices, the extra demand will probably not lead to major price or cost increases. Many construction materials are indeed tradable—i.e., can be easily imported from world markets—at more or less unchanged prices. For these materials, the impact on world prices of even large increases in demand caused by a local construction program would tend to be small.17
However it is rarely the case that all of the inputs needed in a reconstruction program are in elastic supply. Because the supply of some non-tradable factors (skilled labor is a good example) is usually quite inelastic in the short run, their prices tend to rise as demand increases. Clearly, the stronger the boom in local construction, the greater will be the inflationary impact.18 Shortages of non-tradable factors are likely to be more marked in the short run than in the long run.19 In the case of skilled workers for example, this is true for two reasons: first, because over time, more skilled workers can usually be recruited to ease the shortages; and, second, because in the medium term, increasing numbers of unskilled workers can learn specialized construction skills and will thus expand the supply of skilled labor available. But many factors, particularly specialized types of labor, must often be supplied from local or at least domestic sources (and are therefore “non-traded”).20
16 In the case of Sri Lanka, for example, estimates indicated that at least 100,000 additional workers were
required, including about 13,000 masons, 2,000 carpenters, 2,500 painters, and nearly 54,000 unskilled laborers (Jayasuriya, Steele, and Weerakoon 2005: 38).
17 This is the so-called ”small country” case in economic analysis where, because the economy of a country is small compared to the world economy, economic changes within the relevant country do not affect world prices of tradable goods.
18 It should be noted that references to inflation in this context refer to one-off price increases rather than a sustained process of continuing increases in the general price level which extends over a period of time.
19 Recent experience in Pakistan, US (Hurricane Katrina), and even in Indonesia after the Yogyakarta earthquake in 2006 indicate that sharp construction cost increases in disaster zones are common.
20 For various reasons, such as local political factors, it may not be possible sometimes to important certain factors of production. In the case the construction sector, for example, it is usually possible, in principle, to import skilled labor from other countries. In Sri Lanka following the tsunami, there was a suggestion that skilled labor shortages in the construction sector should be met by importing skilled labor from India. However this proved to be politically unacceptable.

17
A. Construction Cost Escalation
The different experiences in Indonesia, Sri Lanka, and Thailand demonstrate how the interaction between higher demand and supply elasticities took place in different places following the tsunami. In Aceh, Indonesia, the cost of building a new 36 square meter house increased from an initial estimate of US$3,000 to around US$5,000 by end-2005. The increase was driven both by rising labor costs—somewhat moderated by the increased willingness of labor to move into the province of Aceh following the establishment of peace—and, even more importantly, by price increases in domestically sourced building materials such as timber. 21 According to USGAO (2007: 17):
World Bank data provided by USAID show that construction costs increased as a result [of the increased demands for construction and labor]. For example, between October 2004 and October 2005, the average wage for bricklayers, plumbers, and construction supervisors in Aceh increased 55 percent, 72 percent, and 81 percent, respectively.
Overall:
…some key project activities in Indonesia and Sri Lanka—particularly its signature projects intended to generate increased visibility for U.S. assistance—have experienced increased estimated costs, are behind initial schedules, and in the case of Indonesia have been reduced in scope. (USGAO 2007: 31)
In Sri Lanka, too, total construction costs for houses planned for tsunami-affected families rose quickly. Costs were estimated to have risen by 30–50% by August 2005, and, by September 2006, had increased over initial estimates by 60–80% or more. While prices of some materials did increase in Sri Lanka, cost increases were mainly driven by higher wages for skilled labor (such as carpenters, painters, and masons) whose wages doubled in some locations (Weerakoon et al. 2007). Skilled construction labor was in scarce supply in many tsunami-affected locations so workers had to be brought in from outside the affected areas. While the tsunami destroyed the livelihoods of many people and created local unemployment, most of the unemployed people (e.g., local fishermen, farmers, small traders, etc.) had little or no construction skills.
In contrast, in Thailand construction costs actually declined during 2005 following the tsunami (Nidhiprabha 2007: 11) explains this phenomenon by emphasizing the role of local factor supply elasticities due to unemployment and excess capacity in the depressed construction sector of Thailand when the tsunami hit:
The reconstruction activities certainly increased demand in the affected regions for construction materials and labor. This was seen in the opening of a large number of construction material shops in the affected areas. However, higher demand did not lead to price increases. Here it is important to note that the tsunami-affected areas were not very far from the metropolitan Bangkok region, and the overall reconstruction activity was small relative to the size of the Thai economy. What was particularly important was that the higher demand came in the context of a depressed construction sector at the national level, reflecting the overall slowdown in economic activity, which was tending to push prices down. There was considerable excess capacity in the main input markets for construction. Substantial excess capacity in the steel industry led to
21 The reasons for the sharp (and somewhat surprising) increase in the price of timber are discussed by Nazara
and Resosudarmo (2007).

18
declining prices of steel products used in construction, while prices of wood and wood products rose less than five per cent over prices in December 2004. Even though higher oil prices exerted some upward pressure on most materials, prices of essential raw materials such as cement and steel remained subdued during the reconstruction period. Overall, the magnitude of the demand effect was not sufficient to increase prices because there was an elastic supply of construction inputs.
Thus the particular economic circumstances in Thailand, which had yet to fully recover from the 1997 economic crisis, meant that inflation in construction costs in the tsunami-affected areas in Thailand were only moderate.
B. Dutch Disease and Reconstruction Following Disasters
This discussion of the impact of the local construction booms following the Asian tsunami has marked similarities to issues discussed in the well-known “Dutch Disease” literature. Whenever a particular sector in a particular economy experiences a marked boom, the demand for inputs used in that sector (both factors of production and materials) tends to increase. This increased demand, in turn, tends to cause negative impacts for other industries that compete for the inputs used in the booming sector. The increased prices of inputs raise costs and reduce profitability in the competing (non-booming) industries. The resulting negative impact on the non-booming sectors is known as “Dutch Disease,” so-named after the experience in the Netherlands of de-industrialization in the wake of large inflows of export revenues from North Sea Oil in the late 1970s. The broad lesson is that in general, when countries receive large capital inflows, including foreign aid flows, expenditure is often concentrated in certain sectors. These sectors sometimes experience a marked boom while competing non-booming sectors may need to deal with negative Dutch Disease effects which flow from the resulting cost increases.22 The cost increases observed in the construction sectors following the Asian tsunami are a reflection of these Dutch Disease effects associated with absorption of financial inflows into the regional economy.
Certain features associated with this phenomenon of aid funds inflow to finance construction following natural disasters have important policy implications. Suppose, for simplicity, that two main types of inputs—tradable (imported) goods and non-tradable (domestic) goods23—are required to support a construction boom (and, more generally, asset replacement following the loss of assets as a result of the tsunami). Suppose, also, that these inputs are used in fixed proportions. Given world prices of imported tradable goods, a given unit of foreign currency will buy a fixed quantity of imported inputs irrespective of the exchange rate 22 See Corden and Neary (1982) and Corden (1984) for an outline of a basic analytical model for Dutch Disease.
A booming sector also generates expenditure effects which raise the overall demand for goods and services. But higher demand does not always translate into higher prices in the case of (internationally) tradable goods. Generally, such goods can be imported at more or less exogenously fixed world prices while domestically produced and consumed goods (non-tradable goods) tend to experience off-setting price increases. Hence, tradable goods experience cost pressures from booming sectors but do not get much of an offsetting effect from higher income-expenditure related demand increases. As a result the relative price of non-tradables to tradables increases. This fall in the relative profitability of tradable industries is the standard “real exchange rate appreciation” that is a necessary and unavoidable outcome of foreign capital absorption by the domestic economy. This can be minimized in the short-term through foreign exchange market interventions and other sterilization measures, but cannot be entirely avoided.
23 Explanation of terms: (1) Here, there is a distinction between "tradable" and "non-tradable" goods. These goods have the very important difference that "tradable" goods (e.g., oil) are traded freely in world markets and thus have their prices set in world markets. However, "non-tradable" (or "non-traded") goods are not traded in world markets and have their prices set within a country. (2) For most countries, there are two types of "tradable" goods—"imported tradables" (also known as “importables”) and "exported tradables" (also known as “exportables”). (3) However, whether any tradable good is an "importable" or "exportable" good depends on the particular country being considered—for example, oil is an "importable" (or imported tradable) for Japan but is an "exportable" (or exported tradable) for Saudi Arabia.

19
of the recipient country.24 But the amount of domestic non-tradable inputs that a unit of foreign currency can purchase depends on both the nominal exchange rate and on the domestic price of those inputs. The cost escalations which reflect the Dutch Disease are closely associated with the local prices of these domestic (non-traded) inputs.
If the nominal foreign exchange rate is fixed, the amount of local construction that can be financed for any given amount of foreign aid (say, $1 million) will be lower and the higher the domestic rate of inflation will be.25 The country’s exchange rate policy, therefore, becomes an important matter to consider. A policy of propping up the nominal exchange rate by “leaning against the wind” in foreign exchange markets (as, for example, appears to have occurred in Sri Lanka following the tsunami) makes it much harder to fund rehabilitation or reconstruction programs with any given amount of foreign aid. 26 By contrast, domestic inflationary pressures can be partially mitigated by trade liberalization which tends to reduce the costs of tradable goods (including imported intermediate goods used in construction and other aid activities).
Distributional issues also need to be considered. The sensitive matter of the "fair use" of aid often arises in the wake of a disaster. It is a fact of life that some people tend to benefit more than others when a Dutch Disease type phenomenon occurs. Because of this, allegations that local traders said to be "monopolists" had indulged in activities believed to be "profiteering" and were therefore "exploiting disaster victims" are not unusual. In fact, it is true that following a disaster such as the tsunami, the local inflation of prices for inputs in short supply (such as skilled labor and certain materials) can create something of a bonanza for suppliers of these inputs. Inflation therefore tends to create a redistribution of construction-targeted aid funds, sometimes seen as an unfair windfall gain, to suppliers of these inputs. The result, within any given budget, is that plans about the scale of construction need to be revised downwards when the costs of construction rise, and, consequently, the expectations that had been raised amongst aid-beneficiary groups tend to be disappointed. 27
Given these problems there is surely a case for relieving supply bottlenecks by encouraging more imports, including the import of skilled labor. This approach would help reduce cost pressures and support faster construction programs. Further, an expanded reconstruction program would inject much-needed funds into the depressed local economy (see the comments in Box 1 earlier) and would help generate jobs for unemployed local people, many of whom often lack the skills to participate in the construction boom. The extra expenditure from both imported skilled labor and locally employed labor would in turn have a wider multiplier effect, lifting overall demand in the local economy. This was observed to be an important aspect of the revival of the regional economy in Aceh and Nias (Indonesia) following the tsunami.
24 The assumption is that the recipient country is a “small” country in world markets so its international
transactions do not have a significant impact on world market prices. 25 The regional economy of the disaster affected area may be considered as a distinct entity within the broader
national economy that has a fixed exchange rate with the rest of the economy. Then, the same considerations apply for funds coming into the region from within the country itself.
26 In the immediate aftermath of the tsunami in Sri Lanka there were euphoric expectations of massive capital flows, peace, and economic prosperity. In this atmosphere, the Sri Lanka rupee appreciated (see Figure 5 in Weerakoon et.al. (2007). Subsequently, the government appeared to have used tsunami aid funds to prop up the currency for political reasons. Such a policy also implies slower absorption (expenditure) of foreign assistance, which reduces domestic cost pressures.
27 In the longer term, higher expenditures by the "profiteering" groups who gain these higher incomes will tend to raise costs throughout the economy, thereby tending to squeeze profits in export and import competing industries. In contrast, the availability of services from reconstructed infrastructure and other assets has an offsetting impact in the future on costs, facilitating increased supplies. Thus, investment in domestic capital stock tends, in the first instance, to produce a real exchange rate appreciation. Later, improved international competitiveness may be expected once the capital assets begin to provide services used in the tradable industries.
20
C. Trade-Off: Pace and Amount of Reconstruction
How quickly should reconstruction proceed in the wake of a disaster? Should planners aim, as many locally-affected people often prefer, to repair the damage and to build new houses, schools, and roads as quickly as possible? Or is it better to go more slowly, and to aim to "build back better,” as many donors decided to do in Indonesia and Sri Lanka following the Asian tsunami?
Those who prefer the more measured "build back better" approach argue that if too much construction is undertaken too quickly, the regional construction boom is likely to impose unacceptable burdens on over-stretched local administrative, technical, and economic systems. They point to the risks of severe localized Dutch Disease effects as inflationary pressures mount, and also to the risks of leakages of funds if contracting processes are not carefully managed. The argument in favor of phasing in reconstruction projects over time is that if the demand for inputs is allowed to increase in a measured way, supplies of these inputs will be more elastic. The result, it is suggested, will be that both cost increases as well as the leakage of construction funds will be correspondingly lower. A more phased approach also allows time for training programs to be provided to local people in at least low-skilled construction activities which has both a cost reducing effect and a job-creating effect.28 The overall result of this approach is that more capital assets can be replaced for a given amount of funding. However, a slower pace of reconstruction imposes various costs: it delays the creation of the flow of valuable services from the capital assets so that services are foregone for a longer time. Ideally, a balance needs to be struck between the high costs associated with a rapid pace of capital asset replacement and the losses due to delayed reconstruction. It is best that a program of reconstruction be planned to allow for the costs and benefits associated with different reconstruction projects. This way, rankings can be established on an economically and socially sound basis.
There are also political economy factors to bear in mind when considering the pace of reconstruction. Foreign aid donors do not hang around forever. Unless funds are put to good use quickly the funds may be diverted to other activities as donors’ priorities change. There is some evidence that this happened in the use of donor funds in Indonesia and Sri Lanka following the Asian tsunami. Domestic funding can also be diverted as well. Delays in reconstruction may lead to funds being used in ways that do not really meet the needs of the worst affected groups. In other words, the costs of delays in reconstruction may fall largely on poor and politically weak groups. This issue is particularly important because a financing gap can lead to a rationing of funds. This indeed appears to be the case in Sri Lanka where reconstruction activities were heavily concentrated in politically-favored regions dominated by the majority community.
Finally, there are two points that need to be noted. One is that the negative effects of the Dutch Disease phenomenon during a construction boom following a natural disaster should not be exaggerated. The most direct negative impact of a localized construction boom would be on competing industries outside the local reconstruction areas (probably also in the construction sector in nearby regions). But this negative effect is likely to be relatively short-lived.29 By its very nature, this type of boom is temporary. It reflects activities that rehabilitate the productive base of the economy including key economic infrastructure such as roads,
28 The incentives for people to take up training in new skills depend on expectations and incentives. In Thailand,
Bhanupong (2007) observed that many people were reluctant to undertake training programs to acquire new skills because they expected to go back to their previous jobs in fisheries and tourism relatively quickly. On the other hand, anecdotal evidence from Sri Lanka suggests that many unemployed people were willing to undertake training in simple construction sector skills.
29 This is a more general point that applies to the spending of all types of financial flows—including development aid—that expand the productive capacity of an economy. It should also be mentioned that all economic agents are likely to perceive that the boom is a temporary phenomenon. The boom is therefore unlikely to generate future unemployment later due to downward rigidity of wages and prices when the boom ends.

21
bridges, and ports. A boom of this kind provides lasting benefits that enhance the future profitability of all sectors across the local economy. The main challenge for policymakers is to maximize the benefits that flow from the boom without dissipating reconstruction funds in ways that lead to too high windfall gains for people who were not directly affected by the disaster.
Secondly, it needs to be remembered that cost increases of the kind discussed above are inevitable. They need to be expected and budgeted for when estimating funding requirements for construction programs. Unless this is done, funding gaps will emerge. Indeed, it is surprising that the international disaster management industry apparently did not anticipate this situation in the wake of the Asian tsunami in December 2004.
IV. CONCLUSION
Drawing on experiences in Indonesia, Sri Lanka, and Thailand, this paper focused on two aspects of the large relief and reconstruction program that followed the Asian tsunami in December 2004, a result of which, almost 230,000 people died.
First, various aspects of the effectiveness and financing of aid delivery activities following the tsunami are considered. The discussion attempts to go beyond the “headline” figures on international aid to assess the level, composition, and quality of aid flows. Second, the challenges of designing significant reconstruction programs in the wake of the tsunami were discussed with reference to the well-known literature about the impact of Dutch Disease effects in booming economies. Paradoxically, post-tsunami construction programs were dogged by both slow levels of spending and by funding gaps that emerged as a consequence of construction cost escalation. In light of this experience, the need to plan for significant construction cost increases in major building programs following natural disasters was emphasized. Careful decisions about the pace and the appropriate sequencing of construction activities are needed to ensure the best use of available funds.
More generally, post-disaster relief and rehabilitation programs involve the participation of (and contributions from) public agencies, private sector agencies, and households. There are many important issues—such as the appropriate modes of relief assistance to be used for rebuilding private houses and buildings, and whether government or aid agencies should build and transfer houses or should, instead, provide affected households with direct financial assistance for reconstruction—that are not discussed here. However, the post-tsunami experience provides important insights on how these matters might be approached following large-scale disasters in the Asian region.
22
REFERENCES
Australian National Audit Office. 2006. Arrangements to manage and account for aid funds provided under the Australia-Indonesia Partnership for reconstruction and development. Canberra. June. Audit Report No 50, 2005-06.
Benson, Charlotte and Edward J. Clay. 2004. Understanding the Economic and Financial Impacts of Natural Disasters. Disaster Risk Management Series No. 4. Washington DC: World Bank.
Bernhard, Richard, Yada Yritsilpe, and Orn-usa Petchkul. 2005. Corporate Philanthropy in Thailand, in Philanthropy in Disasters: Tsunami and After. Conference proceedings of the Asian Pacific Philanthropy Consortium. Phuket, 28-30 November.
Brusset, Emergy et al. 2006. Evaluation of the Linkage of Relief, Rehabilitation and Development (LRRD) Regarding Interventions in Connection with the Tsunami Disaster in December 2004: Indonesia Case Study. Report prepared by Channel Research for Swedish International Development Cooperation Agency (SIDA). 21 March.
Callaghan, Paul. 2006. Tsunami response: our giving has changed lives. Press release. Australian Council for International Development. Canberra, 30 March.
Corden, W.M. 1984. Booming Sector and Dutch Disease Economics: Survey and Consolidation. Oxford Economic Papers, 36(2): 359–80.
Corden, W. Max and Peter J. Neary. 1982. Booming Sectors and De-industrialisation in a Small Open Economy. Economic Journal 92: 825–848.
Cuny, Frederick C. 1983. Disasters and Development. New York: Oxford University Press.
Economist. 2005. The Tsunami. Editorial. 1 January. http://www.economist.com/opinion/displaystory.cfm?story_id=E1_PVTRQSV. Accessed 13 November 2007.
First recorded earthquake in Sri Lanka: 14th April, 1615. Web entry at: http://www.lankalibrary.com/geo/portu/earthquake.htm
Flint, Michael and Hugh Goyder. 2006. Funding the tsunami response: A synthesis of findings. London: Tsunami Evaluation Coalition.
Freeman, Paul K., Michael Keen, and Muthukumara Mani. 2003. Dealing with Increased Risk of Natural Disasters: Challenges and Options. IMF Working Paper WP/03/197. Washington DC: International Monetary Fund.
Fritz Institute. 2005. Recipient Perceptions of Aid Effectiveness: Rescue, Relief and Rehabilitation in Tsunami Affected Indonesian, India and Sri Lanka. www.fritzinstitute.org. Accessed 13 August 2008.
Foreman Shepard and Stewart Patrick (eds.). 2000. Good Intentions: Pledges of Aid for Postconflict Recovery. Boulder: Lynne Rienner Publishers.
Government of Sri Lanka. 2005. Interim Report of the Auditor General on the Rehabilitation of the Losses and Damages Caused to Sri Lanka by the Tsunami. Colombo.
Inderfurth, Karl F, David Fabrycky, and Stephen P. Cohen. 2005. The Tsunami Report Card. Foreign Policy. Posted in December 2005. http://www.foreignpolicy.com/story/cms.php?story_id=3314.. Accessed 15 November 2006.
Jayasuriya, Sisira, Paul Steele, and Dushni Weerakoon. 2005. Post-Tsunami Recovery: Issues and Challenges in Sri Lanka. Report Presented to the Prime Minister of Sri Lanka. November. Colombo: Institute of Policy Studies.
———. 2006. Post-Tsunami Recovery: Issues and Challenges in Sri Lanka. Asian Development Bank Institute (ADBI) Research Paper 71. January.

23
Nazara, Suahasil and Budy P. Resosudarmo. 2007. Aceh-Nias Reconstruction and Rehabilitation: Progress and Challenges at End of 2006. ADBI Discussion Paper 70. Tokyo: ADBI.
Nidhiprabha, Bhanupong. 2007. Adjustment and Recovery in Thailand Two Years after the Tsunami. ADBI Discussion Paper 72. Tokyo: ADBI.
Organisation for Economic Co-operation and Development (OECD). 2005. The Paris Declaration on Aid Effectiveness. Agreed to by donor countries at a high level forum. 28 February–2 March. Paris. http://www.oecd.org/dataoecd/11/41/34428351.pdf. Accessed on 13 March 2008.
———. 2008. Geographical Distribution of Financial Flows to Developing Countries, Disbursements, Commitments, Country Indicators, 2002–2006. Development Assistance Directorate. Paris.
Schwartz, Eric. 2006. Responsibilities and challenges. Press Release. July. United Nations. Office of the Special Envoy. http://www.tsunamispecialenvoy.org/default.aspx. Accessed 20 September 2006
Sen, Amartya. 2005. Ethics, development and disaster. Keynote address at the Inter-American Development Bank. 11 January. www.iadb.org/ethics. Accessed 23 January 2007.
Telford, J., J. Cosgrave, and R. Houghton. 2006. Joint evaluation of the international response to the Indian Ocean tsunami: Synthesis report. London: Tsunami Evaluation Coalition.
United Nations Development Programme. 2008. Tracking Tsunami Resources and Results. ttp://tsunamitracking.org/undprcb/index.jsp?sid=1&id=131&pid=70. Accessed 15 October 2008.
United States Agency for International Development (USAID). 2005. Indian Ocean–Earthquakes and Tsunamis. Fact Sheet No. 38. Washington. May 6.
United States Government Accountability Office (USGAO). 2007. Foreign Assistance: USAID Signature Tsunami Reconstruction Efforts in Indonesia and Sri Lanka Exceed Initial Cost and Schedule Estimates, and Face Further Risks. Report to Congressional Committees. February. www.gao.gov/cgi-bin/getrpt?GAO-07-357. Accessed 17 June 2007.
Weerakoon, Dushni, Sisira Jayasuriya, Nisha Arunatilaka, and Paul Steele. 2007. Economic Challenges of Post-Tsunami Reconstruction in Sri Lanka. ADBI Discussion Paper 75. Tokyo: ADBI.
World Bank. 2007. Sri Lanka Tsunami Recovery website. ttp://web.worldbank.org/WBSITE/EXTERNAL/COUNTRIES/SOUTHASIAEXT/0,,contentMDK:21594465~pagePK:2865106~piPK:2865128~theSitePK:223547,00.html. Accessed 13 January 2007.
World Bank. 2008a. Aceh Tsunami Reconstruction Expenditure Tracking Update. April. http://siteresources.worldbank.org/INTINDONESIA/Resources/226271-1176706430507/3681211-1194602678235/Aceh.Reconstruction.Finance.Update.Dec2007.pdf. Accessed on 13 July 2008.
World Bank. 2008b. Indonesia Reconstruction Progress. http://go.worldbank.org/TE61DUE9G0. Accessed 13 August 2008.