Embed Size (px)
Citation preview
Recommended Methods for
Manure Analysis:
John B. Peters
Soil Science Department
University of Wisconsin – Madison

Background
• Multi-regional committee was established
in September 1996 to work on the
development of a manual for manure
sampling, analysis and reporting.
• Committee members from NCR-13, SERA-
6, NEC-67, and MN Dept. of Agriculture
• Publication is available on the web
http://uwlab.soils.wisc.edu/pubs/A3769.pdf
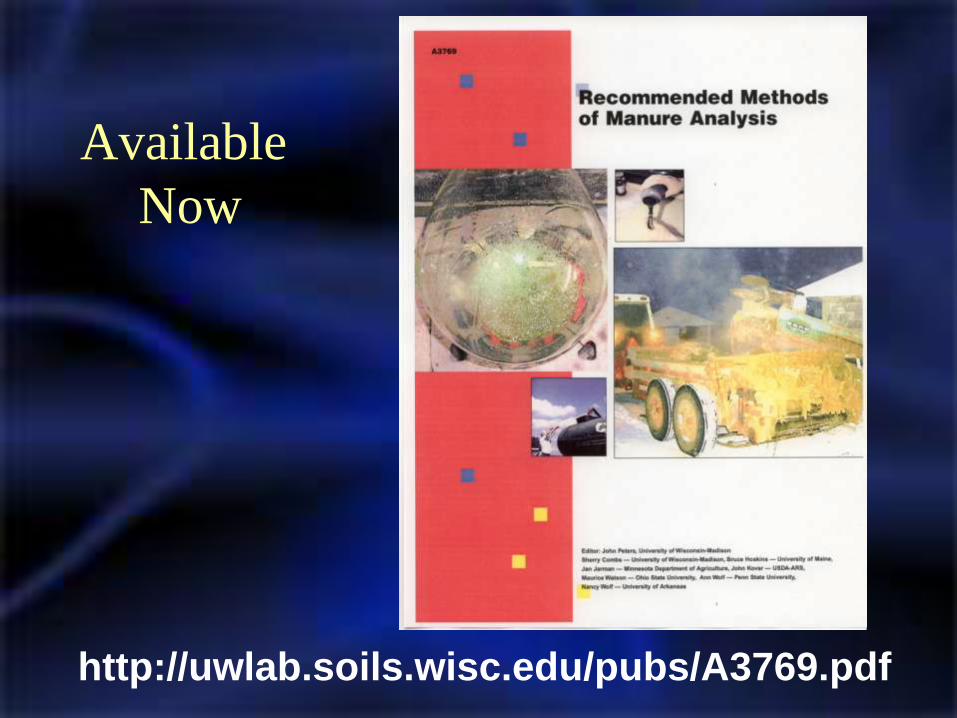
Available
Now
http://uwlab.soils.wisc.edu/pubs/A3769.pdf

Introduction
• Nutrient concentrations can be estimated using
“book” values for available N, P2O5, and K2O
• Manure testing takes management practices into
account and delivers more accurate values
• Sampling technique greatly influences test results
• Sample handling and testing methods also affect
analytical results
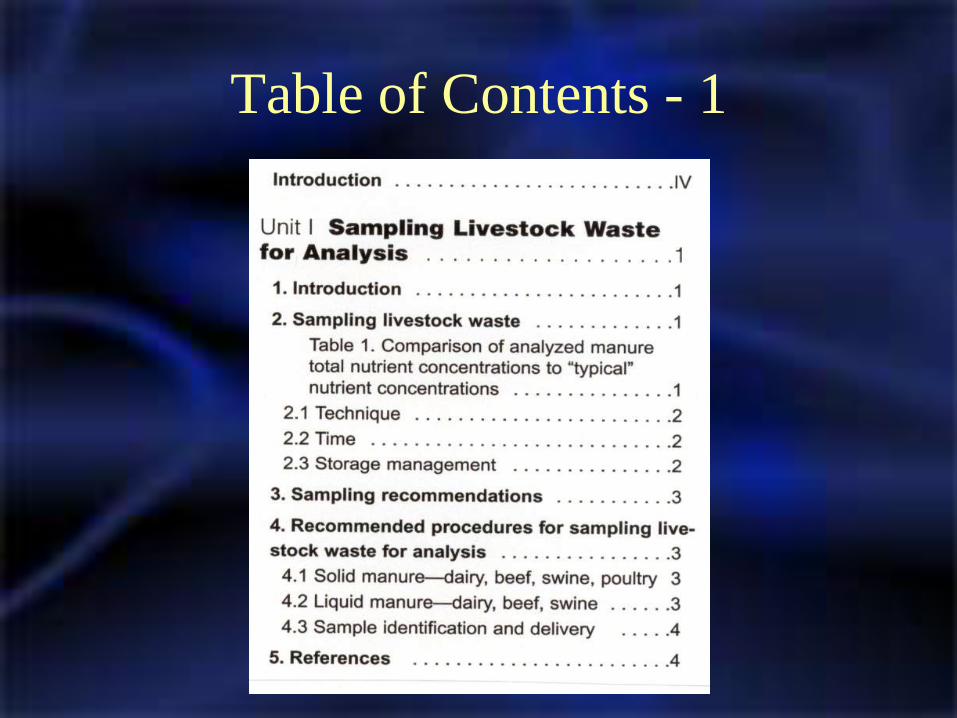
Table of Contents - 1
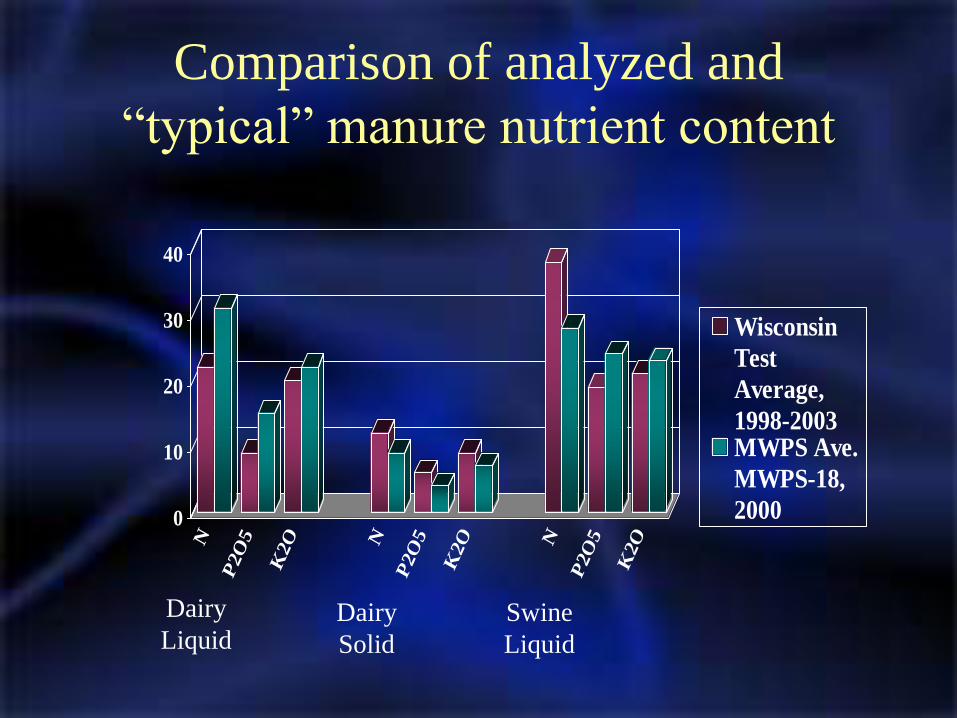
Comparison of analyzed and
“typical” manure nutrient content
0
10
20
30
40
N
P2O
5
K2O N
P2O
5
K2O N
P2O
5
K2O
Wisconsin
Test
Average,
1998-2003MWPS Ave.
MWPS-18,
2000
Dairy
LiquidDairy
Solid
Swine
Liquid
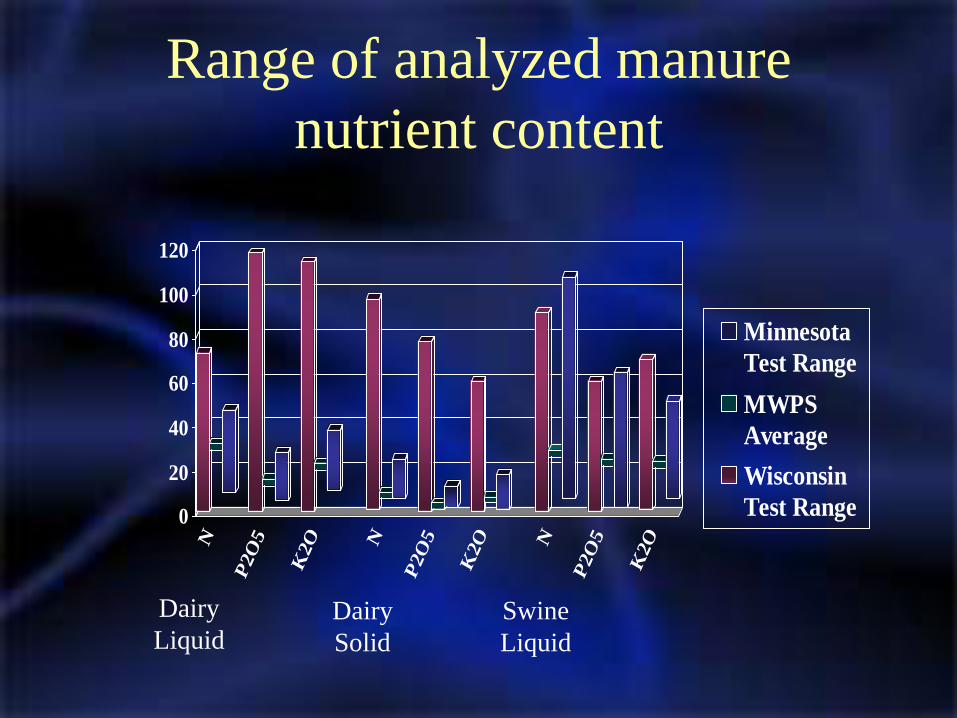
Range of analyzed manure
nutrient content
0
20
40
60
80
100
120
N
P2O
5
K2O N
P2O
5
K2O N
P2O
5
K2O
Minnesota
Test Range
MWPS
Average
Wisconsin
Test Range
Dairy
LiquidDairy
Solid
Swine
Liquid
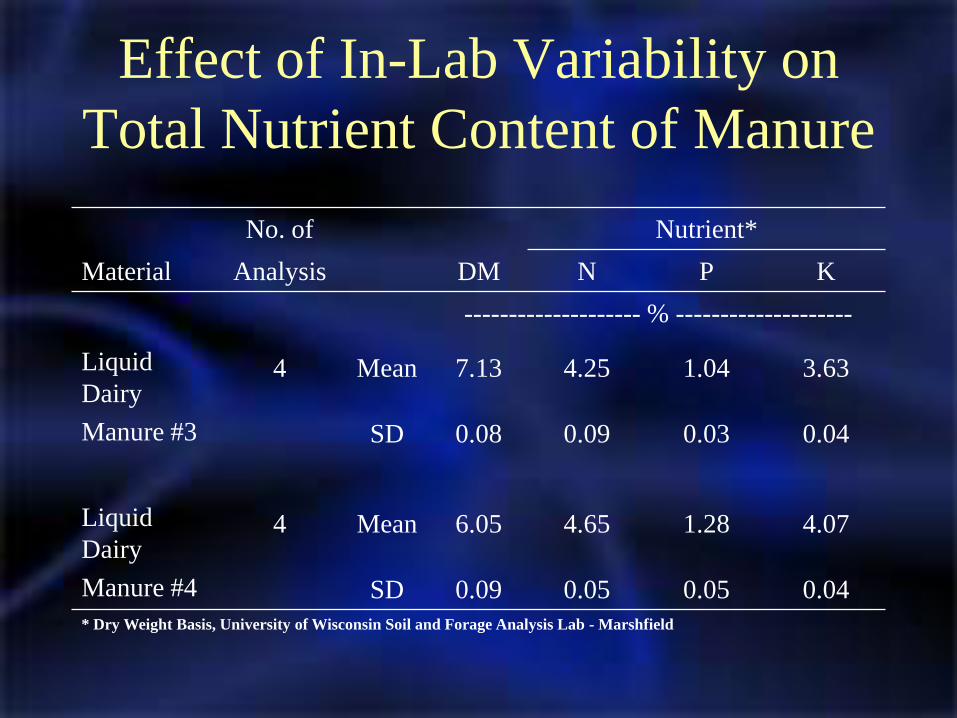
Effect of In-Lab Variability on
Total Nutrient Content of Manure
No. of Nutrient*
Material Analysis DM N P K
-------------------- % --------------------
Liquid
Dairy
Manure #3
4 Mean 7.13 4.25 1.04 3.63
SD 0.08 0.09 0.03 0.04
Liquid
Dairy
Manure #4
4 Mean 6.05 4.65 1.28 4.07
SD 0.09 0.05 0.05 0.04
* Dry Weight Basis, University of Wisconsin Soil and Forage Analysis Lab - Marshfield

Effect of In-Lab Variability on
Total Nutrient Content of Manure
No. of Nutrient*
Material Analysis DM N P K
------------------- % -------------------
Poultry
(fresh)8 Mean 28.14 6.31 1.76 3.08
SD 0.15 1.12 0.04 0.05
Dairy
semi-solid
(fresh)
8 Mean 14.14 3.75 0.83 3.27
SD 0.14 0.26 0.02 0.03
* Dry Weight Basis, University of Wisconsin Soil and Forage Analysis Lab - Marshfield

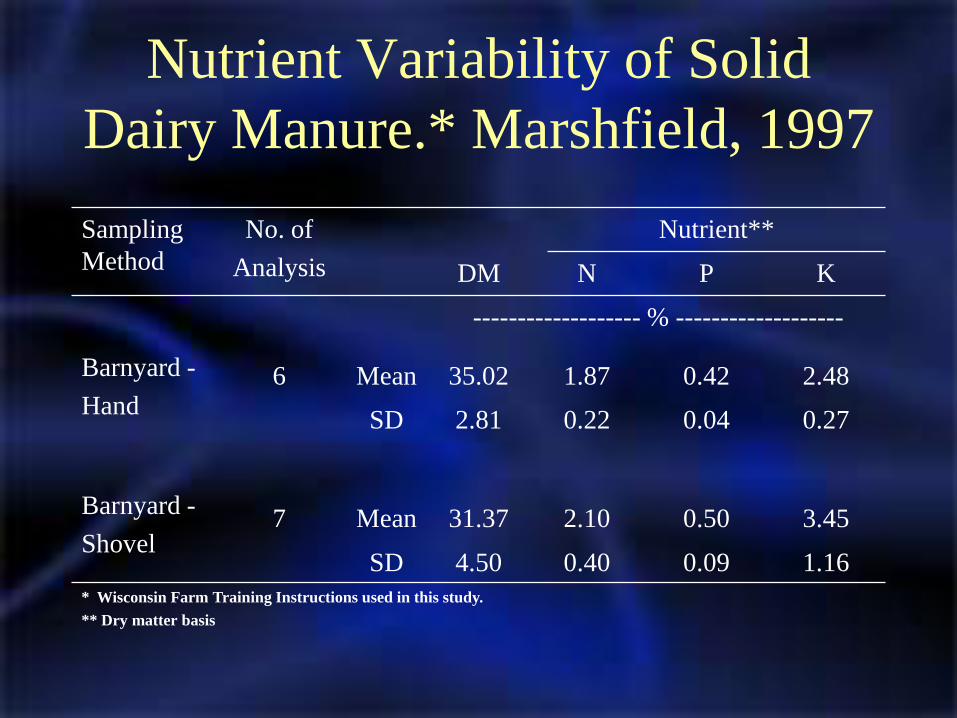
Nutrient Variability of Solid
Dairy Manure.* Marshfield, 1997
Sampling
Method
No. of
Analysis
Nutrient**
DM N P K
------------------- % -------------------
Barnyard -
Hand6 Mean 35.02 1.87 0.42 2.48
SD 2.81 0.22 0.04 0.27
Barnyard -
Shovel7 Mean 31.37 2.10 0.50 3.45
SD 4.50 0.40 0.09 1.16
* Wisconsin Farm Training Instructions used in this study.
** Dry matter basis

Nutrient Variability of Solid
Dairy Manure.* Marshfield, 1997
Sampling
Method
No. of
Analysis
Nutrient**
DM N P K
------------------- % -------------------
Spreader -
Hand6 Mean 34.35 1.98 0.42 2.60
SD 1.41 0.17 0.03 0.39
Spreader -
Shovel6 Mean 34.60 1.98 0.41 2.30
SD 4.82 0.31 0.04 0.31
* Wisconsin Farm Training Instructions used in this study.
** Dry matter basis

Effect of Agitation on Analysis
of Liquid Manure
Minnesota
Animal
System
Loads From
Storage
Nutrient
DM N P2O5 K2O
% ------- lbs/1000 gal -------
Dairy -
Metal Tank
First 8.2 34 16 28
Mid 8.6 33 18 28
Last 8.0 30 14 27
Swine -
Concrete Pit
First 6.9 45 50 15
Mid 8.5 46 60 16
Last 7.4 46 57 18

Effect of Agitation on Analysis
of Liquid Manure
Animal
System
Loads From
Storage
Nutrient
DM N P2O5 K2O
Minnesota -- % -- ---------- lbs/1000 gal ----------
Dairy -
Earthen Pit
First 4.4 24 10 23
Mid 6.0 23 10 22
Last 8.7 27 12 23
Wisconsin*
Dairy -
Earthen Pit
Early** 6.1 24 15 23
Late** 7.1 25 14 25
* Dairy milking herd, Marshfield Agricultural Research Station
** Average of four-subsample analysis

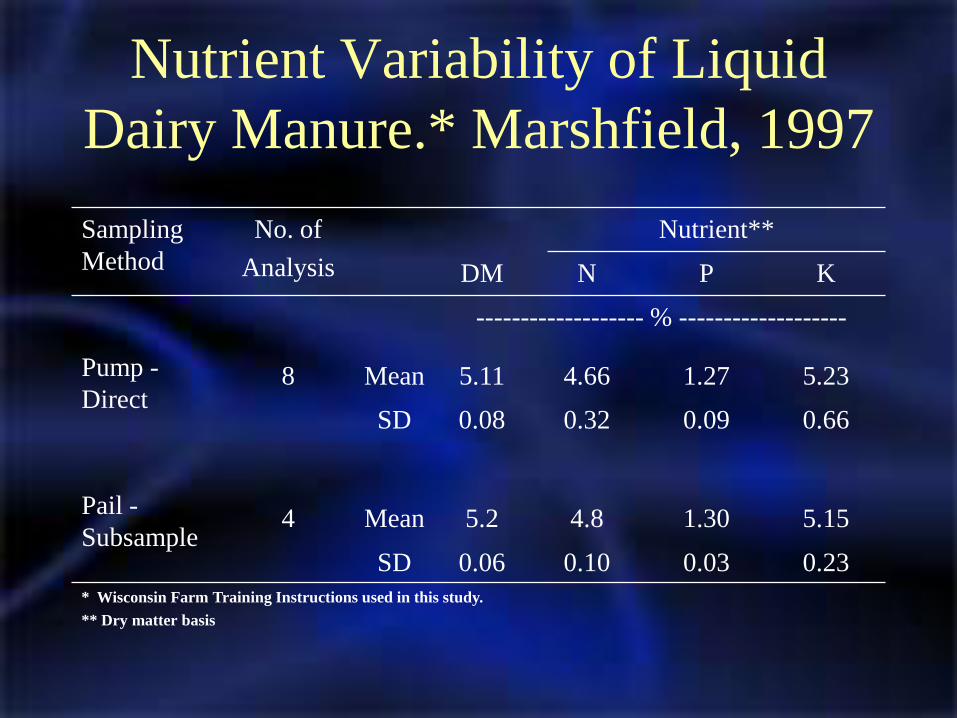
Nutrient Variability of Liquid
Dairy Manure.* Marshfield, 1997
Sampling
Method
No. of
Analysis
Nutrient**
DM N P K
------------------- % -------------------
Pump -
Direct8 Mean 5.11 4.66 1.27 5.23
SD 0.08 0.32 0.09 0.66
Pail -
Subsample4 Mean 5.2 4.8 1.30 5.15
SD 0.06 0.10 0.03 0.23
* Wisconsin Farm Training Instructions used in this study.
** Dry matter basis
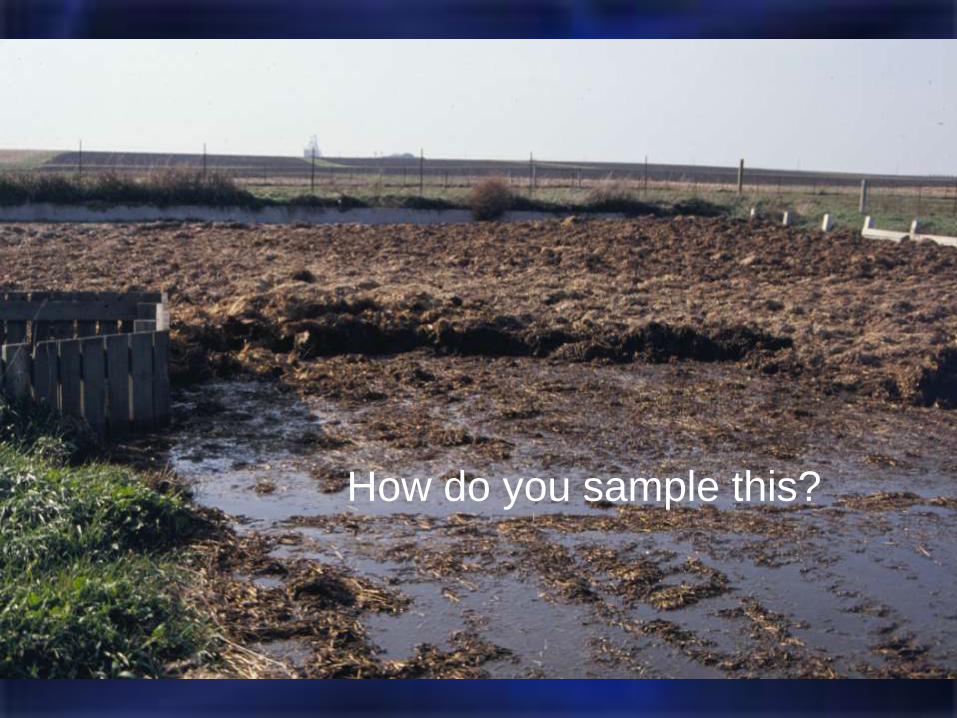
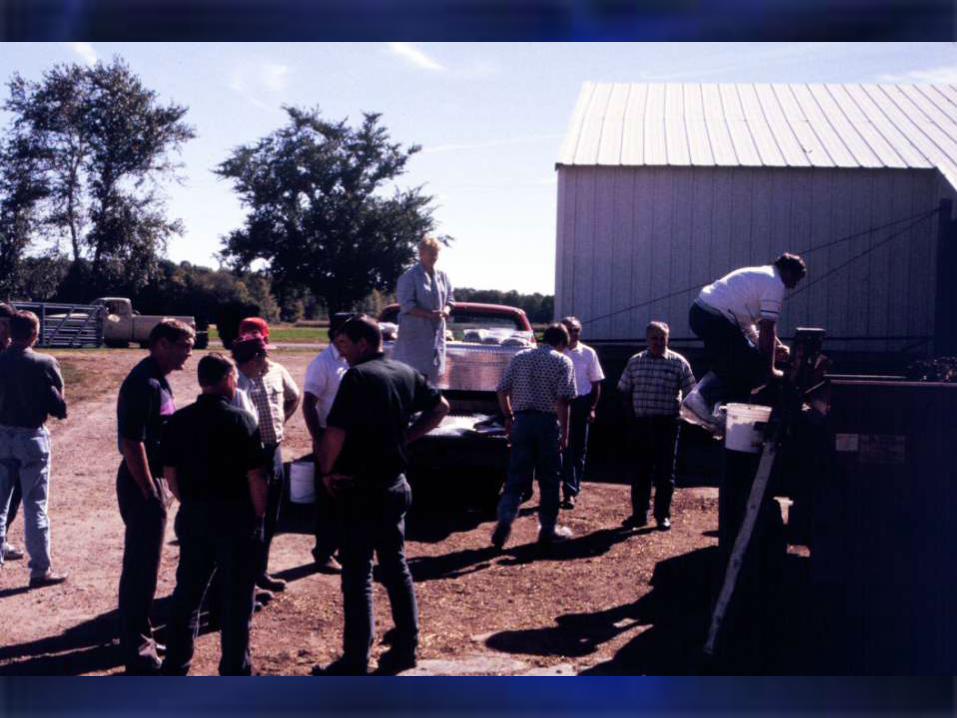
How do you sample this?

Sampling while loading is a better choice
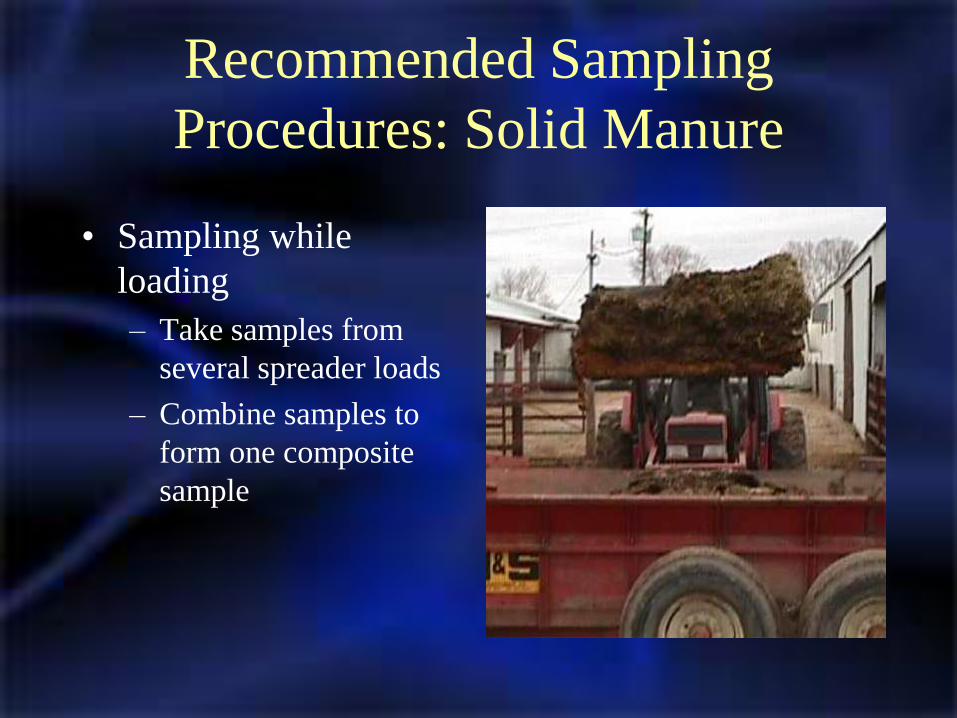
Recommended Sampling
Procedures: Solid Manure
• Sampling while
loading
– Take samples from
several spreader loads
– Combine samples to
form one composite
sample
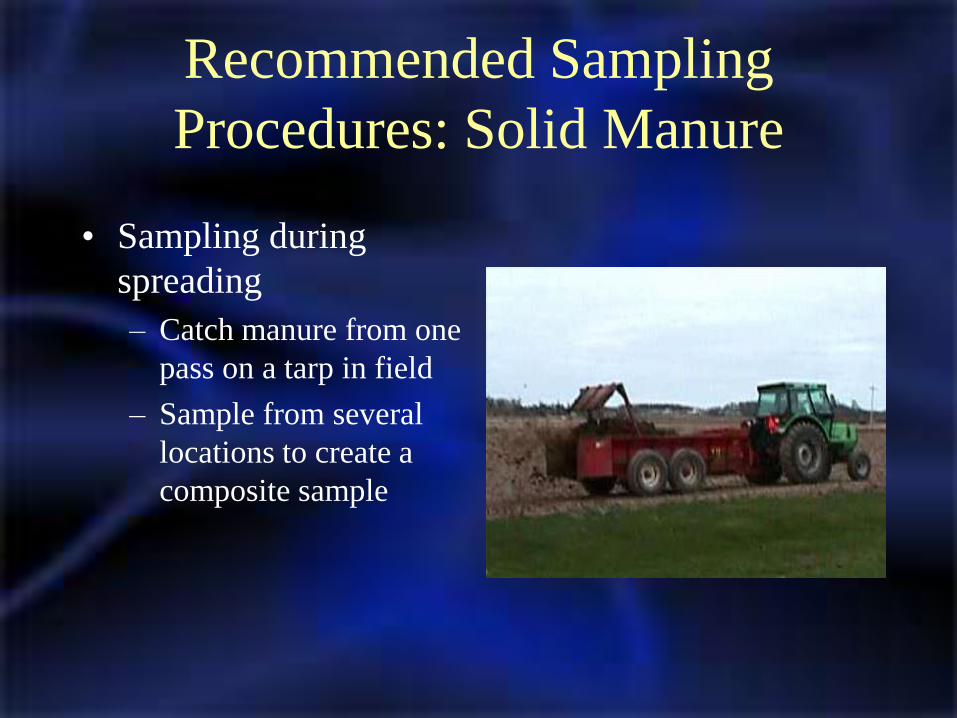
Recommended Sampling
Procedures: Solid Manure
• Sampling during
spreading
– Catch manure from one
pass on a tarp in field
– Sample from several
locations to create a
composite sample
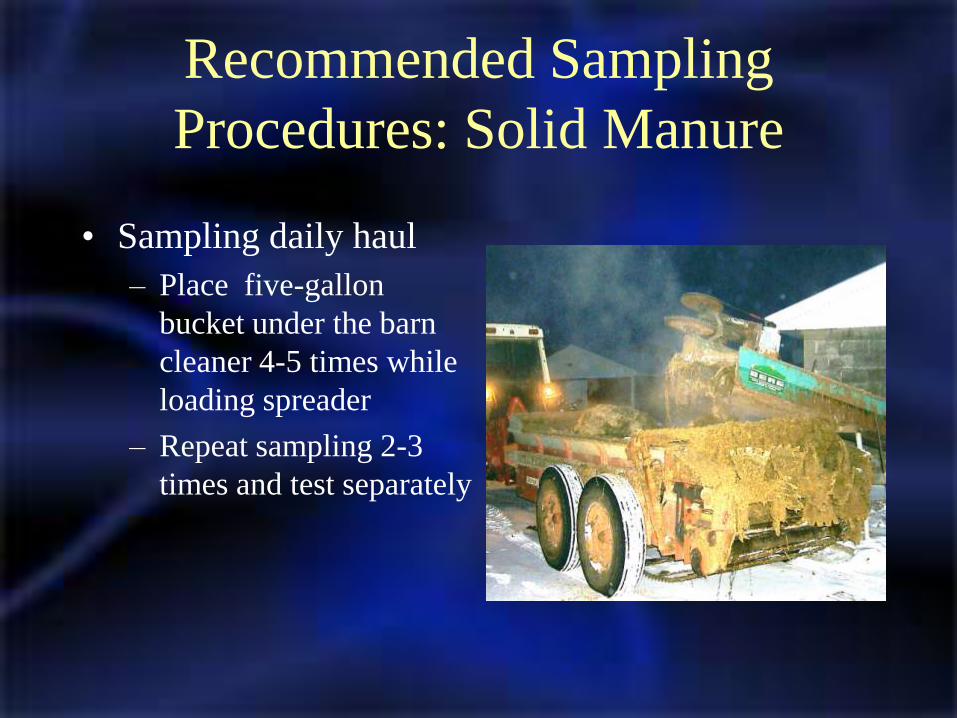
Recommended Sampling
Procedures: Solid Manure
• Sampling daily haul
– Place five-gallon
bucket under the barn
cleaner 4-5 times while
loading spreader
– Repeat sampling 2-3
times and test separately

Recommended Sampling
Procedures: Solid Manure
• Sampling stockpiled
manure
– Take ten subsamples
from different locations
around the pile at least
18 inches below
surface
– Mix thoroughly in a
five-gallon pail
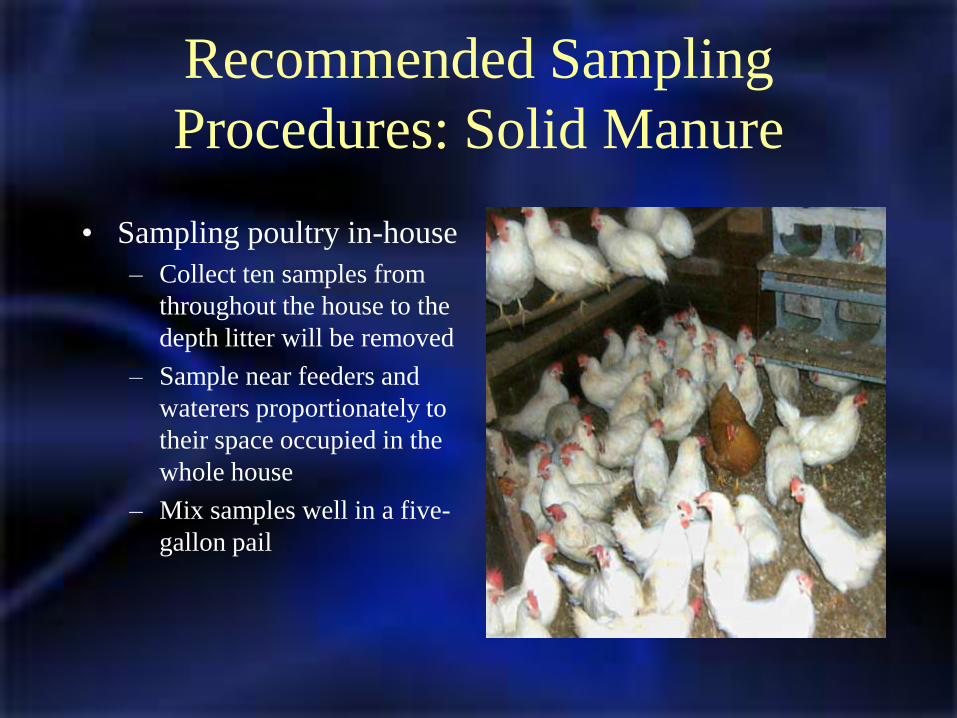
Recommended Sampling
Procedures: Solid Manure
• Sampling poultry in-house
– Collect ten samples from
throughout the house to the
depth litter will be removed
– Sample near feeders and
waterers proportionately to
their space occupied in the
whole house
– Mix samples well in a five-
gallon pail

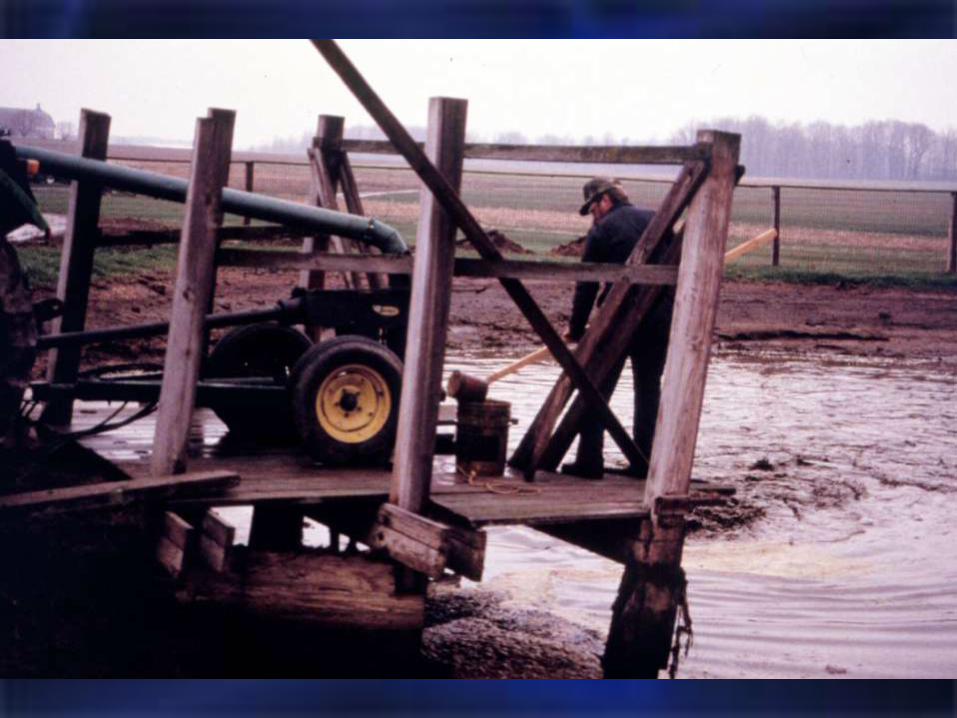
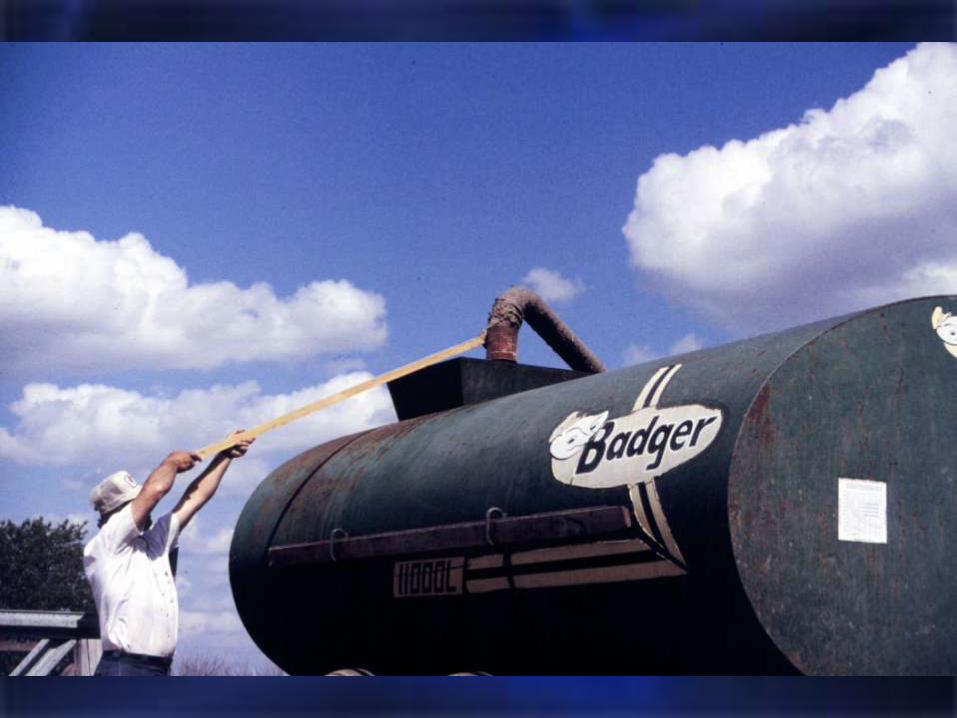
Sampling Procedures: Liquid
Manure
• Sampling from storage
– Agitate storage facility
thoroughly (2-4 hrs
minimum)
– Collect at least five
samples from storage
facility or during
loading using a five
gallon pail
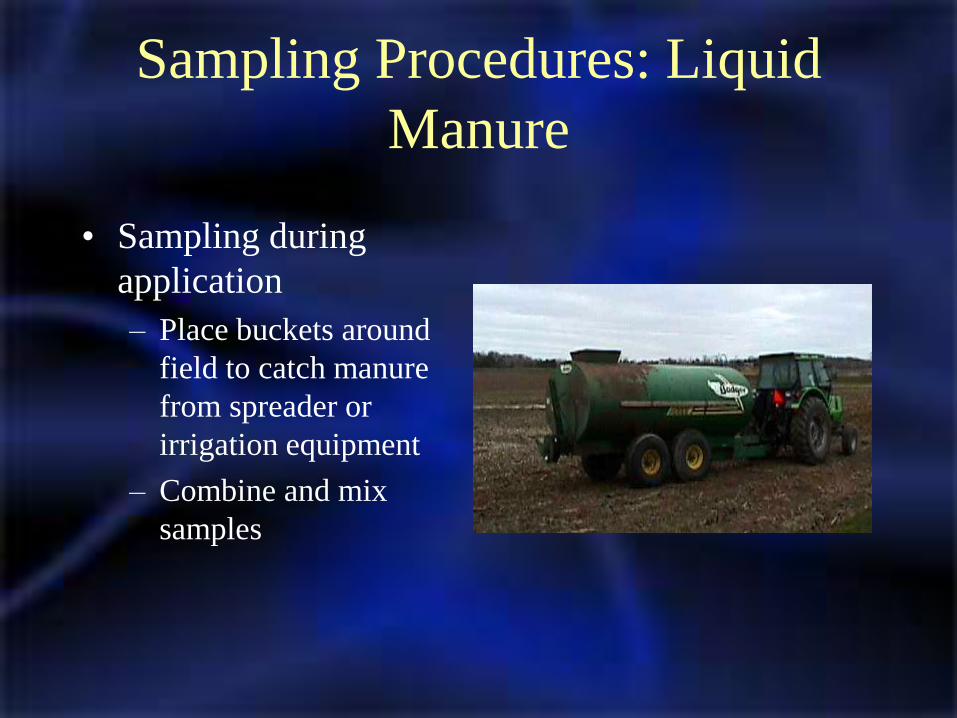
Sampling Procedures: Liquid
Manure
• Sampling during
application
– Place buckets around
field to catch manure
from spreader or
irrigation equipment
– Combine and mix
samples
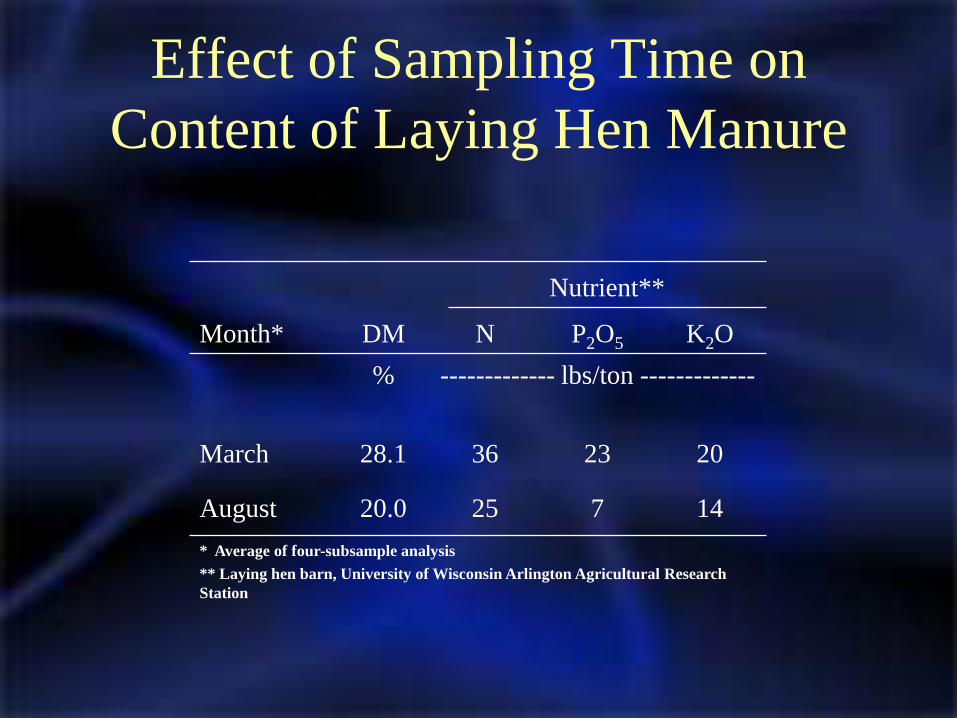
Effect of Sampling Time on
Content of Laying Hen Manure
Month*
Nutrient**
DM N P2O5 K2O
% ------------- lbs/ton -------------
March 28.1 36 23 20
August 20.0 25 7 14
* Average of four-subsample analysis
** Laying hen barn, University of Wisconsin Arlington Agricultural Research
Station
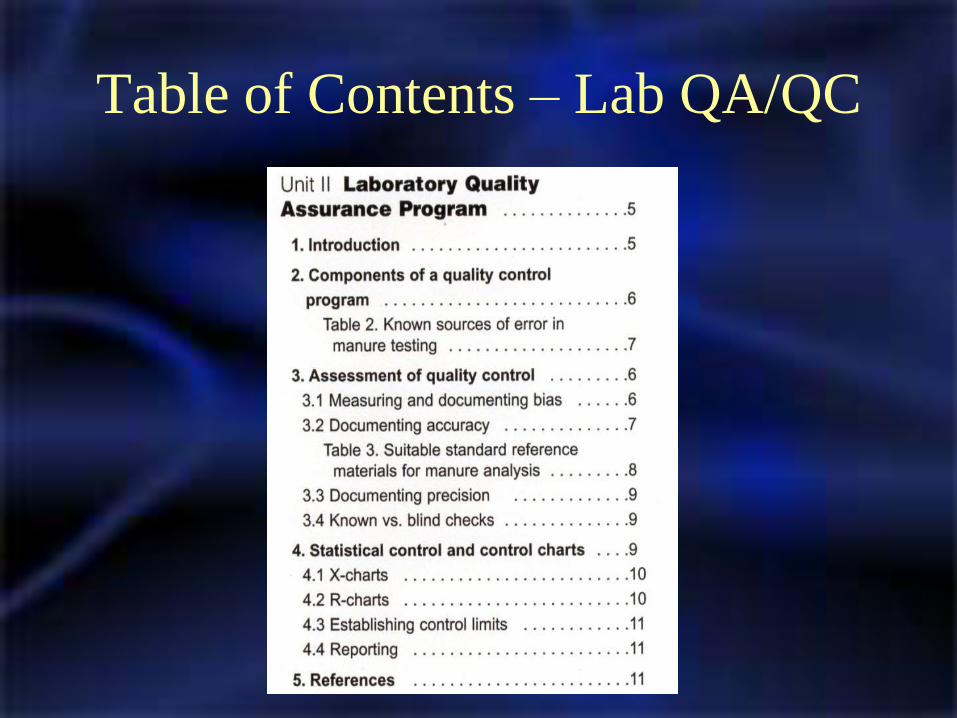
Table of Contents – Lab QA/QC

Quality Assurance
• Ensures consistent quality of analytical
results through the application and
documentation of appropriate quality
control and quality assessment procedures
• Serves to promote client confidence in
analytical results and documenting
analytical uncertainty.

Quality Control
• Comprised of laboratory practices
undertaken specifically to achieve accurate
and reliable analytical results.
• Quality assessment is comprised of the
procedures undertaken to monitor and
document the effectiveness of quality
control practices.
Components of a Quality Control
Program
• Documentation of SOP (standard operating
procedure)
• Training
• Implementation of good laboratory
practices and procedures

Components of a QA/QC
Program
• Document precision
• Document accuracy
• Known vs. blind checks
• Control charts
– X-charts – accuracy and precision
– R-charts – replicate range

X - Charts
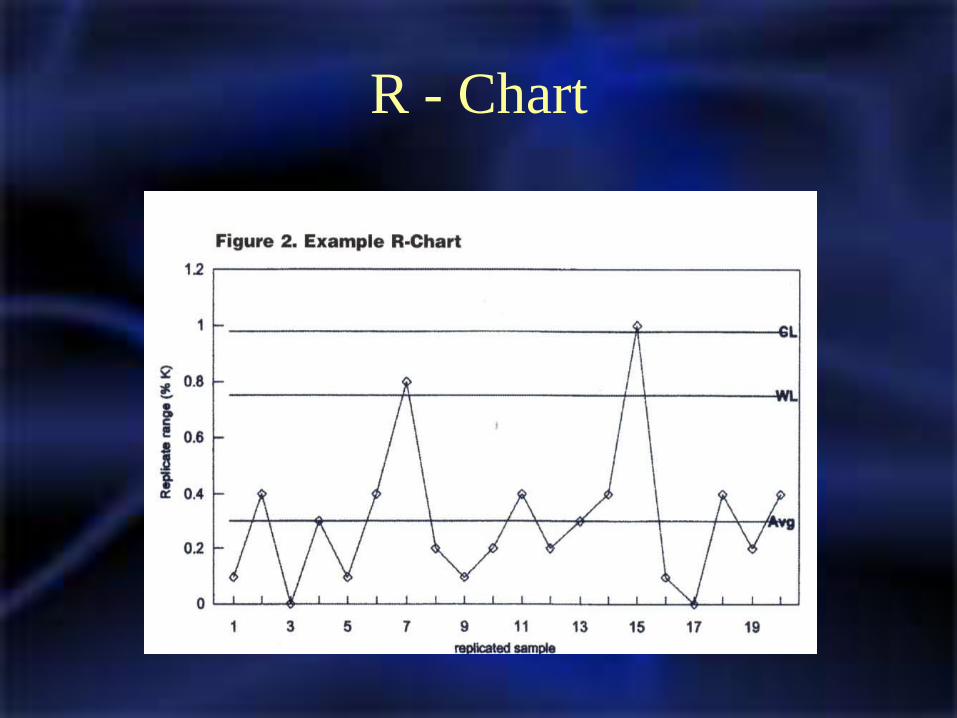
R - Chart
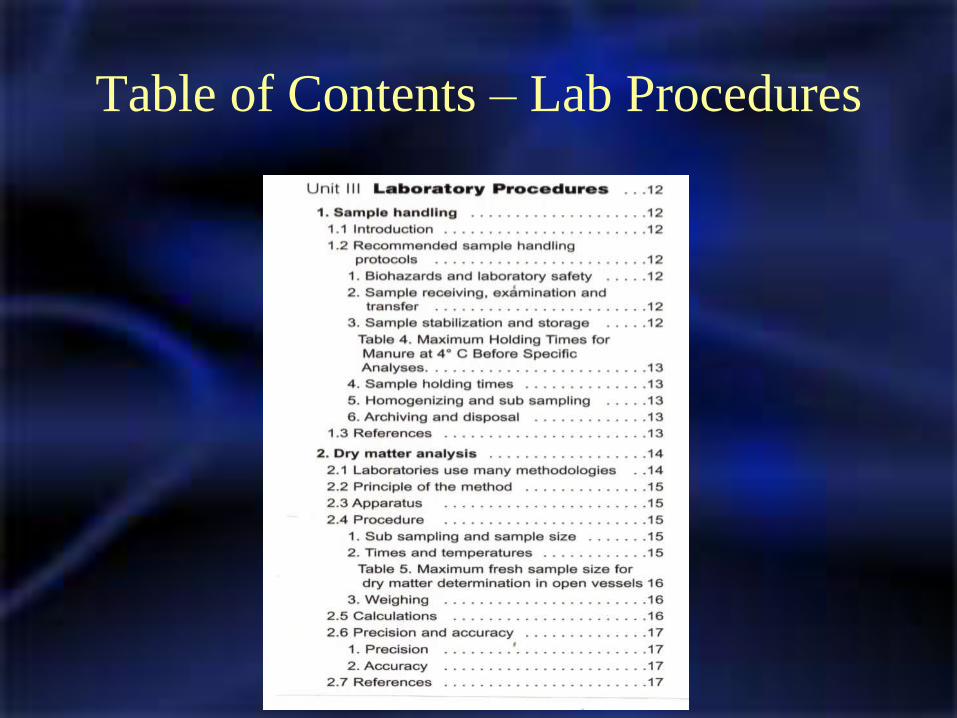
Table of Contents – Lab Procedures
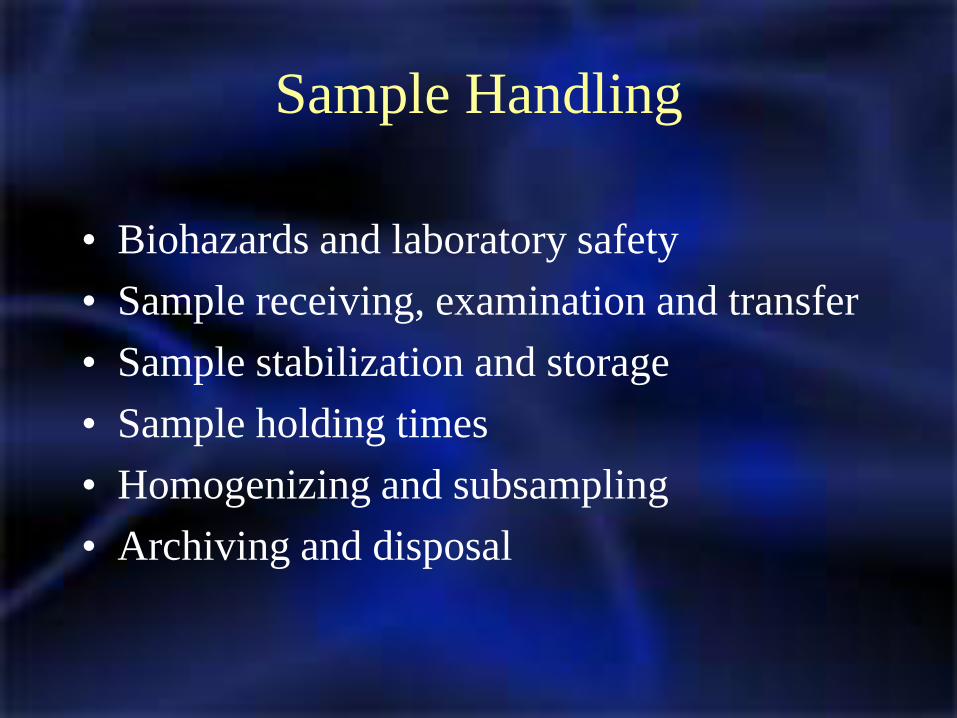
Sample Handling
• Biohazards and laboratory safety
• Sample receiving, examination and transfer
• Sample stabilization and storage
• Sample holding times
• Homogenizing and subsampling
• Archiving and disposal
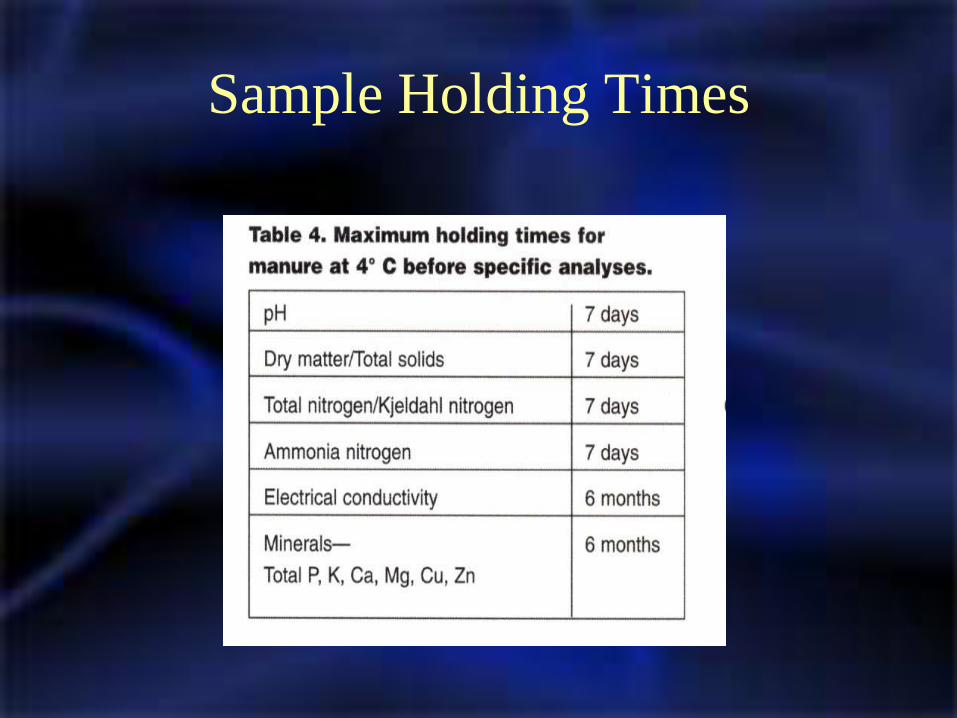
Sample Holding Times
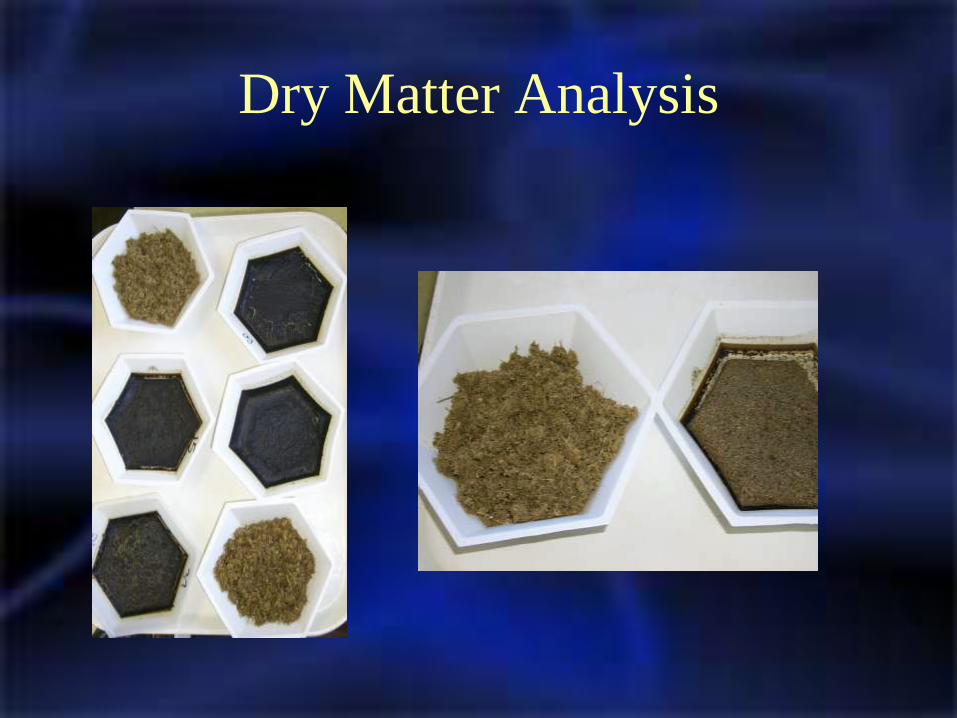
Dry Matter Analysis
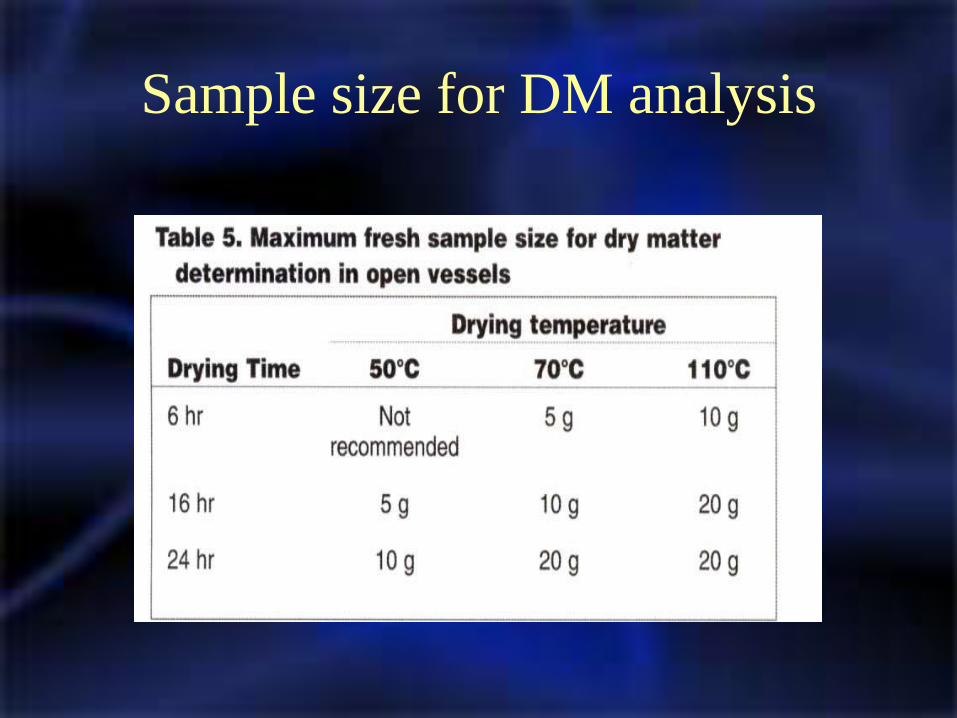
Sample size for DM analysis

Dry Matter Effect on Calculated
Manure Nutrient Content
DM%
Nutrient*
N P2O5 K2O
--------- lbs/wet ton ---------
12 7.2 5.5 11.5
15 9.0 6.9 14.5
18 10.8 8.3 17.3
* Based on dry matter analysis of 3.00% N, 1.00% P and 4.00% K
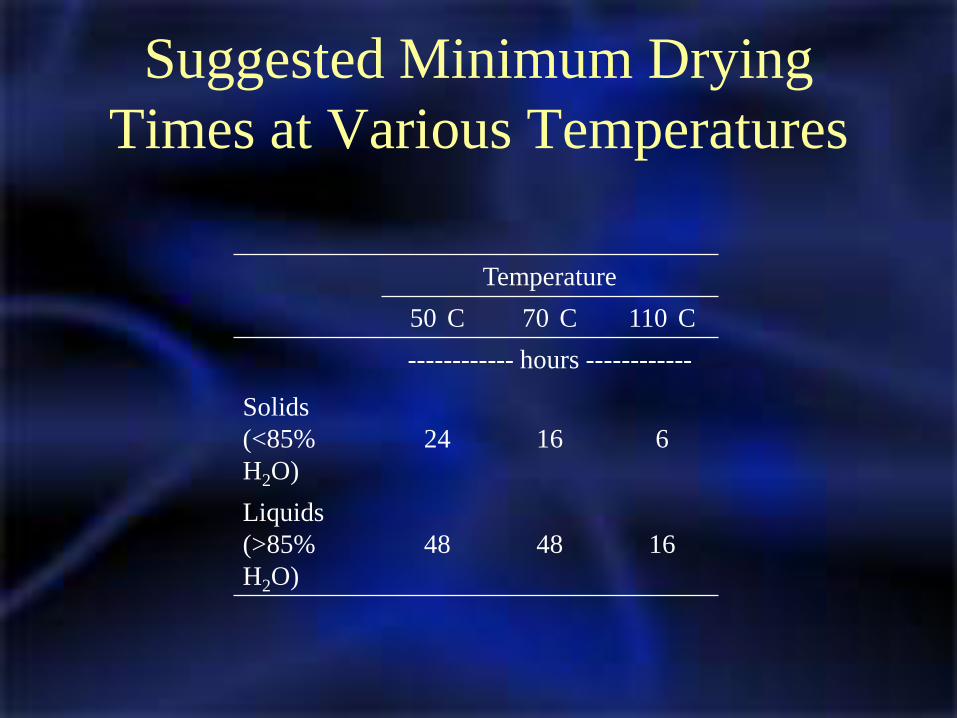
Suggested Minimum Drying
Times at Various Temperatures
Temperature
50 C 70 C 110 C
------------ hours ------------
Solids
(<85%
H2O)
24 16 6
Liquids
(>85%
H2O)
48 48 16

Table of Contents – Total N
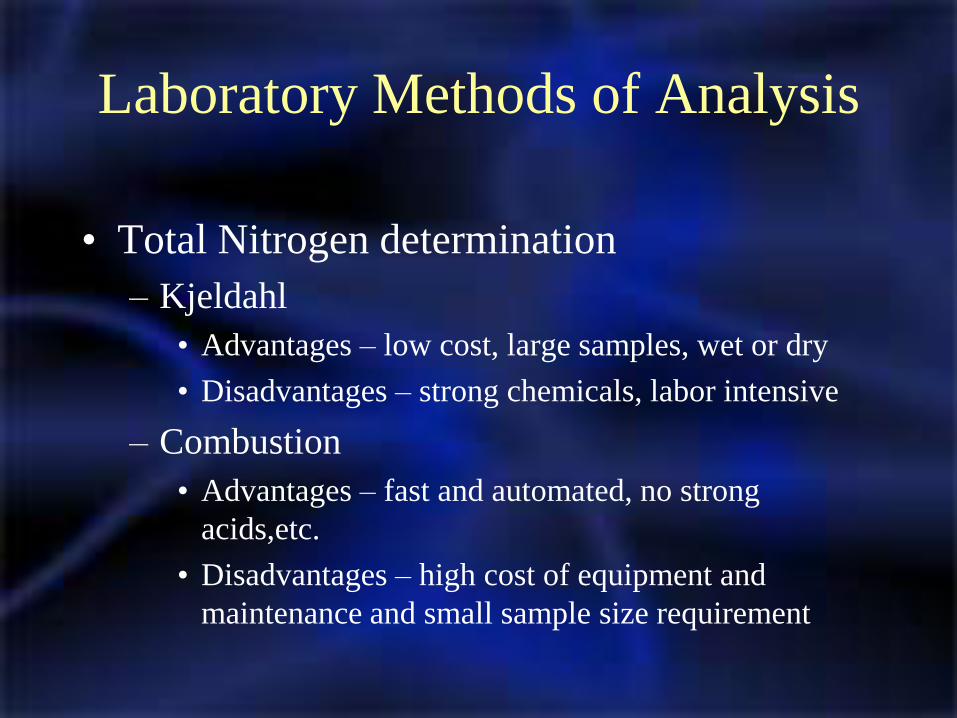
Laboratory Methods of Analysis
• Total Nitrogen determination
– Kjeldahl
• Advantages – low cost, large samples, wet or dry
• Disadvantages – strong chemicals, labor intensive
– Combustion
• Advantages – fast and automated, no strong
acids,etc.
• Disadvantages – high cost of equipment and
maintenance and small sample size requirement
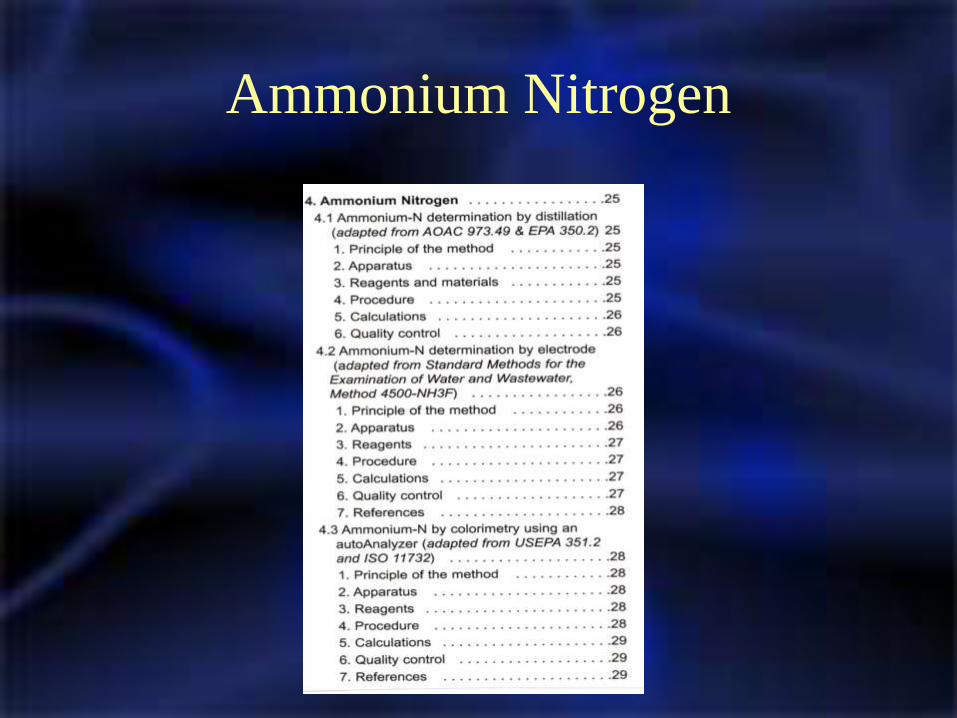
Ammonium Nitrogen
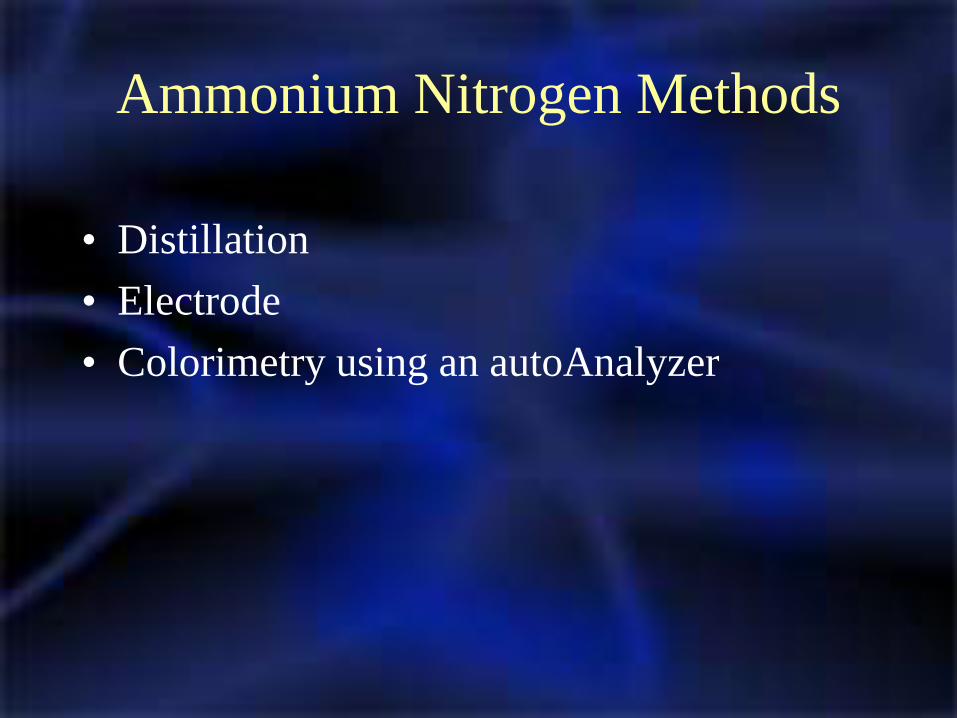
Ammonium Nitrogen Methods
• Distillation
• Electrode
• Colorimetry using an autoAnalyzer
Table of Contents – Digestion and
Dissolution

Digestion and Dissolution Methods
• P, K, Ca, Mg & trace minerals
– Digestion
• Dry Ashing
• Microwave assisted acid digestion
• Nitric and hydrochloric acid digestion with peroxide
• Nitric and hydrochloric with block digester
Table of Contents – Mineral
Analysis

Methods of Determination for P, K
Ca, Mg and trace elements
• Atomic absorption spectrophotometer
• Inductively coupled plasma spectroscopy
• Colorimetric method for P

Table of Contents – pH and EC
Table of Contents - Reporting
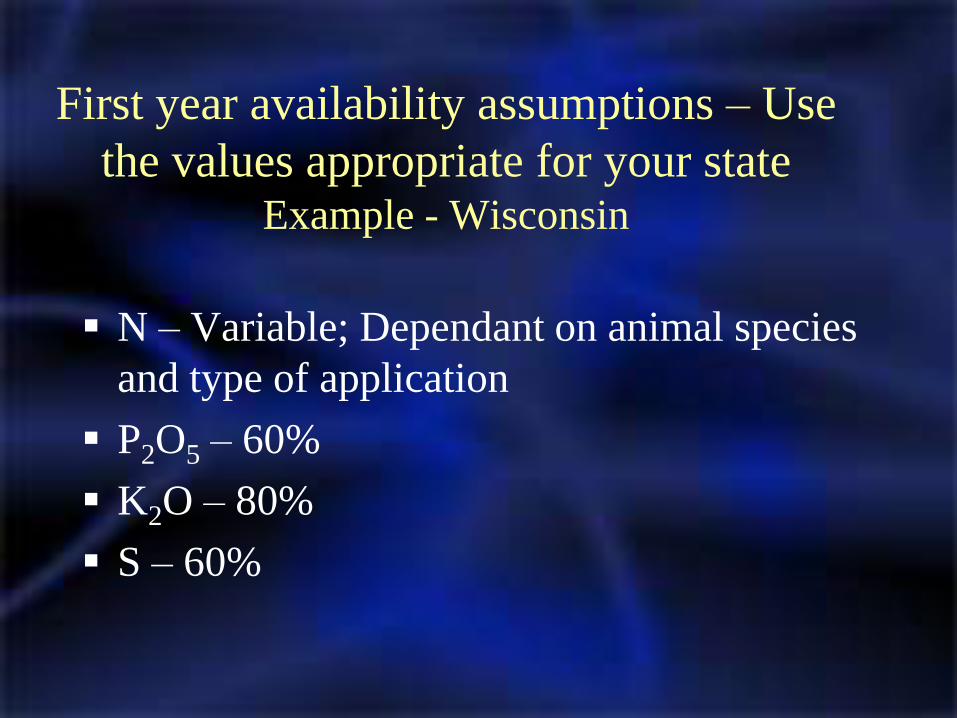
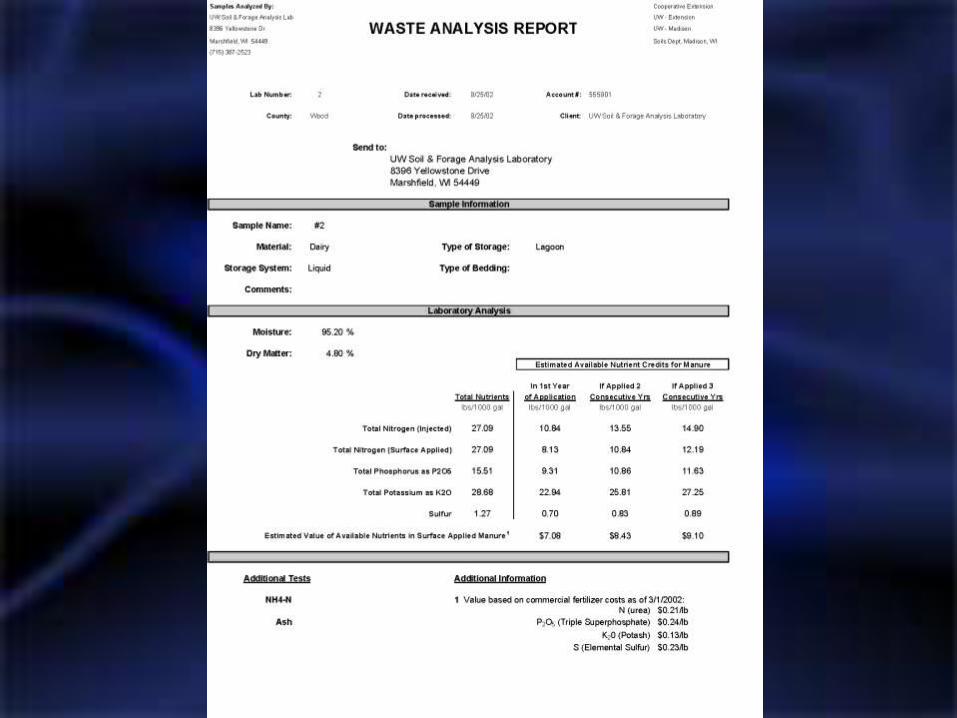
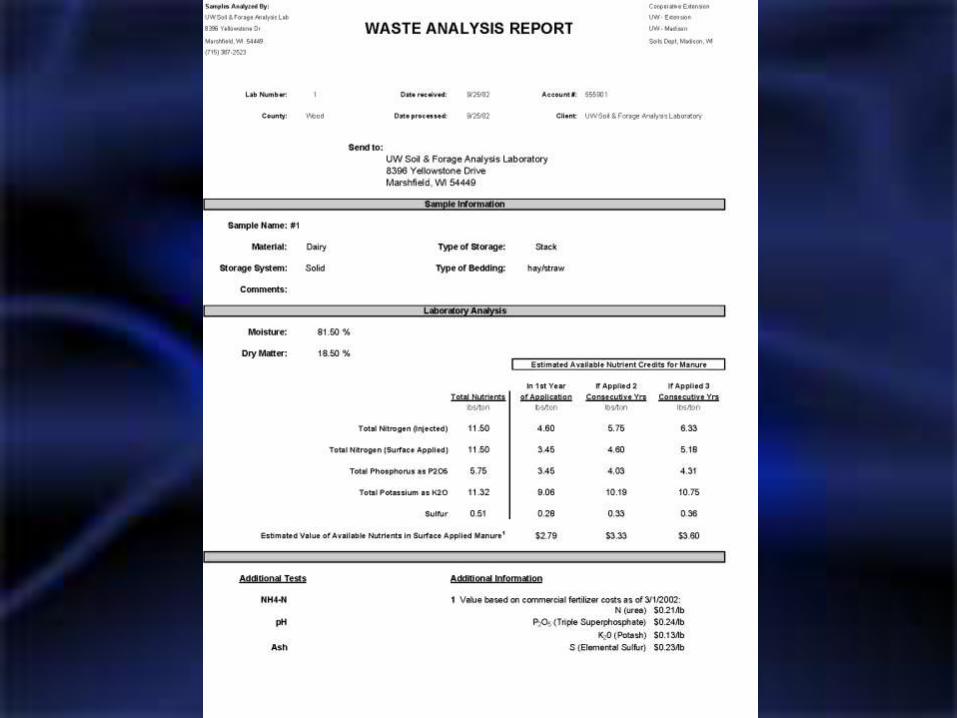
First year availability assumptions – Use
the values appropriate for your stateExample - Wisconsin
N – Variable; Dependant on animal species
and type of application
P2O5 – 60%
K2O – 80%
S – 60%
Summary
• The value of manure testing is highly
dependant on sampling technique
• Laboratory methods – a variety of methods
seem to be acceptable for N, P and K
• Standardizing dry matter analysis methods
is important for calculating proper nutrient
credits of fresh (as applied) manure