Embed Size (px)
Citation preview
Recharge Studies on the High Plains in Northern Lea County, New Mexico
GEOLOGICAL SURVEY WATER-SUPPLY PAPER 1819-F
Prepared in cooperation with the New Mexico State Engineer and the Lea County Soil and Water Conservation District

RECHARGE STUDIES ON THE HIGH PLAINS IN NORTHERN LEA COUNTY, NEW MEXICO

Aerial view looking east-southeast at a depression in the SW}>4 sec. 20, T. 16 S., R. 32 E., showing the apparent alinement of chains of depressions. Rainfall in July 1960 filled the depressions.
Recharge Studies on the High Plains in Northern Lea County, New MexicoBy JOHN S. HAVENS
CONTRIBUTIONS TO THE HYDROLOGY OF THE UNITED STATES
GEOLOGICAL SURVEY WATER-SUPPLY PAPER 1819-F
Prepared in cooperation with the New Mexico State Engineer and the Lea County Soil and Heater Conservation District
UNITED STATES GOVERNMENT PRINTING OFFICE, WASHINGTON : 1966

UNITED STATES DEPARTMENT OF THE INTERIOR
STEWART L. UDALL, Secretary
GEOLOGICAL SURVEY
William T. Pecora, Director
For sale by the Superintendent of Documents, U.S. Government Flirting Office Washington, D.C. 20402
CONTENTS
Page
____-___--_____--_-_____________________________________ FlIntroduction-_____________________________________________________ 1
Previous investigations.________________________________________ 2System of numbering wells in New Mexico______________________ 3Acknowledgments _____________________________________________ 5
Physiography _____________________________________________________ 5Drainage features__________----_-______-____---_-__----__---- 6
Zone l___-__________________-____----_-__---___---___--_- 6Zone 2_________________-____---___-----_-_--_------__---_ 6Zone 3--__..___.----___________________________________ 6Zone 4_________________________________________________ 7
General characteristics and description of depressions ______________ 7Climate.---___-_------_--------_----------------------------- 12
General geology___________________________________________________ 17Rocks of Tertiary and Quaternary age_ __________________________ 17
Ground water in the Ogallala Formation___________________-_-_.-_---_ 22Hydrologic characterists of the Ogallala Formation________________ 22Hydrologic characteristics of Pleistocene and Recent sediments.-____ 25Natural discharge.___________________________________________ 25Artificial discharge.____________________________________________ 26Recharge to the aquifer._______________________________________ 27
Factors that influence recharge from precipitation. ____________ 29Natural recharge in selected depressions __________________________ 31
Sources of water for artificial recharge_________--_-__--______--___-__ 35Precipitation__ _ _____________________-__-_-_-__--___-___--_---_ 35Other sources of water_________________________________________ 38Potential recharge in the physiographic zones _____________________ 39
Zone !___.______________________________________________ 39Zone 2_-__-__-__-___________________--_-_----__--_-__---_ 40Zone 3--___________________________________--____-_ 41Zone 4_______________________________-_-_-_-__-_---__---_ 41Summary of recharge potential in the physiographic zones._--_- 42
Artificial recharge___________-___-____--______---__-_--------___--_- 43Artificial recharge methods_____________________----------_____ 43
Recharge through wells___________________________________ 43Experiments in recharging the aquifer through wells ___________ 45Recharge through spreading ponds or pits ____________________ 48Comparison of probable recharge volumes- ___________________ 49
Summary and conclusions __________________________________________ 50Selected references.-_______________________________________________ 51
VI CONTENTS
ILLUSTKATIONS
[Plates are in pocket]
PLATE 1. Map of area showing physiographic zones and selected depres sions.
2. Topographic map of depression D-l and section A-A'.3. Sections D-D' and E-E' across depression D-8 and topographic
map of depression.4. Map of Theissen-polygon-network areas controlled by six weather
stations in northern Lea County and isohyetal lines o* annual precipitation.
FRONTISPIECE. Aerial view looking east-southeast at a depression in the SWK sec. 20, T. 16 S., R. 32 E.
PageFIGURE 1. Index map showing area of investigation _-_--_-___________ F3
2. System of numbering wells______________________________ 43. Topographic map of depression D-2 and section B-B' _ _ _ _ __ 94. Section C-C" across depression D-7_______________________ 105. Sections F-F' and G-G' across depression D-9-____________ 116. Caliche exposed in borrow pit__-__---________-.__________ 207. Rounded caliche boulders in borrow pit west of Lovirgton___ 218. Exterior banding and heterogeneous interior features of caliche
boulders. ______-____--__-___---_________--___________ 219. Water-level fluctuation in wells 2-E and 2-F after precipita
tion in July 1960_____________________________________ 3110. Water-level declines in selected depressions, precipitation, and
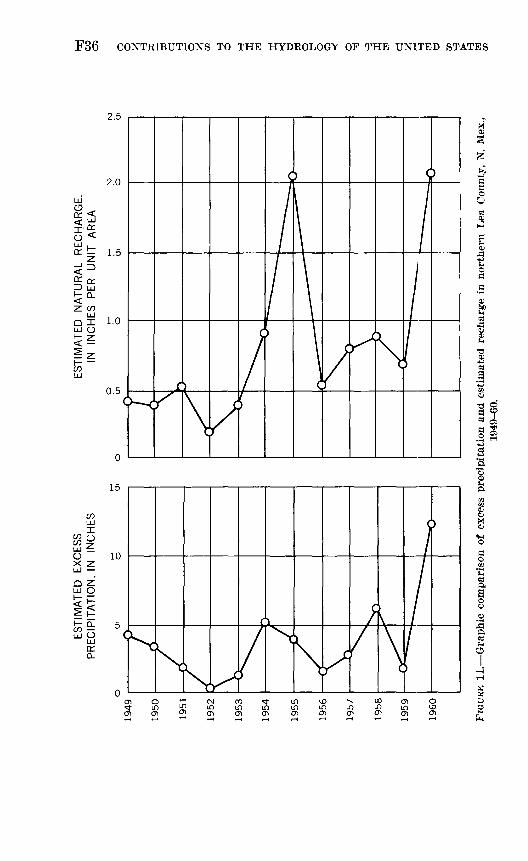
evaporation..________________________________________ 3411. Graphic comparison of excess precipitation and estimated
recharge in northern Lea County, 1949-60_______________ 3612. Shallow stream flowing east-southeast through a swr'e, July
1960________________________________________________ 4213. Topographic map of Lea County recharge project. _________ 4614. Cross section of filter and recharge well in recharge project-__ 4715. Water-level fluctuation in well 2-F during artificial recharging
through recharge well 2_______________________________ 48
TABLES
Page
TABLE 1. Annual precipitation, 1949-61, at weather stations in northernLea County, N. Mex__________________________________ F13
2. Number of storms having 1 inch or more of precipitation,1949-61, northern Lea County-______________-_---_----_ 15
3. Comparison of monthly evaporation and wind movement,1960-61, Lovington and Lake Avalon____________________ 17
4. Hydrologic characteristics of Pleistocene and Recent sedi ments from northern Lea County__--_____________--_-_- 25
5. Estimated pumpage in northern Lea County, 1930-60-______ 276. Estimated recharge to the Ogallala Formation from p~ecipita-
tion, northern Lea County _____________________________ 29

CONTENTS VII
Page
TABLE 7. Computed loss of water, July 7-22, 1960, from depression 2-RP (lot 15, sec. 5, T. 16 S., R. 37 E.), Lea County recharge project-,___-_________--_--_-_____--_-___----____----- F32
8. Water loss from selected depressions in northern Lea County- 339. Estimated excess precipitation, natural recharge, and potential
runoff, 1949-60, northern Lea County ___________________ 3710. Estimated excess precipitation, runoff, storage increase, and
ratio of storage increase to runoff in selected depressions in northern Lea County..______________________________ 37
CONTRIBUTIONS TO THE HYDROLOGY OF THE UNITED STATES
RECHARGE STUDIES ON THE HIGH PLAINS II T NORTHERN LEA COUNTY, NEW MEXICO
By JOHN S. HAVENS
ABSTRACT
The area described in this report is that part of the southern High Plains principally within northern Lea County, N. Mex.; it comprises about 1,400,000 acres. Hydrologic boundaries isolate the main aquifer of the area, the Ogallala Formation, from outside sources of natural recharge other than precipita tion on the area. Natural recharge to this aquifer from the 15-inch average annual precipitation for the period 1949-60 is estimated to be about 95,000 acre-fr. (acre- feet) which is between the 59,000 and 118,000 acre-ft a year obtained from the Theis estimate (1934) of % to 1 inch a year. About one-sixth of the water pumped for irrigation, or an average of about 23,000 acre-ft a year in the period 1949-60, returns to the aquifer. The estimated long-term (1939-60) average annual recharge to the aquifer is about 77,000 acre-ft.
Discharge from the aquifer is by pumping and underflow from th<? area. Gross pumpage averaged about 151,000 acre-ft a year in the period Ifx49-60. Underflow from the area is estimated to have been about 36,000 acre-ft a year. Thus, the estimated average annual discharge from the aquifer was about 187,000 acre-ft a year, and this exceeded recharge by about 69,000 acre-ft a year. This overdraft is reflected in a general net decline of the water table of 10 ft in the period 1950-60 and net declines of as much as 30 feet in local areas.
Data obtained during this study indicate that about 100,000 acre-ft of water collects in closed depressions on the surface of the High Plains in yeari? when precipitation is normal. Studies of water losses from ponds in selected depres sions indicate that between 20 and 80 percent of this loss recharges the frround- water body and the balance is lost to evapotranspiration, principally evapora tion. Artificial recharge facilities constructed in the depressions could put at least 50,000 acre-ft of water underground annually that otherwise would be lost to evaporation. Recharging through pits or spreading ponds would cost less per unit volume of water than recharge through wells.
INTRODUCTION
The Ogallala Formation of Tertiary age underlies the southern High Plains of southeastern New Mexico and is an aquifer heavily pumped for irrigation, commercial, industrial, and domestic uses. The amount of water pumped annually from this aquifer, chiefly for irri gation, plus the natural discharge exceeds the natural recharge to the aquifer and has caused ground-water levels to decline. In the
Fl

F2 CONTRIBUTIONS TO THE HYDROLOGY OF THE UNITED STATES
1,400,000-acre area described in this report, principally northern Lea County (fig. 1), the average net decline during 1950-60 was about 10 feet, and maximum net declines in areas of extremely hea^y pumping were as much as 30 feet.
Natural hydrologic boundaries such as the Mescalero Ridge escarpment on the south and west, bedrock highs of impermeable rocks of Cretaceous age on the north, and the southeast gradient of the water table at the New Mexico-Texas State line prevent water outside the area from recharging the aquifer. The precipitation tl at falls on the land surface is the only new water reaching the are0,, and it is many times greater than the amount that eventually reaches the water table. If a part of storm runoff now lost by evapotranspiration could be introduced into the aquifer by means of artificial recharge, the decline of the ground-water level would be slowed, and the economic life of the aquifer would be prolonged.
This investigation was made to determine the amount of water from runoff that might be available annually for recharge to the main aquifer and to study possible methods of artificial recharge that would be applicable in the southern High Plains.
The possibility of increasing the supply of ground water by artifi cial recharge was recognized by the Board of County Commissioners of Lea County when they established the Lea County Underground Water Recharge Project in 1955. The project was under the direction of E. G. Minton, Jr., who supervised the installation of four recharge wells, nine observation wells, and climatological equipment about 3 miles east of Lovington, N. Mex. In April 1959 the recharge facilities were made available to the U.S. Geological Survey and the State Engi neer of New Mexico, who, in cooperation with the Lea County Soil and Water Conservation District, maintained and operated the facili ties until the summer of 1962.
Data about artificial recharge operations, precipitation, and ground- water levels were collected and analyzed. Statistics on frequency and intensity of precipitation in northern Lea County obtained from records of the U.S. Weather Bureau were tabulated and examined. Information about the material flooring and beneath several natural surface depressions in the area was obtained by tests with rotary- drilling equipment provided by the New Mexico State Engineer.
PREVIOUS INVESTIGATIONS
Previous investigations of ground-water conditions in the area were made by Nye (1930,1932), Theis (1934,1937,1939), Hale and Nichol- son (1953), Conover and Akin (1942), Berkstresser (1959), Cronin (1961), Nicholson and Clebsch (1961), and Ash (1963). Of these
RECHARGE STUDIES, NORTHERN LEA COUNTY, N. MEX. F3
108°
UNION I
1C1
L
xT
)6r
i /r
10
TAGS j Rat°n°
/ i COLFAX
- ,__ ,
^ ' MHT> 4 >
SANDOVAL >7i SANTA FE \-\
SAN MIGUEL
GUADALUPE
i ^ w i\ Tueumcan I
QUAY ;-1 ' I- J
r- ' > r-r1 CURRY
I ! ' Clcr'iso I - I DE BACA
20 0 20 40 60 80 MILES
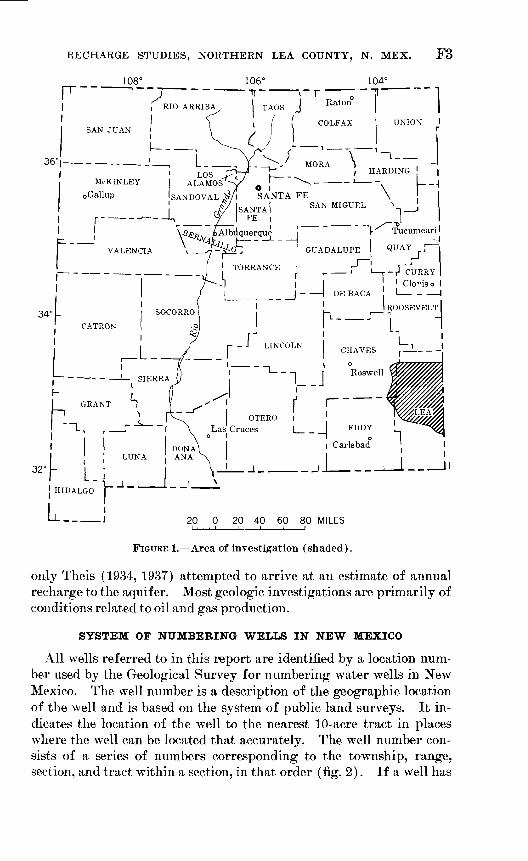
FIGURE 1. Area of investigation (shaded).
only Theis (1934, 1937) attempted to arrive at an estimate of annual recharge to the aquifer. Most geologic investigations are primarily of conditions related to oil and gas production.
SYSTEM OF NUMBERING WELLS IN NEW MEXICO
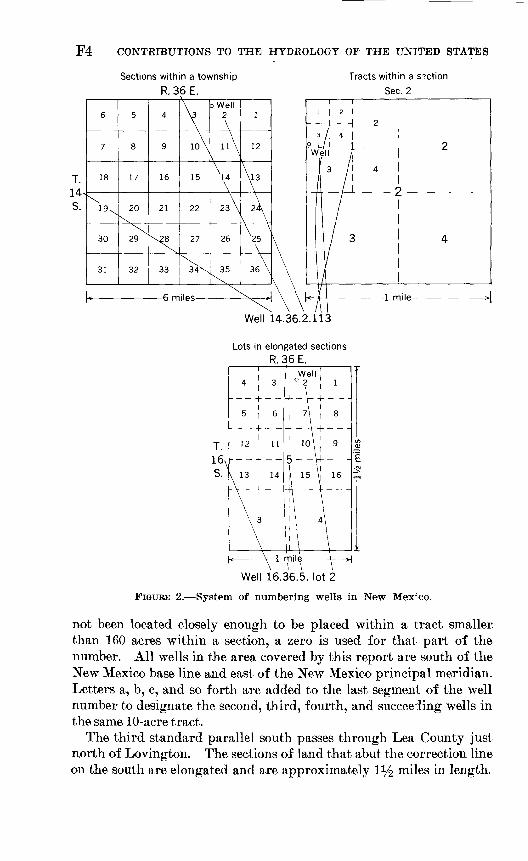
All wells referred to in this report are identified by a location num ber used by the Geological Survey for numbering water wells in New Mexico. The well number is a description of the geographic location of the well and is based on the system of public land surveys. It in dicates the location of the well to the nearest 10-acre tract in places where the well can be located that accurately. The well number con sists of a series of numbers corresponding to the township, range, section, and tract within a section, in that order (fig. 2). If a well has
F4 CONTRIBUTIONS TO THE HYDROLOGY OF THE UNITED STATES
Sections within a township
R.36E.
Tracts within a section
Sec. 2
6
7
18
^V
30
31
5
8
17
20\"\
29
32
4
9
16
21
V28\^
33
10\
15
22
27
34\
o Well2
\
Av14
\
A
26
K5
1
12
VA
N \\ ^
£3
\
36\
6 miles-
Well 14.36.2.113
Lots in elongated sections R.36E.
1 mile !I 1
Well 16.36.5. lot 2
FIGURE 2. System of numbering wells in New Mexico.
not been located closely enough to be placed within a tract smaller than 160 acres within a section, a zero is used for that part of the number. All wells in the area covered by this report are south of the New Mexico base line and east of the New Mexico principal meridian. Letters a, b, c, and so forth are added to the last segment of the well number to designate the second, third, fourth, and succeeding wells in the same 10-acre tract.
The third standard parallel south passes through Lea County just north of Lovington. The sections of land that abut the correction line on the south are elongated and are approximately l1/^ miles in length.
RECHARGE STUDIES, NORTHERN LEA COUNTY, N. MEX. F5
These elongated sections are divided into 2 quarter sections in the southern third of the sections and into 16 lots in the northern two- thirds (fig. 2). The system used in this report for numbering wells in these elongated sections is the same as that described for numHring wells in a standard section except that, when the well is in a lot, the fourth segment of the well number consists of the word "lot" followed by the lot number. Letters a, b, c, and so forth are added to the fourth segment to designate the second, third, fourth, and succeeding wells in the same lot.
The well-numbering system is used also in this report to identify the location of test holes and sites where soil samples were collected.
ACKNOWLEDGMENTS
Grateful acknowledgment is made to the numerous well owners whose information and cooperation made possible the gathering of many of the basic data for this report. In particular, the vriter thanks the landowners who so generously permitted test drilling and continued observations in depressions on their lands: Kyle Taylo^, Jr., and Cecil Holeman, Warren M. Snyder, E. E. Hilburn, Johnny Etche- verry, and George Sumruld. Special thanks are given to John T. Easley, who contributed the land upon which the artificial recharge facilities are located and whose cooperation during their operation by the Geological Survey contributed greatly to the success of this project.
City and county officials were most helpful in furnishing informa tion. The members of the Lovington office of the Soil Conservation Service contributed materially by information, suggestions, and liaison with landowners.
PHYSIOGRAPHY
The High Plains in New Mexico are a subdivision of the Great Plains physiographic province (Fenneman, 1931, p. 11). The south ern part of the High Plains lies in New Mexico and Texas, separated from the northern part of the High Plains by the Canadian Fiver, which flows eastward in New Mexico and Texas. The plains in n orth- ern Lea County are almost flat, broken only by subdued hills, scales, and many elongate depressions. The surface slopes southeastward 10 to 15 feet per mile. The southeastward-trending drainage system is poorly formed, and runoff from precipitation is to the depressions, where it remains until the water infiltrates or is lost by evapotranemra- tion. A few of the depressions contain perennial lakes.
The area investigated is principally in northern Lea County and is that part of the southern High Plains in southeastern New Mexico south of the bedrock high area of Ash (1963), east of the Mescalero

F6 CONTRIBUTIONS TO THE HYDROLOGY OF THE UNITED STATES
Ridge, west of the New Mexico-Texas State line, and north of a line from End Point on Mescalero Ridge extending east-southeast to the State line.
The depressions that pock the surface of the High Plains have prob ably been forming since the beginning of Pleistocene time. In several places along the Mescalero Ridge, these depressions have been breached by recent erosion. Present-day erosion is confined to the upper surface of the Ogallala Formation and exposures of older sediments along Mescalero Ridge. Erosion may have been accelerated b}r removal of protective grass cover through overgrazing. Unstabilizel and parti ally stabilized dune sands cover some areas.
Most of the irrigated farmland is in the east half of Lea Countv. and ranching dominates in the west half.
DBAINAGE FEATURES
In this report, the High Plains in northern Lea Count}1- are divided in four physiographic zones based on drainage, topography, and sur- ficial materials (pi. 1). The boundaries of these zones are arbitrary.
ZONE 1
The surface of zone 1 is flat except for depressions, which number about 1,900. The bottoms of about 60 percent of the depressions are 10 acres or less in area; in about 35 percent they are 10 to 50 acres, and in about 5 percent they are larger than 50 acres. The predominant drainage is to the depressions. Groups of depressions r,re alined in a general southeasterly direction. Although some are connected by shallow drainage channels, surface flow between depressions occurs only after extremely heavy precipitation.
ZONE 2
Zone 2 is characterized in the central and eastern part by very broad, low, elongated hills alternating with poorly defined swales that trend southeastward. The swales become more distinct and abruptly change direction to the east-southeast at the epst boundary of zone 2. This change in direction corresponds closely to a buried valley (Ash, 1963). Depressions are numerous in this zone near the west boundary.
ZONE 3
Zone 3 is characterized by broad, elongated swales trending east- southeast, separated by low hills. The swales and hills pass directly into dune areas and sandier soils near the New Mexico-Texas State line. A few depressions, most of which have bottom areas of less than 5 acres, are in zone 3. Approximately 10 percent of _the land con sists of low caliche-capped hills, and about 90 percent of broad, elongated swales.

RECHARGE STUDIES, NORTHERN LEA COUNTY, N. MEX. F7
ZONE 4
Zone 4 consists of dune areas and sandy soils. Many of the broad swales of zone 3 terminate in the sandy areas of zone 4. Several clearly defined swales, however, continue eastward into Texas; Seminole Draw, which heads northeast of Hobbs, is very distinct. Infiltration of sur face water is relatively rapid compared with that in other zones. Storm runoff from Hobbs drains to Seminole Draw and disappears within a few miles.
GENERAL CHARACTERISTICS AND DESCRIPTION OF DEPRESSIONS
Depressions are the most characteristic surface feature of the High Plains. The depressions are playas and may contain water following greater than normal summer rainfall. The water is generally dissi pated through evapotranspiration and infiltration within a few months.
Depressions on the High Plains range in size from a few inches in depth and a few yards in diameter to more than 50 feet in depfh and more than a mile in diameter. The depressions in the New Mexico part of the southern High Plains, however, are generally not mor1^ than about 40 feet deep and a quarter of a mile in diameter.
The depressions are generally elongate downslope to the southeast, and groups, or chains, of depressions trend in that direction. In zones 1 and 2 this alinement is most evident (frontispiece).
Depressions and their origins have been the subject of much dis cussion in geologic literature (Judson, 1950, p. 254). Differential solution and collapse of evaporite sections in pre-Ogallala rod's may have caused the depressions and, by extension, may account for the alinement. Solution within the Ogallala may also be considered as a cause of the alinement.
Channeling in the post-Mesozoic erosional surface and subs^uent deposition of sediments of Pliocene to Recent age on the erosional surface could account for the pattern of alinement. Several breached depressions along Mescalero Ridge, however, have no features that would be present if irregular bedding or solution and collaps3 were the cause of the alinement of the depressions. Bedding appears to be horizontally continuous, and no rubble zone or recemented rubble is evident beneath the depressions.
The alinement of the depressions may have been caused by jointing in the caliche and underlying sediments, but such a joint pattern has not been proved definitely.
The simplest and most probable hypothesis for alinement of the groups of depressions is that they occur along poorly formed drainage- ways. Solution of caliche along these drainage ways would entrench
F8 CONTRIBUTIONS TO THE HYDROLOGY OF THE UNITED STATES
the drainage and lead to enlargement of the depressions. This suc cession seems to have happened in zone 3 in eastern Lea County where groups, or chains, of depressions may have coalesced to form broad swales.
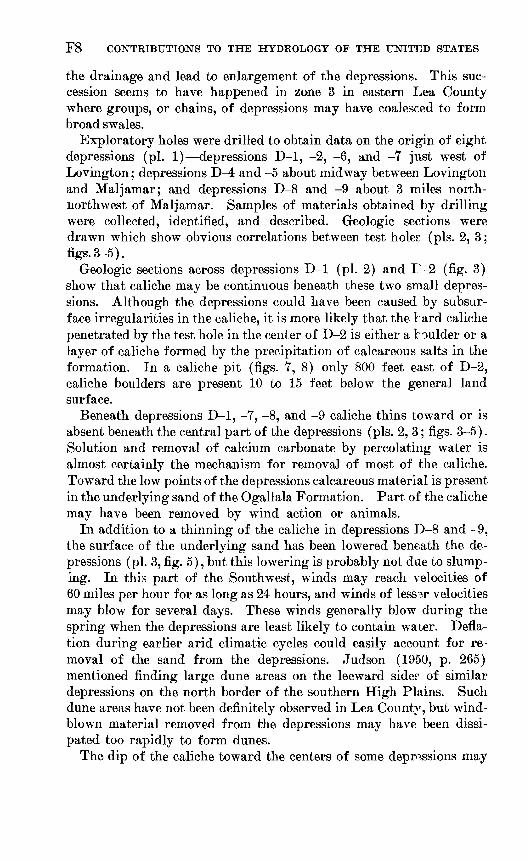
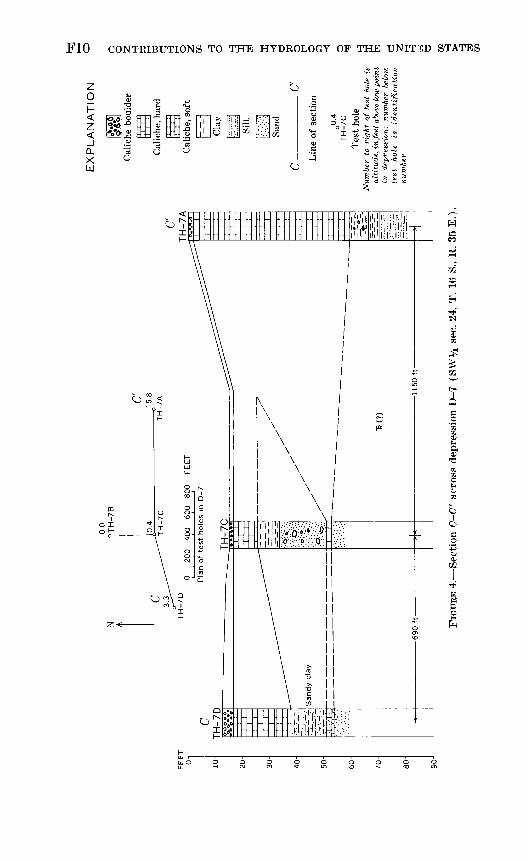
Exploratory holes were drilled to obtain data on the origin of eight depressions (pi. 1) depressions D-l, -2, -6, and -7 just west of Lovington; depressions D-4 and -5 about midway between Lovington and Maljamar; and depressions D-8 and -9 about 3 miles north- northwest of Maljamar. Samples of materials obtained by drilling were collected, identified, and described. Geologic sections were drawn which show obvious correlations between test holee (pis. 2, 3; figs. 3-5).
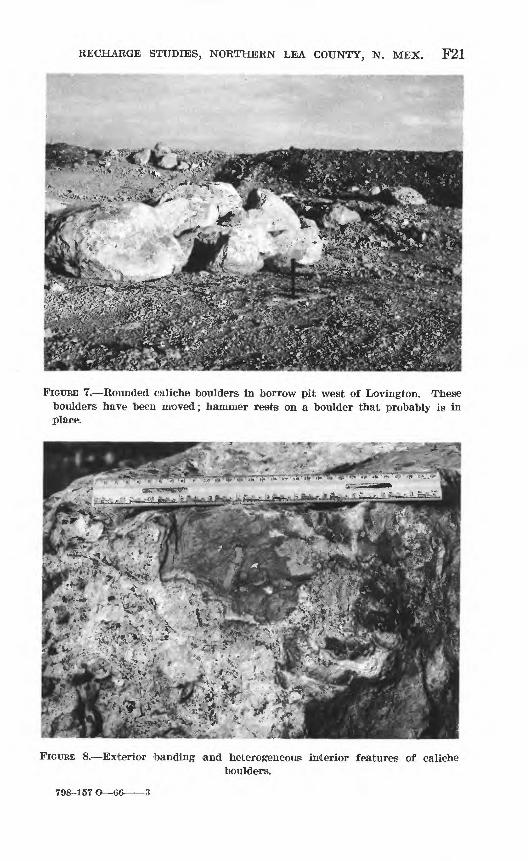
Geologic sections across depressions D-l (pi. 2) and Is -2 (fig. 3) show that caliche may be continuous beneath these two small depres sions. Although the depressions could have been caused by subsur face irregularities in the caliche, it is more likely that the 1 ard caliche penetrated by the test hole in the center of D-2 is either a boulder or a layer of caliche formed by the precipitation of calcareous salts in the formation. In a caliche pit (figs. 7, 8) only 800 feet east of D-2, caliche boulders are present 10 to 15 feet below the general land surface.
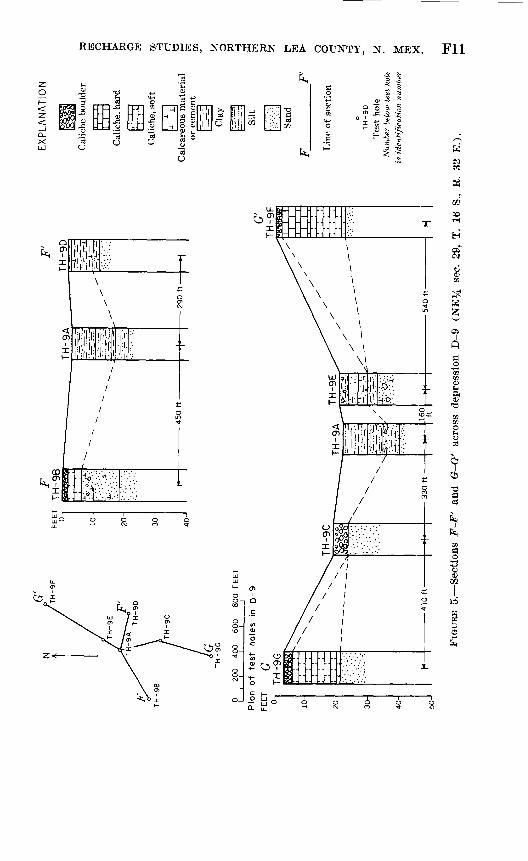
Beneath depressions D-l, -7, -8, and -9 caliche thins toward or is absent beneath the central part of the depressions (pis. 2, 3; figs. 3-5). Solution and removal of calcium carbonate by percolating water is almost certainly the mechanism for removal of most of the caliche. Toward the low points of the depressions calcareous material is present in the underlying sand of the Ogallala Formation. Part of the caliche may have been removed by wind action or animals.
In addition to a thinning of the caliche in depressions D-8 and -9, the surface of the underlying sand has been lowered beneath the de pressions (pi. 3, fig. 5), but this lowering is probably not due to slump ing. In this part of the Southwest, winds may reach velocities of 60 miles per hour for as long as 24 hours, and winds of lessor velocities may blow for several days. These winds generally blow during the spring when the depressions are least likely to contain water. Defla tion during earlier arid climatic cycles could easily account for re moval of the sand from the depressions. Judson (1950, p. 265) mentioned finding large dune areas on the leeward side? of similar depressions on the north border of the southern High Plains. Such dune areas have not been definitely observed in Lea County, but wind blown material removed from the depressions may have been dissi pated too rapidly to form dunes.
The dip of the caliche toward the centers of some depressions may
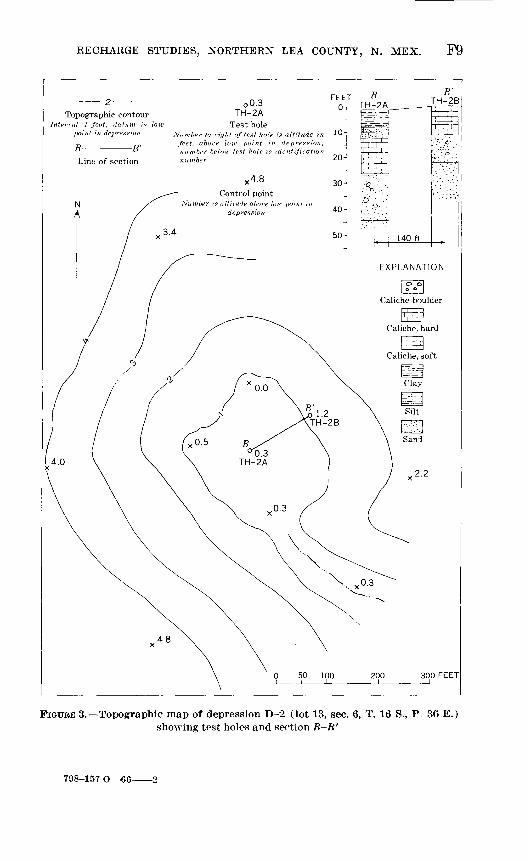
RECHARGE STUDIES, NORTHERN LEA COUNTY, N. MEX. F9
Topographic contour0 0.3
TH-2AInterval I foot; datum is low Test hole
Number to right of test hole is altitude, in 10- feet, above low point in depression, number below test hole is identification
Line of section number
FEET 0-, TH-2A
B'
TH-2B
point in depr
B- -B'
X 4.8
Control pointNumber is altitude above low point in
depression
140 f1
EXPLANATION
I o o|
Caliche boulder
300 FEET
FIGURE 3. Topographic map of depression D-2 (lot 13, sec. 6, T. 16 S., P. 36 E.) showing test holes and section B-B'
798-157 O 66-
F10 CONTRIBUTIONS TO THE HYDROLOGY OF THE UNITED STATES
i §..§ * j fel
?^.g
RECHARGE STUDIES, NORTHERN LEA COUNTY, N. MEX. Fll
F12 CONTRIBUTIONS TO THE HYDROLOGY OF THE UNITED STATES
have been caused by the removal of sandy material and the consequent slumping of parts of the caliche. Redeposition of soluble carbonates could produce the same effect.
Materials on the floors of the depressions are silt, sand, and clay in varying proportions. These materials may have been washed in from the southeastward-trending drainage systems or they may represent insoluble materials released by the solution of caliche. Some of these materials may be Pleistocene lakebed sediments; several fo?sil gastro pod assemblages were found during test drilling in depression D-6 (pl.l).
The depressions are Pleistocene to Recent in age. The Diamond A-Mescalero plain of Pleistocene age, on the west boundary of the Llano Estacado, has breached several depressions, a condition which indicates that the depressions had been forming prior to th°, degrada tion of that erosional surface. Depressions are still forming on the southern High Plains of New Mexico.
In summation, data obtained during the investigation indicate that the depressions are the result of (1) solution of the caliche caprock along zones of weakness parallel or coincident with a poorly formed drainage pattern and (2) removal of underlying sand by wind action. The depressions have been partly filled by fine sediments brought in by runoff following greater than normal precipitation.
CLIMATE
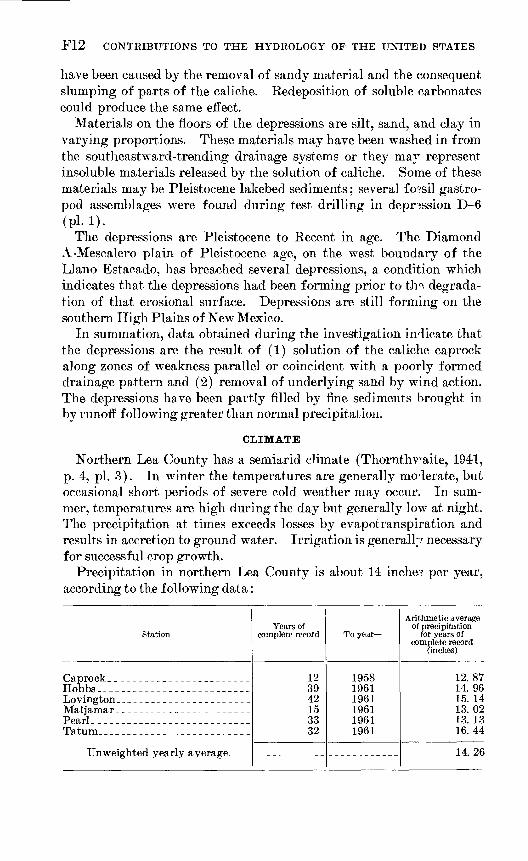
Northern Lea County has a semiarid climate (Thornthvuite, 1941, p. 4, pi. 3). In winter the temperatures are generally moderate, but occasional short periods of severe cold weather may occur. In sum mer, temperatures are high during the day but generally low at night. The precipitation at times exceeds losses by evapotranspiration and results in accretion to ground water. Irrigation is generally necessary for successful crop growth.
Precipitation in northern Lea County is about 14 inche? per year, according to the following data:
Station
Hobbs-. _-----_--_------__-----_
Pearl-________ ____ ___ _______
Years of complete record
123942153332
To year
195819611961196119611961
Arithmetic average of precipitation
for years of complete record
(inches)
12. 8714. 9615. 1413.0213. 1316. 44
14.26
RECHARGE STUDIES, NORTHERN LEA COUNTY, N. MEX. F13
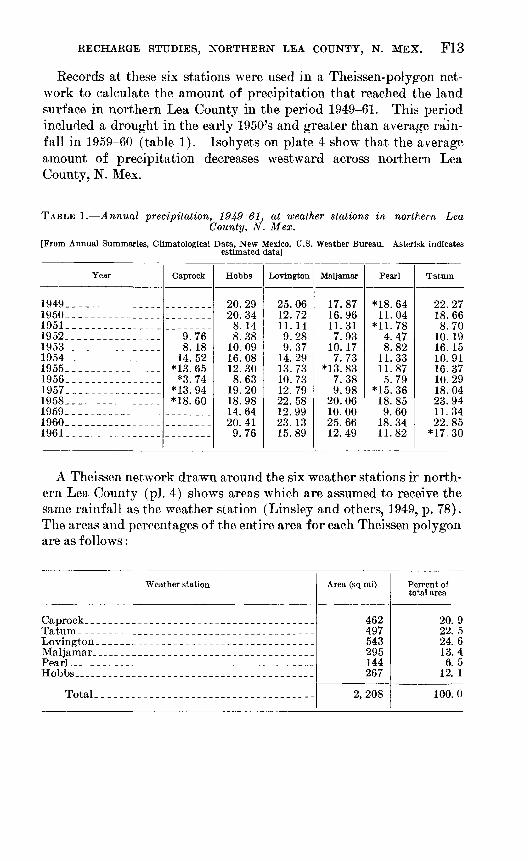
Records at these six stations were used in a Theissen-polygon net work to calculate the amount of precipitation that reached the land surface in northern Lea County in the period 1949-61. This period included a drought in the early 1950's and greater than average rain fall in 1959-60 (table 1). Isohyets on plate 4 show that the average amount of precipitation decreases westward across northern Lea County, N. Mex.
TABLE 1. Annual precipitation, 1949-61, at weather stations in northern LeaCounty, N. Mex.
[From Annual Summaries, Climatological Data, New Mexico, U.S. Weather Bureau. Asterisk indicatesestimated data]
Year
1949________________1950________________1951___ _______1952__________._ ___1953___.____________1954. _______________1955___________ ___1956__-_________--_-1957---_--_-________1958_____-__________1959__-__-_-________1960_. _____________1961_____---_-______
Caprock
9.768. 18
14.52*13. 65
*3. 74*13. 94*18. 60
Hobbs
20.2920.348.148.38
10.0916.0812.308.63
19.2018.9814.6420.419.76
Lovington
25.0612.7211. 149.289.37
14.2913.7310.7312.7922.5812.9923. 1315.89
Maljamar
17.8716.9611.317.93
10. 177.73
*13. 837.389.98
20.0610.0025.6612.49
Pearl
*18. 6411.04
*11.784.478.82
11.3311.875.79
*15. 3618.859.60
18.3411.82
Tatum
22.2718.668.70
10. 1916. 1510.9116.3710.2918.0423.9411.3422.85
*17. 30
A Theissen network drawn around the six weather stations ir north ern Lea County (pi. 4) shows areas which are assumed to receive the same rainfall as the weather station (Linsley and others, 1949, p. 78). The areas and percentages of the entire area for each Theissen polygon are as follows:
Weather station
Tatum _ _
PearL. _ _____ _________ __ ______ ___ _______Hobbs_----_--_________ ___________-----_----___
Total ---_-_____________________--____-_--
Area (sq mi)
462497543295144267
2,208
Percent of total area
20. 922. 524. 613.46.5
12. 1
100.0

F14 CONTRIBUTIONS TO THE HYDROLOGY OF THE UNITED STATES
Precipitation for 1949-61, weighted and adjusted by the Theissen network, was as follows:
Precipitation Year (inches)1949 __________________ X 21. 781950 _________________ '16.151951 _____________ MO. 071952 _________________ 8.971953 __ ___________ 10. 801954 _________________ 12.731955 __________________ 14.02
1 Record from Caprock station not included; other values adjusted to 100 percent.
Precipitation Year (inches)1956 _________________ 8.151957 _________________ 14. 781958 _________________ 21.051959 _____________..___ Ml. 981960 _________________ 1 22.661961 _________________ '14.43
Soil-moisture content, air temperature, humidity, intensity of pre cipitation, and slope of the land surface influence the amount of runoff from precipitation. In northern Lea County, soil-moisture content, air temperature, and humidity can probably be treated as though they were constants. Slope and intensity are the variables. When soil moisture is at a minimum, air temperature is high and humidity is low, and the amount of runoff will probably be low. Runoff will be high from steeper slopes of depressions, but water may stand on level areas atop hills.
Intensity of rainfall can be studied from published precipitation records. Hourly precipitation records from the Caprock weather sta tion show that most rains of 1 inch or more in a 24-hour period fell within 2 to 3 hours. Precipitation patterns at other stations in northern Lea County are similar.
Precipitation of less than 1 inch per 24 hours will result in runoff if the rate of precipitation, in inches, is as follows:
1st day
0. 1-0. 3 .3- .6.6-1.0
2dday
0. 1-0. 3 or 0. 3-0. 6 0. 6-1. 0>0. 5
3d day
0.6-1.0
Much of the intense rainfall in the High Plains, particularly during the summer and early autumn, falls as isolated thunder?howers or cloudbursts. Storms common to three or more stations probably are regional or area wide, rather than limited local events.
The storms that yielded more than 1 inch of precipitation and the instances in which such a storm was common to three or more stations are listed in table 2. During the period studied, an average of three storms a year was common to three stations. Hobbs and Tatum have the greatest average number of heavy storms, about four a year, and Caprock the fewest, about two a year.

RECHARGE STUDIES, NORTHERN LEA COUNTY, N. MEX. F15
£ §11-s S
^-l T-l <N r-H CO r
COIOO'-ICO'-KMCOCOCO'-IIOIM
^lO^HIMCOCOCOCOCOOOCOOOCO
CiCiCiCiCiCiCiCiOiCiCiCiCi

F16 CONTRIBUTIONS TO THE HYDROLOGY OF THE UNITED STATES
In this report, excess precipitation is defined as more thpn 1 inch of rainfall in 24 hours. The first inch of rainfall presumably satisfies soil-moisture deficits or evaporates; larger amounts appear as in runoff. Field observations of rainfall and runoff indicate that this figure is a reasonable estimate.
The precipitation data for northern Lea County were used in estimating the amount of excess precipitation. The excess precipita tion estimated for each year from 1949 through 1960 and the average for that period follow:
year 1949195019511952195319541955
Estimated excess precipitation
(inches) _ _ 4.14
3.251.74
251.195.083.84
Estimated excess precipitation
(inches) . ________ 1.61
YearL956 _______________1957 __________________ 2.651958 __________________ 6.131959 __________________ 1.661960 __________________ 12.34
Average 3.66
The number of days between the last killing frost in the spring and the first killing frost in the fall and the amount of precipitation during this growing season for the Hobbs, Lovington, Maljamar, Pearl, and Tatum weather stations for 1949-61 follow:
Weather station
Hobbs__. ___---__--___...
MaljamarPearl---.-.----------.--.
Average dates
From
May 10 May 15 Apr. 10 Apr. 7 Apr. 21
Apr. 13
To
Nov. 8 Oct. 28 Oct. 31 Nov. 4 Oct. 25
Oct. 31
Average length (days)
214 196 204 211 194
204
Average precipitation during growing season,
1949-61
Inches
12. 81 12. Of 11. 7C 10. If 12. 62
11. 87
Percent of yearly pre cipitation
84. 8 79. 7 89. 6 77. 3 76. 9
83. 1
An evaporation station was operated approximately 3 miles east of Lovington from January 1960 through March 1961. For that period, evaporation averaged 0.09 inch per day. Average daily evaporation from May through August 1960 was 0.36 inch. The monthly evapora tion for 1960 and part of 1961 is compared with that from the Lake Avalon, N. Mex., evaporation pan, listed in table 3. Lake Avalon is about 4 miles north of Carlsbad and about 40 miles west of the study area. Total wind movement in miles measured at Lovington is com pared with that at Lake Avalon in table 3. The altitude at Lake Avalon is 3,208 feet and at the Lovington evaporation pan, approxi-

RECHARGE STUDIES, NORTHERN LEA COUNTY, N. MEX. F17
mately 3,870 feet. The lower altitude and higher mean temperature at Lake Avalon may account for the higher evaporation rate there despite the greater wind movement at Lovington, but differences in exposure are frequently of greater significance.
TABLE 3. Comparison of monthly evaporation and wind movement, 1960-61, Lovington and Lake Avalon, N. Mex.
Date
1960 JanFeb_________________Mar ._
MayJuneJuly... ____..__..._._Aug_________________Sept__ ___________ __OctNov__Dec_________________
1961 JanFeb_________________Mar
Lake Avalon
Evapora tion
(inches)
1 2. 94 1 6. 04 i8. 04 12. 19 15. 11 13.41
1 10. 99 12. 60
9. 67 1 6. 71
4. 54 2 1. 45
1 2. 71 4. 56
1 8. 55
Wind movement
(miles)
2154 3315 2860 2981 3046 1928 1282 2347 1693 1710 1752 1580
1860 2346 3272
Near Lovington
Evapora tion
(inches)
2. 42 3. 64 7. 15 9.79
14. 57 11.93 7.98
10. 15 9. 22 6. 02 4. 64
2 1. 04
2. 41 2 3. 06
6. 62
Wind movement
(miles)
2208 2610 2955 2683
2727 3242 3976
Ratio, Lake Avalon to Loving*<>n
Evapora tion
(inches)
1.21:11. 66:11. 12:11. 22:11. 04:11. 12:11. 38:11. 24:11. 05 : 1 1. 12:1 0. 98:1
2 1. 12:1 2 1. 49 : 1
1. 29:1
Wind novement
(miles)
0.78:1 0. 58:1 0. 59:1 0. 59 : 1
0. 68:1 0.72:1 0.82:1
1 Adjusted to a full month.2 Partial record.
GENERAL GEOLOGY
Nearly all the sedimentary rocks exposed in northern Lea County are of Tertiary or Qua-ternary age. Older rocks crop out in only two places rocks of Late Triassic age along Mescalero Ridge and rocks of Early Cretaceous age on the west side of the northernmost of the Four Lakes. Rocks of Precambrian and Paleozoic age are present only in the subsurface and reportedly do not contain potable water. The only formations of importance to this study are the Ogallala Formation of Tertiary (Pliocene) age, the principal aquifer in northern Lea County, and the underlying formations which retard greatly or prevent the downward movement of water from the Ogal lala Formation.
ROCKS OF TERTIARY AND QUATERNARY AGE
The Ogallala Formation of Tertiary age underlies most of the High Plains. Most authors consider it to be of Pliocene age (C onin, 1961, p. 35), probably deposited by meandering streams. According
798-157 O 66 4

F18 CONTRIBUTIONS TO THE HYDROLOGY OF THE UNITED STATES
to Bretz and Horberg (1949, p. 477), "The Ogallala formation * * * has been universally interpreted as a fluviatile apron deposited east of the Rocky Mountain front * * *."
The Ogallala is as much as 350 feet thick near Mescalero Ridge (Ash, 1963), but it wedges out in the northern part of Lea County where it laps against Cretaceous rocks. The Ogallala probably was deposited by aggrading streams flowing across a post-Mesozoic ero- sional surface. The surface of the High Plains is correlated by Hor berg (1949, p. 464) with the Sacramento plain, possibly of Pliocene age, which truncates the Sacramento Range west of the Pecos River.
The sediments of the Ogallala Formation generally are fine to very fine sand, poorly to moderately well cemented by calcium carbonate. Silt and clay predominate in some sections. The test-hole logs pene trating the upper few feet of the formation could not be correlated where the distance between holes was more than 300 yards (pis. 2, 3; figs. 3-5). Lithologic sections of the Ogallala are given by Theis (1934, p. 131-135), Ash (1963), and Nicholson and Clebsch (1961, fig. 15).
The Ogallala Formation is the principal aquifer of the High Plains. The hydrology of the aquifer is discussed in the section on aquifer characteristics.
Quaternary lakebed sediments consisting of clay, silty sand, and silt have been dated from a fossil snail assemblage collected during test drilling in a depression northwest of Lovington in lot 5, sec. 1, T. 16 S., R. 35 E. These fossils have been identified by D. W. Taylor (written commun., 1962), of the Paleontology and Stratigraphy Branch of the U.S. Geological Survey. Two suites of fresh-water and land snails gathered from 5 to 12 feet below the depression floor contain a single fossil (Dmoceras laeve) not known earlier than in the Illinoian Glaciation of Late Pleistocene age; the other snails occur in Pliocene, Pleistocene, or Recent deposits.
Several fragments of what appear to be algal limestones were also present in this section. These sediments were probably deposited in shallow-water lakes.
These Quaternary lakebed sediments in this part of the High Plains probably are not capable of transmitting more than small quantities of water. Because they are confined to depressions, the total area occupied by these sediments is not great.
Sediments of Recent age mantle much of the surface of Lea County. These sediments consist of sandy to silty or clayey loams containing calcareous and organic material, underlain at shallow to moderate depths by caliche.

RECHARGE STUDIES, NORTHERN LEA COUNTY, N. MEX. F19
Much of the surficial material on the High Plains probably is eolian. This hypothesis is not at all unreasonable because winds attain velocities of 50 to 60 miles per hour for sustained periods during some seasons of the year. Another source of surface material is the break down of caliche containing sand and silt of eolian origin (Brown, 1956, p. 14-15).
Caliche is at or near the surface throughout most of the High Plains. Its contact with the underlying sand of the Ogallala Forma tion is generally gradational. Caliche from 0 to 22 feet thick has been measured in outcrops.
The age of the caliche has not been determined, but the gradational contact between the caliche and the Ogallala Formation indicates that little if any hiatus occurred between the final deposition of the Ogal lala and formation of the caliche. Formation of caliche has probably continued to the present.
Many attempts have been made to account for the origin of the thick deposits of caliche over the High Plains region. Most authors theorize that the caliche has been precipitated by ascending or descend ing water in a soil profile. Others suggest chemical or organic precip itation in shallow lakes as the origin. Most present evidence seems to support the theory of a precipitate around plant roots in an eolian, aggrading soil (Brown, 1956, p. 14-15).
The caliche is predominantly calcium carbonate with minor amounts of sand and finer materials, although siliceous cement and cracks filled with opal or chalcedony have been observed. Near the surface, the caliche commonly is a hard, well-indurated limestone, blocky and slabby in exposure; it grades at depth to a soft, friable, chalky mate rial. In borrow pits, from which caliche has been removed for use as road metal, near-surface slabs 2 to 3 feet long and 4 to 6 inches thick are separated from adjoining slabs by open joints half an inch or more wide. The slabs lie in planes parallel to the general slope of the land surface. The size of the slabs decreases downward, and the caliche grades into softer, more porous material which extends to the top of the Ogallala Formation. (See fig. 6.)
Masses of concentrically banded caliche as much as 8 feet in diam eter and 4 feet in thickness are present in many places within the softer caliche in the lower part of the caliche section (fig. 7). These caliche masses have a well-indurated inner part of irregularly shaped fractured or rounded fragments or of banded caliche (fig. 8). Similar features occur in the slabby caliche at the top of the section.
The color of the hard caliche at a new break varies from very dark brown or black to very light pink or nearly colorless. Softer caliche is a light yellowish gray, light greenish gray, or light brown. Caliche

F20 CONTRIBUTIONS TO THE HYDROLOGY OF THE UNITED STATES
FIGURE 6. Caliche exposed in borrow pit (lot 13, sec. 6, T. 16 S., R. 36 E.) showing blocky and slabby character and gradation to finer material at depth (1-foot rule indicates scale).
RECHARGE STUDIES, NORTHERN LEA COUNTY, N. MEX. F21
FIGURE 7. Rounded caliche boulders in borrow pit west of Lovington. These boulders have been moved; hammer rests on a boulder that probably is in place.
FIGURE 8. Exterior banding and heterogeneous interior features of calicheboulders.
798-157
F22 CONTRIBUTIONS TO THE HYDROLOGY OF THE UNITED STATES
weathers from a light gray or tan on horizontal surface exposures to a medium dark brown on exposures along the cliff faces of Mescalero Ridge.
Several reports have been made about water-bearing caliche on the High Plains outside Lea County (Cronin, 1961, p. 41). Cavernous caliche is reported in Lea County (Nye, 1930, p. 12). In northern Lea County, however, the caliche is well above the water table and is not a water-bearing formation.
GROUND WATER IN THE OGALLALA FORMATION
The principal source of water to wells in northern Lea County is the Ogallala Formation. Prior to the extensive drilling of geophysical prospect holes, two water-bearing zones were reported in parts of the area. A stratum containing "windmill water" is reported to be at shallow depths near Lovington. Northwest of Tatum, in the vicinity of well 11.33.25.442, one rancher indicated that in 1917 and later an artesian aquifer was a few feet below a water-table aquifer at shallow depth (K. W. Epperson, oral commun., 1961). These aquifers at shallow depth probably were perched-water zones overlying clayey materials or indurated caliche in the Ogallala Formation that have since been drained through geophysical prospect holes.
According to Ash (1963), depths to water in the Ogallala range from less than 12 feet a few miles east of Caprock to almost 300 feet along Mescalero Ridge. The saturated thickness of the formation ranges from less than 25 feet to about 250 feet. The zone of saturation is thinnest in the northeastern part of Lea County where the Ogallala Formation is thin.
HYDROLOGIC CHARACTERISTICS OF THE no ATT. AT. A FORMATION
The yield of a properly constructed well depends primarily on the hydraulic properties of the aquifer tapped by the well. These properties include permeability, transmissibility, and storage or spe cific yield. The coefficient of permeability commonly is expressed as the rate of flow of water in gallons per day through a cross-sectional area of 1 square foot under a hydraulic gradient of 100 percent at a temperature of 60° F. Viscosity of fluid contained in an aquifer is a function of temperature, and the range of temperature in most aquifers is small; therefore, the correction for temperature variance commonly is disregarded. The coefficient of permeability in terms of prevailing temperature is referred to as the field coefficient of permeability. Laboratory determinations of permeability are cor rected to 60° F.
RECHARGE STUDIES, NORTHERN LEA COUNTY, N. MEX. F23
The coefficient of transmissibility is expressed as the rate cf flow of water, at the prevailing water temperature, in gallons per day through a vertical strip of the aquifer 1 foot wide extending the full saturated height of the aquifer under a hydraulic gradient of 100 per cent. The coefficient of transmissibility may be considered equal to the product of the field coefficient of permeability and the saturated thick ness of the aquifer.
The coefficient of storage is defined as the volume of wate" that is released from or taken into storage in a vertical prism of the a quifer with a base 1 foot square as the water level declines or rises 1 foot. For unconfined aquifers the coefficient of storage is approximately the same as the specific yield, which may be expressed as the rr.tio of the volume of water that saturated material will yield by gravit7 to its own volume.
The field coefficients of permeability, transmissibility, and storage can be determined by controlled pumping tests. These coefficients are used in formulas to compute the quantity of water that a well or wells might be expected to yield with specified drawdown in the pumped wells and in other wells. Quantitative estimates, therefore, may be made of the amount of water that an. aquifer will yield if the following conditions can be satisfied or accounted for mathemati cally: (1) The aquifer is equally permeable in all directions, (2) the aquifer is of infinite extent, (3) the wells penetrate the full thick ness of the aquifer, (4) the coefficient of transmissibility is constant throughout the aquifer, and (5) the aquifer releases water from storage instantly with a decline in water level. Some variance from the above idealized conditions can be accommodated mathematically without undue distortion of the quantitative estimate.
Nye (1932, p. 249) reported a pumping test at well 17.37.26.400 in Lea County. On the basis of Nye's report, Theis (1934, p. 137) esti mated the coefficient of permeability of the aquifer at this well to be 306 to 356 gpd per ft per ft (gallons per day per foot per foot) and the coefficient of transmissibility to be 53,550 to 62,300 gpd per ft (gallons per day per foot).
Moulder and Frazor (1957, p. 15) concluded that coefficients of transmissibility ranged from 6,000 to 7,000 gpd per ft in the McDonald well field near Amarillo, Tex. The coefficient of permeability would be between 160 and 190 gpd per ft per ft. Cronin and Wells (1960, p. 35) conducted a 120-day pumping test of the Ogallala Formation near Plainview, Tex., and estimated that the coefficient of transmis sibility was between 24,000 and 38,000 gpd per ft and the coefficient of permeability between 100 and 170 gpd per ft per ft.

F24 CONTRIBUTIONS TO THE HYDROLOGY OF THE UNITED STATES
Coefficients of transmissibility ranging from 109,000 to 325,000 gpd per ft were computed from data obtained by recharging the aquifer through recharge well 2 in sec. 5, T. 16 'S., R. 37 E. These values are inconclusive because of their large range. The large range in coeffi cients is attributed to poor test conditions arising from fluctuating recharge rates caused by variations in the degree of screen clogging.
Analysis by the U.S. Geological Survey hydrologic laboratory of recompacted samples of sand f rom a Lovington city well (16.36.10.241) gave the following hydrologic characteristics:
Specific gravity____________________________ 2. 68 Dry unit weight_____________________g per cc_ 1.46 Specific retention_____________________percent_ 7.1 Porosity __________________________do__ 45.5 Specific yield__________________________do__ 38. 4 Coefficient of permeability__________gpd per ft per ft_ 100
Laboratory determinations of permeability of sediments from above the saturated section of the aquifer along Mescalero Ridge are given by Theis (1934, p. 133). The highest coefficient of permeability is 125 gpd per ft per ft, the lowest 15, and the average 60.
For administration of the Lea County Underground Water Basin, the New Mexico State Engineer uses a coefficient of transmissibility of 100,000 gpd per ft as an average transmissibility for the Ogallala Formation.
The specific yield of a few samples of the Ogallala Formation from northern Lea County have been determined by laboratory methods. The average specific yield of samples collected by Theis (1934) was 27.8 percent. The recompacted sample of sand pumped from a Lov ington city well in 1961 had a specific yield of 38.4 percent. Tertiary sand from the southern High Plains in Texas (Barnes and others, 1949, p. 40-41) had an average of 29.2 percent for 8 samples. Data from pumping and recharging tests and laboratory determinations indicate that the specific yield of the Ogallala Formation in the southern High Plains is about 15 percent (Cronin, 1961, p. 46).
From 1930 through January 1955 a net of about 936,000 acre-it (acre-feet) of ground water was pumped in northern Lea County. Annual water-level-change maps prepared by the Geological Survey indicate that this pumpage dewatered 3,879,000 acre-ft of sediments. On the basis of the preceding figures and if recharge other than irri gation return was negligible, the specific yield of the Ogallala Forma tion is 24 percent.
The New Mexico State Engineer uses a specific yield of 20 percent in administering the ground-water rights in the Lea County Under ground Water Basin, and this figure will be used in this reioort. This
RECHARGE STUDIES, NORTHERN LEA COUNTY, N. MEX. F25
figure of 20 percent has been questioned in hearings before th^ State Engineer, and most witnesses have agreed that it is reasonable.
The porosity of 23 samples of the Ogallala as .reported by Theis (1934, p. 133) ranged from 33.4 to 47.4 percent and averaged 36.2 per cent. The porosity of a sample from a well in Lovington was 45.5 percent. An average porosity of 40 percent possibly would not be an unreasonable assumption for the purposes of this report.
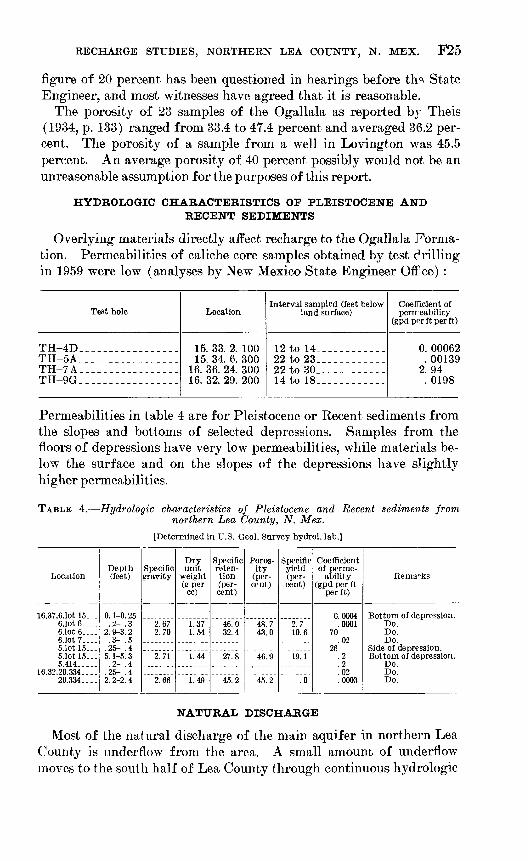
HYDROLOGIC CHARACTERISTICS OF PLEISTOCENE AND RECENT SEDIMENTS
Overlying materials directly affect recharge to the Ogallala Forma tion. Permeabilities of caliche core samples obtained by test drilling in 1959 were low (analyses by New Mexico State Engineer Offce) :
Test hole
TH-4D______. -.--_.____TH-5A_.. ______________TH 7A. .___....__._____TH-9G__-___-_ ___-___
Location
15. 33. 2. 10015. 34. 6. 300
16. 36. 24. 30016. 32. 29. 200
Interval sampled (feet below land surface)
12 to 14____________22 to 23.-.- _ -----22 to 30____________14 to 18_______--__-
Coefftcient of penreability
(gpd per ft per ft)
0. 00062. 00139
2.94. 0198
Permeabilities in table 4 are for Pleistocene or Recent sediments from the slopes and bottoms of selected depressions. Samples from the floors of depressions have very low permeabilities, while materials be low the surface and on the slopes of the depressions have slightly higher permeabilities.
TABLE 4. Hydrologic characteristics of Pleistocene and Recent sediments from northern Lea County, N. Mex.
[Determined in U.S. Geol. Survey hydrol. lab.]
Location
16.37.6.1ot 15 6.1ot6____6.1ot 6..,.6.1ot7_-__5.10tl5 5.10tl5 5.414__.__
16.32.20.334____20.334 ....
Depth(feet)
0. 1-0. 25.2- .3
2. 9-3. 2.3- .5
.25- .45. 1-5. 3.2- .4
.25- .42. 2-2. 4
Specificgravity
2.672.70
2.71
2.66
Dryunit
weight(gper
cc)
1.371.54
1.44
1.49
Specificretention(percent)
46.032.4
27.8
45.2
Poros-ity
(percent)
48.743.0
46.9
45.2
Specificyield(percent)
2.710.6
19.1
.0
Coefficientof perme
ability(gpd per ft
per ft)
0.0004.0001
70.02
26.2.2.02.0003
Remarks
Do.Do.Do.
Bottom of depression.Do.Do.Do.
NATURAL DISCHARGE
Most of the natural discharge of the main aquifer in northern Lea County is underflow from the area. A small amount of underflow moves to the south half of Lea County through continuous hydrologic
F26 CONTRIBUTIONS TO THE HYDROLOGY OF THE UNITED STATES
connections with Quaternary aquifers (Nicholson and Ctabsch, 1961, pi. 2), but most of the underflow moves eastward through the Ogallala Formation into Texas.
Underflow (table 6) may be computed by using the formulaQ=Pf I mw
whereQ = quantity of underflow, in gpd, Pf = field coefficient of permeability, gpd per ft per ft, /= hydraulic gradient, in feet per mile,
m= thickness of saturated section, in feet, and w= width of section of flow in miles.
In 1952, a 47.5-mile section near the Texas-New Mexico State line had an average saturated thickness of 130 feet. The hydraulic gra dient, the slope of the water table to the southeast, ranged from 4.6 to 21.7 feet per mile, averaging 15 feet per mile along this saturated section. Three estimates of field permeability were used to compute underflow. Theis (1934, p. 151) used Pf values of 60 and 325 gpd per ft per ft in computing underflow in northern Lea County. The New Mexico State Engineer office uses a transmissibility of 100,000 gpd per ft for administration of the Lea County basin. Transmissi bility is the product of field permeability and the saturated thickness; therefore, the 130-foot-thick saturated section along the State line has a field permeability of about 770 gpd per ft per ft if the transmissi bility is 100,000 gpd per ft.
Underflow to Texas would be about 7,000 acre-ft per year if Pf=60 gpd per ft per ft; about 36,000 if P/ = 325; and about 84,000 if Pf = 770. This author believes that a Pf of 325 gpd per ft per ft is a reasonable estimate of permeability of the Ogallala in Lea County and that underflow is about 36,000 acre-ft per year.
Springs and seeps discharge small amounts of water along Mescalero Ridge. A few small lakes intersect the water table in the northern part of Lea County, and water is discharged from the lake surface by evaporation.
The water table in much of Lea County lies below the depth at which evapotranspiration can discharge ground water. Transpiration by vegetation is confined generally to the vicinity of springs and seeps, and natural discharge from these areas is not great. Deeply penetrat ing roots of phreatophytes such as mesquite may reach the water table in some areas (Robinson, 1958, p. 14) ; however, this transpiration potential is small in Lea County.
ARTIFICIAL DISCHARGE
About 1,650 wells were yielding water for industrial, municipal, irrigation, and secondary-oil-recovery uses in northern Lea County
RECHARGE STUDIES, NORTHERN LEA COUNTY, N. MEX. F27
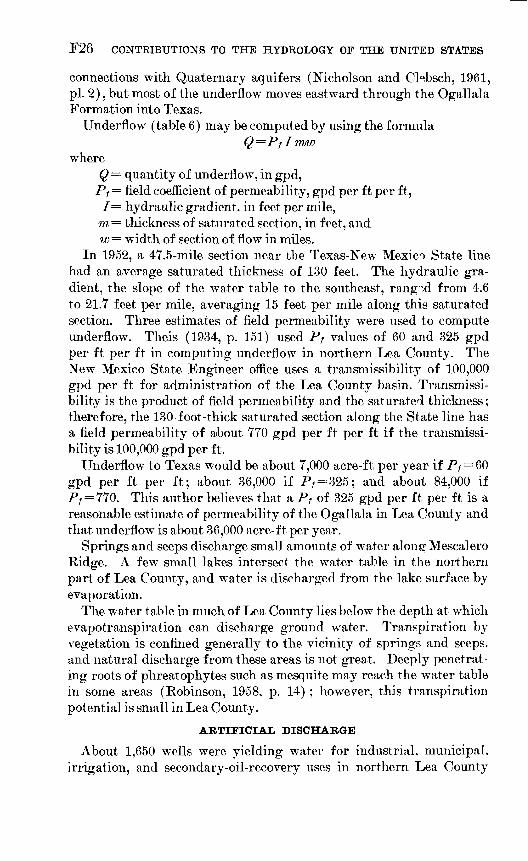
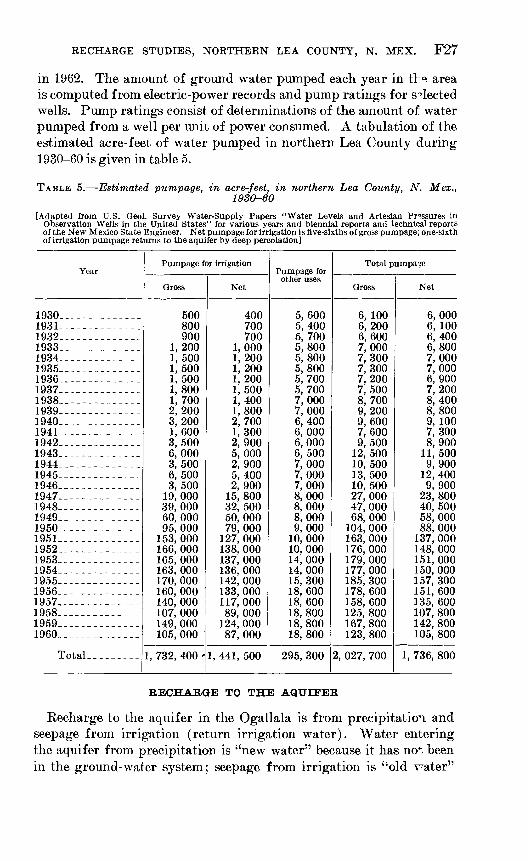
in 1962. The amount of ground water pumped each year in tl Q, area is computed from electric-power records and pump ratings for selected wells. Pump ratings consist of determinations of the amount of water pumped from a well per unit of power consumed. A tabulation of the estimated acre-feet of water pumped in northern Lea County during 1930-60 is given in table 5.
TABLE 5. Estimated pumpage, in acre-feet, in northern Lea County, N. Mex.,1930-60
[Adapted from U.S. Geol. Survey Water-Supply Papers "Water Levels and Artesian Pressures in Observation Wells in the United States" for various years and biennial reports and technical reports of the New Mexico State Engineer. Net pumpage for irrigation is five-sixths of gross pumpage; one-sixth of irrigation pumpage returns to the aquifer by deep percolation]
Year
1930 -----------1931 -----------1932 -----------1933 -----------1934 -----------1935 -----------1936 ----------1937 -----------1938 -----------1939 -----------1940 1Q411942 ----1943--------------1Q441945 -----------1946 _ _-__-__-___10471948 -----------1Q4Q1950 ----------1951 -----------1952 ----------1953 1954 ------------1955 -----------1956 ----------1957 -----------1958 ----------1959 -----------I960 ._
Total-
Pumpage for irrigation
Gross
500 800 900
1,200 1,500 1,500 1,500 1,800 1, 700 2,200 3,200 1,600 3,500 6,000 3, 500 6, 500 3, 500
19, 000 39, 000 60, 000 95, 000
153, 000 166, 000 165, 000 163, 000 170, 000 160, 000 140, 000 107, 000 149, 000 105, 000
1, 732, 400 '
Net
400 700 700
1,000 1,200 1, 200 1,200 1, 500 1, 400 1,800 2,700 1,300 2, 900 5,000 2, 900 5,400 2,900
15, 800 32, 500 50, 000 79, 000
127, 000 138, 000 137, 000 136, 000 142, 000 133, 000 117,000 89, 000
124, 000 87, 000
1, 441, 500
Pumpage for other uses
5, 600 5,400 5,700 5,800 5,800 5,800 5,700 5,700 7,000 7,000 6,400 6, 000 6,000 6,500 7,000 7,000 7,000 8,000 8,000 8,000 9,000
10, 000 10, 000 14, 000 14, 000 15, 300 18, 600 18, 600 18, 800 18, 800 18, 800
295, 300
Total pumpage
Gross
6, 100 6,200 6,600 7,000 7,300 7,300 7,200 7,500 8,700 9,200 9,600 7,600 9,500
12, 500 10, 500 13, 500 10, 500 27, 000 47, 000 68, 000
104, 000 163, 000 176, 000 179, 000 177, 000 185, 300 178, 600 158, 600 125, 800 167, 800 123, 800
2, 027, 700
Net
6,000 6, 100 6,400 6,800 7,000 7,000 6, 900 7,200 8,400 8,800 9, 100 7,300 8,900
11,500 9, 900
12, 400 9, 900
23, 800 40, 500 58, 000 88, 000
137,000 148, 000 151,000 150, 000 157, 300 151, 600 135, 600 107, 800 142, 800 105, 800
1, 736, 800
RECHARGE TO THE AQUIFER
Recharge to the aquifer in the Ogallala is from precipitation and seepage from irrigation (return irrigation water). Water entering the aquifer from precipitation is "new water" because it has not been in the ground-water system; seepage from irrigation is "old v^ater"
F28 CONTRIBUTIONS TO THE HYDROLOGY OF THE UNITED STATES
because it is the return to the aquifer of water that was temporarily withdrawn.
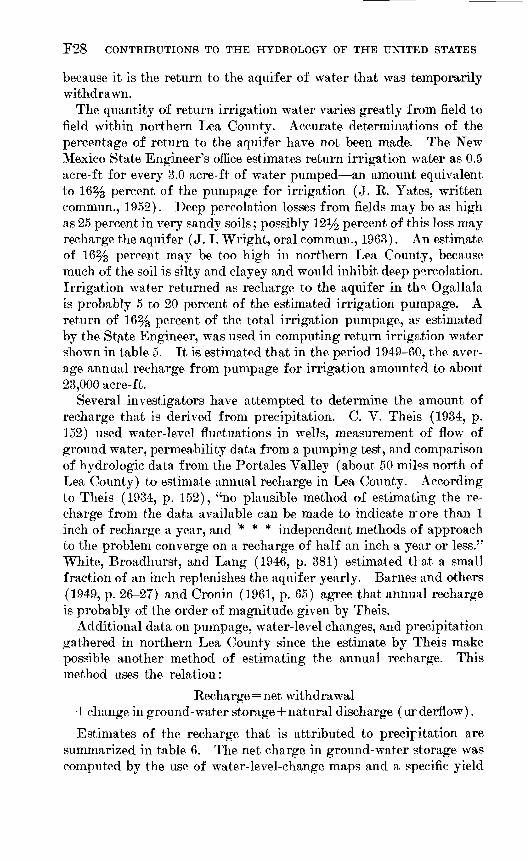
The quantity of return irrigation water varies greatly from field to field within northern Lea County. Accurate determinations of the percentage of return to the aquifer have not been made. The New Mexico State Engineer's office estimates return irrigation water as 0.5 acre-ft for every 3.0 acre-ft of water pumped an amount equivalent to 16% percent of the pumpage for irrigation (J. R. Yates, written commun., 1952). Deep percolation losses from fields may be as high as 25 percent in very sandy soils; possibly 12i/£ percent of this loss may recharge the aquifer (J. I. Wright, oral commun., 1963). An estimate of 16% percent may be too high in northern Lea County, because much of the soil is silty and clayey and would inhibit deep percolation. Irrigation water returned as recharge to the aquifer in th°, Ogallala is probably 5 to 20 percent of the estimated irrigation pumpage. A return of 16% percent of the total irrigation pumpage, as estimated by the State Engineer, was used in computing return irrigation water shown in table 5. It is estimated that in the period 1949-60, the aver age annual recharge from pumpage for irrigation amounted to about 23,000 acre-ft.
Several investigators have attempted to determine the amount of recharge that is derived from precipitation. C. V. Theis (1934, p. 152) used water-level fluctuations in wells, measurement of flow of ground water, permeability data from a pumping test, and comparison of hydrologic data from the Portales Valley (about 50 mil°,s north of Lea County) to estimate annual recharge in Lea County. According to Theis (1934, p. 152), "no plausible method of estimating the re charge from the data available can be made to indicate irore than 1 inch of recharge a year, and * * * independent methods of approach to the problem converge on a recharge of half an inch a year or less." White, Broadhurst, and Lang (1946, p. 381) estimated tl at a small fraction of an inch replenishes the aquifer yearly. Barnes and others (1949, p. 26-27) and Cronin (1961, p. 65) agree that annual recharge is probably of the order of magnitude given by Theis.
Additional data on pumpage, water-level changes, and precipitation gathered in northern Lea County since the estimate by Theis make possible another method of estimating the annual recharge. This method uses the relation:
Recharge=net withdrawal + change in ground-water storage+natural discharge (ur derflow).
Estimates of the recharge that is attributed to precipitation are summarized in table 6. The net charge in ground-water storage was computed by the use of water-level-change maps and a specific yield
RECHARGE STUDIES, NORTHERN LEA COUNTY, N. MEX. F29
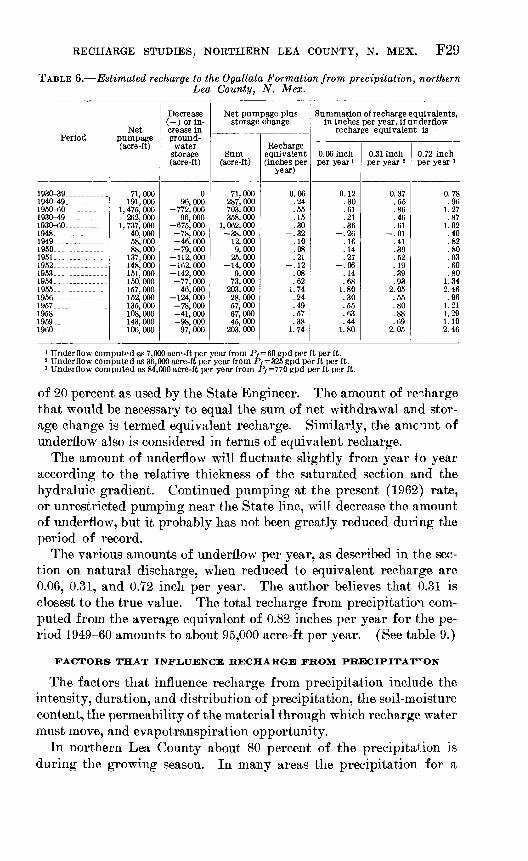
TABLE 6. Estimated recharge to the Ogallala Formation from precipitation, northernLea County, N. Mex.
Period
1930-39___________1940-49. __ ______1950-60___._______1930-49___________193&-60---_-______1948. _____________1949___.___ ___ __1950______________1951____. _________1952______________1953__-_.____ __1954-____-_-_-.___1955_-__--________19S6_______.______1957__.___________1958_____. ________1959--------.----1960_-_______.____
Net pumpage (acre-ft)
71,000 191,000
1, 475, 000 262,000
1, 737, 000 40,000 58,000 88,000
137,000 148,000 151,000 150,000 157,000 152, 000 135,000 108,000 143,000 106,000
Decrease (-) or in crease in ground- water
storage (acre-ft)
0 96,000
-772, 000 96,000
-675, 000 -78,000 -46, 000 -79,000
-112,000 -162,000 -142,000 -77,000
46,000 -124,000 -78,000 -41, 000 -98, 000
97,000
Net pumpage plus storage change
Sum (acre-ft)
71,000 287,000 703,000 358,000
1, 062, 000 -38,000
12,000 9,000
25,000 -14,000
9,000 73,000
203,000 28,000 57,000 67,000 45,000
203,000
Recharge equivalent (inches per
year)
0.06 .24 .55 .15 .30
-.32 .10 .08 .21
-.12 .08 .62
1.74 .24 .49 .57 .38
1.74
Summation of recharge equivalents, in inches per year, if underflow
recharge equivalent is
0.06 inch per year '
0.12 .30 .61 .21 .36
-.26 .16 .14 .27
-.06 .14 .68
1.80 .30 .55 .63 .44
1.80
0.31 inch per year 2
0.37 .55 .86 .46 .61
-.01 .41 .39 .52 .19 .39 .93
2.05 .55 .80 .88 .69
2.05
0.72 inch per year s
0.78 .96
1.27 .87
1.02 .40 .82 .80 .93 .60 .80
1.34 2.46 .96
1.21 1.29 1.10 2.46
1 Underflow computed as 7,000 acre-ft per year from P/=60 gpd per ft per ft.2 Underflow computed as 36,000 acre-ft per year from P/=325 gpd per ft per ft.3 Underflow computed as 84,000 acre-ft per year from P/=770 gpd per ft per ft.
of 20 percent as used by the State Engineer. The amount of recharge that would be necessary to equal the sum of net withdrawal and stor age change is termed equivalent recharge. Similarly, the amount of underflow also is considered in terms of equivalent recharge.
The amount of underflow will fluctuate slightly from year to year according to the relative thickness of the saturated section and the hydraluic gradient. Continued pumping at the present (1962) rate, or unrestricted pumping near the State line, will decrease the amount of underflow, but it probably has not been greatly reduced during the period of record.
The various amounts of underflow per year, as described in the sec tion on natural discharge, when reduced to equivalent recharge are 0.06, 0.31, and 0.72 inch per year. The author believes that 0.31 is closest to the true value. The total recharge from precipitation com puted from the average equivalent of 0.82 inches per year for the pe riod 1949-60 amounts to about 95,000 acre-ft per year. (See table 9.)
FACTORS THAT INFLUENCE RECHARGE FROM PRECIPITATION
The factors that influence recharge from precipitation include the intensity, duration, and distribution of precipitation, the soil-moisture content, the permeability of the material through which recharge water must move, and evapotranspiration opportunity.
In northern Lea County about 80 percent of the precipitation is during the growing season. In many areas the precipitation for a
F30 CONTRIBUTIONS TO THE HYDROLOGY OF THE UNITED STATES
24-hour period may take place in 2 to 3 hours with the result that not all the water infiltrates the ground where it falls, but some runs off. About 25 percent of the excess precipitation is ruroff to the depressions.
Materials of low permeability at the land surface prevent or greatly retard infiltration and promote runoff to the depressions. The hard, dense caliche that covers large areas in Lea County has a very low permeability. Cracks as wide as half an inch may fovm between large slabs of dense caliche and increase the permeability locally. In gross the permeability of the dense caliche is estimated to be as high as 20 gpd per sq ft. Material of low permeability (sil* and clay) is also present in the bottoms of most of the swales and depressions (table 4).
About 75 percent of the precipitation that infiltrates th°s soil either is discharged by evapotranspiration in the upper part of the soil profile or percolates to depths beyond the reach of plants and evaporation. The opportunity for evapotranspiration is high where water is inter cepted by a vegetative cover; however, the vegetation will retard runoff and give the water an opportunity to enter the ground near the point where it hits the earth. In some places recharge would be greater under a vegetative cover than upon barren ground.
Some of the water en route to the zone of saturation may be retained in the unsaturated section by capillary or molecular attraction. Less permeable zones within the Ogallala Formation will inhibit the down ward movement of water, and extensive, flat-lying layers of silty or clayey sediments may perch small bodies of water abo^e the main water table.
Sand dune areas offer the best opportunity for natural recharge because they are highly permeable and quickly absorb precipitation.
Some of the water that ponds in a depression is discharged by evaporation before it can infiltrate the bottom of the depression. No studies were made during the project to determine the rate of evapo ration from pond surfaces; however, the rate of evaporr.tion can be estimated from the evaporation rate from a class A land pan. The results of other investigators (Linsley, Kohler, and Paulhus, 1949, p. 163) who have studied evaporation rates generally show that evaporation rates from pond and lake surfaces are between 0.6 and 0.8 (referred to as pan coefficients) of that from class A land pans. Evaporation rates from water surfaces in the broad shallow depres sions of Lea County may be about equal to that of the land pan, or have a pan coefficient of about 1.0. A pan coefficient of about 0.8 is probably a reasonable one to use as an average for estimpting evapo ration from water surfaces in the depressions of northern Lea County.
RECHARGE STUDIES, NORTHERN LEA COUNTY, N. MEX. F31
NATURAL RECHARGE IN SELECTED DEPRESSIONS
After a rainfall in July 1960, water ponded in six depressions that had been selected for studies of natural recharge. Most of the water in these depressions dissipates naturally by evaporation and infiltra tion. Transpiration by vegetation in the bottoms of some depressions may account for some water loss. Some of the infiltrating water percolates to the water table and causes temporary mounding of the water table beneath the depressions.
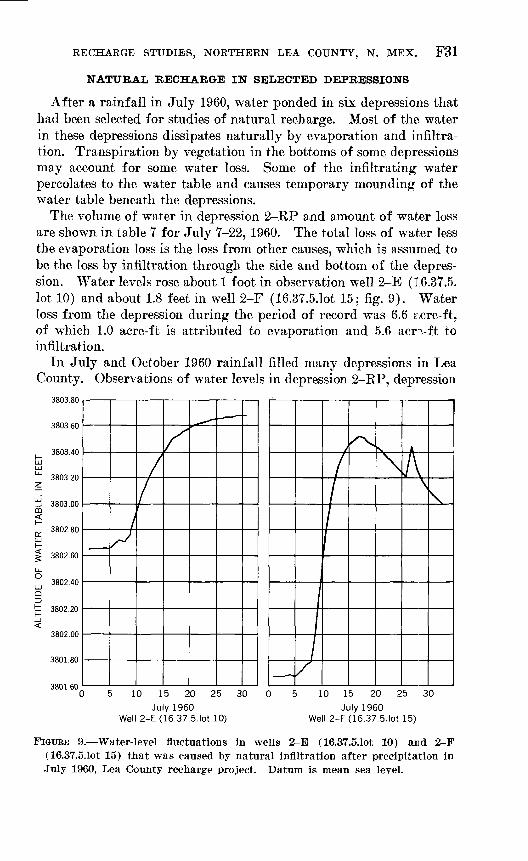
The volume of water in depression 2-RP and amount of water loss are shown in table 7 for July 7-22, 1960. The total loss of water less the evaporation loss is the loss from other causes, which is assumed to be the loss by infiltration through the side and bottom of the depres sion. Water levels rose about 1 foot in observation well 2-E (16.37.5. lot 10) and about 1.8 feet in well 2-F (16.37.5.1ot 15; fig. 9). Water loss from the depression during the period of record was 6.6 gxre-ft, of which 1.0 acre-ft is attributed to evaporation and 5.6 acrvft to infiltration.
In July and October 1960 rainfall filled many depressions in Lea County. Observations of water levels in depression 2-RP, depression
3803.80
3803.60
3803.40LJ UJ
^ 3803.20Z
Iti 3803.00QD
I-£, 3802 80LJ
g 3802.60
u.
° 3802.40Q
t 3802.20
3802.00
3801.80
3801.60
Xft
10 15 20
July 1960
25 30
Well 2-E (16.37. 5. lot 10)
10 15 20 25 30July 1960
Well 2-F (16.37. 5. lot 15)
FIGUEE 9. Water-level fluctuations in wells 2-E (16.37.5.1ot 10) and 2-F (16.37.5.1ot 15) that was caused by natural infiltration after precipitation in July 1960, Lea County recharge project. Datum is mean sea level.

F32 CONTRIBUTIONS TO THE HYDROLOGY OF THE UNITED STATES
TABLE 7. Computed loss of water, July 7-22, 1960, from depression 2-RP (lot 15, sec. 5, T. 16 S., R. 37 E.) Lea County recharge project.
Date in July 1960
7 -- --ll._. ------ _ - _ -13 -__ 14.__ _ _______ _ _16.. ___-__-------._18 - -- 19-_________ ______2021_________________22_______________._
Total__________
Staff gage reading (leet
above datum)
3.60 2. 85 2.53 2.40 2.26 2. 10 2.05 2.00 1. 93 1. 8£
Volume in storage (acre-ft)
9. 5 6.3 5. 1 4.5 4. 1 3.6 3.4 3.2 3.0 2.9
Loss since preceding date
Computed total loss (acre-ft)
3 2 1 2
6 4 5 2 2 2 1
6.6
Total evaporation using pan coefficient
of 0.8 (acre- ft)
o ? iC5c?13 12 08 08 07
1.01
Apparent infiltration
(acre-ft)
2 9 1 1
55 32 37 08 12 12 03
5.59
3-RP, and depression 4-RP (fig. 13), evaporation from a class A land pan, and rainfall are shown in figure 10.
From July 12 to August 1, 1960, about. 1 foot of wp.ter was lost from depression 2-RP. Evaporation was about 0.75 foof. with a pan coefficient of 1.0, or about 0.6 foot with 0.8 coefficient. T us, losses to other than evaporation (principally infiltration) were 0.25 to 0.40 foot. For this 19-day period infiltration in depression 2-RP amounted to 0.013 to 0.021 foot per day, or 0.097 to 0.157 gpd per sq ft.
For the period October 17-December 5, 1960, two rates of loss from depression 2-RP apply (fig. 9). From October 17-28 about 180,000 gal. (gallons) of water was artifically recharged throrgh recharge well 2-RP, and the apparent loss was 0.031 to 0.034 foot per day. From October 28 through December 5 the apparent loss was 0.004 to 0.007 foot per day.
In addition to draining the pond for artificial reel arging, two other factors may have caused this change in apparent rr.te of loss on October 28: (1) the water level may have receded to le?s permeable sediments on the sides of the depression or (2) freezing temperatures on or after October 31 may have killed vegetation in tl °i pond area and eliminated transpiration losses. If transpiration losses have been eliminated from the readings of October 28 to December 5, a rate of 0.004 to 0.007 foot per day may closely approximate the true infiltra tion rates at this elevation in the depression. (See table 4).
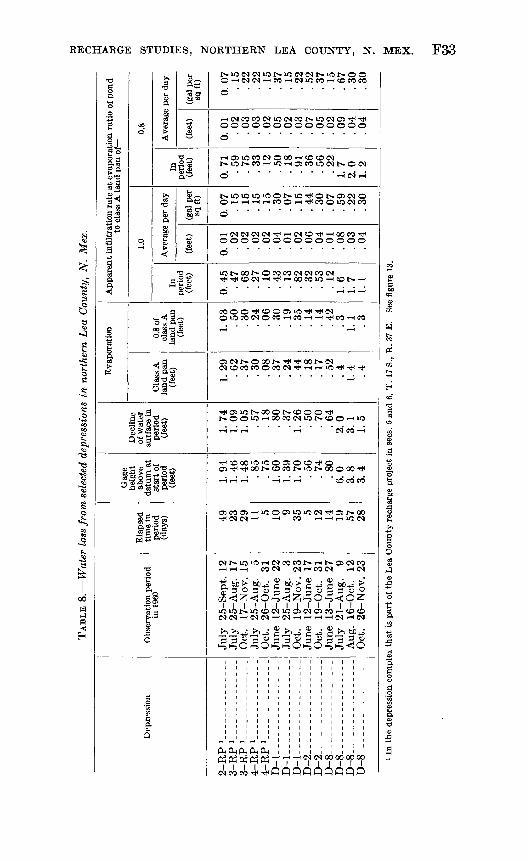
Water losses from other depressions in northern Lef, County are summarized in table 8. Losses from other than evaporation range from 0.09 foot per day to 0.01 foot per day at a 0.8 pan coefficient, or 0.08 to 0.01 foot per day at 1.0 pan coefficient.
RECHARGE STUDIES, NORTHERN LEA COUNTY, N. MEX. F33
3«
00 STS,®
J73 *
S Sb*.H
rH T-l T-l CO C<l
III I I I I I I I I IIIiO *O r*» ^O CO O^ *O Oi O^ QJ CO ^H cw CO

F34 CONTRIBUTIONS TO THE HYDROLOGY OF THE UNITED STATES
41 1 1 1 1 I ITT I
illy rechargir
Pond dry
Depression 2-RPArtificially recharging
Artificially recharging
2 1
S 0
Artificially recharging
\
Mill
1̂ -\
Pond dry
.___l__
y
\
Depression 3-RP
X\
v\
rf\
^\Pond dry
Depression 4-RP
\
\
\
1 1 1 1 1LOO LO O LO
JUNE
^^
1 1 1 1 1
r-l r-lCJ CM
JULY
^
1 1 1 IIUDO 1^)0 Ln
AUG
1 1 1 1 1
^212SSSEPT
Mill
^SSSSOCT
"----
1 1 1 1 1r-I^CJINJ
NCV
II II 1ino Lnotf>
DEC
1960
FIGURE 10. Water-level declines in selected depressions, precipitation, and evap oration from class A land pan, June through December 1960, Lea County recharge project.

RECHARGE STUDIES, NORTHERN LEA COUNTY, N. MEX. F35
Although natural recharge through depressions will retur^ large quantities of water to the aquifer, the process is slow and inefficient. More than 80 percent of the water in shallow ponds may be lost by evapotranspiration at a pan coefficient of unity. In depression 8 (NE14 sec. 20, T. 16 S., R. 32 E., table 8) evaporation loss was 81 percent of the losses when the water level was less than 1 foot above the depression floor a loss of about 3 acre-ft. When the level was 4 to 6 feet above the floor, losses were about 20 percent of the total a loss of about 11 acre-ft. Even though the percentage of losr at the higher elevations is less, these losses are greater than the increased percentage at lower water levels.
SOURCES OF WATER FOR ARTIFICIAL. RECHAPGE
Sources of water other than precipitation are not readily available for artificial recharge in northern Lea County. Possibilities for in creasing the amount of water available for artificial recharge in this area include the salvage of industrial waste waters and purified sewage effluents, importation of water from the Pecos or Canadian Eiver basins, and redistribution of ground water in storage.
PRECIPITATION
The precipitation that is available for artificial recharging is the runoff from excess precipitation that collects in or can be diverted to the depressions. A comparison of the graphs in figure 11 indicates a correlation between estimated yearly recharge and excess precipita tion. Two years, 1955 and 1960, are notable for recharge; in both these years precipitation was more than 4 inches above normal. In 1954, another year of greater than normal precipitation, a storm in May centered northwest of Lovington caused extensive runcff and flooding throughout the city. The Lovington weather station recorded 4.40 inches of precipitation from May 16 through 18 and ar addi tional 1.27 inches on May 22.
About 30 percent of the excess precipitation probably recharged the aquifer during 1949-60 (table 9). Although the spread about any median value of excess precipitation as effective recharge is wide, an average of about one-third of the excess precipitation probably will recharge the ground-water reservoir; a part of the remaining two-thirds will be available for artificial recharge.
Estimated excess precipitation multiplied by 1,400,000 (acres in study area) gives the estimated potential runoff. The yearly average potential runoff for 1949-60 is approximately 400,000 acre-ft (table 9).
The approximate percentage of potential runoff which reached selected depressions during study periods is shown in table 10. Drain-
ES
TIM
AT
ED
E
XC
ES
S
PR
EC
IPIT
AT
ION
, IN
IN
CH
ES
ES
TIM
AT
ED
N
AT
UR
AL
RE
CH
AR
GE
, IN
IN
CH
ES
P
ER
U
NIT
A
RE
A
FIG
UR
E 11. G
raphic
com
pari
son
of e
xces
s pr
ecip
itat
ion
and
esti
mat
ed r
echa
rge
in n
orth
ern
Lea
Cou
nty,
N.
Mex
.,19
49-6
0.
CO
O
5

RECHARGE STUDIES, NORTHERN LEA COUNTY, N. MEX. F37
TABLE 9. Estimated excess precipitation, natural recharge, and potential runoff 1949-60, northern Lea County, N. Mex.
Year
1949_____--__________1950. ________________1951__________. ______1952__... ...-________1953_______________._1954___. _____________1955___--__----_.____1956_-______--_______1957_______-_-.______1958___.___--________1959_________._______1960__________.______
Estimated excess precipitation; see
page F16 (inches)
4 143.251. 74.25
1. 195.083.841.612. 656. 131. 66
12. 34
3. 66
Estimated natural recharge;
see table 6 (inches)
0.41. 39.52
1Q. 39
932.05
. 55
.80
. 88
. 692.05
0. 82
Ratio of natural recharge to excess
precipitation (percent)
101930763318533430144217
31
Estimated potential runoff
(acre-ft)
483, 000379, 000203, 000
29, 100139, 000593, 000448, 000188, 000309, 000715, 000194, 000
1, 440, 000
427, 000
TABLE 10. Estimated excess precipitation, runoff, storage increase, and ratio of storage increase to runoff in selected depressions in northern Lea County, N. Mex.
Depression
1-RP____________1-RP____________2-RP _2-RP2-RP____ _______2-RP__3-RP .3-RP3-RP3-RP___.________4-RP____________4-RP__ _ __4-RP__. _________D-l_____________D-l_____________D-l_____________D-2_____________D-2_____________D-2_____________
Average
Observation date in 1960
July 5-6____________July 5-7___________.July 5 _ _July 5-7____________Oct. 17___. __ -Oct. 17-18__________July 5______________July 5-7 - -Oct. 17 __ _ _Oct. 17-18__________July 5______________July 5-7____________Oct. 17_____________June 12 _July 6______________Oct. 19_____________June 12__ _____ ___July 6______________Oct. 19-__-______-__
Estimated excess pre cipitation
(feet)
0.321. 505. 104. 505.236.288. 127. 510. 233
i . 248. 127. 510. 233. 096. 275. 248. 086. 234. 258
Estimated potential
runoff (acre-ft)
73. 6115. 8
6. 531. 314. 617. 8
9. 839. 217.9
1 19. 15.0
19.99. 12.88. 07. 21. 64. 24. 6
Estimated increase
in storage (acre-ft)
10. 221. 0
1. 39. 72. 82. 81. 0
11. 82. 4
2 1. 92.49.73. 9
. 55. 5
. 7
. 2
. 5
. 3
I atio of storage increase tc runoff (percent)
13.818. 120. 031. 019. 215. 710.230. 113. 4
2 9. 948. 048. 742.917. 968. 8
9. 712. 511.9
6. 5
24.4
1 Precipitation data may be erroneous.2 Amount of storage increase may be too low by the amount of infiltration that occurred. Fii*ures not
included in average.
age areas for these depressions were taken from topographic maps and aerial photographs. The amount of water actually appearing in selected depressions compared to the estimated amount of potential
F38 CONTRIBUTIONS TO THE HYDROLOGY OF THE UNITED STATES
runoff to those depressions ranges from 6 to 69 percent and averages about 25 percent.
Some of the variation in these figures probably can be attributed to water unaccounted for because of infiltration. The degree of accuracy in delimiting the boundaries of the drainage tributary to each depression studied also affected the accuracy of the results.
On the basis that approximately 25 percent of the potential runoff reaches the depressions throughout northern Lea County, the figures given below show the probable amounts of water in depressions in the period 1949-60.
Estimated runoff reaching depressions
Year (acre-ft) 1949________________ 121,0001950 ________________ 95,0001951 ________________ 51,0001952 _______________ 7,0001953 _______________ 35,0001954 _______________ 148, 000 1955_______________ 112,000 1956 _______________ 47,000
Est '-mated runoff reaching depressions
Year (acre-ft) 1957 _________________ 77,000 1958________________ 179,0001959 _______________ 48,0001960 ________________ 360, 000
Total ____________ 1,280,000 Average __________ 107, 000
OTHER SOURCES OF WATER
Precipitation is the principal source of water for artificial recharge in northern Lea County, but other sources could furnish relatively small quantities of water. Industrial- or municipal-waste-water could be returned to the aquifer if its purity, both chemical and bacteriologi cal, were satisfactory. Water used by industries for cooling could be injected into the aquifer; but if its temperature were higher than that of the ground water, it would raise the temperature of the ground water (Suter and Harmeson, 1960, p. 31-35). The quantity of indus trial water having a temperature higher than that of ground water would be too small, however, to make an undesirable temperature change in Lea County ground water.
Sewage effluent might be used for recharging the aquifer Experi mental injection of raw sewage by the University of California Sani tary Engineering Research Project showed that bacteria traveled 100 feet in 33 hours but no farther thereafter ([California] State Water Pollution Control Board, 1954, p. 165). Treated and purified effluents from sewage-disposal plants in northern Lea County would be better than raw sewage for recharging; however, chlorination probably would be necessary to meet State Health Department requirements. Fre quent checks should be made to guard against pollution if sewage is used in recharging the aquifer.
RECHARGE STUDIES, NORTHERN LEA COUNTY, N. MEX. F39
The sewage-disposal plant serving the city of Hobbs discharges 2 to 4 mgd (million gallons per day) and the plant at Lovington 0.4 to 0.6 mgd. The effluent from these plants is appropriated for year- round agricultural use.
Only small quantities of waste water from industries are available for recharge in northern Lea County. Two electric-power-generation plants dispose of several thousand gallons per day of boiler-feed water into surface pits. Other sources of waste water of satisfactory purity are not known at present.
Importation of water from areas outside the High Plains ccnld be considered either for direct use or for artificial recharge facilities- The Canadian River and the Pecos River and their tributaries &,re the nearest stream systems. All the water in the Pecos River is fully appropriated.
The aquifer in local areas where the water level has declined more than normal for the basin can be replenished with water obtained else where within the ground-water basin. Such redistribution probably would be feasible only under the most urgent economic need, such as the threatened total depletion of a municipal-well field. Some of the water brought from distant areas could be used immediately, and any excess could be injected into the depleted part of the aquifer for later use. This process would utilize underground rather than surface storage. Experimental artificial recharging of a city-well field near Amarillo, Tex., showed that during the winter sufficient water could be injected from a more distant well field to provide for peak demands during the summer and that approximately 80 percent of the water injected was recovered (Moulder and Frazor, 1957, p. 1).
POTENTIAL RECHARGE IN THE PHYSIOGRAPHIC ZONiTS
ZONE 1
Zone 1, the western physiographic zone, contains about 975 square miles or about 44 percent of northern Lea County. About 1,900 depressions of various sizes, including most of the larger, better formed depressions, are in this zone. Drainage is toward the depres sions. After a heavy rainfall, such as that in July 1960, most of the depressions contain water (frontispiece). When pond levels ar°, high, water loss by natural infiltration through the more permeable mate rials on the slopes of the depressions is rapid, and the ratio of infiltra tion rate to evaporation loss is high. After the pond surfs.ce has fallen to a level where the only wetted areas are the less perneable bottoms or floors of the depressions, the infiltration rate decreases,
F40 CONTRIBUTIONS TO THE HYDROLOGY OF THE UNITED STATES
and more is lost through evapotranspiration than through infiltration. This level generally is reached when about 1 foot of wF.ter is left, and the total amount of water remaining in all depressions below the 1-foot level in zone 1 would approximate 24,000 acre-ft. Most of this water could be drained to the ground-water reservoir by small inex pensive recharge pits or recharge wells with filtration units in the bottoms of the depressions in zone 1.
The water table in zone 1 slopes southeast toward heavily pumped areas in zones 3 and 4. Water recharged to the ground-water reservoir in zone 1, if not used in that zone, would move southeastward and would eventually be available to wells in zones 3 and 4.
If an average aquifer permeability of 325 gpd per f* per ft, a hydraulic gradient of 15 feet per mile (0.0028 ft per ft), anc1 a porosity of 40 percent are assumed in zone 1, ground-water velocity would be about 110 feet per year. Based upon a transmissibility of 100,000 gpd per ft, an average saturated thickness of 100 feet, the same gradient, and the same porosity, the ground-water velocity may be as high as 340 feet per year. The true velocity probably lies some where between these two estimates.
Injection of water will increase hydraulic gradients away from the point of injection and thus increase flow velocities. Water already in the aquifer will be affected by the injected water and, although water injected in zone 1 may take several years to reach more heavily pumped areas in zones 3 and 4, its hydraulic effects will be observed much sooner.
Ground water is pumped in zone 1 primarily for industrial or com mercial use, but the demand is not as large as in the areis pumped for irrigation. Additional withdrawals are generally for stock and domestic use.
ZONE 2
Zone 2 contains 409 square miles, about 19 percent of northern Lea County. Depressions similar to those in zone 1 predominate in the western part of zone 2. Use of these depressions for recharging would be the same as that suggested for zone 1.
In the central and eastern parts of zone 2, broad elongated swales trending southeastward are conspicuous drainage features. After precipitation has satisfied soil-moisture requirements, runoff flows in these channels. Artificial recharging would conserve part of this water which might otherwise be lost by evapotranspiration. Small dams and diversion structures could be built for diversion, storage, or temporary detention of floodflows. Pits or wells coulo1 be placed at or upstream from the dams for artificial recharge. Floodflows
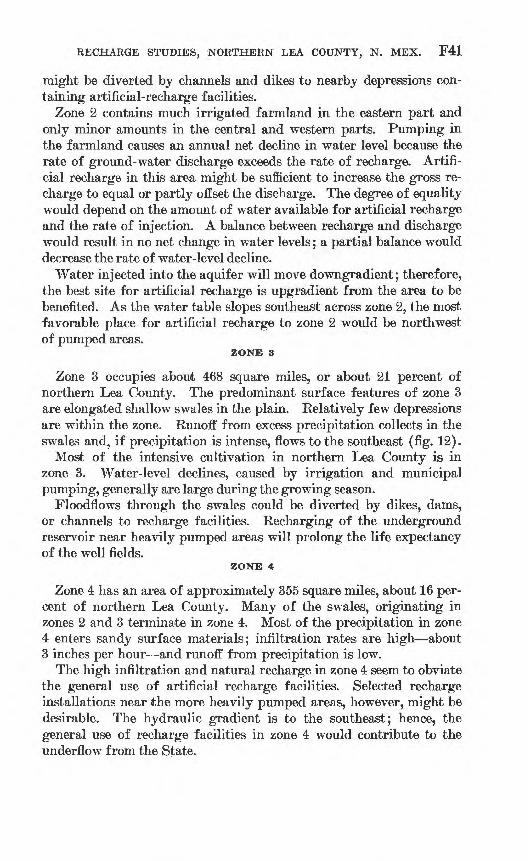
RECHARGE STUDIES, NORTHERN LEA COUNTY, N. MEX. F41
might be diverted by channels and dikes to nearby depressions con taining artificial-recharge facilities.
Zone 2 contains much irrigated farmland in the eastern part and only minor amounts in the central and western parts. Pumping in the farmland causes an annual net decline in water level because the rate of ground-water discharge exceeds the rate of recharge. Artifi cial recharge in this area might be sufficient to increase the gross re charge to equal or partly offset the discharge. The degree of equality would depend on the amount of water available for artificial recharge and the rate of injection. A balance between recharge and discharge would result in no net change in water levels; a partial balance would decrease the rate of water-level decline.
Water injected into the aquifer will move downgradient; therefore, the best site for artificial recharge is upgradient from the area to be benefited. As the water table slopes southeast across zone 2, the most favorable place for artificial recharge to zone 2 would be northwest of pumped areas.
ZONE 3
Zone 3 occupies about 468 square miles, or about 21 percent of northern Lea County. The predominant surface features of zone 3 are elongated shallow swales in the plain. Relatively few depressions are within the zone. Runoff from excess precipitation collects in the swales and, if precipitation is intense, flows to the southeast (fig. 12).
Most of the intensive cultivation in northern Lea County is in zone 3. Water-level declines, caused by irrigation and municipal pumping, generally are large during the growing season.
Floodflows through the swales could be diverted by dikes, dams, or channels to recharge facilities. Recharging of the underground reservoir near heavily pumped areas will prolong the life expectancy of the well fields.
ZONE 4
Zone 4 has an area of approximately 355 square miles, about 16 per cent of northern Lea County. Many of the swales, originating in zones 2 and 3 terminate in zone 4. Most of the precipitation in zone 4 enters sandy surface materials; infiltration rates are high about 3 inches per hour and runoff from precipitation is low.
The high infiltration and natural recharge in zone 4 seem to obviate the general use of artificial recharge facilities. Selected recharge installations near the more heavily pumped areas, however, might be desirable. The hydraulic gradient is to the southeast; hence, the general use of recharge facilities in zone 4 would contribute to the underflow from the State.
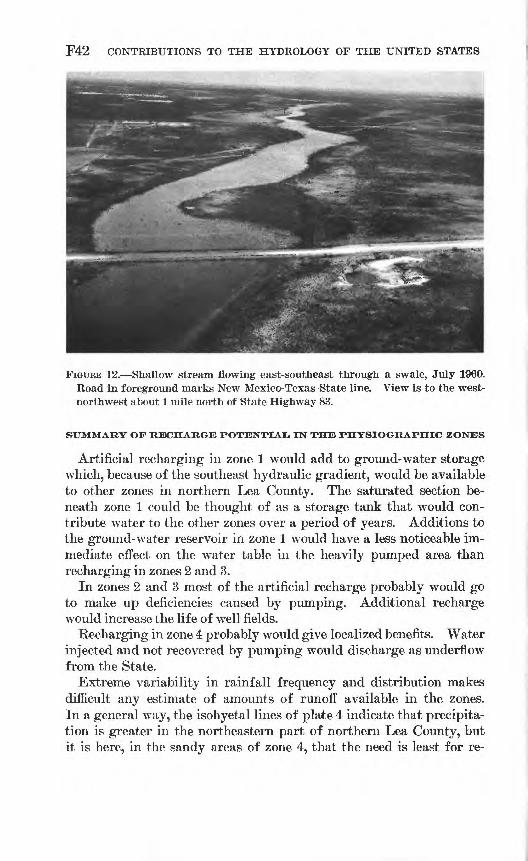
F42 CONTRIBUTIONS TO THE HYDROLOGY OF THE UNITED STATES
FIGURE 12. Shallow stream flowing east-southeast through a swale, July 1960. Road in foreground marks New Mexico-Texas State line. View is to the west- northwest about 1 mile north of State Highway 83.
SUMMARY OF RECHARGE POTENTIAL IN THE PHYSIOGRAPHIC ZONES
Artificial recharging in zone 1 would add to ground-water storage which, because of the southeast hydraulic gradient, would be available to other zones in northern Lea County. The saturated section be neath zone 1 could be thought of as a storage tank that would con tribute water to the other zones over a period of years. Additions to the ground-water reservoir in zone 1 would have a less noticeable im mediate effect on the water table in the heavily pumped area than recharging in zones 2 and 3.
In zones 2 and 3 most of the artificial recharge probably would go to make up deficiencies caused by pumping. Additional recharge would increase the life of well fields.
Recharging in zone 4 probably would give localized benefits. Water injected and not recovered by pumping would discharge as underflow from the State.
Extreme variability in rainfall frequency and distribution makes difficult any estimate of amounts of runoff available in the zones. In a general way, the isohyetal lines of plate 4 indicate that precipita tion is greater in the northeastern part of northern Lea County, but it is here, in the sandy areas of zone 4, that the need is least for re-

RECHARGE STUDIES, NORTHERN LEA COUNTY, N. MEX. F43
charge facilities. Plate 4 shows that rainfall is progressively less toward Mescalero Ridge. Recharge facilities should probably be placed throughout the northwestern and central parts of northern Lea County. Facilities along the south boundary of the study area would probably be of little benefit to the High Plains except in the vicinity of Hobbs.
ARTIFICIAL RECHARGE
Artificial-recharge facilities should be ready for recharge operations before the season of heavy rainfall and should be capable of storing large quantities of water and injecting them in a short time to mini mize evaporation losses. In addition, these installations should be self-contained or self-functioning and should be inexpensive tc build and maintain*
ARTIFICIAL RECHARGE METHODS
Artificial recharge of the aquifer in the Ogallala Formation can be accomplished by two methods by injecting water into the aquifer through wells and by spreading water on permeable areas of th°- land surface where it will percolate downward to the aquifer.
RECHARGE THROUGH WBliLiS
Water can be put, into a recharge well either under pressure or by gravity flow. Pressure may be necessary where the depth to water is too shallow for the buildup of a column of water of sufficient height in the well to force water into the aquifer at a reasonable rate. The depth to the water table is great enough in Lea County to insure that gravity feed of water into the well will be satisfactory.
Water for recharge through wells generally needs some treatment to reduce suspended-sediment load, air content, temperature, algae, and bacteria. Solid particles carried in suspension, algal and bac terial growths, and entrained air in the recharge water may eventually clog the pore spaces in the aquifer around the well and greatly reduce or stop the recharging activity. Filtration and chlorination facilities as well as means of keeping air bubbles from being entrained in the recharge water must be provided.
There are various means of removing sediment from the recharge water. Commercial flocculants can be used. Filtration through rapid-sand filters, cotton-gin trash, pea gravel, or other filter material will reduce the suspended-sediment load.
Clogged pore spaces in the aquifer around the recharge well can, under certain conditions, be reopened by pumping the well if the well is finished in the aquifer. Rehabilitation of the well by pumpirg will
F44 CONTRIBUTIONS TO THE HYDROLOGY OF THE UNITED STATES
be expensive if the pump must be installed in the well for each pump ing period. Not all the solids drained into a well can be pumped out again; therefore, the recharge efficiency of a well may decrease in time.
The advantage of being able to pump the well is a gooi reason for completing the well in the aquifer rather than in permeable beds in the zone of aeration. Naturally, a recharge well completed in the aquifer must be deeper and consequently is more expensive to con struct than a shallower well in the zone of aeration. A recharge well finished in the aquifer in the High Plains would be preferred, 85 the difference in cost would be small there, where the water table is at a shallow depth.
Air bubbles trapped in the recharge water can plug the aquifer around the well as effectively as silt and clay. Minute air bubbles caught and held in the pore spaces of the aquifer create an airlock. Air bubbles enter the water if the water falls into the well through a column of air. The recharging water could be put into the well without entraining air by extending the lower end of an inductor pipe below the water level in the well and using a pipe large enough to accommodate the designed rate of injection without an airspace in the pipe. Price (1961, p. A28-A29) suggests deaeration of the water and use of a foot valve on the bottom of the inductor pipe to help overcome the air-lock hazard.
Artificial recharge through wells may change the ten: r>erature of the water contained in the aquifer (Brashears, 1946, p. 50^; Suter and Harmeson, 1960, p. 31-35). Injection of water during the summer when surface-water temperatures are higher than ground-water tem peratures will raise water temperatures in the vicinity of the recharge well. Conversely, water at a lower temperature injected during the winter will lower water temperatures. Although at first this effect is local, over several years the ground-water temperature will change under a wide area, particularly down the hydraulic gradient from the injection site (Suter and Harmeson, p. 35).
Rises in ground-water temperatures from injection of v^ater can be minimized, even though the most likely times for runoff coincide with the hottest months of the year June, July, and August. During these months, precipitation should be injected into the aquifer as soon as it collects at the recharging points to take advantage of the lower temperature of the water immediately after rainfall. Injection of water will probably not raise water temperatures much in northern Lea County.
Algal and bacterial growth may be present in any well (Cotey, 1959, p. 1-3). Although there have been no reports of bacterial or algal

RECHARGE STUDIES, NORTHERN LEA COUNTY, N. MEX. F45
growth in wells in Lea County, this possibility must not be overlooked. Water injected through a well might carry bacteria and algae whose growth could lead to the eventual clogging of the aquifer near the well. Proper chlorination and periodic cleaning of the well will reduce the likelihood of algal or bacterial plugging.
Chlorination of the recharge water probably will be necessary to gain approval of the State Public Health Department. Periodic chemical and bacteriological analyses of water from the aquifer near the recharge well should be made to insure that artificial recharge is not causing pollution.
EXPERIMENTS IN RECHARGING THE AQUIFER THROUGH WFTJUS
Three operative recharge wells with filters are in the bottoms of depressions east of Lovington, N. Mex., in sees. 5 and 6, T. 16 S., R. 37 E. (fig. 13). A cross-sectional view of a filter and recharge veil is shown in figure 14. Flow into the well is by gravity. Pumpr were not provided for cleaning the wells, and provision was not made for automatic chlorination of recharge water.
In October 1960, water was injected by gravity flow into the aquifer through recharge well 2. The initial metered flow ranged f ro.Ti 600 to 750 gpm (gallons per minute). Within 2 minutes the water level rose nearly 0.6 foot in an observation well 196 feet southeast of the in jection well (fig. 15). As injection continued at lessened rates, the water level in the observation well reflected these changes but continued to rise. When the flow of water into the injection well was stepped, the water level in the observation well declined within a few hours to a level about 0.2 foot above that observed before recharging was started. Because several days were required for the water level in the observation well to decline to that observed before injection began, the buildup and gradual dissipation of a mound of water arourd the recharge well was indicated.
The operation of the gravel-packed filters was not satisfactory, as the gravel became clogged with fine materials, and the slots en the outside of the filter were clogged by shrimp and tadpoles. It was necessary to scrape the slots and to hammer on the filter to loosen accumulated sand, silt, and clay in the filter pack. These operations increased the flow temporarily but allowed fine materials to enter the well. Flow through the filters after a period of several hours was very small, and the recharge well had to be shut down overnight so that the accumulated organisms could be scavenged from the slots. A finer screen than the 14-inch mesh that was used might have prevented clogging of the slots.

F46 CONTRIBUTIONS TO THE HYDROLOGY OF THE UNITED STATES
ZO1-
Q_ XUJ
^-i T>
2 vi o
oS"«
£o>hoin OS
J30O>tf
^
£
3
4)
£
* 1 O3
£
1OS >j OSE
OS
So 1
14-1o>JOS oc3oM
o 'SCO
a a> ao +j
aSa>
c
1
aSg*r^CO
H
CO
s<
ssion
aQ
(75 CM CM tO M
tf tf1 1

RE
CH
AR
GE
W
ELL
5'
Ca
rbo
run
du
m
filte
r (o
ptio
nal)
Rec
harg
e w
ell
FIG
URE
14.
Fil
ter
and
rech
arge
wel
l in
L
ea
Cou
nty
rech
arge
pro
ject
.
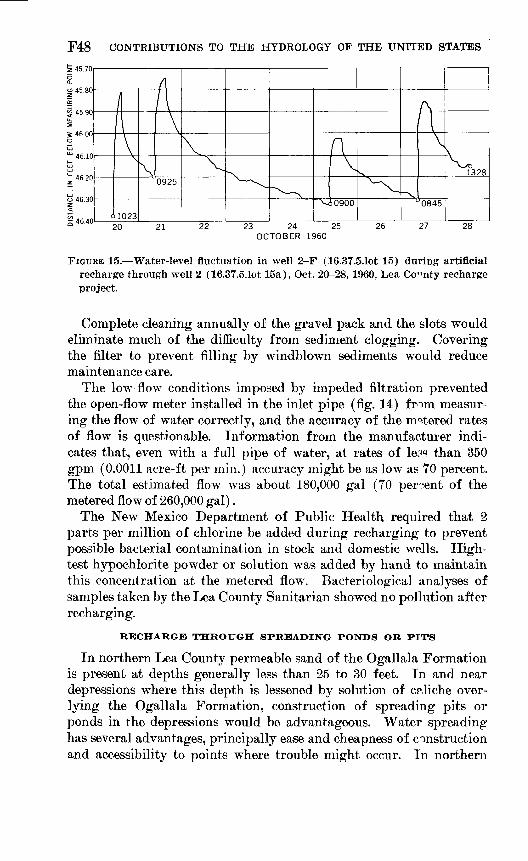
F48 CONTRIBUTIONS TO THE HYDROLOGY OF THE UNITED STATES
45.80
3 4600
1328
o 46.30
0925
VA0900 '0845
6102320 21 22 23 24 25
OCTOBER 196026 27 28
FIGURE 15. Water-level fluctuation in well 2-F (16.37.5.1ot 15) during artificial recharge through well 2 (16.37.5.1ot 15a), Oct. 20-28, 1960, Lea County recharge project.
Complete cleaning annually of the gravel pack and the slots would eliminate much of the difficulty from sediment clogging. Covering the filter to prevent filling by windblown sediments would reduce maintenance care.
The low-flow conditions imposed by impeded nitration prevented the open-flow meter installed in the inlet pipe (fig. 14) from measur ing the flow of water correctly, and the accuracy of the metered rates of flow is questionable. Information from the manufacturer indi cates that, even with a full pipe of water, at rates of ler>s than 350 gpm (0.0011 acre-ft per min.) accuracy might be as low as 70 percent. The total estimated flow was about 180,000 gal (TO percent of the metered flow of 260,000 gal).
The New Mexico Department of Public Health required that 2 parts per million of chlorine be added during recharging to prevent possible bacterial contamination in stock and domestic wells. High- test hypochlorite powder or solution was added by hand to maintain this concentration at the metered flow. Bacteriological analyses of samples taken by the Lea County Sanitarian showed no pollution after recharging.
RECHARGES THROUGH SPREADING POND'S OR PITS
In northern Lea County permeable sand of the Ogallala Formation is present at depths generally less than 25 to 30 feet. In and near depressions where this depth is lessened by solution of caliche over lying the Ogallala Formation, construction of spreading pits or ponds in the depressions would be advantageous. Water spreading has several advantages, principally ease and cheapness of construction and accessibility to points where trouble might occur. In northern
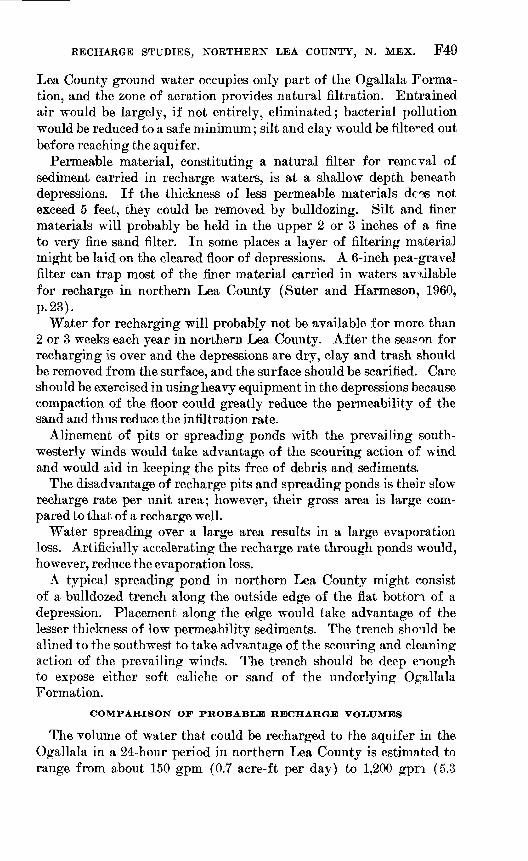
RECHARGE STUDIES, NORTHERN LEA COUNTY, N. MEX. F49
Lea County ground water occupies only part of the Ogallala Forma tion, and the zone of aeration provides natural filtration. Entrained air would be largely, if not entirely, eliminated; bacterial pollution would be reduced to a safe minimum; silt and clay would be filtered out before reaching the aquifer.
Permeable material, constituting a natural filter for removal of sediment carried in recharge waters, is at a shallow depth beneath depressions. If the thickness of less permeable materials dc'^s not exceed 5 feet, they could be removed by bulldozing. Silt and finer materials will probably be held in the upper 2 or 3 inches of a fine to very fine sand filter. In some places a layer of filtering material might be laid on the cleared floor of depressions. A 6-inch pea-gravel filter can trap most of the finer material carried in waters available for recharge in northern Lea County (Suter and Harmeson, 1960, p. 23).
Water for recharging will probably not be available for more than 2 or 3 weeks each year in northern Lea County. After the season for recharging is over and the depressions are dry, clay and trash should be removed from the surface, and the surface should be scarified. Care should be exercised in using heavy equipment in the depressions because compaction of the floor could greatly reduce the permeability of the sand and thus reduce the infiltration rate.
Alinement of pits or spreading ponds with the prevailing south westerly winds would take advantage of the scouring action of wind and would aid in keeping the pits free of debris and sediments,
The disadvantage of recharge pits and spreading ponds is their slow recharge rate per unit area; however, their gross area is large com pared to that of a recharge well.
Water spreading over a large area results in a large evaporation loss. Artificially accelerating the recharge rate through ponds would, however, reduce the evaporation loss.
A typical spreading pond in northern Lea County might consist of a bulldozed trench along the outside edge of the flat botton of a depression. Placement along the edge would take advantage of the lesser thickness of low permeability sediments. The trench should be alined to the southwest to take advantage of the scouring and cleaning action of the prevailing winds. The trench should be deep enough to expose either soft caliche or sand of the underlying Ogallala Formation.
COMPARISON OF PROBABLE RECHARGE VOLUMES
The volume of water that could be recharged to the aquifer in the Ogallala in a 24-hour period in northern Lea County is estimated to range from about 150 gpm (0.7 acre-ft per day) to 1,200 gpri (5.3
F50 CONTRIBUTIONS TO THE HYDROLOGY OF THE UNITED STATES
acre-ft per day) when recharge is through a well and to range from 5 inches per hour (10 acre-ft per day) to 20 inches per hour (40 acre- ft per day) for infiltration of water through a 1-acre spreading pond.
SUMMARY AND CONCLUSIONS
Physical boundaries isolate the southern High Plains of Lea, Chaves, and Eddy Counties, N. Mex., from outside sources of natural recharge. The present rate of ground-water discharge by pumping and under flow from the area exceeds the natural recharge rate, and the ground- water reserves of the area are being reduced.
The average annual natural recharge in the period 194f-60 is com puted to be about 30 percent of the excess precipitation, or r.bout 95,000 acre-ft. Approximately one-sixth of the water pumped for irrigation is returned to the aquifer by seepage; therefore, the average annual re charge from this source in the period 1949-60 probably was about 23,000 acre-ft. Thus the average annual recharge amounts to about 118,000 acre-ft.
The average annual discharge from the aquifer in the period 1949- 60 probably amounted to 151,000 acre-ft as gross pumpag°s and about 36,000 acre-ft as underflow, or a total of about 187,000 acre-ft.
The average annual difference between recharge and discharge amounted to about 69,000 acre-ft. This annual deficit is reflected .in a general net decline of about 10 feet in the High Plains of northern Lea County and local net declines of as much as 30 feet in the period 1950-60.
At least 50,000 acre-ft of water a year could be added to the aquifer by artificial recharge. In the period 1949-60 an average of 107.000 acre-ft a year entered depressions within the 1,400,000-acre study area. Observations of natural recharge indicated that 20 to 80 percent of the water reaching the depressions probably infiltrated to the aquifer; the remainder was discharged by evapotranspiration, principally by evap oration from pond surfaces.
Artificial recharging in northern Lea County could be accomplished either by injection of water through wells or by water spreading in pits or ponds. Water used for injection through wells must be low in suspended sediment, should not entrain air while being injected because it might air lock the aquifer near the well, and should be free from chemical or bacterial contamination. Water spreading, which hastens the process of natural recharge, would require water of mod erate to low turbidity to prevent sealing of the floor of the pits and ponds too rapidly. Filtration through the unsaturated section above the aquifer will probably remove most bacterial contamiration, but it- will not remove chemical contaminants.
RECHARGE STUDIES, NORTHERN LEA COUNTY, N. MEX. F51
Rates of recharge through a well in northern Lea County may range from less than 1 to more than 5 acre-ft per day; rates of recharge per acre of pits or spreadinng ponds may range from 10 to 40 acre-ft per day. Recharging through pits or spreading ponds probably would have a lower cost of installation and maintenance per unit of water recharged than recharging through wells. Recharging through pits or ponds has been successful for long periods, whereas recharging through wells has been plagued by many operational difficulties.
SELECTED REFERENCES
Ash, S. ft., 1963, Ground-water conditions in northern Lea County, New Mexico: U.S. Geol. Survey Hydrol. Inv. Atlas HA-62.
Barnes, J. R., and others, 1949, Geology and ground water in the irrigated region of the Southern High Plains in Texas: Texas Board Water Engineers Prog. Kept. 7, 51 p., 7 pis., 32 figs., 20 tables.
Berkstresser, C. F., Jr., 1959, Tatum-Lovington-Hobbs area, Lea County, in Reeder, H. O., and others, Annual water-level measurements in observation wells, 1951-55. and atlas of maps showing changes in water level for various periods from beginning of record through 1954, New Mexico: New Mexico State Engineer Tech. Kept. 13, p. 91-115, tables 6-7, figs. 46-55.
Brashears, M. L., Jr., 1946, Artificial recharge of ground water on Long Island, New York: Econ. Geology, v. 41, no. 5, p. 503-516.
Bretz, J. H., and Horberg, C. L., 1949, The Ogallala Formation west of the Llano Estacado [New Mexico] : Jour. Geology, 1. 57, no. 5, p. 477-490.
Brown, C. N., 1956, Origin of caliche on the northeastern Llano Estacado, Texas : Jour. Geology, v. 64, no. 1, 15 p.
[California] State Water Pollution Control Board, 1954, Report on the investi gation of travel of pollution: Pub. no. 11, 218 p.
Clyma, Wayne, and Jensen, M. E., 1960, Flocculent used to remove sediments from playa lake water used for ground-water recharge: Texas Agr. Expt. Sta. Prog. Rept. 2144, 7 p.
Conover, C. S., and Akin, P. D., 1942, Progress report on the ground-water supply of northern Lea County, New Mexico: New Mexico State Engineer 14th and 15th Bienn. Rept., 1938-42, p. 285-309.
Cotey, Brad, 1959, Texas wells threatened by strange growth: Water Well Jour., v. 13, no. 7, 4 p.
Cronin, J. G.. 1961, A summary of the occurrence and development of ground water in the Southern High Plains of Texas: Texas Board Water Engineers Bull. 6107, 304 p.
C.ronin, J. G., and Wells, L. C., 1960, Geology and ground-water resources of Hale County, Texas: Texas Board Water Engineers Bull. 6010, 146 p
Dane, C. H., and Bachman, G. O., 1958, Preliminary geologic map of the south eastern part of New Mexico: U.S. Geol. Survey Misc. Geol. Inv. Map 1-256.
Fenneman, N. M., 1931, Physiography of Western United States: New York, McGraw-Hill Book Co., 534 p.
Frye, J. C., and Leonard. A. B., 1957, Studies of Cenozoic geology along the east ern margin of the Texas High Plains, Armstrong to Howard Counties: Texas Univer., Bur. Econ. Geology, Rept. Inv. no. 32, 62 p.
F52 CONTRIBUTIONS TO THE HYDROLOGY OF THE UNITED STATES
Hale, W. E., and Nicholson, Alexander, Jr., 1953, Three maps of a portion of Lea County, New Mexico: (1) Contour map of the bottom of the Ogallala Formation, (2) Contour map showing elevation of the water table, and (3) Map showing the thickness of the zone of saturation ir the Ogallala Formation: U.S. Geol. Survey open-file report, 3 figs.
Horberg, Leland, 1949, Geomorphic history of the Carlsbad Caverns area, New Mexico: Jour. Geology, v. 57, no. 5, p. 464 476.
Judson, S. S., Jr., 1950, Depressions of the northern portion of the southern High Plains of eastern New Mexico: Geol. Soc. America Bull., v. 61, no. 3, p. 253-274.
Linsley, R. K., Jr., Kohler, M. A., and Paulhus, J. L. H., 1949, Applied hydrology: New York, McGraw-Hill Book Co., Inc., 689 p.
Moulder, E. A., and Frazor, D. R., 1957, Artificial-recharge experiments at McDonald well field, Amarillo, Texas: Texas Board Water Engineers Bull. 5701, 34 p.
Nicholson, Alexander, Jr., and Clebsch, Alfred, Jr., 1961, Geolog^ and ground- water conditions in southern Lea County, New Mexico: New Mexico State Bur. Mines and Mineral Resources Ground-Water Rept. 6, 123 p., 2 pis., 30 figs.
Nye, S. S., 1930, Shallow ground-water supplies in northern Lea County, New Mexico: New Mexico State Engineer Bull. 2, 26 p.
1932, Progress report on the ground-water supply of northern Lea County,New Mexico: New Mexico State Engineer 10th Bienn. Fept., 1930-32,p. 229-251,
Price, C. E., 1961, Artificial recharge through a well tapping btsalt aquifers,Walla Walla area, Washington: U.S. Geol. Survey Water-Supply Paper1594-A, 33 p., 4 figs.
Robinson, T. W., 1958, Phreatophytes: U.S. Geol. Survey Water-Supply Paper1423, 84 p., 32 figs.
Suter, Max, and Harmeson, R. H., 1960, Artificial ground-water recharge atPeoria, Illinois: Illinois State Water Survey Bull. 48, 48 p., 42 figs.
Theis, C. V., 1934, Progress report on the ground-water supply of Lea County,New Mexico: New Mexico State Engineer llth Bienn. Pept., 1932-34,p. 127-153.
1937, Amount of ground-water recharge in the southern High Plains: Am. Geophys. Union Trans., v. 18, p. 564-568, 3 figs.
1939, Progress report on the ground-water supply of Ler County, NewMexico: New Mexico State Engineer 12th and 13th Bienn. Fepts., 1934-38,p. 121-134.
Thornthwaite, C. W., 1941, Atlas of climatic types in the United States, 1900-1936: U.S. Dept. Agriculture Misc. Pub. 421, 7 p., 96 pis.
U.S. Weather Bureau, 1949-61, Climatological data, New Mexico: v. 53-65, nos.1-13.
White, W. N., Broadhurst, W. L.. and Lang, J. W., 1946, Grouni water in theHigh Plains of Texas: U.S. Geol. Survey Water-Supply Paper 889-F, p. 381-420, pis. 17-21.
o
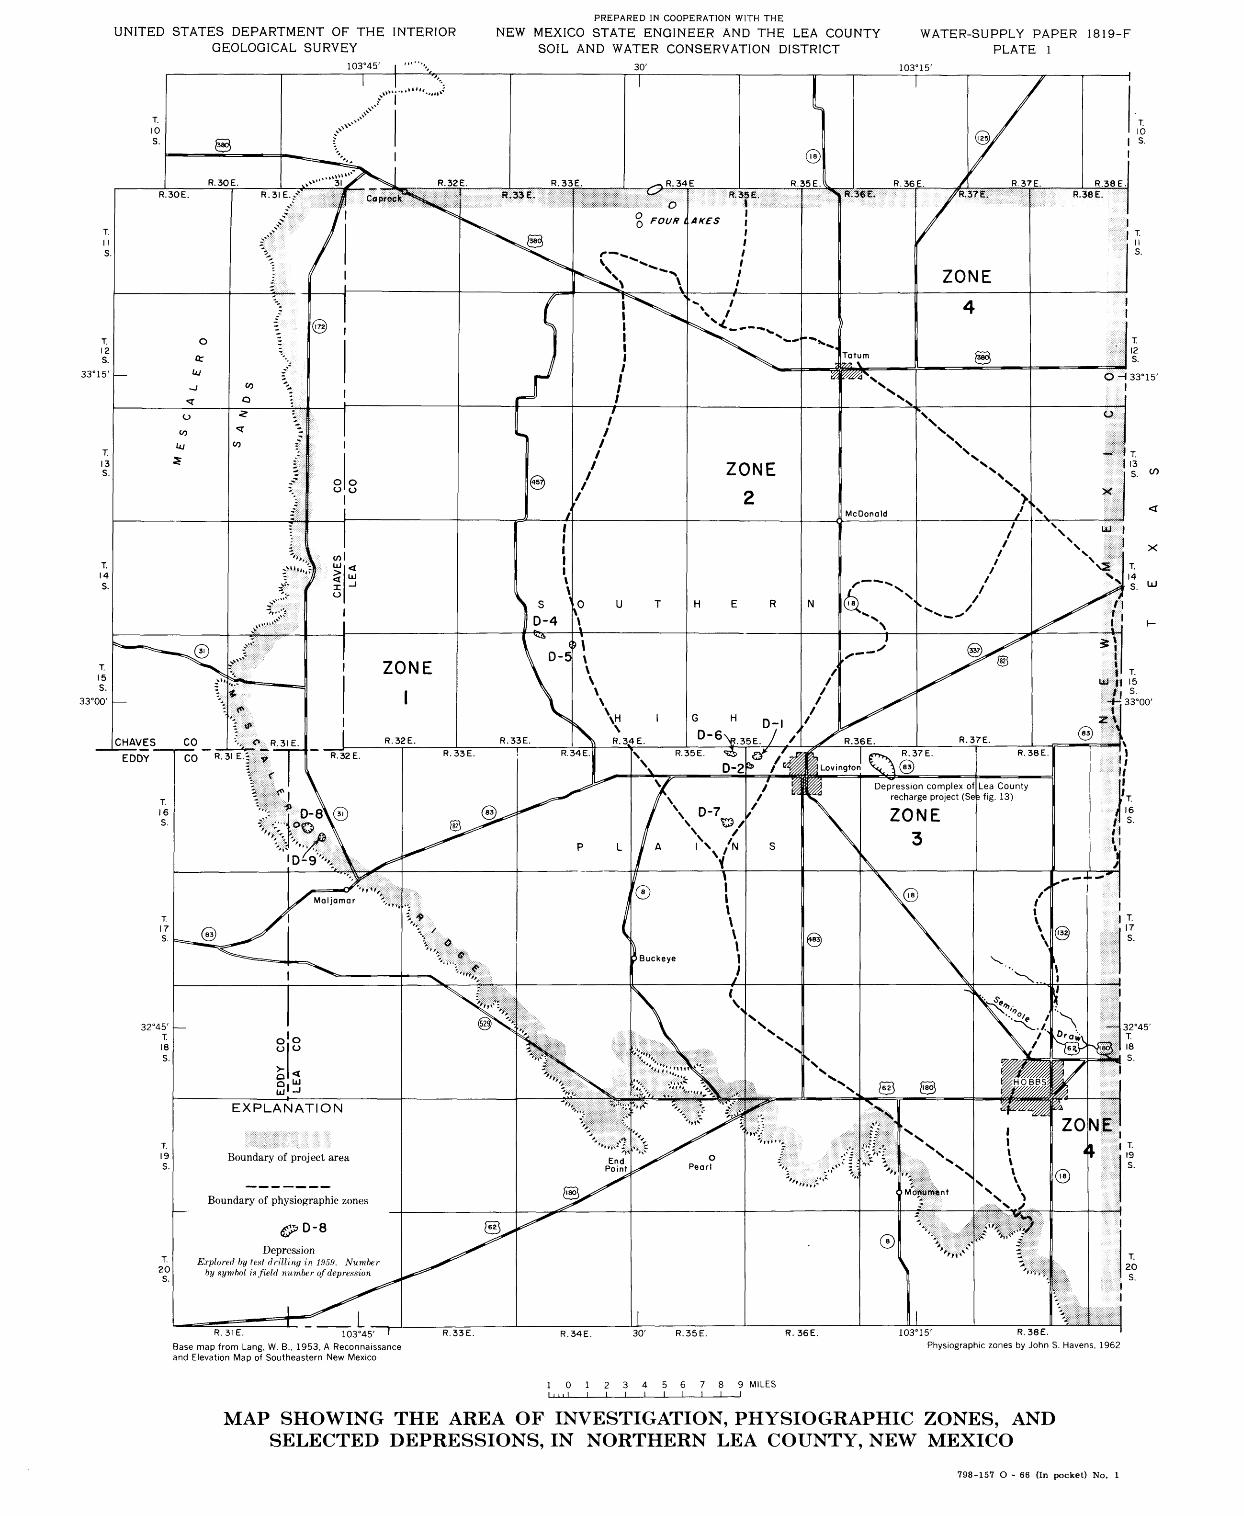
UNITED STATES DEPARTMENT OF THE INTERIOR GEOLOGICAL SURVEY
103°45'
PREPARED IN COOPERATION WITH THE
NEW MEXICO STATE ENGINEER AND THE LEA COUNTY SOIL AND WATER CONSERVATION DISTRICT
30'
WATER-SUPPLY PAPER 1819-F PLATE 1
103° 15'
33°15'
FOUR L AXES |
CHAVES CO
Depression complex ofrecharge project (Se
EXPLANATION
Boundary of project area
Boundary of physiographic zones
DepressionExplored by test drilling in 1959. Number
by symbol infield number of depression
R.3IE. 103°45'
Base map from Lang, W. B., 1953, A Reconnaissance and Elevation Map of Southeastern New Mexico
R.33E. R.34E. 30' R.35E. R. 36E. 103°15' R.38E.
Physiographic zones by John S. Havens, 1962
10123456789 MILES I ..I i I I
798-157 O - 66 (In pocket) No. 1
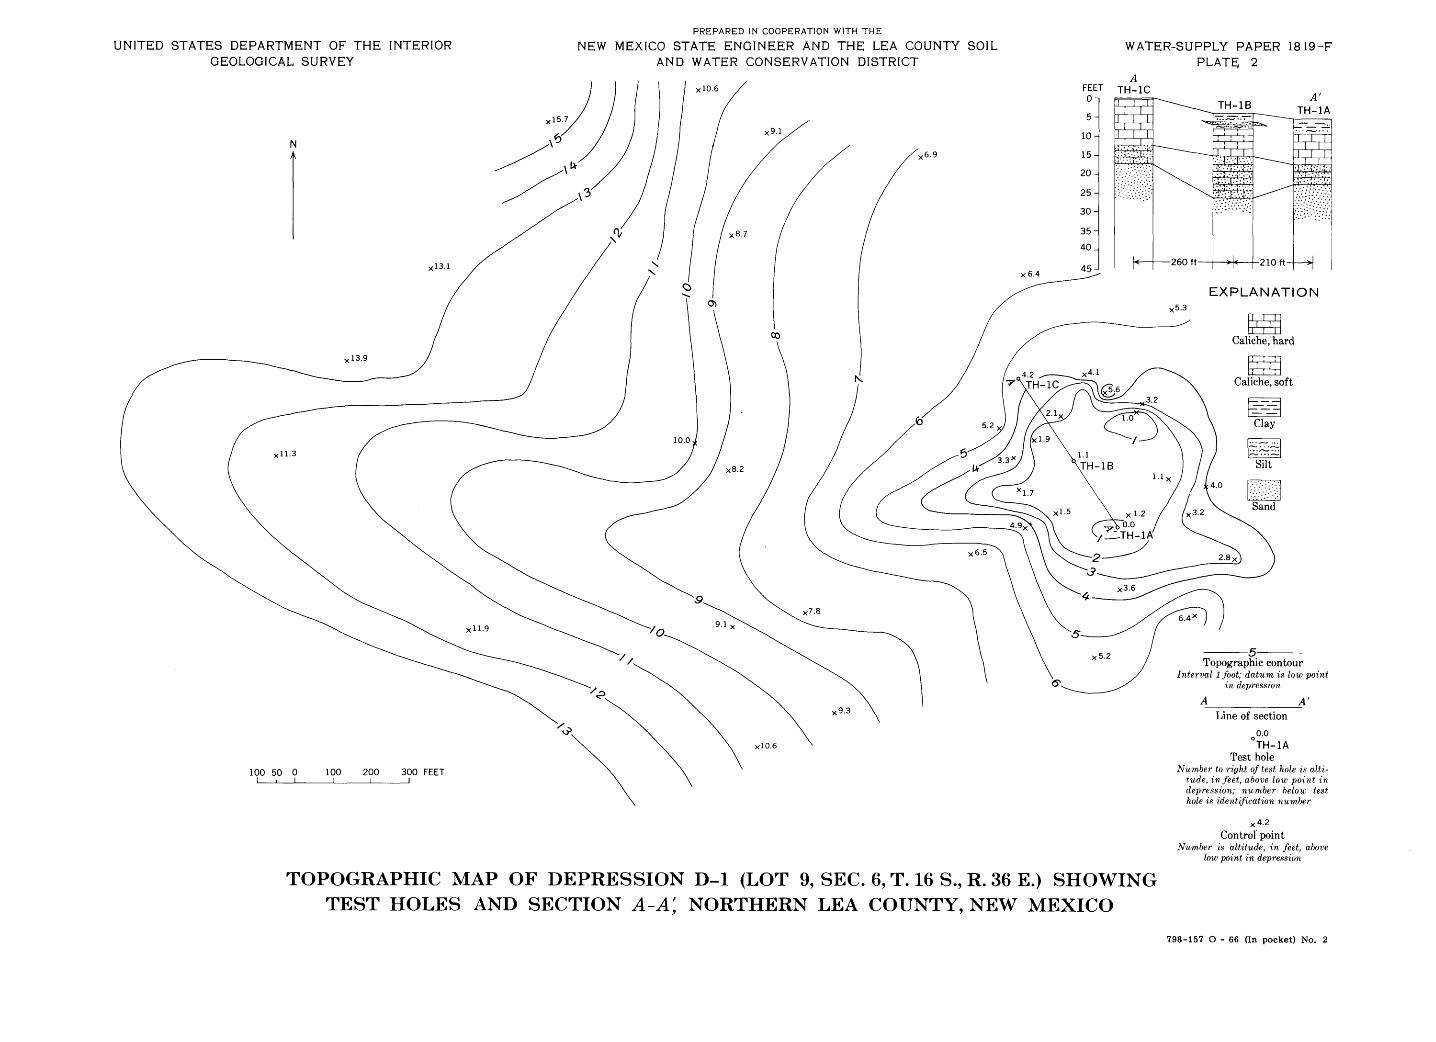
UNITED STATES DEPARTMENT OF THE INTERIOR GEOLOGICAL SURVEY
PREPARED IN COOPERATION WITH THE
NEW MEXICO STATE ENGINEER AND THE LEA COUNTY SOIL AND WATER CONSERVATION DISTRICT
WATER-SUPPLY PAPER 1819-F PLATE 2
A TH-1C
TH-1B
Topographic contourInterval 1 foot; datum is low point
in depression
A A'
Line of section
o o.o TH-1A
Test holeNumber to right of test hole is alti
tude, in feet, above low point in depression; number below test hole is identification number
x 4 - 2 Control point
Number is altitude, in feet, above low point in depression
TOPOGRAPHIC MAP OF DEPRESSION D-l (LOT 9, SEC. 6, T. 16 S., R. 36 E.) SHOWING TEST HOLES AND SECTION A-A, NORTHERN LEA COUNTY, NEW MEXICO
798-157 O - 66 (In pocket) No. 2
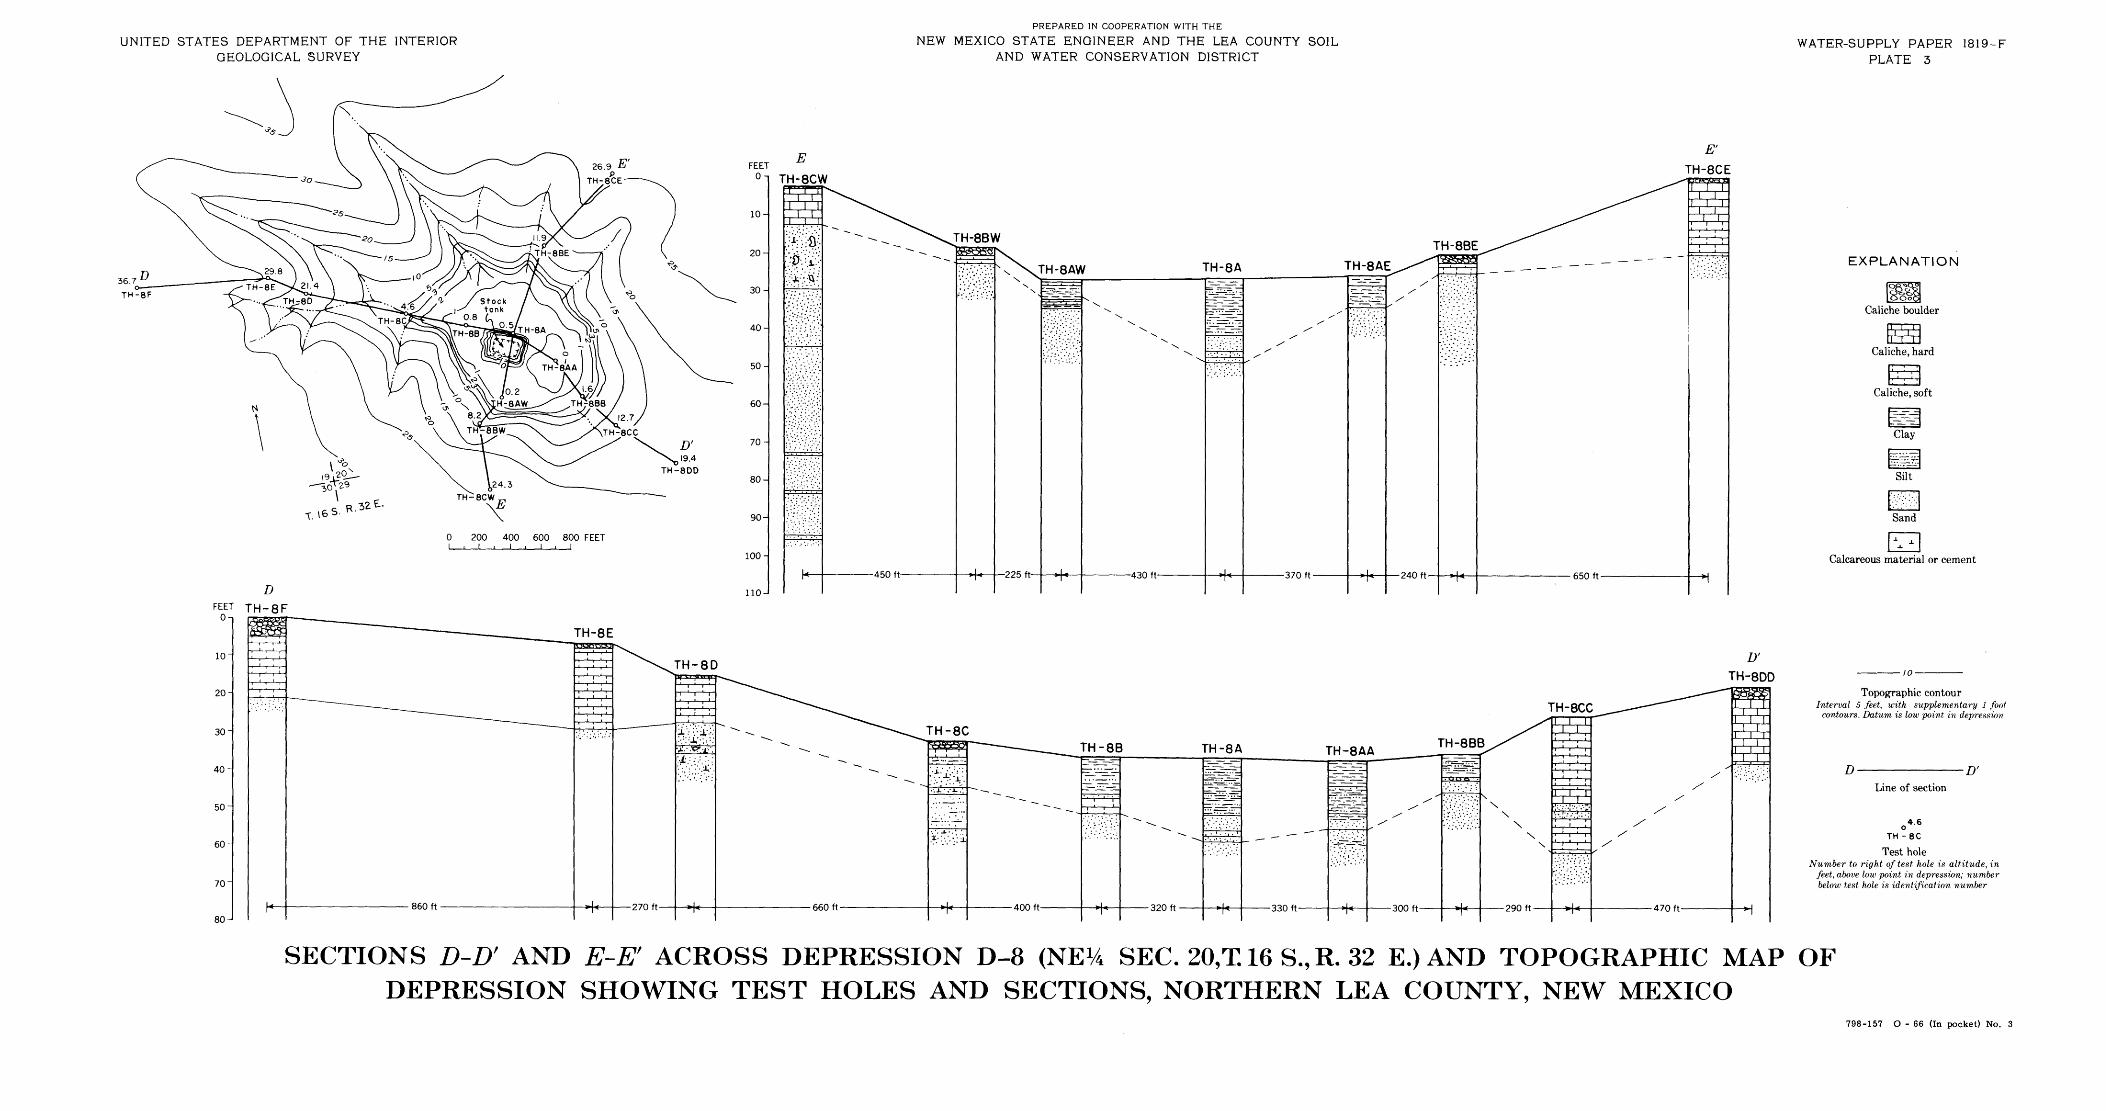
UNITED STATES DEPARTMENT OF THE INTERIOR GEOLOGICAL SURVEY
PREPARED IN COOPERATION WITH THE
NEW MEXICO STATE ENGINEER AND THE LEA COUNTY SOIL AND WATER CONSERVATION DISTRICT
T.
0 200 400 600 800 FEETill i i i i . i
FEET On
10-
20-
30-
40-
50-
60-
70-
80-
90-
100-
110 J
O-i
10
20-
30-
40-
50-
60-
70
80 J
TH-8E
TH-8CC
400ft
___ TH-8B TH-8A TH-8AA '
^-^
_T77.
: ' > ' ' "l '
1 1 _ "-V.
320ft
^=^F
1^' ^z.-i^:
TT ,
1 '-'I. 1
330 ft
f^E^
^r^i-... ..
**
300 ft
H-BBt
5^£
i.s
k -.
290ft
WATER-SUPPLY PAPER 1819-F PLATE 3
EXPLANATION
Calcareous material or cement
Topographic contourInterval 5 feet, with supplementary 1 foot
contours. Datum is low point in depression
D D'
Line of section
o 4 ' 6 TH-8C
Test holeNumber to right of test hole t's altitude, in
feet, above low point in depression; number below test hole is identification number
SECTIONS D-D' AND E-E' ACROSS DEPRESSION D-8 (NEV4 SEC. 20,T 16 S., R. 32 E.)AND TOPOGRAPHIC MAP DEPRESSION SHOWING TEST HOLES AND SECTIONS, NORTHERN LEA COUNTY, NEW MEXICO
OF
798-157 O - 66 (In pocket) No. 3
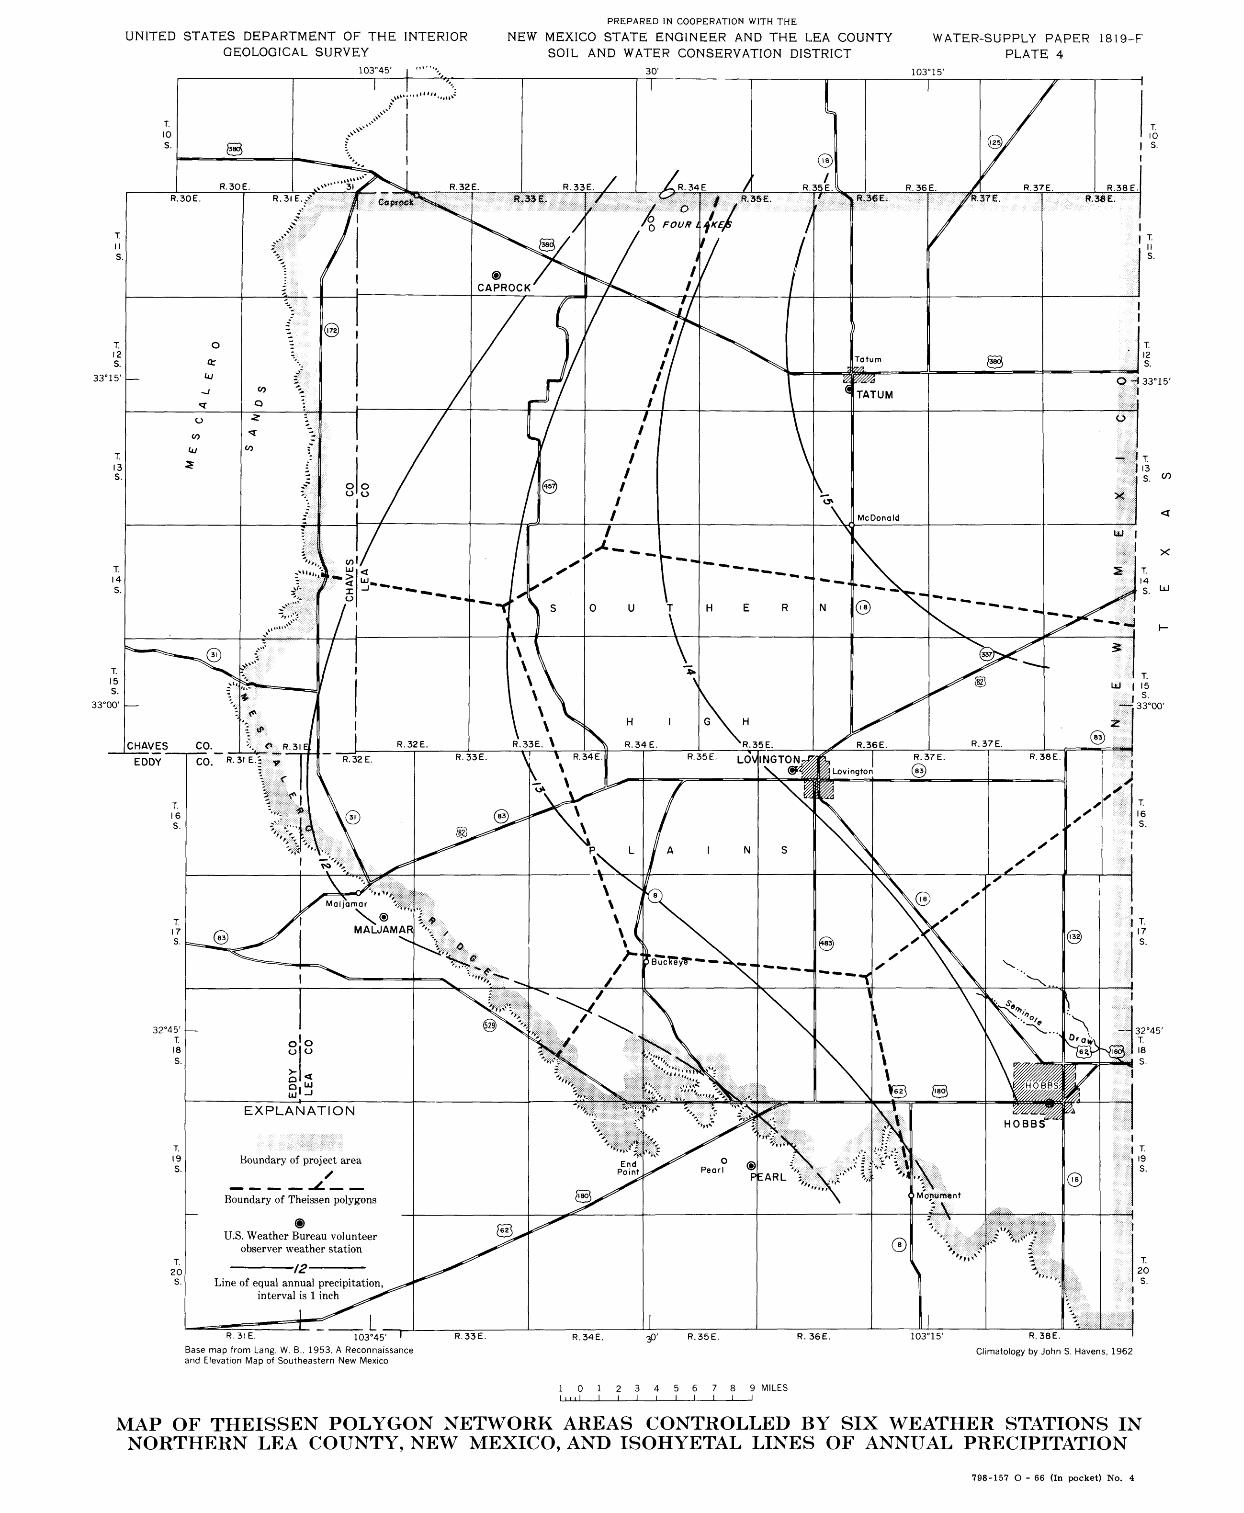
UNITED STATES DEPARTMENT OF THE INTERIOR GEOLOGICAL SURVEY
103°45'
PREPARED IN COOPERATION WITH THE
NEW MEXICO STATE ENGINEER AND THE LEA COUNTY SOIL AND WATER CONSERVATION DISTRICT
30'
WATER-SUPPLY PAPER 1819-F PLATE 4
103°15'
33°15'
33°00'
HER
CHAVES CO.R.33E. V * R.34E. R.35E. LOVllNGTON
\. "-MALJAMAR
Boundary of project area/
-£ Boundary of Theissen polygons
* " IEARL ,
U.S. Weather Bureau volunteer observer weather station
Line of equal annual precipitation,interval is 1 inch
R.3IE.
Base map from Lang, W. B., 1953, A Reconnaissance and Elevation Map of Southeastern New Mexico
3P' R.35E.
10123456789 MILES
103°15' R.38E.
Climatology by John S. Havens, 1962
MAP OF THEISSEN POLYGON NETWORK AREAS CONTROLLED BY SIX WEATHER STATIONS IN NORTHERN LEA COUNTY, NEW MEXICO, AND ISOHYETAL LINES OF ANNUAL PRECIPITATION
798-157 O - 66 (In pocket) No. 4