Embed Size (px)
Citation preview

Appendix A
Groundwater Recharge in the Southern High Plains

Groundwater Recharge in the Southern High Plains
by Robert C. Reedy Bridget R. Scanlon Bureau of Economic Geology, University of Texas at Austin Bret Bruce P.B. McMahon K.F. Dennehy U.S. Geological Survey, Denver, Colorado K. Ellett U.S. Geological Survey, Sacramento, California
January 2003

Table of Contents Page
Introduction................................................................................................................................................... 1
Review of Recharge Estimates from Previous Studies ................................................................................. 1 Recharge Estimation for Current Groundwater Availability Modeling Project ..................................... 2 Recharge Estimates Based on Groundwater Chloride Concentrations................................................... 2 Recharge Estimates Based on Tritium ................................................................................................... 4
Matric Potential Monitoring ......................................................................................................................... 7
Time Lag for Irrigation Return Flow................................................................................................................. 9
Numerical Simulations................................................................................................................................ 11
References................................................................................................................................................... 14
List of Figures Page
Figure 1. Groundwater chloride concentrations in the High Plains Aquifer in Texas .............................A-3
Figure 2. Average annual atmospheric tritium fallout for Ottawa, Ontario.............................................A-4
Figure 3. Map of borehole locations with Texas and New Mexico county lines.....................................A-5
Figure 4. Water content, porosity, and tritium activity with depth at Muleshoe NWR, Roberts Site and Maple Site ..................................................................................................................A-6
Figure 5. Monitored matric potential depth profiles measured during spring and summer of 2002 at the natural and irrigated sites....................................................................................................A-8
Figure 6. Time series of monitored matric potential with depth at natural (a) and irrigated (b, c) location ...................................................................................................................................A-10
Figure 7. Calculated times required for a piston-flow wetting front to arrive at the base of a 100-ft-thick soil profile of uniform texture .......................................................................................A-11
Figure 8. Comparison of simulated annual drainage from the bases of two irrigated sand profiles with different thicknesses. ......................................................................................................A-13
P:\9345\GAM-Rpt.1-03\PDF\AppxA_GW-Recharge_TF.doc i

List of Tables Page
Table 1. Recharge estimates from tritium distributions beneath the irrigated sites .....................A-7
Table 2. van Genuchten parameters used for irrigation return flow time lag estimates ............A-12
Table 3. Simulated drainage lag times.......................................................................................A-12
P:\9345\GAM-Rpt.1-03\PDF\AppxA_GW-Recharge_TF.doc ii

Groundwater Recharge in the Southern High Plains
Introduction
This appendix provides a brief overview of previous estimates of groundwater recharge on the Southern High Plains, and presents the results of additional field work and modeling analyses conducted in conjunction with development of the Southern Ogallala GAM model. The field work, conducted in collaboration with the U.S. Geological Survey (USGS) National Water Quality Assessment (NAWQA) program, was included as part of the GAM study to provide additional information concerning irrigation return flow.
Review of Recharge Estimates from Previous Studies
The primary sources of recharge to the Ogallala aquifer in the Southern High Plains are playas, headwater creeks, and irrigation return flow. Previous studies indicate that recharge in interplaya settings from precipitation is negligi-ble, as shown by high chloride concentrations in the unsaturated zone (Aronovici and Schneider 1972; Scanlon et al. 1997). If recharge rates were high in interplaya settings, chloride would be flushed out of the soil profile. Evidence of high recharge rates beneath playas is provided by low levels of calcium carbonate, low chloride concentrations, and deep penetration of bomb pulse tritium from nuclear testing in the 1950s and 1960s (Scanlon et al., 1997; Wood and Sanford, 1995). Recharge rates estimated from tritium concentrations in the unsaturated zone beneath individual playas range from 3 to 4.7 inches per year (in/yr) (Scanlon et al., 1997; Wood et al., 1997). Because of the spatial focusing of recharge beneath playas, it is diffi-cult to calculate the average recharge rate to the
aquifer from unsaturated zone data. Numerical modeling studies by Mullican et al. (1997) indicated that accurate representation of spatial focusing of recharge is not important for the Ogallala aquifer; similar modeling results were obtained whether recharge was focused beneath playas or was applied uniformly. Regional estimates of recharge were provided by groundwater tracers such as chloride and tritium. The average groundwater chloride concentration of 25 mg/L in the northern half of the Southern High Plains resulted in a regional recharge rate of 0.4 in/yr (Wood and Sanford, 1995). High tritium concentrations in groundwater in the southeastern part of the Ogallala aquifer in the vicinity of Lubbock, Lynn, and Dawson counties resulted in recharge estimates from 0.5 to 3.2 in/yr (mean 1.6 in/yr) (Nativ, 1988).
Irrigation-return flow may also contribute significant amounts of recharge to the aquifer. Many areas of the aquifer have been irrigated since the 1940s. Irrigation inefficiency was high during early decades, but decreased over time, particularly during the 1980s and 1990s. Luckey et al. (1986) estimated irrigation return flow to be 50% of applied irrigation water or net withdrawal in 1940 to 1960, decreasing to 37 to 46% in the 1960 to 1980 period. Field studies in Nevada in loam to clay-loam soil indicated that flood irrigation on alfalfa resulted in 20% return flow (Roark and Healy, 1998).
Recharge rates applied in previous ground-water modeling studies of the Southern High Plains are variable. Recharge rates in the Knowles et al. (1984) model ranged from 0.06 to 0.83 in/yr. These estimates were based on a study of water content monitoring at irrigated and non-irrigated sites in each county conducted by Klemt (1981). Luckey et al. (1986) applied an average recharge rate of 0.13 in/yr in the Southern High Plains during the predevelopment period. A more recent modeling study conducted by Stovall et al. (2000) applied an
P:\9345\GAM-Rpt.1-03\PDF\AppxA_GW-Recharge_TF.doc A-1

average recharge rate of 2.8 in/yr based on automated inverse modeling. In addition to irrigation return flow applied during aquifer development Luckey et al. (1986) applied an additional 2 in/yr to irrigated and dryland areas during the 1960 to 1980 period.
Recharge Estimation for Current Groundwater Availability Modeling Project
Additional studies were conducted to evaluate recharge in the Southern High Plains. The previous regional estimate of recharge based on groundwater chloride concentrations in Wood and Sanford (1995) was reexamined to evaluate any potential impact of irrigation return flow. Field studies were conducted in collaboration with the U.S. Geological Survey (USGS) National Water-Quality Assessment (NAWQA) program. The NAWQA program involved drilling and sampling of boreholes in irrigated and non-irrigated sites. Samples were collected for tritium analysis to evaluate recharge rates. Pressure monitoring devices were also installed to evaluate infiltration beneath irrigated and non-irrigated sites.
Recharge Estimates Based on Groundwater Chloride Concentrations
Recharge was previously estimated by Wood and Sanford (1995) using an average ground-water chloride concentration of 25 mg/L in the northern half of the Southern High Plains because this region is not affected by saline lakes. Areas of known contamination were excluded in the estimate. The recharge rate was calculated using the chloride mass balance approach, which equates the chloride input to the system (precipitation rate [19.1 in/yr] times chloride concentration in precipitation and dry fallout [0.58 mg/L]) to the chloride output (recharge rate times chloride concentration in groundwater [25.2 mg/L]).
0.4in/yr25.2mg/L
0.58mg/L x 19.1in/yrCl
Cl xPR
gw
p���
(1)
These data resulted in a recharge rate of 0.4 in/yr. We reevaluated this recharge estimate by
examining the chloride concentration in pre-cipitation, the precipitation rate, and the groundwater chloride concentration. Chloride concentrations in precipitation (0.13 ± 0.02 mg/L), based on data from the National Atmos-pheric Deposition (NADP) program (http://nadp.sws.uiuc.edu) from 1985 � 2000 at the Muleshoe National Wildlife Reserve (MNWR) and at a site near the Texas-Oklahoma border (OK29; 0.12 ± 0.02 mg/L), are much lower than the previous estimate of 0.5 mg/L, which was based on one year of data from Amarillo (Wood and Sanford; 1995). The differences in chloride input may be partly related to the fact that the NADP values represent wet deposition only, whereas the data from Amarillo represent wet and dry fallout. Studies by Izbicki (USGS, pers. comm., 2001) indicate that values based on wet deposition should be multiplied by a factor of ~2 to approximate wet and dry deposition. Chloride input was also estimated for the Amarillo region using pre-bomb 36Cl/Cl ratios (~0.3 mg/L). The value of 0.3 mg/L is slightly greater than 2 times the NADP value but is more appropriate than 0.58 mg/L. The average precipitation for the region, based on data from the National Climatic Data Center (http://lwf.ncdc.noaa.gov) for the period 1931 � 2001, was 17.8 in/yr.
Groundwater chloride concentrations were also reevaluated. The previous estimate of 25.2 mg/L (Wood and Sanford, 1995) did not eval-uate the impact of irrigation return flow. Groundwater chloride concentrations in irrigated and non-irrigated regions and the distribution of irrigated regions were obtained from the Texas Water Development Board (http://www.twdb.-state.tx.us) (fig. 1). High chloride concentra-tions related to saline lakes and contaminated sites were omitted from average values by excluding data in the predominantly red-colored zone shown in Figure 1 and other concentrations greater than 2 standard deviations above the mean log of the remaining values. Average chloride concentrations in irrigated (15.9 mg/L) and non-irrigated (17.3 mg/L) sites were remarkably similar to and are slightly lower than the average groundwater chloride concentration
P:\9345\GAM-Rpt.1-03\PDF\AppxA_GW-Recharge_TF.doc A-2

#
#######
###########
###
#####
# ######
###
###### ###############
#########
###### ##
###
######
######
###################
############### #####
########
###
## #########
#######
################
##############################
########
##########
############
###########################
##########
###########
##
##########
######
##### #######
####
### #
################
#######
########
############
###########
##############
##################
##############
#######
####### ######
##########
######
##################################################
#######
##############
##############
####
##################
#########################
####################
#####
######
##############
#####
###
####### #########################
##################
###
###
## #
#######
#########
#### ###
##########
####
# ##
### #
#####
####
### #
#
######
#
###
#####
###
######
# ########
#####
## ###
####
###### #### ###
#########
## #########
###
# ########
####
### ####
#####
#####
#########################
################
####
#########
##############
########## ##
###################
###
##########
#######
###################
################
###########
##
###############
#####
#################
########## #
##
####### ##########
########
####################
#################### #####
#######
#
####################################################
########################
#######################
##################
####
#
###
##
##################
##############
##########
### #######
###
#########
#####
#####
######
# ######## ###### ####
## #
############################################# ## ######
############
# ##################
###########
#########
################### ##############
######
###########################
############ ######################
###########
#########
###
######## ##############
#####################
#########
#### #######
########
###
### #######
###########
##### ### ####
###############
########
######### ##
#######################
###################
################################################## #######
#### #######
#### #
# ##
##########
############# ## #####
#
##################
#####
########## ######
#####
######
##########
################################
#######
###################################
#########
#######################
#
#################################
###
####
########
########
######### ####
######
#####
## ##
#############
#############
####################################################
################ ###
################
###########
#####################
###
########
#######
########
####################
####################
## ############
######################################################
#####
###################
####################################
################
##############
#######
##########
#############
#################
##########################
##############
############################
#######
##########################
# #####
######################
##################################
##
###################
############################
##################
#########
#################################################
######################
#### ##################
########
# ######################################
##############
############################## #
######
#######
#########
## ##
########
####
###################
#######
##############################
###########
#####
##################
####
##################
######
##############
######
#######
#####################
#########
##############
######## ######
######### ##
####### ##### #######
########################
######
###################
########################
####### ####
#########
#####################
#########
########
####### ###################
#####
####
#####
#############################
##########################
##################
###
# ##########
##################
######################
#######
#### #
#########
##
#####
###########
########
#############
################
#####
######## ##
#####
###
########### #######
#########
######
############################################
########
#################
##########################
###############
############################
# #################
##################
############################################
#####
######
##
###################
###########
#######################
###
##################
#################
### #
################################################
########### ##
##
#
######
##
##
########
###### #
############
#######
##
##
############ ######## #
##########
###############
########
########################
# #####################
##### ###
#####
########
################################
##########
############ #####
#### #######
#######
### ####
########
##########################
## ####
##
######
#### ########
####
#########
###
########
###########
#######
##
#########
### #
## ########
####### ##
#
#########
########
#####
################################################################################
#########
################################################################
##################################################### ######################################################
##########################################
###################
#####################################
#################################################
######
##############
########### #########
## ##
#########################################
###################################
####################################################
# ############
# ############## #################################
############################
######
########
##
####
# ## #######
##
#####
#
######
#####
####
#####
### #
# #################### #####
#############
###### ## #
####
############################## ##########
#################
##########
#########
############### ## #
###############################
############# ##
#############################################
######
######### ##
# ###################### ############ #
######
##################################
#######
####
#######
###############
#####
# ############
N
0 50 100
Miles
Chloride (mg/l)# 1 - 20# 20 - 50# 50 - 250
250 - 10001000 - 50000
##
######
## ####
#
# ####
# ###
###
####
# ###
##
## ###
###### ######
####
###########
#
## ######
# # #### #
#############################################
#########
## ##########
################
######
##
###############
####
#
## ######## #######
## ########
### #####
######
# ####
### #### #######################
##### #
## #######
### ############### #### ##
###
#
##
#######################
###############
##########
###
################
############## ###
################
#####################
### ##### ############ #
####### ########
#### # ##
##### ##
### ###
# # ###
##
#####################
##
####################### ##
####
# # ####
# ## #
##
########
####### ## #
########
######## ##
####
# ## ######## ##
##################
######## #######
#############################################
# #######################################
####### ###### ###
######## ##########
######
#
#####
###
#
####
##
##### ###
################
#### #
##########################
###### ###
#
# #
#########
#
# #############
####
## ####### #######
###########
###########
###
# ##
###
#####
# ######################
#### ###
########
#######
#
### ####
#
## ### ##
### # #################
##
###
# ##
# ####
###### ######
####
############ ###
##
####
##########
#
######
## ##
#
###
######
#####
#### ######## ##########
####### ######
###
#######
######
###### # #
##### ###### ###### ########### ###
## ##
###
#
## ########
#######
###
###########
###########
## ########## ############### ###########
############ #######
#
Figure 1. Groundwater chloride concentrations in the High Plains Aquifer in Texas. previously estimated by Wood and Sanford (1995). The recharge rate for non-irrigated regions was calculated as follows:
in/yr 0.3116.7mg/L
0.3mg/L x17.8in/yrCl
Cl x PR
gw
p���
(2)
This estimate of 0.31 in/yr is slightly lower than that estimated by Wood and Sanford (1995). Recharge for irrigated regions can be estimated using the following equation:
gw
irrp
Cl
ClIrrClPR
���
� (3)
where Irr is the irrigation application and Clirr is the chloride concentration in the irrigated water.
Estimating recharge rates in irrigated areas requires information on the irrigation application amount, the chloride concentration in the irrigation water, and the chloride concentration in groundwater in irrigated regions. Because
groundwater is used for irrigation, one would assume that the chloride concentrations in groundwater in nonirrigated regions and the irrigation water are similar. The similarity in groundwater chloride concentrations in irrigated and nonirrigated regions suggests that either (1) the database and data mining approach are inadequate, (2) there is mixing and dilution of irrigation return flow with regional Ogallala groundwater, (3) irrigation water had not reached the groundwater, or (4) the irrigation system was 100% inefficient. The first two reasons seem most plausible because the field studies described in this report indicate that irrigation water has reached the water table in the areas examined and the maximum inefficiencies of irrigation systems is generally considered to be 50% during flood irrigation. The database includes chloride concentrations that represent a long time period and there may be temporal trends in chloride concentrations
P:\9345\GAM-Rpt.1-03\PDF\AppxA_GW-Recharge_TF.doc A-3

that are not being evaluated in this approach. The Ogallala aquifer represents a huge reservoir of water, and mixing and dilution may mask the input from irrigation return flow. Irrigated regions would not be expected to represent steady state conditions, which add an additional complexity to the use of chloride to estimate groundwater recharge. Tritium concentrations provide a much better indicator of irrigation return flow than chloride and are discussed in a later section.
Recharge Estimates Based on Tritium Concentrations of tritium in the unsaturated
zone and groundwater were used to estimate recharge rates in irrigated areas. Tritium is used to trace water movement because it is part of the water molecule. Tritium is a radioactive isotope of hydrogen with a half life of 12.32 years. Tritium occurs naturally in the atmosphere and enters the subsurface primarily through precipitation. Tritium fallout increased as a result of atmospheric nuclear testing that began in the early 1950s and peaked in 1963 (fig. 2). The distribution of tritium in the subsurface can be used to determine the average velocity of the water. The recharge rate is calculated by multiplying the velocity by the average water content in the unsaturated zone.
Two boreholes were drilled in areas that had been irrigated since 1958 (Roberts and Maple sites) and one borehole was drilled in a non-irri-
gated site in the MNWR for comparison with irrigated sites (fig. 3). The boreholes in the irrigated sites were located about 5 feet (ft) dis-tant from the edge of cultivated fields. The drilling, sampling, and analyses were conducted by the USGS as part of the NAWQA program. The methods used in this study are similar to those described in McMahon et al. (2002). The boreholes were drilled using an ODEX air-hammer drilling method (Hammermeister et al., 1986). Core samples were collected in an aluminum-lined core barrel for measurement of porosity, water content, and tritium analyses in the unsaturated zone. Groundwater samples at the irrigated sites were also collected for tritium analysis. The porosity of the samples was measured by completely saturating the cores under a vacuum and calculating the volume of pore space as the difference in mass between the saturated and oven-dried sample (McMahon et al., 2002). Gravimetric water content was measured by oven drying the sample at 105ºC for 24 hours and calculating the difference in mass between the initial (field) sample weight and the oven dried sample weight. Unsaturated zone tritium analyses were conducted on water extracted from 1 kilogram (kg) of core by vacuum distillation at 80ºC. Tritium analyses of unsaturated zone pore water and groundwater were conducted at the USGS Tritium Laboratory in Menlo Park, CA using liquid scintillation with electrolytic enrichment (Thatcher et al., 1977).
0
100
200
300
400
1950 1960 1970 1980 1990 2000
Triti
um (T
U)
Figure 2. Average annual atmospheric tritium fallout for Ottawa, Ontario.
P:\9345\GAM-Rpt.1-03\PDF\AppxA_GW-Recharge_TF.doc A-4

#
#
#
LUBBOCK
MNWR
Maple Roberts
NewMexico Texas
N
0 25 50
Miles
Figure 3. Map of borehole locations with Texas and New Mexico county lines. Blue areas represent
extent of Southern High Plains Aquifer. Pink areas represent 1994 irrigated lands in the Texas portion of the aquifer.
Water content at the non-irrigated site was highest at the surface (about 25%) as a result of a recent precipitation and decreased to 10 to 13% at depth (fig. 4). A similar range in water contents was measured at the irrigated sites (8 to 21%). The porosity of the sediments at each site was quite variable, indicating layered sediments of different textures. Porosities ranged from approximately 25 to 48%.
Post-bomb tritium was generally restricted to the root zone at the non-irrigated MNWR site and indicates negligible recharge (fig. 4). The highest tritium concentration at this site was 6.5 tritium units (TU) at a depth of 3.75 ft. In contrast, post-bomb tritium was found through-out much of the unsaturated zone at the two irrigated sites and in the groundwater at the Roberts irrigated site. At depths greater than 20 to 30 ft, some depth intervals containing tritium concentrations below the detection limit are underlain by post-bomb pulse tritium, which suggests non-piston or preferential flow. A range of recharge rates was estimated from the tritium data in the irrigated sites. Pre-bomb tritium activity was estimated to have been about 8 TU (Thatcher, 1962). The activity of pre-bomb
tritium in core samples at the time of sampling, A, was distinguished from post-bomb values by using the radioactive decay equation:
tλeAA 0�
� (4)
where A0 is the pre-bomb tritium activity, � is the half-life, and t is elapsed time. The tritium center of mass is calculated as follows:
(5) ��
z01/2 θTdzT
where � is the volumetric water content (ft3/ft3), T is the tritium activity (TU) and dz is the depth interval. The velocity of the water was calcu-lated using two methods. In the first approach, the depth of the tritium activity center of mass in the subsurface was calculated and assumed to correspond in time with the peak of atmospheric activity (i.e., 1963). In the second approach, the depth of the deepest occurrence of post-bomb tritium activity was determined and assumed to correspond in time with the onset of atmospheric testing (i.e., 1953). Both approaches assume piston-type flow conditions whereas penetration of tritium below the center of mass at both irri-gated sited may have occurred as a result of
P:\9345\GAM-Rpt.1-03\PDF\AppxA_GW-Recharge_TF.doc A-5

referential flow. For comparison and to limit the effects of preferential flow in the calculations, the centers of mass were additionally
approximated by extrapolating the tritium peaks to pre-bomb values, thus removing the �tails� of the tritium distributions at depth (fig. 4).
0
255075
100125150175
0.00 0.10 0.20 0.30 0.40 0.50
Dep
th (f
t)
Muleshoe National Wildlife Refuge
(a)
WC Porosity
0255075
100125150175
0.00 0.10 0.20 0.30 0.40 0.50
Dep
th (f
t)
Roberts Site
(c)
Porosity
WC
025
5075
100125
150175
0.00 0.10 0.20 0.30 0.40 0.50Water content and porosity (m3/m3)
Dep
th (f
t)
Maple Site
(e)
PorosityWC
0255075
100125150175
-5 0 5 10 15 20
(b)
0255075
100125150175
-5 0 5 10 15 20
(d)
extrapolated trend
0
2550
75100
125150
175-5 0 5 10 15 20
Tritium (TU)
(f)
extrapolated trend
Figure 4. Water content, porosity, and tritium activity with depth at Muleshoe NWR (a, b), Roberts Site
(c, d) and Maple Site (e, f). Tritium error bars represent uncertainty (1�) in measured tritium activity. Vertical dashed lines represent calculated present-day activity (0.5 TU) of pre-bomb tritium (~8 TU) after ~50 years of decay. Horizontal dashed lines represent approximate depth of water table and deepest tritium values represent groundwater activity for the two irrigated sites.
P:\9345\GAM-Rpt.1-03\PDF\AppxA_GW-Recharge_TF.doc A-6

The results of the calculations indicate that the center of mass approach to calculating recharge rates is not sensitive to preferential flow at these sites, as most of the mass is in the near-surface bulge and removal of the tails at depth resulted in only a negligible decrease in calculated recharge rates (table 1). The depth of the center of mass of tritium ranged from 13 to 35 ft. The resultant velocities ranged from 0.34 to 0.91 feet per year (ft/yr) based on the time since peak fallout (1963) and the sampling time (2001) (38 years). The recharge rates, calculated by multiplying the velocity by the average water content, ranged from 0.7 to 1.3 in/yr.
The calculations based on the deepest occurrence approach were very sensitive to the presumed preferential flow at both sites. The deepest occurrence of post-bomb tritium ranged from 136 to 148 ft with average velocities ranging from 2.8 to 3.1 ft/yr and recharge rates ranging from 4.6 to 5.0 in/yr. These recharge rates are approximately 2 to 3 times greater than the rates calculated by removing the tails of the tritium distributions at depth (2.4 and 1.7 in/yr, respectively).
These estimates could be considered bounding values for recharge. The tritium data provide average recharge estimates for the time period considered (38 to 48 years); however, recharge rates probably changed over time as irrigation practices varied. Irrigation began in 1958 at both sites. The plots were furrow irrigated initially, followed by sprinkler irriga-
tion. Cotton was the main crop at both sites. The efficiency of irrigation systems improved over time and the amount of irrigation return flow probably decreased substantially with time. However, the current tritium profiles cannot provide any information on the temporal variability in irrigation return flow.
Matric Potential Monitoring
Heat dissipation sensors were installed to monitor the negative pressures in the unsaturated zone to determine the direction of water movement and to evaluate drainage beneath the irrigated plots. Heat dissipation sensors consist of a heater and thermocouple wire in a cylindrical porous ceramic material. A heat pulse is applied for 30 seconds(s) and the amount of heat dissipation is determined by measuring the temperature change of the instrument. Heat dissipation increases with increasing water content in the soil and is related to the negative pressures in the unsaturated zone through laboratory calibration. The heat dissipa-tion sensors (Model 229, Campbell Scientific Inc., Logan, UT) were calibrated in a pressure plate apparatus in the laboratory using proce-dures outlined in Scanlon and Andraski (2002) and Flint et al. (2002). Initially, the tempera-tures were calibrated for temperature changes after 20 seconds of heating. Later, calibrations were changed to use 30 seconds of heating.
Table 1: Recharge estimates from tritium distributions beneath the irrigated sites.
Site Method Data used Depth
(ft) Time (yr)
Average Velocity(ft/yr)
Average Water Content (ft3/ft3)
Recharge Rate
(in/yr) Roberts Center of mass All 35 38 0.91 0.123 1.3 (-) Tails 28 38 0.73 0.126 1.1 Deepest occurrence All 148 48 3.08 0.123 4.6 (-) Tails 75 48 1.57 0.126 2.4 Maple Center of mass All 16 38 0.42 0.147 0.7 (-) Tails 13 38 0.34 0.176 0.7 Deepest occurrence All 136 48 2.84 0.147 5.0 (-) Tails 39 48 0.82 0.176 1.7
Note: Recharge rates based on depth of post-bomb 3H center of mass and time since peak atmospheric 3H levels (38 years) and on deepest occurrence of post-bomb 3H levels and time since onset of atmospheric testing (48 years).
P:\9345\GAM-Rpt.1-03\PDF\AppxA_GW-Recharge_TF.doc A-7

Heat dissipation sensors were installed in the deep boreholes drilled by the USGS. The instru-ments were placed at different depths and were surrounded by a sand and silica flour mixture. A bentonite plug was used to separate the different heat dissipation sensors. In addition, shallow boreholes were drilled to approximately 10 ft using a trailer-mounted drilling rig (Giddings Machine Co., Inc, Giddings, TX) and were located within the swing of the center pivot to monitor water movement directly beneath the irrigated area. The shallowest depth that could be monitored in the irrigated fields was approxi-mately 1.6 ft (0.5 m) because of the approxi-mated 1.3-ft plough depth. The instruments are connected to a data logger and powered by a solar panel. The instruments are logged daily and data are telemetered to the Bureau of Economic Geology using a cell phone system.
Matric potential profiles in the non-irrigated site were generally much lower (more negative) than those in the irrigated sites in the upper 10 ft in the spring and summer, indicating generally drier conditions in the non-irrigated site (fig. 5). The vertical matric potential profile in the non-irrigated site indicates matric potentials as low as �20 to �25 bars in the shallow subsurface, increasing to matric potentials close to zero at a depth of approximately 38 ft. The increase in matric potentials with depth indicates an upward driving force for water movement and suggests upward flow. These monitoring results are similar to results from interplaya settings at the Department of Energy Pantex Plant near Amarillo, Texas (Scanlon et al., 1997). The vertical matric potential profiles in the irrigated plots are close to zero throughout the profile indicating fairly wet conditions as a result of irrigation.
0
25
50
75
100
125
150051015202530
Dep
th (f
t)Muleshoe NWR
Roberts Site
Maple Site
March 20, 2002
(a)
0
25
50
75
100
125
150051015202530
Matric potential (-bar)
Dep
th (f
t)
July 15, 2002
(b)
Figure 5. Monitored matric potential depth profiles measured during spring (a) and summer (b) of 2002
at the natural and irrigated sites.
P:\9345\GAM-Rpt.1-03\PDF\AppxA_GW-Recharge_TF.doc A-8

The time series plots of matric potentials provide information on infiltration of water as a result of precipitation and irrigation (fig. 6). Precipitation data are only available from MNWR but are repeated in the other plots to represent widespread rainfall events. Monitoring of the heat dissipation sensors installed in the deep boreholes began in July and August 2001, whereas monitoring of those installed in the shallow boreholes began in November 2001. Monitoring results from the heat dissipation sensors indicate infiltration and deeper penetra-tion of water to a maximum depth of 2.5 ft in response to precipitation in the spring of 2002 at the nonirrigated site (MNWR). However, matric potentials decreased in May and June and remained low throughout the rest of the summer. Matric potentials in the upper 10 ft were gener-ally in the range of �10 to �15 bars, indicating extremely dry conditions. Matric potentials increased to values close to zero at 64 ft depth because there is a perched water table close to this zone.
In contrast, matric potentials throughout much of the unsaturated zone beneath the irri-gated plots ranged from �0.5 to �1 bar, which is much wetter than the non-irrigated site. The irrigated sites also show infiltration in response to both precipitation and irrigation. As reported by the landowners, the center pivot irrigation systems at both sites require approximately one week for a single pass around the field. The application depth per pass varies from 0.8 inches at the Maple site to 1.0 inches at the Roberts site. Matric potentials increased to a depth 3.3 and 6.6 ft at both irrigated sites in April. Irriga-tions at the Roberts site in June and early July resulted in infiltration and redistribution to the 2.5 ft depth. Drying occurred in the top 3.3 ft from late July through August despite continued irrigation at the Roberts site. The Maple site was irrigated beginning in late May. Matric potentials showed no response until early July and again in mid-August when infiltration occurred to the 6.6 ft depth. The monitoring data at both irrigated sites indicate that, in the absence of precipitation, current center pivot irrigation methods generally result in infiltration and redistribution to depths of less than 3.3 ft.
When irrigations occur in conjunction with larger precipitation events (≥~1.0 inches), infiltration and redistribution occur to depths between 6.6 and 9.8 ft. Therefore, the monitoring data indicate that the soil profile is much wetter beneath the irrigated fields than at the non-irrigated site.
Time Lag for Irrigation Return Flow
An important factor for transient ground-water simulations in the Southern High Plains is the time lag between drainage below the root zone from irrigation and recharge at the water table. We evaluated this time lag using an analytical approach and numerical modeling. The analytical approach required the following assumptions. We assumed uniform texture and initial matric potential conditions and piston flow. We also assumed unit gradient conditions, i.e. pressure head gradient dh/dz = 0; therefore, the only driving force was gravity. Under these conditions, the flux is equal to the unsaturated hydraulic conductivity at the prevailing water content, ku(�f), and the time required for a wetting front induced by a constant flux rate to arrive at a given depth, z, is:
� �� �fu
if
θk
θθzt
��
� (6)
where � f is the final water content and � i is the initial water content in the profile.
From our monitoring of interplaya settings at the Department of Energy Pantex Plant near Amarillo, matric potentials at depths below the root zone are approximately �10 bars. This matric potential was applied to calculate initial water contents for each of the sediment textures. Van Genuchten parameters published by Schaap and Leij (1998) were applied for a range of sediment textures derived from multiple parameter databases (table 2).
The retention functions were solved for water contents corresponding to flux rates of 6, 9, and 12 in/yr and determined the number of years required for irrigation return flow to move down
P:\9345\GAM-Rpt.1-03\PDF\AppxA_GW-Recharge_TF.doc A-9

0.001
0.01
1
1
10
100
6/01
7/01
8/01
9/01
10/0
1
11/0
1
12/0
1
1/02
2/02
3/02
4/02
5/02
6/02
7/02
8/02
9/02
10/0
2
Mat
ric p
oten
tial (
-bar
)0
1
2
3
4
5
Prec
ipita
tion
(in)
0.5 ft*1.0 ft*1.7 ft2.5 ft*3.3 ft*4.9 ft*6.6 ft*9.8 ft*10 ft38 ft48 ft58 ft64 ftMuleshoe National Wildlife Refuge
(a) 0.
0.001
0.01
0.1
1
10
100
6/01
7/01
8/01
9/01
10/0
1
11/0
1
12/0
1
1/02
2/02
3/02
4/02
5/02
6/02
7/02
8/02
9/02
10/0
2
Mat
ric P
oten
tial (
-bar
)
0
1
2
3
4
5
Prec
ipita
tion
(in)
1.6 ft*2.5 ft*3.3 ft*4.9 ft*6.6 ft*8.5 ft*7.5 ft24 ft59 ft84 ft135 ft139 ft
Roberts Site
(b)
1.0 1.06.01.0Irrigation depths (in):
0.001
0.01
0.1
1
10
100
6/01
7/01
8/01
9/01
10/0
1
11/0
1
12/0
1
1/02
2/02
3/02
4/02
5/02
6/02
7/02
8/02
9/02
10/0
2
Mat
ric p
oten
tial (
-bar
)
0
1
2
3
4
5
Prec
ipita
tion
(in)
1.8 ft*2.5 ft*3.3 ft*4.9 ft*5.9 ft6.6 ft*9.8 ft*14 ft24 ft89 ft110 ft120 ft
Maple Site
(c)
Irrigation depths (in): 2.41.62.4
P:\9345\GAM-Rpt.1-03\AppxA_Figures.doc A-10
igure 6. Time series of monitored matric potential with depth at natural (a) and irrigated (b, c)
al
irrigation.
Flocations. Precipitation values shown for all locations were monitored at Muleshoe NWR. Depths marked with an asterisk (*) indicate sensors installed in shallow boreholes; at the irrigated sites, these sensors are within the irrigated area. Verticgray bars behind irrigation depth values represent periods of active center pivot

1 ft (i.e., the time required for storage to increase from � i to �f at a flux of ku(�f)). For a given texture and flux rate, the wetting front rate of advance is linear and the results were calculated for an unsaturated zone thickness of 100 ft (fig. 7). Sensitivity of arrival time to variations in initial potentials was also examined by vary-ing the initial matric potentials from �10 to �0.5 bars. For a thickness, z, other than 100 ft, the wetting front rate of advance can be calculated by multiplying the results by the ratio of (z/100). The lag time for a sand is less than 5 years; this decreases with increasing applied flux from 6 to 12 in/yr and is insensitive to initial water poten-tial conditions. The lag time for a sandy clay loam was much greater because of the increased storage capacity relative to sand. The lag time for a sandy clay loam varied from 33 years for an applied irrigation of 6 in/yr to 19 years for an applied irrigation of 12 in/yr.
Numerical Simulations
We also conducted numerical simulations of unsaturated flow to evaluate the irrigation return flow lag time. We used the code UNSAT-H (Fayer, 2000) to perform vertical one-dimen-sional flow simulations. The upper boundary
condition was based on 50 yrs of climatic his-tory generated for Lubbock using the computer code GEM (Johnson et al., 2000). Daily weather data were input to the simulations, including precipitation, temperature, relative humidity, solar radiation, and wind speed. A 50-year time period was simulated. To evaluate the impact of irrigation, the weather data were modified by increasing the applied precipitation. Irrigation amounts of 15 inches and 30 inches were evalu-ated for the 1950 to 1960 time period. The irrigation was distributed in 5 separate applica-tions each lasting 3 days at bimonthly intervals in the summer. The irrigation amount was reduced over time from the designated amount in 1951 to 1960 to 75% in the next 10 years (1961 through 1970), 50% in the following 10 years (1971 through 1980), and 25% in the remaining 20 years (1981 through 1999). Plant transpiration was included in the simulations and parameters for cotton were incorporated (Dugas et al., 1985). A unit gradient lower boundary condition was used to evaluate drainage from irrigation return flow. Profile depths of 15 and 50 ft were used to evaluate variations in irrigation return flow over time at those depths.
0
10
20
30
40
S SL SCL
Year
s
Initial water potential = -10 bar
S SL SCL
Initial water potential = -2.0 bar
S SL SCL
6in/yr9in/yr12in/yr
Initial water potential = -0.5 bar
Figure 7. Calculated times required for a piston-flow wetting front to arrive at the base of a 100 ft-thick
soil profile of uniform texture. Results are shown for uniform initial water potentials of �10 bar, -2 bar, and �0.5 bar for sand (S), sandy loam (SL), and sandy clay loam (SCL) textures and various imposed recharge rates.
P:\9345\GAM-Rpt.1-03\PDF\AppxA_GW-Recharge_TF.doc A-11
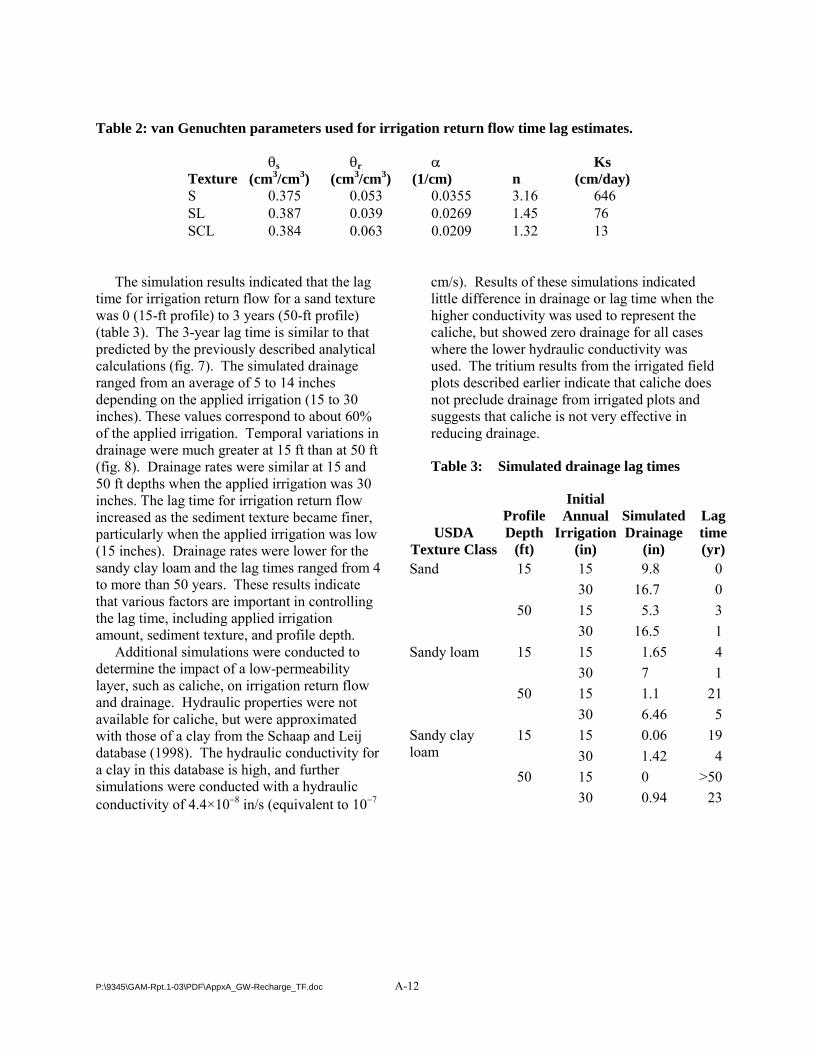
Table 2: van Genuchten parameters used for irrigation return flow time lag estimates.
Texture �s
(cm3/cm3) �r
(cm3/cm3) �
(1/cm) n Ks
(cm/day) S 0.375 0.053 0.0355 3.16 646 SL 0.387 0.039 0.0269 1.45 76 SCL 0.384 0.063 0.0209 1.32 13
The simulation results indicated that the lag
time for irrigation return flow for a sand texture was 0 (15-ft profile) to 3 years (50-ft profile) (table 3). The 3-year lag time is similar to that predicted by the previously described analytical calculations (fig. 7). The simulated drainage ranged from an average of 5 to 14 inches depending on the applied irrigation (15 to 30 inches). These values correspond to about 60% of the applied irrigation. Temporal variations in drainage were much greater at 15 ft than at 50 ft (fig. 8). Drainage rates were similar at 15 and 50 ft depths when the applied irrigation was 30 inches. The lag time for irrigation return flow increased as the sediment texture became finer, particularly when the applied irrigation was low (15 inches). Drainage rates were lower for the sandy clay loam and the lag times ranged from 4 to more than 50 years. These results indicate that various factors are important in controlling the lag time, including applied irrigation amount, sediment texture, and profile depth.
Additional simulations were conducted to determine the impact of a low-permeability layer, such as caliche, on irrigation return flow and drainage. Hydraulic properties were not available for caliche, but were approximated with those of a clay from the Schaap and Leij database (1998). The hydraulic conductivity for a clay in this database is high, and further simulations were conducted with a hydraulic conductivity of 4.4×10�8 in/s (equivalent to 10�7
cm/s). Results of these simulations indicated little difference in drainage or lag time when the higher conductivity was used to represent the caliche, but showed zero drainage for all cases where the lower hydraulic conductivity was used. The tritium results from the irrigated field plots described earlier indicate that caliche does not preclude drainage from irrigated plots and suggests that caliche is not very effective in reducing drainage.
Table 3: Simulated drainage lag times
USDA Texture Class
Profile Depth
(ft)
Initial Annual
Irrigation (in)
Simulated Drainage
(in)
Lag time (yr)
15 9.8 0 15 30 16.7 0 15 5.3 3
Sand
50 30 16.5 1 15 1.65 4 15 30 7 1 15 1.1 21
Sandy loam
50 30 6.46 5 15 0.06 19 15 30 1.42 4 15 0 >50
Sandy clay loam
50 30 0.94 23
P:\9345\GAM-Rpt.1-03\PDF\AppxA_GW-Recharge_TF.doc A-12

0
5
10
15
20
25
0 10 20 30 40 5Time (yr)
Annu
al d
rain
age
(in)
50 ft profile
15 ft profile
0
Figure 8. Comparison of simulated annual drainage from the bases of two irrigated sand
profiles with different thickness.
P:\9345\GAM-Rpt.1-03\PDF\AppxA_GW-Recharge_TF.doc A-13

References
Aronovici, V. S., Schneider, A. D., and Jones, O. R., 1972, Basin recharge of the Ogallala aquifer: J. Irrig. Drain. Div. ASCE, p. 65-75.
Dugas, W. A., Upchurch, D. R., and Ritchie, J. T., 1985, A weighing lysimeter for evapotranspiration and root measurements: Agronomy Journal, v. 77, p. 821-825.
Fayer, M. J., 2000, UNSAT-H Version 3.0: Unsaturated Soil Water and Heat Flow Model, Theory, User Manual, and Examples: Pacific Northwest National Laboratory 13249, p. variously paginated.
Flint, A. L., Campbell, G. S., and Calissendorff, C., 2002, Calibration and temperature correction of heat dissipation matric potential sensors: Soil Sci. Am. J.
Hammermeister, D. P., Blout, D. O., and McDaniel, J. C., 1986, Drilling and coring methods that minimize the disturbance of cuttings, core, and rock formations in the unsaturated zone, Yucca Mountain, Nevada, in Proceedings of the National Water Well Association Conference on Characterization and Monitoring of the Vadose (Unsaturated Zone), Worthington, Ohio, p. 507-541.
Klemt, W. B., 1981, Evaluating the ground-water resources of the High Plains of Texas, neutron probe measurements of deep soil moisture as an indication of aquifer recharge rates.
Johnson, G. L., Daly, C., Taylor, G. H., and Hanson, C. L., 2000, Spatial variability and interpolation of stochastic weather simulation model parameters: J. Appl. Climatology, v. 39, p. 778-796.
Knowles, T. R., Nordstrom, P., and Klemt, W. B., 1984, Evaluating the ground-water resources of the High Plains of Texas: Texas Department of Water Resources Report 288, 119 p.
Luckey, R. R., Gutentag, E. D., Heimes, F. J., and Weeks, J. B., 1986, Digital simulation of ground-water flow in the High Plains aquifer in parts of Colorado, Kansas, Nebraska, New Mexico, Oklahoma, South Dakota, Texas, and Wyoming: U.S. Geological Survey Professional Paper 1400-D, 57 p.
Mullican, W. F. I., Johns, N. D., and Fryar, A. E., 1997, Playas and recharge of the Ogallala aquifer on the Southern High Plains of Texas�An examination using numerical techniques: The University of Texas at Austin, Bureau of Economic Geology, Report of Investigations No. 242, 72 p.
McMahon, P. B., Dennehy, K. F., Ellett, K., Sophocleous, M. A., Paschke, S. S., Michel, R. L., and Hurlbut, D., 2002, Evaluation of Recharge Fluxes to the Central High Plains Aquifer, Southwestern Kansas, 2000-01: Water Resour. Inv. Rept.
Nativ, R., 1988, Hydrogeology and hydrochemistry of the Ogallala Aquifer, Southern High Plains, Texas Panhandle and Eastern New Mexico.
Roark, D. M., and Healy, D. F., 1998, Quantification of deep percolation from two flood- irrigated alfalfa fields, Roswell Basin, New Mexico: USGS Water Resour. Inv. Rept. 98-4096, 32 p.
Scanlon, B. R., Andraski, B. J., and J., B., 2002, Miscellaneous methods for measuring matric or water potential, Methods of Soil Analysis.
Scanlon, B. R., and Goldsmith, R. S., 1997, Field study of spatial variability in unsaturated flow beneath and adjacent to playas: Water Resour. Res., v. 33, p. 2239-2252.
Schaap, M. G., and Leij, F. J., 1998, Database-related accuracy and uncertainty of pedotransfer functions: Soil Science, v. 163, p. 765-779.
P:\9345\GAM-Rpt.1-03\PDF\AppxA_GW-Recharge_TF.doc A-14

Stovall, J., Rainwater, K., and Frailey, S., 2000, Groundwater modeling for the Southern High Plains: Final Report Submitted to Llano Estacado Regional Water Planning Group.
Thatcher, L. L., 1962, The distribution of tritium fallout in precipitation over North America: Bulletin of the International Association of Scientific Hydrology, v. 7, p. 48-58.
Thatcher, L. L., Janzer, V. J., and Edwards, K. W., 1977, Methods for determination of radioactive substances in water and fluvial sediments: U.S. Geological Survey Techniques of Water Resources Investigations, Chapter A-5, 95 p.
Wood, W. W., and Sanford, W. E., 1995, Chemical and isotopic methods for quantifying ground-water recharge in a regional, semiarid environment: Ground Water, v. 33, p. 458-468.
Wood, W. W., Rainwater, K. A., and Thompson, D. B., 1997, Quantifying macropore recharge: examples from a semi-arid area: Ground Water, v. 35, no. 6, p. 1097-1106.
P:\9345\GAM-Rpt.1-03\PDF\AppxA_GW-Recharge_TF.doc A-15
Appendix B
Estimated Irrigation Demand for the
Southern Ogallala GAM

Estimated Irrigation Demand for the Southern Ogallala GAM
By
Dr. Stephen Amosson, Thomas Marek, Leon New, Fran Bretz and Dr. Lal Almas
Amosson Group Amarillo, Texas
January 2003

Estimated Irrigation Demand for the Southern Ogallala GAM
Dr. Stephen Amosson1, Thomas Marek,2 PE Leon New1, PE, Fran Bretz2, and Dr. Lal Almas3
Irrigation accounts for approximately 95 percent of the water use in the area covered by the southern portion of the Ogallala Aquifer. Therefore, accurate assessment of water use in irrigated agriculture is critical to the development of any groundwater availability model (GAM). To estimate irrigation demand in the Southern Ogallala GAM region, a procedure similar to the one developed for the Regional Water Planning Group (RWPG) in Region A (Amosson et al., 1999) was utilized. This procedure, which is based on a water balance approach, is being adopted by the Texas Water Development Board (TWDB) for use in water planning across the state. The water demand methodology developed for the Region A Ogallala model was utilized in developing the southern Ogallala GAM Model. The procedure involved using weather data, crops, acreages, irrigation technologies and other relevant data from the region. Observed water levels were used to validate the crop demand estimates where available. Specific scope of work for developing the irrigation demand for the Southern Ogallala GAM project included:
1) Collection of all required data for determination of annual crop water demand for the southern Ogallala Aquifer region for the period 1940 through 2000. In addition, monthly estimates of irrigation demand will be made for two three-year periods, each centered about a drought period. One three-year period should be during 1980 to 1990, and another 1990 to 2000.
2) Determination of appropriate crop irrigation requirements for the
predictive modeling scenarios as described in Section 4.0 of the GAM Request for Proposal (RFP).
3) Provide complete documentation and explanation of analyses conducted
and associated results.
4) Provide copies of all data collected and analyses conducted.
5) Participate in up to two Stakeholder Advisory Forums to present or discuss work activities.
6) Identify and estimate "drought of record" irrigation demands for the
Southern Ogallala GAM region. 1 Professor and Management Economist and Professor and Agricultural Engineer, Texas Cooperative Extension, Amarillo, Texas. 2 Research Engineer and Superintendent and Research Associate, Texas Agricultural Experiment Station, Amarillo, Texas. 3 Assistant Professor, Agricultural Business and Economics, West Texas A&M University, Canyon, Texas.
P:\9345\GAM-Rpt.1-03\PDF\AppxB-SouthGAMS_TF.doc B-2

Methodology
The overall methodology involved estimating irrigation demand for counties in the Southern Ogallala GAM region by month for the selected years of 1982, 1987, 1992 and 1997. These years were selected because two sources of information on irrigated acreage were available (Texas Agricultural Statistics Services (TASS) and the Census of Agriculture) increasing the validity of estimates. In addition, long-term average (LTA) irrigation and water use by crop and by county were calculated to assist in evaluating other years and the impact of drought scenarios. The LTA was developed utilizing long-term rainfall, and crop ET estimates to reflect water use in an "average year". Data and results of the 1997 simulation are presented in the main report with the remaining analysis provided in the appendices.
Computation of irrigation demand is based upon a water balance crop use approach. This approach lends itself well to use demands based on scientific functions of crop production. Production functions are directly related to crop evapotranspiration (ET). Similarly, crop ET can be related to potential ET (PET). A modified Penman-Monteith equation was used for calculation of PET from meteorological data utilizing a well-watered grass reference. Factors influencing the PET demand equation are percentage of crop ET applied, rainfall, soil profile moisture, and irrigation applied. The equation used for the computation(s) is:
PT(ETC) = IRRC + ER + SSMD (1) where,
PT = Percentage of crop evapotranspiration applied on a seasonal basis, inches
ETC = Crop evapotranspiration (or water use) for maximum production potential, inches
IRRC = Irrigation applied on a seasonal basis to a crop, inches
ER = Effective rainfall computed from seasonal rainfall occurring during the crop season, inches, and
SSMD = Differential seasonal soil moisture used in crop production which is extracted from the soil profile, inches.
Rearranging the equation and solving for IRR yields:
IRRC = ETC(PT) - ER - SSMD (2) Summary equation for the crops grown per county yields:
cIRRIRRn
CTY �=1
(3)
where,
P:\9345\GAM-Rpt.1-03\PDF\AppxB-SouthGAMS_TF.doc B-3

IRRCTY = Total quantity of irrigation volume applied (pumped) to the crops grown within a county in a given year or season, acre-feet.
Similarly,
(4) �=
36
1CTYZ IRRIRR
where,
IRRZ = Total quantity of irrigation volume applied (pumped) to crops grown within the study area (Southern Ogallala GAM Region) in a given year or season, acre-feet.
. Data used in computations for specific crops were derived from crop ET data.
Crop data were derived for corn, grain sorghum, cotton, peanuts, soybeans, wheat, hay, and pasture and other from each of the stations located in the Southern Ogallala GAM region, where sufficient and accurate data existed. In areas where no useable information was available, surrounding meteorological stations were utilized in determining crop ET. Differential seasonal soil moisture values were derived from sampling data obtained from growers by the Texas Cooperative Extension throughout the Texas Panhandle during the 1998 to 2000 time frame. Percentage of crop PET used in computations was obtained from data attained by the Texas Cooperative Extension. Comparing the applied or targeted percentage of crop PET agrees well with crop production level(s) and water use. This term of percentage of crop PET essentially represents the water pumped per crop. Effective precipitation from rainfall events recorded in county data was computed using the National Resources Conservation Service (NRCS, formerly the Soil Conservation Service ) method of estimating effective precipitation. This method is described in Part 623 of Chapter 2 of the NRCS National Engineering Handbook. The storage factor was computed using a usable soil water storage value of 6 inches. The equation used was: SF = (0.531747 + 0.295164 D – 0.057697 D2 + 0.003804 D3) (5) where, D = The usable soil water storage, (in) Using this factor, the average monthly effective precipitation was calculated using the following equation:
ER = SF(0.70917RM0.82416 – 0.11556) (100.02426ET
CM) (6)
P:\9345\GAM-Rpt.1-03\PDF\AppxB-SouthGAMS_TF.doc B-4

where, ER = Average monthly effective monthly precipitation, (in) RM = Mean monthly precipitation, (in) ETCM = Average monthly crop evapotranspiration, (in) and SF = Soil water storage factor.
Data Inputs
While the methodology to estimate irrigation demand is relatively simple, the amount of data required to be analyzed can be extensive. In the next sections, base data required/analyzed to estimate irrigation demand is discussed. Where possible, model parameter estimates are incorporated into the text. In other cases, where data is too "bulky", it is located in an attachment or the data sources are cited. ET and Weather Station Data
Potential evapotranspiration (PET) values were calculated from station data of the North Plains Evapotranspiration Network (NPET) and South Plains Potential Evapotrans-piration Network (SP-PET), principally from the station sites of Chillicothe, Dimmitt, Earth, Etter, Farewell, James Bush Farm (Bushland), Lubbock, Lamesa, Morse and Wellington. (Some of these data are available at the web site http://amarillo2.tamu.edu/-
nppet/station.htm). A proportioning matrix was developed to allocate respective representation and contribution of each of the station sites of the PET network and associated crop values to the desired county. The county attribution was based upon the parameters of longitude, latitude, elevation of the stations and from past analysis and differentiation of crop ETs from the respective locations. Data comparisons of various other PET and meteorological sources were reviewed and partially analyzed, but were determined to be inadequate in terms of accuracy and integrity for purposes of this analysis.
The NPET computations of PET values used in the analysis were obtained using the new American Society of Civil Engineers (ASCE) standardized reference evapotranspiration equation (current draft version) developed by and in cooperation with members of the NPET network development team (Environmental and Water Resources Institute of the American Society of Agricultural Engineers Standardization of Reference Evapotranspiration Task Committee, December 30, 2001 – draft version). The meteorological parameters of temperature, wind speed, solar radiation and elevation are the primary inputs to these computations. Crop ET values for each respective crop used in the irrigation demand analysis were computed by using growth stage crop coefficients determined through explicit prior lysimeter research throughout the cropping season. These crop coefficients were then computed against the standardized values to yield the respective crop ET’s used in the analysis. Compiling these values on a monthly basis provided data for the monthly irrigation demand values of each crop.
P:\9345\GAM-Rpt.1-03\PDF\AppxB-SouthGAMS_TF.doc B-5

Rainfall Data
Rainfall data used in the analysis for the respective years of 1982, 1987, 1992 and 1997 were utilized from Texas and New Mexico quadrangle rainfall records of the Texas Water Development Board. In the case where counties spanned multiple quadrangle boundaries, a proportioning of the quadrangle value(s) was attributed and summed to the total county rainfall value. Similar to the ET data, rainfall data were compared from site-specific locations and other sources but were rejected due to the variability (continuity) of the values within the respective locations as compared to across the region. Use of specific weather station data would thus have provided more attenuation of the irrigation demand values than desired. Use of the quadrangle data set reflects a more consistent trend across the region and corresponds more to the intent of the demand analysis.
The respective county rainfall values were used to compute effective rainfall per crop for each respective growing season. The values were computed using the NRCS engineering equation to determine effective rainfall. Summing the respective values per crop resulted in the amount of effective rainfall deducted from the PET demand per crop per county. Monthly rainfall by county used in the project is located in Attachment B1. Differential Soil Moisture Differential soil moisture (DSM) is the water existing in (prior to the growing season) and extracted from the soil profile during crop production. Estimates of differential soil moisture for the heavier soils were made based on measurements taken from demonstrations conducted in the Agri-Partner program and research trials from the U.S. Department of Agriculture (USDA) facility in Bushland. Differential soil moisture estimates for areas with sandy soils were modified to reflect smaller holding capacities and water use required by cover crops to reduce wind erosion in these areas. Adjustments to DSM were made with input provided by scientists from Texas Tech University (table 1). Table 1. Differential soil moisture (DSM) and long-term average (LTA) crop ET used in calculations per crop category for the northern and southern tiers of counties in the GAM Region.
Crop
DSM, Northern Counties
(acre-inches)
DSM, Southern Counties
(acre-inches)
LTA ET Applied, Northern
Counties
LTA ET Applied, Southern
Counties Corn 2.0 2.0 0.95 0.95 Cotton 5.0 2.0 1.00 1.00 Grain Sorghum 2.5 1.5 0.85 0.85 Hay 1.5 1.0 0.95 0.95 Pasture 2.5 2.5 0.80 0.80 Peanuts 2.5 1.5 1.00 1.00 Soybeans 3.0 1.5 0.92 0.92 Wheat 3.5 0.5 0.78 0.60
P:\9345\GAM-Rpt.1-03\PDF\AppxB-SouthGAMS_TF.doc B-6

Producer Use of ET Actual producer application of irrigation water on a crop in the short run is effected by several factors including: the amount of water available; variable cost of pumping; profitability of the crop; profitability of competing crops; and change in crop yield from an acre-inch of water applied. Agri-Partner demonstration data, water district data and interviews with individual producers were utilized in estimating producer use of ET by crop (table 1). Current estimates of producer use of ET by crop varied across the region depending on water availability. Current estimates were used in all base years and actual drought year simulations. Long-term average estimates varied slightly from current estimates to reflect expected changes in producer water use. LTA estimates were used in evaluating "drought of record" impacts and as a reference point for water use in non-base or actual drought years for GAM modeling. Irrigated Acreage The importance of accurate assessments of irrigated acreage is paramount to estimating water demand. Base years of 1982, 1987, 1992 and 1997 were used to estimate irrigation demand because both of TASS and the Census of Agriculture being available. TASS provides annual estimates of irrigated acreage by major crops annually. The Census of Agriculture provides an estimate of all irrigated acreage delineated into major and minor crops every five years. In non-base years (i.e., selected three-year drought periods in the 1980s and 1990s), minor irrigated crop acreage was assumed to remain unchanged from the most recent Census of Agriculture estimates. Major crop acreage was altered by the associated TASS estimates for the year. Acreage estimates for all years needed to be modified to account for "border" conditions (i.e., not all irrigated acreage in counties on the edge of the Ogallala may be over the aquifer). A survey of border county Farm Service Agency (FSA) offices was conducted to determine the percentage of irrigated land in their counties located over the Ogallala (table 2). Border modified irrigated acreage estimates by base and selected drought years, crop and county are located in Attachment B2.
Drought Scenarios
Annual rainfall data obtained from the TWDB for 1940 to 1998 was utilized to identify drought periods to be analyzed. The contract specifies irrigation demands for the lowest three consecutive rainfall periods during the 1980s and 1990s were to be estimated. Analysis of the rainfall data indicated these periods were 1982 to 1984 and 1992 to 1994, where rainfall averaged 18.47 inches per year and 17.08 inches per year, respectively (table 3).
P:\9345\GAM-Rpt.1-03\PDF\AppxB-SouthGAMS_TF.doc B-7

Table 2. Percentage of irrigated land located above the Ogallala Aquifer in border counties of the Southern Ogallala GAM Region.
Border County
Percentage of Irrigated Land Located Over Ogallala Aquifer
Andrews 100 Armstrong 1 Borden 100 Briscoe 60 Crosby 100 Dickens 50 Ector 100 Floyd 97 Garza 100 Glasscock 8 Howard 100 Lea 100 Midland 30 Motley 7 Oldham 100 Potter 100 Quay 1 Randall 80
P:\9345\GAM-Rpt.1-03\PDF\AppxB-SouthGAMS_TF.doc B-8

Table 3. Rainfall (inches) in Southern Ogallala GAM Region for 1980s and 1990s.
Year
Annual Rainfall (inches)
Year
Annual Rainfall (inches)
1980 17.93 1990 18.45 1981 21.83 1991 24.83 1982 19.35 1992 21.45 1983 15.77 1993 15.39 1984 20.28 1994 14.39 1985 23.78 1995 23.98 1986 27.99 1996 15.98 1987 20.70 1997 24.01 1988 19.25 1998 12.80 1989 15.59
1980, 1981, 1982
19.70 1990, 1991, 1992
21.58 1981, 1982, 1983
18.98 1991, 1992, 1993
20.56 1982, 1983, 1984
18.47 1992, 1993, 1994
17.08 1983, 1984, 1985
19.94 1993, 1994, 1995
17.92 1984, 1985, 1986
24.02 1994, 1995, 1996
18.12 1985, 1986, 1987
24.16 1995, 1996, 1997
21.32 1986, 1987, 1988
22.65 1996, 1997, 1998
17.60 1987, 1988, 1989
18.51
In addition, the impact of the "drought of record" was to be estimated. After consultation with the TWDB, the five consecutive year period from 1952 to 1956 was identified. This period represented the lowest five-year consecutive annual rainfall period, for the region within the 1947 to 1998 time period (table 4). The average annual rainfall for the period was 13.37 inches while the annual rainfall varied more than six inches in that time period and five years were below the long-term average.
P:\9345\GAM-Rpt.1-03\PDF\AppxB-SouthGAMS_TF.doc B-9

Table 4. Drought of Record in Southern GAM Region (inches).
Year
Annual Rainfall (inches)
1952 12.71 1953 13.72 1954 13.44 1955 16.52 1956 10.48
Average 13.37 1990-1998 Average 18.77
Results The purpose of the irrigation demand model is to provide water use estimates by month and county for application in the Southern Ogallala GAM model. Irrigation water demand was estimated for the years 1982, 1983, 1984, 1987, 1992, 1993, 1994 and 1997. Another simulation estimating water demand was conducted utilizing 1997 irrigated acreage, average weather related values and average rainfall from the 1940 to 1998 time period. This LTA scenario is considered a proxy for an "average" year irrigation water use estimate. A regional summary of irrigated acreage, total water use and water use per irrigated acre is given in Table 1. In addition, simulations were conducted to determine the relative impact of irrigated water use by year and month of a "drought of record". All model parameters were assumed to remain unchanged from the LTA scenario with the exception of rainfall. Rainfall totals and distribution were assumed to be identical to the identified "Drought of Record" 1952 to 1956. Simulations for Base Years The years 1982, 1987, 1992, and 1997 were selected as the "benchmark" years for simulating water demand. These years were selected because two different sources of information for irrigated acreage are available, thus increasing the accuracy of estimated water projections. County comparisons are presented in Figures 1 through 4 for these years. Regional and county level water use estimates projected by month for each of the benchmark years are presented in Attachment B3. Drought of Record The five-year drought of record identified from the Texas Water Development Board (TWDB) records for the Southern Ogallala GAM region was 1952 through 1956. The water use estimates were generated from the weather conditions existing during the drought period and utilizing the most recent irrigated acreage estimates (1997). This was done to provide the most viable estimate of water use during an "extended" record drought now or in the future (assuming irrigated acreage remains constant). Water use
P:\9345\GAM-Rpt.1-03\PDF\AppxB-SouthGAMS_TF.doc B-10

Figure 1. 1982 Southern GAMS Irrigation Water Use Demands by County.
P:\9345\GAM-Rpt.1-03\AppxB_Figs.xlsAppxB_Figs.xls 1982Comp2Chart1 B-11
1982 County Irrigation Water Use Demands
0
50,000
100,000
150,000
200,000
250,000
300,000
350,000
400,000
450,000
500,000
ANDREWS
ARMSTRONG
BAILEY
BORDEN
BRISCOE
CASTRO
COCHRAN
CROSBY
DAWSON
DEAF SMITH
DICKENS
ECTOR
FLOYD
GAINES
GARZA
GLASSCOCK
HALE
HOCKLEY
HOWARD
LAMB
LUBBOCK
LYNN
MARTIN
MIDLAND
MOTLEY
OLDHAM
PARMER
POTTER
RANDALL
SWISHER
TERRY
YOAKUM
CURRY
LEA
QUAY
ROOSEVELT
County
Irrig
atio
n W
ater
Use
, ac-
ft

Figure 2. 1987 Southern GAMS Irrigation Water Use Demands by County.
P:\9345\GAM-Rpt.1-03\AppxB_Figs.xlsAppxB_Figs.xls 1987Comp2Chart1 B-12
1987 County Irrigation Water Use Demands
0
50,000
100,000
150,000
200,000
250,000
300,000
ANDREWS
ARMSTRONG
BAILEY
BORDEN
BRISCOE
CASTRO
COCHRAN
CROSBY
DAWSON
DEAF SMITH
DICKENS
ECTOR
FLOYD
GAINES
GARZA
GLASSCOCK
HALE
HOCKLEY
HOWARD
LAMB
LUBBOCK
LYNN
MARTIN
MIDLAND
MOTLEY
OLDHAM
PARMER
POTTER
RANDALL
SWISHER
TERRY
YOAKUM
CURRY
LEA
QUAY
ROOSEVELT
County
Irrig
atio
n W
ater
Use
, ac-
ft

Figure 3. 1992 Southern GAMS Irrigation Water Use Demands by County.
P:\9345\GAM-Rpt.1-03\AppxB_Figs.xlsAppxB_Figs.xls 1992Comp2Chart1 B-13
1992 County Irrigation Water Use Demands
0
50,000
100,000
150,000
200,000
250,000
300,000
350,000
400,000
ANDREWS
ARMSTRONG
BAILEY
BORDEN
BRISCOE
CASTRO
COCHRAN
CROSBY
DAWSON
DEAF SMITH
DICKENS
ECTOR
FLOYD
GAINES
GARZA
GLASSCOCK
HALE
HOCKLEY
HOWARD
LAMB
LUBBOCK
LYNN
MARTIN
MIDLAND
MOTLEY
OLDHAM
PARMER
POTTER
RANDALL
SWISHER
TERRY
YOAKUM
CURRY
LEA
QUAY
ROOSEVELT
County
Irrig
atio
n W
ater
Use
, ac-
ft
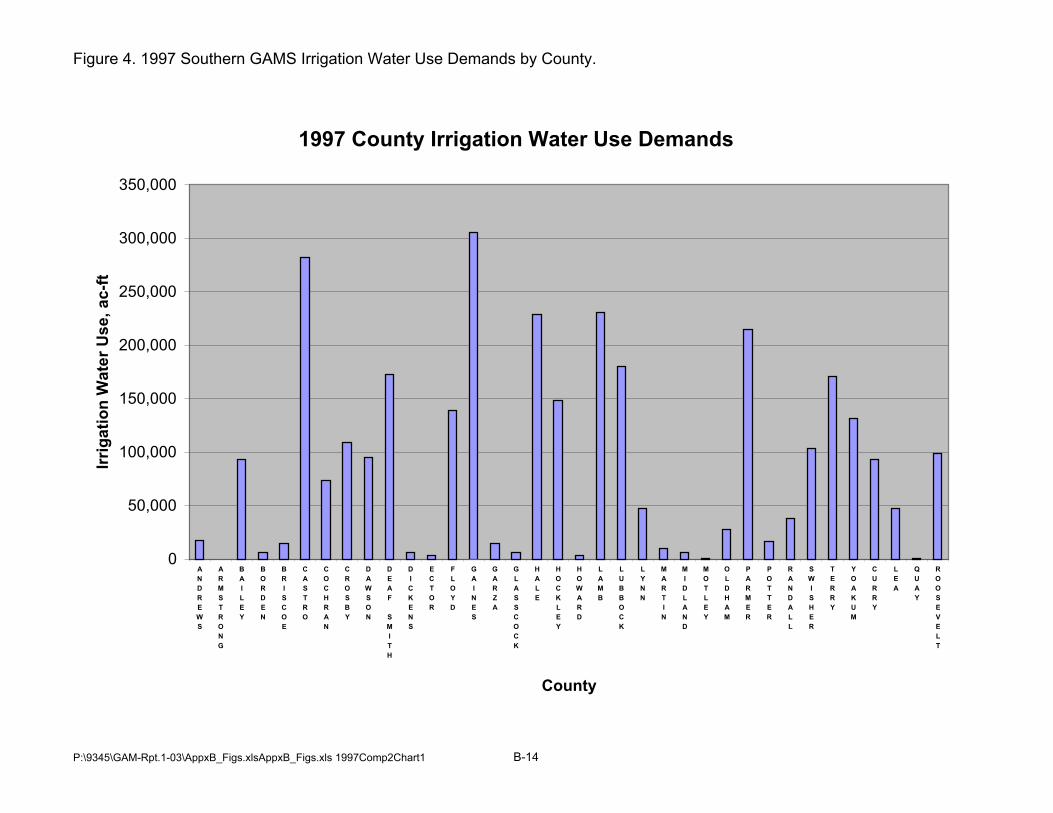
Figure 4. 1997 Southern GAMS Irrigation Water Use Demands by County.
P:\9345\GAM-Rpt.1-03\AppxB_Figs.xlsAppxB_Figs.xls 1997Comp2Chart1 B-14
1997 County Irrigation Water Use Demands
0
50,000
100,000
150,000
200,000
250,000
300,000
350,000
ANDREWS
ARMSTRONG
BAILEY
BORDEN
BRISCOE
CASTRO
COCHRAN
CROSBY
DAWSON
DEAF SMITH
DICKENS
ECTOR
FLOYD
GAINES
GARZA
GLASSCOCK
HALE
HOCKLEY
HOWARD
LAMB
LUBBOCK
LYNN
MARTIN
MIDLAND
MOTLEY
OLDHAM
PARMER
POTTER
RANDALL
SWISHER
TERRY
YOAKUM
CURRY
LEA
QUAY
ROOSEVELT
County
Irrig
atio
n W
ater
Use
, ac-
ft

estimates for the "Drought of Record" are presented by year, month and county in Attachment B3. 1980s and 1990s Drought Irrigation water use in actual three-year periods for the 1980s and 1990s were estimated. These years were identified from TWDB data to be 1982 to 1984 and 1992 to 1994. Actual weather conditions occurring during these years and the associated irrigated acreage for the same years were utilized in the simulation. The resultant water use estimates are summarized and presented by county, year and month in Attachment B3. Long-term Acreage Simulation LTA estimates of water use by crop and county were made using average monthly rainfall data for the region over the 1940 to 1998 time frame for the region, Attachment B4. LTA irrigation water use incorporated weather station data and current producer use of ET in its estimates. A county comparison of these estimates is presented in Figure 5. LTA water use is valuable in estimating water use in years when simulations were not conducted. In addition, LTA water use provides the basic results for approximating average future water use demand for the region. Estimating Irrigation Demand Prior to 1982 The estimation of irrigation demand in the southern Ogallala region can be done in a number of ways. After discussion among ourselves and other knowledgeable individuals, we have decided to recommend the following procedure as a quick/relatively inexpensive methodology for approximating water use prior to 1982. Records and experience suggest water use efficiency has improved an average of 1 percent per year from the inception of irrigation in the region through 1997. Therefore, the easiest/simplest way to estimate irrigation demand for a year prior to 1982 is to use the LTA water use per acre by county and then adjust this amount to reflect the difference in acreage and irrigation efficiency for that year. For example, if the LTA irrigation demand (LTA estimates are calculated using 1940 to 1998 conditions.) for a specific county was 13 inches and water use in 1968 needed to be estimated, then the following equation would be used:
By County YIWU = LTAWU x (1 + (1997 - year)/100) per acre (7)
Sum Over Acres CIWU = YIWU * YIA (8) where,
P:\9345\GAM-Rpt.1-03\PDF\AppxB-SouthGAMS_TF.doc B-15

Figure 5. LTA Southern GAMS Irrigation Water Use Demands by County.
P:\9345\GAM-Rpt.1-03\AppxB_Figs.xlsAppxB_Figs.xls LTAComp2Chart1 B-16
LTA County Irrigation Water Use Demands
0
50,000
100,000
150,000
200,000
250,000
300,000
350,000
400,000
450,000
ANDREWS
ARMSTRONG
BAILEY
BORDEN
BRISCOE
CASTRO
COCHRAN
CROSBY
DAWSON
DEAF SMITH
DICKENS
ECTOR
FLOYD
GAINES
GARZA
GLASSCOCK
HALE
HOCKLEY
HOWARD
LAMB
LUBBOCK
LYNN
MARTIN
MIDLAND
MOTLEY
OLDHAM
PARMER
POTTER
RANDALL
SWISHER
TERRY
YOAKUM
CURRY
LEA
QUAY
ROOSEVELT
County
Irrig
atio
n W
ater
Use
, ac-
ft

YIWU = Water use per irrigated acre in the year being estimated
LTAWU = Long-term average (1940 - 1998) irrigated water use estimate per acre by county
Y = Year being estimated YCIA = County irrigated acreage in year being estimated CIWU = Irrigated water use for the county
If the year is 1968, LTAWU for the county equals 13 inches and 1968 county
irrigated acreage is 50,000 acres then estimated irrigation water use should be: YIWU = 13 x (1 + (1997 - 1968/100)) = 16.77 and CIWU = 16.77 x 50,000 = 838,500 acre-inches
This methodology represents the easiest and simplest way to make a reasonable estimate of irrigation demand for a county. However, it is important to recognize the procedure's weaknesses. First, water use estimates are specific to a year. If this is the only year estimated for a time period, an alternative procedure that utilizes average time period acreages for irrigated acreage and water use efficiency should be considered. Second, since LTA water use for the county is used, there is no allowance considered for weather variations such as temperature in that year which leads to potential distortions in water use estimates for that specific year. Finally, estimating irrigation demand for a specific year utilizing LTA water use per irrigated acre can result in some distortion if the assumed LTA crop mix (based on 1997 regional crop patterns) varies from the specific year's crop mix. The distortion in crop mix can be eliminated by using the LTA water use estimate by crop (included in the LTA estimate). Obviously, this approach increases significantly the workload unless the approach is used only when observed significant variations in crop mix between the LTA and the distribution of estimated irrigated acreage in the year being projected. Optimally, the best approach would be to run the Southern Ogallala GAM water demand model for every year of the time frame being considered. However, the workload would increase significantly and while the results would increase in accuracy, the expense would need to be warranted.
P:\9345\GAM-Rpt.1-03\PDF\AppxB-SouthGAMS_TF.doc B-17
Regional Assessment The summary of the planted irrigation acreages (pia), irrigation water use demands and irrigation water use per pia is presented in Figure 6. Graphically viewing this data along with polynomial trendlines reflects the sequence of irrigation water use for the Southern Ogallala Region. Note that the time series axis is not proportionately contiguous. Additionally, in Figure 7, the irrigation water use per pia is presented for the total region. These estimates are supplemented with observations witnessed from scientists and irrigation associated engineers over the respective periods.
P:\9345\GAM-Rpt.1-03\PDF\AppxB-SouthGAMS_TF.doc B-18

Figure 6. Southern GAMS Comparisons Chart.
P:\9345\GAM-Rpt.1-03\AppxB_Figs.xlsAppxB_Figs.xls Comp2Chart1 B-19
Southern GAMS Comparisons (Selected Years)
0
1,000,000
2,000,000
3,000,000
4,000,000
5,000,000
6,000,000
1982 1983 1984 1987 1992 1993 1994 1997 LTA
Year
Acr
es a
nd T
otal
Irr.
Wat
er U
se V
alue
s
Planted Irrigated Acres, pia
TAES Total Irrigation Water Use, ac-ft
Poly. (Planted Irrigated Acres, pia)
Poly. (TAES Total Irrigation Water Use,ac-ft)

Figure 7. Southern GAMS Water Use Comparison Chart.
P:\9345\GAM-Rpt.1-03\AppxB_Figs.xlsAppxB_Figs.xls Comp2Chart2 B-20
Southern GAMS Water Use Comparison
0
5
10
15
20
25
1982 1983 1984 1987 1992 1993 1994 1997 LTAYear
Irrig
atio
n W
ater
Use
, in/
pia
TAES Irrigation Water Use,in/pia
Poly. (TAES Irrigation WaterUse, in/pia)

Attachment B1
Monthly Rainfall in Inches by County

Attachment B1. Monthly rainfall in inches by county for selected years and long-term average (LTA) in the Southern Ogallala GAM region.
CTY/QID YEAR JAN FEB MAR APR MAY JUN JUL AUG SEP OCT NOV DEC ANNUAL
505 1997 0.30 1.96 0.28 3.12 3.02 3.53 1.85 2.47 2.07 1.09 0.44 2.00 22.111994 0.55 0.04 0.09 0.66 3.22 0.36 1.93 0.46 1.80 0.77 0.85 0.09 10.811993 1.22 0.93 0.98 1.33 1.15 0.72 3.59 1.70 1.05 0.96 0.20 0.33 14.151992 1.56 2.15 0.91 0.76 6.68 3.14 1.45 2.33 0.72 0.01 1.26 0.43 21.411987 0.31 1.52 0.74 0.55 6.47 2.36 0.58 1.97 2.63 0.32 0.07 0.58 18.101984 0.35 0.37 0.38 0.20 3.49 4.17 1.84 4.13 1.53 3.59 2.10 1.41 23.561983 1.55 0.53 0.52 0.70 1.42 1.11 0.94 0.33 0.48 4.41 2.22 0.73 14.951982 0.47 0.32 0.98 1.15 2.90 2.82 2.37 0.59 1.37 0.88 1.53 2.78 18.151956 0.39 1.51 0.08 0.89 1.87 1.23 0.65 0.69 0.18 1.76 0.46 0.33 10.041955 0.81 0.22 0.49 0.94 2.41 1.12 3.56 0.62 1.87 3.54 0.26 0.04 15.871954 0.34 0.07 0.06 2.66 5.78 1.14 0.24 2.54 0.42 3.27 0.40 0.89 17.811953 0.27 0.34 0.87 1.70 5.33 0.45 3.38 1.79 0.73 3.67 0.82 1.15 20.491952 0.48 0.50 0.41 1.50 2.05 0.40 2.75 0.52 1.94 0.03 1.46 1.04 13.06LTA 0.76 0.73 0.73 1.12 2.43 2.04 2.28 1.99 2.48 1.69 0.78 0.78 17.82
206&306 1997 0.59 1.57 0.34 7.50 3.50 2.91 2.56 3.90 2.25 1.05 0.87 2.01 29.011994 0.72 0.12 1.31 2.22 2.49 1.39 3.93 2.09 1.76 0.94 0.83 0.44 18.201993 1.17 0.70 1.17 0.92 2.17 2.79 3.81 3.06 1.21 0.81 0.62 0.51 18.901992 0.75 0.67 1.08 2.11 4.14 6.63 2.70 2.65 0.51 0.08 1.52 0.89 23.701987 0.85 1.32 1.24 0.33 5.18 3.19 2.36 3.75 3.34 0.90 0.48 1.89 24.801984 0.36 0.57 1.12 1.02 0.56 4.14 1.30 3.45 0.83 2.45 1.28 1.57 18.631983 1.58 1.67 0.79 1.11 2.27 2.57 0.60 0.84 1.04 4.09 0.50 0.63 17.661982 0.18 0.63 0.72 0.56 4.92 5.06 4.79 1.08 1.19 0.39 1.04 1.13 21.671956 0.20 1.81 0.13 0.30 3.82 1.65 2.52 0.81 0.49 0.62 0.23 0.34 12.881955 0.45 0.22 0.28 0.70 6.02 3.55 2.02 1.19 1.94 1.02 0.14 0.05 17.541954 0.36 0.06 0.17 1.98 4.37 1.73 1.21 2.35 0.38 0.83 0.03 0.40 13.851953 0.69 0.32 0.66 0.90 1.03 0.34 3.24 2.57 0.26 3.61 0.39 0.48 14.471952 0.70 0.29 0.51 2.63 1.18 1.99 2.18 1.51 0.58 0.00 1.08 0.57 13.19
LTA 0.62 0.75 0.92 1.45 3.05 3.33 2.74 2.67 2.16 1.65 0.76 0.71 20.81
305&405 1997 0.54 0.83 0.09 4.62 2.51 3.11 2.56 3.07 2.61 1.06 0.62 2.04 23.651994 0.16 0.10 1.01 1.46 4.13 1.60 2.93 1.84 1.03 0.45 0.65 0.26 15.631993 1.07 0.36 0.59 0.67 1.47 1.55 3.88 2.56 1.80 1.15 0.53 0.30 15.941992 1.07 0.65 1.16 1.13 4.40 5.16 1.91 2.87 1.17 0.02 1.19 0.77 21.501987 0.71 0.97 0.30 0.18 4.08 2.08 1.43 4.68 3.40 0.78 0.31 1.68 20.601984 0.24 0.14 0.67 0.29 1.01 3.42 2.12 5.54 0.53 3.33 1.28 1.59 20.171983 1.47 0.94 0.39 0.65 1.45 1.67 0.62 0.62 0.76 3.45 0.56 0.45 13.001982 0.15 0.38 0.37 0.48 2.52 3.28 3.93 1.08 0.74 0.44 1.16 1.61 16.121956 0.18 1.21 0.11 0.37 2.40 1.90 1.02 0.96 0.21 0.68 0.03 0.17 9.231955 0.67 0.15 0.22 0.54 3.47 0.95 2.53 1.05 1.98 2.19 0.15 0.03 13.951954 0.18 0.19 0.14 1.17 2.59 0.91 0.57 2.75 0.51 1.67 0.02 0.28 10.991953 0.44 0.44 0.94 0.93 1.20 0.86 2.28 2.00 0.41 2.45 0.24 0.22 12.401952 0.57 0.25 0.42 1.86 0.99 1.53 1.95 1.57 0.85 0.00 1.04 0.36 11.38LTA 0.59 0.63 0.64 1.04 2.34 2.57 2.50 2.55 2.21 1.57 0.68 0.71 18.04
Andrews County-Texas
Armstrong County-Texas
Bailey County-Texas
P:\9345\GAM-Rpt.9-2002\Att_B1.xls B1-1

Attachment B1. Monthly rainfall in inches by county for selected years and long-term average (LTA) in the Southern Ogallala GAM region.
CTY/QID YEAR JAN FEB MAR APR MAY JUN JUL AUG SEP OCT NOV DEC ANNUALBorden County-Texas
506 1997 0.17 3.11 0.27 4.41 2.77 5.34 1.13 3.21 1.76 1.45 0.51 1.63 25.771994 0.99 0.26 0.15 0.81 4.03 0.50 1.16 0.35 3.35 1.12 1.45 0.48 14.641993 1.09 1.12 0.66 1.76 1.93 3.31 2.42 1.73 1.49 2.04 0.26 0.47 18.271992 1.76 2.69 0.65 1.59 7.21 4.33 1.30 2.36 1.24 0.02 1.30 0.56 25.031987 0.41 1.85 0.75 0.46 7.53 2.97 1.67 1.52 2.82 0.07 0.06 0.79 20.901984 0.54 0.82 0.45 0.21 2.06 2.02 1.86 3.28 2.55 3.85 2.77 2.29 22.701983 2.03 0.64 0.93 1.11 2.36 1.46 1.31 0.28 0.78 4.39 1.58 1.63 18.521982 1.56 1.07 0.90 2.07 4.54 6.47 1.74 2.26 0.74 1.34 2.67 5.73 31.101956 0.52 1.25 0.10 1.99 2.16 1.20 0.56 0.44 0.53 1.82 0.57 0.66 11.801955 0.90 0.67 1.47 1.17 4.39 1.45 3.10 1.39 3.61 2.19 0.19 0.11 20.661954 0.69 0.15 0.12 3.54 4.26 1.67 0.17 1.16 0.57 3.11 0.78 0.92 17.141953 0.68 0.67 1.71 2.13 2.49 0.52 2.10 1.22 1.27 3.55 0.55 0.54 17.431952 0.60 0.49 0.81 1.09 1.92 0.19 1.65 0.98 2.39 0.06 2.55 1.69 14.42LTA 0.96 1.01 1.04 1.70 3.08 2.49 2.27 2.10 2.86 2.06 1.05 1.12 21.74
Briscoe County-Texas306 1997 0.65 2.34 0.67 7.35 4.17 3.31 2.01 4.05 2.65 1.18 0.73 1.94 31.05
1994 0.65 0.13 1.44 2.64 3.23 1.23 3.64 1.48 1.98 0.53 0.85 0.35 18.151993 1.28 0.62 0.96 1.02 1.95 1.54 4.00 2.81 0.71 1.13 0.56 0.50 17.061992 0.89 0.92 0.99 2.15 4.70 7.04 2.80 1.37 0.62 0.03 1.57 0.88 23.951987 0.70 1.42 0.55 0.23 5.37 2.31 2.80 3.82 2.95 0.68 0.37 2.18 23.371984 0.26 0.59 0.69 0.71 0.56 4.14 1.58 3.73 0.76 1.90 1.59 1.68 18.191983 1.90 1.47 0.41 0.94 1.91 2.23 0.64 0.66 1.32 5.71 0.42 0.61 18.211982 0.22 0.36 0.70 0.49 5.56 5.39 3.14 0.75 0.66 0.28 1.32 1.27 20.151956 0.30 2.63 0.18 0.45 4.97 1.54 2.10 0.61 0.43 0.85 0.45 0.65 15.161955 0.65 0.34 0.45 0.54 6.61 4.51 2.01 1.07 1.64 1.89 0.20 0.04 19.951954 0.48 0.09 0.19 2.23 4.07 1.44 0.92 2.16 0.29 0.62 0.06 0.58 13.141953 0.85 0.29 0.84 1.01 1.24 0.37 2.70 2.66 0.31 3.34 0.33 0.39 14.331952 1.07 0.24 0.41 2.79 1.09 1.55 2.37 0.89 0.68 0.00 1.18 0.58 12.85LTA 0.67 0.78 0.88 1.48 3.05 3.39 2.51 2.53 2.34 1.72 0.75 0.75 20.85
305 1997 0.56 0.64 0.08 4.79 2.48 2.99 2.59 3.22 2.90 0.99 0.62 2.07 23.921994 0.17 0.10 1.14 1.45 4.17 1.88 3.22 2.12 1.09 0.46 0.64 0.31 16.751993 0.98 0.35 0.51 0.58 1.59 1.71 3.89 2.85 2.02 1.22 0.55 0.34 16.601992 1.00 0.48 1.25 1.10 4.19 5.46 1.95 2.99 1.16 0.02 1.14 0.79 21.531987 0.76 0.87 0.31 0.15 3.79 1.94 1.26 4.70 3.52 0.82 0.33 1.63 20.091984 0.28 0.16 0.79 0.34 0.80 2.95 2.28 5.91 0.41 3.44 1.17 1.59 20.121983 1.39 1.04 0.47 0.63 1.33 1.74 0.56 0.59 0.82 2.97 0.43 0.47 12.411982 0.07 0.39 0.36 0.50 2.18 3.35 3.92 1.24 0.57 0.45 1.14 1.50 15.651956 0.21 1.20 0.13 0.40 2.60 1.85 1.04 1.05 0.20 0.57 0.03 0.14 9.421955 0.65 0.18 0.24 0.61 3.63 0.99 2.56 1.25 1.96 1.17 0.12 0.04 13.411954 0.22 0.22 0.17 0.99 2.41 0.99 0.61 2.86 0.56 1.45 0.02 0.27 10.761953 0.43 0.52 0.99 0.99 1.28 0.89 2.31 2.09 0.41 2.25 0.26 0.25 12.651952 0.55 0.26 0.52 1.95 0.87 1.67 1.94 1.70 0.79 0.00 1.11 0.43 11.78LTA 0.60 0.63 0.66 1.04 2.32 2.58 2.50 2.60 2.13 1.55 0.70 0.74 18.04
Castro County-Texas
P:\9345\GAM-Rpt.9-2002\Att_B1.xls B1-2

Attachment B1. Monthly rainfall in inches by county for selected years and long-term average (LTA) in the Southern Ogallala GAM region.
CTY/QID YEAR JAN FEB MAR APR MAY JUN JUL AUG SEP OCT NOV DEC ANNUAL
405 1997 0.48 1.57 0.11 3.92 2.64 3.57 2.46 2.47 1.43 1.33 0.63 1.94 22.561994 0.14 0.08 0.48 1.49 3.96 0.50 1.77 0.73 0.81 0.42 0.69 0.07 11.141993 1.41 0.42 0.89 1.05 1.01 0.91 3.82 1.41 0.94 0.89 0.46 0.12 13.311992 1.37 1.34 0.80 1.23 5.24 3.98 1.76 2.39 1.19 0.01 1.38 0.67 21.361987 0.50 1.37 0.28 0.32 5.22 2.63 2.09 4.61 2.91 0.60 0.24 1.87 22.651984 0.10 0.07 0.19 0.09 1.85 5.32 1.47 4.06 1.02 2.90 1.70 1.60 20.381983 1.81 0.52 0.07 0.72 1.93 1.38 0.85 0.74 0.50 5.37 1.10 0.35 15.341982 0.46 0.33 0.43 0.40 3.90 3.00 3.95 0.45 1.41 0.38 1.24 2.03 18.001956 0.07 1.23 0.04 0.23 1.60 2.10 0.95 0.62 0.23 1.10 0.02 0.29 8.471955 0.74 0.03 0.12 0.27 2.85 0.77 2.43 0.27 2.08 6.27 0.27 0.00 16.111954 0.04 0.05 0.01 1.91 3.31 0.60 0.41 2.32 0.33 2.56 0.04 0.33 11.921953 0.48 0.12 0.75 0.71 0.88 0.72 2.16 1.66 0.40 3.27 0.14 0.12 11.421952 0.65 0.23 0.03 1.50 1.46 0.97 1.97 1.04 1.08 0.00 0.78 0.07 9.76LTA 0.57 0.64 0.57 1.04 2.41 2.55 2.52 2.37 2.52 1.66 0.61 0.61 18.08
406 1997 0.46 2.23 0.22 6.40 3.64 4.26 2.21 1.96 2.01 1.15 0.53 1.98 27.061994 0.34 0.35 0.42 2.49 4.41 0.50 1.60 1.08 2.44 1.13 1.33 0.19 16.281993 1.31 1.06 0.71 1.25 1.85 1.50 2.46 1.93 0.51 1.30 0.35 0.60 14.841992 1.51 2.46 0.66 2.31 5.73 5.45 2.13 1.53 0.82 0.00 1.76 0.95 25.321987 0.75 2.75 0.64 0.40 5.02 2.82 3.95 2.10 2.71 0.85 1.29 1.94 25.241984 0.33 1.36 0.79 0.60 1.11 3.65 1.58 3.41 1.40 3.43 2.55 1.81 22.031983 2.35 1.45 0.92 1.18 2.96 1.65 1.02 0.67 0.52 7.70 1.49 2.31 24.231982 0.93 0.76 1.09 1.45 5.84 5.37 1.96 1.07 1.94 1.33 1.91 2.70 26.361956 1.41 2.80 0.94 1.94 2.53 2.33 1.47 0.79 0.55 1.24 2.37 1.05 19.431955 1.27 1.19 1.57 0.94 4.71 2.63 4.13 0.90 3.12 3.58 0.58 0.21 24.831954 1.65 0.20 0.31 2.64 4.69 0.64 0.46 1.84 0.31 1.59 0.86 2.00 17.201953 1.10 1.58 1.92 2.42 2.16 0.56 2.69 2.04 0.64 4.04 0.52 0.79 20.471952 1.89 1.32 1.15 2.98 2.48 0.96 3.18 1.28 1.31 0.03 1.70 1.38 19.67LTA 1.19 1.28 1.21 1.78 3.22 2.90 2.53 2.26 2.72 2.12 1.24 1.19 23.65
505&506 1997 0.21 2.77 0.27 4.02 2.85 4.80 1.35 2.99 1.85 1.34 0.49 1.74 24.671994 0.64 0.08 0.10 0.69 3.38 0.39 1.78 0.44 2.11 0.84 0.97 0.17 11.581993 1.19 0.97 0.92 1.42 1.31 1.24 3.36 1.71 1.14 1.18 0.21 0.36 14.971992 1.70 2.53 0.73 1.34 7.05 3.97 1.35 2.35 1.08 0.02 1.29 0.52 23.941987 0.38 1.75 0.75 0.49 7.21 2.79 1.34 1.66 2.76 0.15 0.06 0.73 20.061984 0.39 0.46 0.39 0.20 3.20 3.74 1.84 3.96 1.73 3.64 2.23 1.59 23.391983 1.65 0.55 0.60 0.78 1.61 1.18 1.01 0.32 0.54 4.41 2.09 0.91 15.661982 1.23 0.85 0.92 1.79 4.05 5.38 1.93 1.76 0.93 1.20 2.33 4.85 27.221956 0.48 1.33 0.09 1.66 2.07 1.21 0.59 0.52 0.43 1.80 0.54 0.56 11.271955 0.87 0.54 1.18 1.10 3.80 1.35 3.24 1.16 3.09 2.60 0.21 0.09 19.221954 0.59 0.13 0.10 3.28 4.72 1.51 0.19 1.57 0.53 3.16 0.67 0.91 17.341953 0.56 0.57 1.46 2.00 3.34 0.50 2.48 1.39 1.11 3.59 0.63 0.72 18.351952 0.56 0.49 0.69 1.21 1.96 0.25 1.98 0.84 2.26 0.05 2.22 1.50 14.01LTA 0.80 0.79 0.79 1.23 2.56 2.13 2.28 2.01 2.55 1.77 0.84 0.85 18.60
Cochran County-Texas
Crosby County-Texas
Dawson County-Texas
P:\9345\GAM-Rpt.9-2002\Att_B1.xls B1-3
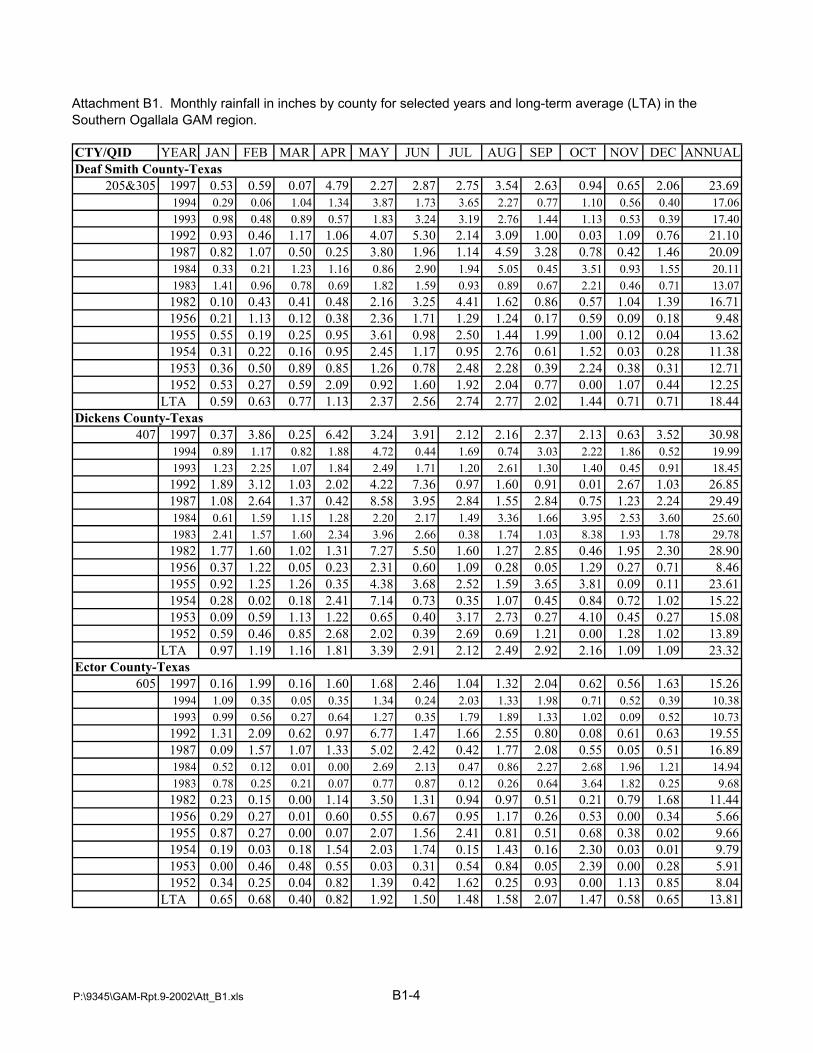
Attachment B1. Monthly rainfall in inches by county for selected years and long-term average (LTA) in the Southern Ogallala GAM region.
CTY/QID YEAR JAN FEB MAR APR MAY JUN JUL AUG SEP OCT NOV DEC ANNUAL
205&305 1997 0.53 0.59 0.07 4.79 2.27 2.87 2.75 3.54 2.63 0.94 0.65 2.06 23.691994 0.29 0.06 1.04 1.34 3.87 1.73 3.65 2.27 0.77 1.10 0.56 0.40 17.061993 0.98 0.48 0.89 0.57 1.83 3.24 3.19 2.76 1.44 1.13 0.53 0.39 17.401992 0.93 0.46 1.17 1.06 4.07 5.30 2.14 3.09 1.00 0.03 1.09 0.76 21.101987 0.82 1.07 0.50 0.25 3.80 1.96 1.14 4.59 3.28 0.78 0.42 1.46 20.091984 0.33 0.21 1.23 1.16 0.86 2.90 1.94 5.05 0.45 3.51 0.93 1.55 20.111983 1.41 0.96 0.78 0.69 1.82 1.59 0.93 0.89 0.67 2.21 0.46 0.71 13.071982 0.10 0.43 0.41 0.48 2.16 3.25 4.41 1.62 0.86 0.57 1.04 1.39 16.711956 0.21 1.13 0.12 0.38 2.36 1.71 1.29 1.24 0.17 0.59 0.09 0.18 9.481955 0.55 0.19 0.25 0.95 3.61 0.98 2.50 1.44 1.99 1.00 0.12 0.04 13.621954 0.31 0.22 0.16 0.95 2.45 1.17 0.95 2.76 0.61 1.52 0.03 0.28 11.381953 0.36 0.50 0.89 0.85 1.26 0.78 2.48 2.28 0.39 2.24 0.38 0.31 12.711952 0.53 0.27 0.59 2.09 0.92 1.60 1.92 2.04 0.77 0.00 1.07 0.44 12.25LTA 0.59 0.63 0.77 1.13 2.37 2.56 2.74 2.77 2.02 1.44 0.71 0.71 18.44
407 1997 0.37 3.86 0.25 6.42 3.24 3.91 2.12 2.16 2.37 2.13 0.63 3.52 30.981994 0.89 1.17 0.82 1.88 4.72 0.44 1.69 0.74 3.03 2.22 1.86 0.52 19.991993 1.23 2.25 1.07 1.84 2.49 1.71 1.20 2.61 1.30 1.40 0.45 0.91 18.451992 1.89 3.12 1.03 2.02 4.22 7.36 0.97 1.60 0.91 0.01 2.67 1.03 26.851987 1.08 2.64 1.37 0.42 8.58 3.95 2.84 1.55 2.84 0.75 1.23 2.24 29.491984 0.61 1.59 1.15 1.28 2.20 2.17 1.49 3.36 1.66 3.95 2.53 3.60 25.601983 2.41 1.57 1.60 2.34 3.96 2.66 0.38 1.74 1.03 8.38 1.93 1.78 29.781982 1.77 1.60 1.02 1.31 7.27 5.50 1.60 1.27 2.85 0.46 1.95 2.30 28.901956 0.37 1.22 0.05 0.23 2.31 0.60 1.09 0.28 0.05 1.29 0.27 0.71 8.461955 0.92 1.25 1.26 0.35 4.38 3.68 2.52 1.59 3.65 3.81 0.09 0.11 23.611954 0.28 0.02 0.18 2.41 7.14 0.73 0.35 1.07 0.45 0.84 0.72 1.02 15.221953 0.09 0.59 1.13 1.22 0.65 0.40 3.17 2.73 0.27 4.10 0.45 0.27 15.081952 0.59 0.46 0.85 2.68 2.02 0.39 2.69 0.69 1.21 0.00 1.28 1.02 13.89LTA 0.97 1.19 1.16 1.81 3.39 2.91 2.12 2.49 2.92 2.16 1.09 1.09 23.32
605 1997 0.16 1.99 0.16 1.60 1.68 2.46 1.04 1.32 2.04 0.62 0.56 1.63 15.261994 1.09 0.35 0.05 0.35 1.34 0.24 2.03 1.33 1.98 0.71 0.52 0.39 10.381993 0.99 0.56 0.27 0.64 1.27 0.35 1.79 1.89 1.33 1.02 0.09 0.52 10.731992 1.31 2.09 0.62 0.97 6.77 1.47 1.66 2.55 0.80 0.08 0.61 0.63 19.551987 0.09 1.57 1.07 1.33 5.02 2.42 0.42 1.77 2.08 0.55 0.05 0.51 16.891984 0.52 0.12 0.01 0.00 2.69 2.13 0.47 0.86 2.27 2.68 1.96 1.21 14.941983 0.78 0.25 0.21 0.07 0.77 0.87 0.12 0.26 0.64 3.64 1.82 0.25 9.681982 0.23 0.15 0.00 1.14 3.50 1.31 0.94 0.97 0.51 0.21 0.79 1.68 11.441956 0.29 0.27 0.01 0.60 0.55 0.67 0.95 1.17 0.26 0.53 0.00 0.34 5.661955 0.87 0.27 0.00 0.07 2.07 1.56 2.41 0.81 0.51 0.68 0.38 0.02 9.661954 0.19 0.03 0.18 1.54 2.03 1.74 0.15 1.43 0.16 2.30 0.03 0.01 9.791953 0.00 0.46 0.48 0.55 0.03 0.31 0.54 0.84 0.05 2.39 0.00 0.28 5.911952 0.34 0.25 0.04 0.82 1.39 0.42 1.62 0.25 0.93 0.00 1.13 0.85 8.04LTA 0.65 0.68 0.40 0.82 1.92 1.50 1.48 1.58 2.07 1.47 0.58 0.65 13.81
Dickens County-Texas
Ector County-Texas
Deaf Smith County-Texas
P:\9345\GAM-Rpt.9-2002\Att_B1.xls B1-4

Attachment B1. Monthly rainfall in inches by county for selected years and long-term average (LTA) in the Southern Ogallala GAM region.
CTY/QID YEAR JAN FEB MAR APR MAY JUN JUL AUG SEP OCT NOV DEC ANNUAL
306&406 1997 0.61 2.32 0.58 7.16 4.06 3.50 2.05 3.63 2.52 1.17 0.69 1.95 30.251994 0.59 0.17 1.24 2.61 3.47 1.08 3.23 1.40 2.07 0.65 0.95 0.32 17.781993 1.29 0.71 0.91 1.07 1.93 1.53 3.69 2.63 0.67 1.16 0.52 0.52 16.621992 1.01 1.23 0.92 2.18 4.91 6.72 2.67 1.40 0.66 0.02 1.61 0.89 24.221987 0.71 1.69 0.57 0.26 5.30 2.41 3.03 3.48 2.90 0.71 0.55 2.13 23.741984 0.27 0.74 0.71 0.69 0.67 4.04 1.58 3.67 0.89 2.21 1.78 1.71 18.961983 1.99 1.47 0.51 0.99 2.12 2.11 0.72 0.66 1.16 6.11 0.63 0.95 19.411982 0.36 0.44 0.78 0.68 5.62 5.39 2.90 0.81 0.92 0.49 1.44 1.56 21.391956 0.52 2.66 0.33 0.75 4.48 1.70 1.97 0.65 0.45 0.93 0.83 0.73 16.011955 0.77 0.51 0.67 0.62 6.23 4.13 2.43 1.04 1.94 2.23 0.28 0.07 20.931954 0.71 0.11 0.21 2.31 4.19 1.28 0.83 2.10 0.29 0.81 0.22 0.86 13.951953 0.90 0.55 1.06 1.29 1.42 0.41 2.70 2.54 0.38 3.48 0.37 0.47 15.561952 1.23 0.46 0.56 2.83 1.37 1.43 2.53 0.97 0.81 0.01 1.28 0.74 14.21LTA 0.77 0.88 0.94 1.54 3.09 3.29 2.52 2.48 2.42 1.80 0.85 0.83 21.41
505 1997 0.30 1.96 0.28 3.12 3.02 3.53 1.85 2.47 2.07 1.09 0.44 2.00 22.111994 0.55 0.04 0.09 0.66 3.22 0.36 1.93 0.46 1.80 0.77 0.85 0.09 10.811993 1.22 0.93 0.98 1.33 1.15 0.72 3.59 1.70 1.05 0.96 0.20 0.33 14.151992 1.56 2.15 0.91 0.76 6.68 3.14 1.45 2.33 0.72 0.01 1.26 0.43 21.411987 0.31 1.52 0.74 0.55 6.47 2.36 0.58 1.97 2.63 0.32 0.07 0.58 18.101984 0.35 0.37 0.38 0.20 3.49 4.17 1.84 4.13 1.53 3.59 2.10 1.41 23.561983 1.55 0.53 0.52 0.70 1.42 1.11 0.94 0.33 0.48 4.41 2.22 0.73 14.951982 0.47 0.32 0.98 1.15 2.90 2.82 2.37 0.59 1.37 0.88 1.53 2.78 18.151956 0.39 1.51 0.08 0.89 1.87 1.23 0.65 0.69 0.18 1.76 0.46 0.33 10.041955 0.81 0.22 0.49 0.94 2.41 1.12 3.56 0.62 1.87 3.54 0.26 0.04 15.871954 0.34 0.07 0.06 2.66 5.78 1.14 0.24 2.54 0.42 3.27 0.40 0.89 17.811953 0.27 0.34 0.87 1.70 5.33 0.45 3.38 1.79 0.73 3.67 0.82 1.15 20.491952 0.48 0.50 0.41 1.50 2.05 0.40 2.75 0.52 1.94 0.03 1.46 1.04 13.06LTA 0.76 0.73 0.73 1.12 2.43 2.04 2.28 1.99 2.48 1.69 0.78 0.78 17.82
406 1997 0.46 2.23 0.22 6.40 3.64 4.26 2.21 1.96 2.01 1.15 0.53 1.98 27.061994 0.34 0.35 0.42 2.49 4.41 0.50 1.60 1.08 2.44 1.13 1.33 0.19 16.281993 1.31 1.06 0.71 1.25 1.85 1.50 2.46 1.93 0.51 1.30 0.35 0.60 14.841992 1.51 2.46 0.66 2.31 5.73 5.45 2.13 1.53 0.82 0.00 1.76 0.95 25.321987 0.75 2.75 0.64 0.40 5.02 2.82 3.95 2.10 2.71 0.85 1.29 1.94 25.241984 0.33 1.36 0.79 0.60 1.11 3.65 1.58 3.41 1.40 3.43 2.55 1.81 22.031983 2.35 1.45 0.92 1.18 2.96 1.65 1.02 0.67 0.52 7.70 1.49 2.31 24.231982 0.93 0.76 1.09 1.45 5.84 5.37 1.96 1.07 1.94 1.33 1.91 2.70 26.361956 1.41 2.80 0.94 1.94 2.53 2.33 1.47 0.79 0.55 1.24 2.37 1.05 19.431955 1.27 1.19 1.57 0.94 4.71 2.63 4.13 0.90 3.12 3.58 0.58 0.21 24.831954 1.65 0.20 0.31 2.64 4.69 0.64 0.46 1.84 0.31 1.59 0.86 2.00 17.201953 1.10 1.58 1.92 2.42 2.16 0.56 2.69 2.04 0.64 4.04 0.52 0.79 20.471952 1.89 1.32 1.15 2.98 2.48 0.96 3.18 1.28 1.31 0.03 1.70 1.38 19.67LTA 1.19 1.28 1.21 1.78 3.22 2.90 2.53 2.26 2.72 2.12 1.24 1.19 23.65
Garza County-Texas
Floyd County-Texas
Gaines County-Texas
P:\9345\GAM-Rpt.9-2002\Att_B1.xls B1-5

Attachment B1. Monthly rainfall in inches by county for selected years and long-term average (LTA) in the Southern Ogallala GAM region.
CTY/QID YEAR JAN FEB MAR APR MAY JUN JUL AUG SEP OCT NOV DEC ANNUAL
606 1997 0.21 3.04 0.82 3.15 1.95 3.47 0.49 1.83 1.88 0.65 0.57 1.50 19.541994 1.82 0.35 0.11 0.93 2.63 0.42 0.84 0.34 2.43 1.20 0.72 0.53 12.321993 1.14 0.67 0.46 0.44 2.31 0.83 1.52 2.63 1.44 0.80 0.13 0.58 12.961992 1.91 2.99 0.70 1.66 4.70 3.43 1.98 3.68 0.60 0.21 0.30 0.50 22.671987 0.31 2.07 1.47 1.04 5.11 2.83 0.28 1.83 3.21 0.52 0.05 1.64 20.361984 0.61 0.28 0.37 0.01 1.12 1.39 1.06 0.68 3.26 2.89 2.23 1.72 15.621983 1.65 0.26 0.48 0.25 0.41 1.47 0.23 0.31 0.30 4.19 0.89 0.52 10.961982 0.73 0.38 0.38 0.75 4.27 2.65 0.92 1.19 1.10 0.66 0.99 2.00 16.031956 0.67 0.42 0.03 1.89 1.06 0.26 1.40 0.68 0.71 1.40 0.07 0.72 9.301955 0.83 0.63 0.03 0.56 2.05 1.53 1.87 1.87 0.68 1.13 0.21 0.08 11.461954 0.28 0.18 0.17 2.76 2.26 2.16 0.01 0.62 0.30 1.35 0.37 0.31 10.761953 0.00 0.33 1.86 0.64 0.80 0.30 1.14 1.70 0.36 1.96 0.02 0.15 9.261952 1.83 0.18 0.23 1.12 1.72 0.23 1.45 1.15 1.01 0.00 1.71 1.14 11.78LTA 0.88 0.96 0.81 1.43 2.51 1.93 1.77 1.96 2.58 1.84 0.84 0.94 18.45
306&406 1997 0.61 2.32 0.58 7.16 4.06 3.50 2.05 3.63 2.52 1.17 0.69 1.95 30.251994 0.59 0.17 1.24 2.61 3.47 1.08 3.23 1.40 2.07 0.65 0.95 0.32 17.781993 1.29 0.71 0.91 1.07 1.93 1.53 3.69 2.63 0.67 1.16 0.52 0.52 16.621992 1.01 1.23 0.92 2.18 4.91 6.72 2.67 1.40 0.66 0.02 1.61 0.89 24.221987 0.71 1.69 0.57 0.26 5.30 2.41 3.03 3.48 2.90 0.71 0.55 2.13 23.741984 0.27 0.74 0.71 0.69 0.67 4.04 1.58 3.67 0.89 2.21 1.78 1.71 18.961983 1.99 1.47 0.51 0.99 2.12 2.11 0.72 0.66 1.16 6.11 0.63 0.95 19.411982 0.36 0.44 0.78 0.68 5.62 5.39 2.90 0.81 0.92 0.49 1.44 1.56 21.391956 0.52 2.66 0.33 0.75 4.48 1.70 1.97 0.65 0.45 0.93 0.83 0.73 16.011955 0.77 0.51 0.67 0.62 6.23 4.13 2.43 1.04 1.94 2.23 0.28 0.07 20.931954 0.71 0.11 0.21 2.31 4.19 1.28 0.83 2.10 0.29 0.81 0.22 0.86 13.951953 0.90 0.55 1.06 1.29 1.42 0.41 2.70 2.54 0.38 3.48 0.37 0.47 15.561952 1.23 0.46 0.56 2.83 1.37 1.43 2.53 0.97 0.81 0.01 1.28 0.74 14.21LTA 0.77 0.88 0.94 1.54 3.09 3.29 2.52 2.48 2.42 1.80 0.85 0.83 21.41
405 1997 0.48 1.57 0.11 3.92 2.64 3.57 2.46 2.47 1.43 1.33 0.63 1.94 22.561994 0.14 0.08 0.48 1.49 3.96 0.50 1.77 0.73 0.81 0.42 0.69 0.07 11.141993 1.41 0.42 0.89 1.05 1.01 0.91 3.82 1.41 0.94 0.89 0.46 0.12 13.311992 1.37 1.34 0.80 1.23 5.24 3.98 1.76 2.39 1.19 0.01 1.38 0.67 21.361987 0.50 1.37 0.28 0.32 5.22 2.63 2.09 4.61 2.91 0.60 0.24 1.87 22.651984 0.10 0.07 0.19 0.09 1.85 5.32 1.47 4.06 1.02 2.90 1.70 1.60 20.381983 1.81 0.52 0.07 0.72 1.93 1.38 0.85 0.74 0.50 5.37 1.10 0.35 15.341982 0.46 0.33 0.43 0.40 3.90 3.00 3.95 0.45 1.41 0.38 1.24 2.03 18.001956 0.07 1.23 0.04 0.23 1.60 2.10 0.95 0.62 0.23 1.10 0.02 0.29 8.471955 0.74 0.03 0.12 0.27 2.85 0.77 2.43 0.27 2.08 6.27 0.27 0.00 16.111954 0.04 0.05 0.01 1.91 3.31 0.60 0.41 2.32 0.33 2.56 0.04 0.33 11.921953 0.48 0.12 0.75 0.71 0.88 0.72 2.16 1.66 0.40 3.27 0.14 0.12 11.421952 0.65 0.23 0.03 1.50 1.46 0.97 1.97 1.04 1.08 0.00 0.78 0.07 9.76LTA 0.57 0.64 0.57 1.04 2.41 2.55 2.52 2.37 2.52 1.66 0.61 0.61 18.08
Glasscock County-Texas
Hale County-Texas
Hockley County-Texas
P:\9345\GAM-Rpt.9-2002\Att_B1.xls B1-6
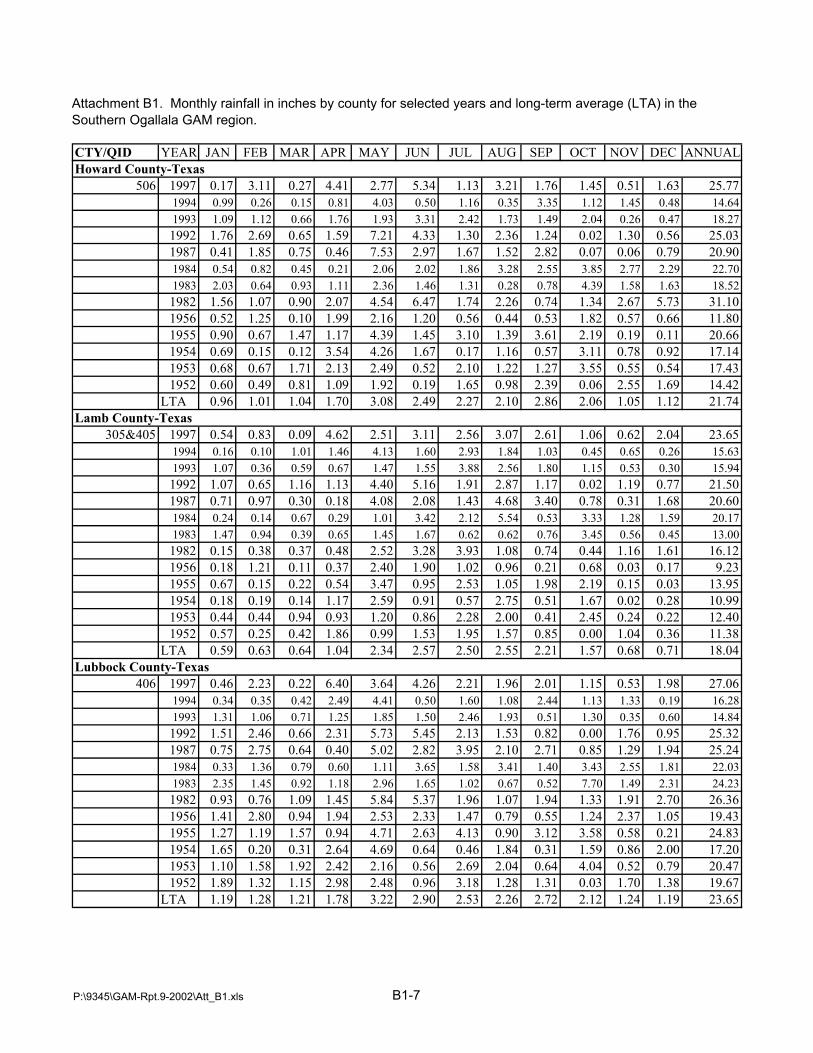
Attachment B1. Monthly rainfall in inches by county for selected years and long-term average (LTA) in the Southern Ogallala GAM region.
CTY/QID YEAR JAN FEB MAR APR MAY JUN JUL AUG SEP OCT NOV DEC ANNUAL
506 1997 0.17 3.11 0.27 4.41 2.77 5.34 1.13 3.21 1.76 1.45 0.51 1.63 25.771994 0.99 0.26 0.15 0.81 4.03 0.50 1.16 0.35 3.35 1.12 1.45 0.48 14.641993 1.09 1.12 0.66 1.76 1.93 3.31 2.42 1.73 1.49 2.04 0.26 0.47 18.271992 1.76 2.69 0.65 1.59 7.21 4.33 1.30 2.36 1.24 0.02 1.30 0.56 25.031987 0.41 1.85 0.75 0.46 7.53 2.97 1.67 1.52 2.82 0.07 0.06 0.79 20.901984 0.54 0.82 0.45 0.21 2.06 2.02 1.86 3.28 2.55 3.85 2.77 2.29 22.701983 2.03 0.64 0.93 1.11 2.36 1.46 1.31 0.28 0.78 4.39 1.58 1.63 18.521982 1.56 1.07 0.90 2.07 4.54 6.47 1.74 2.26 0.74 1.34 2.67 5.73 31.101956 0.52 1.25 0.10 1.99 2.16 1.20 0.56 0.44 0.53 1.82 0.57 0.66 11.801955 0.90 0.67 1.47 1.17 4.39 1.45 3.10 1.39 3.61 2.19 0.19 0.11 20.661954 0.69 0.15 0.12 3.54 4.26 1.67 0.17 1.16 0.57 3.11 0.78 0.92 17.141953 0.68 0.67 1.71 2.13 2.49 0.52 2.10 1.22 1.27 3.55 0.55 0.54 17.431952 0.60 0.49 0.81 1.09 1.92 0.19 1.65 0.98 2.39 0.06 2.55 1.69 14.42LTA 0.96 1.01 1.04 1.70 3.08 2.49 2.27 2.10 2.86 2.06 1.05 1.12 21.74
305&405 1997 0.54 0.83 0.09 4.62 2.51 3.11 2.56 3.07 2.61 1.06 0.62 2.04 23.651994 0.16 0.10 1.01 1.46 4.13 1.60 2.93 1.84 1.03 0.45 0.65 0.26 15.631993 1.07 0.36 0.59 0.67 1.47 1.55 3.88 2.56 1.80 1.15 0.53 0.30 15.941992 1.07 0.65 1.16 1.13 4.40 5.16 1.91 2.87 1.17 0.02 1.19 0.77 21.501987 0.71 0.97 0.30 0.18 4.08 2.08 1.43 4.68 3.40 0.78 0.31 1.68 20.601984 0.24 0.14 0.67 0.29 1.01 3.42 2.12 5.54 0.53 3.33 1.28 1.59 20.171983 1.47 0.94 0.39 0.65 1.45 1.67 0.62 0.62 0.76 3.45 0.56 0.45 13.001982 0.15 0.38 0.37 0.48 2.52 3.28 3.93 1.08 0.74 0.44 1.16 1.61 16.121956 0.18 1.21 0.11 0.37 2.40 1.90 1.02 0.96 0.21 0.68 0.03 0.17 9.231955 0.67 0.15 0.22 0.54 3.47 0.95 2.53 1.05 1.98 2.19 0.15 0.03 13.951954 0.18 0.19 0.14 1.17 2.59 0.91 0.57 2.75 0.51 1.67 0.02 0.28 10.991953 0.44 0.44 0.94 0.93 1.20 0.86 2.28 2.00 0.41 2.45 0.24 0.22 12.401952 0.57 0.25 0.42 1.86 0.99 1.53 1.95 1.57 0.85 0.00 1.04 0.36 11.38LTA 0.59 0.63 0.64 1.04 2.34 2.57 2.50 2.55 2.21 1.57 0.68 0.71 18.04
406 1997 0.46 2.23 0.22 6.40 3.64 4.26 2.21 1.96 2.01 1.15 0.53 1.98 27.061994 0.34 0.35 0.42 2.49 4.41 0.50 1.60 1.08 2.44 1.13 1.33 0.19 16.281993 1.31 1.06 0.71 1.25 1.85 1.50 2.46 1.93 0.51 1.30 0.35 0.60 14.841992 1.51 2.46 0.66 2.31 5.73 5.45 2.13 1.53 0.82 0.00 1.76 0.95 25.321987 0.75 2.75 0.64 0.40 5.02 2.82 3.95 2.10 2.71 0.85 1.29 1.94 25.241984 0.33 1.36 0.79 0.60 1.11 3.65 1.58 3.41 1.40 3.43 2.55 1.81 22.031983 2.35 1.45 0.92 1.18 2.96 1.65 1.02 0.67 0.52 7.70 1.49 2.31 24.231982 0.93 0.76 1.09 1.45 5.84 5.37 1.96 1.07 1.94 1.33 1.91 2.70 26.361956 1.41 2.80 0.94 1.94 2.53 2.33 1.47 0.79 0.55 1.24 2.37 1.05 19.431955 1.27 1.19 1.57 0.94 4.71 2.63 4.13 0.90 3.12 3.58 0.58 0.21 24.831954 1.65 0.20 0.31 2.64 4.69 0.64 0.46 1.84 0.31 1.59 0.86 2.00 17.201953 1.10 1.58 1.92 2.42 2.16 0.56 2.69 2.04 0.64 4.04 0.52 0.79 20.471952 1.89 1.32 1.15 2.98 2.48 0.96 3.18 1.28 1.31 0.03 1.70 1.38 19.67LTA 1.19 1.28 1.21 1.78 3.22 2.90 2.53 2.26 2.72 2.12 1.24 1.19 23.65
Howard County-Texas
Lamb County-Texas
Lubbock County-Texas
P:\9345\GAM-Rpt.9-2002\Att_B1.xls B1-7

Attachment B1. Monthly rainfall in inches by county for selected years and long-term average (LTA) in the Southern Ogallala GAM region.
CTY/QID YEAR JAN FEB MAR APR MAY JUN JUL AUG SEP OCT NOV DEC ANNUAL
406 1997 0.46 2.23 0.22 6.40 3.64 4.26 2.21 1.96 2.01 1.15 0.53 1.98 27.061994 0.34 0.35 0.42 2.49 4.41 0.50 1.60 1.08 2.44 1.13 1.33 0.19 16.281993 1.31 1.06 0.71 1.25 1.85 1.50 2.46 1.93 0.51 1.30 0.35 0.60 14.841992 1.51 2.46 0.66 2.31 5.73 5.45 2.13 1.53 0.82 0.00 1.76 0.95 25.321987 0.75 2.75 0.64 0.40 5.02 2.82 3.95 2.10 2.71 0.85 1.29 1.94 25.241984 0.33 1.36 0.79 0.60 1.11 3.65 1.58 3.41 1.40 3.43 2.55 1.81 22.031983 2.35 1.45 0.92 1.18 2.96 1.65 1.02 0.67 0.52 7.70 1.49 2.31 24.231982 0.93 0.76 1.09 1.45 5.84 5.37 1.96 1.07 1.94 1.33 1.91 2.70 26.361956 1.41 2.80 0.94 1.94 2.53 2.33 1.47 0.79 0.55 1.24 2.37 1.05 19.431955 1.27 1.19 1.57 0.94 4.71 2.63 4.13 0.90 3.12 3.58 0.58 0.21 24.831954 1.65 0.20 0.31 2.64 4.69 0.64 0.46 1.84 0.31 1.59 0.86 2.00 17.201953 1.10 1.58 1.92 2.42 2.16 0.56 2.69 2.04 0.64 4.04 0.52 0.79 20.471952 1.89 1.32 1.15 2.98 2.48 0.96 3.18 1.28 1.31 0.03 1.70 1.38 19.67LTA 1.19 1.28 1.21 1.78 3.22 2.90 2.53 2.26 2.72 2.12 1.24 1.19 23.65
505&506 1997 0.21 2.77 0.27 4.02 2.85 4.80 1.35 2.99 1.85 1.34 0.49 1.74 24.671994 0.64 0.08 0.10 0.69 3.38 0.39 1.78 0.44 2.11 0.84 0.97 0.17 11.581993 1.19 0.97 0.92 1.42 1.31 1.24 3.36 1.71 1.14 1.18 0.21 0.36 14.971992 1.70 2.53 0.73 1.34 7.05 3.97 1.35 2.35 1.08 0.02 1.29 0.52 23.941987 0.38 1.75 0.75 0.49 7.21 2.79 1.34 1.66 2.76 0.15 0.06 0.73 20.061984 0.39 0.46 0.39 0.20 3.20 3.74 1.84 3.96 1.73 3.64 2.23 1.59 23.391983 1.65 0.55 0.60 0.78 1.61 1.18 1.01 0.32 0.54 4.41 2.09 0.91 15.661982 1.23 0.85 0.92 1.79 4.05 5.38 1.93 1.76 0.93 1.20 2.33 4.85 27.221956 0.48 1.33 0.09 1.66 2.07 1.21 0.59 0.52 0.43 1.80 0.54 0.56 11.271955 0.87 0.54 1.18 1.10 3.80 1.35 3.24 1.16 3.09 2.60 0.21 0.09 19.221954 0.59 0.13 0.10 3.28 4.72 1.51 0.19 1.57 0.53 3.16 0.67 0.91 17.341953 0.56 0.57 1.46 2.00 3.34 0.50 2.48 1.39 1.11 3.59 0.63 0.72 18.351952 0.56 0.49 0.69 1.21 1.96 0.25 1.98 0.84 2.26 0.05 2.22 1.50 14.01LTA 0.80 0.79 0.79 1.23 2.56 2.13 2.28 2.01 2.55 1.77 0.84 0.85 18.60
605&606 1997 0.19 2.52 0.49 2.38 1.82 2.97 0.77 1.58 1.96 0.64 0.57 1.57 17.401994 1.46 0.35 0.08 0.64 1.99 0.33 1.44 0.84 2.21 0.96 0.62 0.46 11.351993 1.07 0.62 0.37 0.54 1.79 0.59 1.66 2.26 1.39 0.91 0.11 0.55 11.851992 1.61 2.54 0.66 1.32 5.74 2.45 1.82 3.12 0.70 0.15 0.46 0.57 21.111987 0.20 1.82 1.27 1.19 5.07 2.63 0.35 1.80 2.65 0.54 0.05 1.08 18.631984 0.57 0.20 0.19 0.01 1.91 1.76 0.77 0.77 2.77 2.79 2.10 1.47 15.281983 1.22 0.26 0.35 0.16 0.59 1.17 0.18 0.29 0.47 3.92 1.36 0.39 10.321982 0.48 0.27 0.19 0.95 3.89 1.98 0.93 1.08 0.81 0.44 0.89 1.84 13.741956 0.48 0.35 0.02 1.25 0.81 0.47 1.18 0.93 0.49 0.97 0.04 0.53 7.481955 0.85 0.45 0.02 0.32 2.06 1.55 2.14 1.34 0.60 0.91 0.30 0.05 10.561954 0.24 0.11 0.18 2.15 2.15 1.95 0.08 1.03 0.23 1.83 0.20 0.16 10.281953 0.00 0.40 1.17 0.60 0.42 0.31 0.84 1.27 0.21 2.18 0.01 0.22 7.591952 1.09 0.22 0.14 0.97 1.56 0.33 1.54 0.70 0.97 0.00 1.42 1.00 9.91LTA 0.77 0.82 0.60 1.13 2.22 1.72 1.63 1.77 2.32 1.66 0.71 0.79 16.13
Martin County-Texas
Midland County
Lynn County-Texas
P:\9345\GAM-Rpt.9-2002\Att_B1.xls B1-8
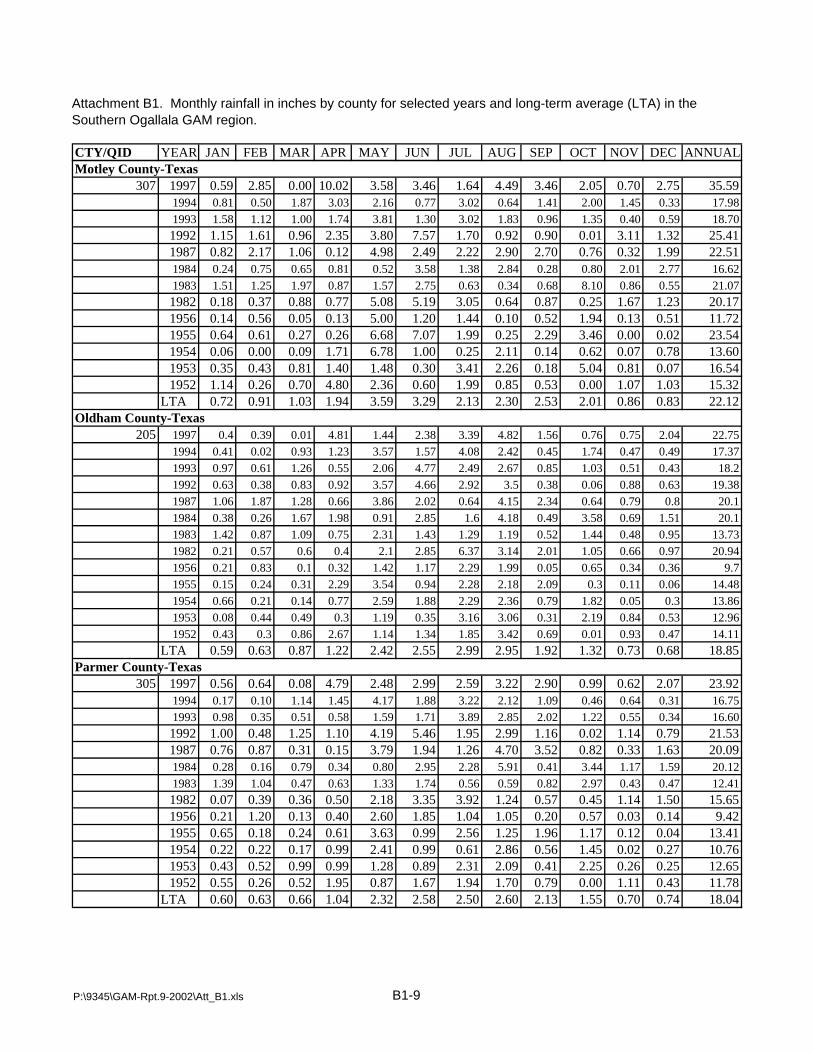
Attachment B1. Monthly rainfall in inches by county for selected years and long-term average (LTA) in the Southern Ogallala GAM region.
CTY/QID YEAR JAN FEB MAR APR MAY JUN JUL AUG SEP OCT NOV DEC ANNUAL
307 1997 0.59 2.85 0.00 10.02 3.58 3.46 1.64 4.49 3.46 2.05 0.70 2.75 35.591994 0.81 0.50 1.87 3.03 2.16 0.77 3.02 0.64 1.41 2.00 1.45 0.33 17.981993 1.58 1.12 1.00 1.74 3.81 1.30 3.02 1.83 0.96 1.35 0.40 0.59 18.701992 1.15 1.61 0.96 2.35 3.80 7.57 1.70 0.92 0.90 0.01 3.11 1.32 25.411987 0.82 2.17 1.06 0.12 4.98 2.49 2.22 2.90 2.70 0.76 0.32 1.99 22.511984 0.24 0.75 0.65 0.81 0.52 3.58 1.38 2.84 0.28 0.80 2.01 2.77 16.621983 1.51 1.25 1.97 0.87 1.57 2.75 0.63 0.34 0.68 8.10 0.86 0.55 21.071982 0.18 0.37 0.88 0.77 5.08 5.19 3.05 0.64 0.87 0.25 1.67 1.23 20.171956 0.14 0.56 0.05 0.13 5.00 1.20 1.44 0.10 0.52 1.94 0.13 0.51 11.721955 0.64 0.61 0.27 0.26 6.68 7.07 1.99 0.25 2.29 3.46 0.00 0.02 23.541954 0.06 0.00 0.09 1.71 6.78 1.00 0.25 2.11 0.14 0.62 0.07 0.78 13.601953 0.35 0.43 0.81 1.40 1.48 0.30 3.41 2.26 0.18 5.04 0.81 0.07 16.541952 1.14 0.26 0.70 4.80 2.36 0.60 1.99 0.85 0.53 0.00 1.07 1.03 15.32
LTA 0.72 0.91 1.03 1.94 3.59 3.29 2.13 2.30 2.53 2.01 0.86 0.83 22.12
205 1997 0.4 0.39 0.01 4.81 1.44 2.38 3.39 4.82 1.56 0.76 0.75 2.04 22.751994 0.41 0.02 0.93 1.23 3.57 1.57 4.08 2.42 0.45 1.74 0.47 0.49 17.371993 0.97 0.61 1.26 0.55 2.06 4.77 2.49 2.67 0.85 1.03 0.51 0.43 18.21992 0.63 0.38 0.83 0.92 3.57 4.66 2.92 3.5 0.38 0.06 0.88 0.63 19.381987 1.06 1.87 1.28 0.66 3.86 2.02 0.64 4.15 2.34 0.64 0.79 0.8 20.11984 0.38 0.26 1.67 1.98 0.91 2.85 1.6 4.18 0.49 3.58 0.69 1.51 20.11983 1.42 0.87 1.09 0.75 2.31 1.43 1.29 1.19 0.52 1.44 0.48 0.95 13.731982 0.21 0.57 0.6 0.4 2.1 2.85 6.37 3.14 2.01 1.05 0.66 0.97 20.941956 0.21 0.83 0.1 0.32 1.42 1.17 2.29 1.99 0.05 0.65 0.34 0.36 9.71955 0.15 0.24 0.31 2.29 3.54 0.94 2.28 2.18 2.09 0.3 0.11 0.06 14.481954 0.66 0.21 0.14 0.77 2.59 1.88 2.29 2.36 0.79 1.82 0.05 0.3 13.861953 0.08 0.44 0.49 0.3 1.19 0.35 3.16 3.06 0.31 2.19 0.84 0.53 12.961952 0.43 0.3 0.86 2.67 1.14 1.34 1.85 3.42 0.69 0.01 0.93 0.47 14.11
LTA 0.59 0.63 0.87 1.22 2.42 2.55 2.99 2.95 1.92 1.32 0.73 0.68 18.85
305 1997 0.56 0.64 0.08 4.79 2.48 2.99 2.59 3.22 2.90 0.99 0.62 2.07 23.921994 0.17 0.10 1.14 1.45 4.17 1.88 3.22 2.12 1.09 0.46 0.64 0.31 16.751993 0.98 0.35 0.51 0.58 1.59 1.71 3.89 2.85 2.02 1.22 0.55 0.34 16.601992 1.00 0.48 1.25 1.10 4.19 5.46 1.95 2.99 1.16 0.02 1.14 0.79 21.531987 0.76 0.87 0.31 0.15 3.79 1.94 1.26 4.70 3.52 0.82 0.33 1.63 20.091984 0.28 0.16 0.79 0.34 0.80 2.95 2.28 5.91 0.41 3.44 1.17 1.59 20.121983 1.39 1.04 0.47 0.63 1.33 1.74 0.56 0.59 0.82 2.97 0.43 0.47 12.411982 0.07 0.39 0.36 0.50 2.18 3.35 3.92 1.24 0.57 0.45 1.14 1.50 15.651956 0.21 1.20 0.13 0.40 2.60 1.85 1.04 1.05 0.20 0.57 0.03 0.14 9.421955 0.65 0.18 0.24 0.61 3.63 0.99 2.56 1.25 1.96 1.17 0.12 0.04 13.411954 0.22 0.22 0.17 0.99 2.41 0.99 0.61 2.86 0.56 1.45 0.02 0.27 10.761953 0.43 0.52 0.99 0.99 1.28 0.89 2.31 2.09 0.41 2.25 0.26 0.25 12.651952 0.55 0.26 0.52 1.95 0.87 1.67 1.94 1.70 0.79 0.00 1.11 0.43 11.78
LTA 0.60 0.63 0.66 1.04 2.32 2.58 2.50 2.60 2.13 1.55 0.70 0.74 18.04
Parmer County-Texas
Motley County-Texas
Oldham County-Texas
P:\9345\GAM-Rpt.9-2002\Att_B1.xls B1-9

Attachment B1. Monthly rainfall in inches by county for selected years and long-term average (LTA) in the Southern Ogallala GAM region.
CTY/QID YEAR JAN FEB MAR APR MAY JUN JUL AUG SEP OCT NOV DEC ANNUAL
206 1997 0.52 0.79 0 7.64 2.82 2.5 3.1 3.74 1.85 0.91 1 2.08 26.961994 0.78 0.1 1.17 1.8 1.75 1.55 4.21 2.69 1.53 1.34 0.81 0.52 18.241993 1.05 0.78 1.37 0.82 2.38 4.04 3.61 3.3 1.71 0.48 0.68 0.52 20.741992 0.61 0.41 1.16 2.07 3.58 6.22 2.59 3.93 0.39 0.13 1.46 0.89 23.441987 1 1.21 1.92 0.43 4.99 4.07 1.91 3.67 3.72 1.11 0.59 1.6 26.221984 0.46 0.54 1.55 1.33 0.56 4.14 1.01 3.17 0.9 2.99 0.96 1.46 19.071983 1.26 1.87 1.16 1.27 2.63 2.9 0.55 1.02 0.75 2.47 0.57 0.64 17.11982 0.14 0.9 0.74 0.63 4.28 4.72 6.43 1.41 1.71 0.5 0.75 0.99 23.191956 0.09 0.99 0.07 0.14 2.66 1.75 2.94 1 0.55 0.38 0 0.03 10.61955 0.24 0.09 0.11 0.85 5.43 2.59 2.02 1.3 2.23 0.15 0.08 0.06 15.131954 0.24 0.03 0.14 1.73 4.67 2.01 1.49 2.53 0.47 1.04 0 0.22 14.561953 0.52 0.35 0.47 0.79 0.81 0.31 3.77 2.48 0.21 3.87 0.44 0.57 14.61952 0.33 0.33 0.6 2.46 1.26 2.43 1.99 2.12 0.48 0 0.98 0.55 13.52
LTA 0.58 0.73 0.96 1.42 3.05 3.26 2.97 2.81 1.98 1.58 0.76 0.67 20.76
206&306 1997 0.59 1.57 0.34 7.50 3.50 2.91 2.56 3.90 2.25 1.05 0.87 2.01 29.011994 0.72 0.12 1.31 2.22 2.49 1.39 3.93 2.09 1.76 0.94 0.83 0.44 18.201993 1.17 0.70 1.17 0.92 2.17 2.79 3.81 3.06 1.21 0.81 0.62 0.51 18.901992 0.75 0.67 1.08 2.11 4.14 6.63 2.70 2.65 0.51 0.08 1.52 0.89 23.701987 0.85 1.32 1.24 0.33 5.18 3.19 2.36 3.75 3.34 0.90 0.48 1.89 24.801984 0.36 0.57 1.12 1.02 0.56 4.14 1.30 3.45 0.83 2.45 1.28 1.57 18.631983 1.58 1.67 0.79 1.11 2.27 2.57 0.60 0.84 1.04 4.09 0.50 0.63 17.661982 0.18 0.63 0.72 0.56 4.92 5.06 4.79 1.08 1.19 0.39 1.04 1.13 21.671956 0.20 1.81 0.13 0.30 3.82 1.65 2.52 0.81 0.49 0.62 0.23 0.34 12.881955 0.45 0.22 0.28 0.70 6.02 3.55 2.02 1.19 1.94 1.02 0.14 0.05 17.541954 0.36 0.06 0.17 1.98 4.37 1.73 1.21 2.35 0.38 0.83 0.03 0.40 13.851953 0.69 0.32 0.66 0.90 1.03 0.34 3.24 2.57 0.26 3.61 0.39 0.48 14.471952 0.70 0.29 0.51 2.63 1.18 1.99 2.18 1.51 0.58 0.00 1.08 0.57 13.19
LTA 0.62 0.75 0.92 1.45 3.05 3.33 2.74 2.67 2.16 1.65 0.76 0.71 20.81
306 1997 0.65 2.34 0.67 7.35 4.17 3.31 2.01 4.05 2.65 1.18 0.73 1.94 31.051994 0.65 0.13 1.44 2.64 3.23 1.23 3.64 1.48 1.98 0.53 0.85 0.35 18.151993 1.28 0.62 0.96 1.02 1.95 1.54 4.00 2.81 0.71 1.13 0.56 0.50 17.061992 0.89 0.92 0.99 2.15 4.70 7.04 2.80 1.37 0.62 0.03 1.57 0.88 23.951987 0.70 1.42 0.55 0.23 5.37 2.31 2.80 3.82 2.95 0.68 0.37 2.18 23.371984 0.26 0.59 0.69 0.71 0.56 4.14 1.58 3.73 0.76 1.90 1.59 1.68 18.191983 1.90 1.47 0.41 0.94 1.91 2.23 0.64 0.66 1.32 5.71 0.42 0.61 18.211982 0.22 0.36 0.70 0.49 5.56 5.39 3.14 0.75 0.66 0.28 1.32 1.27 20.151956 0.30 2.63 0.18 0.45 4.97 1.54 2.10 0.61 0.43 0.85 0.45 0.65 15.161955 0.65 0.34 0.45 0.54 6.61 4.51 2.01 1.07 1.64 1.89 0.20 0.04 19.951954 0.48 0.09 0.19 2.23 4.07 1.44 0.92 2.16 0.29 0.62 0.06 0.58 13.141953 0.85 0.29 0.84 1.01 1.24 0.37 2.70 2.66 0.31 3.34 0.33 0.39 14.331952 1.07 0.24 0.41 2.79 1.09 1.55 2.37 0.89 0.68 0.00 1.18 0.58 12.85LTA 0.67 0.78 0.88 1.48 3.05 3.39 2.51 2.53 2.34 1.72 0.75 0.75 20.85
Swisher County-Texas
Potter County-Texas
Randall County-Texas
P:\9345\GAM-Rpt.9-2002\Att_B1.xls B1-10
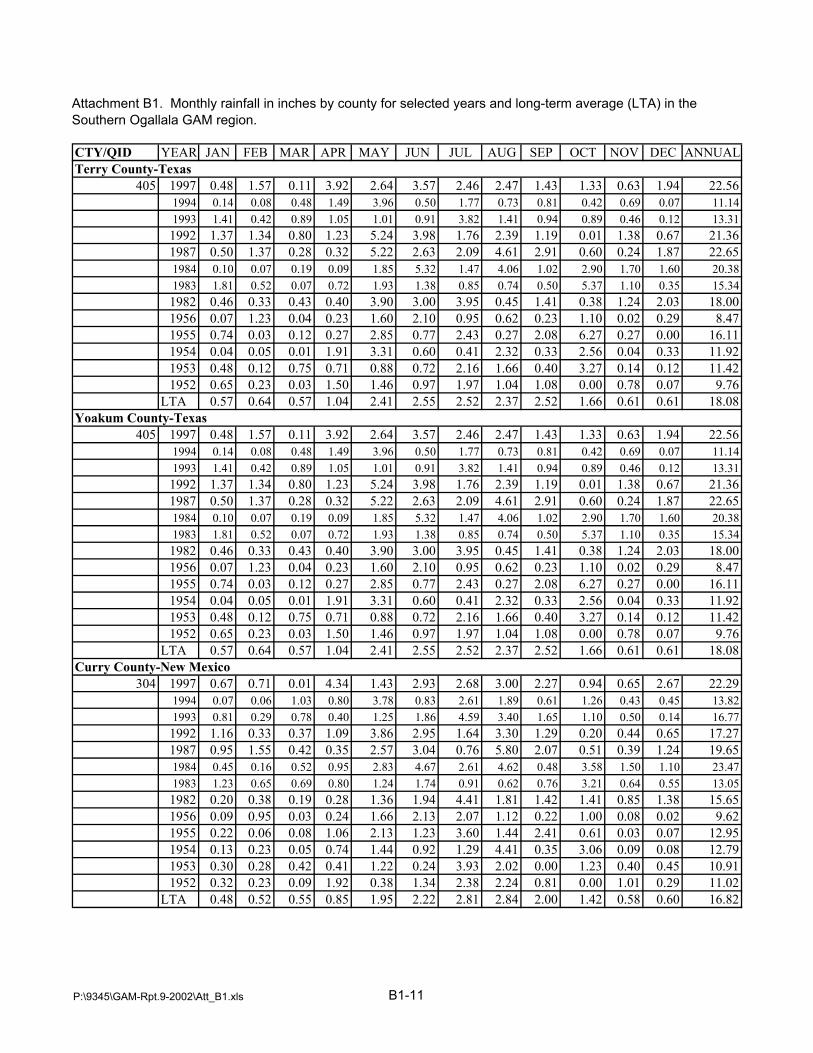
Attachment B1. Monthly rainfall in inches by county for selected years and long-term average (LTA) in the Southern Ogallala GAM region.
CTY/QID YEAR JAN FEB MAR APR MAY JUN JUL AUG SEP OCT NOV DEC ANNUAL
405 1997 0.48 1.57 0.11 3.92 2.64 3.57 2.46 2.47 1.43 1.33 0.63 1.94 22.561994 0.14 0.08 0.48 1.49 3.96 0.50 1.77 0.73 0.81 0.42 0.69 0.07 11.141993 1.41 0.42 0.89 1.05 1.01 0.91 3.82 1.41 0.94 0.89 0.46 0.12 13.311992 1.37 1.34 0.80 1.23 5.24 3.98 1.76 2.39 1.19 0.01 1.38 0.67 21.361987 0.50 1.37 0.28 0.32 5.22 2.63 2.09 4.61 2.91 0.60 0.24 1.87 22.651984 0.10 0.07 0.19 0.09 1.85 5.32 1.47 4.06 1.02 2.90 1.70 1.60 20.381983 1.81 0.52 0.07 0.72 1.93 1.38 0.85 0.74 0.50 5.37 1.10 0.35 15.341982 0.46 0.33 0.43 0.40 3.90 3.00 3.95 0.45 1.41 0.38 1.24 2.03 18.001956 0.07 1.23 0.04 0.23 1.60 2.10 0.95 0.62 0.23 1.10 0.02 0.29 8.471955 0.74 0.03 0.12 0.27 2.85 0.77 2.43 0.27 2.08 6.27 0.27 0.00 16.111954 0.04 0.05 0.01 1.91 3.31 0.60 0.41 2.32 0.33 2.56 0.04 0.33 11.921953 0.48 0.12 0.75 0.71 0.88 0.72 2.16 1.66 0.40 3.27 0.14 0.12 11.421952 0.65 0.23 0.03 1.50 1.46 0.97 1.97 1.04 1.08 0.00 0.78 0.07 9.76LTA 0.57 0.64 0.57 1.04 2.41 2.55 2.52 2.37 2.52 1.66 0.61 0.61 18.08
405 1997 0.48 1.57 0.11 3.92 2.64 3.57 2.46 2.47 1.43 1.33 0.63 1.94 22.561994 0.14 0.08 0.48 1.49 3.96 0.50 1.77 0.73 0.81 0.42 0.69 0.07 11.141993 1.41 0.42 0.89 1.05 1.01 0.91 3.82 1.41 0.94 0.89 0.46 0.12 13.311992 1.37 1.34 0.80 1.23 5.24 3.98 1.76 2.39 1.19 0.01 1.38 0.67 21.361987 0.50 1.37 0.28 0.32 5.22 2.63 2.09 4.61 2.91 0.60 0.24 1.87 22.651984 0.10 0.07 0.19 0.09 1.85 5.32 1.47 4.06 1.02 2.90 1.70 1.60 20.381983 1.81 0.52 0.07 0.72 1.93 1.38 0.85 0.74 0.50 5.37 1.10 0.35 15.341982 0.46 0.33 0.43 0.40 3.90 3.00 3.95 0.45 1.41 0.38 1.24 2.03 18.001956 0.07 1.23 0.04 0.23 1.60 2.10 0.95 0.62 0.23 1.10 0.02 0.29 8.471955 0.74 0.03 0.12 0.27 2.85 0.77 2.43 0.27 2.08 6.27 0.27 0.00 16.111954 0.04 0.05 0.01 1.91 3.31 0.60 0.41 2.32 0.33 2.56 0.04 0.33 11.921953 0.48 0.12 0.75 0.71 0.88 0.72 2.16 1.66 0.40 3.27 0.14 0.12 11.421952 0.65 0.23 0.03 1.50 1.46 0.97 1.97 1.04 1.08 0.00 0.78 0.07 9.76LTA 0.57 0.64 0.57 1.04 2.41 2.55 2.52 2.37 2.52 1.66 0.61 0.61 18.08
304 1997 0.67 0.71 0.01 4.34 1.43 2.93 2.68 3.00 2.27 0.94 0.65 2.67 22.291994 0.07 0.06 1.03 0.80 3.78 0.83 2.61 1.89 0.61 1.26 0.43 0.45 13.821993 0.81 0.29 0.78 0.40 1.25 1.86 4.59 3.40 1.65 1.10 0.50 0.14 16.771992 1.16 0.33 0.37 1.09 3.86 2.95 1.64 3.30 1.29 0.20 0.44 0.65 17.271987 0.95 1.55 0.42 0.35 2.57 3.04 0.76 5.80 2.07 0.51 0.39 1.24 19.651984 0.45 0.16 0.52 0.95 2.83 4.67 2.61 4.62 0.48 3.58 1.50 1.10 23.471983 1.23 0.65 0.69 0.80 1.24 1.74 0.91 0.62 0.76 3.21 0.64 0.55 13.051982 0.20 0.38 0.19 0.28 1.36 1.94 4.41 1.81 1.42 1.41 0.85 1.38 15.651956 0.09 0.95 0.03 0.24 1.66 2.13 2.07 1.12 0.22 1.00 0.08 0.02 9.621955 0.22 0.06 0.08 1.06 2.13 1.23 3.60 1.44 2.41 0.61 0.03 0.07 12.951954 0.13 0.23 0.05 0.74 1.44 0.92 1.29 4.41 0.35 3.06 0.09 0.08 12.791953 0.30 0.28 0.42 0.41 1.22 0.24 3.93 2.02 0.00 1.23 0.40 0.45 10.911952 0.32 0.23 0.09 1.92 0.38 1.34 2.38 2.24 0.81 0.00 1.01 0.29 11.02LTA 0.48 0.52 0.55 0.85 1.95 2.22 2.81 2.84 2.00 1.42 0.58 0.60 16.82
Terry County-Texas
Yoakum County-Texas
Curry County-New Mexico
P:\9345\GAM-Rpt.9-2002\Att_B1.xls B1-11

Attachment B1. Monthly rainfall in inches by county for selected years and long-term average (LTA) in the Southern Ogallala GAM region.
CTY/QID YEAR JAN FEB MAR APR MAY JUN JUL AUG SEP OCT NOV DEC ANNUAL
504 1997 0.21 1.32 0.12 1.93 2.62 2.01 2.38 2.14 3.27 1.90 0.54 1.84 20.281994 0.29 0.01 0.08 0.39 3.70 0.58 1.88 0.37 1.08 0.68 0.81 0.05 9.911993 1.11 0.51 0.35 0.95 0.35 0.77 2.91 1.55 0.59 0.72 0.27 0.03 10.121992 1.03 1.20 0.27 0.27 7.57 3.10 1.29 1.43 0.63 0.14 0.83 0.69 18.451987 0.16 0.98 0.63 0.46 3.45 2.32 0.29 2.87 1.04 0.49 0.25 0.96 13.881984 0.06 0.01 0.01 0.02 3.85 3.71 0.93 5.56 1.40 2.56 1.28 1.29 20.671983 1.06 0.41 0.17 0.61 1.01 0.72 0.41 0.62 2.04 2.45 1.35 0.43 11.271982 0.32 0.11 0.24 0.84 2.17 1.00 1.97 1.20 1.94 0.32 1.08 1.67 12.871956 0.17 1.07 0.25 0.38 1.92 1.10 1.27 0.77 0.88 1.38 0.12 0.60 9.911955 0.87 0.40 0.04 0.64 1.74 0.82 3.23 1.25 2.20 2.03 0.49 0.15 13.861954 0.24 0.11 0.18 1.46 3.29 0.97 0.73 2.44 0.55 2.35 0.20 0.46 12.971953 0.18 0.58 0.43 0.97 0.93 0.78 1.96 1.95 0.39 2.61 0.75 0.64 12.191952 0.32 0.81 0.38 1.10 1.49 1.07 1.86 0.70 0.70 0.00 0.70 0.03 9.16LTA 0.72 0.69 0.63 0.76 1.92 1.74 2.22 2.26 2.44 1.37 0.71 0.75 16.21
204&304 1997 0.53 0.68 0.03 4.47 1.28 2.91 2.71 3.30 1.99 1.00 0.72 2.34 21.931994 0.12 0.04 1.13 1.33 3.98 0.99 2.42 1.98 0.61 1.47 0.45 0.44 14.951993 0.78 0.41 1.05 0.37 1.44 3.04 3.33 3.01 0.96 0.90 0.46 0.10 15.831992 0.83 0.36 0.38 0.86 3.04 2.99 2.57 3.21 1.01 0.23 0.46 0.53 16.441987 1.07 1.64 0.46 0.46 3.15 2.74 0.53 5.27 1.86 0.30 0.48 1.04 18.961984 0.40 0.12 0.92 1.19 2.28 3.58 2.22 4.23 0.56 3.53 1.17 0.92 21.091983 1.08 0.78 0.75 0.67 1.29 1.78 1.09 0.79 0.64 2.38 0.62 0.65 12.511982 0.15 0.28 0.20 0.32 1.56 2.79 5.04 1.93 1.76 1.16 0.66 1.10 16.941956 0.15 0.83 0.10 0.33 1.86 1.87 2.42 1.23 0.16 0.70 0.15 0.07 9.841955 0.27 0.20 0.18 1.58 2.65 0.84 3.15 1.71 2.25 0.38 0.07 0.12 13.401954 0.42 0.21 0.20 0.76 1.96 0.83 1.60 3.03 0.81 2.54 0.17 0.05 12.551953 0.32 0.44 1.00 0.87 1.39 0.22 3.81 2.32 0.13 1.05 0.69 0.74 12.951952 0.47 0.31 0.66 2.18 0.94 1.12 2.28 2.82 0.69 0.03 1.26 0.43 13.16LTA 0.49 0.55 0.64 1.01 2.06 2.21 2.85 2.80 1.95 1.30 0.65 0.57 17.08
404 1997 0.83 1.01 0.28 2.94 1.57 1.68 2.33 2.64 2.04 1.52 0.49 2.02 19.361994 0.02 0.00 0.31 0.45 3.50 0.51 2.52 0.74 0.96 0.50 0.69 0.05 10.261993 0.67 0.17 0.40 0.67 0.57 1.05 5.22 3.37 2.54 0.51 0.54 0.05 15.761992 1.35 0.53 0.27 0.71 6.96 2.07 1.61 2.38 0.91 0.11 0.65 0.48 18.021987 0.36 1.08 0.38 0.19 4.09 2.64 1.00 3.79 3.03 0.70 0.45 1.22 18.931984 0.12 0.01 0.11 0.08 3.46 3.65 2.43 4.74 0.85 3.03 1.41 1.53 21.431983 1.03 0.47 0.07 0.28 1.59 0.89 0.66 0.50 1.23 3.55 1.03 0.15 11.451982 0.47 0.31 0.23 0.23 1.93 1.16 4.84 1.07 2.65 0.87 1.29 1.56 16.601956 0.08 1.34 0.00 0.16 1.50 1.13 1.32 1.16 0.30 1.34 0.00 0.08 8.401955 0.54 0.01 0.08 0.35 2.06 0.37 2.98 0.51 2.42 4.01 0.18 0.00 13.501954 0.06 0.01 0.00 0.82 2.53 0.45 0.50 4.02 0.33 3.24 0.13 0.20 12.291953 0.50 0.20 0.49 0.63 1.66 0.23 2.52 2.25 0.15 2.17 0.11 0.23 11.131952 0.33 0.15 0.06 1.29 0.81 1.29 2.95 1.85 0.94 0.02 0.69 0.15 10.52LTA 0.51 0.53 0.48 0.73 1.88 1.97 2.60 2.46 2.29 1.48 0.61 0.56 16.11
Quay County-New Mexico
Roosevelt County-New Mexico
Lea County-New Mexico
P:\9345\GAM-Rpt.9-2002\Att_B1.xls B1-12

Attachment B2
Irrigated Acreage by Crop and County for 1982, 1983, 1994,
1987, 1992, 1993, 1994, and 1997

Attachment B2. Irrigated acreage by crop and county in the Southern Ogallala GAM region for 1982, 1983, 1994, 1987, 1992, 1993, 1994 and 1997.
Table 1. Irrigated Crop Acreage by County, 1982Counties Corn Cotton Hay Pasture Peanuts Sorghum Soybeans Wheat County Total
Andrews 7,000 81 2,900 900 10,881Armstrong 2,000 3,600 7,400 13,000Bailey 44,000 56,200 5,576 26,000 14,000 14,100 159,876Borden 500 500 1,000Briscoe 1,700 23,900 1,947 7,800 8,000 8,200 51,547Castro 90,500 63,100 6,345 24,000 28,000 71,300 283,245Cochran 51,700 1,263 41,000 8,300 102,263Crosby 78,400 1,726 19,000 15,000 4,600 118,726Dawson 19,000 329 9,500 1,000 800 30,629Deaf Smith 33,200 8,900 3,336 55,000 91,200 191,636Dickens 7,300 513 300 1,200 1,400 10,713Ector 911 911Floyd 16,900 136,700 3,327 41,500 83,000 29,000 310,427Gaines 167,700 2,684 12,600 42,000 4,000 37,700 266,684Garza 3,900 200 100 4,200Glasscock 29,900 1,217 1,100 1,500 33,717Hale 67,500 190,400 1,826 30,500 144,000 39,200 473,426Hockley 118,600 2,277 59,000 6,000 2,800 188,677Howard 7,600 100 900 8,600Lamb 63,700 139,800 3,392 28,500 50,000 32,600 317,992Lubbock 2,100 170,700 7,143 28,000 19,000 6,700 233,643Lynn 24,800 532 6,000 4,000 2,600 37,932Martin 6,300 1,400 900 8,600Midland 11,400 292 1,000 1,300 13,992Motley 1,500 251 2,000 400 300 4,451Oldham 11,000 12,100 23,100Parmer 102,700 55,700 6,242 35,000 32,000 73,700 305,342Potter 1 5,800 5,100 10,901Randall 1,200 11,500 34,200 46,900Swisher 29,400 68,400 4,977 30,000 28,000 92,400 253,177Terry 69,500 654 24,000 10,400 104,554Yoakum 4,000 53,400 1,033 10,500 3,900 72,833Subtotal TX 456,900 1,565,300 0 57,794 14,600 550,100 437,200 587,800 3,669,694Curry 17,300 2,750 7,565 36,500 57,300 121,415Lea 2,700 7,630 4,063 4,500 10,000 28,893Quay 700 1,930 3,770 15,900 16,300 38,600Roosevelt 8,800 9,200 7,028 47,000 33,500 105,528Subtotal NM 29,500 21,510 0 22,426 0 103,900 0 117,100 294,436Crop G.Total 486,400 1,586,810 0 80,220 14,600 654,000 437,200 704,900 3,964,1301Sources: Texas Agricultural Statistics Services, Census of Agriculture.
P:\9345\GAM-Rpt.9-2002\Att_B2.xls B2-1
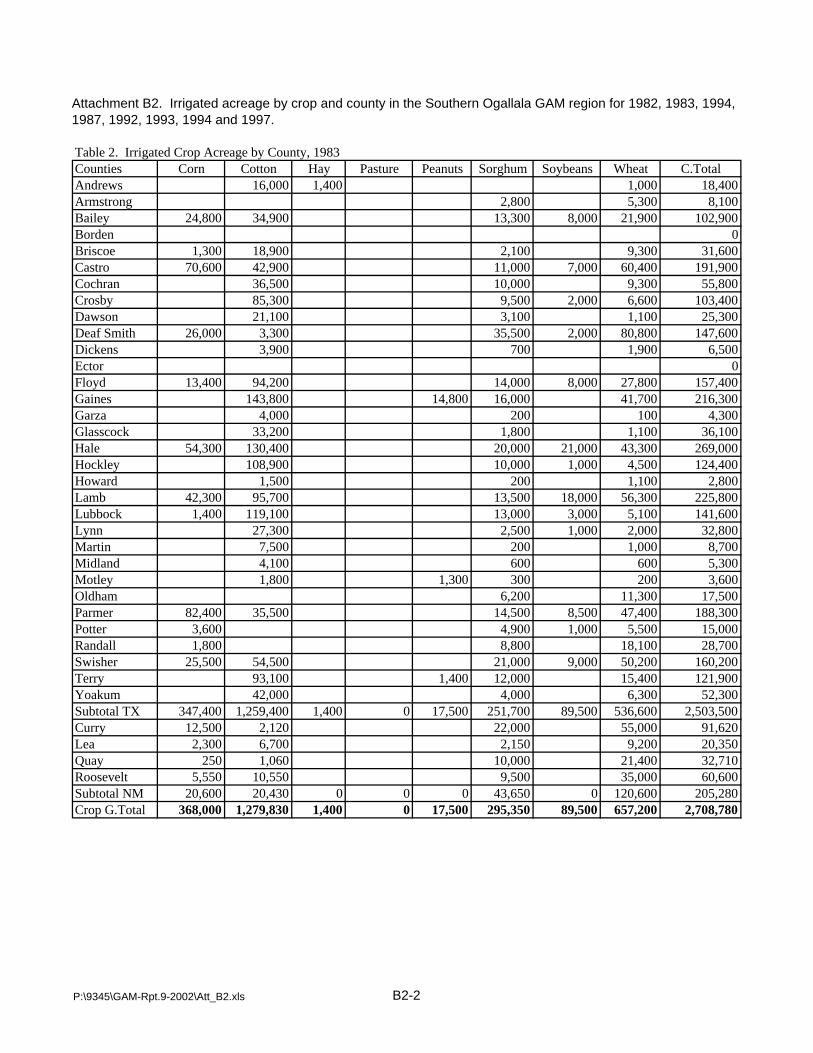
Attachment B2. Irrigated acreage by crop and county in the Southern Ogallala GAM region for 1982, 1983, 1994, 1987, 1992, 1993, 1994 and 1997.
Table 2. Irrigated Crop Acreage by County, 1983Counties Corn Cotton Hay Pasture Peanuts Sorghum Soybeans Wheat C.TotalAndrews 16,000 1,400 1,000 18,400Armstrong 2,800 5,300 8,100Bailey 24,800 34,900 13,300 8,000 21,900 102,900Borden 0Briscoe 1,300 18,900 2,100 9,300 31,600Castro 70,600 42,900 11,000 7,000 60,400 191,900Cochran 36,500 10,000 9,300 55,800Crosby 85,300 9,500 2,000 6,600 103,400Dawson 21,100 3,100 1,100 25,300Deaf Smith 26,000 3,300 35,500 2,000 80,800 147,600Dickens 3,900 700 1,900 6,500Ector 0Floyd 13,400 94,200 14,000 8,000 27,800 157,400Gaines 143,800 14,800 16,000 41,700 216,300Garza 4,000 200 100 4,300Glasscock 33,200 1,800 1,100 36,100Hale 54,300 130,400 20,000 21,000 43,300 269,000Hockley 108,900 10,000 1,000 4,500 124,400Howard 1,500 200 1,100 2,800Lamb 42,300 95,700 13,500 18,000 56,300 225,800Lubbock 1,400 119,100 13,000 3,000 5,100 141,600Lynn 27,300 2,500 1,000 2,000 32,800Martin 7,500 200 1,000 8,700Midland 4,100 600 600 5,300Motley 1,800 1,300 300 200 3,600Oldham 6,200 11,300 17,500Parmer 82,400 35,500 14,500 8,500 47,400 188,300Potter 3,600 4,900 1,000 5,500 15,000Randall 1,800 8,800 18,100 28,700Swisher 25,500 54,500 21,000 9,000 50,200 160,200Terry 93,100 1,400 12,000 15,400 121,900Yoakum 42,000 4,000 6,300 52,300Subtotal TX 347,400 1,259,400 1,400 0 17,500 251,700 89,500 536,600 2,503,500Curry 12,500 2,120 22,000 55,000 91,620Lea 2,300 6,700 2,150 9,200 20,350Quay 250 1,060 10,000 21,400 32,710Roosevelt 5,550 10,550 9,500 35,000 60,600Subtotal NM 20,600 20,430 0 0 0 43,650 0 120,600 205,280Crop G.Total 368,000 1,279,830 1,400 0 17,500 295,350 89,500 657,200 2,708,780
P:\9345\GAM-Rpt.9-2002\Att_B2.xls B2-2

Attachment B2. Irrigated acreage by crop and county in the Southern Ogallala GAM region for 1982, 1983, 1994, 1987, 1992, 1993, 1994 and 1997.
Table 3. Irrigated Crop Acreage by County, 1984Counties Corn Cotton Hay Pasture Peanuts Sorghum Soybeans Wheat C.TotalAndrews 9,300 900 1,600 11,800Armstrong 5,200 4,500 9,700Bailey 30,700 41,200 10,500 1,100 25,900 109,400Borden 500 500Briscoe 1,600 22,400 3,900 3,400 31,300Castro 101,400 63,000 14,000 4,400 57,600 240,400Cochran 60,700 11,500 10,800 83,000Crosby 110,400 11,000 6,400 127,800Dawson 32,200 2,000 1,200 35,400Deaf Smith 28,000 5,700 50,000 2,500 55,300 141,500Dickens 6,600 500 900 8,000Ector 0Floyd 13,800 134,400 22,000 3,000 25,600 198,800Gaines 177,800 27,400 16,000 30,200 251,400Garza 5,600 100 5,700Glasscock 39,400 1,000 400 40,800Hale 76,000 167,300 17,000 14,000 45,200 319,500Hockley 132,100 8,100 8,800 149,000Howard 2,500 500 200 3,200Lamb 52,700 129,600 8,100 4,500 38,600 233,500Lubbock 4,900 171,700 12,000 10,700 199,300Lynn 39,400 1,500 2,800 43,700Martin 7,600 500 1,400 9,500Midland 6,400 500 6,900Motley 3,000 1,900 100 5,000Oldham 8,300 9,400 17,700Parmer 99,800 48,400 20,500 2,800 56,700 228,200Potter 3,500 7,500 16,600 27,600Randall 4,100 12,500 27,100 43,700Swisher 35,600 65,800 28,500 6,500 60,400 196,800Terry 113,500 1,500 11,500 13,400 139,900Yoakum 51,200 2,500 4,600 7,100 65,400Subtotal TX 452,100 1,647,200 0 0 33,300 289,600 38,900 523,300 2,984,400Curry 24,300 3,300 33,000 45,000 105,600Lea 2,200 6,800 4,000 12,800 25,800Quay 350 2,600 13,000 20,000 35,950Roosevelt 8,500 17,300 15,000 32,000 72,800Subtotal NM 35,350 30,000 0 0 0 65,000 0 109,800 240,150Crop G.Total 487,450 1,677,200 0 0 33,300 354,600 38,900 633,100 3,224,550
P:\9345\GAM-Rpt.9-2002\Att_B2.xls B2-3

Attachment B2. Irrigated acreage by crop and county in the Southern Ogallala GAM region for 1982, 1983, 1994, 1987, 1992, 1993, 1994 and 1997.
Table 4. Irrigated Crop Acreage by County, 1987Counties Corn Cotton Hay Pasture Peanuts Sorghum Soybeans Wheat County TotalAndrews 2,400 516 300 1,800 5,016Armstrong 250 398 170 4,100 2,800 7,718Bailey 16,100 35,000 5,906 7,200 23,400 87,606Borden 700 700Briscoe 2,800 15,000 1,184 4,100 4,900 27,984Castro 59,000 43,000 7,533 12,000 4,100 53,400 179,033Cochran 34,600 6,300 3,700 44,600Crosby 65,300 710 7,600 2,200 75,810Dawson 15,200 501 700 100 16,501Deaf Smith 21,200 2,000 3,456 42,500 1,100 67,300 137,556Dickens 1,200 430 100 1,730Ector 984 984Floyd 10,000 111,000 3,976 13,500 4,200 18,100 160,776Gaines 110,600 6,661 15,100 3,200 15,800 151,361Garza 2,100 500 500 3,100Glasscock 20,800 1,284 1,100 400 23,584Hale 60,000 137,000 8,307 20,000 16,700 55,800 297,807Hockley 80,200 388 4,600 3,600 88,788Howard 1,100 200 400 1,700Lamb 37,100 109,500 13,162 9,100 3,100 46,600 218,562Lubbock 2,200 126,400 2,633 7,600 5,900 144,733Lynn 30,000 1,100 200 31,300Martin 3,000 200 500 3,700Midland 7,500 528 300 300 8,628Motley 1,100 2,000 200 100 3,400Oldham 480 1 1 6,400 8,400 15,282Parmer 60,200 38,000 4,527 14,500 2,000 51,800 171,027Potter 1,725 1 3,200 5,700 10,626Randall 2,100 2,709 829 12,000 14,200 31,838Swisher 17,000 44,000 4,134 16,000 3,000 34,600 118,734Terry 76,100 1,082 1,000 5,600 7,200 90,982Yoakum 400 1,200 4,900 12,900 19,400Subtotal TX 287,700 1,110,400 4,914 68,617 19,301 204,600 34,200 438,100 2,167,832Curry 17,800 2,300 6,564 16,000 46,000 88,664Lea 650 6,150 4,315 2,000 29,200 42,315Quay 750 700 5,273 8,000 11,000 25,723Roosevelt 10,000 4,000 7,007 14,000 50,000 85,007Subtotal NM 29,200 13,150 0 23,159 0 40,000 0 136,200 241,709Crop G.Total 316,900 1,123,550 4,914 91,776 19,301 244,600 34,200 574,300 2,409,541
P:\9345\GAM-Rpt.9-2002\Att_B2.xls B2-4

Attachment B2. Irrigated acreage by crop and county in the Southern Ogallala GAM region for 1982, 1983, 1994, 1987, 1992, 1993, 1994 and 1997.
Table 5. Irrigated Crop Acreage by County, 1992Counties Corn Cotton Hay Pasture Peanuts Sorghum Soybeans Wheat County TotalAndrews 500 401 6,400 300 7,601Armstrong 1,300 393 208 2,700 10,400 15,001Bailey 19,000 38,600 10,686 0 29,000 6,800 23,400 127,486Borden 600 600 700 1,900Briscoe 4,900 19,900 1,980 1,400 14,000 0 4,200 46,380Castro 94,200 45,300 13,172 0 21,700 13,900 63,900 252,172Cochran 0 34,700 260 0 40,500 2,100 700 78,260Crosby 0 95,400 2,030 0 68,500 9,600 1,400 176,930Dawson 0 18,700 613 0 7,000 0 900 27,213Deaf Smith 38,500 3,700 11,275 0 41,800 0 82,000 177,275Dickens 0 2,600 0 500 0 200 3,300Ector 0 0 0 0 0 0 0Floyd 19,200 124,800 2,562 0 68,400 23,500 11,000 249,462Gaines 0 158,100 5,374 33,200 20,100 0 25,800 242,574Garza 0 3,200 0 0 0 800 4,000Glasscock 35,100 712 1,300 800 37,912Hale 84,400 173,400 7,218 0 102,800 70,200 24,700 462,718Hockley 0 95,800 852 0 82,400 0 1,100 180,152Howard 5,200 230 100 700 6,230Lamb 59,000 120,200 8,547 1,000 57,700 42,400 29,700 318,547Lubbock 3,500 130,100 2,415 0 86,800 24,500 1,800 249,115Lynn 0 44,500 1,016 0 32,000 1,200 200 78,916Martin 9,300 344 0 600 0 400 10,644Midland 0 8,000 2,203 0 0 0 300 10,503Motley 0 800 250 1,900 0 0 0 2,950Oldham 814 1 5,600 9,800 16,215Parmer 99,300 44,700 12,494 0 32,100 18,200 48,500 255,294Potter 987 652 2,100 7,800 11,539Randall 2,100 2,709 829 12,500 19,700 37,838Swisher 26,900 52,400 6,781 0 38,800 0 35,400 160,281Terry 0 106,500 1,145 3,500 45,100 0 3,400 159,645Yoakum 1,400 49,300 142 4,400 22,000 0 3,100 80,342Subtotal TX 452,400 1,420,900 4,510 93,783 45,400 834,000 212,400 402,400 3,465,793Curry 25,150 1,900 3,200 1,100 25,700 73,500 130,550Lea 3,200 11,000 7,251 4,000 5,400 11,200 42,051Quay 2,050 800 8,827 0 3,800 6,000 21,477Roosevelt 21,000 4,800 4,910 16,000 13,200 40,000 99,910Subtotal NM 51,400 18,500 0 24,188 21,100 48,100 0 130,700 293,988Crop G.Total 503,800 1,439,400 4,510 117,971 66,500 882,100 212,400 533,100 3,759,781
P:\9345\GAM-Rpt.9-2002\Att_B2.xls B2-5

Attachment B2. Irrigated acreage by crop and county in the Southern Ogallala GAM region for 1982, 1983, 1994, 1987, 1992, 1993, 1994 and 1997.
Table 6. Irrigated Crop Acreage by County, 1993Counties Corn Cotton Hay Pasture Peanuts Sorghum Soybeans Wheat County TotalAndrews 3,100 3,100Armstrong 2,100 2,300 4,900 9,300Bailey 21,000 59,000 13,900 16,200 110,100Borden 0Briscoe 3,500 27,000 1,200 3,200 8,100 43,000Castro 99,300 45,400 13,900 3,400 65,400 227,400Cochran 55,000 2,600 2,100 59,700Crosby 2,500 133,000 11,200 2,200 148,900Dawson 40,700 1,400 1,200 43,300Deaf Smith 49,000 3,800 38,900 76,200 167,900Dickens 2,000 2,000Ector 0Floyd 19,800 129,200 26,400 2,800 9,700 187,900Gaines 183,300 36,500 1,200 30,300 251,300Garza 4,200 4,200Glasscock 38,200 38,200Hale 85,300 176,000 24,300 5,500 28,300 319,400Hockley 125,200 6,500 131,700Howard 3,400 3,400Lamb 60,600 133,500 9,100 2,800 37,900 243,900Lubbock 1,600 175,000 7,600 1,200 3,000 188,400Lynn 41,200 1,300 42,500Martin 11,300 11,300Midland 6,400 6,400Motley 1,500 1,200 2,700Oldham 3,700 6,900 10,600Parmer 104,500 48,200 26,600 2,100 48,200 229,600Potter 2,200 10,000 12,200Randall 4,300 6,400 26,900 37,600Swisher 29,200 53,700 17,800 1,200 27,800 129,700Terry 116,100 3,000 7,300 4,900 131,300Yoakum 1,400 49,600 4,200 1,200 3,300 59,700Subtotal TX 484,100 1,665,000 0 0 46,100 229,000 19,000 413,500 2,856,700Curry 30,850 2,400 1,900 25,200 64,700 125,050Lea 2,300 8,500 3,900 1,600 12,750 29,050Quay 2,600 450 5,800 5,000 13,850Roosevelt 23,500 6,550 16,000 13,100 34,100 93,250Subtotal NM 59,250 17,900 0 0 21,800 45,700 0 116,550 261,200Crop G.Total 543,350 1,682,900 0 0 67,900 274,700 19,000 530,050 3,117,900
P:\9345\GAM-Rpt.9-2002\Att_B2.xls B2-6

Attachment B2. Irrigated acreage by crop and county in the Southern Ogallala GAM region for 1982, 1983, 1994, 1987, 1992, 1993, 1994 and 1997.
Table 7. Irrigated Crop Acreage by County, 1994Counties Corn Cotton Hay Pasture Peanuts Sorghum Soybeans Wheat County TotalAndrews 2,900 1,500 4,400Armstrong 1,900 1,400 7,600 10,900Bailey 19,400 55,900 6,700 27,400 109,400Borden 1,500 1,500Briscoe 3,700 23,200 1,300 3,300 6,500 38,000Castro 18,100 51,500 9,000 3,500 49,900 132,000Cochran 1,200 53,500 2,300 2,100 59,100Crosby 119,500 10,400 3,400 133,300Dawson 38,000 2,300 4,100 44,400Deaf Smith 56,800 4,500 29,200 58,000 148,500Dickens 3,500 3,500Ector 0Floyd 21,200 131,000 18,500 1,000 12,200 183,900Gaines 193,400 39,500 1,800 19,600 254,300Garza 7,800 7,800Glasscock 44,500 1,100 1,400 47,000Hale 83,400 185,000 20,700 4,500 29,800 323,400Hockley 1,300 135,200 1,800 2,000 140,300Howard 1,400 1,600 3,000Lamb 58,100 128,700 11,300 4,200 29,400 231,700Lubbock 1,700 170,900 3,800 1,400 177,800Lynn 46,000 1,200 47,200Martin 9,900 9,900Midland 9,100 9,100Motley 1,800 2,800 4,600Oldham 5,400 9,200 14,600Parmer 109,400 51,000 20,700 4,300 37,400 222,800Potter 2,700 8,600 11,300Randall 5,600 9,600 22,000 37,200Swisher 32,500 63,100 16,800 22,900 135,300Terry 1,300 110,000 3,200 4,100 3,800 122,400Yoakum 1,000 66,100 4,700 2,200 3,400 77,400Subtotal TX 416,600 1,708,900 0 0 55,300 184,000 17,500 363,700 2,746,000Curry 35,800 2,350 1,900 24,000 59,000 123,050Lea 4,450 9,850 2,800 1,400 9,000 27,500Quay 2,600 800 5,500 8,400 17,300Roosevelt 22,900 8,200 16,300 8,400 25,000 80,800Subtotal NM 65,750 21,200 0 0 21,000 39,300 0 101,400 248,650Crop G.Total 482,350 1,730,100 0 0 76,300 223,300 17,500 465,100 2,994,650
P:\9345\GAM-Rpt.9-2002\Att_B2.xls B2-7

Attachment B2. Irrigated acreage by crop and county in the Southern Ogallala GAM region for 1982, 1983, 1994, 1987, 1992, 1993, 1994 and 1997.
Table 8. Irrigated Crop Acreage by County, 1997Counties Corn Cotton Hay Pasture Peanuts Sorghum Soybeans Wheat County TotalAndrews 8,200 571 3,500 12,271Armstrong 1,200 800 60 316 2,100 5,000 9,476Bailey 15,500 50,900 0 8,102 0 13,600 1,200 6,100 95,402Borden 5,000 5,000Briscoe 2,900 21,400 0 495 1,500 3,500 0 3,600 33,395Castro 119,200 60,600 0 6,707 0 16,200 3,000 70,200 275,907Cochran 2,000 55,400 0 850 2,300 15,700 0 0 76,250Crosby 0 126,700 0 235 0 6,800 1,100 0 134,835Dawson 0 52,000 0 1,105 16,700 4,800 0 2,800 77,405Deaf Smith 44,000 7,700 0 9,093 0 36,400 0 100,800 197,993Dickens 0 5,400 0 3,966 0 0 0 0 9,366Ector 0 0 0 1,313 0 0 0 0 1,313Floyd 18,500 125,800 0 1,938 0 24,700 10,600 8,200 189,738Gaines 1,600 144,000 0 3,272 64,600 6,700 0 10,700 230,872Garza 12,500 0 0 0 0 0 0 12,500Glasscock 50,700 295 1,900 52,895Hale 62,600 202,200 0 8,963 0 34,900 14,600 37,500 360,763Hockley 143,400 0 1,994 1,000 12,000 0 1,200 159,594Howard 2,800 200 3,000Lamb 62,700 123,600 0 4,662 1,100 14,900 5,100 14,200 226,262Lubbock 1,000 188,900 0 3,738 2,500 14,000 3,600 3,600 217,338Lynn 0 51,300 0 930 1,500 2,100 0 0 55,830Martin 6,000 90 1,800 7,890Midland 0 10,300 0 2,094 0 0 0 0 12,394Motley 0 0 0 1,855 3,300 0 0 0 5,155Oldham 862 0 0 520 0 10,500 0 18,300 30,182Parmer 91,700 65,700 0 9,719 0 17,500 1,600 46,600 232,819Potter 971 0 0 2,948 0 1,500 0 22,800 28,219Randall 5,500 100 2,185 6,570 0 14,800 0 17,700 46,855Swisher 27,900 61,200 0 3,776 0 21,000 5,600 19,400 138,876Terry 1,200 133,100 0 2,331 21,100 8,200 0 6,100 172,031Yoakum 1,900 78,700 0 409 11,800 8,700 0 4,400 105,909Subtotal TX 460,033 1,785,400 0 88,170 129,200 290,400 46,400 394,200 3,193,803Curry 33,000 2,400 0 5,195 1,600 23,500 0 52,000 117,695Lea 4,200 12,200 0 6,291 3,200 2,400 0 6,000 34,291Quay 2,200 2,500 0 14,345 0 5,500 0 9,000 33,545Roosevelt 22,000 13,600 0 3,848 13,200 10,400 0 30,000 93,048Subtotal NM 61,400 30,700 0 29,679 18,000 41,800 0 97,000 278,579Crop G.Total 521,433 1,816,100 0 117,849 147,200 332,200 46,400 491,200 3,472,382
P:\9345\GAM-Rpt.9-2002\Att_B2.xls B2-8

Attachment B3
Irrigation Data by County for Base Years, Drought Years,
Drought-of-Record Years, and Long-Term Average Years

Attachment B3. Irrigation data by county in the Southern Ogallala GAM Region for all base years, drought years, drought of record years and long-term average years.
1982 1982 1982 1982January February March April
COUNTY
1982 Planted Irrigated Acres,
piaTAES Total Irr.
Water Use, ac-ftTAES Irr. Water
Use, in/piaMonthly
Pumpage, ac-ftMonthly
Pumpage, ac-ftMonthly
Pumpage, ac-ftMonthly
Pumpage, ac-ftANDREWS 10,881 17,407 19.20 0 0 35 167ARMSTRONG 130 134 12.34 0 0 7 29BAILEY 159,876 243,703 18.29 0 0 563 8,172BORDEN 1,000 1,089 13.07 0 0 0 0BRISCOE 30,928 39,628 15.38 0 0 693 3,137CASTRO 283,245 474,172 20.09 0 0 9,933 51,391COCHRAN 102,263 132,458 15.54 0 0 1,103 4,784CROSBY 118,726 124,402 12.57 0 0 516 2,528DAWSON 30,629 43,361 16.99 0 0 14 147DEAF SMITH 191,636 299,417 18.75 0 0 12,637 55,069DICKENS 5,357 6,681 14.97 0 0 21 146ECTOR 911 3,122 0.00 0 0 0 312FLOYD 301,114 323,462 12.89 0 0 1,465 8,073GAINES 266,684 424,730 19.11 0 0 1,485 6,790GARZA 4,200 6,029 17.23 0 0 3 13GLASSCOCK 2,866 5,154 21.58 0 0 6 58HALE 473,426 466,255 11.82 0 0 251 7,407HOCKLEY 188,677 239,790 15.25 0 0 125 1,174HOWARD 8,600 11,638 16.24 0 0 7 28LAMB 317,992 456,212 17.22 0 0 1,200 12,219LUBBOCK 233,643 251,439 12.91 0 0 203 2,887LYNN 37,932 37,848 11.97 0 0 83 476MARTIN 8600 11846 16.53 0 0 15 61MIDLAND 4198 7465 21.34 0 0 21 113MOTLEY 334 598 21.48 0 0 1 8OLDHAM 23,100 30,414 15.80 0 0 1,715 6,862PARMER 305,342 450,146 17.69 0 0 9,760 50,363POTTER 10,901 11,530 12.69 0 0 523 2,093RANDALL 3,200 3,528 13.23 0 0 259 1,036SWISHER 253,177 310,690 14.73 0 0 9,728 42,972TERRY 104,554 122,876 14.10 0 0 499 2,194YOAKUM 72,833 115,054 18.96 0 0 190 1,462CURRY 121,415 134,694 13.31 0 0 2,573 13,891LEA 28,893 46,833 19.45 0 0 554 3,892QUAY 386 469 14.59 0 0 7 40ROOSEVELT 105,528 123,539 14.05 0 0 957 6,436TOTALS 3,813,176 4,977,813 15.67 0 0 57,156 296,430
pia = planted irrigation acreagesTAES = Texas Agricultural Extension Service
P:\9345\GAM-Rpt.9-2002\Att_B3.xls B3-1

Attachment B3. Irrigation data by county in the Southern Ogallala GAM Region for all base years, drought years, drought of record years and long-term average years.
1982 1982 1982 1982 1982 1982 1982 1982May June July August September October November December
COUNTYMonthly
Pumpage, ac-ftMonthly
Pumpage, ac-ftMonthly
Pumpage, ac-ftMonthly
Pumpage, ac-ftMonthly
Pumpage, ac-ftMonthly
Pumpage, ac-ftMonthly
Pumpage, ac-ftMonthly
Pumpage, ac-ftANDREWS 904 3,418 7,025 5,747 38 35 35 0ARMSTRONG 24 11 24 22 0 7 7 0BAILEY 17,966 50,120 89,454 72,385 3,917 563 563 0BORDEN 54 229 457 349 0 0 0 0BRISCOE 3,739 6,189 12,796 10,841 846 693 693 0CASTRO 57,746 81,174 138,226 109,752 6,086 9,933 9,933 0COCHRAN 8,727 23,413 49,156 42,511 558 1,103 1,103 0CROSBY 6,926 22,766 48,408 40,214 2,013 516 516 0DAWSON 2,028 8,524 17,713 14,671 237 14 14 0DEAF SMITH 49,484 35,906 63,994 55,635 1,418 12,637 12,637 0DICKENS 422 1,296 2,571 2,046 138 21 21 0ECTOR 468 624 624 624 468 0 0 0FLOYD 17,382 55,814 123,569 105,469 8,761 1,465 1,465 0GAINES 24,068 83,755 166,142 135,507 4,013 1,485 1,485 0GARZA 305 1,251 2,515 1,935 0 3 3 0GLASSCOCK 304 1,061 2,063 1,600 50 6 6 0HALE 23,716 87,656 182,412 151,676 12,635 251 251 0HOCKLEY 11,165 46,334 97,096 81,950 1,697 125 125 0HOWARD 597 2,425 4,856 3,710 0 7 7 0LAMB 29,425 90,172 173,446 139,922 7,429 1,200 1,200 0LUBBOCK 13,740 49,337 99,422 80,938 4,507 203 203 0LYNN 1,944 7,127 15,039 12,447 566 83 83 0MARTIN 598 2391 4879 3870 0 15 15 0MIDLAND 446 1503 2974 2322 44 21 21 0MOTLEY 33 129 207 189 30 1 1 0OLDHAM 5,544 2,254 5,304 5,304 0 1,715 1,715 0PARMER 55,721 76,358 129,455 103,383 5,585 9,760 9,760 0POTTER 1,759 1,071 2,518 2,518 0 523 523 0RANDALL 805 160 375 375 0 259 259 0SWISHER 41,781 42,371 81,592 68,180 4,609 9,728 9,728 0TERRY 7,000 23,558 48,486 39,844 299 499 499 0YOAKUM 6,673 23,524 46,032 36,318 475 190 190 0CURRY 15,757 22,050 38,214 34,242 2,820 2,573 2,573 0LEA 5,268 8,513 13,770 11,678 2,049 554 554 0QUAY 48 73 138 132 16 7 7 0ROOSEVELT 9,942 22,003 41,606 38,105 2,577 957 957 0TOTALS 422,509 884,557 1,712,560 1,416,411 73,880 57,156 57,156 0
pia = planted irrigation acreagesTAES = Texas Agricultural Extension Service
P:\9345\GAM-Rpt.9-2002\Att_B3.xls B3-2

Attachment B3. Irrigation data by county in the Southern Ogallala GAM Region for all base years, drought years, drought of record years and long-term average years.
1983 1983 1983 1983January February March April
COUNTY
1983 Planted Irrigated Acres,
piaTAES Total Irr.
Water Use, ac-ftTAES Irr. Water
Use, in/piaMonthly
Pumpage, ac-ftMonthly
Pumpage, ac-ftMonthly
Pumpage, ac-ftMonthly
Pumpage, ac-ftANDREWS 18,400 34,009 22.18 0 0 42 763ARMSTRONG 81 98 14.56 0 0 5 20BAILEY 102,900 180,360 21.03 0 0 842 6,799BORDEN 0 0 0.00 0 0 0 0BRISCOE 18,960 34,208 21.65 0 0 950 3,907CASTRO 191,900 401,774 25.12 0 0 8,008 42,549COCHRAN 55,800 91,785 19.74 0 0 1,266 5,063CROSBY 103,400 158,593 18.41 0 0 682 2,729DAWSON 25,200 41,475 19.75 0 0 44 177DEAF SMITH 147,600 259,146 21.07 0 0 10,748 46,810DICKENS 3,250 3,578 13.21 0 0 25 99ECTOR 0 0 0.00 0 0 0 0FLOYD 152,678 233,128 18.32 0 0 1,227 6,627GAINES 216,300 322,204 17.88 0 0 1,742 6,968GARZA 4,300 6,587 18.38 0 0 3 10GLASSCOCK 3,069 5,515 21.57 0 0 5 20HALE 269,000 408,155 18.21 0 0 10 7,362HOCKLEY 124,400 205,683 19.84 0 0 215 861HOWARD 2,800 3,104 13.30 0 0 38 152LAMB 225,800 374,602 19.91 0 0 1,993 13,896LUBBOCK 141,600 218,825 18.54 0 0 120 657LYNN 32,800 48,882 17.88 0 0 50 201MARTIN 8700 13505 18.63 0 0 40 161MIDLAND 1590 2693 20.32 0 0 10 39MOTLEY 270 433 19.26 0 0 0 1OLDHAM 17,500 26,995 18.51 0 0 1,589 6,356PARMER 188,300 369,520 23.55 0 0 5,963 34,702POTTER 15,000 25,692 20.55 0 0 549 2,695RANDALL 22,960 31,438 16.43 0 0 1,499 6,203SWISHER 160,200 269,198 20.16 0 0 4,996 23,662TERRY 121,900 185,150 18.23 0 0 788 3,153YOAKUM 52,300 79,331 18.20 0 0 328 1,311CURRY 91,620 96,177 12.60 0 0 2,178 10,343LEA 20,350 26,548 15.65 0 0 504 2,340QUAY 327 299 10.96 0 0 7 30ROOSEVELT 60,600 62,509 12.38 0 0 1,220 5,625TOTALS 2,601,855 4,221,199 19.47 0 0 47,686 242,290
pia = planted irrigation acreagesTAES = Texas Agricultural Extension Service
P:\9345\GAM-Rpt.9-2002\Att_B3.xls B3-3
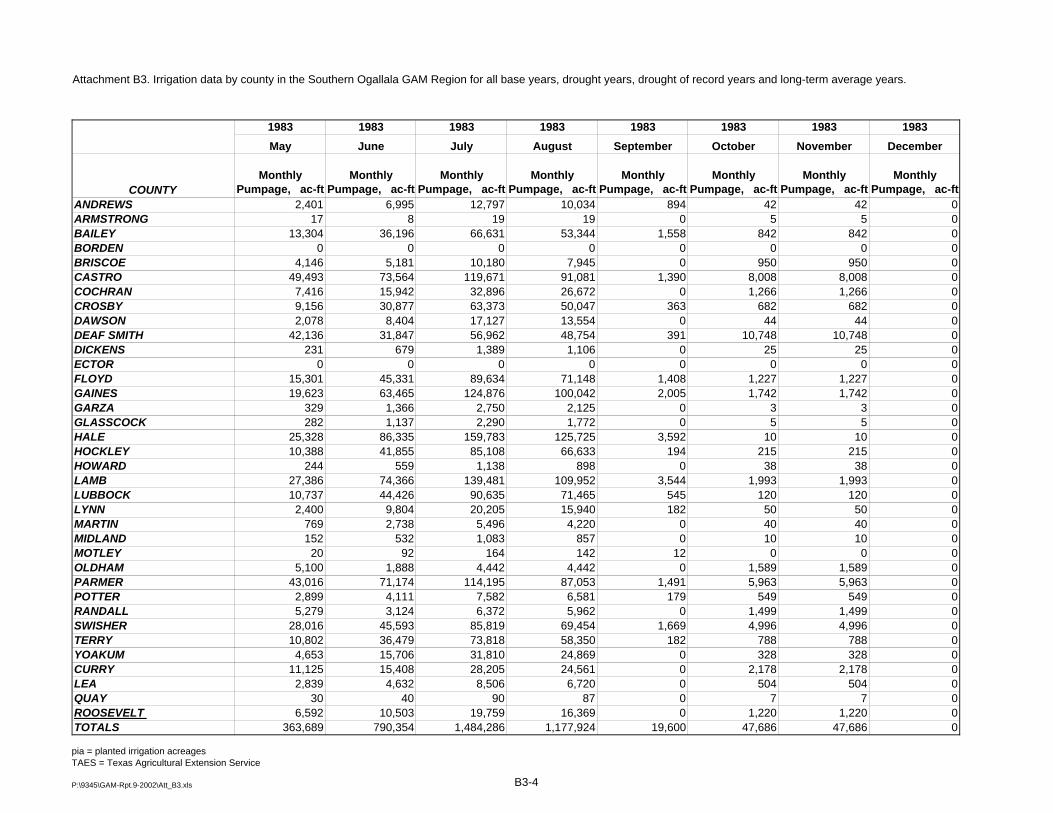
Attachment B3. Irrigation data by county in the Southern Ogallala GAM Region for all base years, drought years, drought of record years and long-term average years.
1983 1983 1983 1983 1983 1983 1983 1983May June July August September October November December
COUNTYMonthly
Pumpage, ac-ftMonthly
Pumpage, ac-ftMonthly
Pumpage, ac-ftMonthly
Pumpage, ac-ftMonthly
Pumpage, ac-ftMonthly
Pumpage, ac-ftMonthly
Pumpage, ac-ftMonthly
Pumpage, ac-ftANDREWS 2,401 6,995 12,797 10,034 894 42 42 0ARMSTRONG 17 8 19 19 0 5 5 0BAILEY 13,304 36,196 66,631 53,344 1,558 842 842 0BORDEN 0 0 0 0 0 0 0 0BRISCOE 4,146 5,181 10,180 7,945 0 950 950 0CASTRO 49,493 73,564 119,671 91,081 1,390 8,008 8,008 0COCHRAN 7,416 15,942 32,896 26,672 0 1,266 1,266 0CROSBY 9,156 30,877 63,373 50,047 363 682 682 0DAWSON 2,078 8,404 17,127 13,554 0 44 44 0DEAF SMITH 42,136 31,847 56,962 48,754 391 10,748 10,748 0DICKENS 231 679 1,389 1,106 0 25 25 0ECTOR 0 0 0 0 0 0 0 0FLOYD 15,301 45,331 89,634 71,148 1,408 1,227 1,227 0GAINES 19,623 63,465 124,876 100,042 2,005 1,742 1,742 0GARZA 329 1,366 2,750 2,125 0 3 3 0GLASSCOCK 282 1,137 2,290 1,772 0 5 5 0HALE 25,328 86,335 159,783 125,725 3,592 10 10 0HOCKLEY 10,388 41,855 85,108 66,633 194 215 215 0HOWARD 244 559 1,138 898 0 38 38 0LAMB 27,386 74,366 139,481 109,952 3,544 1,993 1,993 0LUBBOCK 10,737 44,426 90,635 71,465 545 120 120 0LYNN 2,400 9,804 20,205 15,940 182 50 50 0MARTIN 769 2,738 5,496 4,220 0 40 40 0MIDLAND 152 532 1,083 857 0 10 10 0MOTLEY 20 92 164 142 12 0 0 0OLDHAM 5,100 1,888 4,442 4,442 0 1,589 1,589 0PARMER 43,016 71,174 114,195 87,053 1,491 5,963 5,963 0POTTER 2,899 4,111 7,582 6,581 179 549 549 0RANDALL 5,279 3,124 6,372 5,962 0 1,499 1,499 0SWISHER 28,016 45,593 85,819 69,454 1,669 4,996 4,996 0TERRY 10,802 36,479 73,818 58,350 182 788 788 0YOAKUM 4,653 15,706 31,810 24,869 0 328 328 0CURRY 11,125 15,408 28,205 24,561 0 2,178 2,178 0LEA 2,839 4,632 8,506 6,720 0 504 504 0QUAY 30 40 90 87 0 7 7 0ROOSEVELT 6,592 10,503 19,759 16,369 0 1,220 1,220 0TOTALS 363,689 790,354 1,484,286 1,177,924 19,600 47,686 47,686 0
pia = planted irrigation acreagesTAES = Texas Agricultural Extension Service
P:\9345\GAM-Rpt.9-2002\Att_B3.xls B3-4

Attachment B3. Irrigation data by county in the Southern Ogallala GAM Region for all base years, drought years, drought of record years and long-term average years.
1984 1984 1984 1984January February March April
COUNTY
1984 Planted Irrigated Acres,
piaTAES Total Irr.
Water Use, ac-ftTAES Irr. Water
Use, in/piaMonthly
Pumpage, ac-ftMonthly
Pumpage, ac-ftMonthly
Pumpage, ac-ftMonthly
Pumpage, ac-ftANDREWS 11,800 11,563 11.76 0 0 75 299ARMSTRONG 97 125 15.52 0 0 5 19BAILEY 109,400 146,389 16.06 0 0 963 7,140BORDEN 500 168 0.00 0 0 17 67BRISCOE 18,780 28,312 18.09 0 0 343 1,486CASTRO 240,400 416,520 20.79 0 0 7,300 40,974COCHRAN 83,000 100,166 14.48 0 0 1,469 5,877CROSBY 127,800 163,163 15.32 0 0 723 2,891DAWSON 35,400 38,078 12.91 0 0 53 211DEAF SMITH 141,500 220,633 18.71 0 0 6,640 29,986DICKENS 4,000 4,952 14.86 0 0 11 44ECTOR 0 0 0.00 0 0 0 0FLOYD 192,836 255,234 15.88 0 0 1,161 6,170GAINES 251,400 255,210 12.18 0 0 1,409 5,637GARZA 5,700 7,353 15.48 0 0 0 0GLASSCOCK 3,468 5,167 17.88 0 0 1 6HALE 319,500 423,736 15.91 0 0 72 9,120HOCKLEY 149,000 169,640 13.66 0 0 425 1,701HOWARD 3,200 3,812 14.30 0 0 7 27LAMB 233,500 321,725 16.53 0 0 1,319 10,996LUBBOCK 199,300 253,456 15.26 0 0 343 1,926LYNN 43,700 53,493 14.69 0 0 94 377MARTIN 9,500 9,509 12.01 0 0 62 246MIDLAND 2,070 2,898 16.80 0 0 7 28MOTLEY 375 555 17.77 0 0 0 1OLDHAM 17,700 24,085 16.33 0 0 1,119 4,478PARMER 228,200 349,416 18.37 0 0 6,807 37,357POTTER 27,600 37,689 16.39 0 0 1,682 7,183RANDALL 34,960 48,629 16.69 0 0 2,488 10,370SWISHER 196,800 306,589 18.69 0 0 7,274 33,501TERRY 139,900 152,415 13.07 0 0 693 2,770YOAKUM 65,400 70,780 12.99 0 0 373 1,492CURRY 105,600 102,397 11.64 0 0 1,764 9,295LEA 25,800 23,083 10.74 0 0 756 3,238QUAY 360 311 10.38 0 0 7 30ROOSEVELT 72,800 62,394 10.28 0 0 1,015 4,855TOTALS 3,101,346 4,069,648 15.75 0 0 46,477 239,797
pia = planted irrigation acreagesTAES = Texas Agricultural Extension Service
P:\9345\GAM-Rpt.9-2002\Att_B3.xls B3-5

Attachment B3. Irrigation data by county in the Southern Ogallala GAM Region for all base years, drought years, drought of record years and long-term average years.
1984 1984 1984 1984 1984 1984 1984 1984May June July August September October November December
COUNTYMonthly
Pumpage, ac-ftMonthly
Pumpage, ac-ftMonthly
Pumpage, ac-ftMonthly
Pumpage, ac-ftMonthly
Pumpage, ac-ftMonthly
Pumpage, ac-ftMonthly
Pumpage, ac-ftMonthly
Pumpage, ac-ftANDREWS 746 2,234 4,524 3,537 0 75 75 0ARMSTRONG 17 13 31 31 0 5 5 0BAILEY 12,666 30,636 52,538 40,358 162 963 963 0BORDEN 50 0 0 0 0 17 17 0BRISCOE 2,318 5,180 10,220 8,080 0 343 343 0CASTRO 50,103 79,997 127,248 95,634 664 7,300 7,300 0COCHRAN 8,416 17,419 35,633 28,412 0 1,469 1,469 0CROSBY 9,684 32,184 65,212 51,024 0 723 723 0DAWSON 1,992 7,799 15,728 12,190 0 53 53 0DEAF SMITH 29,382 31,739 58,424 50,791 390 6,640 6,640 0DICKENS 268 1,003 2,027 1,577 0 11 11 0ECTOR 0 0 0 0 0 0 0 0FLOYD 16,392 50,741 99,524 78,472 453 1,161 1,161 0GAINES 15,594 50,677 97,732 78,851 2,491 1,409 1,409 0GARZA 360 1,527 3,085 2,365 16 0 0 0GLASSCOCK 259 1,077 2,162 1,659 0 1 1 0HALE 28,739 92,776 164,454 126,396 2,033 72 72 0HOCKLEY 9,359 34,359 69,276 53,668 0 425 425 0HOWARD 195 762 1,561 1,248 0 7 7 0LAMB 24,561 68,216 121,235 92,088 672 1,319 1,319 0LUBBOCK 13,775 52,331 103,927 80,468 0 343 343 0LYNN 2,872 10,959 22,033 16,970 0 94 94 0MARTIN 618 1,846 3,724 2,889 0 62 62 0MIDLAND 163 594 1,188 905 0 7 7 0MOTLEY 26 121 212 179 16 0 0 0OLDHAM 3,745 2,191 5,156 5,156 0 1,119 1,119 0PARMER 43,967 65,851 103,442 78,017 362 6,807 6,807 0POTTER 6,309 4,276 7,893 6,983 0 1,682 1,682 0RANDALL 8,762 4,708 9,081 8,244 0 2,488 2,488 0SWISHER 36,510 49,710 90,951 73,062 1,033 7,274 7,274 0TERRY 9,071 30,074 60,658 47,618 145 693 693 0YOAKUM 4,333 13,943 27,746 21,906 242 373 373 0CURRY 11,047 18,146 31,743 26,873 0 1,764 1,764 0LEA 3,176 3,267 6,137 4,996 0 756 756 0QUAY 30 43 96 91 0 7 7 0ROOSEVELT 6,130 10,964 20,507 16,893 0 1,015 1,015 0TOTALS 361,639 777,361 1,425,110 1,117,629 8,679 46,477 46,477 0
pia = planted irrigation acreagesTAES = Texas Agricultural Extension Service
P:\9345\GAM-Rpt.9-2002\Att_B3.xls B3-6
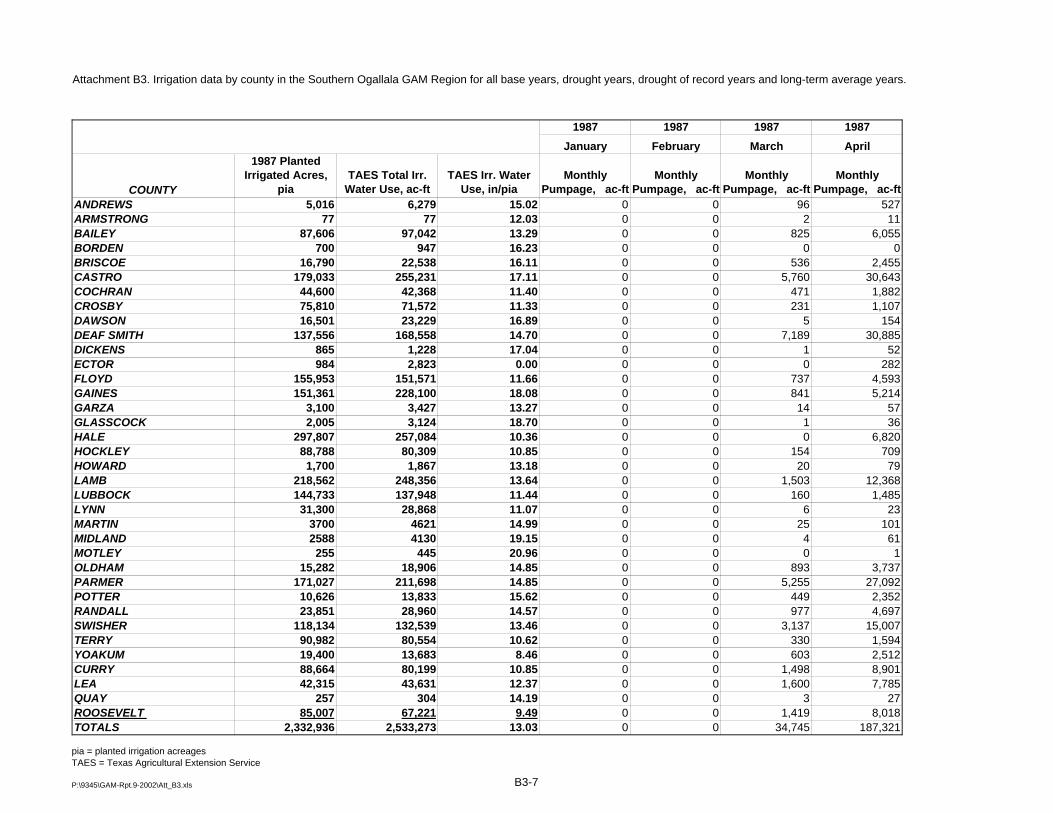
Attachment B3. Irrigation data by county in the Southern Ogallala GAM Region for all base years, drought years, drought of record years and long-term average years.
1987 1987 1987 1987January February March April
COUNTY
1987 Planted Irrigated Acres,
piaTAES Total Irr.
Water Use, ac-ftTAES Irr. Water
Use, in/piaMonthly
Pumpage, ac-ftMonthly
Pumpage, ac-ftMonthly
Pumpage, ac-ftMonthly
Pumpage, ac-ftANDREWS 5,016 6,279 15.02 0 0 96 527ARMSTRONG 77 77 12.03 0 0 2 11BAILEY 87,606 97,042 13.29 0 0 825 6,055BORDEN 700 947 16.23 0 0 0 0BRISCOE 16,790 22,538 16.11 0 0 536 2,455CASTRO 179,033 255,231 17.11 0 0 5,760 30,643COCHRAN 44,600 42,368 11.40 0 0 471 1,882CROSBY 75,810 71,572 11.33 0 0 231 1,107DAWSON 16,501 23,229 16.89 0 0 5 154DEAF SMITH 137,556 168,558 14.70 0 0 7,189 30,885DICKENS 865 1,228 17.04 0 0 1 52ECTOR 984 2,823 0.00 0 0 0 282FLOYD 155,953 151,571 11.66 0 0 737 4,593GAINES 151,361 228,100 18.08 0 0 841 5,214GARZA 3,100 3,427 13.27 0 0 14 57GLASSCOCK 2,005 3,124 18.70 0 0 1 36HALE 297,807 257,084 10.36 0 0 0 6,820HOCKLEY 88,788 80,309 10.85 0 0 154 709HOWARD 1,700 1,867 13.18 0 0 20 79LAMB 218,562 248,356 13.64 0 0 1,503 12,368LUBBOCK 144,733 137,948 11.44 0 0 160 1,485LYNN 31,300 28,868 11.07 0 0 6 23MARTIN 3700 4621 14.99 0 0 25 101MIDLAND 2588 4130 19.15 0 0 4 61MOTLEY 255 445 20.96 0 0 0 1OLDHAM 15,282 18,906 14.85 0 0 893 3,737PARMER 171,027 211,698 14.85 0 0 5,255 27,092POTTER 10,626 13,833 15.62 0 0 449 2,352RANDALL 23,851 28,960 14.57 0 0 977 4,697SWISHER 118,134 132,539 13.46 0 0 3,137 15,007TERRY 90,982 80,554 10.62 0 0 330 1,594YOAKUM 19,400 13,683 8.46 0 0 603 2,512CURRY 88,664 80,199 10.85 0 0 1,498 8,901LEA 42,315 43,631 12.37 0 0 1,600 7,785QUAY 257 304 14.19 0 0 3 27ROOSEVELT 85,007 67,221 9.49 0 0 1,419 8,018TOTALS 2,332,936 2,533,273 13.03 0 0 34,745 187,321
pia = planted irrigation acreagesTAES = Texas Agricultural Extension Service
P:\9345\GAM-Rpt.9-2002\Att_B3.xls B3-7

Attachment B3. Irrigation data by county in the Southern Ogallala GAM Region for all base years, drought years, drought of record years and long-term average years.
1987 1987 1987 1987 1987 1987 1987 1987May June July August September October November December
COUNTYMonthly
Pumpage, ac-ftMonthly
Pumpage, ac-ftMonthly
Pumpage, ac-ftMonthly
Pumpage, ac-ftMonthly
Pumpage, ac-ftMonthly
Pumpage, ac-ftMonthly
Pumpage, ac-ftMonthly
Pumpage, ac-ftANDREWS 690 1,090 1,913 1,556 215 96 96 0ARMSTRONG 10 10 19 18 2 2 2 0BAILEY 9,521 19,359 32,225 25,417 1,990 825 825 0BORDEN 47 199 398 303 0 0 0 0BRISCOE 2,721 3,594 6,593 5,320 245 536 536 0CASTRO 34,284 44,959 70,542 54,442 3,080 5,760 5,760 0COCHRAN 3,184 7,686 15,707 12,497 0 471 471 0CROSBY 4,201 14,251 28,550 22,496 274 231 231 0DAWSON 1,295 4,827 9,427 7,310 201 5 5 0DEAF SMITH 27,461 19,857 36,582 32,103 103 7,189 7,189 0DICKENS 111 250 408 333 69 1 1 0ECTOR 423 565 565 565 423 0 0 0FLOYD 10,665 29,996 57,274 45,230 1,601 737 737 0GAINES 14,958 46,479 85,141 68,683 5,101 841 841 0GARZA 198 672 1,370 1,087 0 14 14 0GLASSCOCK 188 646 1,238 967 46 1 1 0HALE 18,759 55,858 96,392 75,388 3,866 0 0 0HOCKLEY 4,413 16,371 32,795 25,417 142 154 154 0HOWARD 139 343 698 549 0 20 20 0LAMB 22,204 50,687 86,440 67,347 4,800 1,503 1,503 0LUBBOCK 8,004 28,432 55,410 43,138 1,002 160 160 0LYNN 1,438 6,010 12,081 9,299 0 6 6 0MARTIN 290 910 1,831 1,414 0 25 25 0MIDLAND 260 850 1,617 1,263 67 4 4 0MOTLEY 19 99 158 146 22 0 0 0OLDHAM 3,176 1,745 3,662 3,662 245 893 893 0PARMER 29,455 36,748 57,299 43,797 1,542 5,255 5,255 0POTTER 2,295 1,756 2,623 2,623 837 449 449 0RANDALL 4,453 3,498 6,099 6,099 1,182 977 977 0SWISHER 16,459 21,402 37,893 30,720 1,648 3,137 3,137 0TERRY 5,009 16,042 31,566 24,800 551 330 330 0YOAKUM 2,183 1,478 2,690 2,690 322 603 603 0CURRY 10,316 14,050 21,833 18,475 2,132 1,498 1,498 0LEA 7,515 5,618 8,557 7,374 1,982 1,600 1,600 0QUAY 35 52 82 79 21 3 3 0ROOSEVELT 8,956 11,088 17,517 15,163 2,220 1,419 1,419 0TOTALS 255,338 467,480 825,196 657,772 35,932 34,745 34,745 0
pia = planted irrigation acreagesTAES = Texas Agricultural Extension Service
P:\9345\GAM-Rpt.9-2002\Att_B3.xls B3-8

Attachment B3. Irrigation data by county in the Southern Ogallala GAM Region for all base years, drought years, drought of record years and long-term average years.
1992 1992 1992 1992January February March April
COUNTY
1992 Planted Irrigated Acres,
piaTAES Total Irr.
Water Use, ac-ftTAES Irr. Water
Use, in/piaMonthly
Pumpage, ac-ftMonthly
Pumpage, ac-ftMonthly
Pumpage, ac-ftMonthly
Pumpage, ac-ftANDREWS 7,601 7,720 12.19 0 0 9 139ARMSTRONG 150 143 11.41 0 0 8 35BAILEY 127,486 127,389 11.99 0 0 633 6,124BORDEN 1,900 3,096 19.55 0 0 55 220BRISCOE 26,988 30,759 13.68 0 0 382 1,986CASTRO 252,172 303,885 14.46 0 0 5,280 31,427COCHRAN 78,260 74,803 11.47 0 0 81 386CROSBY 176,930 153,672 10.42 0 0 145 1,054DAWSON 27,213 31,262 13.79 0 0 27 257DEAF SMITH 177,275 202,402 13.70 0 0 7,139 31,658DICKENS 1,650 2,039 14.83 0 0 2 7ECTOR 0 0 0.00 0 0 0 0FLOYD 241,978 213,830 10.60 0 0 432 3,496GAINES 242,574 320,398 15.85 0 0 855 4,790GARZA 4,000 4,285 12.85 0 0 22 87GLASSCOCK 3,223 4,274 15.92 0 0 2 24HALE 462,718 376,085 9.75 0 0 0 7,329HOCKLEY 180,152 171,899 11.45 0 0 37 354HOWARD 6,230 7,230 13.93 0 0 21 138LAMB 298,547 294,090 11.82 0 0 782 7,833LUBBOCK 249,115 216,468 10.43 0 0 46 987LYNN 78,916 69,117 10.51 0 0 5 260MARTIN 10644 13202 14.88 0 0 12 131MIDLAND 3151 5002 19.05 0 0 3 180MOTLEY 221 377 20.47 0 0 0 4OLDHAM 16,215 18,025 13.34 0 0 985 4,183PARMER 255,294 261,250 12.28 0 0 3,718 23,911POTTER 11,539 12,618 13.12 0 0 612 2,881RANDALL 30,270 34,317 13.60 0 0 1,355 6,338SWISHER 160,281 161,020 12.06 0 0 2,274 12,496TERRY 159,645 152,204 11.44 0 0 125 785YOAKUM 80,342 96,880 14.47 0 0 0 140CURRY 130,550 108,583 9.98 0 0 3,085 14,946LEA 42,051 57,197 16.32 0 0 529 4,236QUAY 215 339 18.92 0 0 2 33ROOSEVELT 99,910 102,926 12.36 0 0 1,180 7,234TOTALS 3,645,406 3,638,785 11.98 0 0 29,846 176,089
pia = planted irrigation acreagesTAES = Texas Agricultural Extension Service
P:\9345\GAM-Rpt.9-2002\Att_B3.xls B3-9
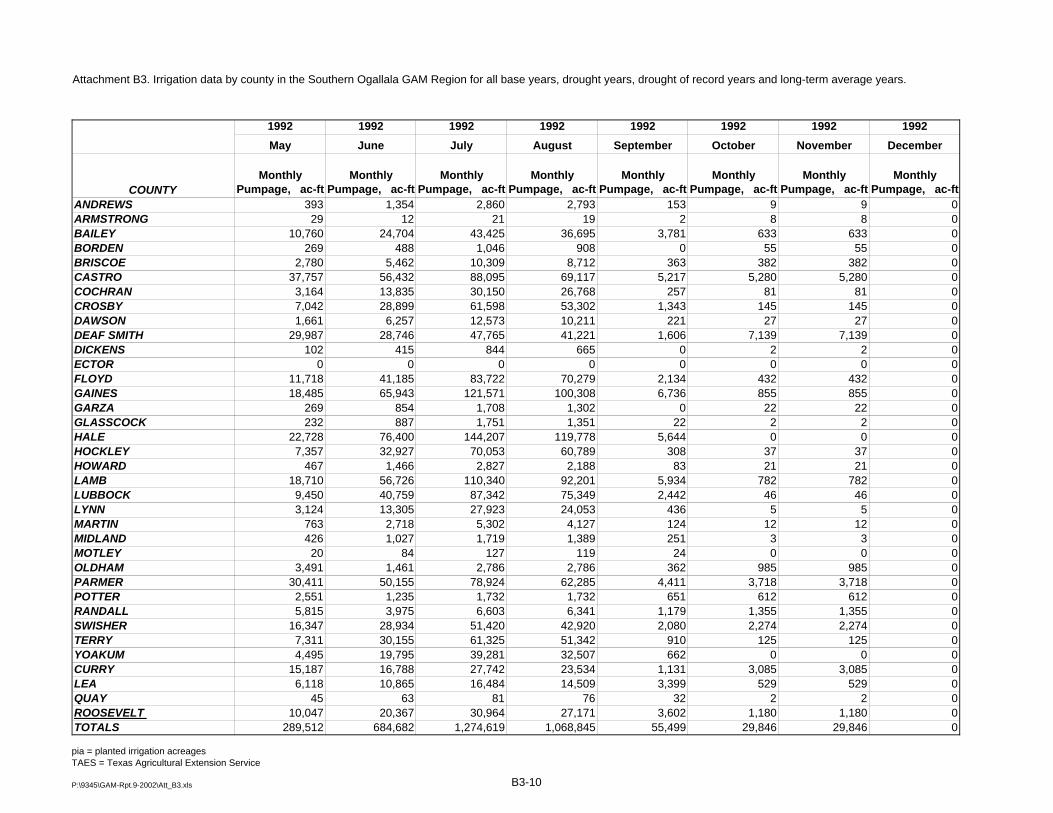
Attachment B3. Irrigation data by county in the Southern Ogallala GAM Region for all base years, drought years, drought of record years and long-term average years.
1992 1992 1992 1992 1992 1992 1992 1992May June July August September October November December
COUNTYMonthly
Pumpage, ac-ftMonthly
Pumpage, ac-ftMonthly
Pumpage, ac-ftMonthly
Pumpage, ac-ftMonthly
Pumpage, ac-ftMonthly
Pumpage, ac-ftMonthly
Pumpage, ac-ftMonthly
Pumpage, ac-ftANDREWS 393 1,354 2,860 2,793 153 9 9 0ARMSTRONG 29 12 21 19 2 8 8 0BAILEY 10,760 24,704 43,425 36,695 3,781 633 633 0BORDEN 269 488 1,046 908 0 55 55 0BRISCOE 2,780 5,462 10,309 8,712 363 382 382 0CASTRO 37,757 56,432 88,095 69,117 5,217 5,280 5,280 0COCHRAN 3,164 13,835 30,150 26,768 257 81 81 0CROSBY 7,042 28,899 61,598 53,302 1,343 145 145 0DAWSON 1,661 6,257 12,573 10,211 221 27 27 0DEAF SMITH 29,987 28,746 47,765 41,221 1,606 7,139 7,139 0DICKENS 102 415 844 665 0 2 2 0ECTOR 0 0 0 0 0 0 0 0FLOYD 11,718 41,185 83,722 70,279 2,134 432 432 0GAINES 18,485 65,943 121,571 100,308 6,736 855 855 0GARZA 269 854 1,708 1,302 0 22 22 0GLASSCOCK 232 887 1,751 1,351 22 2 2 0HALE 22,728 76,400 144,207 119,778 5,644 0 0 0HOCKLEY 7,357 32,927 70,053 60,789 308 37 37 0HOWARD 467 1,466 2,827 2,188 83 21 21 0LAMB 18,710 56,726 110,340 92,201 5,934 782 782 0LUBBOCK 9,450 40,759 87,342 75,349 2,442 46 46 0LYNN 3,124 13,305 27,923 24,053 436 5 5 0MARTIN 763 2,718 5,302 4,127 124 12 12 0MIDLAND 426 1,027 1,719 1,389 251 3 3 0MOTLEY 20 84 127 119 24 0 0 0OLDHAM 3,491 1,461 2,786 2,786 362 985 985 0PARMER 30,411 50,155 78,924 62,285 4,411 3,718 3,718 0POTTER 2,551 1,235 1,732 1,732 651 612 612 0RANDALL 5,815 3,975 6,603 6,341 1,179 1,355 1,355 0SWISHER 16,347 28,934 51,420 42,920 2,080 2,274 2,274 0TERRY 7,311 30,155 61,325 51,342 910 125 125 0YOAKUM 4,495 19,795 39,281 32,507 662 0 0 0CURRY 15,187 16,788 27,742 23,534 1,131 3,085 3,085 0LEA 6,118 10,865 16,484 14,509 3,399 529 529 0QUAY 45 63 81 76 32 2 2 0ROOSEVELT 10,047 20,367 30,964 27,171 3,602 1,180 1,180 0TOTALS 289,512 684,682 1,274,619 1,068,845 55,499 29,846 29,846 0
pia = planted irrigation acreagesTAES = Texas Agricultural Extension Service
P:\9345\GAM-Rpt.9-2002\Att_B3.xls B3-10

Attachment B3. Irrigation data by county in the Southern Ogallala GAM Region for all base years, drought years, drought of record years and long-term average years.
1993 1993 1993 1993January February March April
COUNTY
1993 Planted Irrigated Acres,
piaTAES Total Irr.
Water Use, ac-ftTAES Irr. Water
Use, in/piaMonthly
Pumpage, ac-ftMonthly
Pumpage, ac-ftMonthly
Pumpage, ac-ftMonthly
Pumpage, ac-ftANDREWS 3,501 5,136 17.60 0 0 0 115ARMSTRONG 93 117 15.04 0 0 5 22BAILEY 110,100 140,049 15.26 0 0 635 4,713BORDEN 0 0 0.00 0 0 0 0BRISCOE 25,080 36,299 17.37 0 0 840 3,585CASTRO 227,400 368,552 19.45 0 0 7,903 42,474COCHRAN 59,700 79,749 16.03 0 0 264 1,054CROSBY 148,900 193,050 15.56 0 0 263 1,318DAWSON 43,300 53,333 14.78 0 0 56 222DEAF SMITH 167,700 240,951 17.24 0 0 8,499 39,253DICKENS 1,000 1,279 15.35 0 0 0 0ECTOR 0 0 0.00 0 0 0 0FLOYD 182,263 231,136 15.22 0 0 451 3,757GAINES 251,300 303,810 14.51 0 0 1,401 5,606GARZA 4,200 5,390 15.40 0 0 0 0GLASSCOCK 3,247 4,073 15.05 0 0 0 0HALE 319,400 398,524 14.97 0 0 118 9,315HOCKLEY 131,700 175,304 15.97 0 0 0 0HOWARD 3,400 3,837 13.54 0 0 0 0LAMB 243,900 323,177 15.90 0 0 1,363 11,804LUBBOCK 188,400 243,639 15.52 0 0 127 681LYNN 47,200 54,541 13.87 0 0 0 0MARTIN 11,300 14,166 15.04 0 0 0 0MIDLAND 1,920 2,530 15.81 0 0 0 0MOTLEY 203 238 14.09 0 0 0 0OLDHAM 10,600 11,776 13.33 0 0 740 2,961PARMER 229,600 327,375 17.11 0 0 5,526 32,101POTTER 12,200 11,275 11.09 0 0 897 3,587RANDALL 30,080 36,216 14.45 0 0 2,305 9,577SWISHER 129,700 184,368 17.06 0 0 3,269 16,251TERRY 131,300 167,234 15.28 0 0 234 936YOAKUM 59,700 76,500 15.38 0 0 160 794CURRY 125,050 115,350 11.07 0 0 2,695 13,614LEA 29,050 32,847 13.57 0 0 706 3,089QUAY 139 158 13.67 0 0 2 10ROOSEVELT 93,250 95,996 12.35 0 0 1,231 7,156TOTALS 3,025,875 3,937,974 15.62 0 0 39,689 213,996
pia = planted irrigation acreagesTAES = Texas Agricultural Extension Service
P:\9345\GAM-Rpt.9-2002\Att_B3.xls B3-11

Attachment B3. Irrigation data by county in the Southern Ogallala GAM Region for all base years, drought years, drought of record years and long-term average years.
1993 1993 1993 1993 1993 1993 1993 1993May June July August September October November December
COUNTYMonthly
Pumpage, ac-ftMonthly
Pumpage, ac-ftMonthly
Pumpage, ac-ftMonthly
Pumpage, ac-ftMonthly
Pumpage, ac-ftMonthly
Pumpage, ac-ftMonthly
Pumpage, ac-ftMonthly
Pumpage, ac-ftANDREWS 372 1,067 1,904 1,505 172 0 0 0ARMSTRONG 20 15 25 21 0 5 5 0BAILEY 10,437 29,161 52,785 41,046 0 635 635 0BORDEN 0 0 0 0 0 0 0 0BRISCOE 4,088 5,934 11,351 8,820 0 840 840 0CASTRO 48,464 68,280 105,944 79,237 443 7,903 7,903 0COCHRAN 4,578 16,057 32,319 24,951 0 264 264 0CROSBY 10,289 39,628 79,315 61,712 0 263 263 0DAWSON 2,771 11,013 22,131 17,029 0 56 56 0DEAF SMITH 37,613 35,079 57,207 46,301 0 8,499 8,499 0DICKENS 64 269 537 409 0 0 0 0ECTOR 0 0 0 0 0 0 0 0FLOYD 13,844 47,530 91,766 72,515 370 451 451 0GAINES 18,137 61,847 116,951 93,384 3,681 1,401 1,401 0GARZA 269 1,132 2,264 1,725 0 0 0 0GLASSCOCK 204 855 1,711 1,303 0 0 0 0HALE 28,162 88,643 153,810 117,550 690 118 118 0HOCKLEY 8,594 36,472 73,457 56,781 0 0 0 0HOWARD 192 806 1,611 1,228 0 0 0 0LAMB 25,515 69,242 120,825 91,323 379 1,363 1,363 0LUBBOCK 12,386 50,443 101,321 78,247 180 127 127 0LYNN 2,694 11,387 22,874 17,587 0 0 0 0MARTIN 708 2,975 5,950 4,533 0 0 0 0MIDLAND 127 531 1,063 810 0 0 0 0MOTLEY 11 52 90 77 8 0 0 0OLDHAM 2,352 743 1,749 1,749 0 740 740 0PARMER 39,538 63,835 99,719 75,372 232 5,526 5,526 0POTTER 2,759 393 924 924 0 897 897 0RANDALL 7,811 2,813 4,909 4,191 0 2,305 2,305 0SWISHER 20,004 33,252 58,748 46,144 161 3,269 3,269 0TERRY 8,713 34,336 68,670 53,569 308 234 234 0YOAKUM 4,286 15,912 30,658 23,939 431 160 160 0CURRY 14,783 19,810 32,425 26,478 156 2,695 2,695 0LEA 3,566 5,662 9,856 8,124 434 706 706 0QUAY 14 28 53 47 0 2 2 0ROOSEVELT 9,658 19,180 30,124 24,922 1,265 1,231 1,231 0TOTALS 343,021 774,380 1,395,046 1,083,553 8,911 39,689 39,689 0
pia = planted irrigation acreagesTAES = Texas Agricultural Extension Service
P:\9345\GAM-Rpt.9-2002\Att_B3.xls B3-12

Attachment B3. Irrigation data by county in the Southern Ogallala GAM Region for all base years, drought years, drought of record years and long-term average years.
1994 1994 1994 1994January February March April
COUNTY
1994 Planted Irrigated Acres,
piaTAES Total Irr.
Water Use, ac-ftTAES Irr. Water
Use, in/piaMonthly
Pumpage, ac-ftMonthly
Pumpage, ac-ftMonthly
Pumpage, ac-ftMonthly
Pumpage, ac-ftANDREWS 4,400 5,963 16.26 0 0 0 0ARMSTRONG 109 129 14.25 0 0 7 31BAILEY 109,400 124,924 13.70 0 0 1,183 6,624BORDEN 1,500 2,803 22.43 0 0 0 0BRISCOE 22,020 33,584 18.30 0 0 674 2,960CASTRO 132,000 160,445 14.59 0 0 5,436 23,596COCHRAN 59,100 80,122 16.27 0 0 300 1,333CROSBY 133,300 154,332 13.89 0 0 452 1,808DAWSON 44,400 54,051 14.61 0 0 245 980DEAF SMITH 148,500 221,386 17.89 0 0 6,429 31,598DICKENS 1,750 2,060 14.13 0 0 0 0ECTOR 0 0 0.00 0 0 0 0FLOYD 178,383 215,910 14.52 0 0 643 4,666GAINES 254,300 322,453 15.22 0 0 1,221 4,884GARZA 7,800 8,998 13.84 0 0 0 0GLASSCOCK 3,995 5,324 15.99 0 0 6 23HALE 323,400 385,001 14.29 0 0 303 9,877HOCKLEY 140,300 185,934 15.90 0 0 119 619HOWARD 3,000 2,473 9.89 0 0 81 322LAMB 231,700 301,970 15.64 0 0 1,248 10,739LUBBOCK 177,800 208,500 14.07 0 0 75 480LYNN 47,200 54,445 13.84 0 0 0 0MARTIN 9,900 12,568 15.23 0 0 0 0MIDLAND 2,730 3,686 16.20 0 0 0 0MOTLEY 345 442 15.37 0 0 0 0OLDHAM 14,600 18,144 14.91 0 0 1,168 4,672PARMER 222,800 300,227 16.17 0 0 3,848 25,119POTTER 11,300 12,038 12.78 0 0 874 3,498RANDALL 29,760 37,554 15.14 0 0 1,826 7,799SWISHER 135,300 185,382 16.44 0 0 2,260 12,619TERRY 122,400 157,783 15.47 0 0 238 1,095YOAKUM 77,400 99,129 15.37 0 0 216 972CURRY 137,550 138,782 12.11 0 0 3,460 17,312LEA 27,500 34,537 15.07 0 0 587 2,839QUAY 173 184 12.74 0 0 4 17ROOSEVELT 80,809 103,046 15.30 0 0 1,100 6,780TOTALS 2,896,924 3,634,311 15.05 0 0 34,003 183,264
pia = planted irrigation acreagesTAES = Texas Agricultural Extension Service
P:\9345\GAM-Rpt.9-2002\Att_B3.xls B3-13

Attachment B3. Irrigation data by county in the Southern Ogallala GAM Region for all base years, drought years, drought of record years and long-term average years.
1994 1994 1994 1994 1994 1994 1994 1994May June July August September October November December
COUNTYMonthly
Pumpage, ac-ftMonthly
Pumpage, ac-ftMonthly
Pumpage, ac-ftMonthly
Pumpage, ac-ftMonthly
Pumpage, ac-ftMonthly
Pumpage, ac-ftMonthly
Pumpage, ac-ftMonthly
Pumpage, ac-ftANDREWS 276 1,297 2,304 1,930 156 0 0 0ARMSTRONG 26 13 21 17 0 7 7 0BAILEY 10,944 24,961 44,699 34,147 0 1,183 1,183 0BORDEN 140 589 1,177 897 0 0 0 0BRISCOE 3,572 5,736 10,849 8,445 0 674 674 0CASTRO 23,032 22,852 41,658 32,582 417 5,436 5,436 0COCHRAN 4,828 16,180 32,145 24,736 0 300 300 0CROSBY 8,607 30,982 62,682 48,897 0 452 452 0DAWSON 3,282 10,903 21,370 16,546 235 245 245 0DEAF SMITH 32,331 36,311 57,054 44,805 0 6,429 6,429 0DICKENS 103 433 865 659 0 0 0 0ECTOR 0 0 0 0 0 0 0 0FLOYD 14,040 44,741 84,627 65,793 116 643 643 0GAINES 18,543 66,229 124,985 100,049 4,099 1,221 1,221 0GARZA 450 1,890 3,779 2,879 0 0 0 0GLASSCOCK 278 1,101 2,209 1,695 0 6 6 0HALE 27,986 85,722 147,756 112,262 488 303 303 0HOCKLEY 9,690 38,816 77,345 59,107 0 119 119 0HOWARD 325 350 701 534 0 81 81 0LAMB 23,444 64,296 113,177 86,041 530 1,248 1,248 0LUBBOCK 10,705 43,597 86,914 66,579 0 75 75 0LYNN 2,695 11,378 22,839 17,533 0 0 0 0MARTIN 628 2,639 5,279 4,022 0 0 0 0MIDLAND 184 774 1,548 1,180 0 0 0 0MOTLEY 19 98 162 144 19 0 0 0OLDHAM 3,698 1,099 2,586 2,586 0 1,168 1,168 0PARMER 33,755 61,500 95,841 72,039 431 3,848 3,848 0POTTER 2,722 560 1,317 1,317 0 874 874 0RANDALL 6,749 4,070 7,223 6,234 0 1,826 1,826 0SWISHER 18,067 36,185 62,926 48,804 0 2,260 2,260 0TERRY 8,474 32,626 64,551 50,001 321 238 238 0YOAKUM 5,481 20,471 39,912 31,173 471 216 216 0CURRY 18,453 23,539 38,089 30,837 173 3,460 3,460 0LEA 3,607 6,425 10,936 8,674 296 587 587 0QUAY 19 30 57 50 0 4 4 0ROOSEVELT 9,841 21,247 33,089 27,214 1,573 1,100 1,100 0TOTALS 306,996 719,640 1,302,672 1,010,405 9,325 34,003 34,003 0
pia = planted irrigation acreagesTAES = Texas Agricultural Extension Service
P:\9345\GAM-Rpt.9-2002\Att_B3.xls B3-14

Attachment B3. Irrigation data by county in the Southern Ogallala GAM Region for all base years, drought years, drought of record years and long-term average years.
1997 1997 1997 1997January February March April
COUNTY
1997 Planted Irrigated Acres,
piaTAES Total Irr.
Water Use, ac-ftTAES Irr. Water
Use, in/piaMonthly
Pumpage, ac-ftMonthly
Pumpage, ac-ftMonthly
Pumpage, ac-ftMonthly
Pumpage, ac-ftANDREWS 12,271 17,309 16.93 0 0 0 128ARMSTRONG 95 63 7.94 0 0 2 8BAILEY 95,402 93,040 11.70 0 0 172 2,921BORDEN 5,000 5,864 14.07 0 0 0 0BRISCOE 19,137 14,455 9.06 0 0 52 356CASTRO 275,907 282,039 12.27 0 0 2,993 22,139COCHRAN 76,250 73,224 11.52 0 0 0 316CROSBY 134,835 108,959 9.70 0 0 0 46DAWSON 77,405 95,400 14.79 0 0 91 596DEAF SMITH 197,993 172,527 10.46 0 0 4,774 24,053DICKENS 4,683 6,524 16.72 0 0 0 314ECTOR 1,313 3,542 32.37 0 0 0 354FLOYD 184,046 138,604 9.04 0 0 119 1,881GAINES 230,872 305,859 15.90 0 0 379 2,367GARZA 12,500 14,748 14.16 0 0 0 0GLASSCOCK 4,496 6,395 17.07 0 0 0 6HALE 360,763 229,009 7.62 0 0 0 5,134HOCKLEY 159,594 148,181 11.14 0 0 40 565HOWARD 3,000 3,733 14.93 0 0 0 45LAMB 226,262 230,078 12.20 0 0 359 6,624LUBBOCK 217,338 180,437 9.96 0 0 113 1,223LYNN 55,830 47,218 10.15 0 0 0 181MARTIN 7,890 10,184 15.49 0 0 0 19MIDLAND 3,718 6,151 19.85 0 0 0 163MOTLEY 387 406 12.60 0 0 0 14OLDHAM 30,182 27,314 10.86 0 0 1,520 6,230PARMER 232,819 214,388 11.05 0 0 2,214 16,475POTTER 28,219 16,548 7.04 0 0 917 4,185RANDALL 37,484 38,190 12.23 0 0 817 4,780SWISHER 138,876 103,085 8.91 0 0 472 4,297TERRY 172,031 170,468 11.89 0 0 220 1,474YOAKUM 105,909 131,643 14.92 0 0 162 877CURRY 117,695 92,905 9.47 0 0 1,343 8,357LEA 34,291 46,921 16.42 0 0 247 2,773QUAY 335 397 14.21 0 0 2 33ROOSEVELT 93,048 99,103 12.78 0 0 440 4,114TOTALS 3,357,876 3,134,910 11.20 0 0 17,447 123,048
pia = planted irrigation acreagesTAES = Texas Agricultural Extension Service
P:\9345\GAM-Rpt.9-2002\Att_B3.xls B3-15

Attachment B3. Irrigation data by county in the Southern Ogallala GAM Region for all base years, drought years, drought of record years and long-term average years.
1997 1997 1997 1997 1997 1997 1997 1997May June July August September October November December
COUNTYMonthly
Pumpage, ac-ftMonthly
Pumpage, ac-ftMonthly
Pumpage, ac-ftMonthly
Pumpage, ac-ftMonthly
Pumpage, ac-ftMonthly
Pumpage, ac-ftMonthly
Pumpage, ac-ftMonthly
Pumpage, ac-ftANDREWS 935 3,739 6,462 5,444 601 0 0 0ARMSTRONG 8 10 17 14 1 2 2 0BAILEY 7,065 19,435 34,087 27,257 1,757 172 172 0BORDEN 293 1,231 2,463 1,876 0 0 0 0BRISCOE 971 2,954 5,586 4,378 53 52 52 0CASTRO 31,427 59,523 90,569 67,799 1,603 2,993 2,993 0COCHRAN 3,664 15,002 29,562 24,161 519 0 0 0CROSBY 5,367 22,619 45,548 35,270 110 0 0 0DAWSON 4,891 20,193 36,733 30,526 2,189 91 91 0DEAF SMITH 24,850 27,575 43,682 35,946 2,101 4,774 4,774 0DICKENS 640 1,339 2,050 1,711 471 0 0 0ECTOR 531 708 708 708 531 0 0 0FLOYD 8,185 28,853 55,179 43,574 575 119 119 0GAINES 15,900 65,386 115,275 97,149 8,647 379 379 0GARZA 737 3,097 6,194 4,719 0 0 0 0GLASSCOCK 323 1,336 2,669 2,052 9 0 0 0HALE 16,082 50,243 87,697 68,161 1,692 0 0 0HOCKLEY 7,688 30,607 60,819 47,659 724 40 40 0HOWARD 232 779 1,469 1,141 67 0 0 0LAMB 17,214 50,403 86,884 66,524 1,352 359 359 0LUBBOCK 9,754 37,126 73,097 57,459 1,440 113 113 0LYNN 2,487 9,875 19,207 15,046 422 0 0 0MARTIN 500 2,193 3,980 3,264 227 0 0 0MIDLAND 471 1,275 2,224 1,772 245 0 0 0MOTLEY 32 89 116 116 40 0 0 0OLDHAM 5,117 2,193 4,613 4,477 123 1,520 1,520 0PARMER 23,600 44,784 68,811 52,147 1,930 2,214 2,214 0POTTER 3,608 1,509 1,993 1,840 661 917 917 0RANDALL 5,236 6,010 9,333 8,632 1,746 817 817 0SWISHER 8,399 21,478 37,257 29,478 760 472 472 0TERRY 9,177 35,764 66,173 54,034 3,186 220 220 0YOAKUM 6,871 27,492 52,318 42,103 1,494 162 162 0CURRY 10,538 17,636 27,979 23,115 1,249 1,343 1,343 0LEA 4,650 9,486 14,461 12,240 2,570 247 247 0QUAY 49 76 102 95 36 2 2 0ROOSEVELT 7,963 21,253 33,678 28,222 2,553 440 440 0TOTALS 245,458 643,272 1,128,993 900,112 41,685 17,447 17,447 0
pia = planted irrigation acreagesTAES = Texas Agricultural Extension Service
P:\9345\GAM-Rpt.9-2002\Att_B3.xls B3-16

Attachment B3. Irrigation data by county in the Southern Ogallala GAM Region for all base years, drought years, drought of record years and long-term average years.
LTA LTA LTA LTAJanuary February March April
COUNTY
LTA Planted Irrigated Acres,
piaTAES Total Irr.
Water Use, ac-ftTAES Irr. Water
Use, in/piaMonthly
Pumpage, ac-ftMonthly
Pumpage, ac-ftMonthly
Pumpage, ac-ftMonthly
Pumpage, ac-ftANDREWS 12,271 14,051 13.74 0 0 0 141ARMSTRONG 95 94 11.89 0 0 4 16BAILEY 95,402 128,592 16.17 0 0 321 4,554BORDEN 5,000 9,055 21.73 0 0 0 0BRISCOE 19,137 23,777 14.91 0 0 333 1,564CASTRO 275,907 411,125 17.88 0 0 6,617 40,239COCHRAN 76,250 79,734 12.55 0 0 0 384CROSBY 134,835 121,345 10.80 0 0 0 52DAWSON 77,405 80,954 12.55 0 0 115 726DEAF SMITH 197,993 254,672 15.44 0 0 9,537 44,686DICKENS 4,683 6,505 16.67 0 0 0 397ECTOR 1,313 3,534 32.30 0 0 0 353FLOYD 184,046 188,617 12.30 0 0 341 3,350GAINES 230,872 248,450 12.91 0 0 457 2,788GARZA 12,500 11,211 10.76 0 0 0 0GLASSCOCK 4,496 4,798 12.81 0 0 0 6HALE 360,763 334,295 11.12 0 0 1 7,489HOCKLEY 159,594 161,837 12.17 0 0 53 670HOWARD 3,000 3,112 12.45 0 0 0 47LAMB 226,262 297,598 15.78 0 0 443 8,830LUBBOCK 217,338 201,952 11.15 0 0 98 1,301LYNN 55,830 51,468 11.06 0 0 0 206MARTIN 7,890 8,411 12.79 0 0 0 22MIDLAND 3,718 5,089 16.42 0 0 0 162MOTLEY 387 499 15.47 0 0 0 26OLDHAM 30,182 32,556 12.94 0 0 1,817 7,467PARMER 232,819 295,996 15.26 0 0 4,120 26,552POTTER 28,219 26,620 11.32 0 0 1,716 7,562RANDALL 37,484 47,832 15.31 0 0 1,128 6,511SWISHER 138,876 161,748 13.98 0 0 1,498 9,487TERRY 172,031 172,157 12.01 0 0 286 1,810YOAKUM 105,909 104,474 11.84 0 0 210 1,114CURRY 117,695 118,523 12.08 0 0 1,975 11,894LEA 34,291 46,745 16.36 0 0 267 3,095QUAY 335 499 17.86 0 0 3 47ROOSEVELT 93,048 98,687 12.73 0 0 855 6,235TOTALS 3,357,876 3,756,611 13.42 0 0 32,193 199,784
pia = planted irrigation acreagesTAES = Texas Agricultural Extension Service
P:\9345\GAM-Rpt.9-2002\Att_B3.xls B3-17
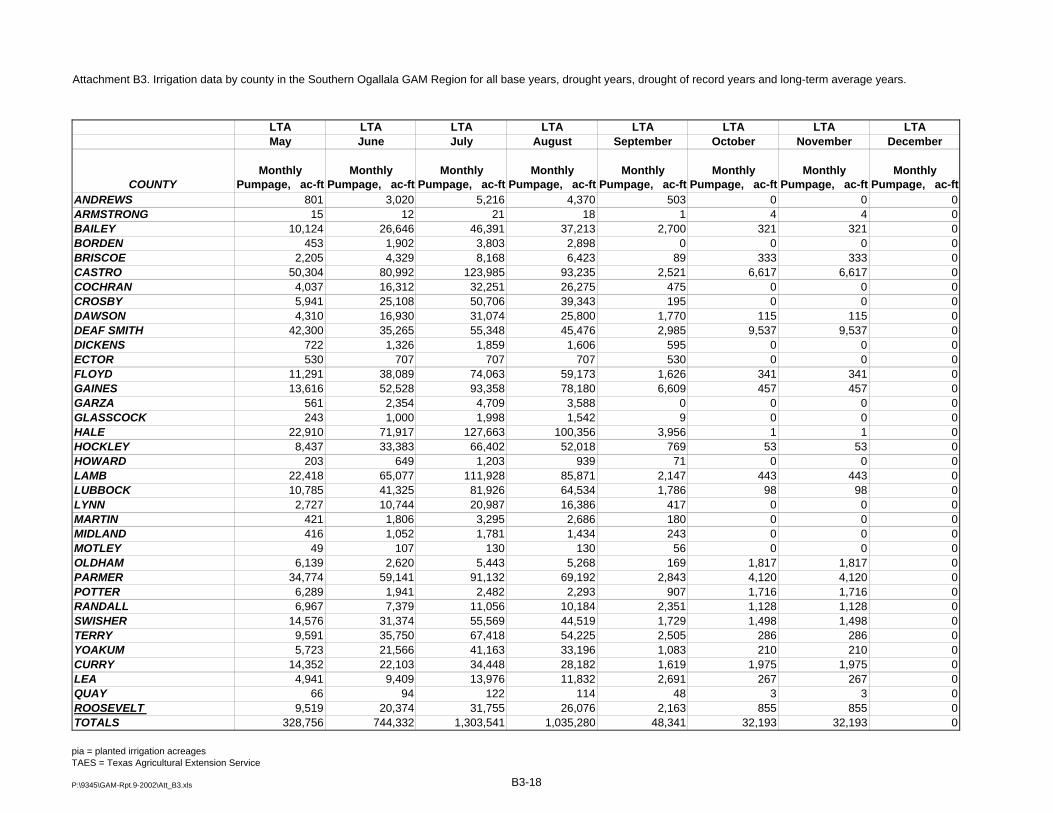
Attachment B3. Irrigation data by county in the Southern Ogallala GAM Region for all base years, drought years, drought of record years and long-term average years.
LTA LTA LTA LTA LTA LTA LTA LTAMay June July August September October November December
COUNTYMonthly
Pumpage, ac-ftMonthly
Pumpage, ac-ftMonthly
Pumpage, ac-ftMonthly
Pumpage, ac-ftMonthly
Pumpage, ac-ftMonthly
Pumpage, ac-ftMonthly
Pumpage, ac-ftMonthly
Pumpage, ac-ftANDREWS 801 3,020 5,216 4,370 503 0 0 0ARMSTRONG 15 12 21 18 1 4 4 0BAILEY 10,124 26,646 46,391 37,213 2,700 321 321 0BORDEN 453 1,902 3,803 2,898 0 0 0 0BRISCOE 2,205 4,329 8,168 6,423 89 333 333 0CASTRO 50,304 80,992 123,985 93,235 2,521 6,617 6,617 0COCHRAN 4,037 16,312 32,251 26,275 475 0 0 0CROSBY 5,941 25,108 50,706 39,343 195 0 0 0DAWSON 4,310 16,930 31,074 25,800 1,770 115 115 0DEAF SMITH 42,300 35,265 55,348 45,476 2,985 9,537 9,537 0DICKENS 722 1,326 1,859 1,606 595 0 0 0ECTOR 530 707 707 707 530 0 0 0FLOYD 11,291 38,089 74,063 59,173 1,626 341 341 0GAINES 13,616 52,528 93,358 78,180 6,609 457 457 0GARZA 561 2,354 4,709 3,588 0 0 0 0GLASSCOCK 243 1,000 1,998 1,542 9 0 0 0HALE 22,910 71,917 127,663 100,356 3,956 1 1 0HOCKLEY 8,437 33,383 66,402 52,018 769 53 53 0HOWARD 203 649 1,203 939 71 0 0 0LAMB 22,418 65,077 111,928 85,871 2,147 443 443 0LUBBOCK 10,785 41,325 81,926 64,534 1,786 98 98 0LYNN 2,727 10,744 20,987 16,386 417 0 0 0MARTIN 421 1,806 3,295 2,686 180 0 0 0MIDLAND 416 1,052 1,781 1,434 243 0 0 0MOTLEY 49 107 130 130 56 0 0 0OLDHAM 6,139 2,620 5,443 5,268 169 1,817 1,817 0PARMER 34,774 59,141 91,132 69,192 2,843 4,120 4,120 0POTTER 6,289 1,941 2,482 2,293 907 1,716 1,716 0RANDALL 6,967 7,379 11,056 10,184 2,351 1,128 1,128 0SWISHER 14,576 31,374 55,569 44,519 1,729 1,498 1,498 0TERRY 9,591 35,750 67,418 54,225 2,505 286 286 0YOAKUM 5,723 21,566 41,163 33,196 1,083 210 210 0CURRY 14,352 22,103 34,448 28,182 1,619 1,975 1,975 0LEA 4,941 9,409 13,976 11,832 2,691 267 267 0QUAY 66 94 122 114 48 3 3 0ROOSEVELT 9,519 20,374 31,755 26,076 2,163 855 855 0TOTALS 328,756 744,332 1,303,541 1,035,280 48,341 32,193 32,193 0
pia = planted irrigation acreagesTAES = Texas Agricultural Extension Service
P:\9345\GAM-Rpt.9-2002\Att_B3.xls B3-18

Attachment B3. Irrigation data by county in the Southern Ogallala GAM Region for all base years, drought years, drought of record years and long-term average years.
1952 1952 1952 1952January February March April
COUNTY
1952 Planted Irrigated Acres,
piaTAES Total Irr.
Water Use, ac-ftTAES Irr. Water
Use, in/piaMonthly
Pumpage, ac-ftMonthly
Pumpage, ac-ftMonthly
Pumpage, ac-ftMonthly
Pumpage, ac-ftANDREWS 12,271 16,626 16.26 0 0 0 161ARMSTRONG 95 129 16.34 0 0 5 24BAILEY 95,402 150,169 18.89 0 0 234 4,646BORDEN 5,000 7,259 17.42 0 0 0 0BRISCOE 19,137 29,657 18.60 0 0 320 1,563CASTRO 275,907 497,533 21.64 0 0 8,651 50,545COCHRAN 76,250 106,574 16.77 0 0 0 462CROSBY 134,835 155,424 13.83 0 0 0 61DAWSON 77,405 99,741 15.46 0 0 98 707DEAF SMITH 197,993 315,649 19.13 0 0 12,365 57,085DICKENS 4,683 8,707 22.31 0 0 0 509ECTOR 1,313 4,090 37.38 0 0 0 409FLOYD 184,046 257,595 16.80 0 0 363 3,870GAINES 230,872 293,907 15.28 0 0 478 3,008GARZA 12,500 14,367 13.79 0 0 0 0GLASSCOCK 4,496 6,223 16.61 0 0 0 8HALE 360,763 463,178 15.41 0 0 82 9,471HOCKLEY 159,594 217,573 16.36 0 0 66 827HOWARD 3,000 4,163 16.65 0 0 0 59LAMB 226,262 365,955 19.41 0 0 534 10,364LUBBOCK 217,338 255,984 14.13 0 0 78 1,371LYNN 55,830 65,591 14.10 0 0 0 241MARTIN 7,890 10,405 15.82 0 0 0 26MIDLAND 3,718 6,267 20.23 0 0 0 192MOTLEY 387 625 19.40 0 0 0 33OLDHAM 30,182 42,090 16.73 0 0 2,443 9,998PARMER 232,819 365,164 18.82 0 0 5,462 33,586POTTER 28,219 36,211 15.40 0 0 2,458 10,677RANDALL 37,484 62,775 20.10 0 0 1,616 8,890SWISHER 138,876 222,391 19.22 0 0 2,204 13,147TERRY 172,031 230,197 16.06 0 0 356 2,232YOAKUM 105,909 139,934 15.86 0 0 260 1,371CURRY 117,695 140,779 14.35 0 0 2,396 14,176LEA 34,291 56,280 19.69 0 0 334 3,691QUAY 335 568 20.30 0 0 3 51ROOSEVELT 93,048 113,597 14.65 0 0 1,206 7,916TOTALS 3,357,876 4,763,375 17.02 0 0 42,012 251,375
pia = planted irrigation acreagesTAES = Texas Agricultural Extension Service
P:\9345\GAM-Rpt.9-2002\Att_B3.xls B3-19
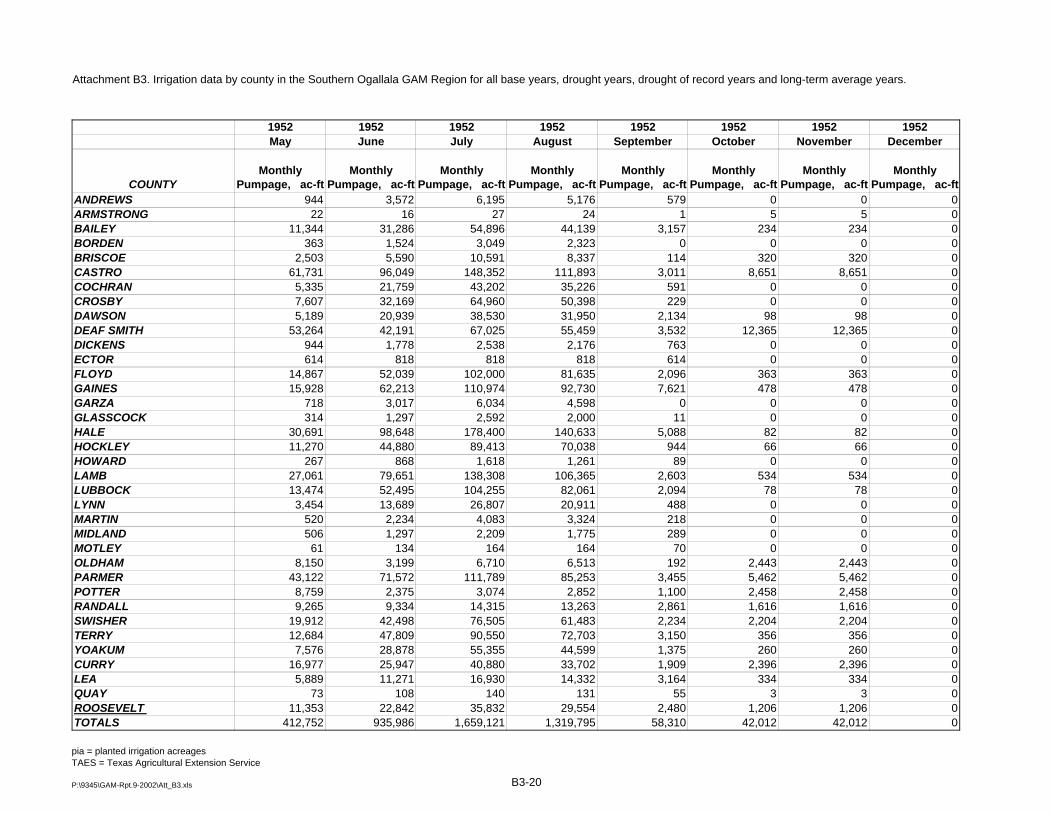
Attachment B3. Irrigation data by county in the Southern Ogallala GAM Region for all base years, drought years, drought of record years and long-term average years.
1952 1952 1952 1952 1952 1952 1952 1952May June July August September October November December
COUNTYMonthly
Pumpage, ac-ftMonthly
Pumpage, ac-ftMonthly
Pumpage, ac-ftMonthly
Pumpage, ac-ftMonthly
Pumpage, ac-ftMonthly
Pumpage, ac-ftMonthly
Pumpage, ac-ftMonthly
Pumpage, ac-ftANDREWS 944 3,572 6,195 5,176 579 0 0 0ARMSTRONG 22 16 27 24 1 5 5 0BAILEY 11,344 31,286 54,896 44,139 3,157 234 234 0BORDEN 363 1,524 3,049 2,323 0 0 0 0BRISCOE 2,503 5,590 10,591 8,337 114 320 320 0CASTRO 61,731 96,049 148,352 111,893 3,011 8,651 8,651 0COCHRAN 5,335 21,759 43,202 35,226 591 0 0 0CROSBY 7,607 32,169 64,960 50,398 229 0 0 0DAWSON 5,189 20,939 38,530 31,950 2,134 98 98 0DEAF SMITH 53,264 42,191 67,025 55,459 3,532 12,365 12,365 0DICKENS 944 1,778 2,538 2,176 763 0 0 0ECTOR 614 818 818 818 614 0 0 0FLOYD 14,867 52,039 102,000 81,635 2,096 363 363 0GAINES 15,928 62,213 110,974 92,730 7,621 478 478 0GARZA 718 3,017 6,034 4,598 0 0 0 0GLASSCOCK 314 1,297 2,592 2,000 11 0 0 0HALE 30,691 98,648 178,400 140,633 5,088 82 82 0HOCKLEY 11,270 44,880 89,413 70,038 944 66 66 0HOWARD 267 868 1,618 1,261 89 0 0 0LAMB 27,061 79,651 138,308 106,365 2,603 534 534 0LUBBOCK 13,474 52,495 104,255 82,061 2,094 78 78 0LYNN 3,454 13,689 26,807 20,911 488 0 0 0MARTIN 520 2,234 4,083 3,324 218 0 0 0MIDLAND 506 1,297 2,209 1,775 289 0 0 0MOTLEY 61 134 164 164 70 0 0 0OLDHAM 8,150 3,199 6,710 6,513 192 2,443 2,443 0PARMER 43,122 71,572 111,789 85,253 3,455 5,462 5,462 0POTTER 8,759 2,375 3,074 2,852 1,100 2,458 2,458 0RANDALL 9,265 9,334 14,315 13,263 2,861 1,616 1,616 0SWISHER 19,912 42,498 76,505 61,483 2,234 2,204 2,204 0TERRY 12,684 47,809 90,550 72,703 3,150 356 356 0YOAKUM 7,576 28,878 55,355 44,599 1,375 260 260 0CURRY 16,977 25,947 40,880 33,702 1,909 2,396 2,396 0LEA 5,889 11,271 16,930 14,332 3,164 334 334 0QUAY 73 108 140 131 55 3 3 0ROOSEVELT 11,353 22,842 35,832 29,554 2,480 1,206 1,206 0TOTALS 412,752 935,986 1,659,121 1,319,795 58,310 42,012 42,012 0
pia = planted irrigation acreagesTAES = Texas Agricultural Extension Service
P:\9345\GAM-Rpt.9-2002\Att_B3.xls B3-20

Attachment B3. Irrigation data by county in the Southern Ogallala GAM Region for all base years, drought years, drought of record years and long-term average years.
1953 1953 1953 1953January February March April
COUNTY
1953 Planted Irrigated Acres,
piaTAES Total Irr.
Water Use, ac-ftTAES Irr. Water
Use, in/piaMonthly
Pumpage, ac-ftMonthly
Pumpage, ac-ftMonthly
Pumpage, ac-ftMonthly
Pumpage, ac-ftANDREWS 12,271 13,512 13.21 0 0 0 129ARMSTRONG 95 131 16.57 0 0 6 25BAILEY 95,402 149,736 18.83 0 0 249 4,605BORDEN 5,000 6,231 14.96 0 0 0 0BRISCOE 19,137 29,165 18.29 0 0 349 1,657CASTRO 275,907 492,625 21.43 0 0 8,597 50,075COCHRAN 76,250 109,888 17.29 0 0 0 451CROSBY 134,835 164,469 14.64 0 0 0 57DAWSON 77,405 91,924 14.25 0 0 124 765DEAF SMITH 197,993 316,165 19.16 0 0 12,574 57,802DICKENS 4,683 8,263 21.17 0 0 0 468ECTOR 1,313 4,170 38.11 0 0 0 417FLOYD 184,046 254,322 16.58 0 0 411 3,974GAINES 230,872 240,305 12.49 0 0 508 2,913GARZA 12,500 15,205 14.60 0 0 0 0GLASSCOCK 4,496 6,595 17.60 0 0 0 8HALE 360,763 455,998 15.17 0 0 302 10,008HOCKLEY 159,594 224,380 16.87 0 0 68 806HOWARD 3,000 4,007 16.03 0 0 0 52LAMB 226,262 365,817 19.40 0 0 570 10,378LUBBOCK 217,338 270,004 14.91 0 0 111 1,439LYNN 55,830 69,168 14.87 0 0 0 225MARTIN 7,890 9,560 14.54 0 0 0 22MIDLAND 3,718 6,714 21.67 0 0 0 194MOTLEY 387 627 19.46 0 0 0 30OLDHAM 30,182 41,598 16.54 0 0 2,694 11,004PARMER 232,819 361,234 18.62 0 0 5,427 33,220POTTER 28,219 37,521 15.96 0 0 2,610 11,255RANDALL 37,484 62,457 19.99 0 0 1,690 9,088SWISHER 138,876 216,633 18.72 0 0 2,278 13,258TERRY 172,031 238,215 16.62 0 0 363 2,227YOAKUM 105,909 144,930 16.42 0 0 265 1,385CURRY 117,695 138,139 14.08 0 0 2,429 14,178LEA 34,291 54,464 19.06 0 0 320 3,494QUAY 335 569 20.36 0 0 3 52ROOSEVELT 93,048 116,451 15.02 0 0 1,173 7,790TOTALS 3,357,876 4,721,195 16.87 0 0 43,121 253,450
pia = planted irrigation acreagesTAES = Texas Agricultural Extension Service
P:\9345\GAM-Rpt.9-2002\Att_B3.xls B3-21

Attachment B3. Irrigation data by county in the Southern Ogallala GAM Region for all base years, drought years, drought of record years and long-term average years.
1953 1953 1953 1953 1953 1953 1953 1953May June July August September October November December
COUNTYMonthly
Pumpage, ac-ftMonthly
Pumpage, ac-ftMonthly
Pumpage, ac-ftMonthly
Pumpage, ac-ftMonthly
Pumpage, ac-ftMonthly
Pumpage, ac-ftMonthly
Pumpage, ac-ftMonthly
Pumpage, ac-ftANDREWS 764 2,904 5,035 4,209 471 0 0 0ARMSTRONG 22 16 27 23 1 6 6 0BAILEY 11,252 31,142 54,853 44,093 3,043 249 249 0BORDEN 312 1,309 2,617 1,994 0 0 0 0BRISCOE 2,530 5,420 10,303 8,110 99 349 349 0CASTRO 61,086 94,962 146,922 110,854 2,934 8,597 8,597 0COCHRAN 5,473 22,431 44,585 36,361 588 0 0 0CROSBY 8,040 34,038 68,756 53,344 234 0 0 0DAWSON 4,849 19,219 35,456 29,360 1,902 124 124 0DEAF SMITH 53,690 41,813 66,577 55,122 3,439 12,574 12,574 0DICKENS 881 1,688 2,441 2,083 702 0 0 0ECTOR 626 834 834 834 626 0 0 0FLOYD 14,707 51,144 100,566 80,571 2,128 411 411 0GAINES 13,298 50,638 90,234 75,456 6,241 508 508 0GARZA 760 3,193 6,386 4,866 0 0 0 0GLASSCOCK 333 1,375 2,749 2,120 11 0 0 0HALE 30,499 96,441 175,050 138,110 4,983 302 302 0HOCKLEY 11,575 46,289 92,307 72,290 910 68 68 0HOWARD 252 836 1,569 1,220 78 0 0 0LAMB 26,995 79,445 138,302 106,415 2,572 570 570 0LUBBOCK 14,154 55,305 110,094 86,627 2,055 111 111 0LYNN 3,613 14,439 28,328 22,088 475 0 0 0MARTIN 477 2,051 3,759 3,056 194 0 0 0MIDLAND 529 1,391 2,394 1,916 291 0 0 0MOTLEY 58 135 168 168 68 0 0 0OLDHAM 8,816 2,689 5,505 5,307 195 2,694 2,694 0PARMER 42,608 70,710 110,671 84,413 3,332 5,427 5,427 0POTTER 9,173 2,333 3,051 2,826 1,053 2,610 2,610 0RANDALL 9,335 9,116 14,084 13,045 2,719 1,690 1,690 0SWISHER 19,624 41,036 74,097 59,601 2,181 2,278 2,278 0TERRY 13,043 49,506 93,775 75,335 3,240 363 363 0YOAKUM 7,814 29,923 57,338 46,231 1,443 265 265 0CURRY 16,803 25,234 39,813 32,905 1,918 2,429 2,429 0LEA 5,624 10,926 16,529 13,964 2,967 320 320 0QUAY 74 108 140 131 55 3 3 0ROOSEVELT 11,393 23,528 37,036 30,630 2,556 1,173 1,173 0TOTALS 411,082 923,568 1,642,349 1,305,680 55,703 43,121 43,121 0
pia = planted irrigation acreagesTAES = Texas Agricultural Extension Service
P:\9345\GAM-Rpt.9-2002\Att_B3.xls B3-22

Attachment B3. Irrigation data by county in the Southern Ogallala GAM Region for all base years, drought years, drought of record years and long-term average years.
1954 1954 1954 1954January February March April
COUNTY
1954 Planted Irrigated Acres,
piaTAES Total Irr.
Water Use, ac-ftTAES Irr. Water
Use, in/piaMonthly
Pumpage, ac-ftMonthly
Pumpage, ac-ftMonthly
Pumpage, ac-ftMonthly
Pumpage, ac-ftANDREWS 12,271 14,405 14.09 0 0 0 132ARMSTRONG 95 118 15.00 0 0 5 22BAILEY 95,402 147,257 18.52 0 0 316 4,838BORDEN 5,000 9,055 21.73 0 0 0 0BRISCOE 19,137 29,024 18.20 0 0 372 1,742CASTRO 275,907 491,810 21.39 0 0 9,031 51,678COCHRAN 76,250 104,005 16.37 0 0 0 430CROSBY 134,835 165,722 14.75 0 0 0 61DAWSON 77,405 92,287 14.31 0 0 153 877DEAF SMITH 197,993 313,868 19.02 0 0 12,752 58,414DICKENS 4,683 7,788 19.96 0 0 0 462ECTOR 1,313 3,681 33.64 0 0 0 368FLOYD 184,046 240,508 15.68 0 0 477 4,153GAINES 230,872 257,641 13.39 0 0 633 3,443GARZA 12,500 15,319 14.71 0 0 0 0GLASSCOCK 4,496 6,278 16.76 0 0 0 7HALE 360,763 432,056 14.37 0 0 608 10,920HOCKLEY 159,594 212,724 15.99 0 0 79 826HOWARD 3,000 3,950 15.80 0 0 0 50LAMB 226,262 359,294 19.06 0 0 725 10,872LUBBOCK 217,338 272,647 15.05 0 0 130 1,579LYNN 55,830 69,807 15.00 0 0 0 241MARTIN 7,890 9,566 14.55 0 0 0 22MIDLAND 3,718 6,032 19.47 0 0 0 176MOTLEY 387 598 18.57 0 0 0 31OLDHAM 30,182 40,515 16.11 0 0 2,400 9,817PARMER 232,819 359,838 18.55 0 0 5,713 34,284POTTER 28,219 33,476 14.24 0 0 2,302 9,975RANDALL 37,484 57,662 18.46 0 0 1,548 8,430SWISHER 138,876 202,114 17.46 0 0 2,149 12,552TERRY 172,031 225,020 15.70 0 0 420 2,420YOAKUM 105,909 137,012 15.52 0 0 306 1,534CURRY 117,695 138,808 14.15 0 0 2,946 16,053LEA 34,291 51,155 17.90 0 0 381 3,605QUAY 335 563 20.15 0 0 4 55ROOSEVELT 93,048 114,675 14.79 0 0 1,447 8,755TOTALS 3,357,876 4,626,278 16.53 0 0 44,900 258,826
pia = planted irrigation acreagesTAES = Texas Agricultural Extension Service
P:\9345\GAM-Rpt.9-2002\Att_B3.xls B3-23

Attachment B3. Irrigation data by county in the Southern Ogallala GAM Region for all base years, drought years, drought of record years and long-term average years.
1954 1954 1954 1954 1954 1954 1954 1954May June July August September October November December
COUNTYMonthly
Pumpage, ac-ftMonthly
Pumpage, ac-ftMonthly
Pumpage, ac-ftMonthly
Pumpage, ac-ftMonthly
Pumpage, ac-ftMonthly
Pumpage, ac-ftMonthly
Pumpage, ac-ftMonthly
Pumpage, ac-ftANDREWS 812 3,094 5,390 4,492 485 0 0 0ARMSTRONG 20 14 24 21 1 5 5 0BAILEY 11,275 30,484 53,593 43,086 3,032 316 316 0BORDEN 453 1,902 3,803 2,898 0 0 0 0BRISCOE 2,573 5,337 10,161 8,000 95 372 372 0CASTRO 62,012 93,788 144,941 109,347 2,951 9,031 9,031 0COCHRAN 5,186 21,229 42,204 34,406 550 0 0 0CROSBY 8,106 34,298 69,272 53,745 240 0 0 0DAWSON 4,943 19,213 35,578 29,387 1,830 153 153 0DEAF SMITH 53,956 40,953 65,045 53,814 3,428 12,752 12,752 0DICKENS 851 1,589 2,256 1,938 692 0 0 0ECTOR 552 736 736 736 552 0 0 0FLOYD 14,207 48,265 94,668 75,791 1,991 477 477 0GAINES 14,473 54,038 96,722 80,639 6,427 633 633 0GARZA 766 3,217 6,434 4,902 0 0 0 0GLASSCOCK 316 1,309 2,617 2,019 11 0 0 0HALE 29,914 90,839 164,223 129,522 4,813 608 608 0HOCKLEY 11,016 43,854 87,449 68,479 864 79 79 0HOWARD 247 825 1,549 1,204 75 0 0 0LAMB 26,954 77,700 135,112 103,941 2,538 725 725 0LUBBOCK 14,395 55,808 110,983 87,345 2,147 130 130 0LYNN 3,661 14,571 28,562 22,274 498 0 0 0MARTIN 478 2,051 3,772 3,057 187 0 0 0MIDLAND 477 1,249 2,147 1,719 264 0 0 0MOTLEY 58 128 157 157 67 0 0 0OLDHAM 7,974 2,995 6,266 6,079 184 2,400 2,400 0PARMER 43,185 69,756 108,988 83,123 3,363 5,713 5,713 0POTTER 8,160 2,136 2,748 2,549 1,001 2,302 2,302 0RANDALL 8,691 8,455 12,868 11,921 2,652 1,548 1,548 0SWISHER 18,481 38,308 68,874 55,374 2,077 2,149 2,149 0TERRY 12,534 46,577 88,353 70,893 2,983 420 420 0YOAKUM 7,536 28,159 54,031 43,516 1,316 306 306 0CURRY 17,968 24,294 38,325 31,590 1,739 2,946 2,946 0LEA 5,489 10,092 15,201 12,846 2,779 381 381 0QUAY 75 104 136 127 52 4 4 0ROOSEVELT 11,882 22,539 35,471 29,292 2,397 1,447 1,447 0TOTALS 409,675 899,907 1,598,660 1,270,228 54,282 44,900 44,900 0
pia = planted irrigation acreagesTAES = Texas Agricultural Extension Service
P:\9345\GAM-Rpt.9-2002\Att_B3.xls B3-24

Attachment B3. Irrigation data by county in the Southern Ogallala GAM Region for all base years, drought years, drought of record years and long-term average years.
1955 1955 1955 1955January February March April
COUNTY
1955 Planted Irrigated Acres,
piaTAES Total Irr.
Water Use, ac-ftTAES Irr. Water
Use, in/piaMonthly
Pumpage, ac-ftMonthly
Pumpage, ac-ftMonthly
Pumpage, ac-ftMonthly
Pumpage, ac-ftANDREWS 5,035 7,014 16.72 0 0 0 73ARMSTRONG 27 44 19.56 0 0 0 2BAILEY 54,853 91,852 20.09 0 0 0 2,333BORDEN 2,617 2,816 12.91 0 0 0 0BRISCOE 10,303 13,584 15.82 0 0 0 177CASTRO 146,922 314,031 25.65 0 0 0 13,073COCHRAN 44,585 63,470 17.08 0 0 0 309CROSBY 68,756 69,906 12.20 0 0 0 30DAWSON 35,456 42,211 14.29 0 0 0 148DEAF SMITH 66,577 140,576 25.34 0 0 0 5,826DICKENS 2,441 3,804 18.70 0 0 0 221ECTOR 834 2,617 37.65 0 0 0 262FLOYD 100,566 123,371 14.72 0 0 0 1,571GAINES 90,234 121,942 16.22 0 0 0 536GARZA 6,386 6,453 12.12 0 0 0 0GLASSCOCK 2,749 3,713 16.21 0 0 0 5HALE 175,050 225,698 15.47 0 0 0 5,918HOCKLEY 92,307 127,298 16.55 0 0 0 291HOWARD 1,569 1,866 14.27 0 0 0 29LAMB 138,302 243,813 21.15 0 0 0 6,326LUBBOCK 110,094 117,321 12.79 0 0 0 533LYNN 28,328 29,472 12.48 0 0 0 117MARTIN 3,759 4,450 14.20 0 0 0 12MIDLAND 2,394 3,920 19.65 0 0 0 120MOTLEY 168 240 17.11 0 0 0 13OLDHAM 5,505 8,922 19.45 0 0 0 155PARMER 110,671 198,338 21.51 0 0 0 8,150POTTER 3,051 6,670 26.23 0 0 0 459RANDALL 14,084 27,048 23.05 0 0 0 1,414SWISHER 74,097 111,420 18.04 0 0 0 2,981TERRY 93,775 129,737 16.60 0 0 0 469YOAKUM 57,338 78,978 16.53 0 0 0 237CURRY 39,813 74,352 22.41 0 0 0 3,052LEA 16,529 30,722 22.30 0 0 0 1,409QUAY 140 318 27.20 0 0 0 22ROOSEVELT 37,036 67,769 21.96 0 0 0 2,195TOTALS 1,642,349 2,495,753 18.24 0 0 0 58,467
pia = planted irrigation acreagesTAES = Texas Agricultural Extension Service
P:\9345\GAM-Rpt.9-2002\Att_B3.xls B3-25
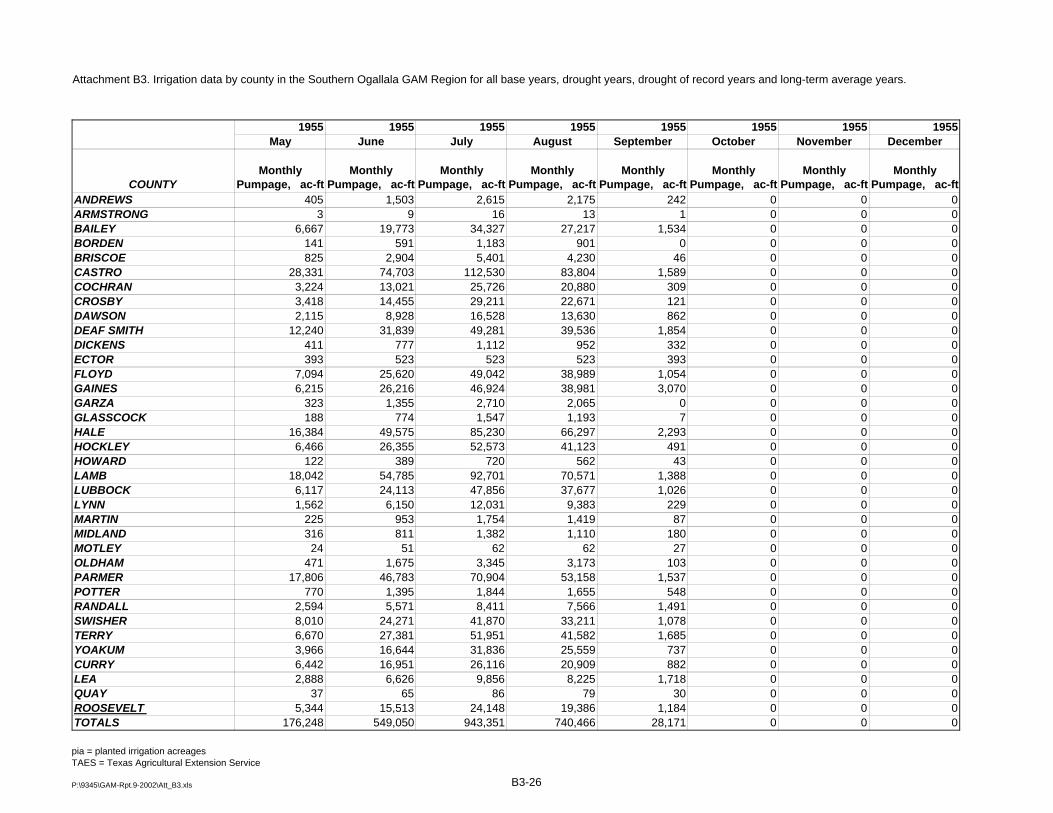
Attachment B3. Irrigation data by county in the Southern Ogallala GAM Region for all base years, drought years, drought of record years and long-term average years.
1955 1955 1955 1955 1955 1955 1955 1955May June July August September October November December
COUNTYMonthly
Pumpage, ac-ftMonthly
Pumpage, ac-ftMonthly
Pumpage, ac-ftMonthly
Pumpage, ac-ftMonthly
Pumpage, ac-ftMonthly
Pumpage, ac-ftMonthly
Pumpage, ac-ftMonthly
Pumpage, ac-ftANDREWS 405 1,503 2,615 2,175 242 0 0 0ARMSTRONG 3 9 16 13 1 0 0 0BAILEY 6,667 19,773 34,327 27,217 1,534 0 0 0BORDEN 141 591 1,183 901 0 0 0 0BRISCOE 825 2,904 5,401 4,230 46 0 0 0CASTRO 28,331 74,703 112,530 83,804 1,589 0 0 0COCHRAN 3,224 13,021 25,726 20,880 309 0 0 0CROSBY 3,418 14,455 29,211 22,671 121 0 0 0DAWSON 2,115 8,928 16,528 13,630 862 0 0 0DEAF SMITH 12,240 31,839 49,281 39,536 1,854 0 0 0DICKENS 411 777 1,112 952 332 0 0 0ECTOR 393 523 523 523 393 0 0 0FLOYD 7,094 25,620 49,042 38,989 1,054 0 0 0GAINES 6,215 26,216 46,924 38,981 3,070 0 0 0GARZA 323 1,355 2,710 2,065 0 0 0 0GLASSCOCK 188 774 1,547 1,193 7 0 0 0HALE 16,384 49,575 85,230 66,297 2,293 0 0 0HOCKLEY 6,466 26,355 52,573 41,123 491 0 0 0HOWARD 122 389 720 562 43 0 0 0LAMB 18,042 54,785 92,701 70,571 1,388 0 0 0LUBBOCK 6,117 24,113 47,856 37,677 1,026 0 0 0LYNN 1,562 6,150 12,031 9,383 229 0 0 0MARTIN 225 953 1,754 1,419 87 0 0 0MIDLAND 316 811 1,382 1,110 180 0 0 0MOTLEY 24 51 62 62 27 0 0 0OLDHAM 471 1,675 3,345 3,173 103 0 0 0PARMER 17,806 46,783 70,904 53,158 1,537 0 0 0POTTER 770 1,395 1,844 1,655 548 0 0 0RANDALL 2,594 5,571 8,411 7,566 1,491 0 0 0SWISHER 8,010 24,271 41,870 33,211 1,078 0 0 0TERRY 6,670 27,381 51,951 41,582 1,685 0 0 0YOAKUM 3,966 16,644 31,836 25,559 737 0 0 0CURRY 6,442 16,951 26,116 20,909 882 0 0 0LEA 2,888 6,626 9,856 8,225 1,718 0 0 0QUAY 37 65 86 79 30 0 0 0ROOSEVELT 5,344 15,513 24,148 19,386 1,184 0 0 0TOTALS 176,248 549,050 943,351 740,466 28,171 0 0 0
pia = planted irrigation acreagesTAES = Texas Agricultural Extension Service
P:\9345\GAM-Rpt.9-2002\Att_B3.xls B3-26

Attachment B3. Irrigation data by county in the Southern Ogallala GAM Region for all base years, drought years, drought of record years and long-term average years.
1956 1956 1956 1956January February March April
COUNTY
1956 Planted Irrigated Acres,
piaTAES Total Irr.
Water Use, ac-ftTAES Irr. Water
Use, in/piaMonthly
Pumpage, ac-ftMonthly
Pumpage, ac-ftMonthly
Pumpage, ac-ftMonthly
Pumpage, ac-ftANDREWS 12,271 19,096 18.67 0 0 0 169ARMSTRONG 95 123 15.63 0 0 5 23BAILEY 95,402 153,505 19.31 0 0 352 5,174BORDEN 5,000 9,055 21.73 0 0 0 0BRISCOE 19,137 32,361 20.29 0 0 365 1,746CASTRO 275,907 499,749 21.74 0 0 9,018 51,895COCHRAN 76,250 111,715 17.58 0 0 0 471CROSBY 134,835 168,013 14.95 0 0 0 63DAWSON 77,405 111,335 17.26 0 0 141 884DEAF SMITH 197,993 460,250 27.89 0 0 26,611 114,159DICKENS 4,683 9,758 25.01 0 0 0 567ECTOR 1,313 4,168 38.09 0 0 0 417FLOYD 184,046 234,217 15.27 0 0 323 3,520GAINES 230,872 339,305 17.64 0 0 557 3,381GARZA 12,500 15,525 14.90 0 0 0 0GLASSCOCK 4,496 6,652 17.75 0 0 0 7HALE 360,763 417,414 13.88 0 0 0 8,448HOCKLEY 159,594 228,118 17.15 0 0 67 850HOWARD 3,000 4,557 18.23 0 0 0 59LAMB 226,262 370,191 19.63 0 0 628 10,716LUBBOCK 217,338 276,018 15.24 0 0 56 1,319LYNN 55,830 70,863 15.23 0 0 0 250MARTIN 7,890 11,584 17.62 0 0 0 26MIDLAND 3,718 6,523 21.05 0 0 0 192MOTLEY 387 673 20.88 0 0 0 34OLDHAM 30,182 47,425 18.86 0 0 2,851 11,646PARMER 232,819 367,301 18.93 0 0 5,704 34,512POTTER 28,219 40,347 17.16 0 0 2,854 12,286RANDALL 37,484 60,491 19.37 0 0 1,610 8,827SWISHER 138,876 194,475 16.80 0 0 1,872 11,388TERRY 172,031 242,760 16.93 0 0 361 2,274YOAKUM 105,909 147,453 16.71 0 0 264 1,390CURRY 117,695 142,460 14.52 0 0 2,693 15,310LEA 34,291 55,932 19.57 0 0 336 3,658QUAY 335 596 21.33 0 0 4 58ROOSEVELT 93,048 123,708 15.95 0 0 1,180 8,026TOTALS 3,357,876 4,983,716 17.81 0 0 57,852 313,749
pia = planted irrigation acreagesTAES = Texas Agricultural Extension Service
P:\9345\GAM-Rpt.9-2002\Att_B3.xls B3-27

Attachment B3. Irrigation data by county in the Southern Ogallala GAM Region for all base years, drought years, drought of record years and long-term average years.
1956 1956 1956 1956 1956 1956 1956 1956May June July August September October November December
COUNTYMonthly
Pumpage, ac-ftMonthly
Pumpage, ac-ftMonthly
Pumpage, ac-ftMonthly
Pumpage, ac-ftMonthly
Pumpage, ac-ftMonthly
Pumpage, ac-ftMonthly
Pumpage, ac-ftMonthly
Pumpage, ac-ftANDREWS 1,068 4,106 7,142 5,964 648 0 0 0ARMSTRONG 21 15 25 22 1 5 5 0BAILEY 11,848 31,688 55,655 44,804 3,280 352 352 0BORDEN 453 1,902 3,803 2,898 0 0 0 0BRISCOE 2,747 6,052 11,528 9,081 113 365 365 0CASTRO 62,618 95,546 147,846 111,654 3,138 9,018 9,018 0COCHRAN 5,577 22,802 45,290 36,949 626 0 0 0CROSBY 8,217 34,767 70,226 54,490 250 0 0 0DAWSON 5,843 23,292 43,005 35,601 2,285 141 141 0DEAF SMITH 96,175 42,565 67,686 56,136 3,697 26,611 26,611 0DICKENS 1,055 1,993 2,852 2,443 850 0 0 0ECTOR 625 834 834 834 625 0 0 0FLOYD 13,476 47,210 92,691 74,280 2,072 323 323 0GAINES 18,279 71,823 128,239 107,189 8,723 557 557 0GARZA 776 3,260 6,520 4,968 0 0 0 0GLASSCOCK 335 1,387 2,773 2,139 11 0 0 0HALE 27,603 88,911 160,644 126,821 4,987 0 0 0HOCKLEY 11,801 47,061 93,768 73,454 982 67 67 0HOWARD 286 951 1,785 1,388 88 0 0 0LAMB 27,444 80,204 139,661 107,544 2,737 628 628 0LUBBOCK 14,399 56,640 112,607 88,654 2,233 56 56 0LYNN 3,721 14,792 28,977 22,605 517 0 0 0MARTIN 577 2,486 4,558 3,703 234 0 0 0MIDLAND 519 1,351 2,316 1,856 289 0 0 0MOTLEY 64 145 178 178 74 0 0 0OLDHAM 9,432 3,421 7,183 6,980 211 2,851 2,851 0PARMER 43,777 71,373 111,652 85,273 3,600 5,704 5,704 0POTTER 9,982 2,410 3,091 2,873 1,143 2,854 2,854 0RANDALL 9,124 8,895 13,471 12,492 2,850 1,610 1,610 0SWISHER 17,355 37,230 66,903 53,840 2,144 1,872 1,872 0TERRY 13,306 50,474 95,471 76,755 3,396 361 361 0YOAKUM 7,937 30,461 58,322 47,051 1,500 264 264 0CURRY 17,749 25,615 40,384 33,367 1,955 2,693 2,693 0LEA 5,836 11,203 16,852 14,262 3,114 336 336 0QUAY 79 111 144 135 57 4 4 0ROOSEVELT 11,947 25,130 39,544 32,747 2,776 1,180 1,180 0TOTALS 462,050 948,102 1,683,627 1,341,428 61,205 57,852 57,852 0
pia = planted irrigation acreagesTAES = Texas Agricultural Extension Service
P:\9345\GAM-Rpt.9-2002\Att_B3.xls B3-28

Attachment B4
Regional and County Long-Term Average Estimates for Irrigation
Water Demand by Crop

Attachment B4. Southern Ogallala GAM regional and county long-term average estimates for irrigation water demand by crop.ANDREWS COUNTY
CropLTA Total Irr.
Water Used, in/piaLTA Total Water
Used, in/piaCrop Acreage,
ac/countyTotal Irr
Demand, ac-ft
Corn: 23.46 34.00 0 0
Cotton: 12.39 22.95 8,200 8,465
Hay: 39.50 53.64 0 0
Pasture and Other: 29.53 45.17 571 1,405
Peanuts: 14.33 25.12 3,500 4,181
Sorghum: 12.33 22.76 0 0
Soybeans: 14.88 26.31 0 0
Wheat - Cover Crop 5.12 8.36 0 0Total 12,271 14,051
P:\9345\GAM-Rpt.9-2002\Att_B4.xls B4 - 1

Attachment B4. Southern Ogallala GAM regional and county long-term average estimates for irrigation water demand by crop.ARMSTRONG COUNTY
CropLTA Total Irr
Water Used, in/piaLTA Total Water
Used, in/piaCrop Acreage,
ac/countyTotal Irr
Demand, ac-ft
Corn: 22.47 35.93 12 22
Cotton: 9.84 25.55 8 7
Hay: 32.44 49.01 1 2
Pasture and Other: 23.70 41.27 3 6
Peanuts: 11.84 25.74 0 0
Sorghum: 11.87 25.64 21 21
Soybeans: 12.00 27.22 0 0
Wheat - Cover Crop 8.70 23.50 50 36Total 95 94
P:\9345\GAM-Rpt.9-2002\Att_B4.xls B4 - 2

Attachment B4. Southern Ogallala GAM regional and county long-term average estimates for irrigation water demand by crop.BAILEY COUNTY
CropLTA Total Irr
Water Used, in/piaLTA Total Water
Used, in/piaCrop Acreage,
ac/countyTotal Irr
Demand, ac-ft
Corn: 24.33 34.68 15,500 31,420
Cotton: 14.23 24.82 50,900 60,358
Hay: 34.16 47.50 0 0
Pasture and Other: 25.16 40.00 8,102 16,988
Peanuts: 14.73 25.03 0 0
Sorghum: 13.32 23.71 13,600 15,093
Soybeans: 15.21 26.12 1,200 1,521
Wheat - Cover Crop 6.32 6.59 6,100 3,212Total 95,402 128,592
P:\9345\GAM-Rpt.9-2002\Att_B4.xls B4 - 3
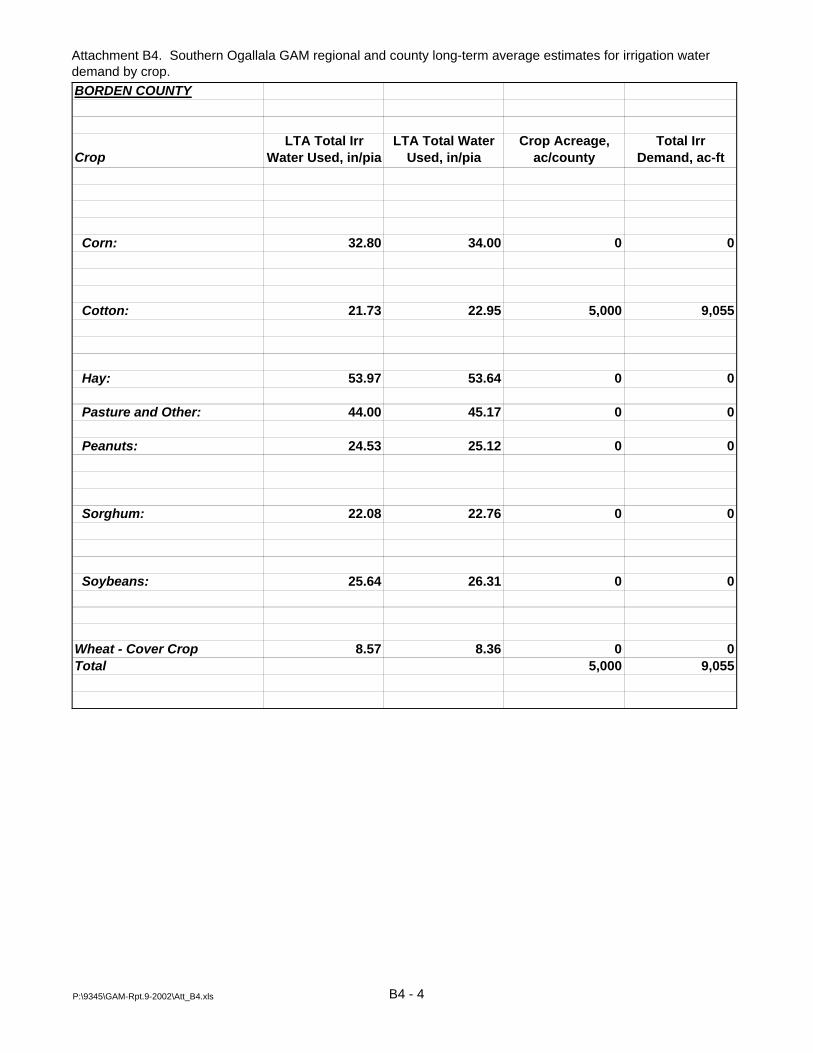
Attachment B4. Southern Ogallala GAM regional and county long-term average estimates for irrigation water demand by crop.BORDEN COUNTY
CropLTA Total Irr
Water Used, in/piaLTA Total Water
Used, in/piaCrop Acreage,
ac/countyTotal Irr
Demand, ac-ft
Corn: 32.80 34.00 0 0
Cotton: 21.73 22.95 5,000 9,055
Hay: 53.97 53.64 0 0
Pasture and Other: 44.00 45.17 0 0
Peanuts: 24.53 25.12 0 0
Sorghum: 22.08 22.76 0 0
Soybeans: 25.64 26.31 0 0
Wheat - Cover Crop 8.57 8.36 0 0Total 5,000 9,055
P:\9345\GAM-Rpt.9-2002\Att_B4.xls B4 - 4

Attachment B4. Southern Ogallala GAM regional and county long-term average estimates for irrigation water demand by crop.BRISCOE COUNTY
CropLTA Total Irr
Water Used, in/piaLTA Total Water
Used, in/piaCrop Acreage,
ac/countyTotal Irr
Demand, ac-ft
Corn: 23.71 35.50 1,740 3,439
Cotton: 13.09 24.94 12,840 14,010
Hay: 33.10 48.74 0 0
Pasture and Other: 23.90 41.04 297 592
Peanuts: 13.05 25.30 0 0
Sorghum: 13.74 25.69 2,100 2,405
Soybeans: 13.90 26.94 0 0
Wheat - Cover Crop 18.51 22.86 2,160 3,332Total 19,137 23,777
P:\9345\GAM-Rpt.9-2002\Att_B4.xls B4 - 5

Attachment B4. Southern Ogallala GAM regional and county long-term average estimates for irrigation water demand by crop.CASTRO COUNTY
CropLTA Total Irr
Water Used, in/piaLTA Total Water
Used, in/piaCrop Acreage,
ac/countyTotal Irr
Demand, ac-ft
Corn: 24.82 36.82 119,200 246,564
Cotton: 12.07 26.63 60,600 60,934
Hay: 34.64 49.38 0 0
Pasture and Other: 25.85 41.59 6,707 14,447
Peanuts: 13.95 26.41 0 0
Sorghum: 14.43 27.06 16,200 19,479
Soybeans: 14.14 27.86 3,000 3,536
Wheat - Cover Crop 11.31 24.52 70,200 66,166Total 275,907 411,125
P:\9345\GAM-Rpt.9-2002\Att_B4.xls B4 - 6

Attachment B4. Southern Ogallala GAM regional and county long-term average estimates for irrigation water demand by crop.COCHRAN COUNTY
CropLTA Total Irr
Water Used, in/piaLTA Total Water
Used, in/piaCrop Acreage,
ac/countyTotal Irr
Demand, ac-ft
Corn: 22.77 34.32 2,000 3,796
Cotton: 12.12 23.53 55,400 55,971
Hay: 37.17 52.00 0 0
Pasture and Other: 27.46 43.79 850 1,945
Peanuts: 13.63 25.14 2,300 2,613
Sorghum: 11.78 23.07 15,700 15,409
Soybeans: 14.13 26.32 0 0
Wheat - Cover Crop 14.62 17.68 0 0Total 76,250 79,734
P:\9345\GAM-Rpt.9-2002\Att_B4.xls B4 - 7

Attachment B4. Southern Ogallala GAM regional and county long-term average estimates for irrigation water demand by crop.CROSBY COUNTY
CropLTA Total Irr
Water Used, in/piaLTA Total Water
Used, in/piaCrop Acreage,
ac/countyTotal Irr
Demand, ac-ft
Corn: 21.60 34.00 0 0
Cotton: 10.76 22.95 126,700 113,636
Hay: 36.58 53.64 0 0
Pasture and Other: 26.61 45.17 235 521
Peanuts: 12.28 25.12 0 0
Sorghum: 10.63 22.76 6,800 6,023
Soybeans: 12.71 26.31 1,100 1,165
Wheat - Cover Crop 11.86 17.60 0 0Total 134,835 121,345
P:\9345\GAM-Rpt.9-2002\Att_B4.xls B4 - 8

Attachment B4. Southern Ogallala GAM regional and county long-term average estimates for irrigation water demand by crop.DAWSON COUNTY
CropLTA Total Irr
Water Used, in/piaLTA Total Water
Used, in/piaCrop Acreage,
ac/countyTotal Irr
Demand, ac-ft
Corn: 23.25 34.00 0 0
Cotton: 12.17 22.95 52,000 52,748
Hay: 39.07 53.64 0 0
Pasture and Other: 29.10 45.17 1,105 2,680
Peanuts: 14.04 25.12 16,700 19,540
Sorghum: 12.10 22.76 4,800 4,840
Soybeans: 14.57 26.31 0 0
Wheat - Cover Crop 4.91 8.36 2,800 1,146Total 77,405 80,954
P:\9345\GAM-Rpt.9-2002\Att_B4.xls B4 - 9

Attachment B4. Southern Ogallala GAM regional and county long-term average estimates for irrigation water demand by crop.DEAF SMITH COUNTY
CropLTA Total Irr
Water Used, in/piaLTA Total Water
Used, in/piaCrop Acreage,
ac/countyTotal Irr
Demand, ac-ft
Corn: 24.80 37.25 44,000 90,950
Cotton: 12.12 26.96 7,700 7,779
Hay: 35.20 50.30 0 0
Pasture and Other: 26.26 42.36 9,093 19,898
Peanuts: 14.02 26.81 0 0
Sorghum: 13.41 26.18 36,400 40,673
Soybeans: 14.14 28.21 0 0
Wheat - Cover Crop 11.35 24.56 100,800 95,372Total 197,993 254,672
P:\9345\GAM-Rpt.9-2002\Att_B4.xls B4 - 10
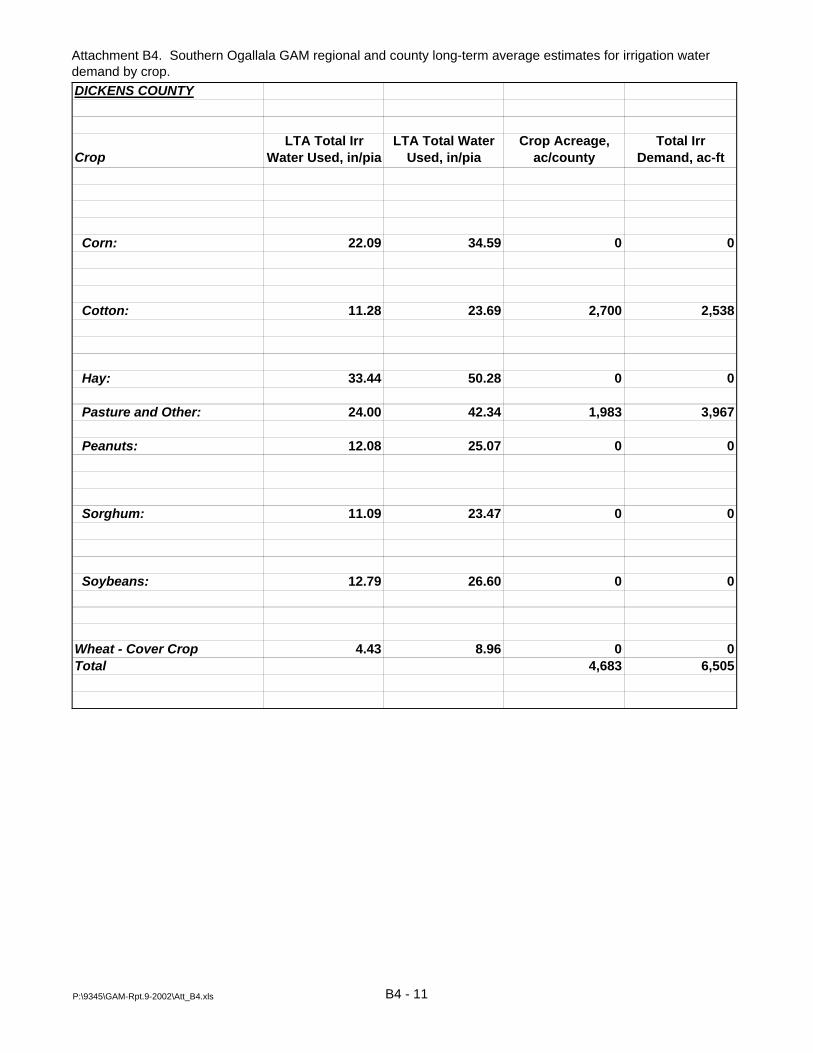
Attachment B4. Southern Ogallala GAM regional and county long-term average estimates for irrigation water demand by crop.DICKENS COUNTY
CropLTA Total Irr
Water Used, in/piaLTA Total Water
Used, in/piaCrop Acreage,
ac/countyTotal Irr
Demand, ac-ft
Corn: 22.09 34.59 0 0
Cotton: 11.28 23.69 2,700 2,538
Hay: 33.44 50.28 0 0
Pasture and Other: 24.00 42.34 1,983 3,967
Peanuts: 12.08 25.07 0 0
Sorghum: 11.09 23.47 0 0
Soybeans: 12.79 26.60 0 0
Wheat - Cover Crop 4.43 8.96 0 0Total 4,683 6,505
P:\9345\GAM-Rpt.9-2002\Att_B4.xls B4 - 11

Attachment B4. Southern Ogallala GAM regional and county long-term average estimates for irrigation water demand by crop.ECTOR COUNTY
CropLTA Total Irr
Water Used, in/piaLTA Total Water
Used, in/piaCrop Acreage,
ac/countyTotal Irr
Demand, ac-ft
Corn: 25.51 34.00 0 0
Cotton: 14.26 22.95 0 0
Hay: 42.27 53.64 0 0
Pasture and Other: 32.30 45.17 1,313 3,534
Peanuts: 16.40 25.12 0 0
Sorghum: 14.28 22.76 0 0
Soybeans: 17.06 26.31 0 0
Wheat - Cover Crop 5.75 8.36 0 0Total 1,313 3,534
P:\9345\GAM-Rpt.9-2002\Att_B4.xls B4 - 12

Attachment B4. Southern Ogallala GAM regional and county long-term average estimates for irrigation water demand by crop.FLOYD COUNTY
CropLTA Total Irr
Water Used, in/piaLTA Total Water
Used, in/piaCrop Acreage,
ac/countyTotal Irr
Demand, ac-ft
Corn: 21.66 34.54 17,945 32,397
Cotton: 11.46 23.85 122,026 116,500
Hay: 32.39 48.45 0 0
Pasture and Other: 23.24 40.80 1,880 3,640
Peanuts: 11.88 24.61 0 0
Sorghum: 10.95 23.27 23,959 21,865
Soybeans: 12.60 26.12 10,282 10,800
Wheat - Cover Crop 5.15 8.78 7,954 3,415Total 184,046 188,617
P:\9345\GAM-Rpt.9-2002\Att_B4.xls B4 - 13

Attachment B4. Southern Ogallala GAM regional and county long-term average estimates for irrigation water demand by crop.GAINES COUNTY
CropLTA Total Irr
Water Used, in/piaLTA Total Water
Used, in/piaCrop Acreage,
ac/countyTotal Irr
Demand, ac-ft
Corn: 23.46 34.00 1,600 3,128
Cotton: 12.39 22.95 144,000 148,660
Hay: 39.50 53.64 0 0
Pasture and Other: 29.53 45.17 3,272 8,051
Peanuts: 14.33 25.12 64,600 77,162
Sorghum: 12.33 22.76 6,700 6,882
Soybeans: 14.88 26.31 0 0
Wheat - Cover Crop 5.12 8.36 10,700 4,566Total 230,872 248,450
P:\9345\GAM-Rpt.9-2002\Att_B4.xls B4 - 14
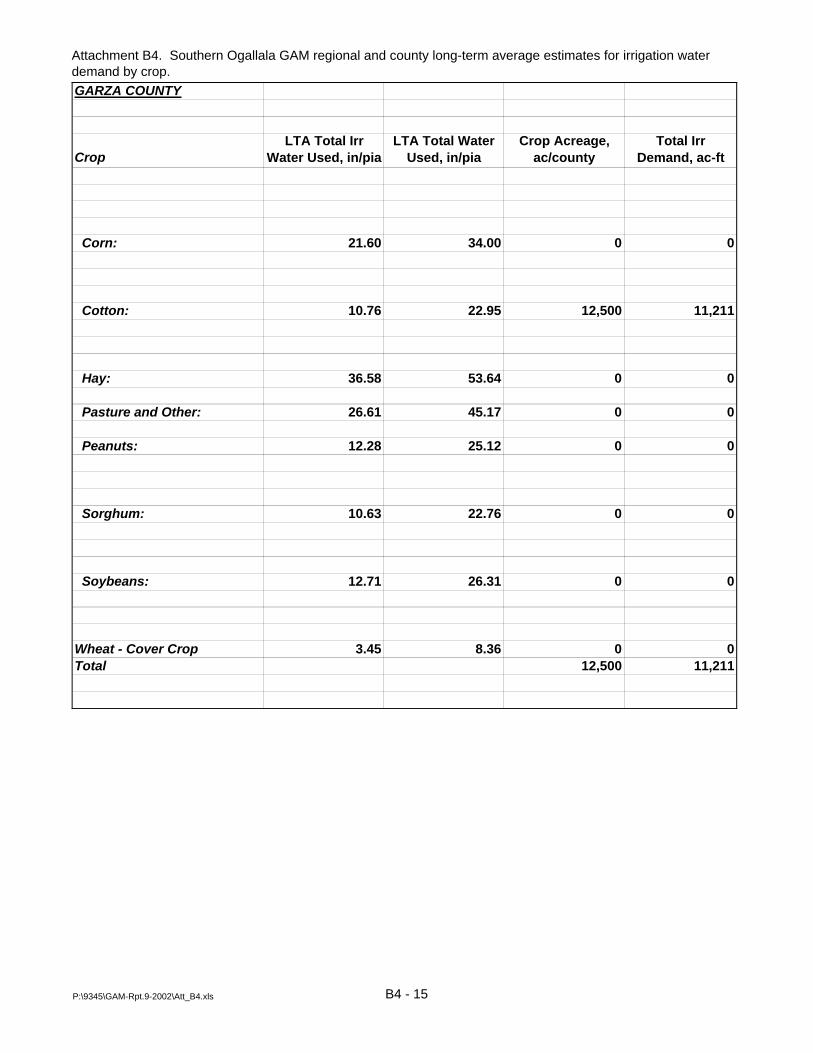
Attachment B4. Southern Ogallala GAM regional and county long-term average estimates for irrigation water demand by crop.GARZA COUNTY
CropLTA Total Irr
Water Used, in/piaLTA Total Water
Used, in/piaCrop Acreage,
ac/countyTotal Irr
Demand, ac-ft
Corn: 21.60 34.00 0 0
Cotton: 10.76 22.95 12,500 11,211
Hay: 36.58 53.64 0 0
Pasture and Other: 26.61 45.17 0 0
Peanuts: 12.28 25.12 0 0
Sorghum: 10.63 22.76 0 0
Soybeans: 12.71 26.31 0 0
Wheat - Cover Crop 3.45 8.36 0 0Total 12,500 11,211
P:\9345\GAM-Rpt.9-2002\Att_B4.xls B4 - 15
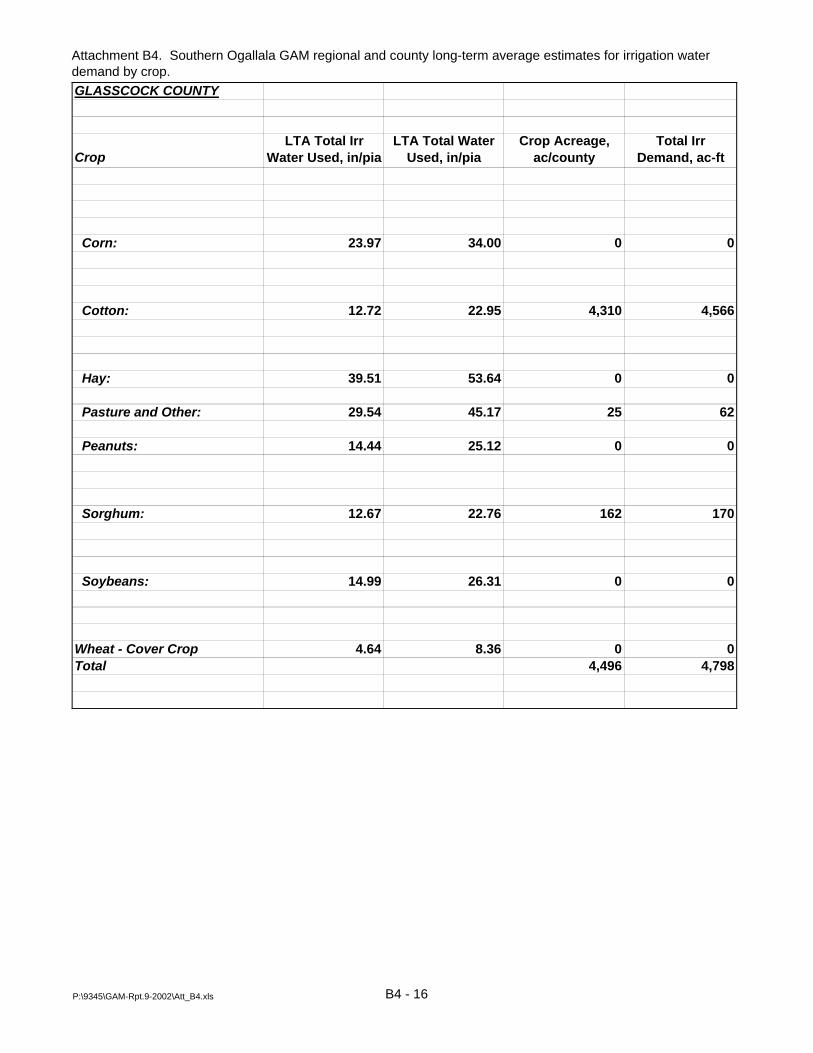
Attachment B4. Southern Ogallala GAM regional and county long-term average estimates for irrigation water demand by crop.GLASSCOCK COUNTY
CropLTA Total Irr
Water Used, in/piaLTA Total Water
Used, in/piaCrop Acreage,
ac/countyTotal Irr
Demand, ac-ft
Corn: 23.97 34.00 0 0
Cotton: 12.72 22.95 4,310 4,566
Hay: 39.51 53.64 0 0
Pasture and Other: 29.54 45.17 25 62
Peanuts: 14.44 25.12 0 0
Sorghum: 12.67 22.76 162 170
Soybeans: 14.99 26.31 0 0
Wheat - Cover Crop 4.64 8.36 0 0Total 4,496 4,798
P:\9345\GAM-Rpt.9-2002\Att_B4.xls B4 - 16

Attachment B4. Southern Ogallala GAM regional and county long-term average estimates for irrigation water demand by crop.HALE COUNTY
CropLTA Total Irr
Water Used, in/piaLTA Total Water
Used, in/piaCrop Acreage,
ac/countyTotal Irr
Demand, ac-ft
Corn: 22.10 35.06 62,600 115,311
Cotton: 9.36 24.88 202,200 157,762
Hay: 31.64 48.17 0 0
Pasture and Other: 23.04 40.56 8,963 17,206
Peanuts: 11.41 25.20 0 0
Sorghum: 10.40 23.79 34,900 30,254
Soybeans: 11.31 26.35 14,600 13,756
Wheat - Cover Crop 0.00 6.50 37,500 8Total 360,763 334,295
P:\9345\GAM-Rpt.9-2002\Att_B4.xls B4 - 17
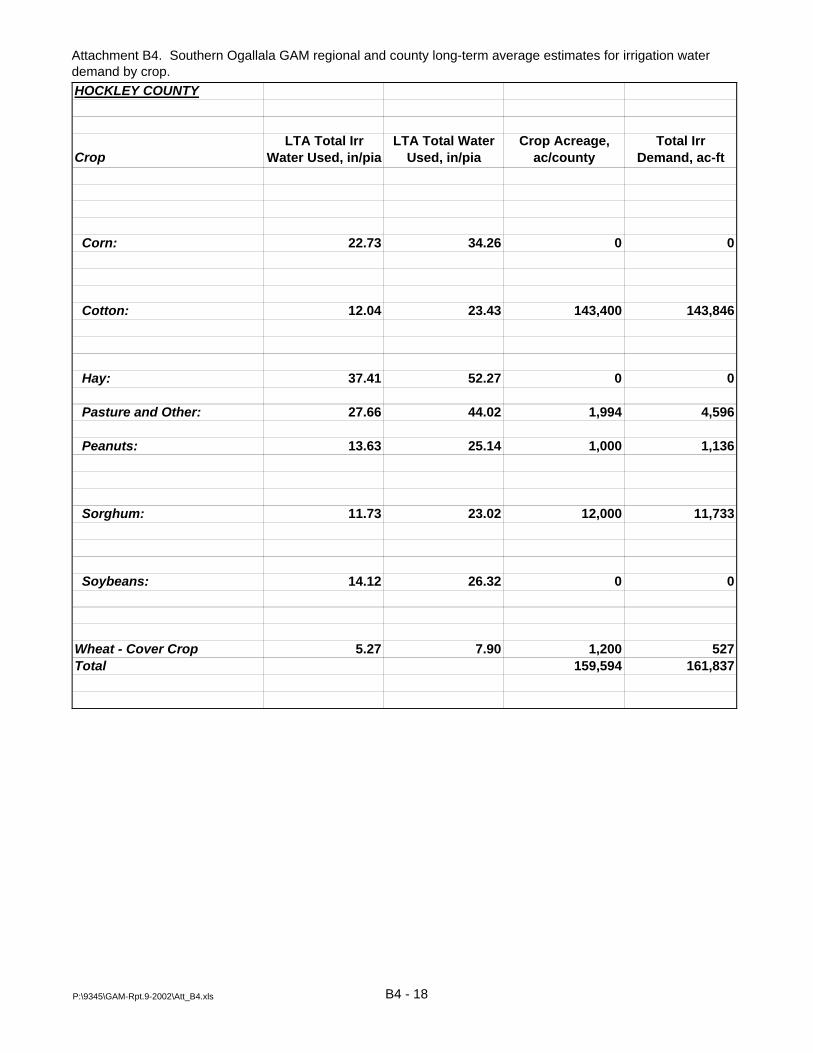
Attachment B4. Southern Ogallala GAM regional and county long-term average estimates for irrigation water demand by crop.HOCKLEY COUNTY
CropLTA Total Irr
Water Used, in/piaLTA Total Water
Used, in/piaCrop Acreage,
ac/countyTotal Irr
Demand, ac-ft
Corn: 22.73 34.26 0 0
Cotton: 12.04 23.43 143,400 143,846
Hay: 37.41 52.27 0 0
Pasture and Other: 27.66 44.02 1,994 4,596
Peanuts: 13.63 25.14 1,000 1,136
Sorghum: 11.73 23.02 12,000 11,733
Soybeans: 14.12 26.32 0 0
Wheat - Cover Crop 5.27 7.90 1,200 527Total 159,594 161,837
P:\9345\GAM-Rpt.9-2002\Att_B4.xls B4 - 18
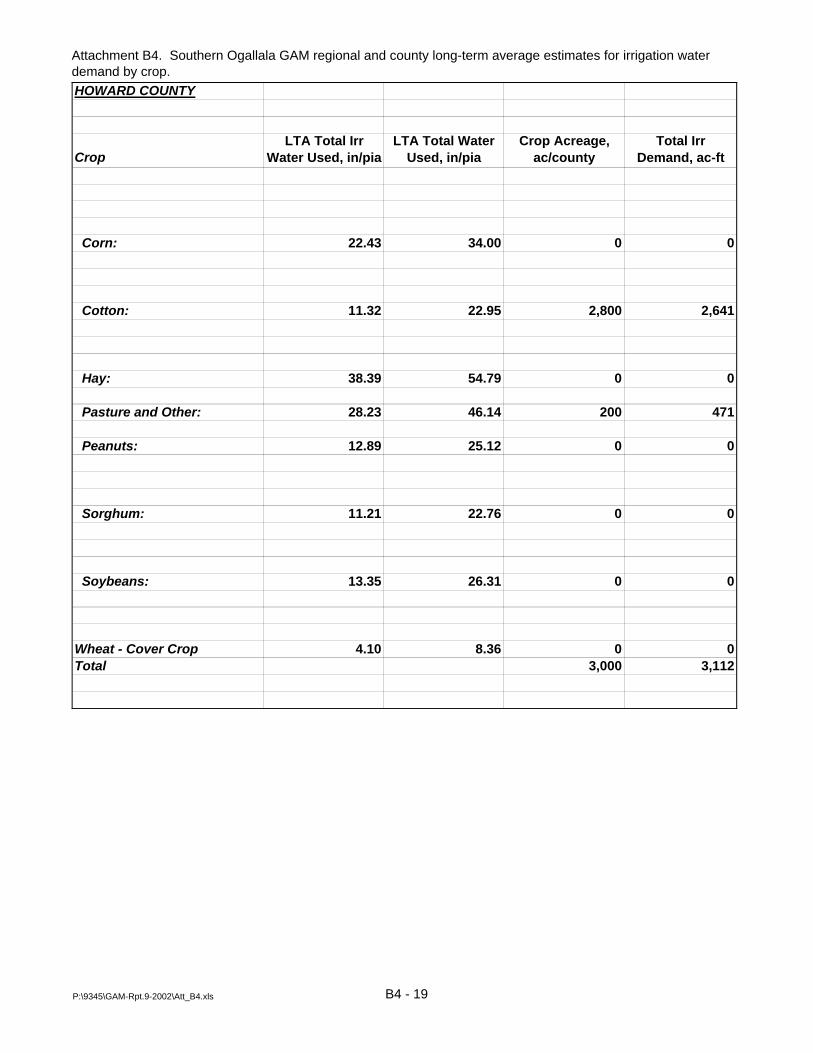
Attachment B4. Southern Ogallala GAM regional and county long-term average estimates for irrigation water demand by crop.HOWARD COUNTY
CropLTA Total Irr
Water Used, in/piaLTA Total Water
Used, in/piaCrop Acreage,
ac/countyTotal Irr
Demand, ac-ft
Corn: 22.43 34.00 0 0
Cotton: 11.32 22.95 2,800 2,641
Hay: 38.39 54.79 0 0
Pasture and Other: 28.23 46.14 200 471
Peanuts: 12.89 25.12 0 0
Sorghum: 11.21 22.76 0 0
Soybeans: 13.35 26.31 0 0
Wheat - Cover Crop 4.10 8.36 0 0Total 3,000 3,112
P:\9345\GAM-Rpt.9-2002\Att_B4.xls B4 - 19

Attachment B4. Southern Ogallala GAM regional and county long-term average estimates for irrigation water demand by crop.LAMB COUNTY
CropLTA Total Irr
Water Used, in/piaLTA Total Water
Used, in/piaCrop Acreage,
ac/countyTotal Irr
Demand, ac-ft
Corn: 23.32 35.06 62,700 121,837
Cotton: 13.47 24.88 123,600 138,738
Hay: 34.01 48.17 0 0
Pasture and Other: 24.90 40.56 4,662 9,674
Peanuts: 13.82 25.20 1,100 1,267
Sorghum: 12.55 23.79 14,900 15,581
Soybeans: 14.29 26.35 5,100 6,075
Wheat - Cover Crop 3.74 6.50 14,200 4,426Total 226,262 297,598
P:\9345\GAM-Rpt.9-2002\Att_B4.xls B4 - 20

Attachment B4. Southern Ogallala GAM regional and county long-term average estimates for irrigation water demand by crop.LUBBOCK COUNTY
CropLTA Total Irr
Water Used, in/piaLTA Total Water
Used, in/piaCrop Acreage,
ac/countyTotal Irr
Demand, ac-ft
Corn: 21.69 34.10 1,000 1,807
Cotton: 10.93 23.14 188,900 172,114
Hay: 36.11 53.09 0 0
Pasture and Other: 26.23 44.71 3,738 8,169
Peanuts: 12.29 25.13 2,500 2,560
Sorghum: 10.72 22.86 14,000 12,503
Soybeans: 12.71 26.31 3,600 3,814
Wheat - Cover Crop 3.28 8.18 3,600 984Total 217,338 201,952
P:\9345\GAM-Rpt.9-2002\Att_B4.xls B4 - 21

Attachment B4. Southern Ogallala GAM regional and county long-term average estimates for irrigation water demand by crop.LYNN COUNTY
CropLTA Total Irr
Water Used, in/piaLTA Total Water
Used, in/piaCrop Acreage,
ac/countyTotal Irr
Demand, ac-ft
Corn: 21.60 34.00 0 0
Cotton: 10.76 22.95 51,300 46,010
Hay: 36.58 53.64 0 0
Pasture and Other: 26.61 45.17 930 2,062
Peanuts: 12.28 25.12 1,500 1,535
Sorghum: 10.63 22.76 2,100 1,860
Soybeans: 12.71 26.31 0 0
Wheat - Cover Crop 3.45 8.36 0 0Total 55,830 51,468
P:\9345\GAM-Rpt.9-2002\Att_B4.xls B4 - 22

Attachment B4. Southern Ogallala GAM regional and county long-term average estimates for irrigation water demand by crop.MARTIN COUNTY
CropLTA Total Irr
Water Used, in/piaLTA Total Water
Used, in/piaCrop Acreage,
ac/countyTotal Irr
Demand, ac-ft
Corn: 23.25 34.00 0 0
Cotton: 12.17 22.95 6,000 6,086
Hay: 39.07 53.64 0 0
Pasture and Other: 29.10 45.17 90 218
Peanuts: 14.04 25.12 1,800 2,106
Sorghum: 12.10 22.76 0 0
Soybeans: 14.57 26.31 0 0
Wheat - Cover Crop 4.91 8.36 0 0Total 7,890 8,411
P:\9345\GAM-Rpt.9-2002\Att_B4.xls B4 - 23

Attachment B4. Southern Ogallala GAM regional and county long-term average estimates for irrigation water demand by crop.MIDLAND COUNTY
CropLTA Total Irr
Water Used, in/piaLTA Total Water
Used, in/piaCrop Acreage,
ac/countyTotal Irr
Demand, ac-ft
Corn: 24.73 34.00 0 0
Cotton: 13.48 22.95 3,090 3,471
Hay: 40.87 53.64 0 0
Pasture and Other: 30.90 45.17 628 1,618
Peanuts: 15.41 25.12 0 0
Sorghum: 13.46 22.76 0 0
Soybeans: 16.01 26.31 0 0
Wheat - Cover Crop 5.19 8.36 0 0Total 3,718 5,089
P:\9345\GAM-Rpt.9-2002\Att_B4.xls B4 - 24

Attachment B4. Southern Ogallala GAM regional and county long-term average estimates for irrigation water demand by crop.MOTLEY COUNTY
CropLTA Total Irr
Water Used, in/piaLTA Total Water
Used, in/piaCrop Acreage,
ac/countyTotal Irr
Demand, ac-ft
Corn: 21.51 34.28 0 0
Cotton: 10.98 23.34 0 0
Hay: 32.01 48.59 0 0
Pasture and Other: 22.84 40.92 139 265
Peanuts: 11.33 24.32 248 234
Sorghum: 10.70 23.00 0 0
Soybeans: 12.20 26.00 0 0
Wheat - Cover Crop 3.16 6.73 0 0Total 387 499
P:\9345\GAM-Rpt.9-2002\Att_B4.xls B4 - 25
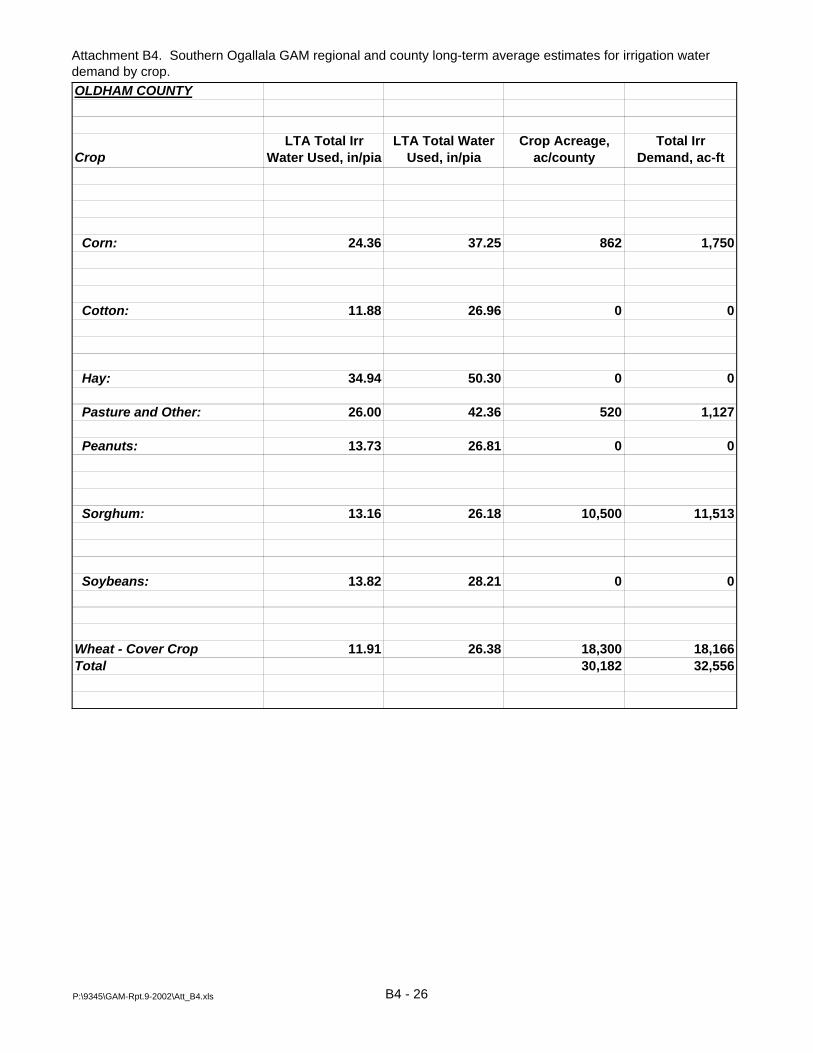
Attachment B4. Southern Ogallala GAM regional and county long-term average estimates for irrigation water demand by crop.OLDHAM COUNTY
CropLTA Total Irr
Water Used, in/piaLTA Total Water
Used, in/piaCrop Acreage,
ac/countyTotal Irr
Demand, ac-ft
Corn: 24.36 37.25 862 1,750
Cotton: 11.88 26.96 0 0
Hay: 34.94 50.30 0 0
Pasture and Other: 26.00 42.36 520 1,127
Peanuts: 13.73 26.81 0 0
Sorghum: 13.16 26.18 10,500 11,513
Soybeans: 13.82 28.21 0 0
Wheat - Cover Crop 11.91 26.38 18,300 18,166Total 30,182 32,556
P:\9345\GAM-Rpt.9-2002\Att_B4.xls B4 - 26

Attachment B4. Southern Ogallala GAM regional and county long-term average estimates for irrigation water demand by crop.PARMER COUNTY
CropLTA Total Irr
Water Used, in/piaLTA Total Water
Used, in/piaCrop Acreage,
ac/countyTotal Irr
Demand, ac-ft
Corn: 21.67 33.18 91,700 165,624
Cotton: 9.82 24.12 65,700 53,776
Hay: 30.08 44.27 0 0
Pasture and Other: 22.10 37.28 9,719 17,895
Peanuts: 11.68 23.91 0 0
Sorghum: 10.91 23.02 17,500 15,911
Soybeans: 11.90 25.29 1,600 1,587
Wheat - Cover Crop 10.61 23.76 46,600 41,204Total 232,819 295,996
P:\9345\GAM-Rpt.9-2002\Att_B4.xls B4 - 27

Attachment B4. Southern Ogallala GAM regional and county long-term average estimates for irrigation water demand by crop.POTTER COUNTY
CropLTA Total Irr
Water Used, in/piaLTA Total Water
Used, in/piaCrop Acreage,
ac/countyTotal Irr
Demand, ac-ft
Corn: 23.31 37.25 971 1,886
Cotton: 11.01 26.96 0 0
Hay: 33.56 50.30 0 0
Pasture and Other: 24.61 42.36 2,948 6,047
Peanuts: 12.75 26.81 0 0
Sorghum: 12.24 26.18 1,500 1,530
Soybeans: 12.78 28.21 0 0
Wheat - Cover Crop 9.03 23.56 22,800 17,157Total 28,219 26,620
P:\9345\GAM-Rpt.9-2002\Att_B4.xls B4 - 28

Attachment B4. Southern Ogallala GAM regional and county long-term average estimates for irrigation water demand by crop.RANDALL COUNTY
CropLTA Total Irr
Water Used, in/piaLTA Total Water
Used, in/piaCrop Acreage,
ac/countyTotal Irr
Demand, ac-ft
Corn: 23.57 37.25 4,400 8,641
Cotton: 11.09 26.96 80 74
Hay: 33.57 50.30 1,748 4,890
Pasture and Other: 24.63 42.36 5,256 10,786
Peanuts: 12.80 26.81 0 0
Sorghum: 12.33 26.18 11,840 12,163
Soybeans: 12.85 28.21 0 0
Wheat - Cover Crop 9.56 24.45 14,160 11,277Total 37,484 47,832
P:\9345\GAM-Rpt.9-2002\Att_B4.xls B4 - 29

Attachment B4. Southern Ogallala GAM regional and county long-term average estimates for irrigation water demand by crop.SWISHER COUNTY
CropLTA Total Irr
Water Used, in/piaLTA Total Water
Used, in/piaCrop Acreage,
ac/countyTotal Irr
Demand, ac-ft
Corn: 23.54 36.90 27,900 54,735
Cotton: 10.93 26.69 61,200 55,760
Hay: 32.94 49.57 0 0
Pasture and Other: 24.11 41.74 3,776 7,588
Peanuts: 12.58 26.49 0 0
Sorghum: 13.02 26.89 21,000 22,777
Soybeans: 12.67 27.93 5,600 5,911
Wheat - Cover Crop 9.26 24.44 19,400 14,978Total 138,876 161,748
P:\9345\GAM-Rpt.9-2002\Att_B4.xls B4 - 30

Attachment B4. Southern Ogallala GAM regional and county long-term average estimates for irrigation water demand by crop.TERRY COUNTY
CropLTA Total Irr
Water Used, in/piaLTA Total Water
Used, in/piaCrop Acreage,
ac/countyTotal Irr
Demand, ac-ft
Corn: 22.55 34.05 1,200 2,255
Cotton: 11.69 23.05 133,100 129,681
Hay: 38.38 53.37 0 0
Pasture and Other: 28.45 44.94 2,331 5,527
Peanuts: 13.61 25.12 21,100 23,939
Sorghum: 11.55 22.81 8,200 7,894
Soybeans: 14.12 26.31 0 0
Wheat - Cover Crop 5.63 8.27 6,100 2,861Total 172,031 172,157
P:\9345\GAM-Rpt.9-2002\Att_B4.xls B4 - 31

Attachment B4. Southern Ogallala GAM regional and county long-term average estimates for irrigation water demand by crop.YOAKUM COUNTY
CropLTA Total Irr
Water Used, in/piaLTA Total Water
Used, in/piaCrop Acreage,
ac/countyTotal Irr
Demand, ac-ft
Corn: 22.50 34.00 1,900 3,562
Cotton: 11.61 22.95 78,700 76,112
Hay: 38.62 53.64 0 0
Pasture and Other: 28.65 45.17 409 976
Peanuts: 13.61 25.12 11,800 13,384
Sorghum: 11.51 22.76 8,700 8,343
Soybeans: 14.11 26.31 0 0
Wheat - Cover Crop 5.72 8.36 4,400 2,096Total 105,909 104,474
P:\9345\GAM-Rpt.9-2002\Att_B4.xls B4 - 32

Attachment B4. Southern Ogallala GAM regional and county long-term average estimates for irrigation water demand by crop.CURRY COUNTY
CropLTA Total Irr
Water Used, in/piaLTA Total Water
Used, in/piaCrop Acreage,
ac/countyTotal Irr
Demand, ac-ft
Corn: 21.81 33.16 33,000 59,968
Cotton: 13.45 24.59 2,400 2,690
Hay: 31.57 44.83 0 0
Pasture and Other: 23.00 37.75 5,195 9,955
Peanuts: 13.43 24.37 1,600 1,790
Sorghum: 12.44 23.38 23,500 24,368
Soybeans: 13.65 25.18 0 0
Wheat - Cover Crop 4.56 6.93 52,000 19,750Total 117,695 118,523
P:\9345\GAM-Rpt.9-2002\Att_B4.xls B4 - 33

Attachment B4. Southern Ogallala GAM regional and county long-term average estimates for irrigation water demand by crop.LEA COUNTY
CropLTA Total Irr
Water Used, in/piaLTA Total Water
Used, in/piaCrop Acreage,
ac/countyTotal Irr
Demand, ac-ft
Corn: 24.00 34.00 4,200 8,399
Cotton: 12.83 22.95 12,200 13,042
Hay: 40.63 53.64 0 0
Pasture and Other: 30.66 45.17 6,291 16,072
Peanuts: 15.02 25.12 3,200 4,005
Sorghum: 12.78 22.76 2,400 2,557
Soybeans: 15.60 26.31 0 0
Wheat - Cover Crop 5.34 8.36 6,000 2,670Total 34,291 46,745
P:\9345\GAM-Rpt.9-2002\Att_B4.xls B4 - 34

Attachment B4. Southern Ogallala GAM regional and county long-term average estimates for irrigation water demand by crop.QUAY COUNTY
CropLTA Total Irr
Water Used, in/piaLTA Total Water
Used, in/piaCrop Acreage,
ac/countyTotal Irr
Demand, ac-ft
Corn: 25.33 37.25 22 46
Cotton: 15.55 26.96 25 32
Hay: 36.40 50.30 0 0
Pasture and Other: 26.96 42.36 143 322
Peanuts: 15.51 26.81 0 0
Sorghum: 14.85 26.18 55 68
Soybeans: 16.16 28.21 0 0
Wheat - Cover Crop 4.00 6.50 90 30Total 335 499
P:\9345\GAM-Rpt.9-2002\Att_B4.xls B4 - 35

Attachment B4. Southern Ogallala GAM regional and county long-term average estimates for irrigation water demand by crop.ROOSEVELT COUNTY
CropLTA Total Irr
Water Used, in/piaLTA Total Water
Used, in/piaCrop Acreage,
ac/countyTotal Irr
Demand, ac-ft
Corn: 22.60 33.17 22,000 41,442
Cotton: 13.55 24.21 13,600 15,351
Hay: 31.71 44.38 0 0
Pasture and Other: 23.20 37.37 3,848 7,441
Peanuts: 13.60 24.00 13,200 14,955
Sorghum: 12.63 23.09 10,400 10,949
Soybeans: 14.26 25.27 0 0
Wheat - Cover Crop 3.42 5.73 30,000 8,548Total 93,048 98,687
P:\9345\GAM-Rpt.9-2002\Att_B4.xls B4 - 36

Appendix C
Historical and Future Pumping Demands for
Southern Ogallala GAM

Historical and Future Pumping Demands for Southern Ogallala
GAM Model
Introduction
Table C-1 in this appendix provides the pumping estimates used in the GAM model for the entire simulation period from 1940 through 2050. The following sections provide a brief description of how the pumping estimates were derived for the Texas portion of the study area. Sources for New Mexico pumping are provided in the main report. For the predictive simulations, pumping for New Mexico was continued into the future at year 2000 estimated amounts. Although agricultural pumping is provided in Table C-1, methods of estimation are provided in Appendix B and the main report.
Municipal Point
Municipal point data were obtained from the provided *LinkedwithWellData tables. Initially, all records that included a latitude and longitude were included. Those records were then limited based on the study area. If a well fell geographically outside of the clipped study area, the record was excluded from further consideration. Additional queries were constructed to verify that the raw tables provided did not contain unlinked information. A latitude and longitude (lat/long) is given for each state well number. Each unique state well number, along with its given lat/long, was exported to a dbf file and brought into ArcView. Using ArcView, the lat/long was converted to decimal degrees and then Texas Centric coordinates. Once the state well numbers were displayed in the Texas Centric projection, they were spatially joined with the model grid to obtain cell IDs for each well. The resulting table contained identified state wells with in the study area and
their Cell ID numbers. This was done for the state well numbers in both the pre- and post 80s pumpage databases.
The pumping was distributed within a city by dividing the annual pumping for a city by the number of wells in that city that we had actual coordinates for. The pumpage numbers for each model grid cell and each year were then summed to derive pumping for a cell in a particular year.
The well’s drilling date was used to screen out wells that were not in use for a particular year wherever available. Additionally, we were able to research and come up with some other drilled dates and end-of-pumping dates, where wells were taken off line.
Decade based census data by county, as supplied by the Texas Water Development Board (TWDB), were used to interpolate data back to 1940. Only wells that had a pumpage value in 1955 were interpolated back in time to 1940. Gaps in annual data were not linearly interpolated for point data.
County Other (Municipal Nonpoint)
County other data were derived from the historical summary table for the post-1980 data. The pre-1980 data give only total municipal amounts, so the point data totals were subtracted from the county totals to determine the county other values within a county for the pre-1980 data. The Census block GIS coverages were used to distribute the county other data. Each census block has a persons/area designation. All census blocks that were outside of a city boundary, as determined by the Texas Natural Resources Information System (TNRIS) city coverage, were intersected with the model grid polygon GIS coverage. By calculating the area of each new polygon using the population distribution of the census blocks within the
P:\9345\GAM-Rpt.1-03\ApdxC\AppxC.doc C-1

model grid cell, a population of each polygon was then calculated within the grid cell.
The County other data were then distributed throughout a county/basin based on the populations of each cell within that county/basin. The 2000 Census blocks were used for 1991 through 2000 data. The 1990 Census blocks were used for the post-1980 data as well as the 1974 and 1977 pre-1980 files. Linear interpolations were used to fill in the gaps between 1974 and 1977 and between 1977 and 1980.
Decade based census data by county, as supplied by the TWDB, were used to interpolate data back to 1940.
Manufacturing Point
The manufacturing point data presented are a combination of innate point data and those that had to be researched. The innate point data are those records in the MFG_LINKED* table that contained a state well number (which comes with lat/long). Those that had to be researched were derived from a location search for the entity. Directories and map engines on the internet were used to obtain latitude and longitude coordinates for the addresses listed for entities in the MFG_LINKED* table. Location data were obtained for approximately 60 percent of the listed users. These coordinates (for both the innate and researched point data) were then projected to the Texas Centric projection. Next, these points were spatially joined in ArcView with the model grid to obtain cell IDs for each location. This allowed each entity to be assigned to a model cell ID.
Decade based census data by county, as supplied by the TWDB, were used to interpolate data back to 1940. Only wells that had a pumpage value in 1955 were interpolated back in time. Gaps in annual data were not linearly interpolated for point data. Point data for which a specific location of the user could not be identified were added into the manufacturing nonpoint use estimates.
Manufacturing Nonpoint
The manufacturing nonpoint pumpage numbers were distributed over the urban, industrial, and mining land uses in their appropriate county/basin as follows:
The 1:250,000-scaled land use data for Texas and New Mexico, clipped to our study area, were used. The land use codes 1, 11, 12, 13, 14, 15, and 75 were selected. These include:
� Urban or built-up land � Residential, � Commercial and services � Industrial � Transportation, communication , and
utilities � Industrial and commercial complexes � Mixed urban or built-up land � Other urban or built-up land � Strip mines, quarries, and gravel pits The ArcView function Intersect was used to
combine this land use data with both the model grid cell ID designations and the county/basin information. The resulting shapefile contained only polygons with urban, industrial, or mining land use, broken up into model grid cells and county/basin areas.
Next, the total area covered by this land use in each county/basin combination was calculated. The area value for each polygon was divided by the total county/basin area value to get a percentage factor. This percentage was then used to weight how much pumpage the polygon’s cell ID should receive.
The resulting attribute table was saved and brought into the pre- and post-1980s pumpage databases. Two queries were developed to link the pumpage values with the percentage factors for each model grid cell.
Decade based census data by county, as obtained from the TWDB, were used to interpolate data back in time.
P:\9345\GAM-Rpt.1-03\ApdxC\AppxC.doc C-2
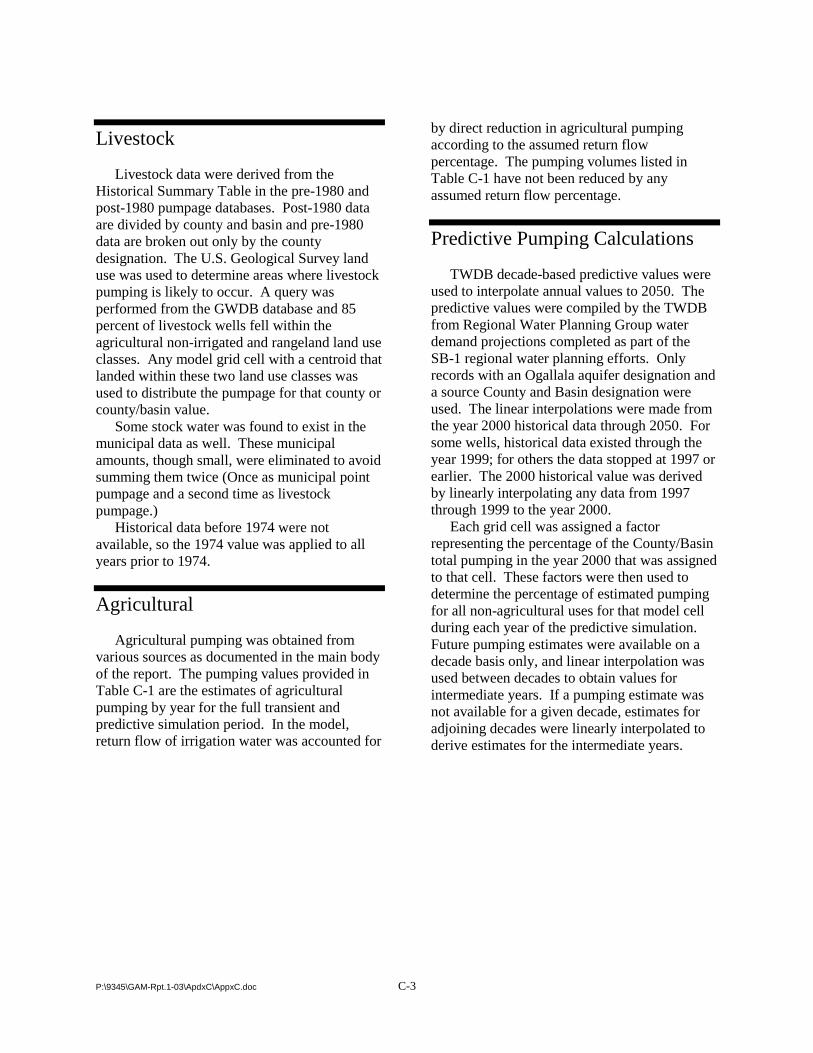
P:\9345\GAM-Rpt.1-03\ApdxC\AppxC.doc C-3
Livestock
Livestock data were derived from the Historical Summary Table in the pre-1980 and post-1980 pumpage databases. Post-1980 data are divided by county and basin and pre-1980 data are broken out only by the county designation. The U.S. Geological Survey land use was used to determine areas where livestock pumping is likely to occur. A query was performed from the GWDB database and 85 percent of livestock wells fell within the agricultural non-irrigated and rangeland land use classes. Any model grid cell with a centroid that landed within these two land use classes was used to distribute the pumpage for that county or county/basin value.
Some stock water was found to exist in the municipal data as well. These municipal amounts, though small, were eliminated to avoid summing them twice (Once as municipal point pumpage and a second time as livestock pumpage.)
Historical data before 1974 were not available, so the 1974 value was applied to all years prior to 1974.
Agricultural
Agricultural pumping was obtained from various sources as documented in the main body of the report. The pumping values provided in Table C-1 are the estimates of agricultural pumping by year for the full transient and predictive simulation period. In the model, return flow of irrigation water was accounted for
by direct reduction in agricultural pumping according to the assumed return flow percentage. The pumping volumes listed in Table C-1 have not been reduced by any assumed return flow percentage.
Predictive Pumping Calculations
TWDB decade-based predictive values were used to interpolate annual values to 2050. The predictive values were compiled by the TWDB from Regional Water Planning Group water demand projections completed as part of the SB-1 regional water planning efforts. Only records with an Ogallala aquifer designation and a source County and Basin designation were used. The linear interpolations were made from the year 2000 historical data through 2050. For some wells, historical data existed through the year 1999; for others the data stopped at 1997 or earlier. The 2000 historical value was derived by linearly interpolating any data from 1997 through 1999 to the year 2000.
Each grid cell was assigned a factor representing the percentage of the County/Basin total pumping in the year 2000 that was assigned to that cell. These factors were then used to determine the percentage of estimated pumping for all non-agricultural uses for that model cell during each year of the predictive simulation. Future pumping estimates were available on a decade basis only, and linear interpolation was used between decades to obtain values for intermediate years. If a pumping estimate was not available for a given decade, estimates for adjoining decades were linearly interpolated to derive estimates for the intermediate years.
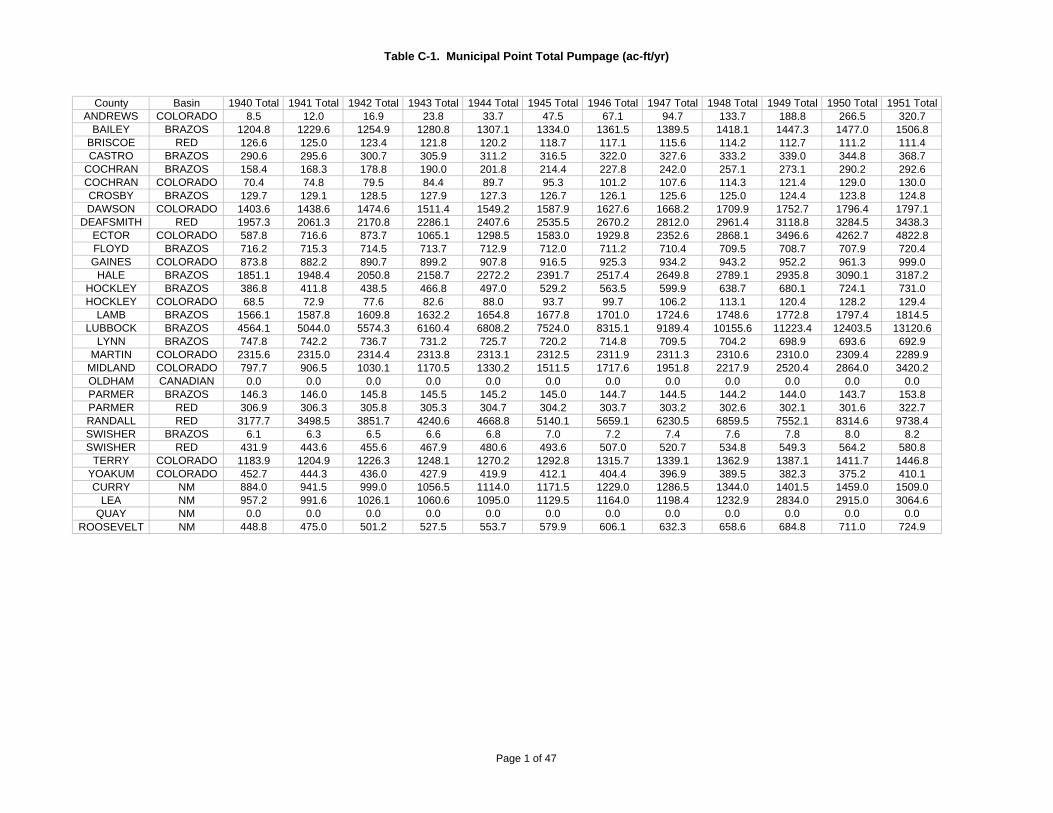
Table C-1. Municipal Point Total Pumpage (ac-ft/yr)
County Basin 1940 Total 1941 Total 1942 Total 1943 Total 1944 Total 1945 Total 1946 Total 1947 Total 1948 Total 1949 Total 1950 Total 1951 TotalANDREWS COLORADO 8.5 12.0 16.9 23.8 33.7 47.5 67.1 94.7 133.7 188.8 266.5 320.7
BAILEY BRAZOS 1204.8 1229.6 1254.9 1280.8 1307.1 1334.0 1361.5 1389.5 1418.1 1447.3 1477.0 1506.8BRISCOE RED 126.6 125.0 123.4 121.8 120.2 118.7 117.1 115.6 114.2 112.7 111.2 111.4CASTRO BRAZOS 290.6 295.6 300.7 305.9 311.2 316.5 322.0 327.6 333.2 339.0 344.8 368.7
COCHRAN BRAZOS 158.4 168.3 178.8 190.0 201.8 214.4 227.8 242.0 257.1 273.1 290.2 292.6COCHRAN COLORADO 70.4 74.8 79.5 84.4 89.7 95.3 101.2 107.6 114.3 121.4 129.0 130.0CROSBY BRAZOS 129.7 129.1 128.5 127.9 127.3 126.7 126.1 125.6 125.0 124.4 123.8 124.8DAWSON COLORADO 1403.6 1438.6 1474.6 1511.4 1549.2 1587.9 1627.6 1668.2 1709.9 1752.7 1796.4 1797.1
DEAFSMITH RED 1957.3 2061.3 2170.8 2286.1 2407.6 2535.5 2670.2 2812.0 2961.4 3118.8 3284.5 3438.3ECTOR COLORADO 587.8 716.6 873.7 1065.1 1298.5 1583.0 1929.8 2352.6 2868.1 3496.6 4262.7 4822.8FLOYD BRAZOS 716.2 715.3 714.5 713.7 712.9 712.0 711.2 710.4 709.5 708.7 707.9 720.4GAINES COLORADO 873.8 882.2 890.7 899.2 907.8 916.5 925.3 934.2 943.2 952.2 961.3 999.0
HALE BRAZOS 1851.1 1948.4 2050.8 2158.7 2272.2 2391.7 2517.4 2649.8 2789.1 2935.8 3090.1 3187.2HOCKLEY BRAZOS 386.8 411.8 438.5 466.8 497.0 529.2 563.5 599.9 638.7 680.1 724.1 731.0HOCKLEY COLORADO 68.5 72.9 77.6 82.6 88.0 93.7 99.7 106.2 113.1 120.4 128.2 129.4
LAMB BRAZOS 1566.1 1587.8 1609.8 1632.2 1654.8 1677.8 1701.0 1724.6 1748.6 1772.8 1797.4 1814.5LUBBOCK BRAZOS 4564.1 5044.0 5574.3 6160.4 6808.2 7524.0 8315.1 9189.4 10155.6 11223.4 12403.5 13120.6
LYNN BRAZOS 747.8 742.2 736.7 731.2 725.7 720.2 714.8 709.5 704.2 698.9 693.6 692.9MARTIN COLORADO 2315.6 2315.0 2314.4 2313.8 2313.1 2312.5 2311.9 2311.3 2310.6 2310.0 2309.4 2289.9
MIDLAND COLORADO 797.7 906.5 1030.1 1170.5 1330.2 1511.5 1717.6 1951.8 2217.9 2520.4 2864.0 3420.2OLDHAM CANADIAN 0.0 0.0 0.0 0.0 0.0 0.0 0.0 0.0 0.0 0.0 0.0 0.0PARMER BRAZOS 146.3 146.0 145.8 145.5 145.2 145.0 144.7 144.5 144.2 144.0 143.7 153.8PARMER RED 306.9 306.3 305.8 305.3 304.7 304.2 303.7 303.2 302.6 302.1 301.6 322.7RANDALL RED 3177.7 3498.5 3851.7 4240.6 4668.8 5140.1 5659.1 6230.5 6859.5 7552.1 8314.6 9738.4SWISHER BRAZOS 6.1 6.3 6.5 6.6 6.8 7.0 7.2 7.4 7.6 7.8 8.0 8.2SWISHER RED 431.9 443.6 455.6 467.9 480.6 493.6 507.0 520.7 534.8 549.3 564.2 580.8
TERRY COLORADO 1183.9 1204.9 1226.3 1248.1 1270.2 1292.8 1315.7 1339.1 1362.9 1387.1 1411.7 1446.8YOAKUM COLORADO 452.7 444.3 436.0 427.9 419.9 412.1 404.4 396.9 389.5 382.3 375.2 410.1CURRY NM 884.0 941.5 999.0 1056.5 1114.0 1171.5 1229.0 1286.5 1344.0 1401.5 1459.0 1509.0
LEA NM 957.2 991.6 1026.1 1060.6 1095.0 1129.5 1164.0 1198.4 1232.9 2834.0 2915.0 3064.6QUAY NM 0.0 0.0 0.0 0.0 0.0 0.0 0.0 0.0 0.0 0.0 0.0 0.0
ROOSEVELT NM 448.8 475.0 501.2 527.5 553.7 579.9 606.1 632.3 658.6 684.8 711.0 724.9
Page 1 of 47

Table C-1. Municipal Point Total Pumpage (ac-ft/yr)
1952 Total 1953 Total 1954 Total 1955 Total 1956 Total 1957 Total 1958 Total 1959 Total 1960 Total 1961 Total 1962 Total 1963 Total 1964 Total 1965 Total 1966 Total385.8 464.2 558.6 672.1 840.9 1101.7 1420.9 1314.2 1937.1 1997.2 2167.7 1920.3 2344.3 2038.9 2003.9
1537.1 1568.0 1599.6 1631.8 3645.0 2895.6 3496.6 3437.7 3433.6 4141.3 5191.3 5711.3 7207.7 8219.0 7752.3111.5 111.7 111.9 112.0 124.3 131.1 112.0 168.0 122.8 116.6 92.1 138.1 199.2 202.9 163.3394.2 421.5 450.6 481.8 392.2 515.4 612.7 853.2 828.6 635.7 791.6 842.9 932.2 840.3 847.3295.0 297.5 299.9 302.4 303.8 306.9 337.6 368.3 383.6 346.8 374.4 396.5 498.5 635.1 564.3131.1 132.2 133.3 134.4 98.2 110.5 73.7 76.7 80.7 79.5 78.3 84.4 93.6 115.1 136.6125.8 126.8 127.9 128.9 55.2 76.7 168.0 92.1 71.7 104.0 69.0 49.9 192.6 197.0 194.6
1797.8 1798.5 1799.2 1799.8 1804.4 1524.1 1737.0 1843.0 1909.5 1925.8 2125.6 2067.8 2154.0 2001.5 1710.13599.3 3767.9 3944.3 4129.0 4556.1 4193.5 4083.4 4650.8 4388.6 4764.0 4861.6 5633.5 6616.0 5419.8 5932.25456.4 6173.3 6984.4 7902.1 9377.6 9401.0 7005.5 3698.0 2351.6 3088.8 1453.0 1179.1 1634.0 1808.3 1105.1733.2 746.2 759.4 772.9 798.7 931.8 758.8 784.1 820.6 757.5 832.0 923.0 1172.7 1197.7 1105.5
1038.1 1078.8 1121.0 1164.9 1173.8 1178.5 2122.1 1649.8 1580.0 1272.8 1276.9 1182.2 2073.5 1879.3 1353.33287.2 3390.4 3496.8 3606.6 4460.2 3648.8 3903.5 4076.7 4446.8 519.2 4620.9 5054.8 5431.7 5482.5 4731.0738.0 745.0 752.2 759.4 1185.5 1268.8 2350.3 2264.5 2267.6 2384.2 2567.8 2834.5 3076.5 3033.6 2822.1130.6 131.9 133.1 134.4 131.1 131.1 227.1 199.5 177.6 181.7 192.0 204.7 323.5 233.8 238.2
1831.7 1849.1 1866.6 1884.3 2362.0 3401.9 4603.5 5930.8 6988.9 6535.4 7794.8 9436.9 9786.9 9469.2 8766.613879.1 14681.4 15530.1 16427.9 16582.0 13573.5 14050.4 14467.6 14448.1 13467.5 14944.1 15741.3 16346.4 16316.6 15813.1692.2 691.5 690.7 690.0 500.8 468.5 497.5 447.8 569.9 557.0 667.1 633.1 615.9 652.5 609.9
2270.5 2251.3 2232.2 2213.3 1562.0 1941.9 1872.0 2915.3 3731.5 3782.8 4225.3 4659.2 5774.6 5484.8 4852.34084.4 4877.6 5824.9 6956.1 7587.0 6980.4 7072.0 7441.8 6855.2 5965.7 6364.2 6771.8 6798.5 6754.0 5925.3
0.0 0.0 0.0 0.0 0.0 73.7 80.1 94.5 96.7 102.6 122.8 135.9 168.0 153.4 194.4164.6 176.2 188.5 201.8 223.7 257.8 261.0 261.0 252.3 135.6 340.2 384.1 470.8 496.5 404.5345.4 369.6 395.6 423.4 496.5 489.1 449.0 505.1 462.0 523.4 507.5 553.8 618.7 609.8 636.6
11406.1 13359.4 15647.2 18326.7 21813.7 17867.1 18642.2 22131.4 20535.3 22128.1 23005.8 26304.1 29491.9 26392.4 27771.78.5 8.7 9.0 9.3 12.0 12.8 9.7 9.6 17.0 9.3 10.2 31.4 34.3 46.8 36.1
597.8 615.4 633.5 652.2 867.7 763.7 812.7 883.4 834.0 956.4 1078.6 1191.2 1435.7 1521.8 1553.71482.7 1519.6 1557.4 1596.1 1727.9 1428.4 1478.7 1564.2 1727.2 1600.3 1670.4 1633.2 1889.1 1741.4 1606.3448.2 489.9 535.5 585.3 669.6 625.7 690.0 780.1 905.5 889.7 945.4 938.5 1128.5 1079.1 883.5
1558.9 1608.9 1658.8 1708.8 1758.7 1808.7 1858.6 1908.6 1958.5 2017.2 2076.0 2134.7 2193.4 2252.1 2310.93214.2 3363.8 3513.4 3662.9 3812.5 5528.8 7245.0 7394.6 7544.2 7648.3 7752.4 7856.5 7960.6 8064.7 8168.8
0.0 0.0 0.0 0.0 0.0 0.0 0.0 0.0 0.0 0.0 0.0 0.0 0.0 0.0 0.0738.8 752.7 766.6 780.5 794.4 808.3 822.2 836.1 850.0 926.8 1003.6 1080.4 1157.2 1234.0 1310.8
Page 2 of 47
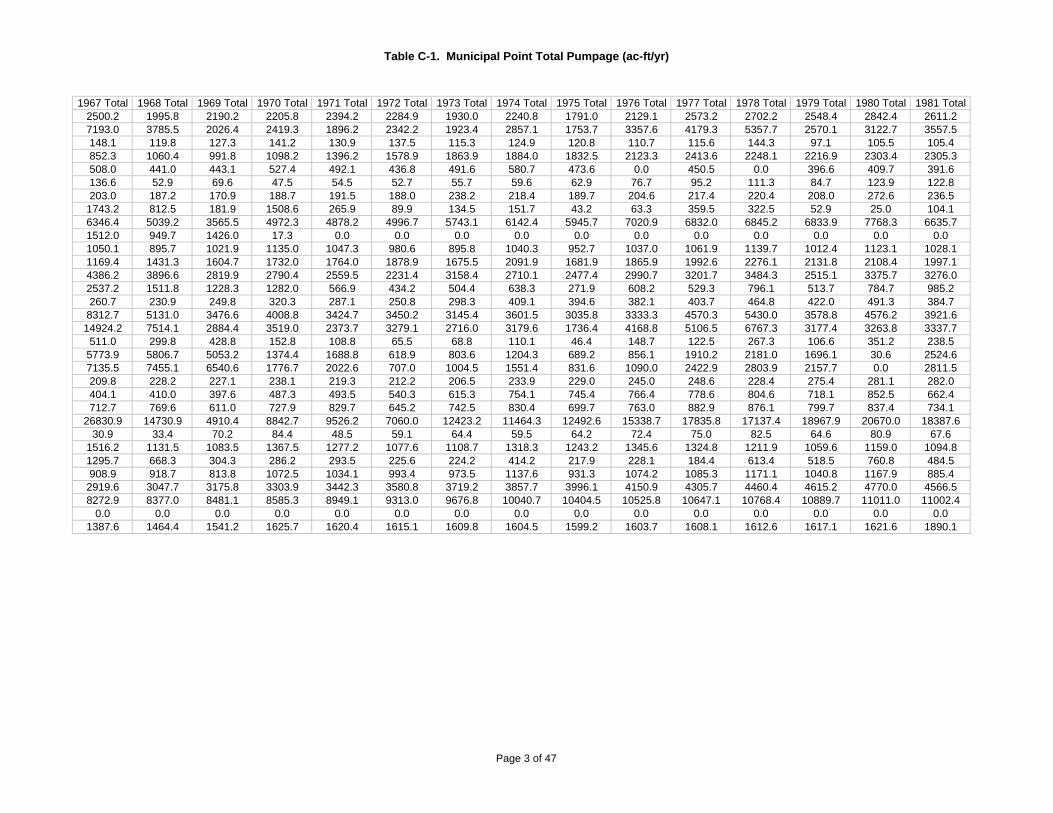
Table C-1. Municipal Point Total Pumpage (ac-ft/yr)
1967 Total 1968 Total 1969 Total 1970 Total 1971 Total 1972 Total 1973 Total 1974 Total 1975 Total 1976 Total 1977 Total 1978 Total 1979 Total 1980 Total 1981 Total2500.2 1995.8 2190.2 2205.8 2394.2 2284.9 1930.0 2240.8 1791.0 2129.1 2573.2 2702.2 2548.4 2842.4 2611.27193.0 3785.5 2026.4 2419.3 1896.2 2342.2 1923.4 2857.1 1753.7 3357.6 4179.3 5357.7 2570.1 3122.7 3557.5148.1 119.8 127.3 141.2 130.9 137.5 115.3 124.9 120.8 110.7 115.6 144.3 97.1 105.5 105.4852.3 1060.4 991.8 1098.2 1396.2 1578.9 1863.9 1884.0 1832.5 2123.3 2413.6 2248.1 2216.9 2303.4 2305.3508.0 441.0 443.1 527.4 492.1 436.8 491.6 580.7 473.6 0.0 450.5 0.0 396.6 409.7 391.6136.6 52.9 69.6 47.5 54.5 52.7 55.7 59.6 62.9 76.7 95.2 111.3 84.7 123.9 122.8203.0 187.2 170.9 188.7 191.5 188.0 238.2 218.4 189.7 204.6 217.4 220.4 208.0 272.6 236.5
1743.2 812.5 181.9 1508.6 265.9 89.9 134.5 151.7 43.2 63.3 359.5 322.5 52.9 25.0 104.16346.4 5039.2 3565.5 4972.3 4878.2 4996.7 5743.1 6142.4 5945.7 7020.9 6832.0 6845.2 6833.9 7768.3 6635.71512.0 949.7 1426.0 17.3 0.0 0.0 0.0 0.0 0.0 0.0 0.0 0.0 0.0 0.0 0.01050.1 895.7 1021.9 1135.0 1047.3 980.6 895.8 1040.3 952.7 1037.0 1061.9 1139.7 1012.4 1123.1 1028.11169.4 1431.3 1604.7 1732.0 1764.0 1878.9 1675.5 2091.9 1681.9 1865.9 1992.6 2276.1 2131.8 2108.4 1997.14386.2 3896.6 2819.9 2790.4 2559.5 2231.4 3158.4 2710.1 2477.4 2990.7 3201.7 3484.3 2515.1 3375.7 3276.02537.2 1511.8 1228.3 1282.0 566.9 434.2 504.4 638.3 271.9 608.2 529.3 796.1 513.7 784.7 985.2260.7 230.9 249.8 320.3 287.1 250.8 298.3 409.1 394.6 382.1 403.7 464.8 422.0 491.3 384.7
8312.7 5131.0 3476.6 4008.8 3424.7 3450.2 3145.4 3601.5 3035.8 3333.3 4570.3 5430.0 3578.8 4576.2 3921.614924.2 7514.1 2884.4 3519.0 2373.7 3279.1 2716.0 3179.6 1736.4 4168.8 5106.5 6767.3 3177.4 3263.8 3337.7511.0 299.8 428.8 152.8 108.8 65.5 68.8 110.1 46.4 148.7 122.5 267.3 106.6 351.2 238.5
5773.9 5806.7 5053.2 1374.4 1688.8 618.9 803.6 1204.3 689.2 856.1 1910.2 2181.0 1696.1 30.6 2524.67135.5 7455.1 6540.6 1776.7 2022.6 707.0 1004.5 1551.4 831.6 1090.0 2422.9 2803.9 2157.7 0.0 2811.5209.8 228.2 227.1 238.1 219.3 212.2 206.5 233.9 229.0 245.0 248.6 228.4 275.4 281.1 282.0404.1 410.0 397.6 487.3 493.5 540.3 615.3 754.1 745.4 766.4 778.6 804.6 718.1 852.5 662.4712.7 769.6 611.0 727.9 829.7 645.2 742.5 830.4 699.7 763.0 882.9 876.1 799.7 837.4 734.1
26830.9 14730.9 4910.4 8842.7 9526.2 7060.0 12423.2 11464.3 12492.6 15338.7 17835.8 17137.4 18967.9 20670.0 18387.630.9 33.4 70.2 84.4 48.5 59.1 64.4 59.5 64.2 72.4 75.0 82.5 64.6 80.9 67.6
1516.2 1131.5 1083.5 1367.5 1277.2 1077.6 1108.7 1318.3 1243.2 1345.6 1324.8 1211.9 1059.6 1159.0 1094.81295.7 668.3 304.3 286.2 293.5 225.6 224.2 414.2 217.9 228.1 184.4 613.4 518.5 760.8 484.5908.9 918.7 813.8 1072.5 1034.1 993.4 973.5 1137.6 931.3 1074.2 1085.3 1171.1 1040.8 1167.9 885.4
2919.6 3047.7 3175.8 3303.9 3442.3 3580.8 3719.2 3857.7 3996.1 4150.9 4305.7 4460.4 4615.2 4770.0 4566.58272.9 8377.0 8481.1 8585.3 8949.1 9313.0 9676.8 10040.7 10404.5 10525.8 10647.1 10768.4 10889.7 11011.0 11002.4
0.0 0.0 0.0 0.0 0.0 0.0 0.0 0.0 0.0 0.0 0.0 0.0 0.0 0.0 0.01387.6 1464.4 1541.2 1625.7 1620.4 1615.1 1609.8 1604.5 1599.2 1603.7 1608.1 1612.6 1617.1 1621.6 1890.1
Page 3 of 47

Table C-1. Municipal Point Total Pumpage (ac-ft/yr)
1982 Total 1983 Total 1984 Total 1985 Total 1986 Total 1987 Total 1988 Total 1989 Total 1990 Total 1991 Total 1992 Total 1993 Total 1994 Total 1995 Total 1996 Total2760.6 3246.1 2958.9 4049.5 4162.7 3732.7 3841.0 4505.5 4047.6 4195.2 3681.5 4106.8 4565.5 3066.1 3590.43699.9 5113.6 3011.2 2810.7 3231.3 4408.6 3989.4 4593.6 5169.2 3394.3 3175.0 3751.2 6034.1 7745.3 919.3103.3 116.2 8.6 0.8 0.0 0.0 0.0 0.0 0.0 0.0 0.0 0.0 0.0 0.0 30.0
2249.1 2284.0 2394.4 2118.7 2611.0 2662.4 2488.3 2631.4 2898.0 2724.7 2772.7 2966.9 2961.1 3035.5 2903.4500.5 542.5 569.4 524.2 523.3 507.5 536.9 568.2 642.4 571.1 453.5 633.0 547.6 607.8 551.0122.0 157.5 152.6 117.3 102.8 96.4 107.4 145.7 130.8 120.5 122.5 134.7 139.4 143.2 142.2222.9 300.3 338.4 245.8 245.4 219.2 238.3 262.6 240.0 241.2 171.4 192.1 220.7 215.3 231.398.9 244.6 162.3 117.9 52.2 57.5 380.9 304.7 443.2 189.0 81.7 274.4 283.8 163.6 543.4
5560.7 7511.1 7080.2 5970.7 5777.1 5964.0 5716.5 5728.6 6328.4 6097.5 5516.9 5902.7 6195.2 6155.9 6192.20.0 0.0 0.0 0.0 0.0 0.0 0.0 0.0 0.0 0.0 0.0 0.0 0.0 0.0 0.0
1031.8 1122.6 201.6 108.0 90.0 1.6 0.4 0.7 0.4 0.0 0.6 0.0 204.3 615.4 665.12087.6 2201.6 2247.3 2250.9 2022.7 1830.2 2122.1 2383.8 2249.8 2182.9 2002.3 2149.0 2459.1 2368.6 2226.23501.7 3942.9 3533.4 3201.4 3549.4 3411.9 3172.8 3978.6 4393.9 3947.4 3412.1 4085.2 4397.2 4108.2 3698.1964.5 953.1 887.7 741.5 425.5 657.5 494.3 606.4 709.7 583.5 469.7 653.0 720.6 903.6 760.8375.5 445.2 302.8 311.9 283.2 271.5 284.0 308.2 355.0 334.0 300.1 366.1 396.2 374.6 295.1
3732.1 4206.3 3485.2 3504.1 3172.9 3422.7 3799.8 3952.3 4192.3 3593.4 3284.0 3380.7 4508.5 5101.1 3084.93280.0 4514.0 2749.0 1546.5 1455.9 1541.9 1874.3 2050.4 2141.5 1637.3 1511.8 1819.0 2475.0 2839.1 1082.6178.9 175.1 629.2 202.2 227.4 119.2 143.9 241.7 228.7 246.1 219.2 264.3 281.7 281.2 235.3
3685.7 5467.7 5668.3 4746.0 3370.9 2417.1 2650.5 3455.0 2715.1 2874.4 2627.6 3185.5 3775.0 858.2 1332.54131.9 6155.5 6368.4 5348.2 3780.0 2727.6 3000.9 3909.3 3055.0 3196.6 2904.4 3593.9 4253.9 967.2 1495.9249.4 265.4 107.4 161.8 134.8 63.3 50.9 104.0 110.6 89.1 77.1 104.1 90.4 73.6 44.8661.1 717.9 558.5 637.1 634.7 597.7 619.0 722.5 751.4 658.7 574.2 681.7 701.6 738.7 618.0695.5 685.1 677.3 899.0 777.2 806.2 756.6 837.0 942.9 841.1 753.8 837.4 817.8 851.8 836.9
18702.9 24999.0 20507.1 20665.6 22548.5 24006.4 21889.7 19906.5 21630.9 22438.1 20168.8 20233.3 21375.1 21436.3 20799.060.8 59.0 54.4 50.5 61.8 82.7 50.2 56.6 60.9 66.0 49.5 49.7 48.8 58.4 52.0
1060.1 1055.3 310.2 99.3 30.7 32.7 22.0 26.3 26.9 32.4 16.9 27.2 152.6 616.4 739.2363.9 219.0 98.5 94.9 111.5 391.5 144.4 185.3 202.4 125.9 121.6 437.4 512.6 632.4 717.1946.2 906.2 1028.3 926.0 826.6 977.8 1289.2 1382.3 1575.4 1425.9 1313.5 1576.3 1743.9 1122.7 1136.2
4363.0 4159.5 3956.0 3752.5 3896.9 4041.3 4185.7 4330.1 4474.5 4571.6 4668.7 4765.9 4863.0 4960.1 4960.110993.8 10985.2 10976.6 10968.0 10906.2 10844.4 10782.6 10720.7 10658.9 10645.1 10631.3 10617.4 10603.6 10592.8 10592.8
0.0 0.0 0.0 0.0 0.0 0.0 0.0 0.0 5.3 5.4 5.6 5.8 6.0 6.2 6.22158.6 2427.2 2695.7 2964.2 2863.1 2762.0 2660.9 2559.7 2695.5 2851.4 3007.2 3163.1 3318.9 3483.6 3483.6
Page 4 of 47
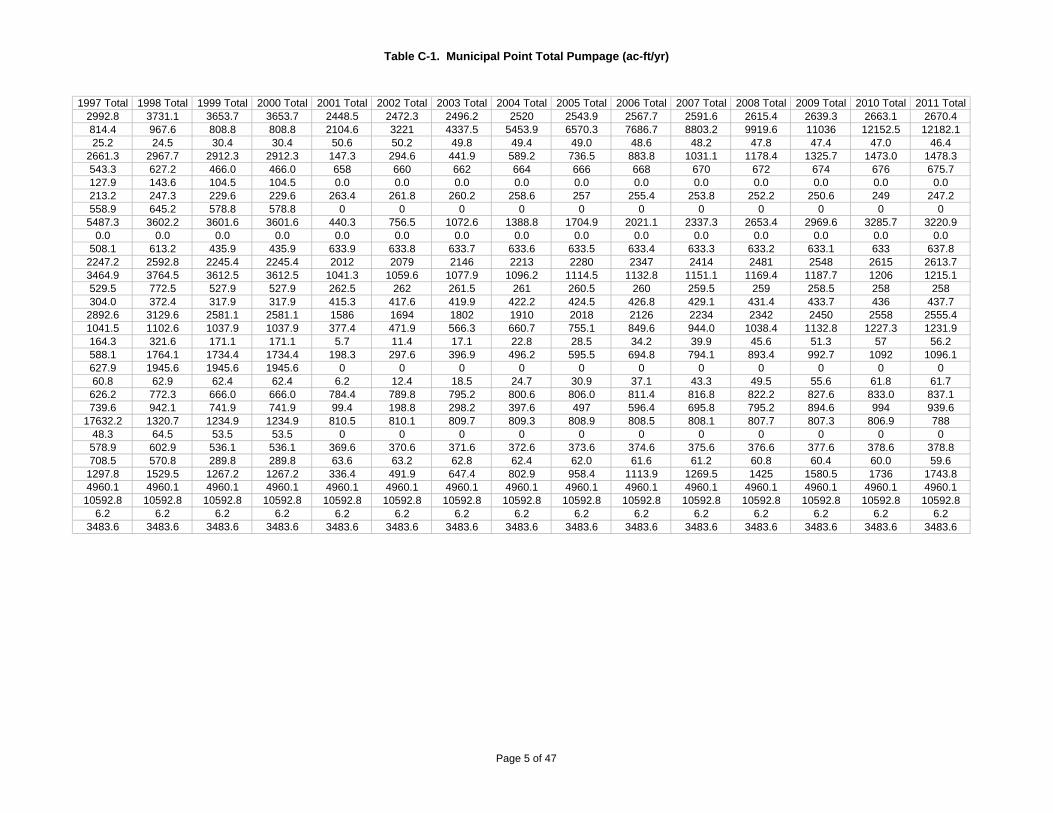
Table C-1. Municipal Point Total Pumpage (ac-ft/yr)
1997 Total 1998 Total 1999 Total 2000 Total 2001 Total 2002 Total 2003 Total 2004 Total 2005 Total 2006 Total 2007 Total 2008 Total 2009 Total 2010 Total 2011 Total2992.8 3731.1 3653.7 3653.7 2448.5 2472.3 2496.2 2520 2543.9 2567.7 2591.6 2615.4 2639.3 2663.1 2670.4814.4 967.6 808.8 808.8 2104.6 3221 4337.5 5453.9 6570.3 7686.7 8803.2 9919.6 11036 12152.5 12182.125.2 24.5 30.4 30.4 50.6 50.2 49.8 49.4 49.0 48.6 48.2 47.8 47.4 47.0 46.4
2661.3 2967.7 2912.3 2912.3 147.3 294.6 441.9 589.2 736.5 883.8 1031.1 1178.4 1325.7 1473.0 1478.3543.3 627.2 466.0 466.0 658 660 662 664 666 668 670 672 674 676 675.7127.9 143.6 104.5 104.5 0.0 0.0 0.0 0.0 0.0 0.0 0.0 0.0 0.0 0.0 0.0213.2 247.3 229.6 229.6 263.4 261.8 260.2 258.6 257 255.4 253.8 252.2 250.6 249 247.2558.9 645.2 578.8 578.8 0 0 0 0 0 0 0 0 0 0 0
5487.3 3602.2 3601.6 3601.6 440.3 756.5 1072.6 1388.8 1704.9 2021.1 2337.3 2653.4 2969.6 3285.7 3220.90.0 0.0 0.0 0.0 0.0 0.0 0.0 0.0 0.0 0.0 0.0 0.0 0.0 0.0 0.0
508.1 613.2 435.9 435.9 633.9 633.8 633.7 633.6 633.5 633.4 633.3 633.2 633.1 633 637.82247.2 2592.8 2245.4 2245.4 2012 2079 2146 2213 2280 2347 2414 2481 2548 2615 2613.73464.9 3764.5 3612.5 3612.5 1041.3 1059.6 1077.9 1096.2 1114.5 1132.8 1151.1 1169.4 1187.7 1206 1215.1529.5 772.5 527.9 527.9 262.5 262 261.5 261 260.5 260 259.5 259 258.5 258 258304.0 372.4 317.9 317.9 415.3 417.6 419.9 422.2 424.5 426.8 429.1 431.4 433.7 436 437.7
2892.6 3129.6 2581.1 2581.1 1586 1694 1802 1910 2018 2126 2234 2342 2450 2558 2555.41041.5 1102.6 1037.9 1037.9 377.4 471.9 566.3 660.7 755.1 849.6 944.0 1038.4 1132.8 1227.3 1231.9164.3 321.6 171.1 171.1 5.7 11.4 17.1 22.8 28.5 34.2 39.9 45.6 51.3 57 56.2588.1 1764.1 1734.4 1734.4 198.3 297.6 396.9 496.2 595.5 694.8 794.1 893.4 992.7 1092 1096.1627.9 1945.6 1945.6 1945.6 0 0 0 0 0 0 0 0 0 0 060.8 62.9 62.4 62.4 6.2 12.4 18.5 24.7 30.9 37.1 43.3 49.5 55.6 61.8 61.7626.2 772.3 666.0 666.0 784.4 789.8 795.2 800.6 806.0 811.4 816.8 822.2 827.6 833.0 837.1739.6 942.1 741.9 741.9 99.4 198.8 298.2 397.6 497 596.4 695.8 795.2 894.6 994 939.6
17632.2 1320.7 1234.9 1234.9 810.5 810.1 809.7 809.3 808.9 808.5 808.1 807.7 807.3 806.9 78848.3 64.5 53.5 53.5 0 0 0 0 0 0 0 0 0 0 0578.9 602.9 536.1 536.1 369.6 370.6 371.6 372.6 373.6 374.6 375.6 376.6 377.6 378.6 378.8708.5 570.8 289.8 289.8 63.6 63.2 62.8 62.4 62.0 61.6 61.2 60.8 60.4 60.0 59.6
1297.8 1529.5 1267.2 1267.2 336.4 491.9 647.4 802.9 958.4 1113.9 1269.5 1425 1580.5 1736 1743.84960.1 4960.1 4960.1 4960.1 4960.1 4960.1 4960.1 4960.1 4960.1 4960.1 4960.1 4960.1 4960.1 4960.1 4960.1
10592.8 10592.8 10592.8 10592.8 10592.8 10592.8 10592.8 10592.8 10592.8 10592.8 10592.8 10592.8 10592.8 10592.8 10592.86.2 6.2 6.2 6.2 6.2 6.2 6.2 6.2 6.2 6.2 6.2 6.2 6.2 6.2 6.2
3483.6 3483.6 3483.6 3483.6 3483.6 3483.6 3483.6 3483.6 3483.6 3483.6 3483.6 3483.6 3483.6 3483.6 3483.6
Page 5 of 47

Table C-1. Municipal Point Total Pumpage (ac-ft/yr)
2012 Total 2013 Total 2014 Total 2015 Total 2016 Total 2017 Total 2018 Total 2019 Total 2020 Total 2021 Total 2022 Total 2023 Total 2024 Total 2025 Total 2026 Total2677.7 2684.9 2692.2 2699.5 2706.7 2714 2721.3 2728.5 2735.8 2741.6 2747.5 2753.3 2759.1 2765 2770.812211.8 12241.5 12271.1 12300.8 12330.5 12360.1 12389.8 12419.5 12449.1 12508.4 12567.7 12627 12686.3 12745.6 12804.9
45.8 45.2 44.6 44.0 43.4 42.8 42.2 41.6 41.0 40.3 39.6 38.9 38.2 37.5 36.81483.6 1488.9 1494.2 1499.5 1504.8 1510.1 1515.4 1520.7 1526.0 1528.4 1530.8 1533.2 1535.6 1538.0 1540.4675.4 675.1 674.8 674.5 674.2 673.9 673.6 673.3 673 672.7 672.4 672.1 671.8 671.5 671.20.0 0.0 0.0 0.0 0.0 0.0 0.0 0.0 0.0 0.0 0.0 0.0 0.0 0.0 0.0
245.4 243.6 241.8 240 238.2 236.4 234.6 232.8 231 228.8 226.6 224.4 222.2 220 217.80 0 0 0 0 0 0 0 0 0 0 0 0 0 0
3156.1 3091.3 3026.5 2961.7 2896.9 2832.1 2767.3 2702.5 2637.7 2375.8 2113.9 1851.9 1590 1328.1 1066.10.0 0.0 0.0 0.0 0.0 0.0 0.0 0.0 0.0 0.0 0.0 0.0 0.0 0.0 0.0
642.6 647.4 652.2 657.1 661.9 666.7 671.5 676.3 681.1 674.7 668.2 661.8 655.3 648.9 642.52612.4 2611.1 2609.8 2608.5 2607.2 2605.9 2604.6 2603.3 2602 2602.1 2602.2 2602.3 2602.4 2602.5 2602.61224.2 1233.3 1242.4 1251.5 1260.6 1269.7 1278.8 1287.9 1297 1296.9 1296.8 1296.7 1296.6 1296.5 1296.4
258 258 258 258 258 258 258 258 258 257.5 257 256.5 256 255.5 255439.4 441.1 442.8 444.5 446.2 447.9 449.6 451.3 453 454 455 456 457 458 459
2552.8 2550.2 2547.6 2545 2542.4 2539.8 2537.2 2534.6 2532 2531.7 2531.4 2531.1 2530.8 2530.5 2530.21236.5 1241.2 1245.8 1250.5 1255.1 1259.8 1264.4 1269.0 1273.7 1285.4 1297.2 1309.0 1320.7 1332.5 1344.355.4 54.6 53.8 53 52.2 51.4 50.6 49.8 49 48.7 48.4 48.1 47.8 47.5 47.2
1100.2 1104.4 1108.5 1112.6 1116.8 1120.9 1125 1129.2 1133.3 1130.7 1128.1 1125.5 1122.9 1120.3 1117.70 0 0 0 0 0 0 0 0 0 0 0 0 0 0
61.6 61.5 61.5 61.4 61.3 61.2 61.1 61 60.9 60.9 60.9 60.9 60.9 60.9 60.9841.2 845.3 849.4 853.5 857.6 861.7 865.8 869.9 874.0 877.5 881.0 884.5 888.0 891.5 895.0885.2 830.9 776.5 722.1 667.7 613.3 559 504.6 450.2 405.2 360.2 315.1 270.1 225.1 180.1769 750 731 712 693 674 655.1 636.1 617.1 642.5 668 693.4 718.9 744.4 769.80 0 0 0 0 0 0 0 0 0 0 0 0 0 0
379 379.2 379.4 379.6 379.8 380 380.2 380.4 380.5 381.8 383 384.3 385.5 386.7 38859.2 58.8 58.4 58.0 57.6 57.2 56.8 56.4 56.0 55.6 55.2 54.8 54.4 54.0 53.6
1751.6 1759.4 1767.2 1775 1782.8 1790.6 1798.4 1806.2 1814 1826.1 1838.2 1850.3 1862.4 1874.5 1886.64960.1 4960.1 4960.1 4960.1 4960.1 4960.1 4960.1 4960.1 4960.1 4960.1 4960.1 4960.1 4960.1 4960.1 4960.110592.8 10592.8 10592.8 10592.8 10592.8 10592.8 10592.8 10592.8 10592.8 10592.8 10592.8 10592.8 10592.8 10592.8 10592.8
6.2 6.2 6.2 6.2 6.2 6.2 6.2 6.2 6.2 6.2 6.2 6.2 6.2 6.2 6.23483.6 3483.6 3483.6 3483.6 3483.6 3483.6 3483.6 3483.6 3483.6 3483.6 3483.6 3483.6 3483.6 3483.6 3483.6
Page 6 of 47

Table C-1. Municipal Point Total Pumpage (ac-ft/yr)
2027 Total 2028 Total 2029 Total 2030 Total 2031 Total 2032 Total 2033 Total 2034 Total 2035 Total 2036 Total 2037 Total 2038 Total 2039 Total 2040 Total 2041 Total2776.7 2782.5 2788.3 2794.2 2791.9 2789.6 2787.3 2785.1 2782.8 2780.5 2778.2 2775.9 2773.7 2771.4 2775.912864.2 12923.5 12982.8 13042.1 13073.1 13104.1 13135.1 13166.1 13197.1 13228.1 13259.1 13290.1 13321.1 13352.1 13423.1
36.1 35.4 34.7 34.0 33.4 32.8 32.2 31.6 31.0 30.4 29.8 29.2 28.6 28.0 27.71542.8 1545.2 1547.6 1550.0 1550.5 1551.0 1551.5 1552.0 1552.5 1553.0 1553.5 1554.0 1554.5 1555.0 1557.5670.9 670.6 670.3 670 669.3 668.6 667.9 667.2 666.5 665.8 665.1 664.4 663.7 663 6620.0 0.0 0.0 0.0 0.0 0.0 0.0 0.0 0.0 0.0 0.0 0.0 0.0 0.0 0.0
215.6 213.4 211.2 209 208.3 207.6 206.9 206.2 205.5 204.8 204.1 203.4 202.7 202 201.70 0 0 0 0 0 0 0 0 0 0 0 0 0 0
804.2 542.3 280.3 18.4 17.4 16.5 15.5 14.6 13.6 12.6 11.7 10.7 9.8 8.8 9.60.0 0.0 0.0 0.0 0.0 0.0 0.0 0.0 0.0 0.0 0.0 0.0 0.0 0.0 0.0636 629.6 623.1 616.7 610.2 603.8 597.4 591 584.6 578.1 571.7 565.3 558.9 552.4 548.5
2602.7 2602.8 2602.9 2603 2604.2 2605.4 2606.6 2607.8 2609 2610.2 2611.4 2612.6 2613.8 2615 2619.11296.3 1296.2 1296.1 1296 1295.8 1295.6 1295.4 1295.2 1295 1294.8 1294.6 1294.4 1294.2 1294 1296.3254.5 254 253.5 253 252 251 250 249 248 247 246 245 244 243 242.4460 461 462 463 463.2 463.4 463.6 463.8 464 464.2 464.4 464.6 464.8 465 465.8
2529.9 2529.6 2529.3 2529 2528.5 2528 2527.5 2527 2526.5 2526 2525.5 2525 2524.5 2524 2526.91356.0 1367.8 1379.5 1391.3 1393.9 1396.5 1399.1 1401.7 1404.3 1406.9 1409.5 1412.1 1414.7 1417.3 1421.946.9 46.6 46.3 46 45.7 45.4 45.1 44.8 44.5 44.2 43.9 43.6 43.3 43 42.9
1115.1 1112.5 1109.9 1107.3 1088.3 1069.4 1050.4 1031.5 1012.5 993.5 974.6 955.6 936.7 917.7 928.60 0 0 0 0 0 0 0 0 0 0 0 0 0 0
60.9 60.9 60.9 60.9 60.5 60.2 59.8 59.5 59.1 58.7 58.4 58 57.6 57.3 51.5898.5 902.0 905.5 909.0 913.1 917.2 921.3 925.4 929.5 933.6 937.7 941.8 945.9 950.0 955.3135.1 90 45 0 0 0 0 0 0 0 0 0 0 0 0795.3 820.7 846.2 871.6 861.4 851.1 840.9 830.7 820.4 810.2 799.9 789.7 779.4 769.2 754.6
0 0 0 0 0 0 0 0 0 0 0 0 0 0 0389.2 390.4 391.7 392.9 394.4 395.8 397.3 398.8 400.2 401.7 403.2 404.6 406.1 407.5 409.853.2 52.8 52.4 52.0 51.5 51.0 50.5 50.0 49.5 49.0 48.5 48.0 47.5 47.0 46.7
1898.7 1910.8 1922.9 1935 1944.5 1954 1963.5 1973 1982.5 1992 2001.5 2011 2020.5 2030 2042.84960.1 4960.1 4960.1 4960.1 4960.1 4960.1 4960.1 4960.1 4960.1 4960.1 4960.1 4960.1 4960.1 4960.1 4960.110592.8 10592.8 10592.8 10592.8 10592.8 10592.8 10592.8 10592.8 10592.8 10592.8 10592.8 10592.8 10592.8 10592.8 10592.8
6.2 6.2 6.2 6.2 6.2 6.2 6.2 6.2 6.2 6.2 6.2 6.2 6.2 6.2 6.23483.6 3483.6 3483.6 3483.6 3483.6 3483.6 3483.6 3483.6 3483.6 3483.6 3483.6 3483.6 3483.6 3483.6 3483.6
Page 7 of 47

Table C-1. Municipal Point Total Pumpage (ac-ft/yr)
2042 Total 2043 Total 2044 Total 2045 Total 2046 Total 2047 Total 2048 Total 2049 Total 2050 Total2780.5 2785.1 2789.6 2794.2 2798.8 2803.3 2807.9 2812.4 281713494 13565 13635.9 13706.9 13777.8 13848.8 13919.7 13990.7 14061.627.4 27.1 26.8 26.5 26.2 25.9 25.6 25.3 25.0
1560.0 1562.5 1565.0 1567.5 1570.0 1572.5 1575.0 1577.5 1580.0661 660 659 658 657 656 655 654 6530.0 0.0 0.0 0.0 0.0 0.0 0.0 0.0 0.0
201.4 201.1 200.8 200.5 200.2 199.9 199.6 199.3 1990 0 0 0 0 0 0 0 0
10.4 11.2 12 12.8 13.6 14.4 15.1 15.9 16.70.0 0.0 0.0 0.0 0.0 0.0 0.0 0.0 0.0
544.6 540.7 536.7 532.8 528.9 525 521 517.1 513.22623.2 2627.3 2631.4 2635.5 2639.6 2643.7 2647.8 2651.9 26561298.6 1300.9 1303.2 1305.5 1307.8 1310.1 1312.4 1314.7 1317241.8 241.2 240.6 240 239.4 238.8 238.2 237.6 237466.6 467.4 468.2 469 469.8 470.6 471.4 472.2 473
2529.8 2532.7 2535.6 2538.5 2541.4 2544.3 2547.2 2550.1 25531426.6 1431.3 1436.0 1440.7 1445.4 1450.1 1454.8 1459.4 1464.142.8 42.7 42.6 42.5 42.4 42.3 42.2 42.1 42939.4 950.3 961.1 972 982.8 993.7 1004.5 1015.4 1026.2
0 0 0 0 0 0 0 0 045.8 40.1 34.4 28.6 22.9 17.2 11.5 5.7 0960.6 965.9 971.2 976.5 981.8 987.1 992.4 997.7 1003.0
0 0 0 0 0 0 0 0 0740 725.4 710.8 696.2 681.6 667 652.4 637.8 623.20 0 0 0 0 0 0 0 0
412.1 414.4 416.7 419 421.2 423.5 425.8 428.1 430.446.4 46.1 45.8 45.5 45.2 44.9 44.6 44.3 44.0
2055.6 2068.4 2081.2 2094 2106.8 2119.6 2132.4 2145.2 21584960.1 4960.1 4960.1 4960.1 4960.1 4960.1 4960.1 4960.1 4960.110592.8 10592.8 10592.8 10592.8 10592.8 10592.8 10592.8 10592.8 10592.8
6.2 6.2 6.2 6.2 6.2 6.2 6.2 6.2 6.23483.6 3483.6 3483.6 3483.6 3483.6 3483.6 3483.6 3483.6 3483.6
Page 8 of 47

Table C-1. County Other Total Pumpage (ac-ft/yr)
County Basin Total 1940 Total 1941 Total 1942 Total 1943 Total 1944 Total 1945 Total 1946 Total 1947 Total 1948 Total 1949 Total 1950 Total 1951ANDREWS COLORADO 2.2 2.6 3.2 4.0 5.2 6.9 9.2 12.6 17.2 23.8 33.2 39.7BAILEY BRAZOS 220.5 329.0 335.8 342.7 349.8 357.0 364.3 371.8 379.5 387.3 395.3 403.2BORDEN BRAZOS 0.7 0.7 0.6 0.6 0.6 0.6 0.6 0.6 0.6 0.6 0.6 0.6BORDEN COLORADO 0.5 0.5 0.5 0.5 0.6 0.6 0.6 0.6 0.6 0.6 0.6 0.6BRISCOE RED 215.1 270.7 267.2 263.8 260.4 257.1 253.8 250.5 247.3 244.2 241.1 241.4CASTRO BRAZOS 0.5 0.5 0.5 0.5 0.5 0.5 0.6 0.6 0.6 0.6 0.6 0.6CASTRO RED 0.6 0.7 0.7 0.7 0.7 0.7 0.7 0.7 0.7 0.8 0.8 0.8COCHRAN BRAZOS 129.1 137.2 145.7 154.7 164.3 174.6 185.4 196.9 209.2 222.2 236.0 238.0COCHRAN COLORADO 14.4 15.3 16.3 17.3 18.3 19.5 20.7 22.0 23.4 24.8 26.4 26.6CROSBY BRAZOS 402.6 436.4 434.4 432.4 430.4 428.5 426.5 424.6 422.6 420.7 418.7 422.1CROSBY RED 0.4 0.4 0.4 0.4 0.4 0.4 0.4 0.4 0.4 0.4 0.4 0.4CURRY 20.7 20.6 20.6 20.6 20.5 20.5 20.5 20.4 20.4 20.4 20.3 21.7DAWSON BRAZOS 114.0 113.4 112.9 112.3 111.7 111.2 110.7 110.2 109.7 109.2 108.7 108.6DAWSON COLORADO 82.7 483.1 495.2 507.5 520.2 533.1 546.4 560.1 574.0 588.3 603.0 603.2DEAFSMITH RED 1.2 1.3 1.3 1.3 1.3 1.3 1.4 1.4 1.4 1.4 1.5 1.5FLOYD BRAZOS 451.3 488.9 488.4 487.8 487.3 486.7 486.1 485.6 485.0 484.5 483.9 492.5FLOYD RED 53.2 53.1 53.0 53.0 52.9 52.8 52.7 52.7 52.6 52.5 52.5 53.4GAINES COLORADO 125.9 376.8 380.0 383.3 386.6 389.9 393.2 396.7 400.1 403.6 407.1 423.7GARZA BRAZOS 0.3 0.3 0.3 0.3 0.3 0.3 0.3 0.3 0.3 0.3 0.2 0.2HALE BRAZOS 493.3 681.9 717.7 755.5 795.2 837.0 880.9 927.2 976.0 1,027.3 1,081.3 1,115.2HALE RED 0.3 0.3 0.3 0.3 0.4 0.4 0.4 0.4 0.4 0.4 0.5 0.5HOCKLEY BRAZOS 279.2 297.4 316.9 337.6 359.7 383.3 408.4 435.2 463.8 494.3 526.8 532.6HOCKLEY COLORADO 25.2 26.9 28.6 30.4 32.4 34.5 36.7 39.0 41.6 44.2 47.1 47.5HOWARD COLORADO 1.5 1.5 1.5 1.5 1.5 1.5 1.5 1.5 1.5 1.5 1.5 1.4LAMB BRAZOS 480.1 486.8 493.6 500.4 507.4 514.5 521.6 528.9 536.2 543.7 551.3 556.5LEA 0.3 0.3 0.3 0.3 0.3 0.4 0.4 0.4 0.4 0.4 0.4 0.4LUBBOCK BRAZOS 506.2 555.1 609.0 668.6 734.3 806.8 886.9 975.3 1,072.9 1,180.6 1,299.6 1,372.1LYNN BRAZOS 410.5 614.0 609.7 605.5 601.3 597.2 593.2 589.3 585.4 581.6 577.9 577.7LYNN COLORADO 5.2 5.2 5.2 5.1 5.1 5.1 5.0 5.0 4.9 4.9 4.9 4.9MARTIN COLORADO 307.7 464.8 464.6 464.5 464.4 464.3 464.2 464.1 464.0 463.9 463.8 459.9MIDLAND COLORADO 1.0 1.0 1.0 1.0 1.0 1.0 1.0 1.0 1.0 1.0 1.1 1.0OLDHAM CANADIAN 172.2 175.8 179.6 183.4 187.2 191.2 195.2 199.4 203.6 207.9 212.3 215.6OLDHAM RED 2.7 2.7 2.8 2.8 2.9 3.0 3.0 3.1 3.2 3.2 3.3 3.3PARMER BRAZOS 73.8 106.1 106.0 105.9 105.8 105.7 105.7 105.6 105.5 105.4 105.3 112.5PARMER RED 62.4 114.6 114.4 114.2 114.0 113.8 113.6 113.4 113.2 113.0 112.8 120.7POTTER CANADIAN 0.0 0.0 0.0 0.0 0.0 0.0 0.0 0.0 0.0 0.0 0.0 0.0
Page 9 of 47

Table C-1. County Other Total Pumpage (ac-ft/yr)
Total 1952 Total 1953 Total 1954 Total 1955 Total 1956 Total 1957 Total 1958 Total 1959 Total 1960 Total 1961 Total 1962 Total 1963 Total 1964 Total 1965 Total 196647.5 56.9 68.3 81.9 98.3 118.0 141.7 170.2 204.6 200.0 195.6 191.2 187.0 182.8 178.7
411.4 419.6 428.1 436.7 445.5 454.5 463.6 472.9 482.5 479.3 476.1 473.0 469.9 466.8 463.70.6 0.6 0.6 0.6 0.6 0.6 0.6 0.6 0.6 0.6 0.6 0.6 0.6 0.6 0.50.6 0.6 0.6 0.6 0.6 0.6 0.6 0.6 0.6 0.6 0.6 0.6 0.6 0.6 0.6
241.7 242.1 242.5 242.8 243.2 243.5 243.9 244.2 244.6 239.3 234.2 229.2 224.3 219.5 214.80.6 0.7 0.7 0.7 0.7 0.7 0.7 0.8 0.8 0.8 0.8 0.8 0.8 0.8 0.80.8 0.9 0.9 0.9 1.0 1.0 1.1 1.1 1.2 1.2 1.2 1.2 1.2 1.2 1.2
240.0 242.0 244.0 246.0 248.1 250.2 252.3 254.4 256.5 252.3 248.1 243.9 239.9 235.9 231.926.8 27.0 27.3 27.5 27.7 28.0 28.2 28.5 28.7 28.2 27.8 27.3 26.9 26.4 26.0
425.5 429.0 432.4 435.9 439.4 443.0 446.6 450.2 453.8 448.4 443.0 437.6 432.3 427.1 422.00.4 0.4 0.4 0.4 0.4 0.4 0.4 0.5 0.5 0.5 0.4 0.4 0.4 0.4 0.4
23.3 24.9 26.6 28.5 30.5 32.6 34.9 37.4 40.0 40.4 40.8 41.2 41.6 42.0 42.4108.5 108.4 108.3 108.2 108.1 108.0 107.9 107.8 107.7 106.0 104.3 102.6 101.0 99.4 97.8603.5 603.7 603.9 604.2 604.4 604.6 604.9 605.1 605.3 597.3 589.4 581.5 573.8 566.2 558.7
1.5 1.6 1.6 1.7 1.7 1.7 1.8 1.8 1.9 1.9 1.9 2.0 2.0 2.0 2.1501.2 510.1 519.2 528.4 537.7 547.3 557.0 566.8 576.9 570.8 564.7 558.7 552.8 547.0 541.254.3 55.2 56.2 57.2 58.2 59.2 60.2 61.3 62.3 61.7 61.0 60.3 59.7 59.0 58.4
441.0 459.0 477.9 497.5 518.0 539.4 561.7 585.1 609.4 606.0 602.6 599.2 595.9 592.5 589.20.2 0.3 0.3 0.3 0.3 0.3 0.3 0.3 0.3 0.3 0.2 0.2 0.2 0.2 0.2
1,150.2 1,186.3 1,223.6 1,262.0 1,301.6 1,342.5 1,384.6 1,428.1 1,472.9 1,462.3 1,451.8 1,441.4 1,431.1 1,420.8 1,410.60.5 0.5 0.5 0.5 0.6 0.6 0.6 0.6 0.6 0.6 0.6 0.6 0.6 0.6 0.6
538.6 544.6 550.8 557.1 563.5 570.1 576.7 583.5 590.4 586.0 581.7 577.3 573.1 568.9 564.748.0 48.5 48.9 49.4 49.9 50.4 50.8 51.3 51.8 51.4 50.9 50.5 50.1 49.6 49.21.4 1.4 1.4 1.4 1.4 1.4 1.4 1.3 1.3 1.3 1.3 1.3 1.3 1.3 1.3
561.9 567.2 572.6 578.1 583.6 589.2 594.9 600.5 606.3 595.1 584.1 573.4 562.8 552.4 542.20.4 0.4 0.4 0.5 0.5 0.5 0.5 0.5 0.6 0.6 0.6 0.6 0.6 0.6 0.5
1,448.8 1,530.0 1,615.7 1,706.3 1,802.1 1,903.4 2,010.5 2,123.7 2,243.4 2,274.7 2,306.5 2,338.7 2,371.5 2,404.8 2,438.6577.5 577.4 577.2 577.1 577.0 577.0 576.9 576.9 577.0 568.0 559.1 550.4 541.8 533.3 525.0
4.9 4.9 4.9 4.9 4.9 4.9 4.9 4.9 4.9 4.8 4.7 4.6 4.6 4.5 4.4456.0 452.2 448.4 444.6 440.8 437.1 433.5 429.8 426.2 423.8 421.3 418.9 416.4 414.0 411.6
1.0 1.0 1.0 1.1 1.1 1.1 1.1 1.1 1.1 1.1 1.1 1.1 1.1 1.1 1.1218.9 222.4 225.8 229.3 232.9 236.5 240.2 243.9 247.7 252.0 256.4 260.9 265.4 270.0 274.8
3.4 3.4 3.5 3.6 3.6 3.7 3.7 3.8 3.8 3.9 4.0 4.0 4.1 4.2 4.3120.1 128.3 137.1 146.5 156.5 167.2 178.7 191.0 204.1 206.0 208.0 209.9 211.9 213.8 215.8129.2 138.3 148.0 158.4 169.5 181.4 194.1 207.7 222.3 224.5 226.7 228.9 231.1 233.4 235.6
0.0 0.0 0.0 0.0 0.0 0.0 0.0 0.0 0.0 0.0 0.0 0.0 0.0 0.0 0.0
Page 10 of 47
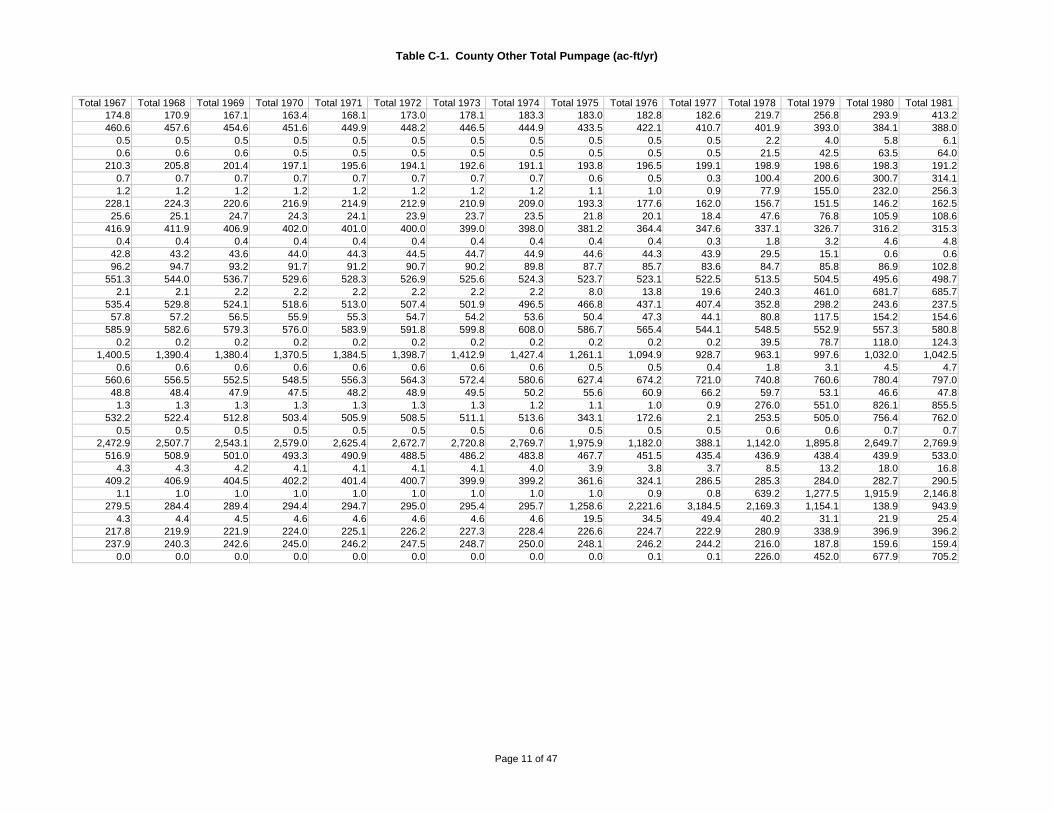
Table C-1. County Other Total Pumpage (ac-ft/yr)
Total 1967 Total 1968 Total 1969 Total 1970 Total 1971 Total 1972 Total 1973 Total 1974 Total 1975 Total 1976 Total 1977 Total 1978 Total 1979 Total 1980 Total 1981174.8 170.9 167.1 163.4 168.1 173.0 178.1 183.3 183.0 182.8 182.6 219.7 256.8 293.9 413.2460.6 457.6 454.6 451.6 449.9 448.2 446.5 444.9 433.5 422.1 410.7 401.9 393.0 384.1 388.0
0.5 0.5 0.5 0.5 0.5 0.5 0.5 0.5 0.5 0.5 0.5 2.2 4.0 5.8 6.10.6 0.6 0.6 0.5 0.5 0.5 0.5 0.5 0.5 0.5 0.5 21.5 42.5 63.5 64.0
210.3 205.8 201.4 197.1 195.6 194.1 192.6 191.1 193.8 196.5 199.1 198.9 198.6 198.3 191.20.7 0.7 0.7 0.7 0.7 0.7 0.7 0.7 0.6 0.5 0.3 100.4 200.6 300.7 314.11.2 1.2 1.2 1.2 1.2 1.2 1.2 1.2 1.1 1.0 0.9 77.9 155.0 232.0 256.3
228.1 224.3 220.6 216.9 214.9 212.9 210.9 209.0 193.3 177.6 162.0 156.7 151.5 146.2 162.525.6 25.1 24.7 24.3 24.1 23.9 23.7 23.5 21.8 20.1 18.4 47.6 76.8 105.9 108.6
416.9 411.9 406.9 402.0 401.0 400.0 399.0 398.0 381.2 364.4 347.6 337.1 326.7 316.2 315.30.4 0.4 0.4 0.4 0.4 0.4 0.4 0.4 0.4 0.4 0.3 1.8 3.2 4.6 4.8
42.8 43.2 43.6 44.0 44.3 44.5 44.7 44.9 44.6 44.3 43.9 29.5 15.1 0.6 0.696.2 94.7 93.2 91.7 91.2 90.7 90.2 89.8 87.7 85.7 83.6 84.7 85.8 86.9 102.8
551.3 544.0 536.7 529.6 528.3 526.9 525.6 524.3 523.7 523.1 522.5 513.5 504.5 495.6 498.72.1 2.1 2.2 2.2 2.2 2.2 2.2 2.2 8.0 13.8 19.6 240.3 461.0 681.7 685.7
535.4 529.8 524.1 518.6 513.0 507.4 501.9 496.5 466.8 437.1 407.4 352.8 298.2 243.6 237.557.8 57.2 56.5 55.9 55.3 54.7 54.2 53.6 50.4 47.3 44.1 80.8 117.5 154.2 154.6
585.9 582.6 579.3 576.0 583.9 591.8 599.8 608.0 586.7 565.4 544.1 548.5 552.9 557.3 580.80.2 0.2 0.2 0.2 0.2 0.2 0.2 0.2 0.2 0.2 0.2 39.5 78.7 118.0 124.3
1,400.5 1,390.4 1,380.4 1,370.5 1,384.5 1,398.7 1,412.9 1,427.4 1,261.1 1,094.9 928.7 963.1 997.6 1,032.0 1,042.50.6 0.6 0.6 0.6 0.6 0.6 0.6 0.6 0.5 0.5 0.4 1.8 3.1 4.5 4.7
560.6 556.5 552.5 548.5 556.3 564.3 572.4 580.6 627.4 674.2 721.0 740.8 760.6 780.4 797.048.8 48.4 47.9 47.5 48.2 48.9 49.5 50.2 55.6 60.9 66.2 59.7 53.1 46.6 47.81.3 1.3 1.3 1.3 1.3 1.3 1.3 1.2 1.1 1.0 0.9 276.0 551.0 826.1 855.5
532.2 522.4 512.8 503.4 505.9 508.5 511.1 513.6 343.1 172.6 2.1 253.5 505.0 756.4 762.00.5 0.5 0.5 0.5 0.5 0.5 0.5 0.6 0.5 0.5 0.5 0.6 0.6 0.7 0.7
2,472.9 2,507.7 2,543.1 2,579.0 2,625.4 2,672.7 2,720.8 2,769.7 1,975.9 1,182.0 388.1 1,142.0 1,895.8 2,649.7 2,769.9516.9 508.9 501.0 493.3 490.9 488.5 486.2 483.8 467.7 451.5 435.4 436.9 438.4 439.9 533.0
4.3 4.3 4.2 4.1 4.1 4.1 4.1 4.0 3.9 3.8 3.7 8.5 13.2 18.0 16.8409.2 406.9 404.5 402.2 401.4 400.7 399.9 399.2 361.6 324.1 286.5 285.3 284.0 282.7 290.5
1.1 1.0 1.0 1.0 1.0 1.0 1.0 1.0 1.0 0.9 0.8 639.2 1,277.5 1,915.9 2,146.8279.5 284.4 289.4 294.4 294.7 295.0 295.4 295.7 1,258.6 2,221.6 3,184.5 2,169.3 1,154.1 138.9 943.9
4.3 4.4 4.5 4.6 4.6 4.6 4.6 4.6 19.5 34.5 49.4 40.2 31.1 21.9 25.4217.8 219.9 221.9 224.0 225.1 226.2 227.3 228.4 226.6 224.7 222.9 280.9 338.9 396.9 396.2237.9 240.3 242.6 245.0 246.2 247.5 248.7 250.0 248.1 246.2 244.2 216.0 187.8 159.6 159.4
0.0 0.0 0.0 0.0 0.0 0.0 0.0 0.0 0.0 0.1 0.1 226.0 452.0 677.9 705.2
Page 11 of 47

Table C-1. County Other Total Pumpage (ac-ft/yr)
Total 1982 Total 1983 Total 1984 Total 1985 Total 1986 Total 1987 Total 1988 Total 1989 Total 1990 Total 1991 Total 1992 Total 1993 Total 1994 Total 1995 Total 1996532.5 651.8 771.1 735.0 622.7 590.6 534.5 594.8 634.8 715.9 699.9 718.0 756.5 790.9 885.0392.0 395.9 399.8 405.7 430.2 424.4 388.1 336.0 345.9 322.4 318.3 325.0 320.3 321.4 311.3
6.4 6.8 7.1 6.7 6.6 6.6 6.5 5.5 5.5 7.0 6.9 6.8 6.6 11.1 10.264.5 65.1 65.6 70.6 61.4 69.7 60.5 52.9 55.3 64.5 61.8 60.2 53.9 52.0 50.2
184.1 176.9 169.8 175.8 220.9 219.0 259.1 184.3 187.4 181.0 169.2 182.9 181.9 182.9 157.6327.6 341.0 354.5 346.1 340.4 370.8 364.3 299.2 266.8 252.7 288.9 288.3 279.6 270.2 261.8280.6 304.8 329.1 313.8 254.4 255.4 264.5 221.2 218.9 210.1 196.6 211.4 208.2 207.4 226.2178.8 195.1 211.4 179.6 160.5 163.5 138.1 168.5 180.3 172.0 173.8 164.1 172.2 198.6 194.8111.3 114.0 116.6 119.5 115.6 115.6 101.2 122.3 119.5 123.3 122.5 119.4 126.1 102.1 103.8314.4 313.6 312.7 282.3 251.1 250.8 261.7 219.5 219.4 232.0 219.7 218.4 217.8 227.5 230.0
4.9 5.1 5.2 4.6 4.6 4.6 4.6 3.9 3.3 5.0 5.0 4.4 4.3 2.9 2.90.6 0.6 0.6 0.6 0.6 0.6 0.8 0.7 0.7 18.1 14.2 14.7 14.8 14.9 14.9
118.8 134.8 150.7 86.5 91.3 71.5 72.7 65.5 61.7 25.2 24.6 28.3 27.1 37.7 36.8501.8 504.9 508.0 506.6 523.1 488.6 472.3 422.8 404.9 384.3 393.4 497.1 424.4 432.4 451.6689.7 693.7 697.7 700.6 693.0 662.6 622.7 557.2 556.6 548.7 546.9 546.1 544.1 562.4 575.4231.3 225.2 219.1 211.0 174.0 168.2 189.0 156.1 151.0 150.1 150.9 152.0 154.9 162.8 166.2155.0 155.3 155.7 150.8 128.7 129.5 137.1 118.4 113.1 109.1 106.1 107.0 107.0 117.3 118.1604.4 627.9 651.4 638.3 628.4 633.3 653.0 717.1 726.0 704.2 694.2 717.9 753.3 739.6 768.2130.7 137.0 143.3 140.7 136.4 132.1 122.7 135.5 132.9 139.6 146.7 148.5 142.2 125.4 124.5
1,053.0 1,063.5 1,074.0 1,073.0 1,015.8 1,095.8 998.7 870.0 855.7 866.0 847.1 892.6 919.1 1,203.0 989.84.9 5.1 5.3 5.3 5.2 5.3 5.2 4.5 4.5 2.8 2.8 2.8 2.8 0.5 0.4
813.7 830.4 847.0 827.2 723.6 763.2 694.9 750.2 724.6 797.9 792.1 843.0 842.0 836.6 887.349.0 50.3 51.5 56.4 53.5 50.5 49.6 53.4 53.4 46.4 47.2 47.4 47.4 29.7 29.0
885.0 914.5 943.9 902.1 773.8 687.2 689.9 689.1 674.3 789.7 756.7 808.6 820.9 821.5 874.3767.6 773.2 778.8 777.8 785.7 699.3 700.3 625.8 591.8 628.2 605.9 621.9 619.7 629.3 651.4
0.8 0.8 0.8 0.8 0.8 0.8 0.8 0.9 0.9 8.6 8.4 8.5 8.8 8.5 8.72,890.2 3,010.4 3,130.6 2,776.7 3,004.8 3,005.8 2,682.8 2,724.1 2,903.0 2,765.7 2,943.3 2,969.3 3,050.4 3,500.9 3,937.3
626.0 719.1 812.2 435.6 458.2 336.2 357.4 330.0 314.4 348.3 335.6 345.5 355.6 364.5 365.015.5 14.3 13.0 12.1 11.4 12.8 12.1 8.4 6.9 9.0 11.5 12.4 12.4 10.7 10.7
298.2 306.0 313.7 317.5 302.7 294.1 302.5 299.7 296.8 280.1 286.0 322.1 316.8 321.6 317.62,377.6 2,608.5 2,839.3 2,834.3 2,132.5 1,598.1 2,124.3 2,645.4 2,694.2 2,472.6 2,686.7 2,703.1 2,646.4 2,712.2 2,770.11,748.9 2,553.9 3,358.9 3,342.2 2,339.9 2,166.0 2,460.9 2,444.0 2,439.9 1,853.5 595.9 530.6 454.3 416.2 410.0
28.8 32.3 35.7 41.9 38.8 38.6 41.7 43.7 41.6 570.8 212.8 194.1 172.4 166.7 164.9395.6 394.9 394.3 399.3 391.6 396.7 477.8 438.1 474.9 457.2 355.0 365.7 369.3 371.0 370.8159.1 158.9 158.7 185.5 172.6 183.5 151.7 137.7 137.8 132.0 132.7 132.7 131.8 123.9 123.9732.5 759.8 787.0 900.0 785.1 919.4 801.5 801.0 859.4 773.7 832.6 828.5 908.9 1,037.5 1,074.2
Page 12 of 47
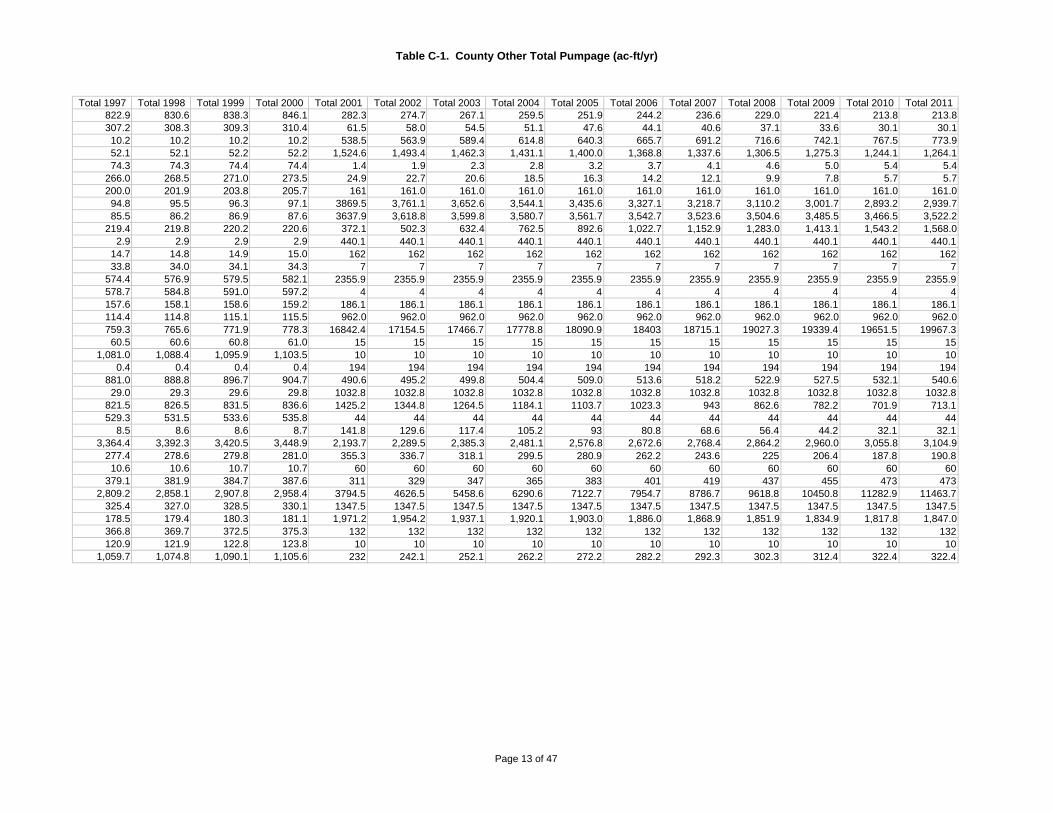
Table C-1. County Other Total Pumpage (ac-ft/yr)
Total 1997 Total 1998 Total 1999 Total 2000 Total 2001 Total 2002 Total 2003 Total 2004 Total 2005 Total 2006 Total 2007 Total 2008 Total 2009 Total 2010 Total 2011822.9 830.6 838.3 846.1 282.3 274.7 267.1 259.5 251.9 244.2 236.6 229.0 221.4 213.8 213.8307.2 308.3 309.3 310.4 61.5 58.0 54.5 51.1 47.6 44.1 40.6 37.1 33.6 30.1 30.110.2 10.2 10.2 10.2 538.5 563.9 589.4 614.8 640.3 665.7 691.2 716.6 742.1 767.5 773.952.1 52.1 52.2 52.2 1,524.6 1,493.4 1,462.3 1,431.1 1,400.0 1,368.8 1,337.6 1,306.5 1,275.3 1,244.1 1,264.174.3 74.3 74.4 74.4 1.4 1.9 2.3 2.8 3.2 3.7 4.1 4.6 5.0 5.4 5.4
266.0 268.5 271.0 273.5 24.9 22.7 20.6 18.5 16.3 14.2 12.1 9.9 7.8 5.7 5.7200.0 201.9 203.8 205.7 161 161.0 161.0 161.0 161.0 161.0 161.0 161.0 161.0 161.0 161.094.8 95.5 96.3 97.1 3869.5 3,761.1 3,652.6 3,544.1 3,435.6 3,327.1 3,218.7 3,110.2 3,001.7 2,893.2 2,939.785.5 86.2 86.9 87.6 3637.9 3,618.8 3,599.8 3,580.7 3,561.7 3,542.7 3,523.6 3,504.6 3,485.5 3,466.5 3,522.2
219.4 219.8 220.2 220.6 372.1 502.3 632.4 762.5 892.6 1,022.7 1,152.9 1,283.0 1,413.1 1,543.2 1,568.02.9 2.9 2.9 2.9 440.1 440.1 440.1 440.1 440.1 440.1 440.1 440.1 440.1 440.1 440.1
14.7 14.8 14.9 15.0 162 162 162 162 162 162 162 162 162 162 16233.8 34.0 34.1 34.3 7 7 7 7 7 7 7 7 7 7 7
574.4 576.9 579.5 582.1 2355.9 2355.9 2355.9 2355.9 2355.9 2355.9 2355.9 2355.9 2355.9 2355.9 2355.9578.7 584.8 591.0 597.2 4 4 4 4 4 4 4 4 4 4 4157.6 158.1 158.6 159.2 186.1 186.1 186.1 186.1 186.1 186.1 186.1 186.1 186.1 186.1 186.1114.4 114.8 115.1 115.5 962.0 962.0 962.0 962.0 962.0 962.0 962.0 962.0 962.0 962.0 962.0759.3 765.6 771.9 778.3 16842.4 17154.5 17466.7 17778.8 18090.9 18403 18715.1 19027.3 19339.4 19651.5 19967.360.5 60.6 60.8 61.0 15 15 15 15 15 15 15 15 15 15 15
1,081.0 1,088.4 1,095.9 1,103.5 10 10 10 10 10 10 10 10 10 10 100.4 0.4 0.4 0.4 194 194 194 194 194 194 194 194 194 194 194
881.0 888.8 896.7 904.7 490.6 495.2 499.8 504.4 509.0 513.6 518.2 522.9 527.5 532.1 540.629.0 29.3 29.6 29.8 1032.8 1032.8 1032.8 1032.8 1032.8 1032.8 1032.8 1032.8 1032.8 1032.8 1032.8
821.5 826.5 831.5 836.6 1425.2 1344.8 1264.5 1184.1 1103.7 1023.3 943 862.6 782.2 701.9 713.1529.3 531.5 533.6 535.8 44 44 44 44 44 44 44 44 44 44 44
8.5 8.6 8.6 8.7 141.8 129.6 117.4 105.2 93 80.8 68.6 56.4 44.2 32.1 32.13,364.4 3,392.3 3,420.5 3,448.9 2,193.7 2,289.5 2,385.3 2,481.1 2,576.8 2,672.6 2,768.4 2,864.2 2,960.0 3,055.8 3,104.9
277.4 278.6 279.8 281.0 355.3 336.7 318.1 299.5 280.9 262.2 243.6 225 206.4 187.8 190.810.6 10.6 10.7 10.7 60 60 60 60 60 60 60 60 60 60 60
379.1 381.9 384.7 387.6 311 329 347 365 383 401 419 437 455 473 4732,809.2 2,858.1 2,907.8 2,958.4 3794.5 4626.5 5458.6 6290.6 7122.7 7954.7 8786.7 9618.8 10450.8 11282.9 11463.7
325.4 327.0 328.5 330.1 1347.5 1347.5 1347.5 1347.5 1347.5 1347.5 1347.5 1347.5 1347.5 1347.5 1347.5178.5 179.4 180.3 181.1 1,971.2 1,954.2 1,937.1 1,920.1 1,903.0 1,886.0 1,868.9 1,851.9 1,834.9 1,817.8 1,847.0366.8 369.7 372.5 375.3 132 132 132 132 132 132 132 132 132 132 132120.9 121.9 122.8 123.8 10 10 10 10 10 10 10 10 10 10 10
1,059.7 1,074.8 1,090.1 1,105.6 232 242.1 252.1 262.2 272.2 282.2 292.3 302.3 312.4 322.4 322.4
Page 13 of 47

Table C-1. County Other Total Pumpage (ac-ft/yr)
Total 2012 Total 2013 Total 2014 Total 2015 Total 2016 Total 2017 Total 2018 Total 2019 Total 2020 Total 2021 Total 2022 Total 2023 Total 2024 Total 2025 Total 2026213.8 213.8 213.8 213.8 213.8 213.8 213.8 213.8 213.8 213.8 213.8 213.8 213.8 213.8 213.830.1 30.1 30.1 30.1 30.1 30.1 30.1 30.1 30.1 30.1 30.1 30.1 30.1 30.1 30.1
780.2 786.5 792.9 799.2 805.5 811.9 818.2 824.5 830.9 837.3 843.7 850.1 856.5 862.9 869.31,284.0 1,303.9 1,323.8 1,343.7 1,363.6 1,383.5 1,403.4 1,423.4 1,443.3 1,458.3 1,473.4 1,488.5 1,503.6 1,518.6 1,533.7
5.4 5.4 5.4 5.4 5.4 5.4 5.4 5.4 5.4 5.4 5.4 5.4 5.4 5.4 5.45.7 5.7 5.7 5.7 5.7 5.7 5.7 5.7 5.7 5.7 5.7 5.7 5.7 5.7 5.7
161.0 161.0 161.0 161.0 161.0 161.0 161.0 161.0 161.0 161.0 161.0 161.0 161.0 161.0 161.02,986.2 3,032.7 3,079.2 3,125.6 3,172.1 3,218.6 3,265.1 3,311.6 3,358.0 3,393.1 3,428.2 3,463.3 3,498.4 3,533.5 3,568.63,577.8 3,633.4 3,689.1 3,744.7 3,800.4 3,856.0 3,911.7 3,967.3 4,023.0 4,065.0 4,107.1 4,149.2 4,191.3 4,233.3 4,275.41,592.9 1,617.7 1,642.5 1,667.3 1,692.1 1,716.9 1,741.7 1,766.5 1,791.3 1,810.0 1,828.8 1,847.5 1,866.2 1,884.9 1,903.6
440.1 440.1 440.1 440.1 440.1 440.1 440.1 440.1 440.1 440.1 440.1 440.1 440.1 440.1 440.1162 162 162 162 162 162 162 162 162 162 162 162 162 162 162
7 7 7 7 7 7 7 7 7 7 7 7 7 7 72355.9 2355.9 2355.9 2355.9 2355.9 2355.9 2355.9 2355.9 2355.9 2355.9 2355.9 2355.9 2355.9 2355.9 2355.9
4 4 4 4 4 4 4 4 4 4 4 4 4 4 4186.1 186.1 186.1 186.1 186.1 186.1 186.1 186.1 186.1 186.1 186.1 186.1 186.1 186.1 186.1962.0 962.0 962.0 962.0 962.0 962.0 962.0 962.0 962.0 962.0 962.0 962.0 962.0 962.0 962.0
20283 20598.8 20914.6 21230.3 21546.1 21861.9 22177.7 22493.4 22809.2 23047.8 23286.4 23525.1 23763.7 24002.3 2424115 15 15 15 15 15 15 15 15 15 15 15 15 15 1510 10 10 10 10 10 10 10 10 10 10 10 10 10 10
194 194 194 194 194 194 194 194 194 194 194 194 194 194 194549.1 557.6 566.1 574.5 583.0 591.5 600.0 608.5 617.0 623.4 629.8 636.1 642.5 648.9 655.2
1032.8 1032.8 1032.8 1032.8 1032.8 1032.8 1032.8 1032.8 1032.8 1032.8 1032.8 1032.8 1032.8 1032.8 1032.8724.3 735.5 746.7 757.9 769.1 780.3 791.5 802.7 813.9 822.5 831 839.6 848.1 856.7 865.2
44 44 44 44 44 44 44 44 44 44 44 44 44 44 4432.1 32.1 32.1 32.1 32.1 32.1 32.1 32.1 32.1 32.1 32.1 32.1 32.1 32.1 32.1
3,154.0 3,203.1 3,252.2 3,301.4 3,350.5 3,399.6 3,448.7 3,497.9 3,547.0 3,584.0 3,621.0 3,658.1 3,695.1 3,732.1 3,769.1193.9 196.9 200 203 206.1 209.1 212.2 215.3 218.3 220.6 222.8 225 227.3 229.5 231.8
60 60 60 60 60 60 60 60 60 60 60 60 60 60 60473 473 473 473 473 473 473 473 473 473 473 473 473 473 473
11644.6 11825.5 12006.3 12187.2 12368.1 12548.9 12729.8 12910.7 13091.5 13228.2 13365 13501.7 13638.4 13775.1 13911.81347.5 1347.5 1347.5 1347.5 1347.5 1347.5 1347.5 1347.5 1347.5 1347.5 1347.5 1347.5 1347.5 1347.5 1347.51,876.1 1,905.3 1,934.4 1,963.6 1,992.7 2,021.9 2,051.0 2,080.2 2,109.3 2,131.4 2,153.5 2,175.6 2,197.7 2,219.8 2,241.9
132 132 132 132 132 132 132 132 132 132 132 132 132 132 13210 10 10 10 10 10 10 10 10 10 10 10 10 10 10
322.4 322.4 322.4 322.4 322.4 322.4 322.4 322.4 322.4 322.4 322.4 322.4 322.4 322.4 322.4
Page 14 of 47

Table C-1. County Other Total Pumpage (ac-ft/yr)
Total 2027 Total 2028 Total 2029 Total 2030 Total 2031 Total 2032 Total 2033 Total 2034 Total 2035 Total 2036 Total 2037 Total 2038 Total 2039 Total 2040 Total 2041213.8 213.8 213.8 213.8 213.8 213.8 213.8 213.8 213.8 213.8 213.8 213.8 213.8 213.8 213.830.1 30.1 30.1 30.1 30.1 30.1 30.1 30.1 30.1 30.1 30.1 30.1 30.1 30.1 30.1
875.7 882.1 888.5 894.9 901.9 908.9 915.9 922.9 929.9 936.8 943.8 950.8 957.8 964.8 972.61,548.8 1,563.8 1,578.9 1,594.0 1,610.7 1,627.3 1,644.0 1,660.7 1,677.4 1,694.1 1,710.8 1,727.4 1,744.1 1,760.8 1,779.3
5.4 5.4 5.4 5.4 5.4 5.4 5.4 5.4 5.4 5.4 5.4 5.4 5.4 5.4 5.45.7 5.7 5.7 5.7 5.7 5.7 5.7 5.7 5.7 5.7 5.7 5.7 5.7 5.7 5.7
161.0 161.0 161.0 161.0 161.0 161.0 161.0 161.0 161.0 161.0 161.0 161.0 161.0 161.0 161.03,603.7 3,638.8 3,673.9 3,709.0 3,747.9 3,786.8 3,825.7 3,864.6 3,903.5 3,942.4 3,981.3 4,020.2 4,059.1 4,098.0 4,140.74,317.5 4,359.5 4,401.6 4,443.7 4,490.2 4,536.7 4,583.3 4,629.8 4,676.3 4,722.9 4,769.4 4,816.0 4,862.5 4,909.0 4,960.41,922.3 1,941.0 1,959.7 1,978.5 1,999.1 2,019.7 2,040.3 2,060.9 2,081.5 2,102.1 2,122.7 2,143.3 2,163.9 2,184.5 2,207.4
440.1 440.1 440.1 440.1 440.1 440.1 440.1 440.1 440.1 440.1 440.1 440.1 440.1 440.1 440.1162 162 162 162 162 162 162 162 162 162 162 162 162 162 162
7 7 7 7 7 7 7 7 7 7 7 7 7 7 72355.9 2355.9 2355.9 2355.9 2355.9 2355.9 2355.9 2355.9 2355.9 2355.9 2355.9 2355.9 2355.9 2355.9 2355.9
4 4 4 4 4 4 4 4 4 4 4 4 4 4 4186.1 186.1 186.1 186.1 186.1 186.1 186.1 186.1 186.1 186.1 186.1 186.1 186.1 186.1 186.1962.0 962.0 962.0 962.0 962.0 962.0 962.0 962.0 962.0 962.0 962.0 962.0 962.0 962.0 962.0
24479.6 24718.2 24956.9 25195.5 25458.7 25721.9 25985 26248.2 26511.4 26774.6 27037.7 27300.9 27564.1 27827.2 28118.315 15 15 15 15 15 15 15 15 15 15 15 15 15 1510 10 10 10 10 10 10 10 10 10 10 10 10 10 10
194 194 194 194 194 194 194 194 194 194 194 194 194 194 194661.6 668.0 674.3 680.7 688.0 695.3 702.5 709.8 717.1 724.3 731.6 738.9 746.1 753.4 761.2
1032.8 1032.8 1032.8 1032.8 1032.8 1032.8 1032.8 1032.8 1032.8 1032.8 1032.8 1032.8 1032.8 1032.8 1032.8873.8 882.3 890.9 899.4 908.9 918.3 927.8 937.2 946.6 956.1 965.5 974.9 984.4 993.8 1004.1
44 44 44 44 44 44 44 44 44 44 44 44 44 44 4432.1 32.1 32.1 32.1 32.1 32.1 32.1 32.1 32.1 32.1 32.1 32.1 32.1 32.1 32.1
3,806.1 3,843.2 3,880.2 3,917.2 3,958.2 3,999.2 4,040.2 4,081.2 4,122.2 4,163.2 4,204.2 4,245.2 4,286.2 4,327.2 4,372.5234 236.3 238.5 240.8 243.3 245.8 248.4 250.9 253.4 256 258.5 261 263.6 266.1 268.960 60 60 60 60 60 60 60 60 60 60 60 60 60 60
473 473 473 473 473 473 473 473 473 473 473 473 473 473 47314048.5 14185.2 14322 14458.7 14610.3 14761.9 14913.5 15065.1 15216.7 15368.3 15519.9 15671.5 15823.2 15974.8 16141.81347.5 1347.5 1347.5 1347.5 1347.5 1347.5 1347.5 1347.5 1347.5 1347.5 1347.5 1347.5 1347.5 1347.5 1347.52,264.0 2,286.1 2,308.2 2,330.3 2,354.6 2,378.9 2,403.3 2,427.6 2,451.9 2,476.2 2,500.6 2,524.9 2,549.2 2,573.5 2,600.4
132 132 132 132 132 132 132 132 132 132 132 132 132 132 13210 10 10 10 10 10 10 10 10 10 10 10 10 10 10
322.4 322.4 322.4 322.4 322.4 322.4 322.4 322.4 322.4 322.4 322.4 322.4 322.4 322.4 322.4
Page 15 of 47

Table C-1. County Other Total Pumpage (ac-ft/yr)
Total 2042 Total 2043 Total 2044 Total 2045 Total 2046 Total 2047 Total 2048 Total 2049 Total 2050213.8 213.8 213.8 213.8 213.8 213.8 213.8 213.8 213.830.1 30.1 30.1 30.1 30.1 30.1 30.1 30.1 30.1
980.5 988.3 996.1 1,003.9 1,011.8 1,019.6 1,027.4 1,035.2 1,043.01,797.8 1,816.2 1,834.7 1,853.2 1,871.7 1,890.2 1,908.6 1,927.1 1,945.6
5.4 5.4 5.4 5.4 5.4 5.4 5.4 5.4 5.45.7 5.7 5.7 5.7 5.7 5.7 5.7 5.7 5.7
161.0 161.0 161.0 161.0 161.0 161.0 161.0 161.0 161.04,183.5 4,226.3 4,269.1 4,311.9 4,354.7 4,397.5 4,440.3 4,483.1 4,525.95,011.7 5,063.1 5,114.5 5,165.8 5,217.2 5,268.5 5,319.9 5,371.3 5,422.62,230.3 2,253.2 2,276.2 2,299.1 2,322.0 2,344.9 2,367.8 2,390.8 2,413.7
440.1 440.1 440.1 440.1 440.1 440.1 440.1 440.1 440.1162 162 162 162 162 162 162 162 162
7 7 7 7 7 7 7 7 72355.9 2355.9 2355.9 2355.9 2355.9 2355.9 2355.9 2355.9 2355.9
4 4 4 4 4 4 4 4 4186.1 186.1 186.1 186.1 186.1 186.1 186.1 186.1 186.1962.0 962.0 962.0 962.0 962.0 962.0 962.0 962.0 962.0
28409.3 28700.3 28991.3 29282.3 29573.4 29864.4 30155.4 30446.4 30737.415 15 15 15 15 15 15 15 1510 10 10 10 10 10 10 10 10
194 194 194 194 194 194 194 194 194769.0 776.9 784.7 792.5 800.3 808.2 816.0 823.8 831.6
1032.8 1032.8 1032.8 1032.8 1032.8 1032.8 1032.8 1032.8 1032.81014.5 1024.8 1035.1 1045.4 1055.7 1066.1 1076.4 1086.7 1097
44 44 44 44 44 44 44 44 4432.1 32.1 32.1 32.1 32.1 32.1 32.1 32.1 32.1
4,417.8 4,463.2 4,508.5 4,553.8 4,599.2 4,644.5 4,689.8 4,735.2 4,780.5271.6 274.4 277.2 279.9 282.7 285.5 288.2 291 293.8
60 60 60 60 60 60 60 60 60473 473 473 473 473 473 473 473 473
16308.8 16475.9 16642.9 16809.9 16977 17144 17311 17478.1 17645.11347.5 1347.5 1347.5 1347.5 1347.5 1347.5 1347.5 1347.5 1347.52,627.4 2,654.3 2,681.2 2,708.1 2,735.1 2,762.0 2,788.9 2,815.8 2,842.8
132 132 132 132 132 132 132 132 13210 10 10 10 10 10 10 10 10
322.4 322.4 322.4 322.4 322.4 322.4 322.4 322.4 322.4
Page 16 of 47

Table C-1. Manufacturing Point Total Pumpage (ac-ft/yr)
County Basin Total 1940 Total 1941 Total 1942 Total 1943 Total 1944 Total 1945 Total 1946 Total 1947 Total 1948 Total 1949 Total 1950 Total 1951 Total 1952ANDREWS Colorado 320.7 330.3 340.3 350.5 361.0 371.9 383.0 394.5 406.4 418.6 431.2 438.6 446.1CASTRO Brazos 0.0 0.0 0.0 0.0 0.0 0.0 0.0 0.0 0.0 0.0 0.0 0.0 0.0DAWSON Colorado 0.0 0.0 0.0 0.0 0.0 0.0 0.0 0.0 0.0 0.0 0.0 0.0 0.0
DEAFSMITH Red 0.0 0.0 0.0 0.0 0.0 0.0 0.0 0.0 0.0 0.0 0.0 0.0 0.0GAINES Colorado 32.1 32.1 32.1 32.2 32.2 32.2 32.3 32.3 32.3 32.3 32.4 32.5 32.6
HALE Brazos 0.0 0.0 0.0 0.0 0.0 0.0 0.0 0.0 0.0 0.0 0.0 0.0 0.0HOCKLEY Brazos 191.2 192.4 193.6 194.8 196.0 197.2 198.4 199.6 200.8 202.0 203.3 203.5 203.6
LAMB Brazos 0.0 0.0 0.0 0.0 0.0 0.0 0.0 0.0 0.0 0.0 0.0 0.0 0.0LUBBOCK Brazos 0.0 0.0 0.0 0.0 0.0 0.0 0.0 0.0 0.0 0.0 0.0 0.0 0.0
TERRY Colorado 0.0 0.0 0.0 0.0 0.0 0.0 0.0 0.0 0.0 0.0 0.0 0.0 0.0YOAKUM Colorado 3,633.4 3,626.5 3,619.6 3,612.8 3,605.9 3,599.1 3,592.3 3,585.5 3,578.7 3,572.0 3,565.2 3,595.8 3,626.7
Page 17 of 47

Table C-1. Manufacturing Point Total Pumpage (ac-ft/yr)
Total 1953 Total 1954 Total 1955 Total 1956 Total 1957 Total 1958 Total 1959 Total 1960 Total 1961 Total 1962 Total 1963 Total 1964 Total 1965 Total 1966 Total 1967453.8 461.6 461.0 426.6 375.9 476.5 440.1 537.4 0.0 622.9 614.1 636.9 664.8 659.4 669.6
0.0 0.0 0.0 0.0 0.0 0.0 0.0 0.0 0.0 0.0 0.0 636.4 477.0 512.2 469.00.0 0.0 0.0 0.0 0.0 0.0 0.0 0.0 0.0 0.0 0.0 0.0 0.0 0.0 0.00.0 0.0 0.0 0.0 0.0 0.0 0.0 0.0 0.0 0.0 0.0 0.0 3,377.0 2,253.8 2,336.732.7 32.9 33.0 33.6 33.6 36.8 33.6 63.5 7.4 7.8 7.5 340.0 423.0 738.5 696.40.0 0.0 0.0 0.0 0.0 0.0 0.0 0.0 0.0 0.0 0.0 0.0 1,590.3 1,590.9 53.8
203.8 204.0 203.8 185.5 200.0 198.3 194.3 178.4 235.6 236.7 255.6 282.6 758.7 289.1 274.40.0 0.0 0.0 0.0 0.0 0.0 0.0 0.0 0.0 0.0 0.0 0.0 0.0 0.0 0.00.0 0.0 0.0 0.0 0.0 0.0 0.0 0.0 0.0 0.0 12.5 41.1 1,332.4 1,335.2 8,626.60.0 0.0 0.0 0.0 0.0 0.0 0.0 0.0 0.0 322.6 161.3 161.3 161.3 161.3 160.9
3,657.8 3,689.2 3,688.8 4,642.5 5,063.6 4,871.4 6,368.9 5,921.3 6,149.0 6,485.1 6,045.8 6,793.7 6,368.1 7,037.1 6,541.4
Page 18 of 47

Table C-1. Manufacturing Point Total Pumpage (ac-ft/yr)
Total 1968 Total 1969 Total 1970 Total 1971 Total 1972 Total 1973 Total 1974 Total 1975 Total 1976 Total 1977 Total 1978 Total 1979 Total 1980 Total 1981 Total 1982601.5 566.2 560.4 516.7 463.3 475.5 391.0 390.4 184.9 169.3 130.4 129.0 127.9 243.9 234.6493.7 364.6 0.0 448.1 926.8 987.3 991.2 1,188.3 1,780.8 2,344.9 851.7 967.2 935.6 996.7 1,112.2
0.0 0.0 0.0 0.0 0.0 0.0 0.0 0.0 0.0 0.0 0.0 0.0 0.0 0.0 0.02,150.4 2,212.2 6,578.8 9,792.7 10,297.5 8,492.2 10,080.7 6,951.6 8,463.2 8,421.1 6,181.0 5,521.5 5,259.2 7,180.4 8,012.2907.2 641.3 867.5 896.0 891.1 735.3 779.0 740.9 789.7 364.9 479.1 652.8 692.4 2,396.9 2,461.8674.2 3,526.5 3,081.1 4,476.4 5,473.2 5,315.3 5,785.4 6,090.9 6,453.6 6,515.6 6,548.1 6,836.7 6,766.9 5,939.1 5,964.2289.7 370.9 366.1 396.8 851.2 288.1 285.7 270.7 265.5 201.7 190.8 195.0 193.3 187.2 199.4
0.0 0.0 0.0 0.0 0.0 0.0 0.0 0.0 0.0 0.0 0.0 0.0 157.6 132.1 133.31,400.0 1,856.5 2,213.4 1,324.0 1,305.3 1,623.9 1,147.8 1,560.5 1,526.1 1,545.4 1,888.3 1,927.4 1,551.7 1,407.0 1,692.4161.3 164.4 161.9 282.3 193.6 193.6 193.6 159.1 161.3 143.8 160.9 160.9 160.9 160.8 161.3
6,848.6 7,076.6 6,393.8 7,081.3 7,349.0 7,174.0 8,317.4 5,122.7 5,192.4 5,664.3 5,521.5 4,515.5 4,811.4 4,460.3 4,601.7
Page 19 of 47

Table C-1. Manufacturing Point Total Pumpage (ac-ft/yr)
Total 1983 Total 1984 Total 1985 Total 1986 Total 1987 Total 1988 Total 1989 Total 1990 Total 1991 Total 1992 Total 1993 Total 1994 Total 1995 Total 1996 Total 1997241.3 249.6 337.7 343.9 335.1 445.2 398.0 251.7 250.2 249.4 249.9 249.3 249.3 229.6 24.5716.8 967.3 1,041.0 912.2 464.8 258.9 673.9 1,741.9 995.7 1,018.9 675.5 426.0 351.1 475.1 171.1
0.0 0.0 34.0 20.6 36.9 25.5 20.0 44.4 23.2 23.2 30.0 39.1 26.9 26.7 30.08,482.3 10,088.7 9,983.3 6,081.5 3,682.1 3,936.3 3,253.2 3,558.9 4,040.7 4,732.0 4,439.8 4,291.6 4,583.3 3,834.1 4,366.92,692.5 766.3 738.2 599.7 454.2 525.2 652.1 1,255.0 580.3 628.1 1,388.1 987.5 752.5 839.5 733.16,265.7 6,211.8 5,979.1 5,508.1 5,422.9 5,583.8 6,151.6 5,934.7 6,235.6 6,052.9 6,443.3 6,543.7 6,987.7 7,994.5 8,912.1186.9 124.3 65.2 60.3 70.2 76.9 52.3 6.5 23.9 25.0 51.7 62.8 26.5 12.6 13.1143.0 156.2 120.6 126.3 123.8 97.3 25.9 13.6 14.4 4.9 7.6 7.9 2.5 2.2 0.9
1,202.3 2,025.5 2,983.2 2,478.6 1,451.2 2,898.9 1,584.8 1,495.5 1,474.9 1,498.6 1,042.1 2,436.1 1,294.1 2,795.5 2,043.6162.4 162.4 112.9 58.9 40.4 15.9 0.0 0.0 0.0 0.0 2.7 6.8 4.8 4.5 5.5
3,960.2 4,309.3 1,327.1 183.4 310.0 244.2 477.0 1,926.3 726.6 753.2 1,475.3 2,537.4 2,228.0 2,945.8 2,209.1
Page 20 of 47

Table C-1. Manufacturing Point Total Pumpage (ac-ft/yr)
Total 1998 Total 1999 Total 2000 Total 2001 Total 2002 Total 2003 Total 2004 Total 2005 Total 2006 Total 2007 Total 2008 Total 2009 Total 2010 Total 2011 Total 20120.1 0.1 0.1 9.8 9.6 9.5 9.4 9.2 9.1 8.9 8.8 8.6 8.5 8.4 8.3
190.6 187.0 187.0 2120.3 2153.7 2187.1 2220.5 2253.9 2287.3 2320.7 2354.1 2387.5 2420.9 2451.1 2481.320.8 12.5 12.5 884.1 868.1 852.2 836.2 820.2 804.3 788.3 772.4 756.4 740.5 727.4 714.3
3,682.1 5,771.9 5,771.9 546.0 549.9 553.8 557.7 561.6 565.5 569.4 573.3 577.2 581.1 584.2 587.3654.9 856.7 856.7 9377.9 9219.8 9061.8 8903.7 8745.6 8587.6 8429.5 8271.5 8113.4 7955.3 7808.3 7661.2
6,237.2 8,780.0 8,780.0 2016.1 2022.4 2028.7 2035.0 2041.3 2047.6 2053.9 2060.2 2066.5 2072.8 2080.2 2087.77.9 7.9 7.9 135.4 133.5 131.6 129.7 127.8 126.0 124.1 122.2 120.3 118.4 116.6 114.81.2 0.9 0.9 16780.5 16772.7 16765.0 16757.2 16749.5 16741.7 16734.0 16726.2 16718.5 16710.7 17327.8 17944.8
1,242.4 1,138.0 1,138.0 2054.8 2081.7 2108.5 2135.4 2162.3 2189.2 2216.1 2243.0 2269.8 2296.7 2293.8 2290.94.1 3.7 3.7 271.3 266.2 261.2 256.1 251.1 246.0 241.0 235.9 230.9 225.8 221.7 217.6
2,819.2 2,819.2 2,819.2 9364.4 9230.9 9097.4 8963.9 8830.4 8696.9 8563.4 8429.9 8296.5 8163.0 8053.9 7944.8
Page 21 of 47

Table C-1. Manufacturing Point Total Pumpage (ac-ft/yr)
Total 2013 Total 2014 Total 2015 Total 2016 Total 2017 Total 2018 Total 2019 Total 2020 Total 2021 Total 2022 Total 2023 Total 2024 Total 2025 Total 2026 Total 20278.3 8.2 8.1 8.1 8.0 7.9 7.9 7.8 7.8 7.8 7.7 7.7 7.7 7.7 7.6
2511.5 2541.7 2571.9 2602.1 2632.3 2662.5 2692.7 2722.9 2750.0 2777.1 2804.2 2831.3 2858.4 2885.5 2912.6701.3 688.2 675.2 662.1 649.0 636.0 622.9 609.8 599.1 588.4 577.7 567.0 556.3 545.6 534.9590.4 593.5 596.6 599.7 602.8 605.9 609.0 612.1 614.6 617.1 619.6 622.1 624.6 627.1 629.6
7514.1 7367.0 7220.0 7072.9 6925.8 6778.7 6631.6 6484.6 6394.6 6304.7 6214.8 6124.8 6034.9 5944.9 5855.02095.2 2102.7 2110.2 2117.7 2125.2 2132.7 2140.1 2147.6 2155.5 2163.4 2171.3 2179.2 2187.1 2195.0 2202.9
113.0 111.2 109.5 107.7 105.9 104.1 102.3 100.5 99.0 97.5 96.0 94.6 93.1 91.6 90.118561.9 19178.9 19796.0 20413.0 21030.1 21647.2 22264.2 22881.3 22881.0 22880.7 22880.5 22880.2 22879.9 22879.7 22879.4
2287.9 2285.0 2282.1 2279.2 2276.3 2273.3 2270.4 2267.5 2274.0 2280.5 2287.0 2293.5 2300.0 2306.5 2313.0213.4 209.3 205.2 201.0 196.9 192.8 188.6 184.5 181.1 177.8 174.4 171.0 167.6 164.3 160.9
7835.7 7726.6 7617.5 7508.4 7399.3 7290.2 7181.1 7072.0 6982.9 6893.8 6804.7 6715.6 6626.5 6537.4 6448.3
Page 22 of 47

Table C-1. Manufacturing Point Total Pumpage (ac-ft/yr)
Total 2028 Total 2029 Total 2030 Total 2031 Total 2032 Total 2033 Total 2034 Total 2035 Total 2036 Total 2037 Total 2038 Total 2039 Total 2040 Total 2041 Total 20427.6 7.6 7.6 7.6 7.6 7.5 7.5 7.5 7.5 7.5 7.5 7.5 7.4 7.4 7.4
2939.7 2966.8 2993.9 3035.6 3077.3 3119.0 3160.7 3202.4 3244.1 3285.8 3327.5 3369.1 3410.8 3452.1 3493.4524.2 513.5 502.8 494.1 485.5 476.9 468.3 459.7 451.0 442.4 433.8 425.2 416.5 409.5 402.4632.1 634.6 637.1 642.3 647.5 652.7 658.0 663.2 668.4 673.6 678.8 684.0 689.3 693.0 696.7
5765.1 5675.1 5585.2 5501.3 5417.4 5333.5 5249.6 5165.7 5081.8 4997.9 4914.0 4830.1 4746.2 4678.4 4610.52210.7 2218.6 2226.5 2243.8 2261.1 2278.3 2295.6 2312.9 2330.2 2347.4 2364.7 2382.0 2399.2 2546.1 2693.0
88.6 87.1 85.7 84.5 83.3 82.1 80.9 79.7 78.5 77.3 76.1 74.9 73.8 72.7 71.622879.1 22878.9 22878.6 22878.4 22878.2 22878.1 22877.9 22877.7 22877.5 22877.3 22877.2 22877.0 22876.8 23322.4 23768.0
2319.5 2326.1 2332.6 2360.7 2388.8 2416.9 2445.0 2473.1 2501.2 2529.3 2557.4 2585.5 2613.6 2643.3 2672.9157.5 154.2 150.8 148.0 145.2 142.5 139.7 136.9 134.2 131.4 128.6 125.9 123.1 120.8 118.6
6359.2 6270.1 6181.0 6108.2 6035.4 5962.6 5889.8 5817.0 5744.2 5671.4 5598.6 5525.8 5453.0 5393.5 5334.0
Page 23 of 47

Table C-1. Manufacturing Point Total Pumpage (ac-ft/yr)
Total 2043 Total 2044 Total 2045 Total 2046 Total 2047 Total 2048 Total 2049 Total 20507.4 7.4 7.4 7.4 7.4 7.4 7.4 7.4
3534.7 3576.0 3617.3 3658.6 3699.9 3741.2 3782.5 3823.8395.3 388.3 381.2 374.1 367.1 360.0 352.9 345.9700.5 704.2 708.0 711.7 715.4 719.2 722.9 726.7
4542.7 4474.9 4407.1 4339.3 4271.4 4203.6 4135.8 4068.02839.9 2986.7 3133.6 3280.5 3427.3 3574.2 3721.1 3867.9
70.5 69.4 68.3 67.2 66.1 65.0 63.9 62.824213.6 24659.2 25104.8 25550.4 25996.0 26441.6 26887.2 27332.8
2702.5 2732.1 2761.7 2791.3 2821.0 2850.6 2880.2 2909.8116.4 114.1 111.9 109.7 107.4 105.2 103.0 100.7
5274.5 5215.0 5155.5 5096.0 5036.5 4977.0 4917.5 4858.0
Page 24 of 47

Table C-1. Manufacturing NonPoint Total Pumpage (ac-ft/yr)
County Basin Total 1940 Total 1941 Total 1942 Total 1943 Total 1944 Total 1945 Total 1946 Total 1947 Total 1948 Total 1949 Total 1950 Total 1951 Total 1952ANDREWS COLORADO 9.6 13.5 19.1 26.9 38.0 53.6 75.7 106.9 150.9 213.1 300.9 362.0 435.6ARMSTRONG RED 0.0 0.0 0.0 0.0 0.0 0.0 0.0 0.0 0.0 0.0 0.0 0.0 0.0BAILEY BRAZOS 0.0 0.0 0.0 0.0 0.0 0.0 0.0 0.0 0.0 0.0 0.0 0.0 0.0BORDEN COLORADO 0.4 0.4 0.4 0.4 0.4 0.4 0.3 0.3 0.3 0.3 0.3 0.3 0.3CASTRO BRAZOS 0.0 0.0 0.0 0.0 0.0 0.0 0.0 0.0 0.0 0.0 0.0 0.0 0.0CASTRO RED 5.0 5.1 5.2 5.3 5.4 5.5 5.6 5.7 5.8 5.8 6.0 6.4 6.8COCHRAN BRAZOS 0.4 0.5 0.5 0.5 0.5 0.6 0.6 0.7 0.7 0.7 0.8 0.8 0.8COCHRAN COLORADO 8.1 8.7 9.2 9.8 10.4 11.0 11.7 12.4 13.2 14.0 14.9 15.0 15.2CROSBY BRAZOS 0.0 0.0 0.0 0.0 0.0 0.0 0.0 0.0 0.0 0.0 0.0 0.0 0.0DAWSON BRAZOS 0.1 0.1 0.1 0.1 0.1 0.1 0.1 0.1 0.1 0.1 0.1 0.1 0.1DAWSON COLORADO 17.2 17.2 17.6 17.6 18.1 18.1 18.5 18.5 19.0 19.0 19.5 19.5 19.5DEAF SMITH RED 12.0 12.6 12.7 13.3 13.4 14.0 14.1 14.7 14.8 15.5 15.6 16.3 17.1ECTOR COLORADO 196.1 239.0 291.4 355.3 433.1 528.0 643.7 784.7 956.7 1166.3 1421.8 1608.7 1820.0FLOYD BRAZOS 0.0 0.0 0.0 0.0 0.0 0.0 0.0 0.0 0.0 0.0 0.0 0.0 0.0GAINES COLORADO 1870.6 1888.5 1906.6 1924.9 1943.4 1962.0 1980.8 1999.8 2019.0 2038.4 2057.9 2138.5 2222.3GARZA BRAZOS 0.0 0.0 0.0 0.0 0.0 0.0 0.0 0.0 0.0 0.0 0.0 0.0 0.0GLASSCOCK COLORADO 0.0 0.0 0.0 0.0 0.0 0.0 0.0 0.0 0.0 0.0 0.0 0.0 0.0HALE BRAZOS 0.0 0.0 0.0 0.0 0.0 0.0 0.0 0.0 0.0 0.0 0.0 0.0 0.0HOCKLEY BRAZOS 4.2 4.5 4.8 5.1 5.4 5.8 6.2 6.6 7.0 7.4 7.9 8.0 8.1HOWARD COLORADO 10.5 10.8 11.1 11.4 11.7 12.1 12.4 12.8 13.1 13.5 13.9 14.6 15.4LAMB BRAZOS 14.0 14.2 14.4 14.6 14.8 15.0 15.2 15.4 15.6 15.8 16.1 16.2 16.4LEA 8.9 9.0 9.1 9.2 9.3 9.4 9.5 9.6 9.8 9.9 10.0 10.4 10.8LUBBOCK BRAZOS 51.0 56.3 62.2 68.8 76.0 84.0 92.8 102.6 113.4 125.3 138.5 146.5 155.0LYNN BRAZOS 0.0 0.0 0.0 0.0 0.0 0.0 0.0 0.0 0.0 0.0 0.0 0.0 0.0MARTIN COLORADO 0.7 0.7 0.7 0.7 0.7 0.7 0.7 0.7 0.7 0.7 0.6 0.6 0.6MIDLAND COLORADO 70.8 80.5 91.5 103.9 118.1 134.2 152.5 173.3 196.9 223.8 254.3 303.6 362.6OLDHAM CANADIAN 0.0 0.0 0.0 0.0 0.0 0.0 0.0 0.0 0.0 0.0 0.0 0.0 0.0OLDHAM RED 0.0 0.0 0.0 0.0 0.0 0.0 0.0 0.0 0.0 0.0 0.0 0.0 0.0PARMER RED 0.0 0.0 0.0 0.0 0.0 0.0 0.0 0.0 0.0 0.0 0.0 0.0 0.0POTTER CANADIAN 111.5 115.5 119.7 124.1 128.6 133.3 138.2 143.2 148.5 153.9 159.5 169.2 179.5POTTER RED 37.2 38.6 40.0 41.4 42.9 44.5 46.1 47.8 49.5 51.3 53.2 56.5 59.9RANDALL RED 0.3 0.3 0.3 0.4 0.4 0.4 0.5 0.5 0.6 0.7 0.7 0.8 1.0SWISHER BRAZOS 0.0 0.0 0.0 0.0 0.0 0.0 0.0 0.0 0.0 0.0 0.0 0.0 0.0SWISHER RED 0.0 0.0 0.0 0.0 0.0 0.0 0.0 0.0 0.0 0.0 0.0 0.0 0.0TERRY COLORADO 656.1 667.8 679.6 691.7 704.0 716.5 729.2 742.1 755.3 768.7 782.4 801.8 821.8YOAKUM COLORADO 56.8 55.8 54.7 53.7 52.7 51.7 50.8 49.8 48.9 48.0 47.1 51.5 56.3
Page 25 of 47

Table C-1. Manufacturing NonPoint Total Pumpage (ac-ft/yr)
Total 1953 Total 1954 Total 1955 Total 1956 Total 1957 Total 1958 Total 1959 Total 1960 Total 1961 Total 1962 Total 1963 Total 1964 Total 1965 Total 1966 Total 1967524.1 630.6 758.7 963.9 1052.5 1053.0 1197.9 1127.9 1059.9 1029.3 1019.3 1111.0 820.5 745.6 785.9
0.0 0.0 0.0 0.0 0.0 0.0 0.0 0.0 0.1 0.1 0.1 0.1 0.1 0.1 0.10.0 0.0 0.0 0.0 0.0 0.0 0.0 0.0 0.0 0.0 0.0 0.0 0.0 0.0 0.00.3 0.3 0.3 0.3 0.3 0.3 0.3 0.3 0.3 0.3 0.3 0.3 0.3 0.3 0.30.0 0.0 0.0 0.0 0.0 0.0 0.0 0.0 0.0 0.0 0.1 0.0 0.0 0.0 0.07.3 7.8 8.3 8.3 8.3 8.3 8.3 8.3 0.9 0.0 0.0 0.0 0.0 0.0 0.30.8 0.8 0.8 0.8 0.8 0.8 0.8 0.8 0.8 0.8 0.8 0.8 0.8 0.8 0.8
15.3 15.4 15.6 14.4 14.4 14.4 14.4 14.4 14.6 14.3 14.9 13.9 13.9 13.9 13.90.0 0.0 0.0 0.0 0.0 0.0 0.0 0.0 0.0 0.0 0.0 0.0 0.0 0.0 0.00.1 0.1 0.1 0.1 0.1 0.1 0.1 0.1 0.1 0.1 0.1 0.1 0.1 0.1 0.1
19.5 19.5 19.5 19.5 19.5 19.5 19.5 19.5 19.3 19.0 18.8 21.1 20.2 20.0 20.017.9 18.7 19.6 20.5 21.5 22.5 23.5 24.6 25.8 27.0 28.2 29.5 30.9 32.3 33.8
2059.1 2329.7 2635.8 2762.9 3123.1 3109.4 3374.9 3386.6 3964.2 3864.4 4053.0 4307.9 4559.0 4835.2 4903.90.0 0.0 0.0 0.0 0.0 0.0 0.0 0.0 0.0 0.0 0.0 0.0 3.6 3.6 4.0
2309.3 2399.8 2493.8 2584.3 2355.6 1627.8 1277.8 1151.6 1344.7 1253.6 1298.0 1342.7 1363.0 1283.7 2238.30.0 0.0 0.0 0.0 0.0 0.0 0.0 0.0 0.0 0.0 0.0 0.0 0.0 0.0 0.00.0 0.0 0.0 0.0 0.0 0.0 0.0 0.0 0.0 2.1 2.1 0.3 0.4 0.4 0.00.0 0.0 66.0 68.1 70.3 72.5 74.7 77.1 10.9 22.7 109.2 26.8 26.8 26.8 26.88.2 8.2 8.3 8.3 8.3 8.3 8.3 8.3 0.9 154.3 231.1 463.9 501.0 501.0 159.0
16.2 17.0 17.9 22.4 22.4 18.3 14.2 10.0 5.9 1.8 1.8 1.7 1.7 1.7 1.616.5 16.7 16.8 15.6 15.6 15.6 15.6 15.6 8.3 8.4 7.8 7.1 9.9 8.0 23.311.2 11.6 12.0 12.4 11.4 8.0 6.4 5.8 6.7 6.3 6.5 6.7 6.8 6.5 11.2
163.9 173.4 183.4 209.2 233.7 230.6 216.2 217.1 165.9 184.5 174.6 161.4 219.5 193.1 154.20.0 0.0 0.0 0.0 0.0 0.0 0.0 0.0 0.0 0.0 0.0 0.0 0.0 0.0 0.00.6 0.6 0.6 0.7 0.6 0.6 0.7 0.5 0.6 0.6 0.7 0.8 0.6 0.5 0.6
433.0 517.1 617.6 666.4 562.9 619.4 697.6 511.4 609.8 604.7 501.9 520.5 326.9 316.7 361.50.0 0.0 0.0 0.0 0.0 0.0 0.0 0.0 0.0 0.0 0.0 0.0 0.0 0.0 0.00.0 0.0 0.0 0.0 0.0 0.0 0.0 0.0 0.0 0.0 0.0 0.0 0.0 0.0 0.00.0 0.0 0.0 0.0 0.0 0.0 0.0 0.0 0.0 0.0 0.0 0.0 0.0 0.0 0.0
190.5 202.1 214.5 283.4 331.7 382.9 406.0 512.9 560.2 559.7 632.1 742.5 684.1 722.9 760.363.6 67.5 71.6 94.6 110.7 127.8 135.5 171.1 187.0 186.8 211.0 247.8 228.3 241.3 253.71.2 1.4 1.6 1.6 0.9 0.9 0.9 0.9 7.8 7.8 7.8 8.4 10.2 10.0 9.90.0 0.0 0.0 0.0 0.0 0.0 0.0 0.0 0.0 0.0 0.0 0.0 0.0 0.0 0.00.0 0.0 0.0 0.0 0.0 0.0 0.0 0.0 0.0 0.0 0.0 0.0 0.0 0.0 0.0
842.2 863.1 884.6 664.0 664.0 643.3 865.6 58.6 890.8 918.7 0.3 703.4 214.1 44.7 58.161.5 67.2 73.5 73.1 73.1 101.9 107.5 102.5 89.7 88.9 95.3 95.1 90.8 348.7 796.2
Page 26 of 47

Table C-1. Manufacturing NonPoint Total Pumpage (ac-ft/yr)
Total 1968 Total 1969 Total 1970 Total 1971 Total 1972 Total 1973 Total 1974 Total 1975 Total 1976 Total 1977 Total 1978 Total 1979 Total 1980 Total 1981 Total 1982624.8 527.3 510.5 546.2 587.4 564.2 602.0 509.2 563.2 545.5 331.9 336.2 345.6 342.2 356.8
0.1 0.1 0.1 0.1 0.1 0.1 0.1 0.1 0.1 0.1 0.1 0.0 0.1 0.1 0.10.0 0.0 0.0 0.0 0.0 0.0 0.0 0.0 0.0 0.0 0.0 0.0 0.0 0.0 0.00.5 0.3 0.3 0.3 0.3 0.2 0.2 0.2 0.1 0.1 0.1 0.1 0.1 0.1 0.10.0 0.0 0.0 0.2 0.2 0.0 0.0 0.1 0.1 0.1 0.0 0.0 0.0 0.0 0.00.2 0.1 0.3 0.4 0.1 0.3 0.2 0.1 0.3 0.3 0.1 0.5 0.3 0.3 0.40.8 0.8 0.8 0.8 0.8 0.8 0.8 0.8 0.8 0.8 0.2 0.0 0.1 0.1 0.1
14.2 14.2 14.2 14.2 14.2 14.2 14.2 14.2 14.2 14.2 2.1 0.2 0.8 0.6 0.70.0 0.0 0.0 0.0 0.0 0.0 0.0 195.0 195.0 195.0 195.0 195.0 195.0 195.0 195.00.1 0.1 0.1 0.1 0.1 0.1 0.1 0.1 0.0 0.0 0.0 0.0 0.0 0.0 0.0
28.7 21.1 20.2 19.5 20.2 10.9 14.1 10.9 9.4 9.4 7.8 7.3 7.3 7.4 7.526.6 9.4 39.6 50.3 15.6 36.9 21.2 10.0 36.8 38.9 12.5 66.7 34.7 44.7 47.5
4579.6 4554.3 4672.7 5702.0 4589.8 4335.9 4395.5 4661.0 4622.9 4580.2 3690.3 3860.8 302.0 303.4 296.91.3 1.3 1.1 1.0 1.1 1.3 1.0 1.0 1.0 0.9 1.0 0.9 1.0 0.9 1.0
1662.5 1766.9 1623.7 1788.5 2000.5 1986.0 1864.9 1665.4 1395.0 1431.9 1284.9 1316.9 1232.4 1115.4 1298.00.0 0.0 0.0 0.0 0.0 0.0 0.0 3.9 3.9 3.9 3.9 3.9 3.9 3.9 3.90.0 0.0 0.0 0.0 0.0 0.0 0.0 0.0 0.0 0.0 0.0 0.0 0.0 0.0 0.0
20.5 31.4 31.5 260.5 347.6 47.0 43.5 160.0 150.8 131.9 39.5 61.9 21.8 9.8 11.599.4 99.4 63.1 114.9 82.7 105.2 184.7 106.5 109.9 56.1 364.5 10.0 244.4 244.4 245.01.6 1.6 1.6 1.6 1.6 1.6 1.6 68.0 67.0 84.5 185.1 460.5 228.0 171.5 111.87.5 16.3 9.2 7.5 6.4 7.1 7.8 7.2 6.0 5.2 2.6 2.1 2.1 0.9 17.38.2 8.6 8.0 8.8 9.7 9.7 9.1 8.2 6.9 7.1 6.1 6.2 5.8 5.2 6.1
154.3 202.0 177.0 199.3 217.9 234.5 271.5 181.8 200.1 311.3 175.0 521.6 92.2 140.7 19.10.0 0.0 0.0 0.0 0.0 0.0 0.0 0.0 0.0 0.0 0.0 0.0 0.0 0.0 0.00.8 0.7 0.7 0.8 0.7 0.6 0.6 0.5 0.5 0.5 0.4 9.7 9.7 9.7 9.7
509.1 502.6 489.9 615.2 439.7 444.9 446.1 421.3 422.7 373.8 313.9 292.3 3.5 2.5 2.40.0 0.0 0.0 0.0 152.6 152.6 152.6 160.1 8.6 1.6 1.6 1.6 1.6 1.6 1.60.0 0.0 0.0 0.0 1.2 1.2 1.2 1.3 0.1 0.0 0.0 0.0 0.0 0.0 0.00.0 0.0 0.0 0.0 0.0 90.9 87.5 87.3 86.1 83.8 97.3 169.9 215.9 215.9 155.3
807.3 968.3 884.3 878.4 885.6 1004.1 901.2 1062.5 1033.5 1001.3 893.8 911.3 962.9 949.8 903.0352.9 387.4 371.9 366.8 303.5 335.9 366.8 414.0 408.7 396.3 362.6 365.9 384.3 366.4 355.8
7.4 8.5 6.5 6.5 7.2 6.9 7.0 6.9 7.6 7.4 7.0 2.0 4.4 5.0 6.00.0 0.0 0.0 0.0 0.0 0.0 0.0 0.0 0.0 0.0 0.0 0.0 0.0 0.0 0.00.0 0.0 0.0 0.0 0.0 0.0 0.0 0.0 0.0 0.0 0.0 0.0 0.0 0.0 0.0
36.5 45.1 373.5 335.5 323.2 418.6 198.5 155.1 323.2 45.2 46.2 39.8 0.9 13.8 20.785.4 85.0 87.8 115.0 101.5 116.2 115.5 132.7 146.9 153.1 146.7 139.9 136.6 149.0 139.9
Page 27 of 47

Table C-1. Manufacturing NonPoint Total Pumpage (ac-ft/yr)
Total 1983 Total 1984 Total 1985 Total 1986 Total 1987 Total 1988 Total 1989 Total 1990 Total 1991 Total 1992 Total 1993 Total 1994 Total 1995 Total 1996 Total 1997436.3 442.6 349.5 453.5 435.7 368.6 369.7 254.2 56.8 62.2 56.4 107.0 161.5 242.2 101.8
0.0 0.1 0.1 0.1 0.0 0.0 0.0 0.1 0.0 0.0 0.0 0.1 0.0 0.0 0.10.0 4.1 0.0 0.0 0.0 0.0 0.0 0.0 0.0 0.0 0.0 0.0 0.0 0.0 0.00.1 0.2 0.2 0.2 0.2 0.2 0.2 0.2 0.2 0.2 0.2 0.2 0.2 0.2 0.20.0 0.0 0.0 0.0 0.0 0.0 0.0 0.0 0.0 0.0 0.0 0.0 0.0 0.0 0.00.3 0.3 0.2 0.3 0.3 0.3 0.1 0.3 0.3 0.1 0.1 0.1 0.0 0.0 0.00.1 0.0 0.0 0.0 0.0 0.0 0.0 0.0 0.0 0.0 0.0 0.0 0.0 0.0 0.00.7 2995.1 0.0 0.0 0.0 0.0 0.0 0.0 0.0 0.0 0.0 0.0 0.0 0.0 0.0
195.0 195.0 195.0 195.0 195.0 195.0 195.0 195.0 195.0 195.0 195.0 195.0 195.0 195.0 178.70.0 0.1 0.1 0.1 0.0 0.0 0.0 0.0 0.0 0.0 0.0 0.0 0.0 0.0 0.07.5 10.9 10.9 10.8 10.7 10.5 10.4 10.4 10.5 10.5 10.6 10.6 10.7 10.7 10.8
44.0 38.8 24.7 34.8 33.5 39.0 6.8 38.3 44.5 8.2 11.7 8.4 8.5 8.6 8.7312.9 374.9 335.3 319.6 250.2 522.6 435.5 399.2 435.5 300.6 300.6 300.6 300.6 280.4 33.6
0.7 1.1 1.2 0.7 7.2 13.8 20.3 26.8 33.4 39.9 46.5 53.0 53.0 53.0 53.01250.9 1000.2 1110.0 1294.1 1569.5 1194.7 728.8 576.7 515.0 423.0 104.3 98.9 99.5 111.5 102.2
3.9 3.9 3.9 4.7 4.7 4.7 4.2 4.2 6.9 20.1 3.9 3.9 3.9 3.9 3.60.0 0.0 0.0 0.0 0.0 0.0 0.0 0.0 0.0 0.0 0.0 0.0 0.0 0.0 0.0
12.4 9.2 9.7 4.9 4.5 2.8 0.7 3.4 6.0 6.0 6.1 6.0 6.8 6.9 6.9245.6 246.2 246.8 247.4 248.0 248.6 249.2 251.2 253.3 255.4 257.5 259.6 261.7 263.9 266.147.0 91.6 204.9 312.8 188.2 212.1 294.3 301.2 302.4 285.4 77.1 336.8 342.1 164.8 134.321.6 0.5 0.4 0.1 0.1 0.1 0.1 0.1 0.1 0.1 0.1 0.1 0.1 0.1 0.15.9 1929.2 5.1 6.0 7.3 5.5 3.4 2.7 2.4 2.0 0.5 0.5 0.5 0.5 0.5
11.5 11.8 12.2 10.9 3.3 6.2 2.7 54.3 56.6 53.4 74.5 76.8 52.5 52.3 62.30.0 0.0 0.0 0.1 0.1 0.1 0.0 0.0 0.4 2.2 0.0 0.0 0.0 0.0 0.09.7 3.6 48.9 32.4 28.4 27.2 29.0 39.1 24.4 15.2 32.9 46.9 50.1 37.6 49.90.5 10.3 21.0 30.6 40.5 109.2 155.3 56.7 19.9 36.2 97.0 172.0 189.2 157.1 135.31.6 1.6 1.6 1.6 1.6 1.6 1.6 1.6 1.6 1.6 1.6 1.6 1.6 1.6 1.60.0 0.0 0.0 0.0 0.0 0.0 0.0 0.0 0.0 0.0 0.0 0.0 0.0 0.0 0.0
200.9 136.2 147.4 63.5 28.3 28.0 27.6 27.8 28.1 28.3 28.5 28.7 28.9 29.2 29.41691.9 1695.8 1375.3 1157.7 1179.7 1173.3 1386.3 1376.7 1057.4 878.6 1197.1 1200.2 1069.3 540.9 745.8620.2 618.4 512.4 419.0 424.6 418.5 490.1 482.5 373.8 363.5 494.7 489.2 446.2 266.4 319.8
4.2 12.8 6.2 6.1 3.6 3.7 1.2 9.8 0.6 0.3 0.3 12.4 0.2 0.3 5.60.0 0.0 0.0 0.2 0.2 0.2 0.1 0.1 0.2 0.2 0.2 0.2 0.2 0.2 0.20.0 1.4 0.9 7.1 7.0 6.8 6.7 6.7 6.8 6.8 6.9 6.9 7.0 7.0 7.1
19.9 20.4 28.6 25.5 27.6 26.0 33.6 24.3 31.9 29.7 29.2 32.1 30.1 12.5 12.6117.4 0.0 0.0 0.0 0.0 0.0 0.0 0.0 0.0 0.0 0.0 0.0 0.0 0.0 0.0
Page 28 of 47
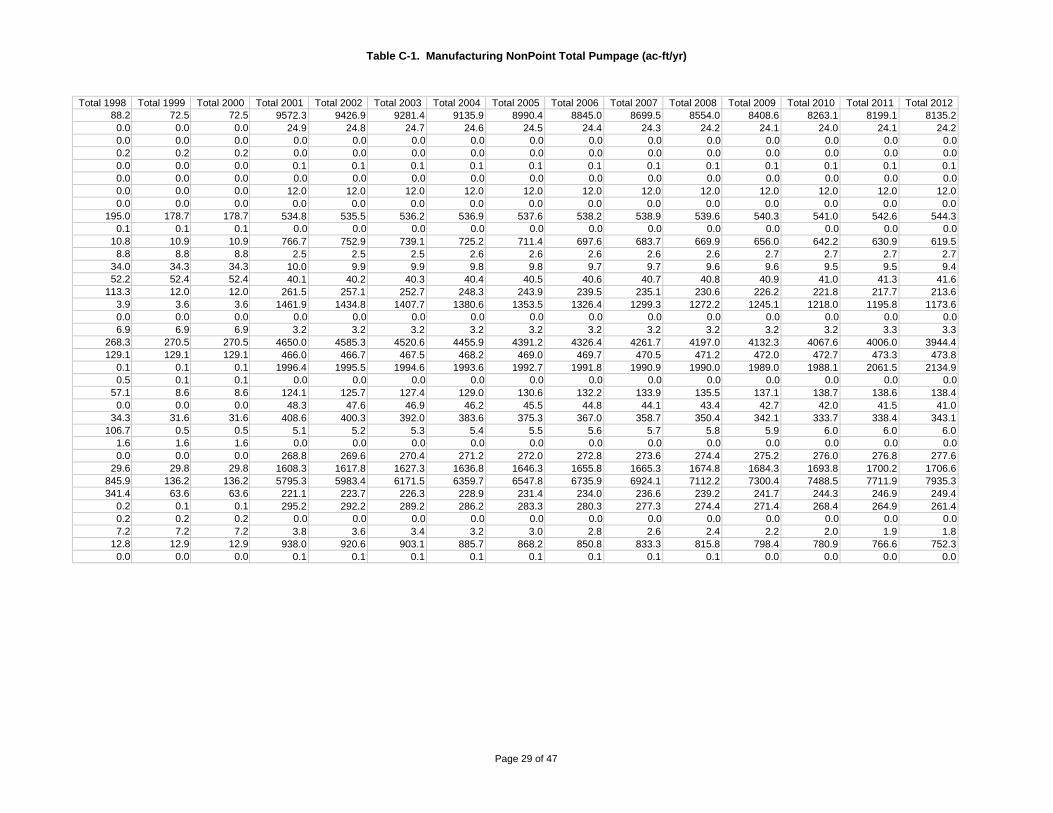
Table C-1. Manufacturing NonPoint Total Pumpage (ac-ft/yr)
Total 1998 Total 1999 Total 2000 Total 2001 Total 2002 Total 2003 Total 2004 Total 2005 Total 2006 Total 2007 Total 2008 Total 2009 Total 2010 Total 2011 Total 201288.2 72.5 72.5 9572.3 9426.9 9281.4 9135.9 8990.4 8845.0 8699.5 8554.0 8408.6 8263.1 8199.1 8135.20.0 0.0 0.0 24.9 24.8 24.7 24.6 24.5 24.4 24.3 24.2 24.1 24.0 24.1 24.20.0 0.0 0.0 0.0 0.0 0.0 0.0 0.0 0.0 0.0 0.0 0.0 0.0 0.0 0.00.2 0.2 0.2 0.0 0.0 0.0 0.0 0.0 0.0 0.0 0.0 0.0 0.0 0.0 0.00.0 0.0 0.0 0.1 0.1 0.1 0.1 0.1 0.1 0.1 0.1 0.1 0.1 0.1 0.10.0 0.0 0.0 0.0 0.0 0.0 0.0 0.0 0.0 0.0 0.0 0.0 0.0 0.0 0.00.0 0.0 0.0 12.0 12.0 12.0 12.0 12.0 12.0 12.0 12.0 12.0 12.0 12.0 12.00.0 0.0 0.0 0.0 0.0 0.0 0.0 0.0 0.0 0.0 0.0 0.0 0.0 0.0 0.0
195.0 178.7 178.7 534.8 535.5 536.2 536.9 537.6 538.2 538.9 539.6 540.3 541.0 542.6 544.30.1 0.1 0.1 0.0 0.0 0.0 0.0 0.0 0.0 0.0 0.0 0.0 0.0 0.0 0.0
10.8 10.9 10.9 766.7 752.9 739.1 725.2 711.4 697.6 683.7 669.9 656.0 642.2 630.9 619.58.8 8.8 8.8 2.5 2.5 2.5 2.6 2.6 2.6 2.6 2.6 2.7 2.7 2.7 2.7
34.0 34.3 34.3 10.0 9.9 9.9 9.8 9.8 9.7 9.7 9.6 9.6 9.5 9.5 9.452.2 52.4 52.4 40.1 40.2 40.3 40.4 40.5 40.6 40.7 40.8 40.9 41.0 41.3 41.6
113.3 12.0 12.0 261.5 257.1 252.7 248.3 243.9 239.5 235.1 230.6 226.2 221.8 217.7 213.63.9 3.6 3.6 1461.9 1434.8 1407.7 1380.6 1353.5 1326.4 1299.3 1272.2 1245.1 1218.0 1195.8 1173.60.0 0.0 0.0 0.0 0.0 0.0 0.0 0.0 0.0 0.0 0.0 0.0 0.0 0.0 0.06.9 6.9 6.9 3.2 3.2 3.2 3.2 3.2 3.2 3.2 3.2 3.2 3.2 3.3 3.3
268.3 270.5 270.5 4650.0 4585.3 4520.6 4455.9 4391.2 4326.4 4261.7 4197.0 4132.3 4067.6 4006.0 3944.4129.1 129.1 129.1 466.0 466.7 467.5 468.2 469.0 469.7 470.5 471.2 472.0 472.7 473.3 473.8
0.1 0.1 0.1 1996.4 1995.5 1994.6 1993.6 1992.7 1991.8 1990.9 1990.0 1989.0 1988.1 2061.5 2134.90.5 0.1 0.1 0.0 0.0 0.0 0.0 0.0 0.0 0.0 0.0 0.0 0.0 0.0 0.0
57.1 8.6 8.6 124.1 125.7 127.4 129.0 130.6 132.2 133.9 135.5 137.1 138.7 138.6 138.40.0 0.0 0.0 48.3 47.6 46.9 46.2 45.5 44.8 44.1 43.4 42.7 42.0 41.5 41.0
34.3 31.6 31.6 408.6 400.3 392.0 383.6 375.3 367.0 358.7 350.4 342.1 333.7 338.4 343.1106.7 0.5 0.5 5.1 5.2 5.3 5.4 5.5 5.6 5.7 5.8 5.9 6.0 6.0 6.0
1.6 1.6 1.6 0.0 0.0 0.0 0.0 0.0 0.0 0.0 0.0 0.0 0.0 0.0 0.00.0 0.0 0.0 268.8 269.6 270.4 271.2 272.0 272.8 273.6 274.4 275.2 276.0 276.8 277.6
29.6 29.8 29.8 1608.3 1617.8 1627.3 1636.8 1646.3 1655.8 1665.3 1674.8 1684.3 1693.8 1700.2 1706.6845.9 136.2 136.2 5795.3 5983.4 6171.5 6359.7 6547.8 6735.9 6924.1 7112.2 7300.4 7488.5 7711.9 7935.3341.4 63.6 63.6 221.1 223.7 226.3 228.9 231.4 234.0 236.6 239.2 241.7 244.3 246.9 249.4
0.2 0.1 0.1 295.2 292.2 289.2 286.2 283.3 280.3 277.3 274.4 271.4 268.4 264.9 261.40.2 0.2 0.2 0.0 0.0 0.0 0.0 0.0 0.0 0.0 0.0 0.0 0.0 0.0 0.07.2 7.2 7.2 3.8 3.6 3.4 3.2 3.0 2.8 2.6 2.4 2.2 2.0 1.9 1.8
12.8 12.9 12.9 938.0 920.6 903.1 885.7 868.2 850.8 833.3 815.8 798.4 780.9 766.6 752.30.0 0.0 0.0 0.1 0.1 0.1 0.1 0.1 0.1 0.1 0.1 0.0 0.0 0.0 0.0
Page 29 of 47
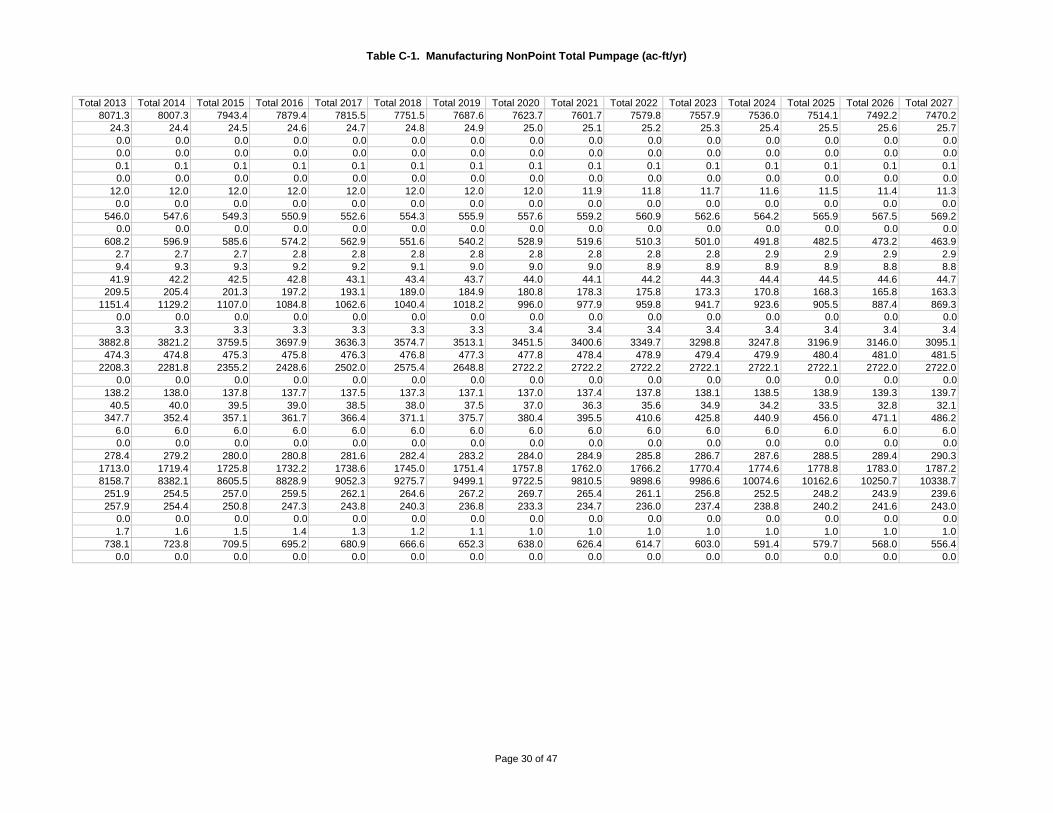
Table C-1. Manufacturing NonPoint Total Pumpage (ac-ft/yr)
Total 2013 Total 2014 Total 2015 Total 2016 Total 2017 Total 2018 Total 2019 Total 2020 Total 2021 Total 2022 Total 2023 Total 2024 Total 2025 Total 2026 Total 20278071.3 8007.3 7943.4 7879.4 7815.5 7751.5 7687.6 7623.7 7601.7 7579.8 7557.9 7536.0 7514.1 7492.2 7470.2
24.3 24.4 24.5 24.6 24.7 24.8 24.9 25.0 25.1 25.2 25.3 25.4 25.5 25.6 25.70.0 0.0 0.0 0.0 0.0 0.0 0.0 0.0 0.0 0.0 0.0 0.0 0.0 0.0 0.00.0 0.0 0.0 0.0 0.0 0.0 0.0 0.0 0.0 0.0 0.0 0.0 0.0 0.0 0.00.1 0.1 0.1 0.1 0.1 0.1 0.1 0.1 0.1 0.1 0.1 0.1 0.1 0.1 0.10.0 0.0 0.0 0.0 0.0 0.0 0.0 0.0 0.0 0.0 0.0 0.0 0.0 0.0 0.0
12.0 12.0 12.0 12.0 12.0 12.0 12.0 12.0 11.9 11.8 11.7 11.6 11.5 11.4 11.30.0 0.0 0.0 0.0 0.0 0.0 0.0 0.0 0.0 0.0 0.0 0.0 0.0 0.0 0.0
546.0 547.6 549.3 550.9 552.6 554.3 555.9 557.6 559.2 560.9 562.6 564.2 565.9 567.5 569.20.0 0.0 0.0 0.0 0.0 0.0 0.0 0.0 0.0 0.0 0.0 0.0 0.0 0.0 0.0
608.2 596.9 585.6 574.2 562.9 551.6 540.2 528.9 519.6 510.3 501.0 491.8 482.5 473.2 463.92.7 2.7 2.7 2.8 2.8 2.8 2.8 2.8 2.8 2.8 2.8 2.9 2.9 2.9 2.99.4 9.3 9.3 9.2 9.2 9.1 9.0 9.0 9.0 8.9 8.9 8.9 8.9 8.8 8.8
41.9 42.2 42.5 42.8 43.1 43.4 43.7 44.0 44.1 44.2 44.3 44.4 44.5 44.6 44.7209.5 205.4 201.3 197.2 193.1 189.0 184.9 180.8 178.3 175.8 173.3 170.8 168.3 165.8 163.3
1151.4 1129.2 1107.0 1084.8 1062.6 1040.4 1018.2 996.0 977.9 959.8 941.7 923.6 905.5 887.4 869.30.0 0.0 0.0 0.0 0.0 0.0 0.0 0.0 0.0 0.0 0.0 0.0 0.0 0.0 0.03.3 3.3 3.3 3.3 3.3 3.3 3.3 3.4 3.4 3.4 3.4 3.4 3.4 3.4 3.4
3882.8 3821.2 3759.5 3697.9 3636.3 3574.7 3513.1 3451.5 3400.6 3349.7 3298.8 3247.8 3196.9 3146.0 3095.1474.3 474.8 475.3 475.8 476.3 476.8 477.3 477.8 478.4 478.9 479.4 479.9 480.4 481.0 481.5
2208.3 2281.8 2355.2 2428.6 2502.0 2575.4 2648.8 2722.2 2722.2 2722.2 2722.1 2722.1 2722.1 2722.0 2722.00.0 0.0 0.0 0.0 0.0 0.0 0.0 0.0 0.0 0.0 0.0 0.0 0.0 0.0 0.0
138.2 138.0 137.8 137.7 137.5 137.3 137.1 137.0 137.4 137.8 138.1 138.5 138.9 139.3 139.740.5 40.0 39.5 39.0 38.5 38.0 37.5 37.0 36.3 35.6 34.9 34.2 33.5 32.8 32.1
347.7 352.4 357.1 361.7 366.4 371.1 375.7 380.4 395.5 410.6 425.8 440.9 456.0 471.1 486.26.0 6.0 6.0 6.0 6.0 6.0 6.0 6.0 6.0 6.0 6.0 6.0 6.0 6.0 6.00.0 0.0 0.0 0.0 0.0 0.0 0.0 0.0 0.0 0.0 0.0 0.0 0.0 0.0 0.0
278.4 279.2 280.0 280.8 281.6 282.4 283.2 284.0 284.9 285.8 286.7 287.6 288.5 289.4 290.31713.0 1719.4 1725.8 1732.2 1738.6 1745.0 1751.4 1757.8 1762.0 1766.2 1770.4 1774.6 1778.8 1783.0 1787.28158.7 8382.1 8605.5 8828.9 9052.3 9275.7 9499.1 9722.5 9810.5 9898.6 9986.6 10074.6 10162.6 10250.7 10338.7251.9 254.5 257.0 259.5 262.1 264.6 267.2 269.7 265.4 261.1 256.8 252.5 248.2 243.9 239.6257.9 254.4 250.8 247.3 243.8 240.3 236.8 233.3 234.7 236.0 237.4 238.8 240.2 241.6 243.0
0.0 0.0 0.0 0.0 0.0 0.0 0.0 0.0 0.0 0.0 0.0 0.0 0.0 0.0 0.01.7 1.6 1.5 1.4 1.3 1.2 1.1 1.0 1.0 1.0 1.0 1.0 1.0 1.0 1.0
738.1 723.8 709.5 695.2 680.9 666.6 652.3 638.0 626.4 614.7 603.0 591.4 579.7 568.0 556.40.0 0.0 0.0 0.0 0.0 0.0 0.0 0.0 0.0 0.0 0.0 0.0 0.0 0.0 0.0
Page 30 of 47

Table C-1. Manufacturing NonPoint Total Pumpage (ac-ft/yr)
Total 2028 Total 2029 Total 2030 Total 2031 Total 2032 Total 2033 Total 2034 Total 2035 Total 2036 Total 2037 Total 2038 Total 2039 Total 2040 Total 2041 Total 20427448.3 7426.4 7404.5 7391.3 7378.2 7365.0 7351.9 7338.7 7325.6 7312.4 7299.3 7286.1 7273.0 7270.0 7266.9
25.8 25.9 26.0 26.0 26.0 26.0 26.0 26.0 26.0 26.0 26.0 26.0 26.0 26.0 26.00.0 0.0 0.0 0.0 0.0 0.0 0.0 0.0 0.0 0.0 0.0 0.0 0.0 0.0 0.00.0 0.0 0.0 0.0 0.0 0.0 0.0 0.0 0.0 0.0 0.0 0.0 0.0 0.0 0.00.1 0.1 0.1 0.1 0.1 0.1 0.1 0.1 0.1 0.1 0.1 0.2 0.2 0.2 0.20.0 0.0 0.0 0.0 0.0 0.0 0.0 0.0 0.0 0.0 0.0 0.0 0.0 0.0 0.0
11.2 11.1 11.0 11.0 11.0 11.0 11.0 11.0 11.0 11.0 11.0 11.0 11.0 10.9 10.80.0 0.0 0.0 0.0 0.0 0.0 0.0 0.0 0.0 0.0 0.0 0.0 0.0 0.0 0.0
570.9 572.5 574.2 575.8 577.5 579.2 580.8 582.5 584.1 585.8 587.5 589.1 590.8 592.4 594.10.0 0.0 0.0 0.0 0.0 0.0 0.0 0.0 0.0 0.0 0.0 0.0 0.0 0.0 0.0
454.6 445.3 436.0 428.6 421.1 413.6 406.1 398.7 391.2 383.7 376.2 368.7 361.3 355.1 349.02.9 2.9 2.9 3.0 3.0 3.0 3.0 3.0 3.1 3.1 3.1 3.1 3.2 3.2 3.28.8 8.8 8.7 8.7 8.7 8.7 8.7 8.7 8.7 8.6 8.6 8.6 8.6 8.6 8.6
44.8 44.9 45.0 45.1 45.2 45.3 45.4 45.5 45.6 45.7 45.8 45.9 46.0 46.1 46.2160.8 158.2 155.7 153.4 151.1 148.7 146.4 144.0 141.7 139.4 137.0 134.7 132.3 130.5 128.6851.2 833.1 815.0 800.3 785.6 770.9 756.2 741.5 726.8 712.1 697.4 682.7 668.0 655.9 643.8
0.0 0.0 0.0 0.0 0.0 0.0 0.0 0.0 0.0 0.0 0.0 0.0 0.0 0.0 0.03.5 3.5 3.5 3.5 3.5 3.6 3.6 3.6 3.6 3.7 3.7 3.7 3.8 4.0 4.2
3044.2 2993.3 2942.3 2901.4 2860.5 2819.6 2778.7 2737.8 2696.9 2656.0 2615.1 2574.2 2533.2 2495.6 2458.0482.0 482.5 483.1 483.6 484.2 484.7 485.2 485.8 486.3 486.9 487.4 488.0 488.5 488.7 488.9
2722.0 2721.9 2721.9 2721.9 2721.9 2721.8 2721.8 2721.8 2721.8 2721.8 2721.7 2721.7 2721.7 2774.7 2827.70.0 0.0 0.0 0.0 0.0 0.0 0.0 0.0 0.0 0.0 0.0 0.0 0.0 0.0 0.0
140.1 140.5 140.9 142.6 144.3 146.0 147.7 149.4 151.1 152.8 154.5 156.2 157.9 159.7 161.531.4 30.7 30.0 29.6 29.2 28.8 28.4 28.0 27.6 27.2 26.8 26.4 26.0 25.6 25.2
501.4 516.5 531.6 537.3 543.0 548.7 554.4 560.1 565.8 571.6 577.3 583.0 588.7 594.5 600.46.0 6.0 6.0 5.9 5.8 5.7 5.6 5.5 5.4 5.3 5.2 5.1 5.0 5.1 5.20.0 0.0 0.0 0.0 0.0 0.0 0.0 0.0 0.0 0.0 0.0 0.0 0.0 0.0 0.0
291.2 292.1 293.0 293.9 294.8 295.7 296.6 297.5 298.4 299.3 300.2 301.1 302.0 271.8 241.61791.4 1795.6 1799.8 1812.3 1824.8 1837.3 1849.8 1862.3 1874.8 1887.3 1899.8 1912.3 1924.8 1936.5 1948.2
10426.7 10514.8 10602.8 9844.9 9087.0 8329.0 7571.1 6813.2 6055.3 5297.4 4539.5 3781.6 3023.7 2770.6 2517.5235.3 231.0 226.7 216.7 206.6 196.5 186.4 176.3 166.2 156.1 146.0 136.0 125.9 113.3 100.7244.3 245.7 247.1 242.7 238.3 234.0 229.6 225.2 220.8 216.4 212.0 207.6 203.3 196.1 189.0
0.0 0.0 0.0 0.0 0.0 0.0 0.0 0.0 0.0 0.0 0.0 0.0 0.0 0.0 0.01.0 1.0 1.0 0.9 0.8 0.7 0.6 0.5 0.4 0.3 0.2 0.1 0.0 0.0 0.0
544.7 533.1 521.4 511.8 502.2 492.7 483.1 473.5 463.9 454.3 444.8 435.2 425.6 417.9 410.20.0 0.0 0.0 0.0 0.0 0.0 0.0 0.0 0.0 0.0 0.0 0.0 0.0 0.0 0.0
Page 31 of 47

Table C-1. Manufacturing NonPoint Total Pumpage (ac-ft/yr)
Total 2043 Total 2044 Total 2045 Total 2046 Total 2047 Total 2048 Total 2049 Total 20507263.9 7260.9 7257.9 7254.9 7251.9 7248.8 7245.8 7242.8
26.0 26.0 26.0 26.0 26.0 26.0 26.0 26.00.0 0.0 0.0 0.0 0.0 0.0 0.0 0.00.0 0.0 0.0 0.0 0.0 0.0 0.0 0.00.2 0.2 0.2 0.2 0.2 0.2 0.2 0.20.0 0.0 0.0 0.0 0.0 0.0 0.0 0.0
10.7 10.6 10.5 10.4 10.3 10.2 10.1 10.00.0 0.0 0.0 0.0 0.0 0.0 0.0 0.0
595.8 597.4 599.1 600.7 602.4 604.1 605.7 607.40.0 0.0 0.0 0.0 0.0 0.0 0.0 0.0
342.9 336.8 330.6 324.5 318.4 312.2 306.1 300.03.2 3.2 3.3 3.3 3.3 3.3 3.3 3.38.6 8.6 8.6 8.6 8.6 8.6 8.6 8.6
46.3 46.4 46.5 46.6 46.7 46.8 46.9 47.0126.7 124.8 122.9 121.0 119.1 117.2 115.3 113.4631.7 619.6 607.5 595.4 583.3 571.2 559.1 547.0
0.0 0.0 0.0 0.0 0.0 0.0 0.0 0.04.4 4.7 4.9 5.1 5.4 5.6 5.8 6.1
2420.4 2382.8 2345.2 2307.6 2270.0 2232.4 2194.8 2157.2489.1 489.2 489.4 489.6 489.8 490.0 490.1 490.3
2880.7 2933.8 2986.8 3039.8 3092.8 3145.8 3198.8 3251.80.0 0.0 0.0 0.0 0.0 0.0 0.0 0.0
163.2 165.0 166.8 168.6 170.4 172.2 174.0 175.824.8 24.4 24.0 23.6 23.2 22.8 22.4 22.0
606.3 612.2 618.1 623.9 629.8 635.7 641.6 647.45.3 5.4 5.5 5.6 5.7 5.8 5.9 6.00.0 0.0 0.0 0.0 0.0 0.0 0.0 0.0
211.4 181.2 151.0 120.8 90.6 60.4 30.2 0.01959.9 1971.6 1983.3 1995.0 2006.7 2018.4 2030.1 2041.82264.4 2011.3 1758.2 1505.1 1252.0 998.9 745.8 492.7
88.1 75.5 62.9 50.3 37.8 25.2 12.6 0.0181.9 174.8 167.7 160.6 153.5 146.4 139.3 132.2
0.0 0.0 0.0 0.0 0.0 0.0 0.0 0.00.0 0.0 0.0 0.0 0.0 0.0 0.0 0.0
402.4 394.7 387.0 379.3 371.5 363.8 356.1 348.40.0 0.0 0.0 0.0 0.0 0.0 0.0 0.0
Page 32 of 47
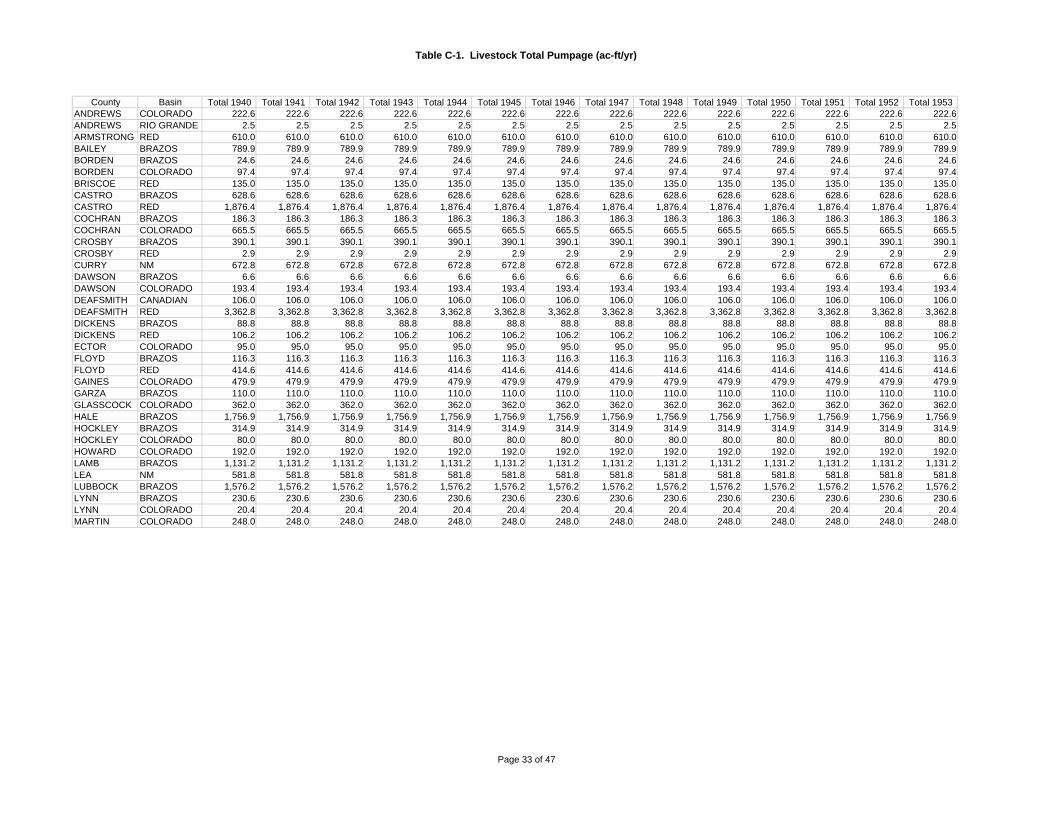
Table C-1. Livestock Total Pumpage (ac-ft/yr)
County Basin Total 1940 Total 1941 Total 1942 Total 1943 Total 1944 Total 1945 Total 1946 Total 1947 Total 1948 Total 1949 Total 1950 Total 1951 Total 1952 Total 1953ANDREWS COLORADO 222.6 222.6 222.6 222.6 222.6 222.6 222.6 222.6 222.6 222.6 222.6 222.6 222.6 222.6ANDREWS RIO GRANDE 2.5 2.5 2.5 2.5 2.5 2.5 2.5 2.5 2.5 2.5 2.5 2.5 2.5 2.5ARMSTRONG RED 610.0 610.0 610.0 610.0 610.0 610.0 610.0 610.0 610.0 610.0 610.0 610.0 610.0 610.0BAILEY BRAZOS 789.9 789.9 789.9 789.9 789.9 789.9 789.9 789.9 789.9 789.9 789.9 789.9 789.9 789.9BORDEN BRAZOS 24.6 24.6 24.6 24.6 24.6 24.6 24.6 24.6 24.6 24.6 24.6 24.6 24.6 24.6BORDEN COLORADO 97.4 97.4 97.4 97.4 97.4 97.4 97.4 97.4 97.4 97.4 97.4 97.4 97.4 97.4BRISCOE RED 135.0 135.0 135.0 135.0 135.0 135.0 135.0 135.0 135.0 135.0 135.0 135.0 135.0 135.0CASTRO BRAZOS 628.6 628.6 628.6 628.6 628.6 628.6 628.6 628.6 628.6 628.6 628.6 628.6 628.6 628.6CASTRO RED 1,876.4 1,876.4 1,876.4 1,876.4 1,876.4 1,876.4 1,876.4 1,876.4 1,876.4 1,876.4 1,876.4 1,876.4 1,876.4 1,876.4COCHRAN BRAZOS 186.3 186.3 186.3 186.3 186.3 186.3 186.3 186.3 186.3 186.3 186.3 186.3 186.3 186.3COCHRAN COLORADO 665.5 665.5 665.5 665.5 665.5 665.5 665.5 665.5 665.5 665.5 665.5 665.5 665.5 665.5CROSBY BRAZOS 390.1 390.1 390.1 390.1 390.1 390.1 390.1 390.1 390.1 390.1 390.1 390.1 390.1 390.1CROSBY RED 2.9 2.9 2.9 2.9 2.9 2.9 2.9 2.9 2.9 2.9 2.9 2.9 2.9 2.9CURRY NM 672.8 672.8 672.8 672.8 672.8 672.8 672.8 672.8 672.8 672.8 672.8 672.8 672.8 672.8DAWSON BRAZOS 6.6 6.6 6.6 6.6 6.6 6.6 6.6 6.6 6.6 6.6 6.6 6.6 6.6 6.6DAWSON COLORADO 193.4 193.4 193.4 193.4 193.4 193.4 193.4 193.4 193.4 193.4 193.4 193.4 193.4 193.4DEAFSMITH CANADIAN 106.0 106.0 106.0 106.0 106.0 106.0 106.0 106.0 106.0 106.0 106.0 106.0 106.0 106.0DEAFSMITH RED 3,362.8 3,362.8 3,362.8 3,362.8 3,362.8 3,362.8 3,362.8 3,362.8 3,362.8 3,362.8 3,362.8 3,362.8 3,362.8 3,362.8DICKENS BRAZOS 88.8 88.8 88.8 88.8 88.8 88.8 88.8 88.8 88.8 88.8 88.8 88.8 88.8 88.8DICKENS RED 106.2 106.2 106.2 106.2 106.2 106.2 106.2 106.2 106.2 106.2 106.2 106.2 106.2 106.2ECTOR COLORADO 95.0 95.0 95.0 95.0 95.0 95.0 95.0 95.0 95.0 95.0 95.0 95.0 95.0 95.0FLOYD BRAZOS 116.3 116.3 116.3 116.3 116.3 116.3 116.3 116.3 116.3 116.3 116.3 116.3 116.3 116.3FLOYD RED 414.6 414.6 414.6 414.6 414.6 414.6 414.6 414.6 414.6 414.6 414.6 414.6 414.6 414.6GAINES COLORADO 479.9 479.9 479.9 479.9 479.9 479.9 479.9 479.9 479.9 479.9 479.9 479.9 479.9 479.9GARZA BRAZOS 110.0 110.0 110.0 110.0 110.0 110.0 110.0 110.0 110.0 110.0 110.0 110.0 110.0 110.0GLASSCOCK COLORADO 362.0 362.0 362.0 362.0 362.0 362.0 362.0 362.0 362.0 362.0 362.0 362.0 362.0 362.0HALE BRAZOS 1,756.9 1,756.9 1,756.9 1,756.9 1,756.9 1,756.9 1,756.9 1,756.9 1,756.9 1,756.9 1,756.9 1,756.9 1,756.9 1,756.9HOCKLEY BRAZOS 314.9 314.9 314.9 314.9 314.9 314.9 314.9 314.9 314.9 314.9 314.9 314.9 314.9 314.9HOCKLEY COLORADO 80.0 80.0 80.0 80.0 80.0 80.0 80.0 80.0 80.0 80.0 80.0 80.0 80.0 80.0HOWARD COLORADO 192.0 192.0 192.0 192.0 192.0 192.0 192.0 192.0 192.0 192.0 192.0 192.0 192.0 192.0LAMB BRAZOS 1,131.2 1,131.2 1,131.2 1,131.2 1,131.2 1,131.2 1,131.2 1,131.2 1,131.2 1,131.2 1,131.2 1,131.2 1,131.2 1,131.2LEA NM 581.8 581.8 581.8 581.8 581.8 581.8 581.8 581.8 581.8 581.8 581.8 581.8 581.8 581.8LUBBOCK BRAZOS 1,576.2 1,576.2 1,576.2 1,576.2 1,576.2 1,576.2 1,576.2 1,576.2 1,576.2 1,576.2 1,576.2 1,576.2 1,576.2 1,576.2LYNN BRAZOS 230.6 230.6 230.6 230.6 230.6 230.6 230.6 230.6 230.6 230.6 230.6 230.6 230.6 230.6LYNN COLORADO 20.4 20.4 20.4 20.4 20.4 20.4 20.4 20.4 20.4 20.4 20.4 20.4 20.4 20.4MARTIN COLORADO 248.0 248.0 248.0 248.0 248.0 248.0 248.0 248.0 248.0 248.0 248.0 248.0 248.0 248.0
Page 33 of 47

Table C-1. Livestock Total Pumpage (ac-ft/yr)
Total 1954 Total 1955 Total 1956 Total 1957 Total 1958 Total 1959 Total 1960 Total 1961 Total 1962 Total 1963 Total 1964 Total 1965 Total 1966 Total 1967222.6 222.6 222.6 222.6 222.6 222.6 222.6 222.6 222.6 222.6 222.6 222.6 222.6 222.6
2.5 2.5 2.5 2.5 2.5 2.5 2.5 2.5 2.5 2.5 2.5 2.5 2.5 2.5610.0 610.0 610.0 610.0 610.0 610.0 610.0 610.0 610.0 610.0 610.0 610.0 610.0 610.0789.9 789.9 789.9 789.9 789.9 789.9 789.9 789.9 789.9 789.9 789.9 789.9 789.9 789.924.6 24.6 24.6 24.6 24.6 24.6 24.6 24.6 24.6 24.6 24.6 24.6 24.6 24.697.4 97.4 97.4 97.4 97.4 97.4 97.4 97.4 97.4 97.4 97.4 97.4 97.4 97.4
135.0 135.0 135.0 135.0 135.0 135.0 135.0 135.0 135.0 135.0 135.0 135.0 135.0 135.0628.6 628.6 628.6 628.6 628.6 628.6 628.6 628.6 628.6 628.6 628.6 628.6 628.6 628.6
1,876.4 1,876.4 1,876.4 1,876.4 1,876.4 1,876.4 1,876.4 1,876.4 1,876.4 1,876.4 1,876.4 1,876.4 1,876.4 1,876.4186.3 186.3 186.3 186.3 186.3 186.3 186.3 186.3 186.3 186.3 186.3 186.3 186.3 186.3665.5 665.5 665.5 665.5 665.5 665.5 665.5 665.5 665.5 665.5 665.5 665.5 665.5 665.5390.1 390.1 390.1 390.1 390.1 390.1 390.1 390.1 390.1 390.1 390.1 390.1 390.1 390.1
2.9 2.9 2.9 2.9 2.9 2.9 2.9 2.9 2.9 2.9 2.9 2.9 2.9 2.9672.8 672.8 672.8 672.8 672.8 672.8 672.8 672.8 672.8 672.8 672.8 672.8 672.8 672.8
6.6 6.6 6.6 6.6 6.6 6.6 6.6 6.6 6.6 6.6 6.6 6.6 6.6 6.6193.4 193.4 193.4 193.4 193.4 193.4 193.4 193.4 193.4 193.4 193.4 193.4 193.4 193.4106.0 106.0 106.0 106.0 106.0 106.0 106.0 106.0 106.0 106.0 106.0 106.0 106.0 106.0
3,362.8 3,362.8 3,362.8 3,362.8 3,362.8 3,362.8 3,362.8 3,362.8 3,362.8 3,362.8 3,362.8 3,362.8 3,362.8 3,362.888.8 88.8 88.8 88.8 88.8 88.8 88.8 88.8 88.8 88.8 88.8 88.8 88.8 88.8
106.2 106.2 106.2 106.2 106.2 106.2 106.2 106.2 106.2 106.2 106.2 106.2 106.2 106.295.0 95.0 95.0 95.0 95.0 95.0 95.0 95.0 95.0 95.0 95.0 95.0 95.0 95.0
116.3 116.3 116.3 116.3 116.3 116.3 116.3 116.3 116.3 116.3 116.3 116.3 116.3 116.3414.6 414.6 414.6 414.6 414.6 414.6 414.6 414.6 414.6 414.6 414.6 414.6 414.6 414.6479.9 479.9 479.9 479.9 479.9 479.9 479.9 479.9 479.9 479.9 479.9 479.9 479.9 479.9110.0 110.0 110.0 110.0 110.0 110.0 110.0 110.0 110.0 110.0 110.0 110.0 110.0 110.0362.0 362.0 362.0 362.0 362.0 362.0 362.0 362.0 362.0 362.0 362.0 362.0 362.0 362.0
1,756.9 1,756.9 1,756.9 1,756.9 1,756.9 1,756.9 1,756.9 1,756.9 1,756.9 1,756.9 1,756.9 1,756.9 1,756.9 1,756.9314.9 314.9 314.9 314.9 314.9 314.9 314.9 314.9 314.9 314.9 314.9 314.9 314.9 314.980.0 80.0 80.0 80.0 80.0 80.0 80.0 80.0 80.0 80.0 80.0 80.0 80.0 80.0
192.0 192.0 192.0 192.0 192.0 192.0 192.0 192.0 192.0 192.0 192.0 192.0 192.0 192.01,131.2 1,131.2 1,131.2 1,131.2 1,131.2 1,131.2 1,131.2 1,131.2 1,131.2 1,131.2 1,131.2 1,131.2 1,131.2 1,131.2
581.8 581.8 581.8 581.8 581.8 581.8 581.8 581.8 581.8 581.8 581.8 581.8 581.8 581.81,576.2 1,576.2 1,576.2 1,576.2 1,576.2 1,576.2 1,576.2 1,576.2 1,576.2 1,576.2 1,576.2 1,576.2 1,576.2 1,576.2
230.6 230.6 230.6 230.6 230.6 230.6 230.6 230.6 230.6 230.6 230.6 230.6 230.6 230.620.4 20.4 20.4 20.4 20.4 20.4 20.4 20.4 20.4 20.4 20.4 20.4 20.4 20.4
248.0 248.0 248.0 248.0 248.0 248.0 248.0 248.0 248.0 248.0 248.0 248.0 248.0 248.0
Page 34 of 47

Table C-1. Livestock Total Pumpage (ac-ft/yr)
Total 1968 Total 1969 Total 1970 Total 1971 Total 1972 Total 1973 Total 1974 Total 1975 Total 1976 Total 1977 Total 1978 Total 1979 Total 1980 Total 1981 Total 1982222.6 222.6 222.6 222.6 222.6 222.6 222.6 231.5 240.4 250.3 243.4 236.4 189.9 225.7 261.4
2.5 2.5 2.5 2.5 2.5 2.5 2.5 2.6 2.7 2.8 2.7 2.7 42.0 50.0 58.0610.0 610.0 610.0 610.0 610.0 610.0 610.0 601.0 592.0 582.0 613.0 644.0 675.0 618.0 561.0789.9 789.9 789.9 789.9 789.9 789.9 789.9 653.9 517.9 381.9 483.9 585.9 687.9 780.1 872.424.6 24.6 24.6 24.6 24.6 24.6 24.6 19.8 14.9 10.3 9.9 9.5 1.0 1.0 1.097.4 97.4 97.4 97.4 97.4 97.4 97.4 78.2 59.1 40.7 39.1 37.5 45.0 42.5 40.0
135.0 135.0 135.0 135.0 135.0 135.0 135.0 267.0 399.1 531.1 535.1 539.1 543.1 475.1 407.1628.6 628.6 628.6 628.6 628.6 628.6 628.6 678.5 728.4 778.4 783.4 788.4 1,647.0 1,742.5 1,838.0
1,876.4 1,876.4 1,876.4 1,876.4 1,876.4 1,876.4 1,876.4 2,025.5 2,174.5 2,323.6 2,338.6 2,353.6 1,514.0 1,602.0 1,690.0186.3 186.3 186.3 186.3 186.3 186.3 186.3 183.9 181.5 179.3 165.5 151.7 224.0 232.5 241.0665.5 665.5 665.5 665.5 665.5 665.5 665.5 656.9 648.3 640.5 591.3 542.1 406.1 422.1 438.1390.1 390.1 390.1 390.1 390.1 390.1 390.1 388.1 386.1 384.1 370.2 356.3 332.0 322.8 313.5
2.9 2.9 2.9 2.9 2.9 2.9 2.9 2.9 2.9 2.8 2.7 2.6 14.0 13.5 13.0672.8 672.8 800.0 766.0 732.0 697.0 663.0 629.0 624.0 619.0 613.0 608.0 603.0 614.2 625.5
6.6 6.6 6.6 6.6 6.6 6.6 6.6 15.3 23.9 32.5 22.6 12.7 1.0 1.0 1.0193.4 193.4 193.4 193.4 193.4 193.4 193.4 443.8 694.2 945.6 657.5 369.4 84.0 87.3 90.5106.0 106.0 106.0 106.0 106.0 106.0 106.0 126.9 147.9 168.8 172.1 175.4 321.0 377.5 434.0
3,362.8 3,362.8 3,362.8 3,362.8 3,362.8 3,362.8 3,362.8 4,027.7 4,692.7 5,357.7 5,462.4 5,567.1 5,528.4 6,497.3 7,466.288.8 88.8 88.8 88.8 88.8 88.8 88.8 72.4 56.0 39.2 37.8 36.4 45.0 41.2 37.5
106.2 106.2 106.2 106.2 106.2 106.2 106.2 86.6 67.0 46.8 45.2 43.6 31.0 28.2 25.595.0 95.0 95.0 95.0 95.0 95.0 95.0 124.0 153.0 181.0 159.0 137.0 79.0 109.0 139.0
116.3 116.3 116.3 116.3 116.3 116.3 116.3 140.4 164.5 188.6 189.0 189.5 277.0 277.7 278.5414.6 414.6 414.6 414.6 414.6 414.6 414.6 500.5 586.4 672.2 673.8 675.4 589.9 591.4 592.9479.9 479.9 479.9 479.9 479.9 479.9 479.9 424.9 369.9 314.9 365.9 416.9 467.9 500.1 532.3110.0 110.0 110.0 110.0 110.0 110.0 110.0 94.0 78.0 63.0 57.0 51.0 44.0 45.0 46.0362.0 362.0 362.0 362.0 362.0 362.0 362.0 332.0 302.0 271.0 262.0 253.0 243.0 260.7 278.5
1,756.9 1,756.9 1,756.9 1,756.9 1,756.9 1,756.9 1,756.9 1,642.9 1,528.9 1,414.9 1,445.9 1,476.9 1,505.9 1,456.7 1,407.4314.9 314.9 314.9 314.9 314.9 314.9 314.9 352.4 389.9 426.5 401.0 375.5 377.9 367.4 356.980.0 80.0 80.0 80.0 80.0 80.0 80.0 89.6 99.1 108.4 101.9 95.4 60.0 58.3 56.5
192.0 192.0 192.0 192.0 192.0 192.0 192.0 179.0 166.0 154.0 163.0 172.0 181.0 197.2 213.51,131.2 1,131.2 1,131.2 1,131.2 1,131.2 1,131.2 1,131.2 1,208.2 1,285.2 1,362.2 1,272.2 1,182.2 1,092.2 1,348.5 1,604.7
581.8 581.8 899.7 822.7 744.7 667.7 589.8 512.8 513.8 514.8 516.8 517.8 518.8 494.3 469.81,576.2 1,576.2 1,576.2 1,576.2 1,576.2 1,576.2 1,576.2 1,452.2 1,328.2 1,205.2 1,188.2 1,171.2 1,155.2 1,305.9 1,456.7
230.6 230.6 230.6 230.6 230.6 230.6 230.6 206.7 182.8 158.9 155.3 151.6 151.0 164.0 177.020.4 20.4 20.4 20.4 20.4 20.4 20.4 18.3 16.1 14.0 13.7 13.4 11.0 12.0 13.0
248.0 248.0 248.0 248.0 248.0 248.0 248.0 226.0 204.0 182.0 164.0 146.0 128.0 160.7 193.5
Page 35 of 47

Table C-1. Livestock Total Pumpage (ac-ft/yr)
Total 1983 Total 1984 Total 1985 Total 1986 Total 1987 Total 1988 Total 1989 Total 1990 Total 1991 Total 1992 Total 1993 Total 1994 Total 1995 Total 1996 Total 1997297.1 332.9 244.9 178.9 135.0 57.0 150.9 148.9 151.9 236.9 239.9 247.9 285.9 274.9 289.966.0 74.0 54.0 39.0 30.0 12.0 33.0 33.0 34.0 53.0 53.0 55.0 64.0 61.0 65.0
504.0 447.0 468.0 492.0 517.0 497.0 517.0 518.0 529.0 853.0 926.0 669.0 504.0 493.0 513.0964.6 1,056.8 1,271.8 1,959.7 1,338.8 1,017.9 1,014.9 1,111.8 1,137.8 1,603.8 1,934.7 1,752.7 2,074.7 1,977.7 1,555.8
1.0 1.0 0.0 1.0 0.0 0.0 0.0 0.0 1.0 1.0 1.0 2.0 2.0 1.0 1.037.5 35.0 23.0 28.0 17.0 19.0 18.0 18.0 19.0 22.0 22.0 41.0 41.0 27.0 27.0
339.0 271.0 204.0 217.0 150.0 163.0 161.0 159.0 162.0 215.0 242.0 242.0 243.0 202.0 161.01,933.5 2,029.0 2,535.0 2,089.0 2,089.0 1,201.0 1,230.0 1,408.0 1,448.0 2,895.0 3,344.0 3,764.0 3,869.0 3,655.0 3,978.01,778.0 1,866.0 2,330.9 1,920.0 1,921.0 1,104.0 1,131.0 1,294.0 1,331.0 2,660.9 3,073.9 3,459.9 3,556.9 3,360.9 3,656.9
249.5 258.0 335.0 301.0 238.0 152.0 150.0 168.0 173.0 233.0 262.0 208.0 248.0 236.0 242.0454.1 470.1 609.2 547.1 432.1 276.1 272.1 306.1 315.1 424.1 476.1 377.1 450.1 429.1 440.1304.3 295.0 291.0 202.0 203.0 218.0 214.0 212.0 217.0 218.0 243.0 228.0 214.0 201.0 162.012.5 12.0 12.0 8.0 8.0 9.0 9.0 9.0 9.0 9.0 10.0 10.0 9.0 9.0 7.0
636.7 648.0 659.0 759.0 858.0 958.0 1,058.0 1,157.0 1,256.9 1,356.9 1,455.9 1,555.9 2,355.9 2,355.9 2,355.91.0 1.0 1.0 2.0 1.0 1.0 1.0 1.0 2.0 3.0 3.0 2.0 2.0 3.0 4.0
93.8 97.0 85.0 98.0 73.0 80.0 79.0 78.0 80.0 133.0 133.0 93.0 118.0 131.0 186.1490.5 547.0 635.0 575.0 565.0 347.0 355.0 395.0 406.0 719.0 820.0 766.0 837.0 932.0 962.0
8,435.1 9,404.0 10,921.9 9,892.0 9,709.0 5,976.4 6,103.4 6,801.3 6,976.3 12,350.7 14,085.5 13,167.6 14,372.5 16,017.3 16,530.333.7 30.0 30.0 30.0 32.0 35.0 35.0 35.0 36.0 33.0 53.0 28.0 23.0 20.0 15.022.7 20.0 20.0 20.0 22.0 23.0 24.0 23.0 24.0 22.0 36.0 19.0 15.0 13.0 10.0
169.0 199.0 188.0 243.0 188.0 207.0 193.0 191.0 195.0 118.0 107.0 183.0 183.0 161.0 194.0279.2 280.0 352.0 287.0 291.0 193.0 199.0 217.0 223.0 382.0 413.0 404.0 406.0 590.0 486.0594.4 595.9 747.9 609.9 618.9 410.9 422.9 460.9 472.9 811.9 878.9 858.9 863.9 1,252.8 1,032.8564.6 596.8 677.8 590.8 586.8 405.9 399.9 440.9 451.9 873.7 917.7 1,006.7 1,073.7 1,636.5 1,505.647.0 48.0 33.0 34.0 39.0 42.0 42.0 41.0 42.0 32.0 32.0 47.0 51.0 51.0 44.0
296.2 314.0 261.0 170.0 211.0 224.0 220.0 218.0 223.0 161.0 157.0 156.0 169.0 127.0 154.01,358.2 1,309.0 1,351.9 1,337.9 1,286.0 621.0 606.0 679.0 699.0 1,472.9 1,608.9 1,780.9 2,051.9 2,036.9 2,097.9
346.4 335.9 450.9 351.9 370.9 202.0 199.0 226.0 233.0 585.9 628.9 459.9 456.9 468.9 373.954.8 53.0 72.0 56.0 59.0 32.0 31.0 36.0 37.0 94.0 101.0 74.0 73.0 75.0 60.0
229.7 246.0 165.0 193.0 179.0 198.0 196.0 193.0 197.0 264.0 263.0 227.0 225.0 195.0 293.01,861.0 2,117.3 2,384.4 1,959.3 2,229.3 1,564.2 1,568.2 1,734.3 1,773.3 2,399.4 2,571.4 2,483.4 3,418.5 2,348.4 2,962.4
445.3 420.8 395.8 459.8 523.8 587.8 651.8 714.7 778.7 842.7 906.7 970.6 1,347.5 1,347.5 1,347.51,607.5 1,758.2 1,866.3 1,842.3 2,015.3 1,352.2 1,355.2 1,509.2 1,550.2 2,172.3 2,330.3 1,769.2 2,042.3 2,345.3 1,988.3
190.0 203.0 128.0 154.0 191.0 207.0 205.0 202.0 206.0 142.0 180.0 155.0 142.0 155.0 132.014.0 15.0 9.0 11.0 14.0 15.0 15.0 15.0 16.0 11.0 14.0 12.0 11.0 12.0 10.0
226.2 259.0 165.0 191.0 299.0 319.0 315.0 310.0 317.0 290.0 292.0 211.0 251.0 209.0 222.0
Page 36 of 47
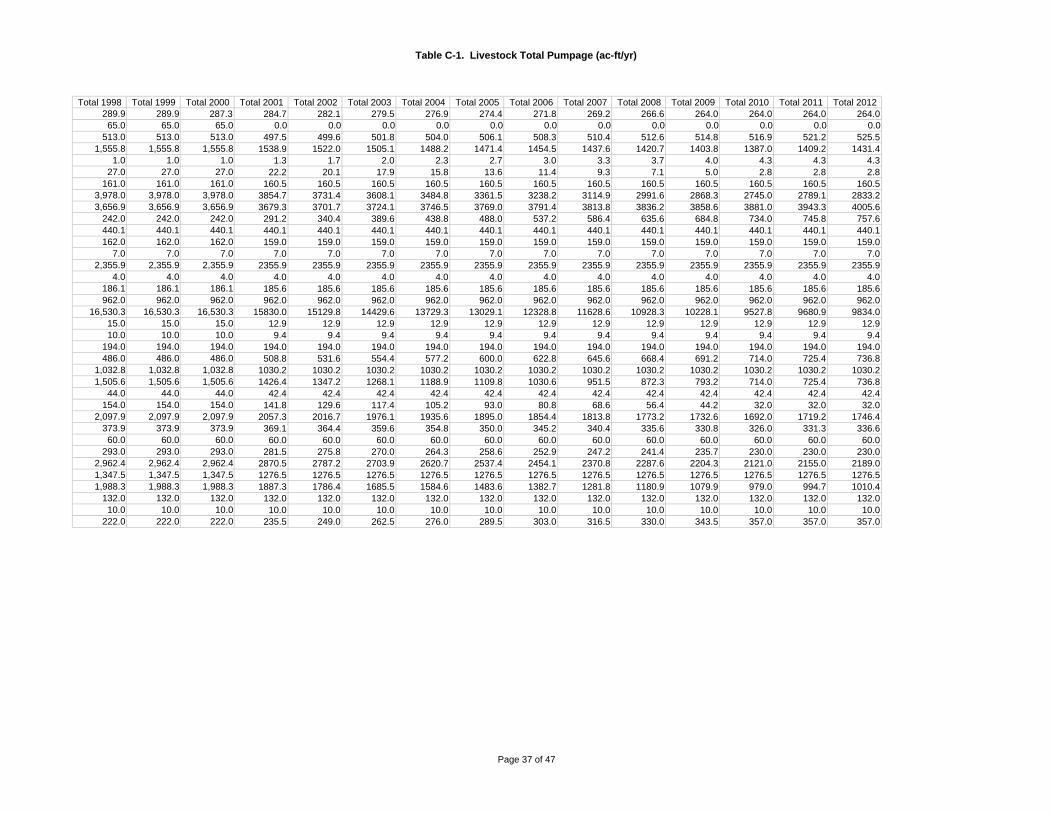
Table C-1. Livestock Total Pumpage (ac-ft/yr)
Total 1998 Total 1999 Total 2000 Total 2001 Total 2002 Total 2003 Total 2004 Total 2005 Total 2006 Total 2007 Total 2008 Total 2009 Total 2010 Total 2011 Total 2012289.9 289.9 287.3 284.7 282.1 279.5 276.9 274.4 271.8 269.2 266.6 264.0 264.0 264.0 264.065.0 65.0 65.0 0.0 0.0 0.0 0.0 0.0 0.0 0.0 0.0 0.0 0.0 0.0 0.0
513.0 513.0 513.0 497.5 499.6 501.8 504.0 506.1 508.3 510.4 512.6 514.8 516.9 521.2 525.51,555.8 1,555.8 1,555.8 1538.9 1522.0 1505.1 1488.2 1471.4 1454.5 1437.6 1420.7 1403.8 1387.0 1409.2 1431.4
1.0 1.0 1.0 1.3 1.7 2.0 2.3 2.7 3.0 3.3 3.7 4.0 4.3 4.3 4.327.0 27.0 27.0 22.2 20.1 17.9 15.8 13.6 11.4 9.3 7.1 5.0 2.8 2.8 2.8
161.0 161.0 161.0 160.5 160.5 160.5 160.5 160.5 160.5 160.5 160.5 160.5 160.5 160.5 160.53,978.0 3,978.0 3,978.0 3854.7 3731.4 3608.1 3484.8 3361.5 3238.2 3114.9 2991.6 2868.3 2745.0 2789.1 2833.23,656.9 3,656.9 3,656.9 3679.3 3701.7 3724.1 3746.5 3769.0 3791.4 3813.8 3836.2 3858.6 3881.0 3943.3 4005.6
242.0 242.0 242.0 291.2 340.4 389.6 438.8 488.0 537.2 586.4 635.6 684.8 734.0 745.8 757.6440.1 440.1 440.1 440.1 440.1 440.1 440.1 440.1 440.1 440.1 440.1 440.1 440.1 440.1 440.1162.0 162.0 162.0 159.0 159.0 159.0 159.0 159.0 159.0 159.0 159.0 159.0 159.0 159.0 159.0
7.0 7.0 7.0 7.0 7.0 7.0 7.0 7.0 7.0 7.0 7.0 7.0 7.0 7.0 7.02,355.9 2,355.9 2,355.9 2355.9 2355.9 2355.9 2355.9 2355.9 2355.9 2355.9 2355.9 2355.9 2355.9 2355.9 2355.9
4.0 4.0 4.0 4.0 4.0 4.0 4.0 4.0 4.0 4.0 4.0 4.0 4.0 4.0 4.0186.1 186.1 186.1 185.6 185.6 185.6 185.6 185.6 185.6 185.6 185.6 185.6 185.6 185.6 185.6962.0 962.0 962.0 962.0 962.0 962.0 962.0 962.0 962.0 962.0 962.0 962.0 962.0 962.0 962.0
16,530.3 16,530.3 16,530.3 15830.0 15129.8 14429.6 13729.3 13029.1 12328.8 11628.6 10928.3 10228.1 9527.8 9680.9 9834.015.0 15.0 15.0 12.9 12.9 12.9 12.9 12.9 12.9 12.9 12.9 12.9 12.9 12.9 12.910.0 10.0 10.0 9.4 9.4 9.4 9.4 9.4 9.4 9.4 9.4 9.4 9.4 9.4 9.4
194.0 194.0 194.0 194.0 194.0 194.0 194.0 194.0 194.0 194.0 194.0 194.0 194.0 194.0 194.0486.0 486.0 486.0 508.8 531.6 554.4 577.2 600.0 622.8 645.6 668.4 691.2 714.0 725.4 736.8
1,032.8 1,032.8 1,032.8 1030.2 1030.2 1030.2 1030.2 1030.2 1030.2 1030.2 1030.2 1030.2 1030.2 1030.2 1030.21,505.6 1,505.6 1,505.6 1426.4 1347.2 1268.1 1188.9 1109.8 1030.6 951.5 872.3 793.2 714.0 725.4 736.8
44.0 44.0 44.0 42.4 42.4 42.4 42.4 42.4 42.4 42.4 42.4 42.4 42.4 42.4 42.4154.0 154.0 154.0 141.8 129.6 117.4 105.2 93.0 80.8 68.6 56.4 44.2 32.0 32.0 32.0
2,097.9 2,097.9 2,097.9 2057.3 2016.7 1976.1 1935.6 1895.0 1854.4 1813.8 1773.2 1732.6 1692.0 1719.2 1746.4373.9 373.9 373.9 369.1 364.4 359.6 354.8 350.0 345.2 340.4 335.6 330.8 326.0 331.3 336.660.0 60.0 60.0 60.0 60.0 60.0 60.0 60.0 60.0 60.0 60.0 60.0 60.0 60.0 60.0
293.0 293.0 293.0 281.5 275.8 270.0 264.3 258.6 252.9 247.2 241.4 235.7 230.0 230.0 230.02,962.4 2,962.4 2,962.4 2870.5 2787.2 2703.9 2620.7 2537.4 2454.1 2370.8 2287.6 2204.3 2121.0 2155.0 2189.01,347.5 1,347.5 1,347.5 1276.5 1276.5 1276.5 1276.5 1276.5 1276.5 1276.5 1276.5 1276.5 1276.5 1276.5 1276.51,988.3 1,988.3 1,988.3 1887.3 1786.4 1685.5 1584.6 1483.6 1382.7 1281.8 1180.9 1079.9 979.0 994.7 1010.4
132.0 132.0 132.0 132.0 132.0 132.0 132.0 132.0 132.0 132.0 132.0 132.0 132.0 132.0 132.010.0 10.0 10.0 10.0 10.0 10.0 10.0 10.0 10.0 10.0 10.0 10.0 10.0 10.0 10.0
222.0 222.0 222.0 235.5 249.0 262.5 276.0 289.5 303.0 316.5 330.0 343.5 357.0 357.0 357.0
Page 37 of 47
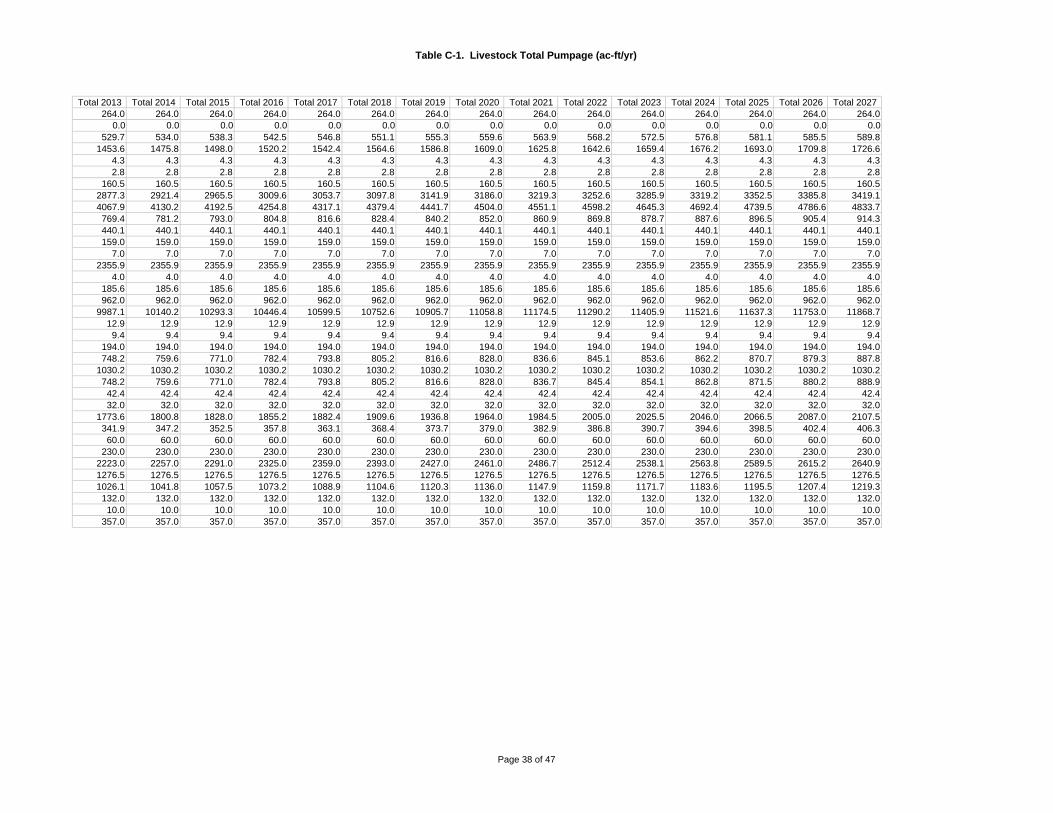
Table C-1. Livestock Total Pumpage (ac-ft/yr)
Total 2013 Total 2014 Total 2015 Total 2016 Total 2017 Total 2018 Total 2019 Total 2020 Total 2021 Total 2022 Total 2023 Total 2024 Total 2025 Total 2026 Total 2027264.0 264.0 264.0 264.0 264.0 264.0 264.0 264.0 264.0 264.0 264.0 264.0 264.0 264.0 264.0
0.0 0.0 0.0 0.0 0.0 0.0 0.0 0.0 0.0 0.0 0.0 0.0 0.0 0.0 0.0529.7 534.0 538.3 542.5 546.8 551.1 555.3 559.6 563.9 568.2 572.5 576.8 581.1 585.5 589.8
1453.6 1475.8 1498.0 1520.2 1542.4 1564.6 1586.8 1609.0 1625.8 1642.6 1659.4 1676.2 1693.0 1709.8 1726.64.3 4.3 4.3 4.3 4.3 4.3 4.3 4.3 4.3 4.3 4.3 4.3 4.3 4.3 4.32.8 2.8 2.8 2.8 2.8 2.8 2.8 2.8 2.8 2.8 2.8 2.8 2.8 2.8 2.8
160.5 160.5 160.5 160.5 160.5 160.5 160.5 160.5 160.5 160.5 160.5 160.5 160.5 160.5 160.52877.3 2921.4 2965.5 3009.6 3053.7 3097.8 3141.9 3186.0 3219.3 3252.6 3285.9 3319.2 3352.5 3385.8 3419.14067.9 4130.2 4192.5 4254.8 4317.1 4379.4 4441.7 4504.0 4551.1 4598.2 4645.3 4692.4 4739.5 4786.6 4833.7769.4 781.2 793.0 804.8 816.6 828.4 840.2 852.0 860.9 869.8 878.7 887.6 896.5 905.4 914.3440.1 440.1 440.1 440.1 440.1 440.1 440.1 440.1 440.1 440.1 440.1 440.1 440.1 440.1 440.1159.0 159.0 159.0 159.0 159.0 159.0 159.0 159.0 159.0 159.0 159.0 159.0 159.0 159.0 159.0
7.0 7.0 7.0 7.0 7.0 7.0 7.0 7.0 7.0 7.0 7.0 7.0 7.0 7.0 7.02355.9 2355.9 2355.9 2355.9 2355.9 2355.9 2355.9 2355.9 2355.9 2355.9 2355.9 2355.9 2355.9 2355.9 2355.9
4.0 4.0 4.0 4.0 4.0 4.0 4.0 4.0 4.0 4.0 4.0 4.0 4.0 4.0 4.0185.6 185.6 185.6 185.6 185.6 185.6 185.6 185.6 185.6 185.6 185.6 185.6 185.6 185.6 185.6962.0 962.0 962.0 962.0 962.0 962.0 962.0 962.0 962.0 962.0 962.0 962.0 962.0 962.0 962.0
9987.1 10140.2 10293.3 10446.4 10599.5 10752.6 10905.7 11058.8 11174.5 11290.2 11405.9 11521.6 11637.3 11753.0 11868.712.9 12.9 12.9 12.9 12.9 12.9 12.9 12.9 12.9 12.9 12.9 12.9 12.9 12.9 12.99.4 9.4 9.4 9.4 9.4 9.4 9.4 9.4 9.4 9.4 9.4 9.4 9.4 9.4 9.4
194.0 194.0 194.0 194.0 194.0 194.0 194.0 194.0 194.0 194.0 194.0 194.0 194.0 194.0 194.0748.2 759.6 771.0 782.4 793.8 805.2 816.6 828.0 836.6 845.1 853.6 862.2 870.7 879.3 887.8
1030.2 1030.2 1030.2 1030.2 1030.2 1030.2 1030.2 1030.2 1030.2 1030.2 1030.2 1030.2 1030.2 1030.2 1030.2748.2 759.6 771.0 782.4 793.8 805.2 816.6 828.0 836.7 845.4 854.1 862.8 871.5 880.2 888.942.4 42.4 42.4 42.4 42.4 42.4 42.4 42.4 42.4 42.4 42.4 42.4 42.4 42.4 42.432.0 32.0 32.0 32.0 32.0 32.0 32.0 32.0 32.0 32.0 32.0 32.0 32.0 32.0 32.0
1773.6 1800.8 1828.0 1855.2 1882.4 1909.6 1936.8 1964.0 1984.5 2005.0 2025.5 2046.0 2066.5 2087.0 2107.5341.9 347.2 352.5 357.8 363.1 368.4 373.7 379.0 382.9 386.8 390.7 394.6 398.5 402.4 406.360.0 60.0 60.0 60.0 60.0 60.0 60.0 60.0 60.0 60.0 60.0 60.0 60.0 60.0 60.0
230.0 230.0 230.0 230.0 230.0 230.0 230.0 230.0 230.0 230.0 230.0 230.0 230.0 230.0 230.02223.0 2257.0 2291.0 2325.0 2359.0 2393.0 2427.0 2461.0 2486.7 2512.4 2538.1 2563.8 2589.5 2615.2 2640.91276.5 1276.5 1276.5 1276.5 1276.5 1276.5 1276.5 1276.5 1276.5 1276.5 1276.5 1276.5 1276.5 1276.5 1276.51026.1 1041.8 1057.5 1073.2 1088.9 1104.6 1120.3 1136.0 1147.9 1159.8 1171.7 1183.6 1195.5 1207.4 1219.3132.0 132.0 132.0 132.0 132.0 132.0 132.0 132.0 132.0 132.0 132.0 132.0 132.0 132.0 132.010.0 10.0 10.0 10.0 10.0 10.0 10.0 10.0 10.0 10.0 10.0 10.0 10.0 10.0 10.0
357.0 357.0 357.0 357.0 357.0 357.0 357.0 357.0 357.0 357.0 357.0 357.0 357.0 357.0 357.0
Page 38 of 47

Table C-1. Livestock Total Pumpage (ac-ft/yr)
Total 2028 Total 2029 Total 2030 Total 2031 Total 2032 Total 2033 Total 2034 Total 2035 Total 2036 Total 2037 Total 2038 Total 2039 Total 2040 Total 2041 Total 2042264.0 264.0 264.0 264.0 264.0 264.0 264.0 264.0 264.0 264.0 264.0 264.0 264.0 264.0 264.0
0.0 0.0 0.0 0.0 0.0 0.0 0.0 0.0 0.0 0.0 0.0 0.0 0.0 0.0 0.0594.1 598.4 602.7 607.4 612.1 616.8 621.5 626.2 631.0 635.7 640.4 645.1 649.8 655.1 660.3
1743.4 1760.2 1777.0 1795.6 1814.2 1832.8 1851.4 1870.0 1888.6 1907.2 1925.8 1944.4 1963.0 1983.6 2004.24.3 4.3 4.3 4.3 4.3 4.3 4.3 4.3 4.3 4.3 4.3 4.3 4.3 4.3 4.32.8 2.8 2.8 2.8 2.8 2.8 2.8 2.8 2.8 2.8 2.8 2.8 2.8 2.8 2.8
160.5 160.5 160.5 160.5 160.5 160.5 160.5 160.5 160.5 160.5 160.5 160.5 160.5 160.5 160.53452.4 3485.7 3519.0 3555.9 3592.8 3629.7 3666.6 3703.5 3740.4 3777.3 3814.2 3851.1 3888.0 3928.6 3969.24880.8 4927.9 4975.0 5027.1 5079.2 5131.3 5183.4 5235.5 5287.6 5339.7 5391.8 5443.9 5496.0 5553.5 5611.0923.2 932.1 941.0 950.8 960.6 970.4 980.2 990.0 999.8 1009.6 1019.4 1029.2 1039.0 1049.9 1060.8440.1 440.1 440.1 440.1 440.1 440.1 440.1 440.1 440.1 440.1 440.1 440.1 440.1 440.1 440.1159.0 159.0 159.0 159.0 159.0 159.0 159.0 159.0 159.0 159.0 159.0 159.0 159.0 159.0 159.0
7.0 7.0 7.0 7.0 7.0 7.0 7.0 7.0 7.0 7.0 7.0 7.0 7.0 7.0 7.02355.9 2355.9 2355.9 2355.9 2355.9 2355.9 2355.9 2355.9 2355.9 2355.9 2355.9 2355.9 2355.9 2355.9 2355.9
4.0 4.0 4.0 4.0 4.0 4.0 4.0 4.0 4.0 4.0 4.0 4.0 4.0 4.0 4.0185.6 185.6 185.6 185.6 185.6 185.6 185.6 185.6 185.6 185.6 185.6 185.6 185.6 185.6 185.6962.0 962.0 962.0 962.0 962.0 962.0 962.0 962.0 962.0 962.0 962.0 962.0 962.0 962.0 962.0
11984.4 12100.1 12215.8 12343.4 12471.0 12598.6 12726.2 12853.8 12981.4 13109.0 13236.6 13364.2 13491.8 13632.9 13774.012.9 12.9 12.9 12.9 12.9 12.9 12.9 12.9 12.9 12.9 12.9 12.9 12.9 12.9 12.99.4 9.4 9.4 9.4 9.4 9.4 9.4 9.4 9.4 9.4 9.4 9.4 9.4 9.4 9.4
194.0 194.0 194.0 194.0 194.0 194.0 194.0 194.0 194.0 194.0 194.0 194.0 194.0 194.0 194.0896.4 904.9 913.5 923.2 933.0 942.7 952.5 962.2 972.0 981.7 991.5 1001.3 1011.0 1021.5 1032.0
1030.2 1030.2 1030.2 1030.2 1030.2 1030.2 1030.2 1030.2 1030.2 1030.2 1030.2 1030.2 1030.2 1030.2 1030.2897.6 906.3 915.0 924.6 934.2 943.8 953.4 963.0 972.6 982.2 991.8 1001.4 1011.0 1021.5 1032.042.4 42.4 42.4 42.4 42.4 42.4 42.4 42.4 42.4 42.4 42.4 42.4 42.4 42.4 42.432.0 32.0 32.0 32.0 32.0 32.0 32.0 32.0 32.0 32.0 32.0 32.0 32.0 32.0 32.0
2128.0 2148.5 2169.0 2191.7 2214.4 2237.1 2259.8 2282.5 2305.2 2327.9 2350.6 2373.3 2396.0 2421.1 2446.2410.2 414.1 418.0 422.4 426.8 431.2 435.6 440.0 444.4 448.8 453.2 457.6 462.0 466.8 471.660.0 60.0 60.0 60.0 60.0 60.0 60.0 60.0 60.0 60.0 60.0 60.0 60.0 60.0 60.0
230.0 230.0 230.0 230.0 230.0 230.0 230.0 230.0 230.0 230.0 230.0 230.0 230.0 230.0 230.02666.6 2692.3 2718.0 2746.5 2775.0 2803.5 2832.0 2860.5 2889.0 2917.5 2946.0 2974.5 3003.0 3034.4 3065.81276.5 1276.5 1276.5 1276.5 1276.5 1276.5 1276.5 1276.5 1276.5 1276.5 1276.5 1276.5 1276.5 1276.5 1276.51231.2 1243.1 1255.0 1268.1 1281.2 1294.3 1307.4 1320.5 1333.6 1346.7 1359.8 1372.9 1386.0 1400.5 1415.0132.0 132.0 132.0 132.0 132.0 132.0 132.0 132.0 132.0 132.0 132.0 132.0 132.0 132.0 132.010.0 10.0 10.0 10.0 10.0 10.0 10.0 10.0 10.0 10.0 10.0 10.0 10.0 10.0 10.0
357.0 357.0 357.0 357.0 357.0 357.0 357.0 357.0 357.0 357.0 357.0 357.0 357.0 357.0 357.0
Page 39 of 47

Table C-1. Livestock Total Pumpage (ac-ft/yr)
Total 2043 Total 2044 Total 2045 Total 2046 Total 2047 Total 2048 Total 2049 Total 2050264.0 264.0 264.0 264.0 264.0 264.0 264.0 101.0
0.0 0.0 0.0 0.0 0.0 0.0 0.0 0.0665.6 670.9 676.1 681.4 686.7 691.9 697.2 702.5
2024.8 2045.4 2065.9 2086.5 2107.1 2127.7 2148.3 2168.94.3 4.3 4.3 4.3 4.3 4.3 4.3 4.32.8 2.8 2.8 2.8 2.8 2.8 2.8 2.8
160.5 160.5 160.5 160.5 160.5 160.5 160.5 160.54009.8 4050.4 4091.0 4131.6 4172.2 4212.8 4253.4 4294.05668.5 5726.0 5783.5 5841.0 5898.5 5956.0 6013.5 6071.01071.7 1082.6 1093.5 1104.4 1115.3 1126.2 1137.1 1148.0440.1 440.1 440.1 440.1 440.1 440.1 440.1 440.1159.0 159.0 159.0 159.0 159.0 159.0 159.0 159.0
7.0 7.0 7.0 7.0 7.0 7.0 7.0 7.02355.9 2355.9 2355.9 2355.9 2355.9 2355.9 2355.9 2355.9
4.0 4.0 4.0 4.0 4.0 4.0 4.0 4.0185.6 185.6 185.6 185.6 185.6 185.6 185.6 185.6962.0 962.0 962.0 962.0 962.0 962.0 962.0 962.0
13915.1 14056.2 14197.3 14338.3 14479.4 14620.5 14761.6 14902.712.9 12.9 12.9 12.9 12.9 12.9 12.9 12.99.4 9.4 9.4 9.4 9.4 9.4 9.4 9.4
194.0 194.0 194.0 194.0 194.0 194.0 194.0 194.01042.5 1053.0 1063.5 1074.0 1084.5 1095.0 1105.5 1116.01030.2 1030.2 1030.2 1030.2 1030.2 1030.2 1030.2 1030.21042.5 1053.0 1063.5 1074.0 1084.5 1095.0 1105.5 1116.0
42.4 42.4 42.4 42.4 42.4 42.4 42.4 42.432.0 32.0 32.0 32.0 32.0 32.0 32.0 32.0
2471.3 2496.4 2521.5 2546.6 2571.7 2596.8 2621.9 2647.0476.4 481.2 486.0 490.8 495.6 500.4 505.2 510.060.0 60.0 60.0 60.0 60.0 60.0 60.0 60.0
230.0 230.0 230.0 230.0 230.0 230.0 230.0 230.03097.2 3128.6 3160.0 3191.4 3222.8 3254.2 3285.6 3317.01276.5 1276.5 1276.5 1276.5 1276.5 1276.5 1276.5 1276.51429.5 1444.0 1458.5 1473.0 1487.5 1502.0 1516.5 1531.0132.0 132.0 132.0 132.0 132.0 132.0 132.0 132.010.0 10.0 10.0 10.0 10.0 10.0 10.0 10.0
357.0 357.0 357.0 357.0 357.0 357.0 357.0 357.0
Page 40 of 47
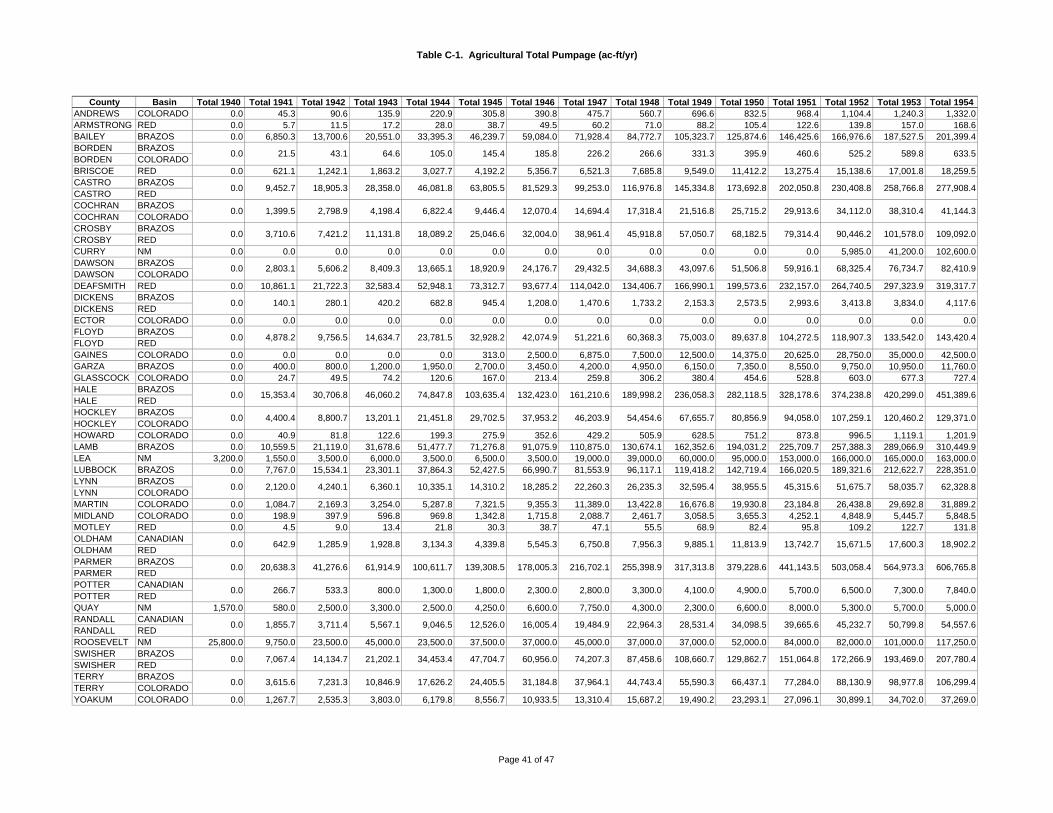
Table C-1. Agricultural Total Pumpage (ac-ft/yr)
County Basin Total 1940 Total 1941 Total 1942 Total 1943 Total 1944 Total 1945 Total 1946 Total 1947 Total 1948 Total 1949 Total 1950 Total 1951 Total 1952 Total 1953 Total 1954ANDREWS COLORADO 0.0 45.3 90.6 135.9 220.9 305.8 390.8 475.7 560.7 696.6 832.5 968.4 1,104.4 1,240.3 1,332.0ARMSTRONG RED 0.0 5.7 11.5 17.2 28.0 38.7 49.5 60.2 71.0 88.2 105.4 122.6 139.8 157.0 168.6BAILEY BRAZOS 0.0 6,850.3 13,700.6 20,551.0 33,395.3 46,239.7 59,084.0 71,928.4 84,772.7 105,323.7 125,874.6 146,425.6 166,976.6 187,527.5 201,399.4BORDEN BRAZOSBORDEN COLORADOBRISCOE RED 0.0 621.1 1,242.1 1,863.2 3,027.7 4,192.2 5,356.7 6,521.3 7,685.8 9,549.0 11,412.2 13,275.4 15,138.6 17,001.8 18,259.5CASTRO BRAZOSCASTRO REDCOCHRAN BRAZOSCOCHRAN COLORADOCROSBY BRAZOSCROSBY REDCURRY NM 0.0 0.0 0.0 0.0 0.0 0.0 0.0 0.0 0.0 0.0 0.0 0.0 5,985.0 41,200.0 102,600.0DAWSON BRAZOSDAWSON COLORADODEAFSMITH RED 0.0 10,861.1 21,722.3 32,583.4 52,948.1 73,312.7 93,677.4 114,042.0 134,406.7 166,990.1 199,573.6 232,157.0 264,740.5 297,323.9 319,317.7DICKENS BRAZOSDICKENS REDECTOR COLORADO 0.0 0.0 0.0 0.0 0.0 0.0 0.0 0.0 0.0 0.0 0.0 0.0 0.0 0.0 0.0FLOYD BRAZOSFLOYD REDGAINES COLORADO 0.0 0.0 0.0 0.0 0.0 313.0 2,500.0 6,875.0 7,500.0 12,500.0 14,375.0 20,625.0 28,750.0 35,000.0 42,500.0GARZA BRAZOS 0.0 400.0 800.0 1,200.0 1,950.0 2,700.0 3,450.0 4,200.0 4,950.0 6,150.0 7,350.0 8,550.0 9,750.0 10,950.0 11,760.0GLASSCOCK COLORADO 0.0 24.7 49.5 74.2 120.6 167.0 213.4 259.8 306.2 380.4 454.6 528.8 603.0 677.3 727.4HALE BRAZOSHALE REDHOCKLEY BRAZOSHOCKLEY COLORADOHOWARD COLORADO 0.0 40.9 81.8 122.6 199.3 275.9 352.6 429.2 505.9 628.5 751.2 873.8 996.5 1,119.1 1,201.9LAMB BRAZOS 0.0 10,559.5 21,119.0 31,678.6 51,477.7 71,276.8 91,075.9 110,875.0 130,674.1 162,352.6 194,031.2 225,709.7 257,388.3 289,066.9 310,449.9LEA NM 3,200.0 1,550.0 3,500.0 6,000.0 3,500.0 6,500.0 3,500.0 19,000.0 39,000.0 60,000.0 95,000.0 153,000.0 166,000.0 165,000.0 163,000.0LUBBOCK BRAZOS 0.0 7,767.0 15,534.1 23,301.1 37,864.3 52,427.5 66,990.7 81,553.9 96,117.1 119,418.2 142,719.4 166,020.5 189,321.6 212,622.7 228,351.0LYNN BRAZOSLYNN COLORADOMARTIN COLORADO 0.0 1,084.7 2,169.3 3,254.0 5,287.8 7,321.5 9,355.3 11,389.0 13,422.8 16,676.8 19,930.8 23,184.8 26,438.8 29,692.8 31,889.2MIDLAND COLORADO 0.0 198.9 397.9 596.8 969.8 1,342.8 1,715.8 2,088.7 2,461.7 3,058.5 3,655.3 4,252.1 4,848.9 5,445.7 5,848.5MOTLEY RED 0.0 4.5 9.0 13.4 21.8 30.3 38.7 47.1 55.5 68.9 82.4 95.8 109.2 122.7 131.8OLDHAM CANADIANOLDHAM REDPARMER BRAZOSPARMER REDPOTTER CANADIANPOTTER REDQUAY NM 1,570.0 580.0 2,500.0 3,300.0 2,500.0 4,250.0 6,600.0 7,750.0 4,300.0 2,300.0 6,600.0 8,000.0 5,300.0 5,700.0 5,000.0RANDALL CANADIANRANDALL REDROOSEVELT NM 25,800.0 9,750.0 23,500.0 45,000.0 23,500.0 37,500.0 37,000.0 45,000.0 37,000.0 37,000.0 52,000.0 84,000.0 82,000.0 101,000.0 117,250.0SWISHER BRAZOSSWISHER REDTERRY BRAZOSTERRY COLORADOYOAKUM COLORADO 0.0 1,267.7 2,535.3 3,803.0 6,179.8 8,556.7 10,933.5 13,310.4 15,687.2 19,490.2 23,293.1 27,096.1 30,899.1 34,702.0 37,269.0
98,977.8 106,299.455,590.3 66,437.1 77,284.0 88,130.90.0 3,615.6 7,231.3 10,846.9 17,626.2 24,405.5 31,184.8 37,964.1 44,743.4
172,266.9 193,469.0 207,780.487,458.6 108,660.7 129,862.7 151,064.834,453.4 47,704.7 60,956.0 74,207.30.0 7,067.4 14,134.7 21,202.1
50,799.8 54,557.628,531.4 34,098.5 39,665.6 45,232.70.0 1,855.7 3,711.4 5,567.1 9,046.5 12,526.0 16,005.4 19,484.9 22,964.3
6,500.0 7,300.0 7,840.03,300.0 4,100.0 4,900.0 5,700.01,300.0 1,800.0 2,300.0 2,800.00.0 266.7 533.3 800.0
564,973.3 606,765.8317,313.8 379,228.6 441,143.5 503,058.40.0 20,638.3 41,276.6 61,914.9 100,611.7 139,308.5 178,005.3 216,702.1 255,398.9
15,671.5 17,600.3 18,902.27,956.3 9,885.1 11,813.9 13,742.73,134.3 4,339.8 5,545.3 6,750.80.0 642.9 1,285.9 1,928.8
58,035.7 62,328.832,595.4 38,955.5 45,315.6 51,675.70.0 2,120.0 4,240.1 6,360.1 10,335.1 14,310.2 18,285.2 22,260.3 26,235.3
107,259.1 120,460.2 129,371.054,454.6 67,655.7 80,856.9 94,058.021,451.8 29,702.5 37,953.2 46,203.90.0 4,400.4 8,800.7 13,201.1
420,299.0 451,389.6236,058.3 282,118.5 328,178.6 374,238.80.0 15,353.4 30,706.8 46,060.2 74,847.8 103,635.4 132,423.0 161,210.6 189,998.2
118,907.3 133,542.0 143,420.460,368.3 75,003.0 89,637.8 104,272.523,781.5 32,928.2 42,074.9 51,221.60.0 4,878.2 9,756.5 14,634.7
3,834.0 4,117.62,153.3 2,573.5 2,993.6 3,413.80.0 140.1 280.1 420.2 682.8 945.4 1,208.0 1,470.6 1,733.2
68,325.4 76,734.7 82,410.934,688.3 43,097.6 51,506.8 59,916.113,665.1 18,920.9 24,176.7 29,432.50.0 2,803.1 5,606.2 8,409.3
101,578.0 109,092.057,050.7 68,182.5 79,314.4 90,446.20.0 3,710.6 7,421.2 11,131.8 18,089.2 25,046.6 32,004.0 38,961.4 45,918.8
34,112.0 38,310.4 41,144.317,318.4 21,516.8 25,715.2 29,913.66,822.4 9,446.4 12,070.4 14,694.40.0 1,399.5 2,798.9 4,198.4
258,766.8 277,908.4145,334.8 173,692.8 202,050.8 230,408.80.0 9,452.7 18,905.3 28,358.0 46,081.8 63,805.5 81,529.3 99,253.0 116,976.8
525.2 589.8 633.5266.6 331.3 395.9 460.6105.0 145.4 185.8 226.20.0 21.5 43.1 64.6
Page 41 of 47

Table C-1. Agricultural Total Pumpage (ac-ft/yr)
Total 1955 Total 1956 Total 1957 Total 1958 Total 1959 Total 1960 Total 1961 Total 1962 Total 1963 Total 1964 Total 1965 Total 1966 Total 1967 Total 1968 Total 1969 Total 1970 Total 19711,423.8 1,515.5 1,607.3 1,699.0 4,148.0 6,597.0 9,046.0 11,495.0 13,944.0 16,393.0 13,354.0 10,315.0 7,276.0 4,237.0 1,198.0 2,014.0 2,830.0
180.2 191.9 203.5 215.1 252.2 289.3 326.5 363.6 400.7 437.8 418.2 398.6 378.9 359.3 339.7 332.4 325.0215,271.3 229,143.2 243,015.1 256,887.0 273,157.2 289,427.3 305,697.5 321,967.7 338,237.8 354,508.0 320,583.0 286,658.0 252,733.0 218,808.0 184,883.0 223,081.2 261,279.4
19,517.2 20,774.9 22,032.5 23,290.2 30,543.3 37,796.4 45,049.5 52,302.6 59,555.7 66,808.8 64,975.3 63,141.8 61,308.4 59,474.9 57,641.4 58,478.5 59,315.6
138,380.0 156,000.0 140,000.0 105,490.0 95,000.0 70,000.0 95,977.8 121,955.6 147,933.3 173,911.1 199,888.9 225,866.7 251,844.4 277,822.2 227,850.0 228,030.0 228,210.0
341,311.5 363,305.4 385,299.2 407,293.0 417,601.7 427,910.3 438,219.0 448,527.7 458,836.3 469,145.0 471,621.0 474,097.0 476,573.0 479,049.0 481,525.0 488,179.8 494,834.6
0.0 0.0 0.0 0.0 952.0 1,904.0 2,856.0 3,808.0 4,760.0 5,712.0 5,311.2 4,910.4 4,509.6 4,108.8 3,708.0 3,687.8 3,667.6
50,000.0 59,375.0 72,500.0 80,625.0 95,000.0 112,500.0 108,750.0 142,500.0 182,000.0 199,558.8 180,210.9 160,863.1 141,515.2 122,167.4 102,819.5 125,771.2 148,723.012,570.0 13,380.0 14,190.0 15,000.0 15,502.3 16,004.7 16,507.0 17,009.3 17,511.7 18,014.0 17,708.0 17,402.0 17,096.0 16,790.0 16,484.0 16,320.6 16,157.2
777.5 827.6 877.7 927.8 1,100.8 1,273.9 1,447.0 1,620.0 1,793.1 1,966.2 2,119.9 2,273.6 2,427.3 2,581.1 2,734.8 3,069.5 3,404.2
1,284.7 1,367.4 1,450.2 1,533.0 1,638.7 1,744.3 1,850.0 1,955.7 2,061.3 2,167.0 2,009.4 1,851.8 1,694.2 1,536.6 1,379.0 1,604.0 1,829.0331,832.9 353,215.9 374,599.0 395,982.0 443,860.3 491,738.7 539,617.0 587,495.3 635,373.7 683,252.0 624,376.6 565,501.2 506,625.8 447,750.4 388,875.0 393,874.4 398,873.8170,000.0 160,000.0 140,000.0 107,000.0 149,000.0 105,000.0 107,052.4 109,104.9 111,157.3 113,209.8 115,262.2 117,314.7 119,367.1 121,419.6 123,472.0 123,113.5 122,755.0244,079.2 259,807.5 275,535.7 291,264.0 278,269.7 265,275.3 252,281.0 239,286.7 226,292.3 213,298.0 208,608.4 203,918.8 199,229.2 194,539.6 189,850.0 207,561.8 225,273.6
34,085.7 36,282.1 38,478.6 40,675.0 41,506.7 42,338.3 43,170.0 44,001.7 44,833.3 45,665.0 42,369.4 39,073.8 35,778.2 32,482.6 29,187.0 29,314.6 29,442.26,251.3 6,654.1 7,057.0 7,459.8 6,958.9 6,457.9 5,957.0 5,456.0 4,955.1 4,454.1 5,569.0 6,683.9 7,798.9 8,913.8 10,028.7 10,270.4 10,512.1
140.8 149.9 159.0 168.1 187.2 206.3 225.4 244.5 263.6 282.7 326.0 369.3 412.6 455.9 499.2 491.2 483.2
5,400.0 3,400.0 3,200.0 3,000.0 4,500.0 2,000.0 2,620.1 3,240.2 3,860.3 4,480.4 5,100.6 5,720.7 6,340.8 6,960.9 5,685.8 6,971.5 8,257.3
104,250.0 109,250.0 98,250.0 79,250.0 98,500.0 85,000.0 94,144.4 103,288.9 112,433.3 121,577.8 130,722.2 139,866.7 149,011.1 158,155.6 125,475.0 134,420.0 143,365.0
39,836.0 42,403.0 44,970.0 47,537.0 46,827.1 46,117.2 45,407.3 44,697.3 43,987.4 43,277.5 45,023.3 46,769.1 48,514.9 50,260.7 52,006.5 54,500.0 56,993.6
58,057.0 59,611.0 61,165.0147,861.8 125,410.6 102,959.4 80,508.2152,949.5 158,737.3 164,525.2 170,313.0128,264.4 135,586.0 141,373.8 147,161.7113,621.1 120,942.7
390,034.2 369,637.0 390,685.2 411,733.4471,623.0 451,225.8 430,828.6 410,431.4333,891.7 368,324.5 402,757.3 437,190.2236,403.2 250,714.6 265,026.0 299,458.8222,091.8
70,036.0 71,530.1 73,024.2108,546.1 98,918.6 89,291.0 79,663.593,881.2 101,978.7 110,076.1 118,173.665,831.0 69,588.8 77,686.3 85,783.758,315.4 62,073.2
21,184.8 20,844.0 21,540.6 22,237.222,548.0 22,207.2 21,866.4 21,525.614,182.7 16,274.0 18,365.3 20,456.78,920.0 9,460.0 10,000.0 12,091.38,380.0
493,295.0 515,775.4 538,255.8557,875.0 541,730.0 525,585.0 509,440.0673,978.0 640,658.7 607,339.3 574,020.0732,143.5 773,936.0 740,616.7 707,297.3648,558.4 690,350.9
31,781.4 30,084.0 30,404.8 30,725.638,571.0 36,873.6 35,176.2 33,478.828,930.3 31,340.5 33,750.7 36,160.821,506.1 22,808.1 24,110.0 26,520.220,204.2
23,477.0 33,258.0 43,039.067,949.0 56,831.0 45,713.0 34,595.079,284.0 79,211.7 79,139.3 79,067.075,207.9 79,501.0 79,428.7 79,356.366,621.8 70,914.9
251,353.4 214,696.0 240,857.2 267,018.4397,983.0 361,325.6 324,668.2 288,010.8242,670.3 281,498.5 320,326.7 359,154.8147,192.5 156,103.2 165,014.0 203,842.2138,281.7
680,167.0 709,405.0 738,643.01,020,526.2 935,436.4 850,346.6 765,256.8840,684.0 928,994.7 1,017,305.3 1,105,616.0544,661.4 575,752.0 664,062.7 752,373.3482,480.2 513,570.8
296,162.3 308,116.6 302,248.9 296,381.2248,345.2 260,299.5 272,253.8 284,208.1204,737.9 215,639.7 226,541.6 237,443.4163,177.3 173,055.8 182,934.2 193,836.1153,298.9
8,458.0 8,295.2 8,132.46,489.2 6,981.4 7,473.6 7,965.85,624.5 5,748.7 5,872.8 5,997.04,968.4 5,252.0 5,376.2 5,500.34,401.2 4,684.8
63,510.2 42,192.0 40,002.6 37,813.2148,783.0 127,464.8 106,146.6 84,828.4119,671.7 126,949.5 134,227.3 141,505.293,763.5 99,439.7 105,116.0 112,393.888,087.2
215,809.0 219,207.2 222,605.4193,920.2 199,392.4 204,864.6 210,336.8163,798.0 172,014.7 180,231.3 188,448.0131,634.0 139,148.0 147,364.7 155,581.3116,606.0 124,120.0
66,425.6 65,312.0 69,362.4 73,412.870,880.0 69,766.4 68,652.8 67,539.258,613.3 61,680.0 64,746.7 67,813.346,812.2 49,646.1 52,480.0 55,546.743,978.2
548,634.0 548,139.2 547,644.4617,166.8 600,033.6 582,900.4 565,767.2494,387.5 541,025.0 587,662.5 634,300.0335,333.4 354,475.0 401,112.5 447,750.0297,050.1 316,191.7
714.6 716.0 698.4 680.8709.0 710.4 711.8 713.2775.0 758.5 742.0 725.5720.7 764.4 808.0 791.5677.1
Page 42 of 47

Table C-1. Agricultural Total Pumpage (ac-ft/yr)
Total 1972 Total 1973 Total 1974 Total 1975 Total 1976 Total 1977 Total 1978 Total 1979 Total 1980 Total 1981 Total 1982 Total 1983 Total 1984 Total 1985 Total 1986 Total 1987 Total 19883,646.0 4,462.0 5,278.0 6,048.8 6,819.6 7,590.4 8,361.2 9,132.0 11,890.3 14,648.6 17,407.0 34,008.8 11,563.4 9,801.9 8,040.5 6,279.0 6,567.3
317.7 310.4 303.1 268.1 233.2 198.3 163.3 128.4 86.0 43.7 133.7 98.3 125.5 109.3 93.2 77.0 90.1299,477.6 337,675.8 375,874.0 351,136.2 326,398.4 301,660.6 276,922.8 252,185.0 241,234.2 230,283.4 219,332.6 162,323.8 131,750.5 116,946.3 102,142.0 87,337.8 92,800.2
60,152.8 60,989.9 61,827.0 60,903.6 59,980.2 59,056.8 58,133.4 57,210.0 46,065.6 34,921.1 39,627.8 34,207.7 28,312.4 26,387.6 24,462.8 22,538.0 24,182.1
228,390.0 228,570.0 228,750.0 228,930.0 221,455.5 213,981.0 206,506.5 199,032.0 191,557.5 195,052.0 134,694.1 96,176.5 102,397.2 94,997.8 87,598.4 80,199.0 85,875.7
501,489.4 508,144.2 514,799.0 474,980.4 435,161.8 395,343.2 355,524.6 315,706.0 310,276.3 304,846.7 299,417.0 259,145.6 220,633.0 203,274.6 185,916.3 168,558.0 175,326.8
3,647.4 3,627.2 3,607.0 3,624.2 3,641.4 3,658.6 3,675.8 3,693.0 3,502.8 3,312.5 3,122.3 0.0 0.0 941.0 1,882.0 2,823.0 2,258.4
171,674.7 194,626.5 217,578.2 231,887.0 246,195.9 260,504.7 274,813.6 289,122.4 291,851.9 294,581.5 382,257.0 289,983.9 229,689.2 221,556.1 213,423.1 205,290.0 221,903.715,993.8 15,830.4 15,667.0 14,912.4 14,157.8 13,403.2 12,648.6 11,894.0 9,939.0 7,983.9 6,028.9 6,587.3 7,352.7 6,044.1 4,735.6 3,427.0 3,598.63,738.9 4,073.6 4,408.2 4,149.9 3,891.5 3,633.2 3,374.8 3,116.5 2,215.1 1,313.7 5,153.5 5,515.3 5,167.3 4,486.2 3,805.1 3,124.0 3,354.1
2,054.0 2,279.0 2,504.0 2,174.4 1,844.8 1,515.2 1,185.6 856.0 4,449.9 8,043.8 11,637.7 3,104.3 3,812.1 3,163.7 2,515.4 1,867.0 2,939.5403,873.2 408,872.6 413,872.0 395,104.2 376,336.4 357,568.6 338,800.8 320,033.0 350,218.8 380,404.7 410,590.5 337,142.1 289,552.1 267,541.5 245,531.0 223,520.4 231,752.6122,396.5 122,038.0 121,679.5 121,321.0 117,708.8 114,096.6 110,484.4 106,872.2 103,260.0 75,046.4 46,832.7 26,548.0 23,083.1 29,932.4 36,781.7 43,631.0 46,344.1242,985.4 260,697.2 278,409.0 227,923.2 177,437.4 126,951.6 76,465.8 25,980.0 101,133.1 176,286.2 251,439.3 218,825.4 253,455.8 214,953.2 176,450.6 137,948.0 153,652.0
29,569.8 29,697.4 29,825.0 26,985.0 24,145.0 21,305.0 18,465.0 15,625.0 14,365.2 13,105.5 11,845.7 13,504.7 9,508.6 7,879.4 6,250.2 4,621.0 6,337.110,753.7 10,995.4 11,237.1 10,463.9 9,690.8 8,917.6 8,144.5 7,371.3 5,660.7 3,950.1 7,464.8 2,692.6 2,898.3 3,308.9 3,719.4 4,130.0 4,304.4
475.1 467.1 459.1 409.0 358.8 308.6 258.4 208.3 152.8 97.3 597.7 433.3 555.2 518.5 481.7 445.0 431.5
9,543.0 10,828.8 12,114.5 13,400.3 12,596.7 11,793.2 10,989.6 10,186.1 9,382.5 6,489.6 3,284.6 2,092.2 2,175.8 2,159.8 2,143.9 2,128.0 2,176.6
152,310.0 161,255.0 170,200.0 179,145.0 168,658.5 158,172.0 147,685.5 137,199.0 126,712.5 146,244.5 123,539.1 62,508.7 62,394.1 64,003.1 65,612.0 67,221.0 74,362.0
59,487.1 61,980.7 64,474.2 68,787.0 73,099.9 77,412.7 81,725.6 86,038.4 84,204.9 82,371.5 103,548.9 71,398.3 63,702.3 46,573.1 29,443.9 12,314.7 27,290.2
115,615.5 94,057.0 72,498.6 85,395.692,963.0 110,588.4 166,634.9 137,173.960,958.0 59,335.0 57,712.0 75,337.564,273.0 65,827.0 64,204.0 62,581.062,719.0
138,235.2306,589.2 248,572.5 190,555.7 132,539.0208,864.7 259,777.4 310,690.1 269,198.0348,107.6 284,722.4 221,337.2 157,952.0432,781.6 453,829.8 474,878.0 411,492.8
42,072.6 35,516.3 28,960.0 30,031.423,203.2 3,528.4 31,438.2 48,628.969,381.0 66,672.5 63,964.0 43,583.676,012.3 77,506.4 74,797.9 72,089.474,518.2
13,590.037,689.2 29,737.2 21,785.1 13,833.017,653.3 14,591.7 11,530.0 25,691.622,882.2 22,159.8 21,437.4 20,715.022,933.8 23,630.4 24,327.0 23,604.6
303,510.1 257,604.1 211,698.0 221,608.3497,699.1 450,145.7 369,519.7 349,416.2597,962.4 595,384.2 592,806.0 545,252.6583,216.6 605,697.0 603,118.8 600,540.6560,736.2
18,729.824,084.7 22,358.4 20,632.2 18,906.021,286.0 25,850.0 30,414.1 26,994.725,701.6 22,708.4 19,715.2 16,722.031,046.4 31,367.2 31,688.0 28,694.8
45,285.0 37,076.5 28,868.0 36,917.937,995.6 37,848.4 48,882.4 53,493.551,926.8 45,108.4 38,290.0 38,142.862,601.0 72,382.0 65,563.6 58,745.252,820.0
88,764.4152,676.1 125,876.8 99,077.4 72,278.1101,948.4 158,879.8 215,811.3 185,115.1225,308.0 165,211.0 105,114.0 45,017.0293,179.6 319,340.8 345,502.0 285,405.0
368,185.4 312,634.7 257,084.0 280,884.2429,819.4 466,254.7 408,155.2 423,736.1544,712.2 450,830.6 356,949.0 393,384.2797,119.0 826,357.0 732,475.4 638,593.8767,881.0
164,022.8255,234.5 220,680.0 186,125.5 151,571.0219,025.3 266,391.6 323,461.7 233,128.4235,930.4 214,506.6 193,082.8 171,659.0290,513.4 284,645.7 278,778.0 257,354.2
3,710.4 2,469.2 1,228.0 1,390.22,773.6 6,681.4 3,578.1 4,951.74,041.3 2,840.4 1,639.5 2,206.67,806.8 7,644.0 6,443.1 5,242.27,969.6
24,835.738,078.5 33,128.6 28,178.8 23,229.020,920.2 32,140.4 43,360.7 41,474.722,627.0 18,318.0 14,009.0 9,700.035,623.8 33,434.4 31,245.0 26,936.0
132,632.4 102,102.2 71,572.0 87,991.997,297.6 124,402.4 158,592.6 163,162.6118,972.8 81,030.4 43,088.0 70,192.8229,401.8 232,800.0 194,857.6 156,915.2226,003.6
43,969.690,149.0 72,809.7 55,470.5 38,131.258,467.5 88,839.9 119,212.4 82,606.962,576.4 51,082.6 39,588.8 28,095.077,463.2 81,513.6 85,564.0 74,070.2
362,757.3 308,994.1 255,231.0 264,961.7453,358.2 474,171.8 401,773.6 416,520.4465,502.6 438,616.8 411,731.0 432,544.6546,654.8 546,160.0 519,274.2 492,388.4547,149.6
1,376.8167.5 427.3 687.2 947.0565.1 827.2 1,089.3 0.0498.0 433.0 368.0 303.0663.2 645.6 628.0 563.0
Page 43 of 47

Table C-1. Agricultural Total Pumpage (ac-ft/yr)
Total 1989 Total 1990 Total 1991 Total 1992 Total 1993 Total 1994 Total 1995 Total 1996 Total 1997 Total 1998 Total 1999 Total 2000 Total 2001 Total 2002 Total 2003 Total 2004 Total 20056,855.6 7,143.9 7,432.2 7,720.5 5,135.5 5,962.9 9,745.0 13,527.0 17,309.0 17,012.0 16,715.0 16,418.0 16,445.0 16,472.0 16,499.1 16,526.1 16,553.1
103.2 116.4 129.5 142.6 116.5 129.5 107.3 85.2 63.0 2,290.9 4,518.8 6,746.6 6,746.6 6,746.6 6,746.6 6,746.6 6,746.698,262.7 103,725.1 109,187.5 114,649.9 126,044.3 112,431.7 102,866.4 93,301.2 83,736.0 116,760.3 140,480.7 164,201.0 163,869.2 163,537.4 163,205.6 162,873.8 162,542.0
92.0 92.0 92.0 92.0 92.0727.4 727.8 728.2 728.6 729.0
25,826.3 27,470.4 29,114.5 30,758.7 36,299.4 33,584.4 27,208.0 20,831.5 14,455.0 19,110.3 23,765.7 28,421.0 28,302.7 28,184.4 28,066.1 27,947.8 27,829.5156,285.0 155,858.4 155,431.8 155,005.1 154,578.5100,788.1 100,400.2 100,012.3 99,624.4 99,236.519,188.6 19,176.2 19,163.8 19,151.4 19,139.018,256.1 18,185.2 18,114.3 18,043.4 17,972.585,107.9 84,759.8 84,411.7 84,063.6 83,715.51,307.9 1,306.0 1,304.1 1,302.1 1,300.2
91,552.5 97,229.2 102,905.9 108,582.6 115,349.8 138,782.2 123,489.8 108,197.4 92,905.0 118,523.0 118,523.0 118,523.0 118,523.0 118,523.0 118,523.0 118,523.0 118,523.0362.9 360.8 358.7 356.6 354.5
35,906.4 35,702.8 35,499.2 35,295.6 35,092.0182,095.5 188,864.3 195,633.0 202,401.8 240,950.6 221,385.9 205,099.6 188,813.3 172,527.0 197,727.0 222,927.0 248,127.0 247,331.4 246,535.8 245,740.2 244,944.6 244,149.0
2,155.6 2,149.2 2,142.8 2,136.4 2,130.01,625.1 1,620.2 1,615.3 1,610.4 1,605.5
1,693.8 1,129.2 564.6 0.0 0.0 0.0 1,180.7 2,361.3 3,542.0 4,236.9 4,931.8 5,626.7 5,619.6 5,612.4 5,605.3 5,598.2 5,591.139,966.6 39,883.8 39,801.1 39,718.3 39,635.566,471.2 66,205.4 65,939.6 65,673.8 65,408.0
238,517.4 255,131.1 271,744.9 288,358.6 273,428.9 290,207.8 285,229.6 280,251.3 275,273.1 322,347.0 338,835.0 355,323.0 353,472.4 351,621.8 349,771.2 347,920.6 346,070.03,770.1 3,941.7 4,113.2 4,284.8 5,389.7 8,998.1 10,914.7 12,831.4 14,748.0 10,385.2 6,022.5 1,659.7 1,666.0 1,672.3 1,678.6 1,684.9 1,691.23,584.1 3,814.2 4,044.3 4,274.3 4,073.1 5,324.3 5,681.2 6,038.1 6,395.0 5,562.0 4,729.0 3,896.0 3,896.0 3,896.0 3,896.0 3,896.0 3,896.0
306,017.9 305,280.1 304,542.2 303,804.3 303,066.51,415.0 1,408.0 1,401.0 1,394.0 1,387.0
73,951.8 73,771.9 73,592.0 73,412.1 73,232.29,534.0 9,496.0 9,458.0 9,420.0 9,382.0
4,012.0 5,084.5 6,157.1 7,229.6 3,836.9 2,473.4 2,893.3 3,313.1 3,733.0 4,055.3 4,377.7 4,700.0 4,694.7 4,689.4 4,684.1 4,678.8 4,673.5239,984.7 248,216.9 256,449.0 264,681.2 290,859.2 271,772.7 250,205.2 228,637.7 207,070.2 247,625.0 265,172.0 282,719.0 281,606.4 280,493.8 279,381.2 278,268.6 277,156.049,057.3 51,770.4 54,483.6 57,196.7 32,846.9 34,536.7 38,664.8 42,792.9 46,921.0 46,745.0 46,745.0 46,745.0 46,745.0 46,745.0 46,745.0 46,745.0 46,745.0
169,356.0 185,059.9 200,763.9 216,467.9 243,639.4 208,500.4 199,146.0 189,791.5 180,437.0 168,726.7 157,016.3 145,306.0 144,384.9 143,463.8 142,542.7 141,621.6 140,700.527,973.9 27,832.8 27,691.7 27,550.6 27,409.5
344.1 342.2 340.3 338.4 336.58,053.3 9,769.4 11,485.5 13,201.7 14,165.7 12,567.9 11,773.2 10,978.6 10,184.0 11,418.7 12,653.3 13,888.0 13,784.1 13,680.2 13,576.3 13,472.4 13,368.54,478.8 4,653.1 4,827.5 5,001.9 2,530.3 3,686.2 4,507.8 5,329.4 6,151.0 5,235.3 4,319.7 3,404.0 3,413.4 3,422.8 3,432.2 3,441.6 3,451.0
418.0 404.5 390.9 377.4 237.8 441.8 429.9 417.9 406.0 811.3 1,216.7 1,622.0 1,617.2 1,612.4 1,607.6 1,602.8 1,598.07,314.3 6,928.6 6,542.9 6,157.2 5,771.5
18,206.3 18,164.5 18,122.8 18,081.0 18,039.3195,230.1 194,178.2 193,126.3 192,074.4 191,022.591,981.9 91,881.8 91,781.7 91,681.6 91,581.58,610.3 8,269.7 7,929.0 7,588.3 7,247.68,468.9 8,398.8 8,328.7 8,258.6 8,188.5
2,225.2 2,273.8 2,322.4 2,370.9 1,104.3 1,285.7 1,783.5 2,281.2 2,779.0 3,493.0 3,493.0 3,493.0 499.2 499.2 499.2 499.2 499.2500.0 447.0 394.0 341.1 288.1
52,065.8 51,962.6 51,859.3 51,756.1 51,652.981,503.0 88,644.0 95,785.0 102,926.0 95,995.6 103,045.9 101,731.6 100,417.3 99,103.0 98,687.0 98,687.0 98,687.0 98,687.0 98,687.0 98,687.0 98,687.0 98,687.0
18,321.5 18,314.0 18,306.5 18,299.0 18,291.584,327.8 84,279.6 84,231.4 84,183.2 84,135.03,468.9 3,449.8 3,430.7 3,411.6 3,392.5
100,996.5 100,476.0 99,955.5 99,435.0 98,914.542,265.6 57,241.1 72,216.6 87,192.0 68,849.6 89,215.7 98,970.0 108,724.4 118,478.7 116,070.3 100,497.7 84,925.0 84,518.6 84,112.2 83,705.8 83,299.4 82,893.0
153,421.2 148,647.0 126,826.0 105,005.0150,510.6 142,004.6 145,810.1 149,615.798,292.5 111,189.5 124,086.5 136,983.4
102,705.0130,517.3 103,085.0 102,958.3 102,831.7161,019.8 184,368.4 185,382.0 157,949.7143,931.3 149,627.5 155,323.6
38,190.0 43,034.0 47,878.0 52,722.036,215.7 37,553.8 37,765.9 37,977.931,102.8 32,174.1 33,245.5 34,316.9
17,490.015,044.5 16,548.0 16,862.0 17,176.012,618.1 11,275.2 12,037.6 13,541.113,347.1 13,104.1 12,861.1
214,388.0 239,046.7 263,705.3 288,364.0327,375.2 300,227.5 271,614.3 243,001.2231,518.6 241,428.9 251,339.2 261,249.5
25,948.024,257.3 27,314.0 26,858.7 26,403.318,025.0 11,775.7 18,144.0 21,200.718,553.6 18,377.4 18,201.2
47,218.0 40,965.7 34,713.3 28,461.054,540.9 54,445.4 52,036.2 49,627.144,967.8 53,017.6 61,067.5 69,117.4
83,703.7144,688.9 133,362.9 126,688.6 105,196.1154,709.5 157,773.7 167,340.8 156,014.8105,250.7 121,737.0 138,223.2
229,009.0 255,398.6 281,788.2 308,177.8398,524.3 385,000.6 333,003.4 281,006.2304,684.4 328,484.7 352,284.9 376,085.1
106,786.4164,372.8 138,604.0 127,998.1 117,392.3213,830.0 231,136.1 215,910.5 190,141.7176,474.6 188,926.4 201,378.2
6,524.0 5,613.3 4,702.7 3,792.01,279.4 2,059.9 3,547.9 5,036.01,552.3 1,714.5 1,876.7 2,038.9
36,475.081,617.1 95,400.0 75,758.3 56,116.731,262.5 53,333.0 54,051.4 67,834.326,442.4 28,049.1 29,655.8
108,959.0 101,561.3 94,163.6 86,765.8193,050.3 154,332.3 139,207.8 124,083.4104,411.9 120,831.8 137,251.7 153,671.6
37,528.067,971.1 65,901.6 61,325.3 49,426.767,323.1 71,774.3 72,110.0 70,040.549,808.0 55,646.4 61,484.8
282,039.0 273,988.6 265,938.1 257,887.7368,551.8 160,445.1 200,976.4 241,507.7274,692.4 284,423.2 294,153.9 303,884.6
819.04,843.8 5,864.0 4,182.3 2,500.73,096.0 0.0 2,803.3 3,823.51,806.6 2,236.4 2,666.2
Page 44 of 47

Table C-1. Agricultural Total Pumpage (ac-ft/yr)
Total 2006 Total 2007 Total 2008 Total 2009 Total 2010 Total 2011 Total 2012 Total 2013 Total 2014 Total 2015 Total 2016 Total 2017 Total 2018 Total 2019 Total 2020 Total 2021 Total 202216,580.1 16,607.1 16,634.1 16,661.2 16,688.2 16,517.5 16,346.9 16,176.2 16,005.5 15,834.9 15,664.2 15,493.6 15,322.9 15,152.3 14,981.6 14,968.6 14,955.66,746.6 6,746.6 6,746.6 6,746.6 6,746.6 6,746.7 6,746.7 6,746.8 6,746.8 6,746.8 6,746.9 6,746.9 6,746.9 6,747.0 6,747.0 6,747.0 6,747.0
162,210.2 161,878.4 161,546.6 161,214.8 160,883.0 160,591.0 160,299.0 160,007.0 159,715.0 159,423.0 159,131.0 158,839.0 158,547.0 158,255.0 157,963.0 157,702.9 157,442.892.0 92.0 92.0 92.0 92.0 92.1 92.2 92.3 92.4 92.5 92.6 92.7 92.8 92.9 93.0 93.1 93.2
729.4 729.8 730.2 730.6 731.0 731.5 732.0 732.5 733.0 733.5 734.0 734.5 735.0 735.5 736.0 736.6 737.227,711.2 27,592.9 27,474.6 27,356.3 27,238.0 27,124.1 27,010.2 26,896.3 26,782.4 26,668.5 26,554.6 26,440.7 26,326.8 26,212.9 26,099.0 26,213.4 26,327.8
154,151.8 153,725.2 153,298.5 152,871.9 152,445.2 152,008.6 151,572.0 151,135.4 150,698.7 150,262.1 149,825.5 149,388.9 148,952.2 148,515.6 148,079.0 147,578.5 147,078.098,848.6 98,460.7 98,072.8 97,684.9 97,297.0 96,924.0 96,551.0 96,178.0 95,805.0 95,432.0 95,059.0 94,686.0 94,313.0 93,940.0 93,567.0 93,208.2 92,849.419,126.6 19,114.2 19,101.8 19,089.4 19,077.0 19,133.1 19,189.2 19,245.3 19,301.4 19,357.5 19,413.6 19,469.7 19,525.8 19,581.9 19,638.0 19,637.4 19,636.817,901.6 17,830.7 17,759.8 17,688.9 17,618.0 17,550.0 17,482.0 17,414.0 17,346.0 17,278.0 17,210.0 17,142.0 17,074.0 17,006.0 16,938.0 16,872.5 16,807.083,367.4 83,019.3 82,671.2 82,323.1 81,975.0 81,640.9 81,306.8 80,972.7 80,638.6 80,304.5 79,970.4 79,636.3 79,302.2 78,968.1 78,634.0 78,314.2 77,994.41,298.3 1,296.4 1,294.4 1,292.5 1,290.6 1,288.2 1,285.9 1,283.5 1,281.2 1,278.8 1,276.5 1,274.1 1,271.7 1,269.4 1,267.0 1,264.4 1,261.8
118,523.0 118,523.0 118,523.0 118,523.0 118,523.0 118,523.0 118,523.0 118,523.0 118,523.0 118,523.0 118,523.0 118,523.0 118,523.0 118,523.0 118,523.0 118,523.0 118,523.0352.4 350.3 348.2 346.1 344.0 342.1 340.2 338.3 336.4 334.5 332.6 330.7 328.8 326.9 325.0 323.2 321.4
34,888.4 34,684.8 34,481.2 34,277.6 34,074.0 33,881.9 33,689.8 33,497.7 33,305.6 33,113.5 32,921.4 32,729.3 32,537.2 32,345.1 32,153.0 31,971.7 31,790.4243,353.4 242,557.8 241,762.2 240,966.6 240,171.0 239,400.8 238,630.6 237,860.4 237,090.2 236,320.0 235,549.8 234,779.6 234,009.4 233,239.2 232,469.0 231,723.0 230,977.0
2,123.6 2,117.2 2,110.8 2,104.4 2,098.0 2,091.7 2,085.4 2,079.1 2,072.8 2,066.5 2,060.2 2,053.9 2,047.6 2,041.3 2,035.0 2,029.0 2,023.01,600.6 1,595.7 1,590.8 1,585.9 1,581.0 1,576.3 1,571.6 1,566.9 1,562.2 1,557.5 1,552.8 1,548.1 1,543.4 1,538.7 1,534.0 1,529.4 1,524.85,583.9 5,576.8 5,569.7 5,562.6 5,555.4 5,548.7 5,542.0 5,535.2 5,528.5 5,521.8 5,515.1 5,508.3 5,501.6 5,494.9 5,488.1 5,481.4 5,474.7
39,552.7 39,470.0 39,387.2 39,304.4 39,221.6 39,144.3 39,066.9 38,989.5 38,912.2 38,834.8 38,757.5 38,680.1 38,602.7 38,525.4 38,448.0 38,388.7 38,329.565,142.2 64,876.4 64,610.6 64,344.8 64,079.0 63,823.8 63,568.6 63,313.4 63,058.2 62,803.0 62,547.8 62,292.6 62,037.4 61,782.2 61,527.0 61,281.9 61,036.8
344,219.4 342,368.8 340,518.2 338,667.6 336,817.0 335,062.8 333,308.6 331,554.4 329,800.2 328,046.0 326,291.8 324,537.6 322,783.4 321,029.2 319,275.0 317,612.2 315,949.41,697.4 1,703.7 1,710.0 1,716.3 1,722.6 1,717.8 1,713.1 1,708.3 1,703.5 1,698.8 1,694.0 1,689.2 1,684.4 1,679.7 1,674.9 1,667.9 1,660.83,896.0 3,896.0 3,896.0 3,896.0 3,896.0 3,896.0 3,896.0 3,896.0 3,896.0 3,896.0 3,896.0 3,896.0 3,896.0 3,896.0 3,896.0 3,896.0 3,896.0
302,328.6 301,590.8 300,852.9 300,115.0 299,377.2 298,619.4 297,861.7 297,103.9 296,346.2 295,588.4 294,830.7 294,072.9 293,315.2 292,557.4 291,799.7 291,019.1 290,238.61,380.0 1,373.0 1,366.0 1,359.0 1,352.0 1,345.8 1,339.6 1,333.4 1,327.2 1,321.0 1,314.8 1,308.6 1,302.4 1,296.2 1,290.0 1,284.3 1,278.6
73,052.3 72,872.4 72,692.4 72,512.5 72,332.6 72,100.3 71,867.9 71,635.5 71,403.1 71,170.8 70,938.4 70,706.0 70,473.7 70,241.3 70,008.9 69,780.6 69,552.39,344.0 9,306.0 9,268.0 9,230.0 9,192.0 9,155.4 9,118.8 9,082.2 9,045.6 9,009.0 8,972.4 8,935.8 8,899.2 8,862.6 8,826.0 8,790.9 8,755.84,668.2 4,662.9 4,657.6 4,652.3 4,647.0 4,641.7 4,636.4 4,631.1 4,625.8 4,620.5 4,615.2 4,609.9 4,604.6 4,599.3 4,594.0 4,588.7 4,583.4
276,043.4 274,930.8 273,818.2 272,705.6 271,593.0 270,523.2 269,453.4 268,383.6 267,313.8 266,244.0 265,174.2 264,104.4 263,034.6 261,964.8 260,895.0 259,866.5 258,838.046,745.0 46,745.0 46,745.0 46,745.0 46,745.0 46,745.0 46,745.0 46,745.0 46,745.0 46,745.0 46,745.0 46,745.0 46,745.0 46,745.0 46,745.0 46,745.0 46,745.0
139,779.4 138,858.3 137,937.2 137,016.1 136,095.0 135,241.4 134,387.8 133,534.2 132,680.6 131,827.0 130,973.4 130,119.8 129,266.2 128,412.6 127,559.0 126,733.9 125,908.827,268.4 27,127.3 26,986.2 26,845.1 26,704.0 26,559.8 26,415.6 26,271.4 26,127.2 25,983.0 25,838.8 25,694.6 25,550.4 25,406.2 25,262.0 25,138.9 25,015.8
334.6 332.7 330.8 328.9 327.0 325.3 323.6 321.9 320.2 318.5 316.8 315.1 313.4 311.7 310.0 308.3 306.613,264.5 13,160.6 13,056.7 12,952.8 12,848.9 12,825.5 12,802.1 12,778.7 12,755.3 12,731.8 12,708.4 12,685.0 12,661.6 12,638.2 12,614.8 12,590.4 12,566.13,460.4 3,469.8 3,479.2 3,488.6 3,498.0 3,498.0 3,498.0 3,498.0 3,498.0 3,498.0 3,498.0 3,498.0 3,498.0 3,498.0 3,498.0 3,498.0 3,498.01,593.2 1,588.4 1,583.6 1,578.8 1,574.0 1,569.3 1,564.6 1,559.9 1,555.2 1,550.5 1,545.8 1,541.1 1,536.4 1,531.7 1,527.0 1,522.5 1,518.05,385.8 5,000.1 4,614.4 4,228.7 3,843.0 3,761.6 3,680.2 3,598.7 3,517.3 3,435.9 3,354.5 3,273.1 3,191.7 3,110.2 3,028.8 3,028.8 3,028.8
17,997.5 17,955.8 17,914.1 17,872.3 17,830.6 17,809.3 17,788.0 17,766.7 17,745.4 17,724.2 17,702.9 17,681.6 17,660.3 17,639.0 17,617.8 17,617.8 17,617.8189,970.6 188,918.7 187,866.8 186,814.9 185,763.0 184,892.2 184,021.4 183,150.6 182,279.8 181,409.0 180,538.2 179,667.4 178,796.6 177,925.8 177,055.0 176,205.0 175,355.091,481.4 91,381.3 91,281.2 91,181.1 91,081.0 90,982.0 90,883.0 90,784.0 90,685.0 90,586.0 90,487.0 90,388.0 90,289.0 90,190.0 90,091.0 89,993.1 89,895.26,907.0 6,566.3 6,225.6 5,884.9 5,544.3 5,440.0 5,335.8 5,231.5 5,127.2 5,023.0 4,918.7 4,814.5 4,710.2 4,605.9 4,501.7 4,478.3 4,455.08,118.4 8,048.3 7,978.2 7,908.2 7,838.1 7,792.1 7,746.1 7,700.1 7,654.1 7,608.1 7,562.2 7,516.2 7,470.2 7,424.2 7,378.2 6,877.8 6,377.4
499.2 499.2 499.2 499.2 499.2 499.2 499.2 499.2 499.2 499.2 499.2 499.2 499.2 499.2 499.2 499.2 499.2235.1 182.1 129.1 76.1 23.2 22.4 21.6 20.8 20.0 19.2 18.4 17.7 16.9 16.1 15.3 15.0 14.6
51,549.7 51,446.5 51,343.3 51,240.0 51,136.8 51,046.6 50,956.3 50,866.1 50,775.8 50,685.5 50,595.3 50,505.0 50,414.8 50,324.5 50,234.2 50,129.5 50,024.798,687.0 98,687.0 98,687.0 98,687.0 98,687.0 98,687.0 98,687.0 98,687.0 98,687.0 98,687.0 98,687.0 98,687.0 98,687.0 98,687.0 98,687.0 98,687.0 98,687.018,284.0 18,276.5 18,269.0 18,261.5 18,254.0 18,247.3 18,240.6 18,233.9 18,227.2 18,220.5 18,213.8 18,207.1 18,200.4 18,193.7 18,187.0 18,180.8 18,174.684,086.8 84,038.6 83,990.4 83,942.2 83,894.0 83,542.3 83,190.6 82,838.9 82,487.2 82,135.5 81,783.8 81,432.1 81,080.4 80,728.7 80,377.0 80,633.2 80,889.43,373.4 3,354.3 3,335.2 3,316.1 3,297.0 3,279.2 3,261.4 3,243.6 3,225.8 3,208.0 3,190.2 3,172.4 3,154.6 3,136.8 3,119.0 3,101.9 3,084.8
98,394.0 97,873.5 97,353.0 96,832.5 96,312.0 95,818.2 95,324.4 94,830.6 94,336.8 93,843.0 93,349.2 92,855.4 92,361.6 91,867.8 91,374.0 90,905.5 90,437.082,486.6 82,080.2 81,673.8 81,267.4 80,861.0 80,473.9 80,086.8 79,699.7 79,312.6 78,925.5 78,538.4 78,151.3 77,764.2 77,377.1 76,990.0 76,621.5 76,253.0
Page 45 of 47
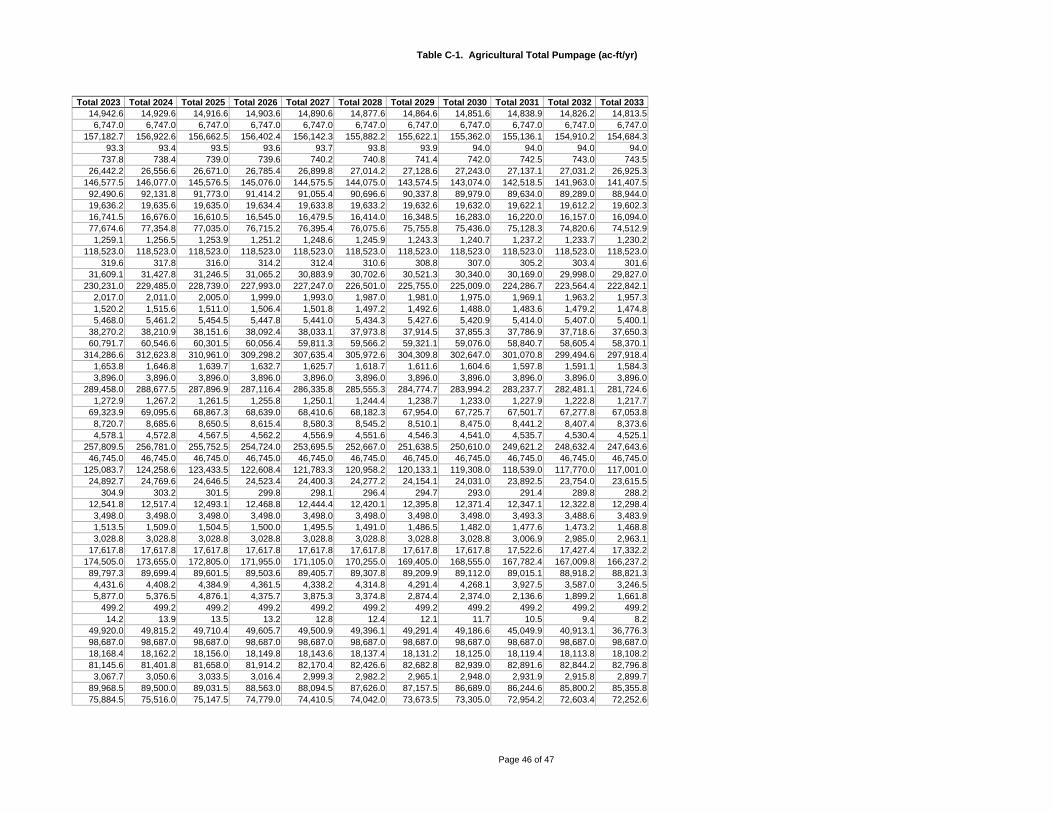
Table C-1. Agricultural Total Pumpage (ac-ft/yr)
Total 2023 Total 2024 Total 2025 Total 2026 Total 2027 Total 2028 Total 2029 Total 2030 Total 2031 Total 2032 Total 203314,942.6 14,929.6 14,916.6 14,903.6 14,890.6 14,877.6 14,864.6 14,851.6 14,838.9 14,826.2 14,813.56,747.0 6,747.0 6,747.0 6,747.0 6,747.0 6,747.0 6,747.0 6,747.0 6,747.0 6,747.0 6,747.0
157,182.7 156,922.6 156,662.5 156,402.4 156,142.3 155,882.2 155,622.1 155,362.0 155,136.1 154,910.2 154,684.393.3 93.4 93.5 93.6 93.7 93.8 93.9 94.0 94.0 94.0 94.0
737.8 738.4 739.0 739.6 740.2 740.8 741.4 742.0 742.5 743.0 743.526,442.2 26,556.6 26,671.0 26,785.4 26,899.8 27,014.2 27,128.6 27,243.0 27,137.1 27,031.2 26,925.3
146,577.5 146,077.0 145,576.5 145,076.0 144,575.5 144,075.0 143,574.5 143,074.0 142,518.5 141,963.0 141,407.592,490.6 92,131.8 91,773.0 91,414.2 91,055.4 90,696.6 90,337.8 89,979.0 89,634.0 89,289.0 88,944.019,636.2 19,635.6 19,635.0 19,634.4 19,633.8 19,633.2 19,632.6 19,632.0 19,622.1 19,612.2 19,602.316,741.5 16,676.0 16,610.5 16,545.0 16,479.5 16,414.0 16,348.5 16,283.0 16,220.0 16,157.0 16,094.077,674.6 77,354.8 77,035.0 76,715.2 76,395.4 76,075.6 75,755.8 75,436.0 75,128.3 74,820.6 74,512.91,259.1 1,256.5 1,253.9 1,251.2 1,248.6 1,245.9 1,243.3 1,240.7 1,237.2 1,233.7 1,230.2
118,523.0 118,523.0 118,523.0 118,523.0 118,523.0 118,523.0 118,523.0 118,523.0 118,523.0 118,523.0 118,523.0319.6 317.8 316.0 314.2 312.4 310.6 308.8 307.0 305.2 303.4 301.6
31,609.1 31,427.8 31,246.5 31,065.2 30,883.9 30,702.6 30,521.3 30,340.0 30,169.0 29,998.0 29,827.0230,231.0 229,485.0 228,739.0 227,993.0 227,247.0 226,501.0 225,755.0 225,009.0 224,286.7 223,564.4 222,842.1
2,017.0 2,011.0 2,005.0 1,999.0 1,993.0 1,987.0 1,981.0 1,975.0 1,969.1 1,963.2 1,957.31,520.2 1,515.6 1,511.0 1,506.4 1,501.8 1,497.2 1,492.6 1,488.0 1,483.6 1,479.2 1,474.85,468.0 5,461.2 5,454.5 5,447.8 5,441.0 5,434.3 5,427.6 5,420.9 5,414.0 5,407.0 5,400.1
38,270.2 38,210.9 38,151.6 38,092.4 38,033.1 37,973.8 37,914.5 37,855.3 37,786.9 37,718.6 37,650.360,791.7 60,546.6 60,301.5 60,056.4 59,811.3 59,566.2 59,321.1 59,076.0 58,840.7 58,605.4 58,370.1
314,286.6 312,623.8 310,961.0 309,298.2 307,635.4 305,972.6 304,309.8 302,647.0 301,070.8 299,494.6 297,918.41,653.8 1,646.8 1,639.7 1,632.7 1,625.7 1,618.7 1,611.6 1,604.6 1,597.8 1,591.1 1,584.33,896.0 3,896.0 3,896.0 3,896.0 3,896.0 3,896.0 3,896.0 3,896.0 3,896.0 3,896.0 3,896.0
289,458.0 288,677.5 287,896.9 287,116.4 286,335.8 285,555.3 284,774.7 283,994.2 283,237.7 282,481.1 281,724.61,272.9 1,267.2 1,261.5 1,255.8 1,250.1 1,244.4 1,238.7 1,233.0 1,227.9 1,222.8 1,217.7
69,323.9 69,095.6 68,867.3 68,639.0 68,410.6 68,182.3 67,954.0 67,725.7 67,501.7 67,277.8 67,053.88,720.7 8,685.6 8,650.5 8,615.4 8,580.3 8,545.2 8,510.1 8,475.0 8,441.2 8,407.4 8,373.64,578.1 4,572.8 4,567.5 4,562.2 4,556.9 4,551.6 4,546.3 4,541.0 4,535.7 4,530.4 4,525.1
257,809.5 256,781.0 255,752.5 254,724.0 253,695.5 252,667.0 251,638.5 250,610.0 249,621.2 248,632.4 247,643.646,745.0 46,745.0 46,745.0 46,745.0 46,745.0 46,745.0 46,745.0 46,745.0 46,745.0 46,745.0 46,745.0
125,083.7 124,258.6 123,433.5 122,608.4 121,783.3 120,958.2 120,133.1 119,308.0 118,539.0 117,770.0 117,001.024,892.7 24,769.6 24,646.5 24,523.4 24,400.3 24,277.2 24,154.1 24,031.0 23,892.5 23,754.0 23,615.5
304.9 303.2 301.5 299.8 298.1 296.4 294.7 293.0 291.4 289.8 288.212,541.8 12,517.4 12,493.1 12,468.8 12,444.4 12,420.1 12,395.8 12,371.4 12,347.1 12,322.8 12,298.43,498.0 3,498.0 3,498.0 3,498.0 3,498.0 3,498.0 3,498.0 3,498.0 3,493.3 3,488.6 3,483.91,513.5 1,509.0 1,504.5 1,500.0 1,495.5 1,491.0 1,486.5 1,482.0 1,477.6 1,473.2 1,468.83,028.8 3,028.8 3,028.8 3,028.8 3,028.8 3,028.8 3,028.8 3,028.8 3,006.9 2,985.0 2,963.1
17,617.8 17,617.8 17,617.8 17,617.8 17,617.8 17,617.8 17,617.8 17,617.8 17,522.6 17,427.4 17,332.2174,505.0 173,655.0 172,805.0 171,955.0 171,105.0 170,255.0 169,405.0 168,555.0 167,782.4 167,009.8 166,237.289,797.3 89,699.4 89,601.5 89,503.6 89,405.7 89,307.8 89,209.9 89,112.0 89,015.1 88,918.2 88,821.34,431.6 4,408.2 4,384.9 4,361.5 4,338.2 4,314.8 4,291.4 4,268.1 3,927.5 3,587.0 3,246.55,877.0 5,376.5 4,876.1 4,375.7 3,875.3 3,374.8 2,874.4 2,374.0 2,136.6 1,899.2 1,661.8
499.2 499.2 499.2 499.2 499.2 499.2 499.2 499.2 499.2 499.2 499.214.2 13.9 13.5 13.2 12.8 12.4 12.1 11.7 10.5 9.4 8.2
49,920.0 49,815.2 49,710.4 49,605.7 49,500.9 49,396.1 49,291.4 49,186.6 45,049.9 40,913.1 36,776.398,687.0 98,687.0 98,687.0 98,687.0 98,687.0 98,687.0 98,687.0 98,687.0 98,687.0 98,687.0 98,687.018,168.4 18,162.2 18,156.0 18,149.8 18,143.6 18,137.4 18,131.2 18,125.0 18,119.4 18,113.8 18,108.281,145.6 81,401.8 81,658.0 81,914.2 82,170.4 82,426.6 82,682.8 82,939.0 82,891.6 82,844.2 82,796.83,067.7 3,050.6 3,033.5 3,016.4 2,999.3 2,982.2 2,965.1 2,948.0 2,931.9 2,915.8 2,899.7
89,968.5 89,500.0 89,031.5 88,563.0 88,094.5 87,626.0 87,157.5 86,689.0 86,244.6 85,800.2 85,355.875,884.5 75,516.0 75,147.5 74,779.0 74,410.5 74,042.0 73,673.5 73,305.0 72,954.2 72,603.4 72,252.6
Page 46 of 47

Table C-1. Agricultural Total Pumpage (ac-ft/yr)
Total 2034 Total 2035 Total 2036 Total 2037 Total 2038 Total 2039 Total 2040 Total 2041 Total 2042 Total 2043 Total 2044 Total 2045 Total 2046 Total 2047 Total 2048 Total 2049 Total 205014,800.8 14,788.1 14,775.4 14,762.7 14,750.0 14,737.3 14,724.6 14,712.0 14,699.4 14,686.8 14,674.2 14,661.6 14,649.0 14,636.4 14,623.8 14,611.2 14,598.66,747.0 6,747.0 6,747.0 6,747.0 6,747.0 6,747.0 6,747.0 6,747.0 6,747.0 6,747.0 6,747.0 6,747.0 6,747.0 6,747.0 6,747.0 6,747.0 6,747.0
154,458.4 154,232.5 154,006.6 153,780.7 153,554.8 153,328.9 153,103.0 152,878.5 152,654.0 152,429.5 152,205.0 151,980.5 151,756.0 151,531.5 151,307.0 151,082.5 150,858.094.0 94.0 94.0 94.0 94.0 94.0 94.0 94.1 94.2 94.3 94.4 94.5 94.6 94.7 94.8 94.9 95.0
744.0 744.5 745.0 745.5 746.0 746.5 747.0 747.4 747.8 748.2 748.6 749.0 749.4 749.8 750.2 750.6 751.026,819.4 26,713.5 26,607.6 26,501.7 26,395.8 26,289.9 26,184.0 26,082.0 25,980.0 25,878.0 25,776.0 25,674.0 25,572.0 25,470.0 25,368.0 25,266.0 25,164.0
140,852.0 140,296.5 139,741.0 139,185.5 138,630.0 138,074.5 137,519.0 136,982.0 136,445.0 135,908.0 135,371.0 134,834.0 134,297.0 133,760.0 133,223.0 132,686.0 132,149.088,599.0 88,254.0 87,909.0 87,564.0 87,219.0 86,874.0 86,529.0 86,197.3 85,865.6 85,533.9 85,202.2 84,870.5 84,538.8 84,207.1 83,875.4 83,543.7 83,212.019,592.4 19,582.5 19,572.6 19,562.7 19,552.8 19,542.9 19,533.0 19,522.3 19,511.6 19,500.9 19,490.2 19,479.5 19,468.8 19,458.1 19,447.4 19,436.7 19,426.016,031.0 15,968.0 15,905.0 15,842.0 15,779.0 15,716.0 15,653.0 15,592.5 15,532.0 15,471.5 15,411.0 15,350.5 15,290.0 15,229.5 15,169.0 15,108.5 15,048.074,205.2 73,897.5 73,589.8 73,282.1 72,974.4 72,666.7 72,359.0 72,063.8 71,768.6 71,473.4 71,178.2 70,883.0 70,587.8 70,292.6 69,997.4 69,702.2 69,407.01,226.7 1,223.3 1,219.8 1,216.3 1,212.8 1,209.3 1,205.8 1,202.4 1,199.0 1,195.6 1,192.2 1,188.7 1,185.3 1,181.9 1,178.5 1,175.1 1,171.6
118,523.0 118,523.0 118,523.0 118,523.0 118,523.0 118,523.0 118,523.0 118,523.0 118,523.0 118,523.0 118,523.0 118,523.0 118,523.0 118,523.0 118,523.0 118,523.0 118,523.0299.8 298.0 296.2 294.4 292.6 290.8 289.0 287.4 285.8 284.2 282.6 281.0 279.4 277.8 276.2 274.6 273.0
29,656.0 29,485.0 29,314.0 29,143.0 28,972.0 28,801.0 28,630.0 28,468.6 28,307.2 28,145.8 27,984.4 27,823.0 27,661.6 27,500.2 27,338.8 27,177.4 27,016.0222,119.8 221,397.5 220,675.2 219,952.9 219,230.6 218,508.3 217,786.0 217,086.6 216,387.2 215,687.8 214,988.4 214,289.0 213,589.6 212,890.2 212,190.8 211,491.4 210,792.0
1,951.4 1,945.5 1,939.6 1,933.7 1,927.8 1,921.9 1,916.0 1,910.2 1,904.4 1,898.6 1,892.8 1,887.0 1,881.2 1,875.4 1,869.6 1,863.8 1,858.01,470.4 1,466.0 1,461.6 1,457.2 1,452.8 1,448.4 1,444.0 1,439.7 1,435.4 1,431.1 1,426.8 1,422.5 1,418.2 1,413.9 1,409.6 1,405.3 1,401.05,393.2 5,386.3 5,379.4 5,372.5 5,365.6 5,358.7 5,351.8 5,345.0 5,338.2 5,331.4 5,324.6 5,317.9 5,311.1 5,304.3 5,297.5 5,290.7 5,284.0
37,582.0 37,513.7 37,445.3 37,377.0 37,308.7 37,240.4 37,172.1 37,106.1 37,040.1 36,974.0 36,908.0 36,842.0 36,776.0 36,710.0 36,644.0 36,578.0 36,512.058,134.8 57,899.5 57,664.2 57,428.9 57,193.6 56,958.3 56,723.0 56,497.0 56,271.0 56,045.0 55,819.0 55,593.0 55,367.0 55,141.0 54,915.0 54,689.0 54,463.0
296,342.2 294,766.0 293,189.8 291,613.6 290,037.4 288,461.2 286,885.0 285,390.8 283,896.6 282,402.4 280,908.2 279,414.0 277,919.8 276,425.6 274,931.4 273,437.2 271,943.01,577.6 1,570.8 1,564.0 1,557.3 1,550.5 1,543.8 1,537.0 1,530.4 1,523.9 1,517.3 1,510.8 1,504.2 1,497.7 1,491.1 1,484.6 1,478.0 1,471.53,896.0 3,896.0 3,896.0 3,896.0 3,896.0 3,896.0 3,896.0 3,896.0 3,896.0 3,896.0 3,896.0 3,896.0 3,896.0 3,896.0 3,896.0 3,896.0 3,896.0
280,968.1 280,211.6 279,455.1 278,698.6 277,942.0 277,185.5 276,429.0 275,669.6 274,910.2 274,150.8 273,391.4 272,632.0 271,872.7 271,113.3 270,353.9 269,594.5 268,835.11,212.6 1,207.5 1,202.4 1,197.3 1,192.2 1,187.1 1,182.0 1,177.4 1,172.8 1,168.2 1,163.6 1,159.0 1,154.4 1,149.8 1,145.2 1,140.6 1,136.0
66,829.9 66,605.9 66,382.0 66,158.0 65,934.1 65,710.1 65,486.2 65,266.9 65,047.7 64,828.4 64,609.2 64,389.9 64,170.7 63,951.4 63,732.2 63,512.9 63,293.78,339.8 8,306.0 8,272.2 8,238.4 8,204.6 8,170.8 8,137.0 8,104.6 8,072.2 8,039.8 8,007.4 7,975.0 7,942.6 7,910.2 7,877.8 7,845.4 7,813.04,519.8 4,514.5 4,509.2 4,503.9 4,498.6 4,493.3 4,488.0 4,482.7 4,477.4 4,472.1 4,466.8 4,461.5 4,456.2 4,450.9 4,445.6 4,440.3 4,435.0
246,654.8 245,666.0 244,677.2 243,688.4 242,699.6 241,710.8 240,722.0 239,771.4 238,820.8 237,870.2 236,919.6 235,969.0 235,018.4 234,067.8 233,117.2 232,166.6 231,216.046,745.0 46,745.0 46,745.0 46,745.0 46,745.0 46,745.0 46,745.0 46,745.0 46,745.0 46,745.0 46,745.0 46,745.0 46,745.0 46,745.0 46,745.0 46,745.0 46,745.0
116,232.0 115,463.0 114,694.0 113,925.0 113,156.0 112,387.0 111,618.0 110,876.0 110,134.0 109,392.0 108,650.0 107,908.0 107,166.0 106,424.0 105,682.0 104,940.0 104,198.023,477.0 23,338.5 23,200.0 23,061.5 22,923.0 22,784.5 22,646.0 22,489.7 22,333.4 22,177.1 22,020.8 21,864.5 21,708.2 21,551.9 21,395.6 21,239.3 21,083.0
286.6 285.0 283.4 281.8 280.2 278.6 277.0 275.5 274.0 272.5 271.0 269.5 268.0 266.5 265.0 263.5 262.012,274.1 12,249.8 12,225.4 12,201.1 12,176.8 12,152.4 12,128.1 12,103.9 12,079.7 12,055.4 12,031.2 12,007.0 11,982.8 11,958.5 11,934.3 11,910.1 11,885.93,479.2 3,474.5 3,469.8 3,465.1 3,460.4 3,455.7 3,451.0 3,465.6 3,480.2 3,494.8 3,509.4 3,524.0 3,538.6 3,553.2 3,567.8 3,582.4 3,597.01,464.4 1,460.0 1,455.6 1,451.2 1,446.8 1,442.4 1,438.0 1,433.6 1,429.2 1,424.8 1,420.4 1,416.0 1,411.6 1,407.2 1,402.8 1,398.4 1,394.02,941.2 2,919.3 2,897.5 2,875.6 2,853.7 2,831.8 2,809.9 2,528.9 2,247.9 1,966.9 1,685.9 1,404.9 1,123.9 843.0 562.0 281.0 0.0
17,237.1 17,141.9 17,046.7 16,951.5 16,856.4 16,761.2 16,666.0 14,999.4 13,332.8 11,666.2 9,999.6 8,333.0 6,666.4 4,999.8 3,333.2 1,666.6 0.0165,464.6 164,692.0 163,919.4 163,146.8 162,374.2 161,601.6 160,829.0 160,122.9 159,416.8 158,710.7 158,004.6 157,298.5 156,592.4 155,886.3 155,180.2 154,474.1 153,768.088,724.4 88,627.5 88,530.6 88,433.7 88,336.8 88,239.9 88,143.0 88,047.1 87,951.2 87,855.3 87,759.4 87,663.5 87,567.6 87,471.7 87,375.8 87,279.9 87,184.02,906.0 2,565.4 2,224.9 1,884.4 1,543.8 1,203.3 862.8 776.5 690.2 603.9 517.7 431.4 345.1 258.8 172.6 86.3 0.01,424.4 1,187.0 949.6 712.2 474.8 237.4 0.0 0.0 0.0 0.0 0.0 0.0 0.0 0.0 0.0 0.0 0.0
499.2 499.2 499.2 499.2 499.2 499.2 499.2 499.2 499.2 499.2 499.2 499.2 499.2 499.2 499.2 499.2 499.27.0 5.9 4.7 3.5 2.3 1.2 0.0 0.0 0.0 0.0 0.0 0.0 0.0 0.0 0.0 0.0 0.0
32,639.6 28,502.8 24,366.1 20,229.3 16,092.5 11,955.8 7,819.0 7,037.1 6,255.2 5,473.3 4,691.4 3,909.5 3,127.6 2,345.7 1,563.8 781.9 0.098,687.0 98,687.0 98,687.0 98,687.0 98,687.0 98,687.0 98,687.0 98,687.0 98,687.0 98,687.0 98,687.0 98,687.0 98,687.0 98,687.0 98,687.0 98,687.0 98,687.018,102.6 18,097.0 18,091.4 18,085.8 18,080.2 18,074.6 18,069.0 18,063.9 18,058.8 18,053.7 18,048.6 18,043.5 18,038.4 18,033.3 18,028.2 18,023.1 18,018.082,749.4 82,702.0 82,654.6 82,607.2 82,559.8 82,512.4 82,465.0 82,417.9 82,370.8 82,323.7 82,276.6 82,229.5 82,182.4 82,135.3 82,088.2 82,041.1 81,994.02,883.6 2,867.5 2,851.4 2,835.3 2,819.2 2,803.1 2,787.0 2,778.4 2,769.8 2,761.2 2,752.6 2,744.0 2,735.4 2,726.8 2,718.2 2,709.6 2,701.0
84,911.4 84,467.0 84,022.6 83,578.2 83,133.8 82,689.4 82,245.0 81,823.3 81,401.6 80,979.9 80,558.2 80,136.5 79,714.8 79,293.1 78,871.4 78,449.7 78,028.071,901.8 71,551.0 71,200.2 70,849.4 70,498.6 70,147.8 69,797.0 69,462.9 69,128.8 68,794.7 68,460.6 68,126.5 67,792.4 67,458.3 67,124.2 66,790.1 66,456.0
Page 47 of 47

Appendix D
Simulated and Observed Hydrographs for Transient
Model Calibration
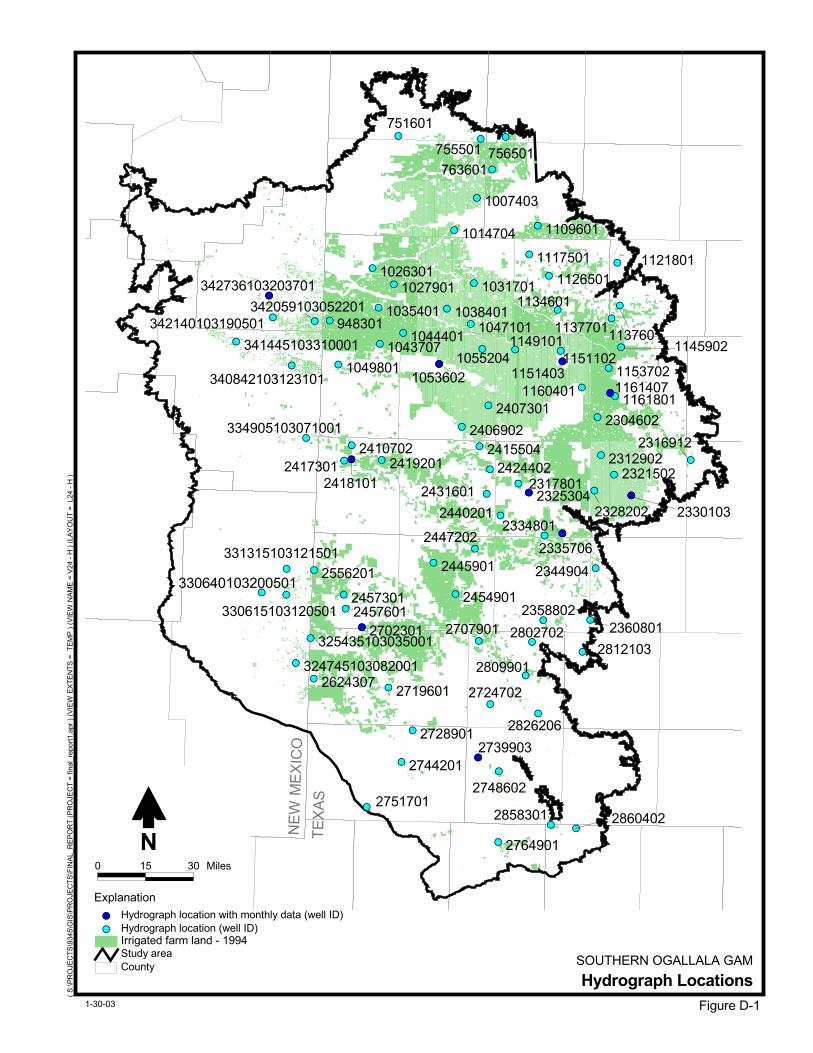
��������
�����
��
����
����
����
��
� ��
����
����
�
���
��
����
�������
!"#
$�%�"
�&��'
� (
� )�
���
�����
*�
&��'�
(��
�* �
��'+
����,
�&���
�-�.
����
��+���
�,�&
��.�, �������������*�������������� ���
��
����
��
��
��
��
��
��
����
��
����
���� ���� ��
���� ��
��
�� ��
��
��
��
��
��
��
��
��
��
��
��
��
����
��
��
�� ��
�� ��
��
��
��
��
��
����
��
��
��
��
�� ��
��
��
��
��
��
��
��
����
��
�� ��
����
����
��
��
��
��
��
��
��
��
��
����
��
��
����
��
��
��
��
��
����
��
��
��
��
� (
�* )
���
� )�
�
+/+0���
+/��+��
+/��/��
����/�/����0��
+0�+���
��+�0��
���/1�����//��
����/�����0���
���/���
+���/�++��/��� +���+��
+��0���+��+��+
+�+���+
+�+0+�+ +������
��+/�1���+��/��
��+��������������+��������++��
+0�+/�+
+0�����+/+�/�+
���/���
����/��
+��1��+
������+����/�+��1�0��
+���1�+
��1���/
�+�������������
+1+���/ +/��1��
+������
+�1�0��
+0�0��� +01���+
�������������+
��1�����������
+������+�+���+
+���1��
�����������+��
+��/���+��1��+
����1�+
����������+����
���1�����+��������1������+����
�+�/������0+���
+��/0��+���+��
+���0��
+�+����
+���/�1
+��00�+
+/�01�+
+/�����
+/1����
/��1��/�����
��+1�����+/���
���������0���
/�1���/1�1��
����1��
���������������
���0�+����+����
����������/����
���/�����+1���
����1��
+��/+�++������
+������+��1+��
+��/���+��/1��
+/�+��� +/�/���
+0+1+�1
��23 !�4��
�� �� �� *��!5
6"����$�#�
�#3�$7�$387�� !�
�� ,78 #2 �"9��#:�$�#���;!����4&�� ,78 #2 �"9��#:�$�#��;�$9�<#�$9�7�8�$���;!����4&
� �2�$!8��� <����8�������

Table D-1. Well Locations Page 1 of 2
Name Well ID X-Coordinate Y-Coordinate
ANDREWS1 2728901 4151430.44 20150514.67 ANDREWS2 2744201 4133013.62 20098137.35 ANDREWS3 2751701 4075341.60 20023780.13 BAILEY1 1043707 4096906.53 20790090.92 BAILEY2 1049801 4028543.99 20755921.39 BORDEN1 2812103 4432587.56 20280676.80 BRISCOE1 1121801 4490034.68 20924412.34 BRISCOE2 1137601 4494481.77 20853670.96 BRISCOE3 1137701 4480884.20 20832578.24 CASTRO1 1031701 4253131.03 20890595.60 CASTRO2 1038401 4208299.29 20848326.49 CASTRO3 1047101 4247580.17 20822922.64 COCHRAN1 2410702 4050544.96 20622511.52 COCHRAN2 2417301 4037974.81 20597035.28 COCHRAN3 2419201 4100515.60 20597782.14 COCHRAN4 2418101 4050265.001 20598828.43 CROSBY1 2312902 4463317.10 20605637.39 CROSBY2 2321502 4484910.85 20573575.80 CROSBY3 2328202 4452393.40 20547193.30 CROSBY4 2330103 4513456.675 20539510.7 CURRY1 342736103203701 3914051.53 20870087.99 CURRY2 342140103190501 3920413.12 20833972.53 CURRY3 342059103052201 3989482.84 20827709.58 DAWSON1 2802702 4349389.98 20296887.27 DAWSON2 2809901 4338417.61 20241370.66 DAWSON3 2724702 4279696.94 20193831.08 DAWSON4 2707901 4260900 20298678 DAWSON5 2826206 4358922 20178429 DEAFSMITH1 1007403 4257942.46 21031823.64 DEAFSMITH2 1014704 4220354.00 20978161.94 DICKENS1 2316912 4611569.84 20597895.30 FLOYD1 1145902 4496281.90 20784336.69 FLOYD2 1153702 4475863.26 20749888.19 FLOYD3 1161801 4486416.36 20703593.45 FLOYD4 2304602 4457513.08 20668896.60 FLOYD5 1161407 4478435.862 20708980.47 GAINES1 325435103035001 3982648.90 20303015.94 GAINES2 2624307 3988041.65 20236028.94 GAINES3 2719601 4111466.79 20221121.46 GARZA1 2344904 4454058.42 20419104.22 GARZA2 2360801 4445065.68 20333172.58 GLASSCOCK1 2858301 4380174.94 19994188.07 GLASSCOCK2 2860402 4422010.72 19988593.48 HALE1 1149101 4321156.00 20780757.27 HALE2 1151102 4396539.39 20778578.02
P:\9345\GAM-Rpt.1-03\ApdxD\ApdxD1_Well-Lctn.doc

Table D-1. Well Locations Page 2 of 2
P:\9345\GAM-Rpt.1-03\ApdxD\ApdxD1_Well-Lctn.doc
Name Well ID X-Coordinate Y-Coordinate HALE3 1160401 4431650.61 20717610.15 HALE4 1151403 4399199.536 20761306.13 HOCKLEY1 2415504 4262136.77 20620825.59 HOCKLEY2 2424402 4279348.81 20582848.26 HOCKLEY3 2431601 4274274.16 20541727.70 LAMB1 1044401 4135509.78 20808177.93 LAMB2 1055204 4266898.33 20781848.48 LAMB3 2407301 4277001.63 20688348.37 LAMB4 2406902 4233110.83 20652892.21 LAMB5 1053602 4195280.898 20756914.4 LEA1 331315103121501 3942962.99 20417571.69 LEA2 330640103200501 3901926.92 20378786.14 LEA3 330615103120501 3942588.62 20375069.27 LEA4 324745103082001 3958502.08 20262160.34 LUBBOCK1 2317801 4326383.19 20558805.86 LUBBOCK2 2440201 4297100.77 20506163.37 LUBBOCK3 2334801 4369821.60 20472713.22 LUBBOCK4 2325304 4344096.97 20543920.14 LUBBOCK5 2335706 4399079.298 20476402.39 LYNN1 2358802 4367780.98 20332925.80 MARTIN1 2748602 4293982.91 20083165.95 MARTIN2 2739903 4259729.408 20105689.38 MIDLAND1 2764901 4293030.03 19965706.41 OLDHAM1 751601 4127901.53 21133994.17 OLDHAM2 755501 4263992.75 21129589.64 PARMER1 1026301 4084857.98 20915230.69 PARMER2 1027901 4120326.66 20888570.57 PARMER3 1035401 4094885.36 20849923.87 PARMER4 948301 4014049.37 20828963.65 POTTER1 756501 4305150.83 21132728.06 RANDALL1 763601 4283251.28 21078835.35 RANDALL2 1109601 4358426.29 20985658.08 ROOSEVELT1 341445103310001 3859447.17 20793733.46 ROOSEVELT2 340842103123101 3951380.75 20754207.50 ROOSEVELT3 334905103071001 3974980.21 20634397.03 SWISHER1 1117501 4344278.05 20938382.60 SWISHER2 1126501 4377181.37 20902614.23 SWISHER3 1134601 4391479.50 20846042.98 TERRY1 2447202 4254567.38 20451211.87 TERRY2 2445901 4185937.28 20427740.73 TERRY3 2454901 4222271.07 20376336.29 YOAKUM1 2556201 3988154.13 20415782.85 YOAKUM2 2457301 4037313.88 20375268.62 YOAKUM3 2457601 4040806.32 20351989.58 YOAKUM4 2702301 4067382.065 20320938.14

Table D-2. Root Mean Squared Error for Each Hydrograph for the Transient Model Calibration
Page 1 of 2
Well RMSEhyd
(feet) ANDREWS1 2.4 ANDREWS2 4.5 ANDREWS3 2.9 BAILEY1 53.1 BAILEY2 2.0 BORDEN1 5.0 BRISCOE1 12.0 BRISCOE2 3.8 BRISCOE3 27.2 CASTRO1 62.1 CASTRO2 5.7 CASTRO3 10.7 COCHRAN1 5.0 COCHRAN2 11.2 COCHRAN3 20.5 COCHRAN4 8.8 CROSBY1 69.4 CROSBY2 95.7 CROSBY3 24.0 CROSBY4 19.3 CURRY1 6.3 CURRY2 13.1 CURRY3 36.8 DAWSON1 3.4 DAWSON2 21.4 DAWSON3 3.6 DAWSON4 29.4 DAWSON5 12.6 DEAFSMITH1 7.7 DEAFSMITH2 18.7 DICKENS1 12.1 FLOYD1 19.2 FLOYD2 63.7 FLOYD3 89.4 FLOYD4 63.7 FLOYD5 25.2 GAINES1 20.3 GAINES2 15.3 GAINES3 13.9 GARZA1 10.9 GARZA2 6.6 GLASSCOCK1 17.5 GLASSCOCK2 18.2 HALE1 13.9 HALE2 21.3
P:\9345\GAM-Rpt.1-03\ApdxD\ApdxD2_RMSE.doc

Table D-2. Root Mean Squared Error for Each Hydrograph for the Transient Model Calibration
Page 2 of 2
P:\9345\GAM-Rpt.1-03\ApdxD\ApdxD2_RMSE.doc
Well RMSEhyd
(feet) HALE3 21.8 HALE4 15.9 HOCKLEY1 13.8 HOCKLEY2 28.9 HOCKLEY3 12.6 LAMB1 15.5 LAMB2 38.2 LAMB3 33.1 LAMB4 15.9 LAMB5 13.4 LEA1 2.3 LEA2 21.6 LEA3 10.3 LEA4 5.3 LUBBOCK1 14.4 LUBBOCK2 15.9 LUBBOCK3 21.8 LUBBOCK4 78.1 LUBBOCK5 4.5 LYNN1 6.2 MARTIN1 20.5 MARTIN2 21.9 MIDLAND1 9.2 OLDHAM1 2.9 OLDHAM2 17.5 PARMER1 49.3 PARMER2 13.2 PARMER3 3.8 PARMER4 11.2 POTTER1 31.9 RANDALL1 12.7 RANDALL2 39.9 ROOSEVELT1 21.2 ROOSEVELT2 11.3 ROOSEVELT3 8.3 SWISHER1 18.2 SWISHER2 39.4 SWISHER3 17.6 TERRY1 14.8 TERRY2 6.0 TERRY3 10.1 YOAKUM1 17.2 YOAKUM2 7.6 YOAKUM3 5.9 YOAKUM4 4.2

Year
Wat
erLe
vel(
ft-M
SL)
1940 1950 1960 1970 1980 1990 20003000
3025
3050
3075
3100
3125
3150
3175
3200
Observed water levelSimulated water level
Andrews2
Year
Wat
erLe
vel(
ft-M
SL)
1940 1950 1960 1970 1980 1990 20003000
3025
3050
3075
3100
3125
3150
3175
3200
Observed water levelSimulated water level
Andrews1
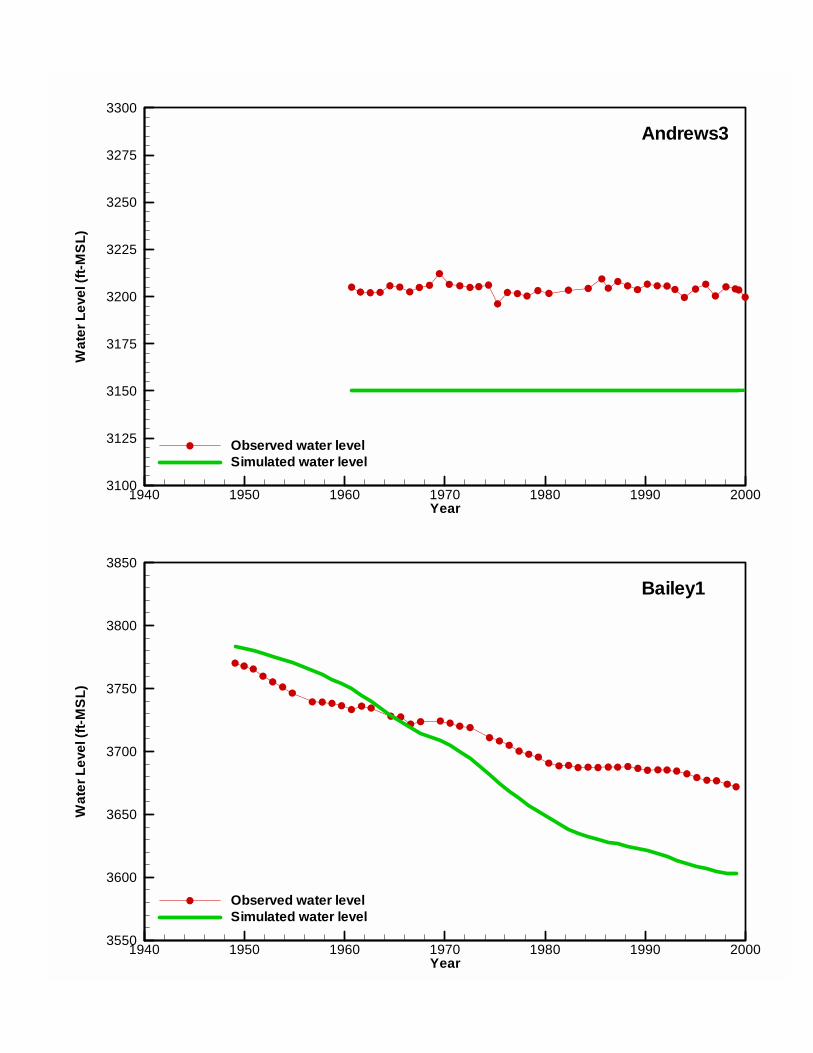
Year
Wat
erLe
vel(
ft-M
SL)
1940 1950 1960 1970 1980 1990 20003550
3600
3650
3700
3750
3800
3850
Observed water levelSimulated water level
Bailey1
Year
Wat
erLe
vel(
ft-M
SL)
1940 1950 1960 1970 1980 1990 20003100
3125
3150
3175
3200
3225
3250
3275
3300
Observed water levelSimulated water level
Andrews3

Year
Wat
erLe
vel(
ft-M
SL)
1940 1950 1960 1970 1980 1990 20003700
3750
3800
3850
3900
3950
4000
Observed water levelSimulated water level
Bailey2
Year
Wat
erLe
vel(
ft-M
SL)
1940 1950 1960 1970 1980 1990 20002800
2825
2850
2875
2900
2925
2950
2975
3000
Observed water levelSimulated water level
Borden1

Year
Wat
erLe
vel(
ft-M
SL)
1940 1950 1960 1970 1980 1990 20003100
3125
3150
3175
3200
3225
3250
3275
3300
Observed water levelSimulated water level
Briscoe2
Year
Wat
erLe
vel(
ft-M
SL)
1940 1950 1960 1970 1980 1990 20003200
3210
3220
3230
3240
3250
3260
3270
3280
3290
3300
Observed water levelSimulated water level
Briscoe1

Year
Wat
erLe
vel(
ft-M
SL)
1940 1950 1960 1970 1980 1990 20003450
3500
3550
3600
3650
3700
3750
Observed water levelSimulated water level
Castro1
Year
Wat
erLe
vel(
ft-M
SL)
1940 1950 1960 1970 1980 1990 20003000
3050
3100
3150
3200
3250
3300
Observed water levelSimulated water level
Briscoe3

Year
Wat
erLe
vel(
ft-M
SL)
1940 1950 1960 1970 1980 1990 20003400
3450
3500
3550
3600
3650
3700
Observed water levelSimulated water level
Castro3
Year
Wat
erLe
vel(
ft-M
SL)
1940 1950 1960 1970 1980 1990 20003450
3500
3550
3600
3650
3700
3750
Observed water levelSimulated water level
Castro2

Year
Wat
erLe
vel(
ft-M
SL)
1940 1950 1960 1970 1980 1990 20003650
3675
3700
3725
3750
3775
3800
Observed water levelSimulated water level
Cochran2
Year
Wat
erLe
vel(
ft-M
SL)
1940 1950 1960 1970 1980 1990 20003650
3675
3700
3725
3750
3775
3800
Observed water levelSimulated water level
Cochran1

Year
Wat
erLe
vel(
ft-M
SL)
1940 1950 1960 1970 1980 1990 20003600
3625
3650
3675
3700
3725
3750
3775
3800
Observed water levelSimulated water level
Cochran4
Year
Wat
erLe
vel(
ft-M
SL)
1940 1950 1960 1970 1980 1990 20003450
3475
3500
3525
3550
3575
3600
3625
3650
3675
3700
Observed water levelSimulated water level
Cochran3

Year
Wat
erLe
vel(
ft-M
SL)
1940 1950 1960 1970 1980 1990 20002850
2900
2950
3000
3050
3100
3150
3200
Observed water levelSimulated water level
Crosby1
Year
Wat
erLe
vel(
ft-M
SL)
1940 1950 1960 1970 1980 1990 20002800
2850
2900
2950
3000
3050
3100
Observed water levelSimulated water level
Crosby2

Year
Wat
erLe
vel(
ft-M
SL)
1940 1950 1960 1970 1980 1990 20002900
2925
2950
2975
3000
3025
3050
3075
3100
3125
3150
Observed water levelSimulated water level
Crosby3
Year
Wat
erLe
vel(
ft-M
SL)
1940 1950 1960 1970 1980 1990 20002750
2800
2850
2900
2950
3000
3050
Observed water levelSimulated water level
Crosby4

Year
Wat
erLe
vel(
ft-M
SL)
1940 1950 1960 1970 1980 1990 20004000
4025
4050
4075
4100
4125
4150
Observed water levelSimulated water level
Curry1
Year
Wat
erLe
vel(
ft-M
SL)
1940 1950 1960 1970 1980 1990 20003850
3900
3950
4000
4050
4100
4150
Observed water levelSimulated water level
Curry2
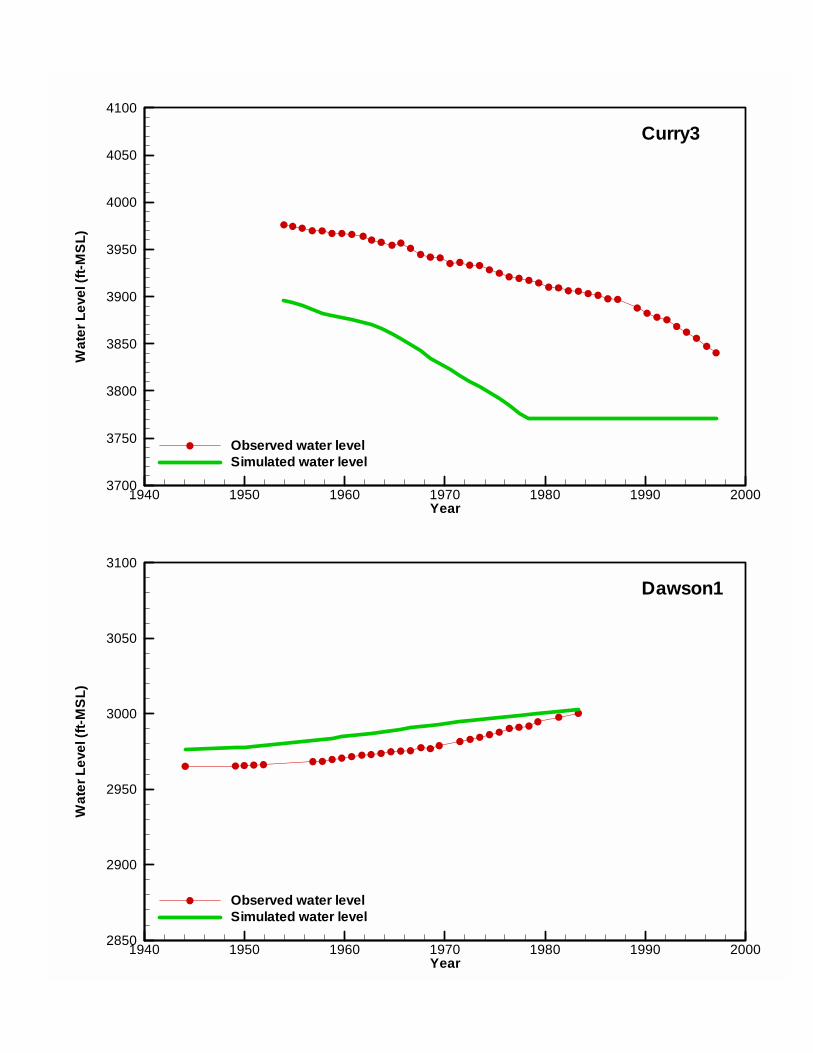
Year
Wat
erLe
vel(
ft-M
SL)
1940 1950 1960 1970 1980 1990 20003700
3750
3800
3850
3900
3950
4000
4050
4100
Observed water levelSimulated water level
Curry3
Year
Wat
erLe
vel(
ft-M
SL)
1940 1950 1960 1970 1980 1990 20002850
2900
2950
3000
3050
3100
Observed water levelSimulated water level
Dawson1
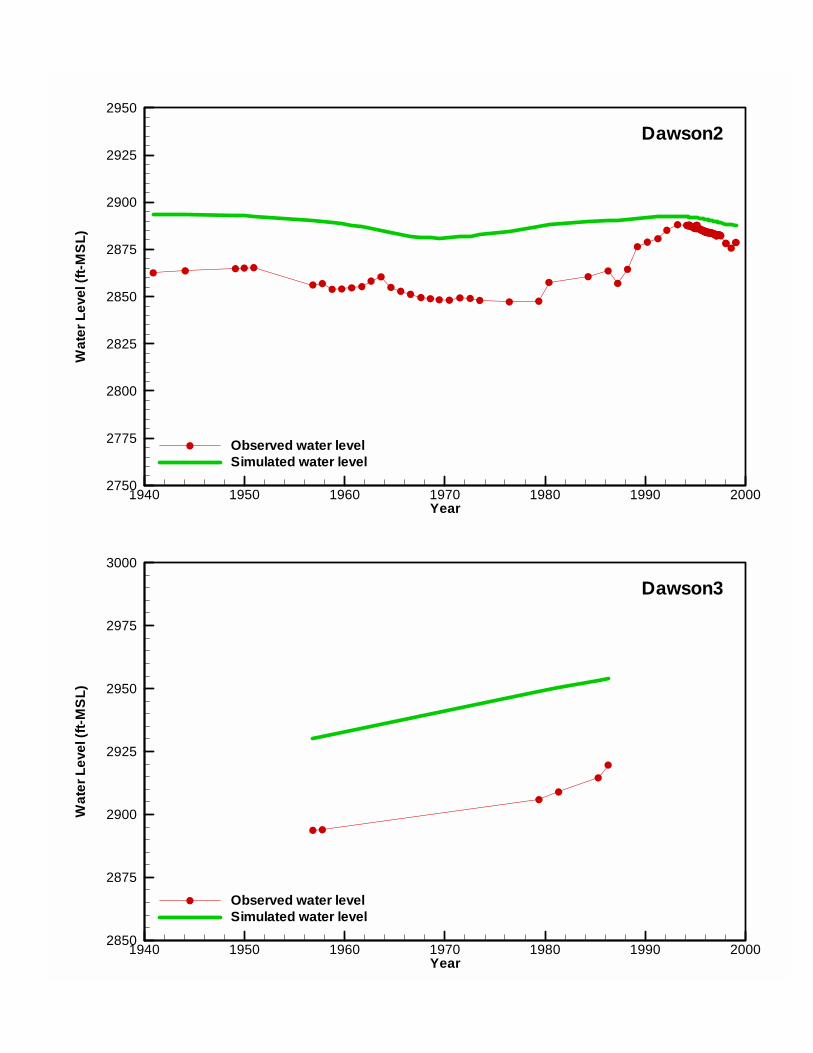
Year
Wat
erLe
vel(
ft-M
SL)
1940 1950 1960 1970 1980 1990 20002750
2775
2800
2825
2850
2875
2900
2925
2950
Observed water levelSimulated water level
Dawson2
Year
Wat
erLe
vel(
ft-M
SL)
1940 1950 1960 1970 1980 1990 20002850
2875
2900
2925
2950
2975
3000
Observed water levelSimulated water level
Dawson3

Year
Wat
erLe
vel(
ft-M
SL)
1940 1950 1960 1970 1980 1990 20002950
2975
3000
3025
3050
3075
3100
3125
3150
Observed water levelSimulated water level
Dawson4
Year
Wat
erLe
vel(
ft-M
SL)
1940 1950 1960 1970 1980 1990 20002650
2675
2700
2725
2750
2775
2800
2825
2850
2875
2900
Observed water levelSimulated water level
Dawson5
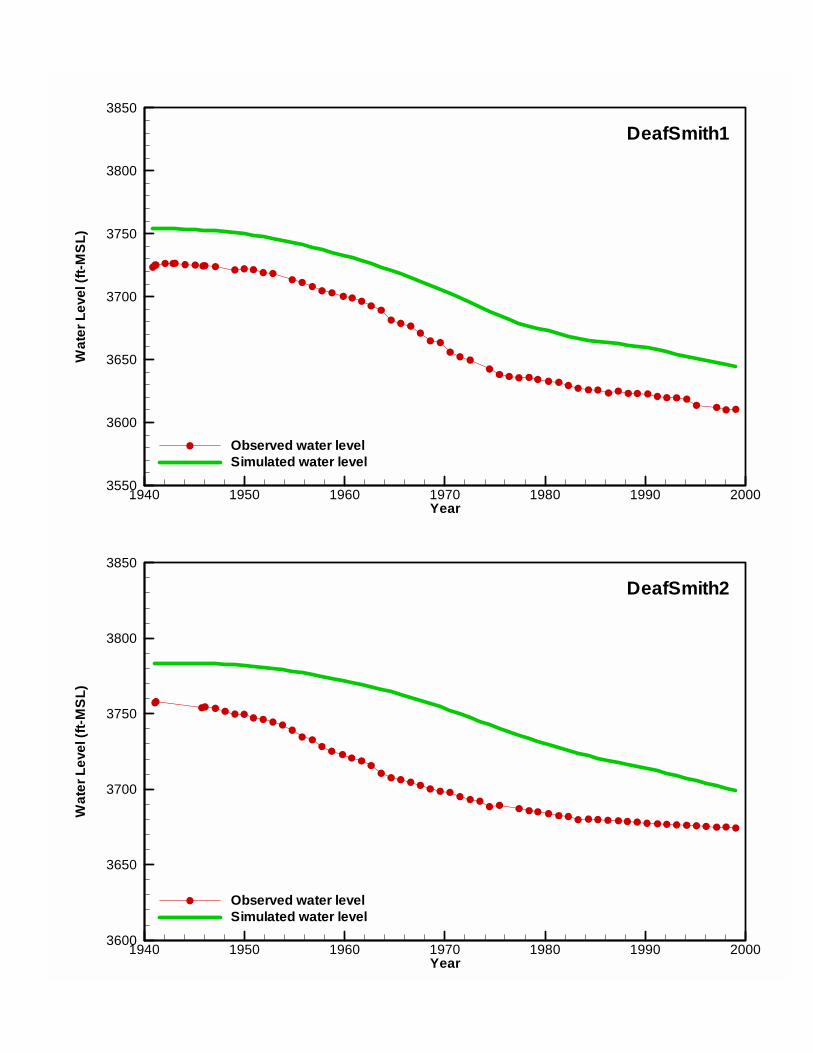
Year
Wat
erLe
vel(
ft-M
SL)
1940 1950 1960 1970 1980 1990 20003550
3600
3650
3700
3750
3800
3850
Observed water levelSimulated water level
DeafSmith1
Year
Wat
erLe
vel(
ft-M
SL)
1940 1950 1960 1970 1980 1990 20003600
3650
3700
3750
3800
3850
Observed water levelSimulated water level
DeafSmith2
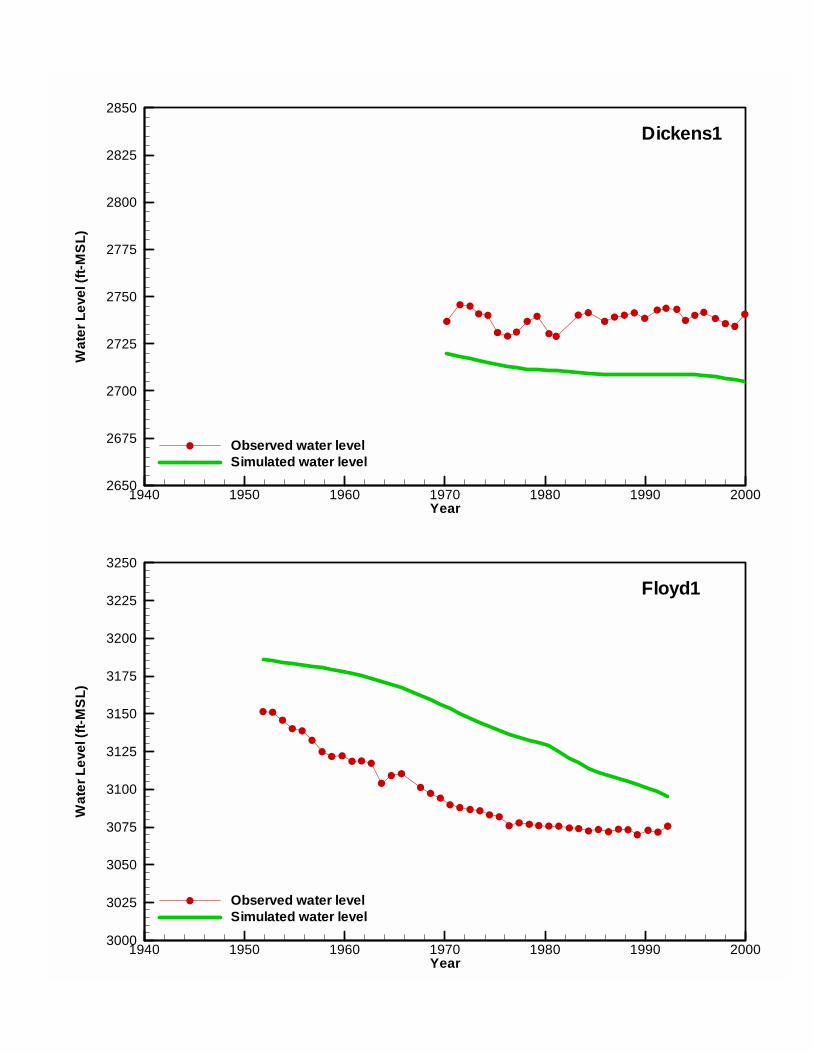
Year
Wat
erLe
vel(
ft-M
SL)
1940 1950 1960 1970 1980 1990 20002650
2675
2700
2725
2750
2775
2800
2825
2850
Observed water levelSimulated water level
Dickens1
Year
Wat
erLe
vel(
ft-M
SL)
1940 1950 1960 1970 1980 1990 20003000
3025
3050
3075
3100
3125
3150
3175
3200
3225
3250
Observed water levelSimulated water level
Floyd1

Year
Wat
erLe
vel(
ft-M
SL)
1940 1950 1960 1970 1980 1990 20002900
2950
3000
3050
3100
3150
3200
3250
3300
Observed water levelSimulated water level
Floyd3
Year
Wat
erLe
vel(
ft-M
SL)
1940 1950 1960 1970 1980 1990 20003000
3050
3100
3150
3200
3250
3300
Observed water levelSimulated water level
Floyd2

Year
Wat
erLe
vel(
ft-M
SL)
1940 1950 1960 1970 1980 1990 20002900
2950
3000
3050
3100
3150
3200
3250
Observed water levelSimulated water level
Floyd4
Year
Wat
erLe
vel(
ft-M
SL)
1940 1950 1960 1970 1980 1990 20002900
2950
3000
3050
3100
3150
3200
Observed water levelSimulated water level
Floyd5

Year
Wat
erLe
vel(
ft-M
SL)
1940 1950 1960 1970 1980 1990 20003400
3425
3450
3475
3500
3525
3550
3575
3600
Observed water levelSimulated water level
Gaines2
Year
Wat
erLe
vel(
ft-M
SL)
1940 1950 1960 1970 1980 1990 20003400
3450
3500
3550
3600
3650
3700
Observed water levelSimulated water level
Gaines1

Year
Wat
erLe
vel(
ft-M
SL)
1940 1950 1960 1970 1980 1990 20003150
3175
3200
3225
3250
3275
3300
Observed water levelSimulated water level
Gaines3
Year
Wat
erLe
vel(
ft-M
SL)
1940 1950 1960 1970 1980 1990 20002800
2825
2850
2875
2900
2925
2950
2975
3000
Observed water levelSimulated water level
Garza1

Year
Wat
erLe
vel(
ft-M
SL)
1940 1950 1960 1970 1980 1990 20002750
2775
2800
2825
2850
2875
2900
2925
2950
Observed water levelSimulated water level
Garza2
Year
Wat
erLe
vel(
ft-M
SL)
1940 1950 1960 1970 1980 1990 20002400
2450
2500
2550
2600
2650
2700
Observed water levelSimulated water level
Glasscock1

Year
Wat
erLe
vel(
ft-M
SL)
1940 1950 1960 1970 1980 1990 20002350
2400
2450
2500
2550
2600
2650
Observed water levelSimulated water level
Glasscock2
Year
Wat
erLe
vel(
ft-M
SL)
1940 1950 1960 1970 1980 1990 20003200
3250
3300
3350
3400
3450
3500
3550
3600
Observed water levelSimulated water level
Hale1

Year
Wat
erLe
vel(
ft-M
SL)
1940 1950 1960 1970 1980 1990 20003150
3200
3250
3300
3350
3400
3450
Observed water levelSimulated water level
Hale2
Year
Wat
erLe
vel(
ft-M
SL)
1940 1950 1960 1970 1980 1990 20003100
3150
3200
3250
3300
3350
Observed water levelSimulated water level
Hale3

Year
Wat
erLe
vel(
ft-M
SL)
1940 1950 1960 1970 1980 1990 20003100
3125
3150
3175
3200
3225
3250
3275
3300
Observed water levelSimulated water level
Hale4
Year
Wat
erLe
vel(
ft-M
SL)
1940 1950 1960 1970 1980 1990 20003200
3250
3300
3350
3400
3450
3500
Observed water levelSimulated water level
Hockley1

Year
Wat
erLe
vel(
ft-M
SL)
1940 1950 1960 1970 1980 1990 20003100
3150
3200
3250
3300
3350
3400
Observed water levelSimulated water level
Hockley2
Year
Wat
erLe
vel(
ft-M
SL)
1940 1950 1960 1970 1980 1990 20003150
3200
3250
3300
3350
3400
Observed water levelSimulated water level
Hockley3

Year
Wat
erLe
vel(
ft-M
SL)
1940 1950 1960 1970 1980 1990 20003500
3550
3600
3650
3700
3750
3800
3850
3900
Observed water levelSimulated water level
Lamb1
Year
Wat
erLe
vel(
ft-M
SL)
1940 1950 1960 1970 1980 1990 20003300
3350
3400
3450
3500
3550
3600
3650
3700
Observed water levelSimulated water level
Lamb2

Year
Wat
erLe
vel(
ft-M
SL)
1940 1950 1960 1970 1980 1990 20003200
3250
3300
3350
3400
3450
3500
Observed water levelSimulated water level
Lamb3
Year
Wat
erLe
vel(
ft-M
SL)
1940 1950 1960 1970 1980 1990 20003250
3300
3350
3400
3450
3500
3550
Observed water levelSimulated water level
Lamb4
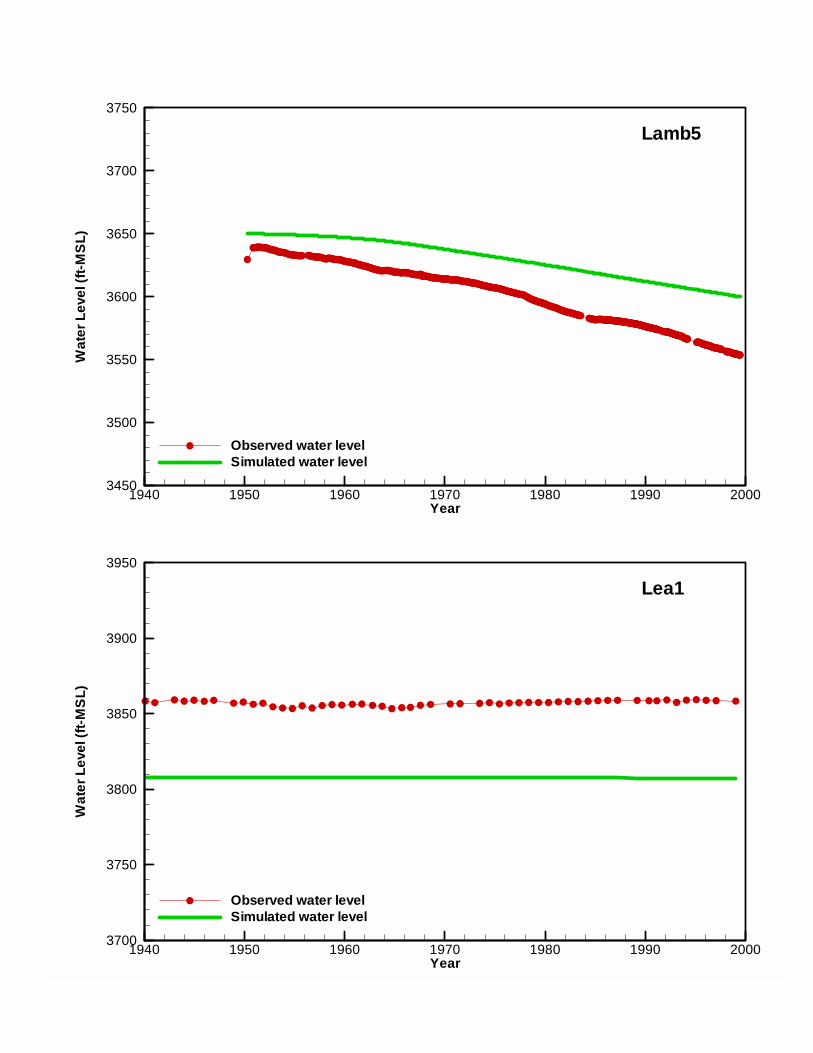
Year
Wat
erLe
vel(
ft-M
SL)
1940 1950 1960 1970 1980 1990 20003450
3500
3550
3600
3650
3700
3750
Observed water levelSimulated water level
Lamb5
Year
Wat
erLe
vel(
ft-M
SL)
1940 1950 1960 1970 1980 1990 20003700
3750
3800
3850
3900
3950
Observed water levelSimulated water level
Lea1

Year
Wat
erLe
vel(
ft-M
SL)
1940 1950 1960 1970 1980 1990 20003750
3800
3850
3900
3950
4000
Observed water levelSimulated water level
Lea2
Year
Wat
erLe
vel(
ft-M
SL)
1940 1950 1960 1970 1980 1990 20003700
3725
3750
3775
3800
3825
3850
Observed water levelSimulated water level
Lea3

Year
Wat
erLe
vel(
ft-M
SL)
1940 1950 1960 1970 1980 1990 20003100
3125
3150
3175
3200
3225
3250
3275
3300
Observed water levelSimulated water level
Lubbock1
Year
Wat
erLe
vel(
ft-M
SL)
1940 1950 1960 1970 1980 1990 20003450
3500
3550
3600
3650
3700
Observed water levelSimulated water level
Lea4

Year
Wat
erLe
vel(
ft-M
SL)
1940 1950 1960 1970 1980 1990 20002950
3000
3050
3100
3150
Observed water levelSimulated water level
Lubbock3
Year
Wat
erLe
vel(
ft-M
SL)
1940 1950 1960 1970 1980 1990 20003100
3150
3200
3250
3300
3350
Observed water levelSimulated water level
Lubbock2

Year
Wat
erLe
vel(
ft-M
SL)
1940 1950 1960 1970 1980 1990 20003000
3050
3100
3150
3200
3250
3300
Observed water levelSimulated water level
Lubbock4
Year
Wat
erLe
vel(
ft-M
SL)
1940 1950 1960 1970 1980 1990 20002900
2925
2950
2975
3000
3025
3050
3075
3100
Observed water levelSimulated water level
Lubbock5
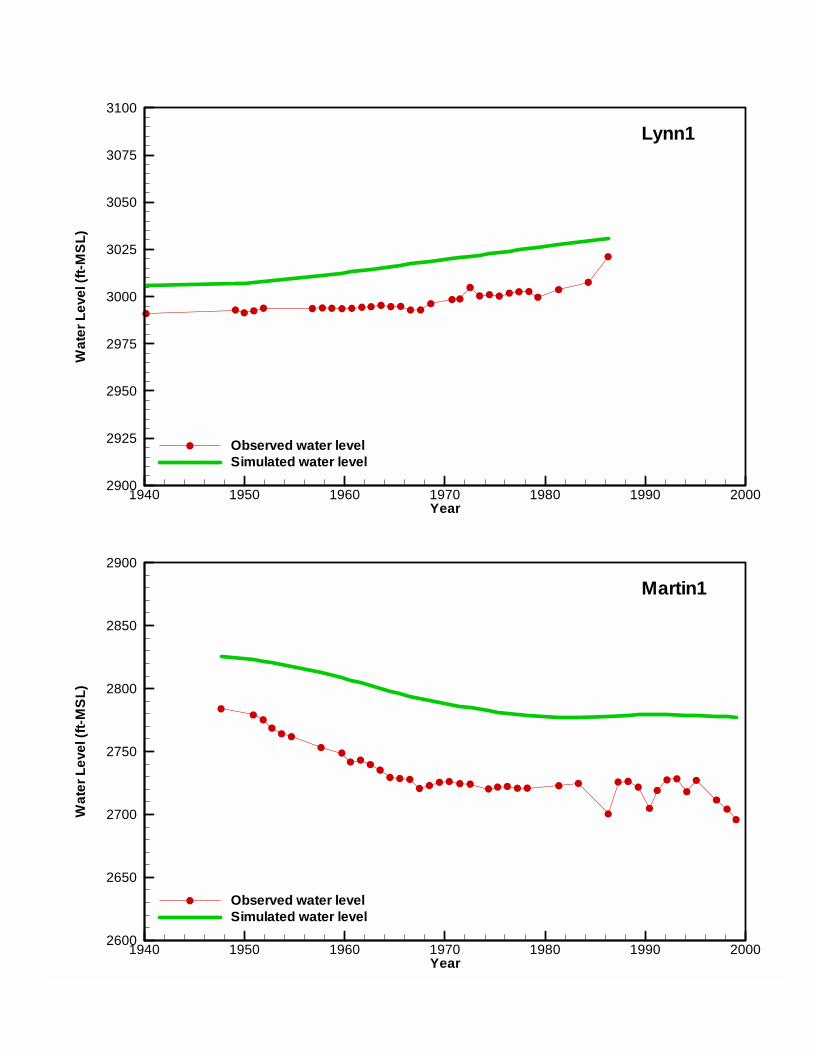
Year
Wat
erLe
vel(
ft-M
SL)
1940 1950 1960 1970 1980 1990 20002600
2650
2700
2750
2800
2850
2900
Observed water levelSimulated water level
Martin1
Year
Wat
erLe
vel(
ft-M
SL)
1940 1950 1960 1970 1980 1990 20002900
2925
2950
2975
3000
3025
3050
3075
3100
Observed water levelSimulated water level
Lynn1

Year
Wat
erLe
vel(
ft-M
SL)
1940 1950 1960 1970 1980 1990 20002700
2725
2750
2775
2800
2825
2850
2875
2900
Observed water levelSimulated water level
Martin2
Year
Wat
erLe
vel(
ft-M
SL)
1940 1950 1960 1970 1980 1990 20002700
2710
2720
2730
2740
2750
2760
2770
2780
2790
2800
Observed water levelSimulated water level
Midland1
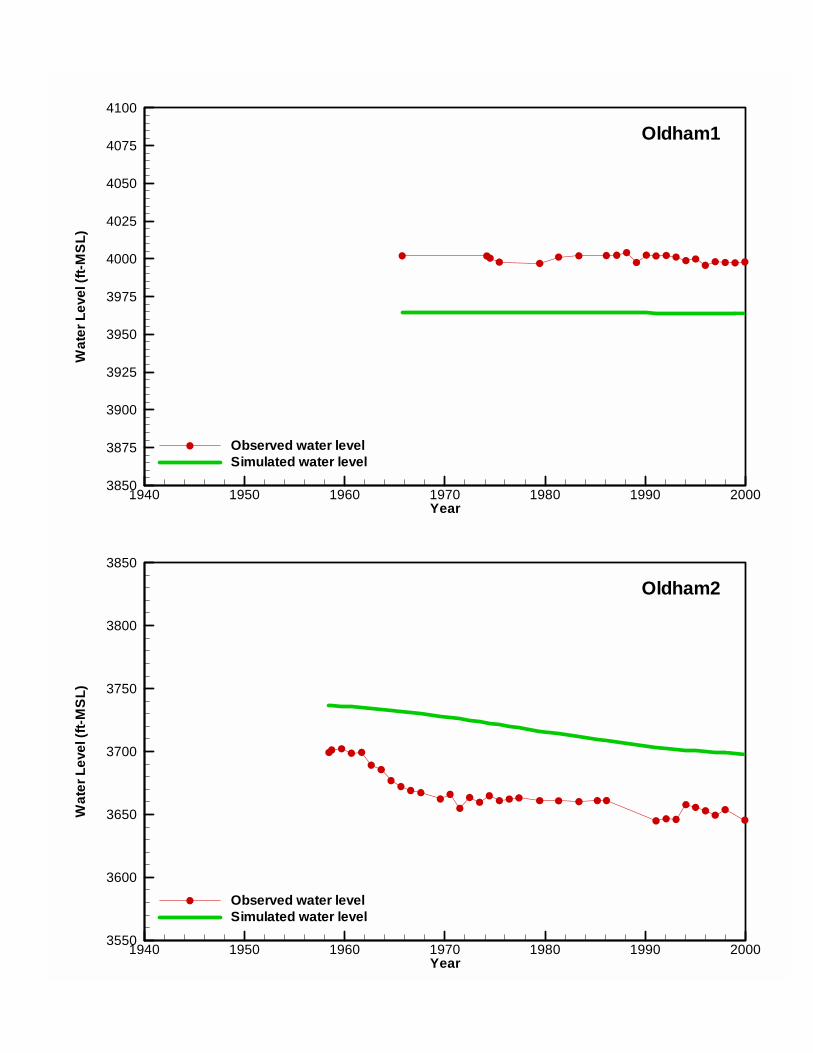
Year
Wat
erLe
vel(
ft-M
SL)
1940 1950 1960 1970 1980 1990 20003850
3875
3900
3925
3950
3975
4000
4025
4050
4075
4100
Observed water levelSimulated water level
Oldham1
Year
Wat
erLe
vel(
ft-M
SL)
1940 1950 1960 1970 1980 1990 20003550
3600
3650
3700
3750
3800
3850
Observed water levelSimulated water level
Oldham2

Year
Wat
erLe
vel(
ft-M
SL)
1940 1950 1960 1970 1980 1990 20003650
3700
3750
3800
3850
3900
3950
Observed water levelSimulated water level
Parmer1
Year
Wat
erLe
vel(
ft-M
SL)
1940 1950 1960 1970 1980 1990 20003600
3650
3700
3750
3800
3850
3900
Observed water levelSimulated water level
Parmer2

Year
Wat
erLe
vel(
ft-M
SL)
1940 1950 1960 1970 1980 1990 20003600
3650
3700
3750
3800
3850
3900
Observed water levelSimulated water level
Parmer3
Year
Wat
erLe
vel(
ft-M
SL)
1940 1950 1960 1970 1980 1990 20003700
3750
3800
3850
3900
3950
4000
Observed water levelSimulated water level
Parmer4

Year
Wat
erLe
vel(
ft-M
SL)
1940 1950 1960 1970 1980 1990 20003500
3525
3550
3575
3600
3625
3650
3675
3700
Observed water levelSimulated water level
Potter1
Year
Wat
erLe
vel(
ft-M
SL)
1940 1950 1960 1970 1980 1990 20003550
3575
3600
3625
3650
3675
3700
3725
3750
Observed water levelSimulated water level
Randall1

Year
Wat
erLe
vel(
ft-M
SL)
1940 1950 1960 1970 1980 1990 20003950
3975
4000
4025
4050
4075
4100
4125
4150
Observed water levelSimulated water level
Roosevelt1
Year
Wat
erLe
vel(
ft-M
SL)
1940 1950 1960 1970 1980 1990 20003400
3425
3450
3475
3500
3525
3550
3575
3600
Observed water levelSimulated water level
Randall2

Year
Wat
erLe
vel(
ft-M
SL)
1940 1950 1960 1970 1980 1990 20003800
3825
3850
3875
3900
3925
3950
3975
4000
Observed water levelSimulated water level
Roosevelt2
Year
Wat
erLe
vel(
ft-M
SL)
1940 1950 1960 1970 1980 1990 20003800
3850
3900
3950
4000
4050
Observed water levelSimulated water level
Roosevelt3
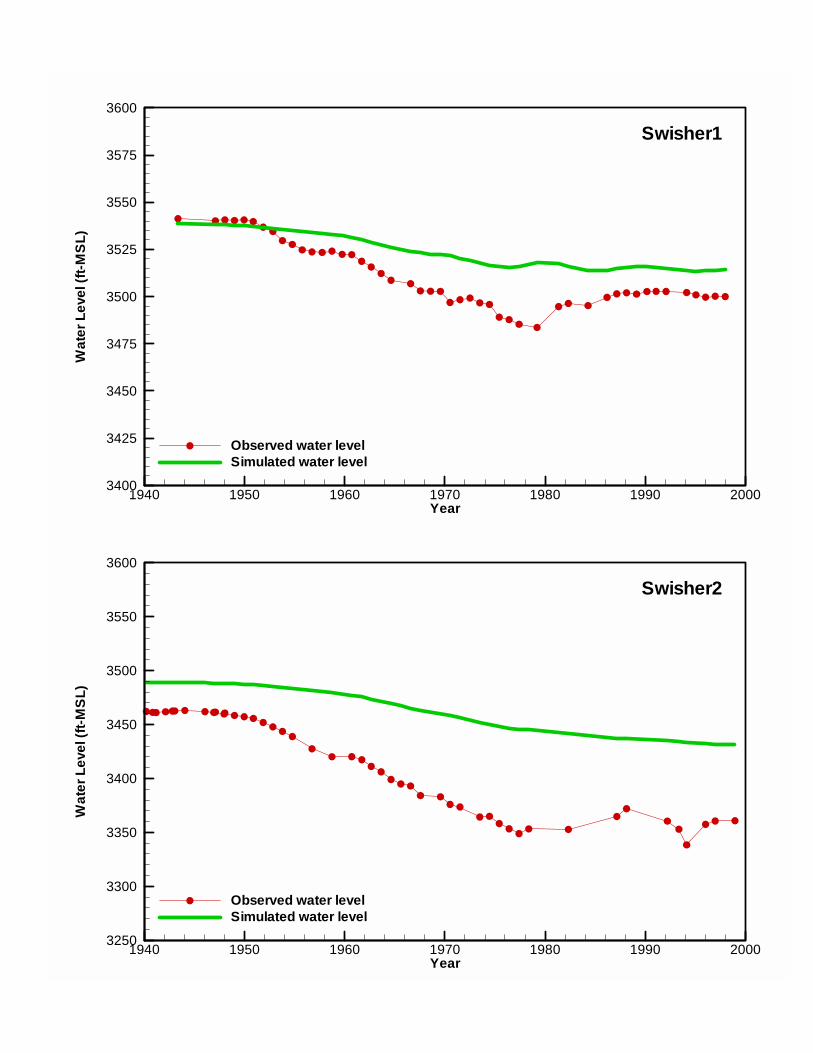
Year
Wat
erLe
vel(
ft-M
SL)
1940 1950 1960 1970 1980 1990 20003400
3425
3450
3475
3500
3525
3550
3575
3600
Observed water levelSimulated water level
Swisher1
Year
Wat
erLe
vel(
ft-M
SL)
1940 1950 1960 1970 1980 1990 20003250
3300
3350
3400
3450
3500
3550
3600
Observed water levelSimulated water level
Swisher2

Year
Wat
erLe
vel(
ft-M
SL)
1940 1950 1960 1970 1980 1990 20003250
3300
3350
3400
3450
3500
3550
Observed water levelSimulated water level
Swisher3
Year
Wat
erLe
vel(
ft-M
SL)
1940 1950 1960 1970 1980 1990 20003150
3175
3200
3225
3250
3275
3300
3325
3350
Observed water levelSimulated water level
Terry1

Year
Wat
erLe
vel(
ft-M
SL)
1940 1950 1960 1970 1980 1990 20003225
3250
3275
3300
3325
3350
3375
Observed water levelSimulated water level
Terry2
Year
Wat
erLe
vel(
ft-M
SL)
1940 1950 1960 1970 1980 1990 20003125
3150
3175
3200
3225
3250
3275
Observed water levelSimulated water level
Terry3

Year
Wat
erLe
vel(
ft-M
SL)
1940 1950 1960 1970 1980 1990 20003650
3660
3670
3680
3690
3700
3710
3720
3730
3740
3750
Observed water levelSimulated water level
Yoakum1
Year
Wat
erLe
vel(
ft-M
SL)
1940 1950 1960 1970 1980 1990 20003500
3525
3550
3575
3600
3625
3650
Observed water levelSimulated water level
Yoakum2
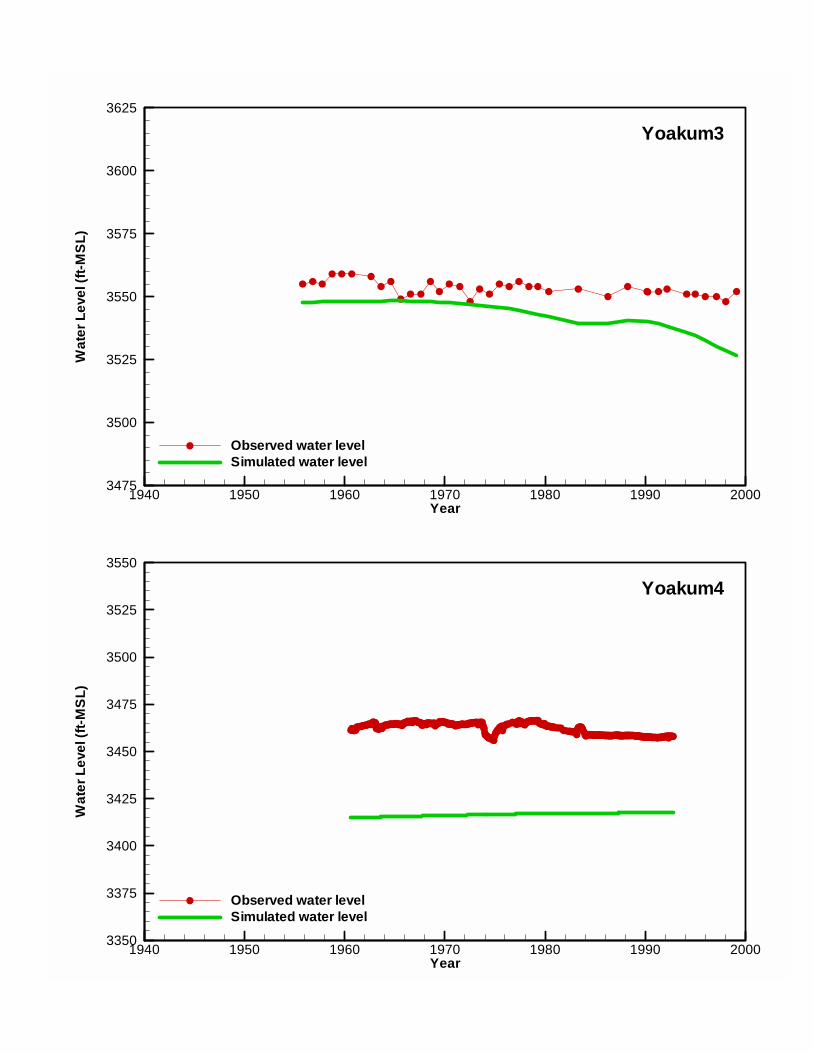
Year
Wat
erLe
vel(
ft-M
SL)
1940 1950 1960 1970 1980 1990 20003475
3500
3525
3550
3575
3600
3625
Observed water levelSimulated water level
Yoakum3
Year
Wat
erLe
vel(
ft-M
SL)
1940 1950 1960 1970 1980 1990 20003350
3375
3400
3425
3450
3475
3500
3525
3550
Observed water levelSimulated water level
Yoakum4

Appendix E
Executive Administrator’s Comments on Draft Report

Review of Draft Report –Ogallala South GAM Technical/Administrative Comments
ATTACHMENT 1
TEXAS WATER DEVELOPMENT BOARD Review of the Draft Final Report: Contract No. 2001-483-379
" Draft Groundwater Availability of the Southern Ogallala Aquifer in Texas and New Mexico Numerical Simulations Through 2050"
DRAFT REPORT TECHNICAL / ADMINISTRATIVE COMMENTS: DRAFT REPORT – TABLE OF CONTENTS 1. No comments DRAFT REPORT – REPORT TITLE 1. Report title should read “ Groundwater Availability Model of the Southern Ogallala Aquifer in Texas and
New Mexico: Numerical Simulations Through 2050”. Edit made. DRAFT REPORT – ABSTRACT 1. The second sentence should read “…and it updates other availability models,” instead of available
models. Edit made.
DRAFT REPORT – INTRODUCTION 1. No comments DRAFT REPORT – STUDY AREA 1. Page 5: Please mention evaporation and include a map of evaporation (see RFP Attachment 1, page
4/40). Evaporation map is now included (Figure 10) and report has been amended. 2. Page 5: Please include a map of the physiographic provinces (see RFP Attachment 1, page 4/40). Physiographic map is now included, (Figure 4). 3. Figure 3: Please mention source of population data.
Edit made on Figure 3.
4. Figure 6: Please mention source of soils data. Edit made on Figure 7. 5. Figure 7: Please mention source of precipitation data.
Edit made on Figure 8.

Review of Draft Report –Ogallala South GAM Technical/Administrative Comments
6. Figure 7: Please indicate units for precipitation data. Units already on figure.
7. Physiography and Climate section: Please include a map and discussion of average net lake evaporation.
Map (Figure 10) and discussion provided.
8. Physiography and Climate section: Please include a discussion of evapotranspiration.
Discussion of evapotranspiration provided in Discharge section.
9. Figure 9: Please mention source of geologic data. Although included in the legend, there does not appear
to be 'Paleogene sedimentary rocks' or 'Neogene sedimentary rocks' on the map. Unclear how the terminology on the figure relates to the stratigraphic column or the text. Please provide a clearer geologic map that relates to the text and stratigraphic column.
The figure and text have been amended.
10. Figure 9: Please indicate units for thickness data.
Edit made; units are feet.
11. Figure 15: "Olgallala" should be Ogallala
Edit made.
12. Figure 16: This figure doesn’t print well in black and white and Ogallala is spelled wrong.
Edits made.
DRAFT REPORT – PREVIOUS WORK 1. Page 22, last paragraph of “SB1 Regional Water Planning Model,” line 3: “that” should be “than” Edit made. DRAFT REPORT – HYDROGEOLOGIC SETTING 1. Figure 17: Please add the Ruppel (1983) and Howard and Williams (1972) references to the reference list
at the end of the report. References added.
2. Page 25, 4th paragraph: 'Osterkamp and other, 1987' versus 'Osterkamp and Wood (1987)' in the
reference list. Please verify reference. Sources verified. Osterkamp and Wood is correct reference.
3. Page 25, 5th bulleted item: Please include Gutentag (1981) in the reference list at the end of the report.
Reference added.
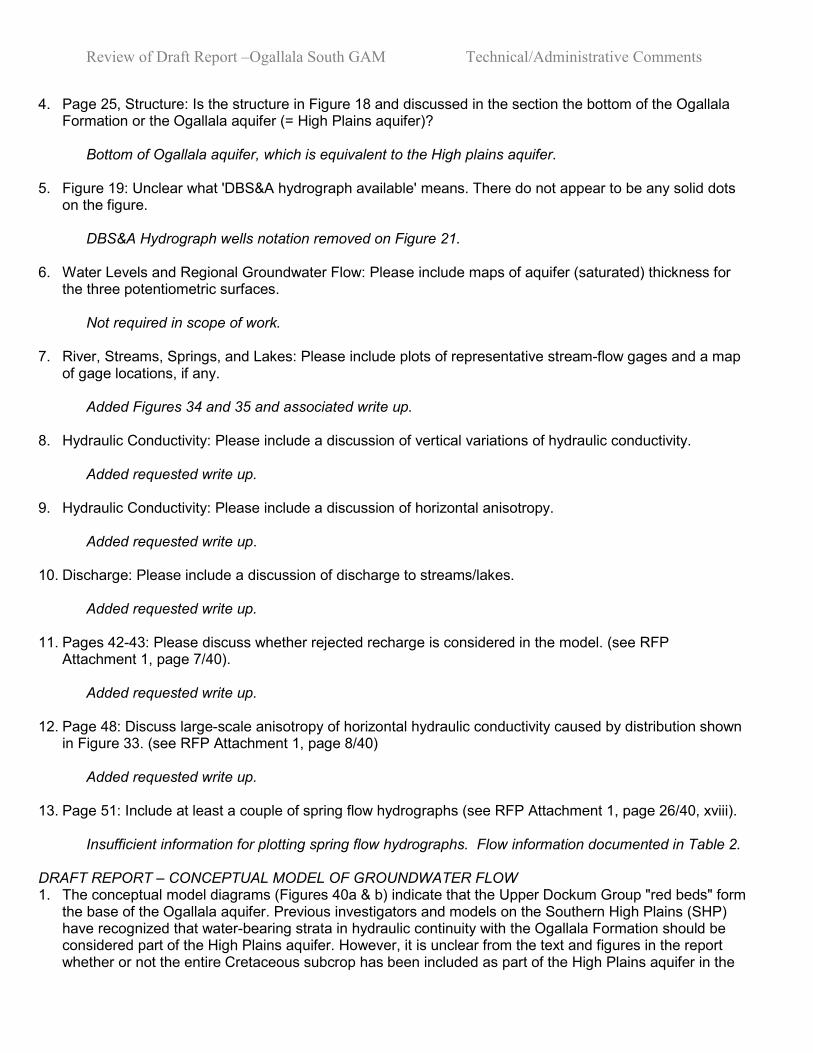
Review of Draft Report –Ogallala South GAM Technical/Administrative Comments
4. Page 25, Structure: Is the structure in Figure 18 and discussed in the section the bottom of the Ogallala Formation or the Ogallala aquifer (= High Plains aquifer)?
Bottom of Ogallala aquifer, which is equivalent to the High plains aquifer.
5. Figure 19: Unclear what 'DBS&A hydrograph available' means. There do not appear to be any solid dots
on the figure. DBS&A Hydrograph wells notation removed on Figure 21. 6. Water Levels and Regional Groundwater Flow: Please include maps of aquifer (saturated) thickness for
the three potentiometric surfaces. Not required in scope of work.
7. River, Streams, Springs, and Lakes: Please include plots of representative stream-flow gages and a map of gage locations, if any.
Added Figures 34 and 35 and associated write up.
8. Hydraulic Conductivity: Please include a discussion of vertical variations of hydraulic conductivity.
Added requested write up.
9. Hydraulic Conductivity: Please include a discussion of horizontal anisotropy.
Added requested write up.
10. Discharge: Please include a discussion of discharge to streams/lakes.
Added requested write up.
11. Pages 42-43: Please discuss whether rejected recharge is considered in the model. (see RFP
Attachment 1, page 7/40). Added requested write up.
12. Page 48: Discuss large-scale anisotropy of horizontal hydraulic conductivity caused by distribution shown
in Figure 33. (see RFP Attachment 1, page 8/40) Added requested write up.
13. Page 51: Include at least a couple of spring flow hydrographs (see RFP Attachment 1, page 26/40, xviii).
Insufficient information for plotting spring flow hydrographs. Flow information documented in Table 2.
DRAFT REPORT – CONCEPTUAL MODEL OF GROUNDWATER FLOW 1. The conceptual model diagrams (Figures 40a & b) indicate that the Upper Dockum Group "red beds" form
the base of the Ogallala aquifer. Previous investigators and models on the Southern High Plains (SHP) have recognized that water-bearing strata in hydraulic continuity with the Ogallala Formation should be considered part of the High Plains aquifer. However, it is unclear from the text and figures in the report whether or not the entire Cretaceous subcrop has been included as part of the High Plains aquifer in the

Review of Draft Report –Ogallala South GAM Technical/Administrative Comments
GAM (i.e., if model cells in the area underlain by Cretaceous have been extended to the base of the Cretaceous). If the entire Cretaceous subcrop is included and values of hydraulic conductivity for initial input to the model were calculated as a weighted average of hydraulic conductivity of both the Ogallala Formation and the Cretaceous section (as described on page 49), the hydraulic conductivity values of the dynamic section of the aquifer (i.e., the Ogallala section) will be significantly modified. Since sensitivity analyses indicate that the model is most sensitive to hydraulic conductivity (along with recharge), it is imperative that conductivity values accurately represents the conductivity of the aquifer. (external comment)
Text has been amended to clarify this issue. Only a portion of the Cretaceous subcrop (as interpreted in previous studies) is included in the model.
DRAFT REPORT – MODEL DESIGN 1. Page 68, Model Design, Layers and Grid: Please mention the projection parameters and the grid origin
coordinates. Provided in Figure 45. 2. Page 69, Model Parameters, 6th paragraph: Please clarify that although pumping was reduced in low
transmissivity cells, 100% of pumping volume was preserved. Clarification added. DRAFT REPORT – MODELING APPROACH 1. Page 73: Discuss how this model will match up with Ogallala North model (Dutton et al., 2000). (see RFP
Attachment 1, page 13/40). Discussion added.
2. Include a map of the grid. Consider doing what the BEG did: show 10 cell by 10 cellblocks. Then show
one 10 x 10 block magnified with all of the cells in it. This way readers can see the orientation and extent of the grid. This will also allow you to explain that you extended the grid to the east so that the Dockum aquifer could be added at a later date.
Two new figures were added to illustrate the model grid (figs. 45 and 46). Discussion added.
DRAFT REPORT – STEADY-STATE MODEL 1. Figures 44 and 57: Show locations of observation wells. (see RFP Attachment 1, page 26/40, xxviii)
Locations of observed water levels are plotted in Figure 21 and Figure 23. Locations of observation wells are plotted on Figures 21 and 23, and a note to that effect is included on the figures. There are too many data points in some locations to plot them on the cited figures - the water level contours would be too obscured.
2. Pages 80 and 96: Please include detailed tables of the water budget for the calibration and predictive
simulations listing (1) recharge, (2) natural discharge (3) cross-formational flow, (4) well discharge, (5) changes in storage etc. The tables should include budgets for steady state, 1980, 1990, 2000, 2010, 2020, 2030, 2040, and 2050. (see RFP Attachment 1, pages 15/40 and 17/40).
Requested water budgets have been added as tables in the report.

Review of Draft Report –Ogallala South GAM Technical/Administrative Comments
3. Page 80: Please include a table or figure depicting results of hydraulic head sensitivity analysis. Table 4 added.
4. Page 77: Please also report the Mean Absolute Error.
Mean absolute error reported.
5. Page 83, Figure 50a: Y-axis label should be flux at springs (not average difference in simulated head).
Figure corrected.
6. Water Budget, page 80: Please include a detailed water budget for the steady-state model.
Water budget table included.
7. Figure 50: It appears that the Y-axis of the top plot is incorrectly identified.
Figure corrected.
8. Figure 50: The variations in the lines for drain conductance and recharge of the bottom plot appear
unusual. These plots generally do not show reversals of slope. Please check that the data represented in the plot is correct.
Calculations were checked and figure was redone - there was an error in the draft report figure.
DRAFT REPORT – TRANSIENT MODEL 1. Please include a detailed water budget for:
• steady-state • beginning of calibration period • the drought of the calibration period • end of the calibration period • end of the verification period • end of 2000, 2010, 2020,2030,2040, and 2050.
Requested water budgets have been added as tables in the report
3. Page 84: Please give RMS for fitting hydrographs (see RFP Attachment 1, page 15/40).
RMS for hydrographs is provided and documented.
4. Page 100: Please include a figure depicting hydrograph sensitivity to specific yield (see RFP Attachment
1, page 16/40). Figure 68 added.
5. Page 94, Figure 58: Legend label for 100 – 150 ft is mislabeled as 10 – 150 ft.
Legend corrected.

Review of Draft Report –Ogallala South GAM Technical/Administrative Comments
6. Page 96, 1st paragraph: Please change '138.651 ac-ft' to '138,651 ac-ft.' Edit made.
7. Page 91, first paragraph: Verb “are” has been omitted from second sentence. Should read “…statistics
for 1980 are similar to those for …” Edit made.
8. Page 93, first paragraph, last sentence: Please leave out second occurrence of “are."
Edit made.
9. According to the report under the Transient Model component, 80 wells were used for model verification;
specifically Gaines County well #2624307 has a simulated hydrograph value which some 50 feet below the observed hydrograph level. Why is there is such a large difference between these values? Does this not in fact show that these values, at least in Gaines County’s case, are off? (external comment).
Calibration results are documented and discussed in the report, and were discussed during several SAF meetings.
10. Additionally, again under the Transient Model component, 80 wells were used for model calibration, which
is represented as figures Gaines 1, 2, 3, and 4 in appendix D. The average of these wells has a simulated hydrograph value some 55 feet below the observed hydrograph level. Again, as you can see these values are substantially different from what are observed. At what point are these observed values being used in this model and how can it be considered accurate if the figures are consistently off by some 50 feet particularly if we have a saturated thickness of say 150 feet? (external comment)
Calibration results are documented and discussed in the report, and were discussed during several SAF meetings.
11. The difference in simulated vs. observed heads on numerous model runs was frequently 25 to 50 feet
(occasionally up to 100 feet). It is unclear why model input parameters were not adjusted to improve model correlation to actual conditions. (external comment)
Calibration results are documented and discussed in the report, and were discussed during several SAF meetings. Close matches between observed and simulated water levels can not be obtained in all areas unless detailed adjustments to model input parameters are made, for which there is no basis other than matching water levels. The TWDB does not want to develop “over-calibrated” models.
12. It is unclear why model input parameters were not adjusted to reduce the number of model cells that went
dry. Comparison of actual data to Year 2000 simulations confirms that the numerous cells that are drying (as well as flooding) do not represent actual aquifer conditions. (external comment)
This issue is discussed in the report in the Transient Calibration section.

Review of Draft Report –Ogallala South GAM Technical/Administrative Comments
13. Why does the model show rising water levels in Dawson County? Recently, monitor wells have indicated declining water levels. (external comment).
Water levels have been rising away outside of irrigated areas, and declining within or near irrigated areas. The model replicates these general trends.
14. Monitor wells 27-07-901 and 28-26-206 in the northern and southern portions of the Dawson County,
respectively, would make better observation wells for model calibration than the the two that were selected. (external comment)
These two wells were added as observation wells and are included in Appendix D.
15. A model that will give the amount of water in storage based on the change in water levels from year to
year would be helpful. Will this model do that? (external comment) Yes, on a regional basis and over the long term. For county by county annual calculations, other methods or tools may be more appropriate.
DRAFT REPORT – PREDICTIONS 1. Page 102: Were monthly stress periods used for final 10 years of each scenario? (See RFP Attachment
1, page 17/40). Yes, and the text has been amended. 1. Pages 102 and C-3: Please say more about the source of predictive pumping data (see RFP page 17/40
“using RWPG water demand projections under average and drought-of –record conditions”). Text has been amended.
2. Predictions: Please provide discussion on the effects of water-level declines/rises on environmental
resource. Additional section has been added.
DRAFT REPORT – LIMITATIONS OF THE MODEL 1. Page 134, second paragraph, last sentence: Please add the word “to” before phrase “be average
values…” Edit made. DRAFT REPORT – RECOMMENDED FUTURE IMPROVEMENTS 1. No comments DRAFT REPORT – SUMMARY AND CONCLUSIONS 1. No comments DRAFT REPORT – ACKNOWLEDGMENTS 1. No comments DRAFT REPORT – REFERENCES 1. No comments

Review of Draft Report –Ogallala South GAM Technical/Administrative Comments
DRAFT REPORT – APPENDICES – PART A 1. Time lag for irrigation return flow (Appendix A) utilized calculations based on soil types; however, soil
types are appropriate only for soils and paleosols and are not representative of the majority of the sediment profile on the southern high plains.
The word “soil” has been replaced with “sediment”.
DRAFT REPORT – APPENDICES – PART B 1. No comments DRAFT REPORT – APPENDICES – PART C 1. No comments DRAFT REPORT – APPENDICES – PART D 1. No comments The following figures are not readable when photocopied in black and white (see RFP Attachment 1 page 25/40, “figures shall be designed such that a black and white photocopy is readable”): Figure 3 Figure 4 Figure 5 Figure 6 Figure 11 Figure 12 Figure 22 Figure 34 Figure 41 Figure 46 Figure 47 Figure 48 Figure 58 Figure 59 Figure 60 Figures 63, 64, 65, 66, 67 Figures 68, 69, 70, 71 Figures 72, 73, 74, 75, 76, 77, 78, 79, 80 Figures 81, 82, 83, 84, 85, 86, 87, 88, 89, 90,91, 92, 93, 94, 95 Each of these figures were recreated and black and white copy tested to ensure their readability when
reprinted.

Review of Draft Report –Ogallala South GAM Technical/Administrative Comments
DRAFT REPORT – REVIEW OF SOURCE DATA
OGLL_s GAM Review – Part B: Project Data Did we get all of the data files we requested? NO Is the data organized in the way we requested? NO Introduction: It is imperative that enough source data to completely rebuild the groundwater model from scratch and reproduce all report figures and tables (should it be necessary) be received. In other words, if a new model grid resolution and/or orientation is needed, there should be sufficient data to create a new model for the study area. Moreover, there should be enough data to regenerate any or all of the intermediate derivative data with updated information. This source and intermediate derivative data should be organized under the SRCDATA folder/directory according to the guidelines set forth in Attachments 1 & 2 of the RFP. An empty directory tree structure was provided to facilitate the organization of the project data. The empty directory tree structure is available for download in zip format at http://www.twdb.state.tx.us/gam/resources/gam_tree.zip. It is also required that all final model parameter and variable/stress data be delivered in a database format that can easily be referenced to each and every model grid cell. In other words, there should be enough cell-referenced data to regenerate all or update any individual cell value of the required MODFLOW or PMWIN input files. The file format of these databases may be in Excel 97, Access 97, or in an ESRI GIS format compatible with ArcView 3.2 or ArcInfo 7.21. Each sheet, table, or coverage should be attributed with the appropriate model grid cell-reference information as set forth in Attachments 1 & 2 of the RFP. These data sets should be organized under the GRDDATA folder directory and with in the appropriate sub-folders/directories. The GRDDATA OUTPUT folder and its sub-folders/directories may be omitted or left empty. Finally, the actual MODFLOW 96 and PMWIN 5.0 formatted files for both INPUT and OUTPUT must be organized as set forth in Attachments 1 & 2 of the RFP. Separate folders/directories must be used for 1) the calibrated steady-state model files; 2) the calibrated transient model files; 3) the verification transient model files; 4) and each of the decadal transient predictive model simulation run files. All required data, model inputs and outputs, and GIS files have been provided as requested. Some specific comments are provided below, but each item is not addressed individually. Review Summary: The data provided by the OGLL_s contractor is mostly incomplete but somewhat unorganized. Many of the geographic features in the draft report are not included in the data CDs such as roads, cities, counties, streams, reservoirs, playas, target calibration wells, regional geologic structures, Cretaceous extent, surficial geology, soil types, topography, population density, groundwater conservation districts, lines of geologic cross-section(s), landuse (original), various water-use pumping maps, ibounds, specific yield, recharge maps, top of aquifer, thickness of Ogallala sediments, thickness of Cretaceous sediments, etc. More information on source and derivative data used to estimate recharge and return flows is needed. The contractor must follow the requirements as set forth in Attachments 1 & 2 of the RFP. It is therefore required that the contractor resubmit the project data after reading and understanding Attachments 1 & 2 of the RFP. Furthermore, all GIS data appears to be correct NAD83 Datum but listed as NAD27 datum within the metadata. Finally, all Access databases may be in wrong version since reviewer was unable to open any of them in Access 97. All Access databases must be in Access 97 format.

Review of Draft Report –Ogallala South GAM Technical/Administrative Comments
DRIVE:\OGLL_s\grddata\input\hydraul The shape coverage is not referenced to row, column, and/or cell_id. This coverage belongs under srcdata folder. The metadata file is incomplete and requires Data_Abstract, Attributes, Attribute_Descriptions, and Attributes_Domain. Metadata file was expanded and the files were moved to the OGLL_s/scrdata/subhyd folder. Model Cells folder contains accurate information for this area. DRIVE:\OGLL_s\grddata\input\ibnd NO DATA FOUND – model cell referenced ibound data should go here. DRIVE:\OGLL_s\grddata\input\stress\ststate\drns NO DATA FOUND – model cell referenced drain package parameters should go here. DRIVE:\OGLL_s\grddata\input\stress\ststate\evt NO DATA FOUND – model cell referenced ET package parameters should go here. DRIVE:\OGLL_s\grddata\input\stress\ststate\rech NO DATA FOUND – model cell referenced recharge package parameters should go here. DRIVE:\OGLL_s\grddata\input\stress\ststate\res NO DATA FOUND – model cell referenced reservoir package parameters should go here if applicable. DRIVE:\OGLL_s\grddata\input\stress\ststate\strm NO DATA FOUND – model cell referenced streamflow-routing package parameters should go here if
applicable. DRIVE:\OGLL_s\grddata\input\stress\ststate\well NO DATA FOUND – model cell referenced well package data should go here. DRIVE:\OGLL_s\grddata\input\stress\trans\drns NO DATA FOUND – model cell drain package parameters should go here. DRIVE:\OGLL_s\grddata\input\stress\trans\evt NO DATA FOUND – model cell referenced ET package parameters should go here. DRIVE:\OGLL_s\grddata\input\stress\trans\rech NO DATA FOUND – model cell referenced recharge package parameters should go here. DRIVE:\OGLL_s\grddata\input\stress\trans\res NO DATA FOUND – model cell referenced reservoir package parameters should go here if applicable. DRIVE:\OGLL_s\grddata\input\stress\trans\strm NO DATA FOUND – model cell referenced streamflow-routing package parameters should go here if
applicable. DRIVE:\OGLL_s\grddata\input\stress\trans\well NO DATA FOUND – model cell referenced well package data should go here. DRIVE:\OGLL_s\grddata\input\struct NO DATA FOUND – model cell referenced structure data such as tops and bottoms of each model layer should go here. DRIVE:\OGLL_s\modflow\modfl_96\input\ststate These files are acceptable. DRIVE:\OGLL_s\modflow\modfl_96\input\trans These files are acceptable. DRIVE:\OGLL_s\modflow\pmwin_50\input\ststate NO DATA FOUND DRIVE:\OGLL_s\modflow\pmwin_50\input\trans Borehole files for calibration not found. These files must be included under this folder. Remainder of files acceptable. DRIVE:\OGLL_s\modflow\pmwin_50\refdxf OK … contains county, model bndy, and rivers.

Review of Draft Report –Ogallala South GAM Technical/Administrative Comments
DRIVE:\OGLL_s\scrdata\bndy Census 2000 data missing for New Mexico are of model. The metadata for census does not match with coverage (some fields have no values) and reference is made to landuse/landcover relation to census tract polygons in metadata but no such relation exists in coverage. Also missing population density. Census 2000 date from New Mexico was not used as approved by the TWDB and therefore is not present as a coverage. Metadata file has been updated. The population density is included in these files and is indicated as such. The tx_censusblocks_2000.shp file has an attribute field derived by DBS&A described in the metadata. The two 1990 files have the pop_90_sqmile filed which was already present in the source data. Model grid and study area coverages appear to be acceptable. Need to include basin and county boundary coverages as well as roads, groundwater conservation districts, and city boundaries. DRIVE:\OGLL_s\scrdata\clim Contoured precipitation coverage OK but also require the source point data used to interpolate contour
coverage. DRIVE:\OGLL_s\scrdata\cnsv The irrigated shape file is not the same as described by metadata. The metadata must be updated to fit manipulated irrigated coverage and correct coverage for metadata file should be added. Landuse coverage has also been manipulated from its original form and requires original landuse data as well as manipulated coverage provided. Grid referenced recharge information is in wrong directory. DRIVE:\OGLL_s\scrdata\geol Insufficient or no metadata for the point and polygon sand fraction coverages. Remainder of lithologic data acceptable. No coverages of regional geologic structures, Cretaceous extent, surficial geology? No cross-sections used in study? The maps of regional geological structures and surficial geology included in the report (Figures 9 and 17), the cross sections presented in Figures 11 and 12, and the Cretaceous subcrop map (Figure 13) were prepared as graphics files for the purpose of conveying required information in the report. These information were not needed as GIS coverages for the purposes of model construction or analysis. DRIVE:\OGLL_s\scrdata\geom NO DATA FOUND – DEMs, physiography, and any other geomorphologic data should go here DEMs were moved to this folder and physiography was added here. DRIVE:\OGLL_s\scrdata\geop NO DATA FOUND – Landsat data should go here along with any other geophysical data. Landsat data was moved to this folder. DRIVE:\OGLL_s\scrdata\soil The coverage has no soil attributes. Instead the coverage is an intermediate derivative coverage for recharge and has only recharge attributes without the actual soils source data. Greater detail is needed for the processing of the recharge coverage that is provided within the readme or metadata file. No coverage of soils data? Recharge metadata description was expanded and STATSGO data was added to this folder.

Review of Draft Report –Ogallala South GAM Technical/Administrative Comments
DRIVE:\OGLL_s\scrdata\subhyd The metadata implies that several sources were used to develop the aquifer base yet only the resultant contours are provided in the coverage. The point source data must be provided as well as interpreted data for the aquifer base. Top of aquifer must be provided or referenced to another directory (ie. DEM location) No coverage of aquifer thickness or saturated thickness? The digitized files that were used to create the aquifer base were added to a subfolder called aquifer_base_source and the metadata was updated to note this. A reference file is provided here noting that the DEM was used as the top of aquifer and that it can be found in the OGLL_s\scrdata\geom directory. Hydraulic data is acceptable. Water level data is acceptable but needs readme/metadata file. Water level shapefile metadata files exist as: water_level_1990.txt, water_level_2000.txt and
water_level_pre_devt.txt. The ogll_s_Waterlevels.MDB file has an associated .txt file as well. Need source and intermediate derivative coverages used to spatially distribute pumpage data. Need coverage of specific yield and porosity if available. Not available. Specific yield based on hydraulic conductivity zones as used in the model. Need point coverage of calibration target boreholes and hydrographs. DRIVE:\OGLL_s\scrdata\surhyd The only coverage is for springs. The metadata references associations to landuse but none was found in the attribute table. Further explanation is needed regarding how data was transformed into GAM coordinates. Missing coverage data for streams, reservoirs, and playas. DRIVE:\OGLL_s\scrdata\tran NO DATA FOUND – no roads or transportation features submitted in report? DRAFT REPORT – OGALLALA SOUTH – EDITORIAL COMMENTS Page ii: Please list Appendices in Table of Contents. Edit made. Page 19, Figure 15 caption: Ogallala is misspelled. Edit made. Page 21, Figure 16 caption: Ogallala is misspelled. Edit made. Page 91, 1st paragraph, last line: “….for 1980 are similar to those ….” (“are” is missing). Edit made. Page 118, last 2 paragraphs: Suggest moving sentence “In addition …… by Amosson and others (Appendix B)” to the beginning of the next paragraph.

Review of Draft Report –Ogallala South GAM Technical/Administrative Comments
Not changed. Page A-6, top of page: “preferential flow”, “pre” is missing. Edit made. Page A-10, Figure 6 caption: The last sentence is incomplete. Edit made. Page B-8, Table 2: The numbers in the top two rows are not centered. Edit made. Page B-16, Figure 5: Nothing is plotted in this figure? Figure corrected. It is difficult to differentiate the color scale on some figures (for example, the blue scale for the ranges of 200 to 350 feet on Figure 58). It would be most helpful to the end users if distinct color scales would be used. (external comment) Color figures were edited and tested for black and white photocopy readability.