Embed Size (px)
Citation preview
Recent Verifications of Climate Prediction Center (CPC) Extended
Range Outlooks Scott Handel
NOAA/NWS/NCEP/CPC 37th Climate Diagnostics and Prediction Workshop
Fort Collins, CO Oct 22, 2012
Acknowledgements
• Adam Allgood
• David Unger
• Jon Gottschalck
• Ed Olenic
• Melissa Ou
• Mike Charles
• Sarah Marquardt
Outline
• Overview of forecasts, observations, and verification methods
• Summary of Verification Statistics
• Verification Resources Available to the Public
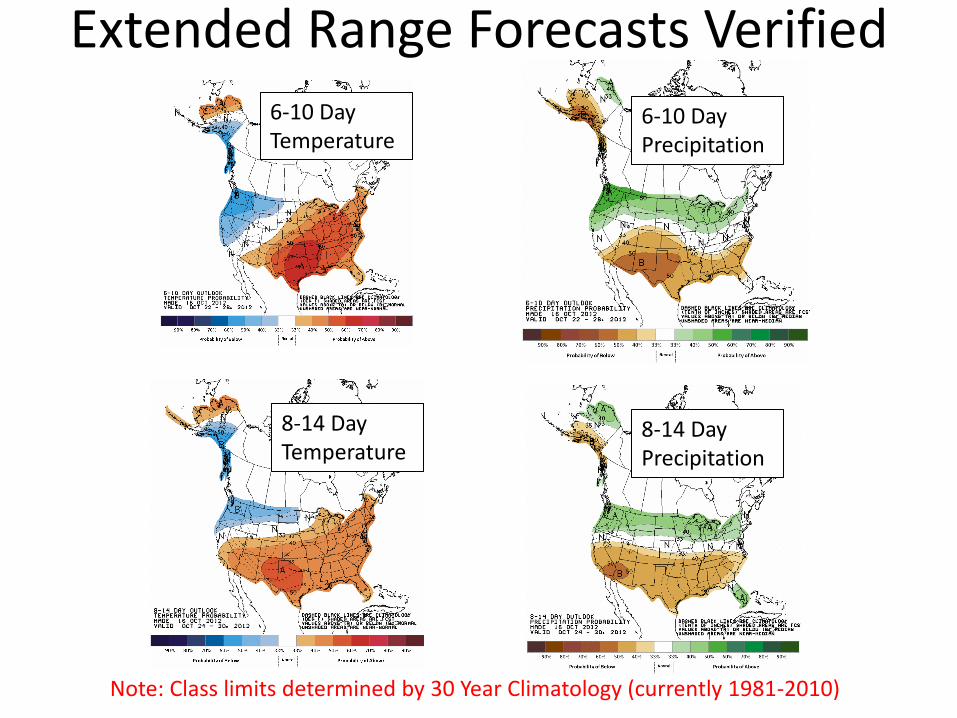
Extended Range Forecasts Verified
Gridded Representation
6-10 Day Temperature
8-14 Day Precipitation
6-10 Day Precipitation
8-14 Day Temperature
Note: Class limits determined by 30 Year Climatology (currently 1981-2010)
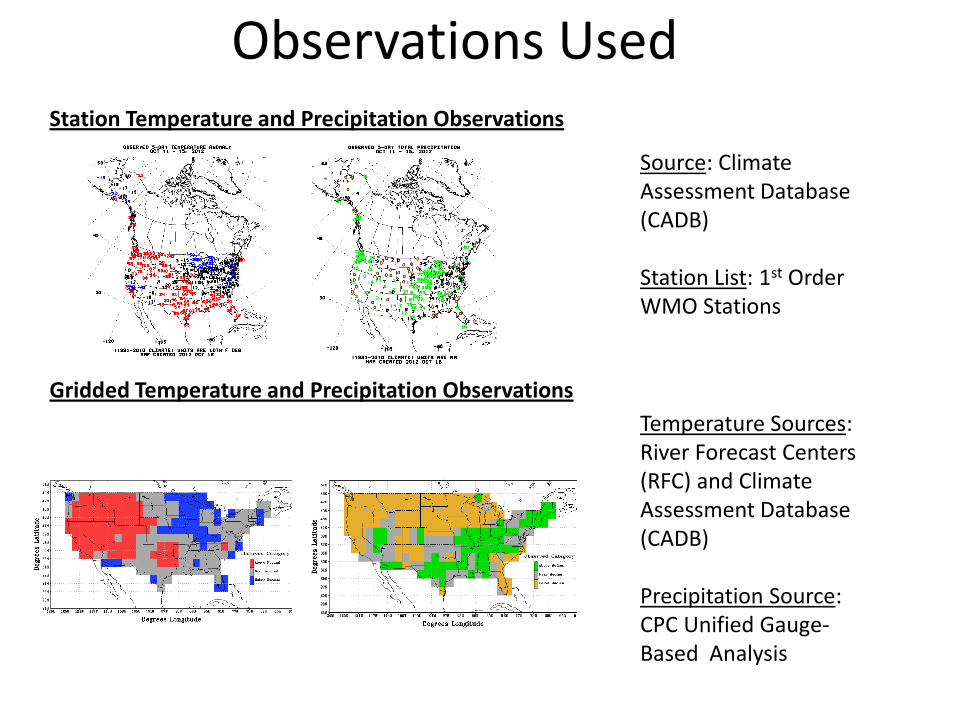
Observations Used
Gridded Temp
Station Temperature and Precipitation Observations
Gridded Temperature and Precipitation Observations
Source: Climate Assessment Database (CADB) Station List: 1st Order WMO Stations
Temperature Sources: River Forecast Centers (RFC) and Climate Assessment Database (CADB) Precipitation Source: CPC Unified Gauge-Based Analysis
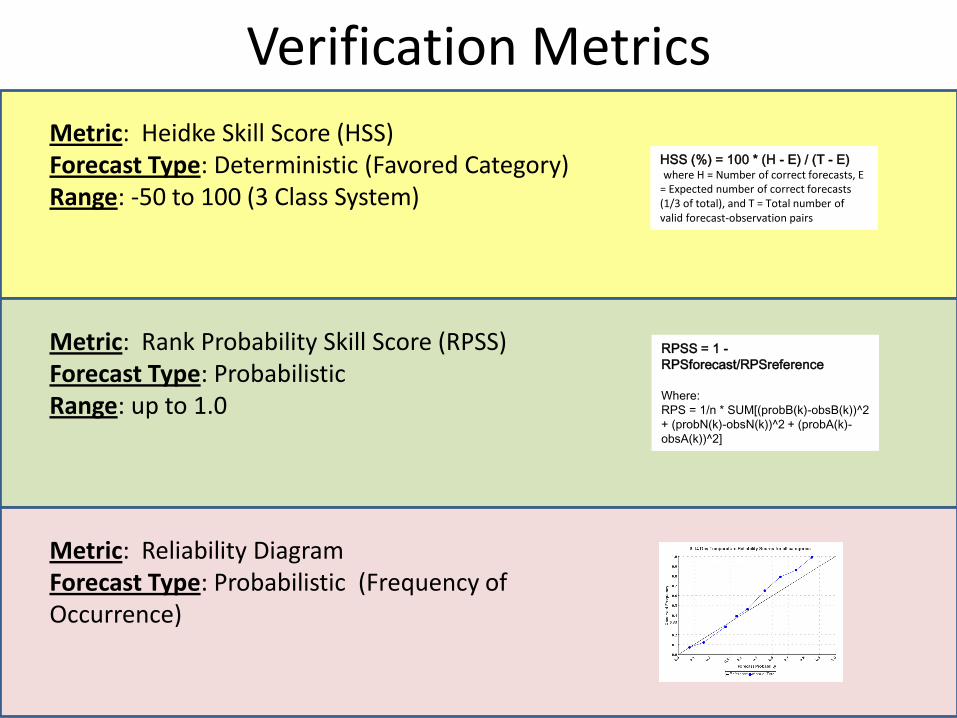
Verification Metrics
Metric: Heidke Skill Score (HSS) Forecast Type: Deterministic (Favored Category) Range: -50 to 100 (3 Class System)
Metric: Rank Probability Skill Score (RPSS) Forecast Type: Probabilistic Range: up to 1.0
Metric: Reliability Diagram Forecast Type: Probabilistic (Frequency of Occurrence)
HSS (%) = 100 * (H - E) / (T - E) where H = Number of correct forecasts, E = Expected number of correct forecasts (1/3 of total), and T = Total number of valid forecast-observation pairs
RPSS = 1 -
RPSforecast/RPSreference
Where:
RPS = 1/n * SUM[(probB(k)-obsB(k))^2
+ (probN(k)-obsN(k))^2 + (probA(k)-
obsA(k))^2]
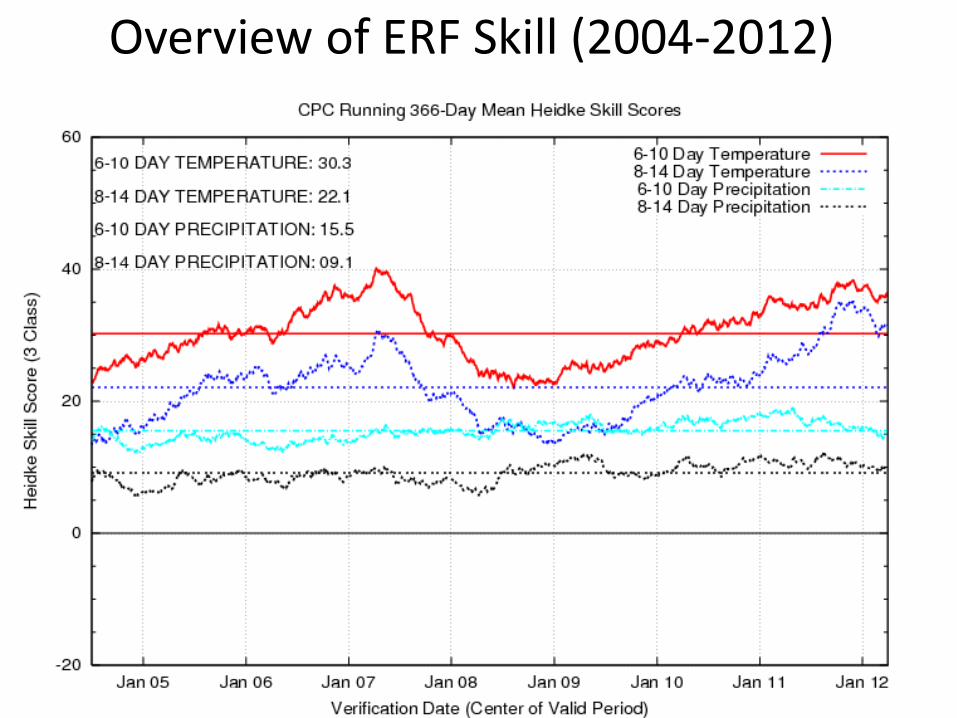
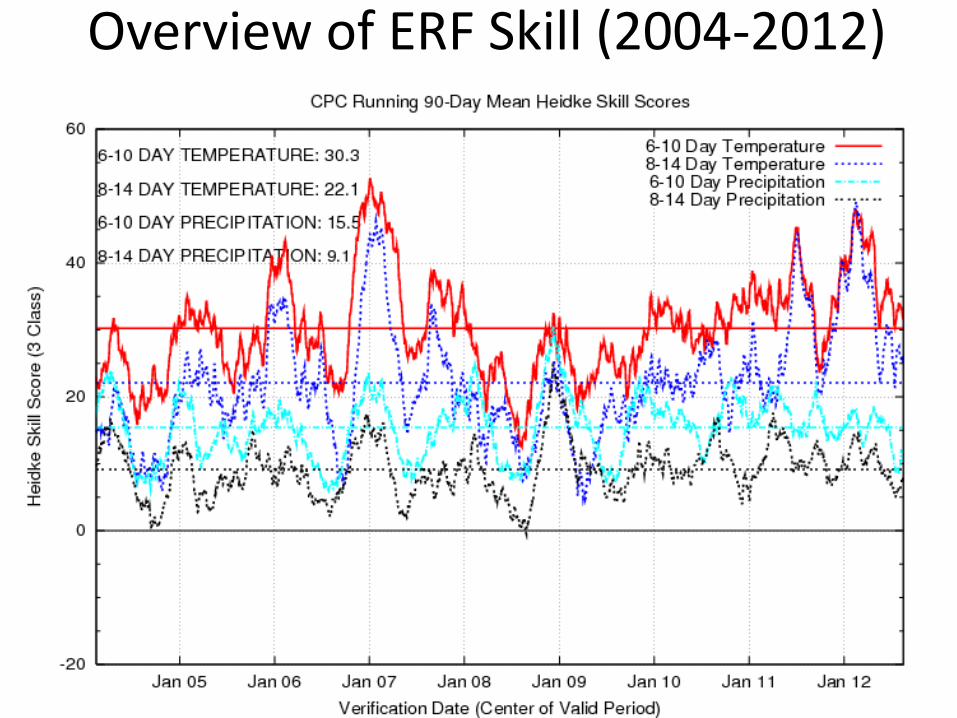
Overview of ERF Skill (2004-2012)
• [One Single Time Series Chart of Past 10 Years Consisting of 6-10/8-14 T & P all in One Graph]
• Summer Skill Improve, Winter the Same
• Fewer periods of bad skill
• Indicate when NAEFS started
• NEED RPSS PLOT
Overview of ERF Skill (2004-2012)
• [One Single Time Series Chart of Past 10 Years Consisting of 6-10/8-14 T & P all in One Graph]
• Summer Skill Improve, Winter the Same
• Fewer periods of bad skill
• Indicate when NAEFS started
• NEED RPSS PLOT
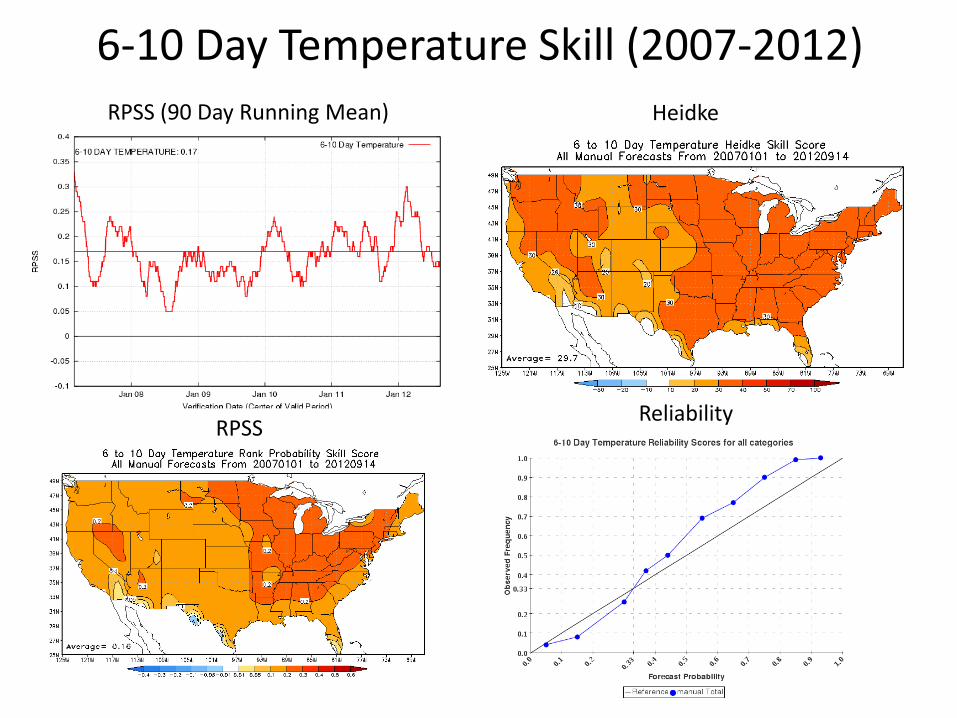
6-10 Day Temperature Skill (2007-2012)
Heidke Time Series Heidke or RPSS Map
RPSS Time Series
RPSS (90 Day Running Mean) Heidke
RPSS Reliability
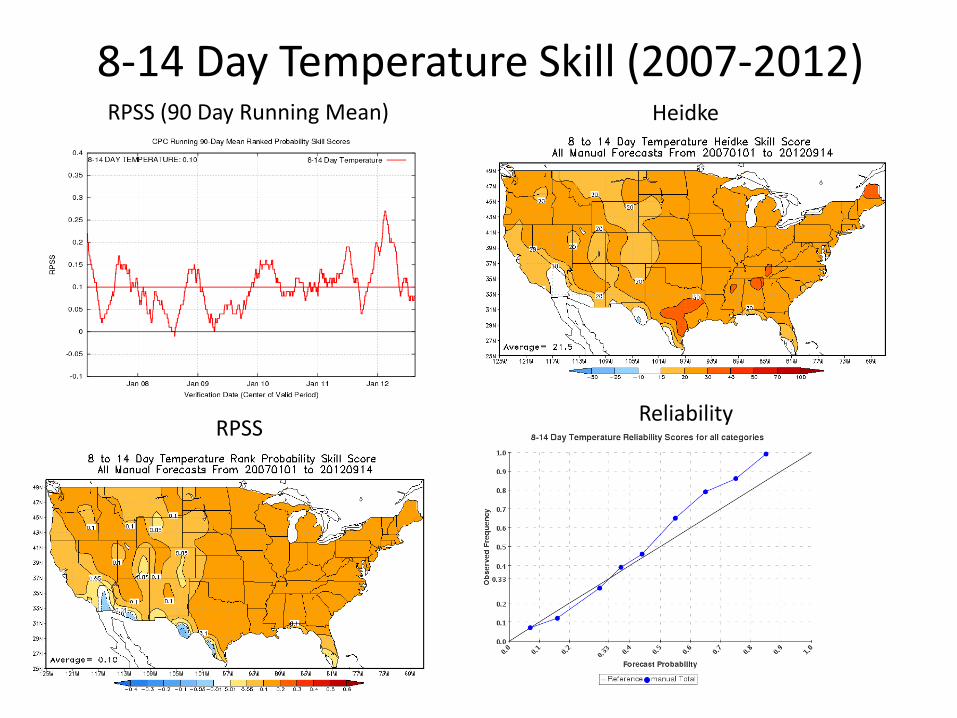
8-14 Day Temperature Skill (2007-2012)
Reliability
Heidke or RPSS Map
RPSS Time Series
RPSS (90 Day Running Mean) Heidke
RPSS Reliability
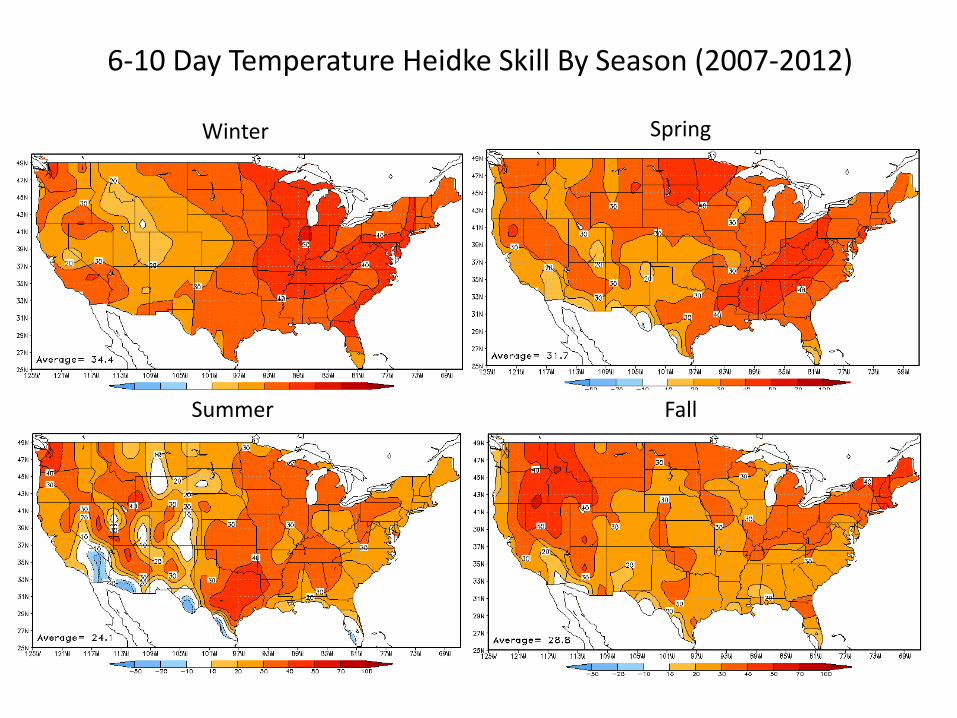
6-10 Day Temperature Heidke Skill By Season (2007-2012)
RPSS Time Series
Winter Spring
Summer Fall
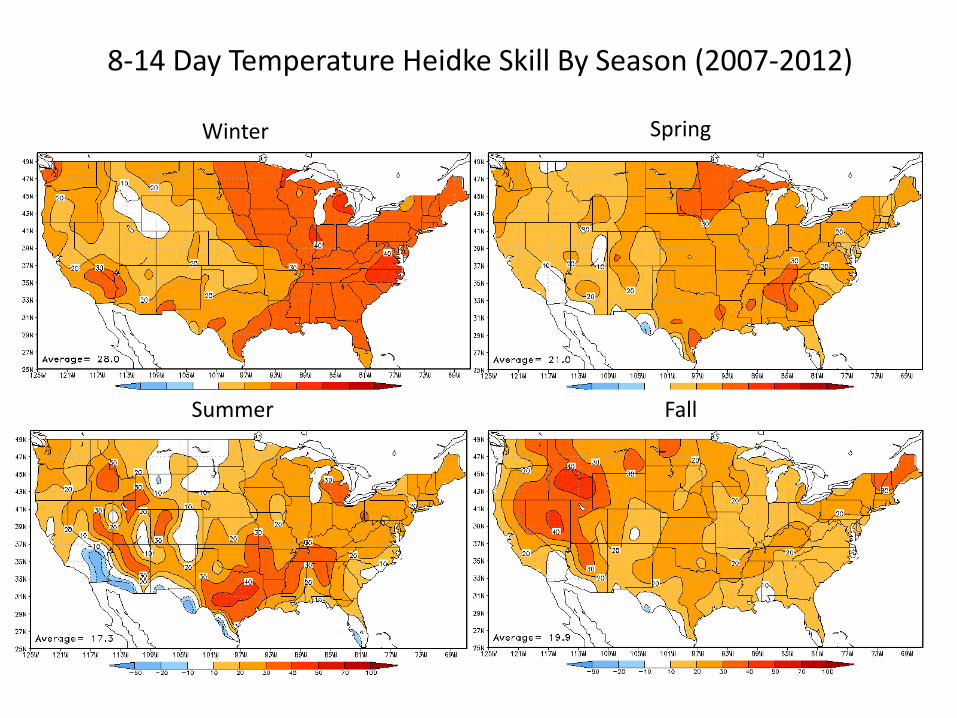
8-14 Day Temperature Heidke Skill By Season (2007-2012)
Winter Spring
Summer Fall
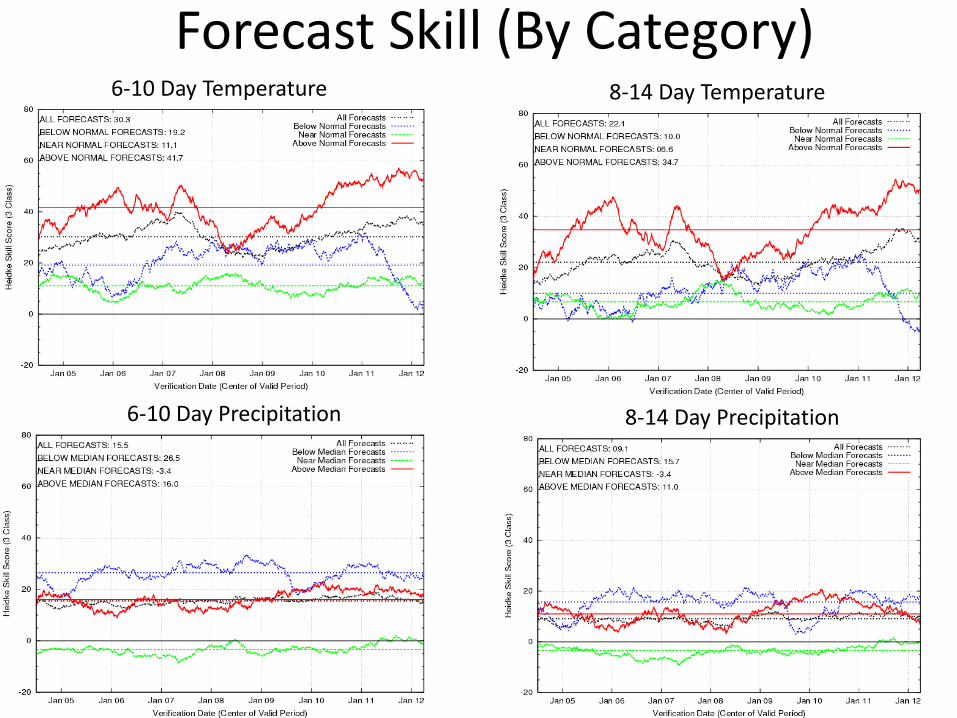
Forecast Skill (By Category)
D+ 11 T Reliability D+ 11 P Reliability
6-10 Day Temperature 8-14 Day Temperature
6-10 Day Precipitation 8-14 Day Precipitation
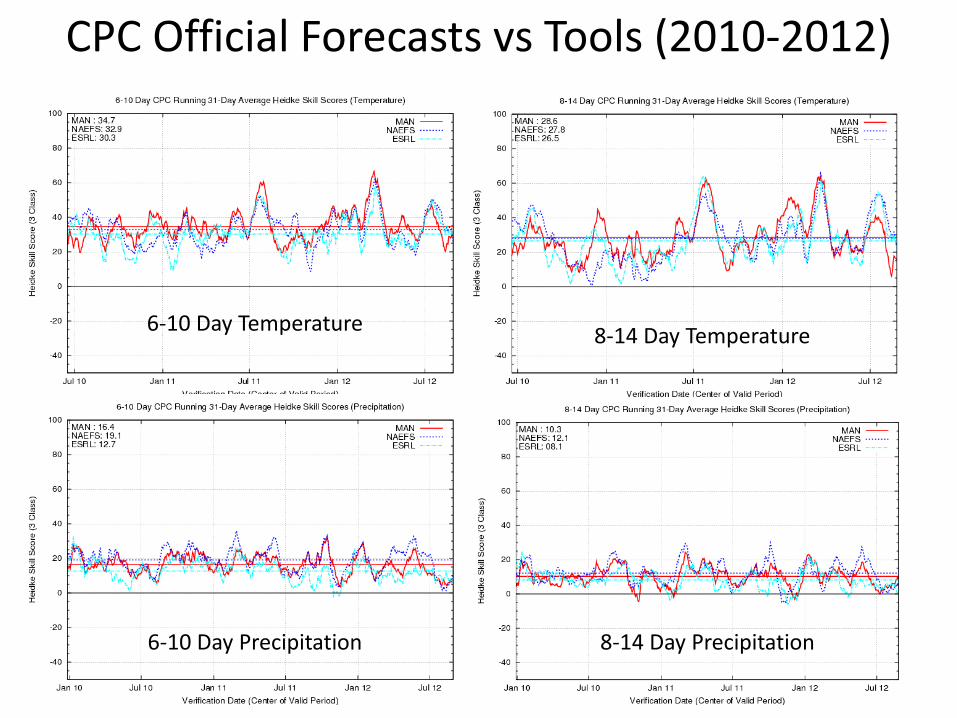
CPC Official Forecasts vs Tools (2010-2012)
D+ 11 T Reliability D+ 8 T Reliability
6-10 Day Temperature
8-14 Day Precipitation
8-14 Day Temperature
6-10 Day Precipitation
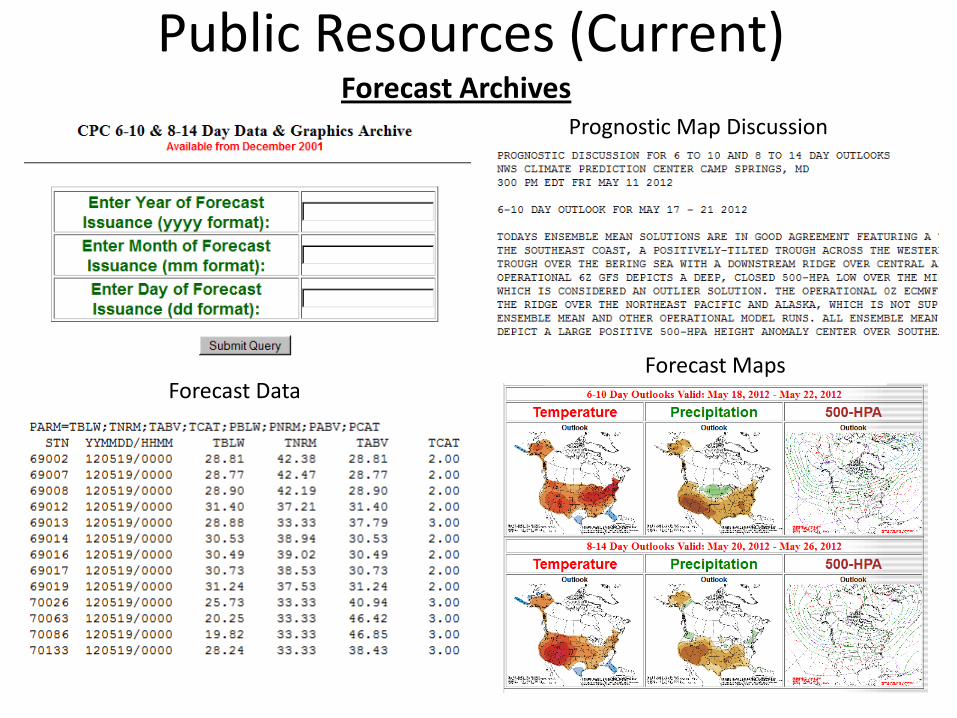
Public Resources (Current) Forecast Archives
Prognostic Map Discussion
Forecast Data Forecast Maps
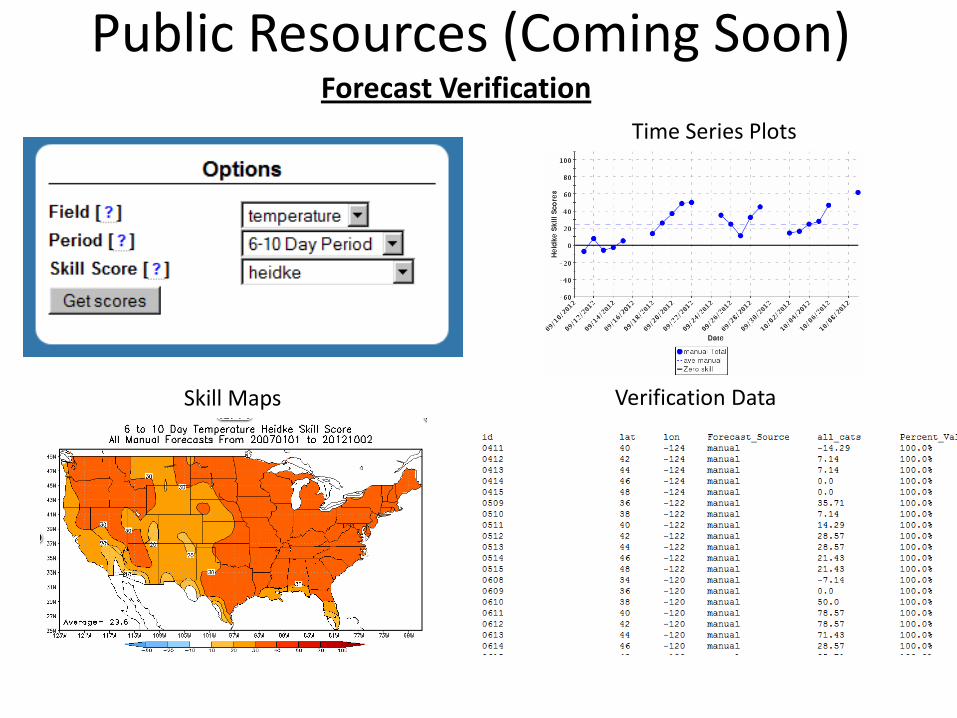
Public Resources (Coming Soon) Forecast Verification
Time Series Plots
Skill Maps Verification Data
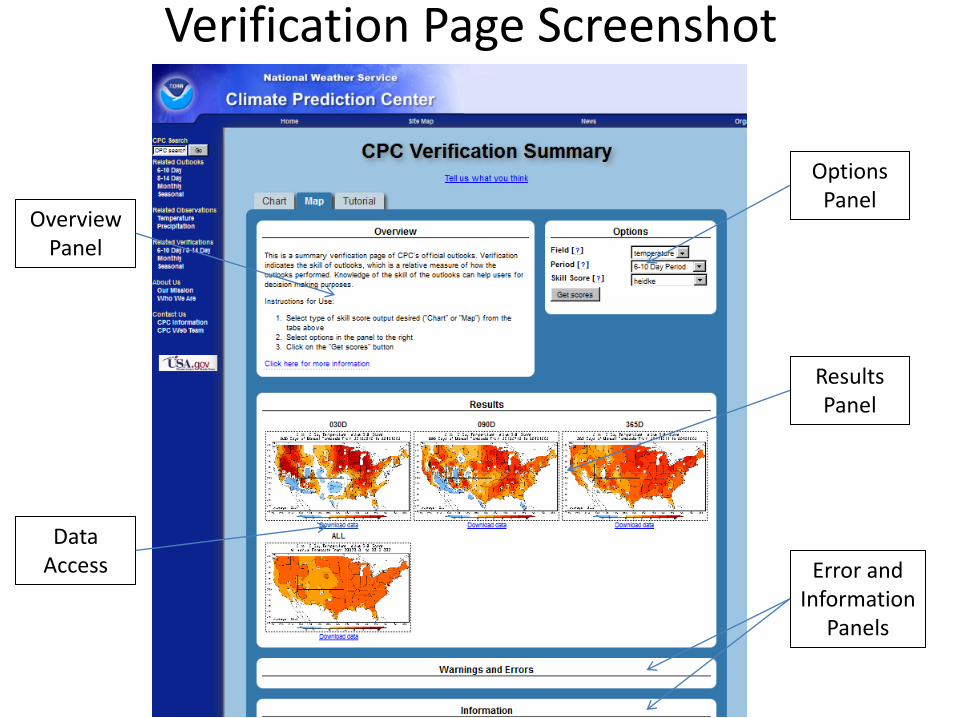
Verification Page Screenshot
Overview Panel
Options Panel
Results Panel
Error and Information
Panels
Data Access
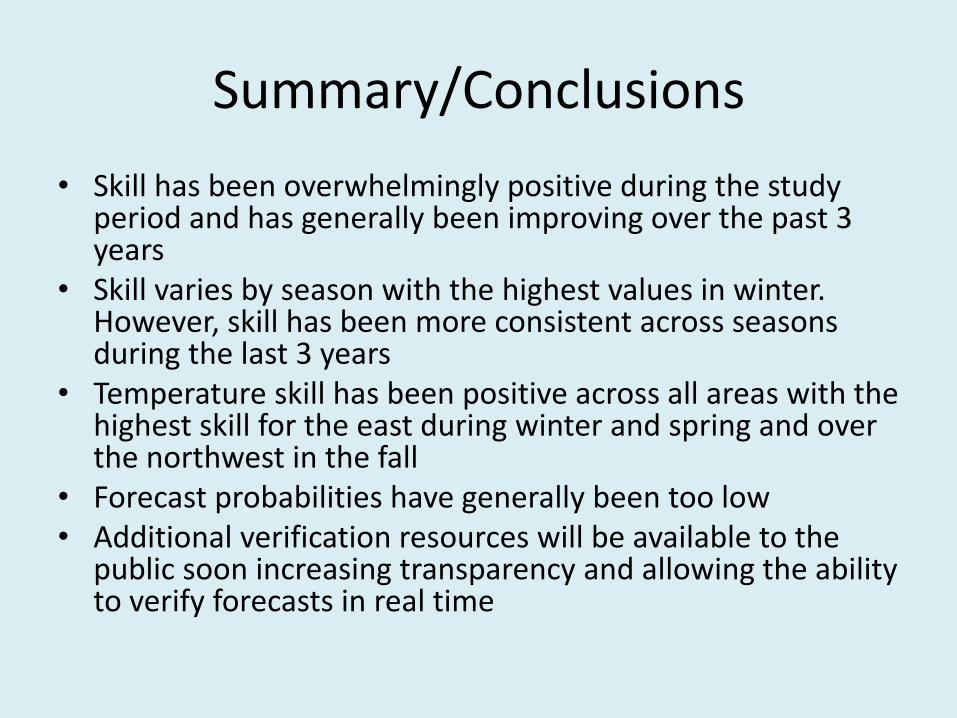
Summary/Conclusions
• Skill has been overwhelmingly positive during the study period and has generally been improving over the past 3 years
• Skill varies by season with the highest values in winter. However, skill has been more consistent across seasons during the last 3 years
• Temperature skill has been positive across all areas with the highest skill for the east during winter and spring and over the northwest in the fall
• Forecast probabilities have generally been too low • Additional verification resources will be available to the
public soon increasing transparency and allowing the ability to verify forecasts in real time

Backup Slides
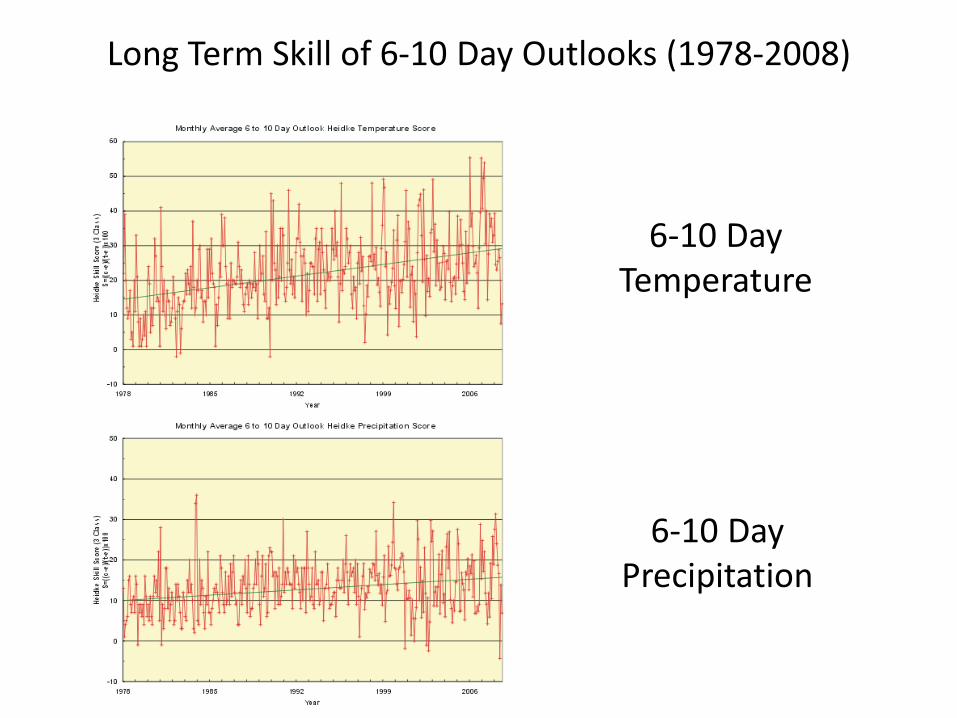
Long Term Skill of 6-10 Day Outlooks (1978-2008)
6-10 Day Temperature
6-10 Day Precipitation
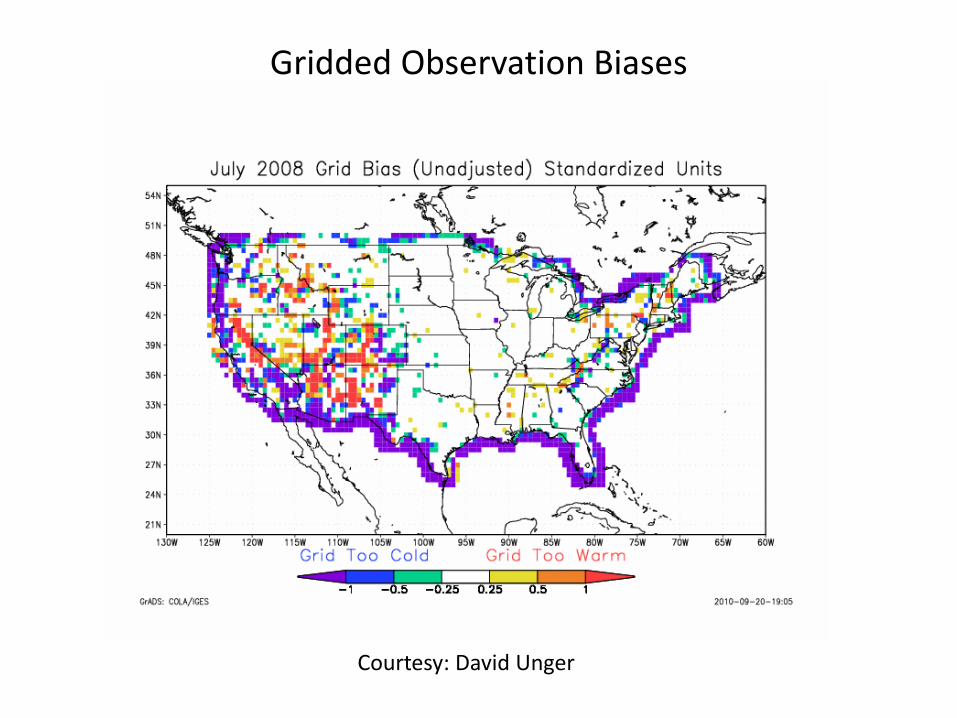
Gridded Observation Biases
Courtesy: David Unger
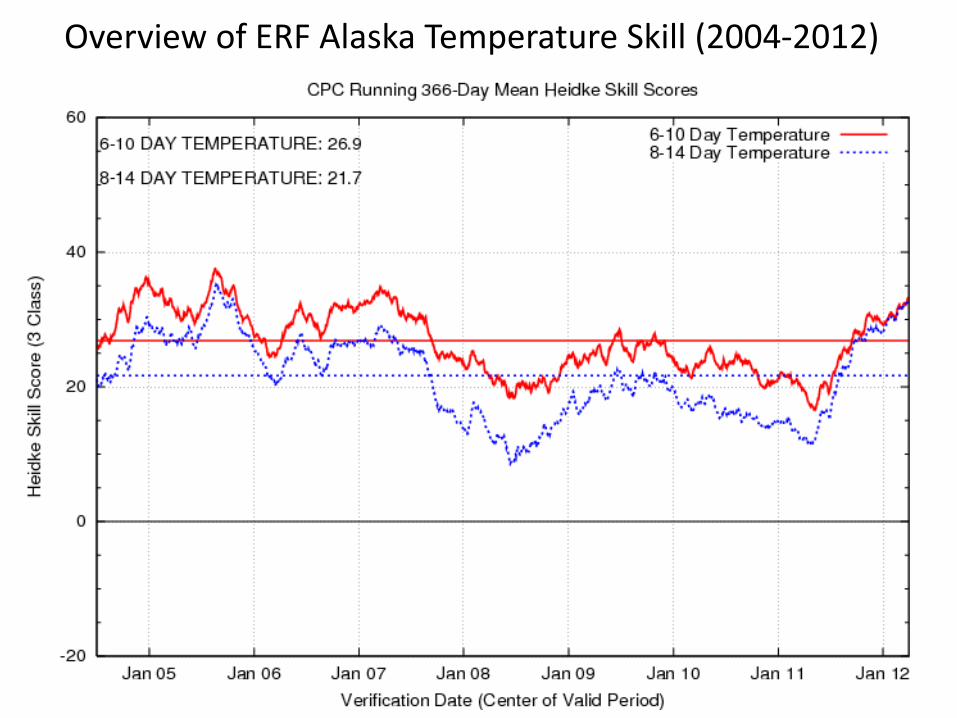
Overview of ERF Alaska Temperature Skill (2004-2012)
• [One Single Time Series Chart of Past 10 Years Consisting of 6-10/8-14 T & P all in One Graph]
• Summer Skill Improve, Winter the Same
• Fewer periods of bad skill
• Indicate when NAEFS started
• NEED RPSS PLOT
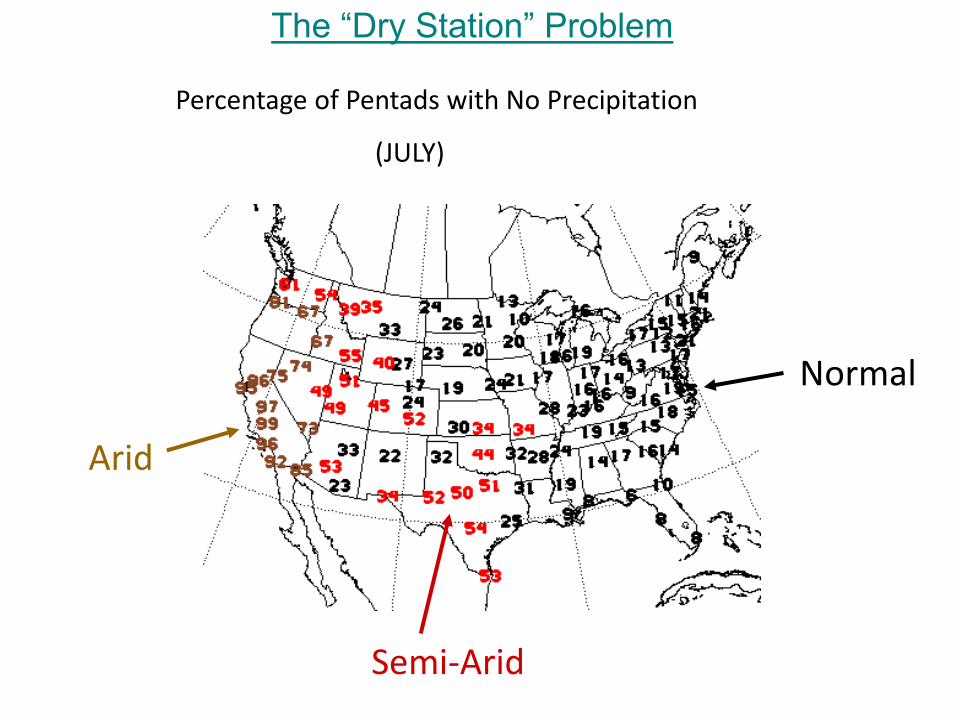
The “Dry Station” Problem
Percentage of Pentads with No Precipitation
(JULY)
Arid
Semi-Arid
Normal
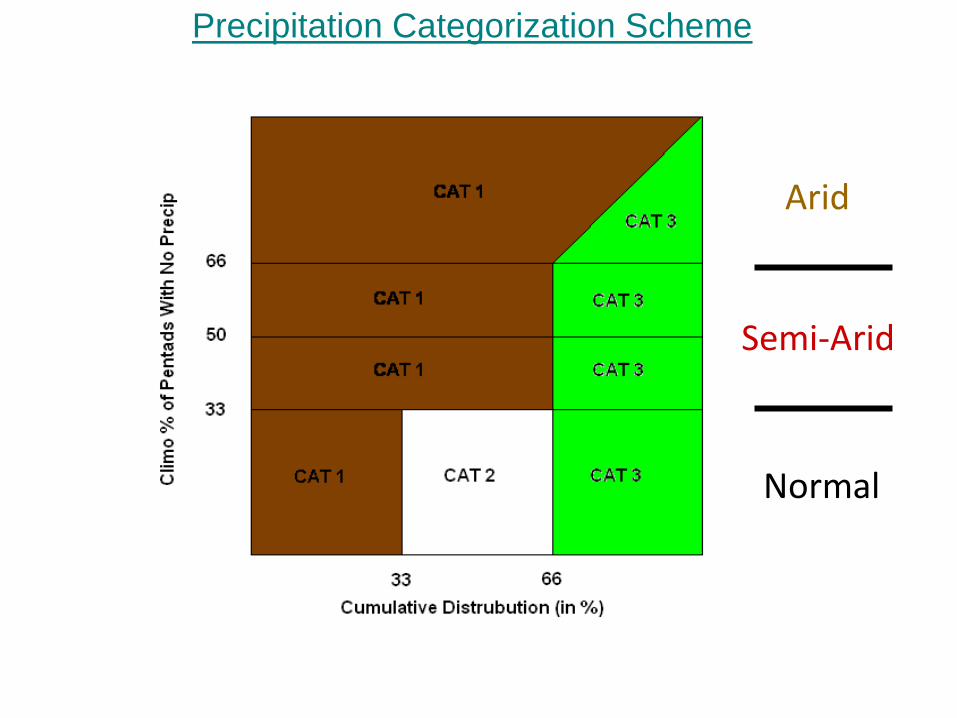
Precipitation Categorization Scheme
Arid
Semi-Arid
Normal