Embed Size (px)
Citation preview
Atmos. Chem. Phys., 18, 8279–8291, 2018https://doi.org/10.5194/acp-18-8279-2018© Author(s) 2018. This work is distributed underthe Creative Commons Attribution 4.0 License.
Recent decrease trend of atmospheric mercury concentrations inEast China: the influence of anthropogenic emissionsYi Tang1,2, Shuxiao Wang1,2, Qingru Wu1,2, Kaiyun Liu1,2, Long Wang3, Shu Li1, Wei Gao4, Lei Zhang5,Haotian Zheng1,2, Zhijian Li1, and Jiming Hao1,2
1State Key Joint Laboratory of Environmental Simulation and Pollution Control, School of Environment,Tsinghua University, Beijing 100084, China2State Environmental Protection Key Laboratory of Sources and Control of Air Pollution Complex,Beijing 100084, China3School of Environment and Energy, South China University of Technology,Guangzhou 510006, China4Yangtze River Delta Center for Environmental Meteorology Prediction and Warning,Shanghai 20030, China5State Key Laboratory of Pollution Control & Resource Reuse, School of the Environment,Nanjing University, Nanjing 210023, China
Correspondence: Shuxiao Wang ([email protected]) and Qingru Wu ([email protected])
Received: 20 December 2017 – Discussion started: 1 February 2018Revised: 9 May 2018 – Accepted: 18 May 2018 – Published: 14 June 2018
Abstract. Measurements of gaseous elemental mercury(GEM), other air pollutants, including SO2, NOx , O3, PM2.5,and CO, and meteorological conditions were carried out atChongming Island in East China from 1 March 2014 to 31December 2016. During the sampling period, GEM con-centrations significantly decreased from 2.68± 1.07 ng m−3
in 2014 (March to December) to 1.60± 0.56 ng m−3 in2016 (March to December). Monthly mean GEM concen-tration showed a significant decrease, at a rate of −0.60±0.08 ng m−3 yr−1 (R2
= 0.64, p < 0.01 significance level).Combining the analysis of the potential source contributionfunction (PSCF), principle component analysis (PCA), andthe emission inventory, we found that the Yangtze RiverDelta (YRD) region was the dominant source region of GEMin Chongming Island and the main source industries includedcoal-fired power plants, coal-fired industrial boilers, and ce-ment clinker production. We further quantified the effect ofemission change on the air Hg concentration variations atChongming Island through a coupled method of trajectoryclusters and air Hg concentrations. It was found that the re-duction of domestic emissions was the main driver of GEMdecline in Chongming Island, accounting for 70 % of the totaldecline. The results indicated that air pollution control poli-
cies targeting SO2, NOx , and particulate matter reductionshad significant co-benefits on GEM.
1 Introduction
Mercury (Hg) is of crucial concern to public health andthe global environment for its neurotoxicity, long-distancetransport, and bioaccumulation. The atmosphere is an im-portant channel for global Hg transport. Once atmosphericHg deposits to the aquatic system, it can be transformed intomethylmercury (MeHg), which bioaccumulates through thefood web and affects the central nervous system of human be-ings (Mason et al., 1995). Hg is therefore on the priority listof several international agreements and conventions dealingwith environmental protection, including the Minamata Con-vention on Mercury.
Atmospheric Hg exists in three operationally definedforms: gaseous elemental mercury (GEM), gaseous oxidizedmercury (GOM), and particulate-bound mercury (PBM).And the sum of GEM and GOM is known as total gaseousmercury (TGM). In the atmosphere, Hg is mainly present asGEM, accounting for over 95 % of the total at most obser-
Published by Copernicus Publications on behalf of the European Geosciences Union.
8280 Y. Tang et al.: Recent decrease trend of atmospheric mercury concentrations in East China
vation sites (Fu et al., 2015; Li et al., 2016; Zhang et al.,2013). GEM is stable, has a low solubility in the troposphereand a long residence time, and can be transported at regionaland global scales (Lindberg et al., 2007). GEM can be ox-idized through photochemical reaction to GOM, which canbe converted to PBM upon adsorption/absorption on aerosolsurfaces. GOM is more soluble than GEM, and PBM can bequickly scavenged by both dry and wet deposition. There-fore, the residence time of both GOM and PBM is shorterthan that of GEM, generally several days to a few weeksfor GOM and PBM and 0.5–2 year for GEM (Schroeder andMunthe, 1998).
The atmospheric Hg observation results are important ev-idence to help assess the effect of Hg emission control. Dur-ing the past decades, significant decreases of GEM concen-trations have been observed in Europe and North America(Cole et al., 2013; Weigelt et al., 2015). Air Hg concentra-tions in the Northern Hemisphere are reported to decline by30–40 % between 1990 and 2010 (Y. Zhang et al., 2016).Such a decrease is consistent with the decrease in the an-thropogenic Hg emissions inventory in Europe and NorthAmerica (Streets et al., 2011). So far, most of the long-termobservations on ground sites have been carried out in devel-oped countries. For developing countries such as China, lim-ited atmospheric Hg observations have been carried out (Fuet al., 2008b; H. Zhang et al., 2016; Hong et al., 2016) andthere is no official national observing network of atmosphericHg in mainland China. Therefore, there are few continuousmulti-year observation records of China’s air Hg concentra-tions published (Fu et al., 2015).
China contributes to the largest Hg emissions in the worldand will continue to be a significant Hg emitter for globalHg emissions in the future (UNEP, 2013; Wu et al., 2016;Chen et al., 2018; Pacyna et al., 2016). Large Hg emis-sions in China have led to average air Hg concentrations of2.86± 0.95 ng m−3 (in the range of 1.60–5.07 ng m−3) at re-mote sites in China (Fu et al., 2015). Such a Hg concentra-tion level is approximately 1.3 ng m−3 higher than the back-ground concentration of GEM in the Northern Hemisphere(Zhang et al., 2016; Sprovieri et al., 2017; Fu et al., 2015).In addition, large Hg emissions in China will also impact theair Hg concentrations in East Asia and even North Americathrough long-range transport (Sung et al., 2018; Zhang et al.,2017). Meanwhile, China has a great potential for Hg emis-sion reduction through the implementation of the MinamataConvention on Mercury (Chen et al., 2018). Therefore, long-term atmospheric Hg observations in China are critical to un-derstand the Hg cycling at both regional and global scales.China’s Hg emissions increased from 147 t yr−1 in 1978 toaround 538 t yr−1 in 2010 due to dramatic economic develop-ment (L. Zhang et al., 2015; Wu et al., 2016; Hui et al., 2017).Atmospheric Hg monitoring that spanned from 2002 to 2010in Guiyang, southwestern China, reflected the increase of Hgemissions in China (Fu et al., 2011). However, atmosphericHg emissions in China are estimated to have decreased since
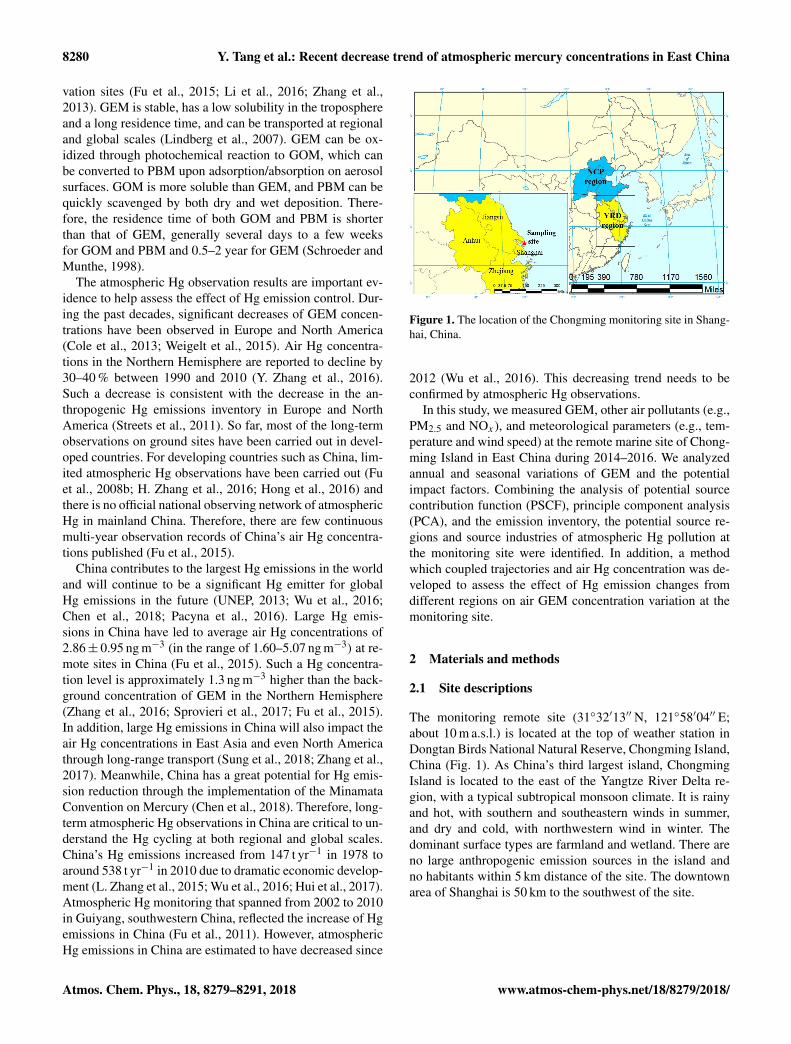
Figure 1. The location of the Chongming monitoring site in Shang-hai, China.
2012 (Wu et al., 2016). This decreasing trend needs to beconfirmed by atmospheric Hg observations.
In this study, we measured GEM, other air pollutants (e.g.,PM2.5 and NOx), and meteorological parameters (e.g., tem-perature and wind speed) at the remote marine site of Chong-ming Island in East China during 2014–2016. We analyzedannual and seasonal variations of GEM and the potentialimpact factors. Combining the analysis of potential sourcecontribution function (PSCF), principle component analysis(PCA), and the emission inventory, the potential source re-gions and source industries of atmospheric Hg pollution atthe monitoring site were identified. In addition, a methodwhich coupled trajectories and air Hg concentration was de-veloped to assess the effect of Hg emission changes fromdifferent regions on air GEM concentration variation at themonitoring site.
2 Materials and methods
2.1 Site descriptions
The monitoring remote site (31◦32′13′′ N, 121◦58′04′′ E;about 10 m a.s.l.) is located at the top of weather station inDongtan Birds National Natural Reserve, Chongming Island,China (Fig. 1). As China’s third largest island, ChongmingIsland is located to the east of the Yangtze River Delta re-gion, with a typical subtropical monsoon climate. It is rainyand hot, with southern and southeastern winds in summer,and dry and cold, with northwestern wind in winter. Thedominant surface types are farmland and wetland. There areno large anthropogenic emission sources in the island andno habitants within 5 km distance of the site. The downtownarea of Shanghai is 50 km to the southwest of the site.
Atmos. Chem. Phys., 18, 8279–8291, 2018 www.atmos-chem-phys.net/18/8279/2018/
Y. Tang et al.: Recent decrease trend of atmospheric mercury concentrations in East China 8281
2.2 Sampling methods and analysis
During the monitoring period, we used Tekran2537X/1130/1135 instruments to monitor speciated Hgin the atmosphere, which has been widely used for airHg observations worldwide. The sampling inlet was 1.5 mabove the instrument platform. Continuous 5 min of GEMwas measured by a Tekran 2537X Hg vapor analyzer, witha detection limit of 0.1 ng m−3 at a sampling flow rate of1.0 L min−1 during two campaigns: 1 March 2014 to 31December 2015 and 26 March to 31 December 2016. From 5July 2015 to 30 April 2016, the Tekran 1130/1135 speciationunit was damaged by the rainstorm; the Tekran 2537Xwas operated without speciation units but with a PTFEfilter to protect the instrument from particles and sea salt.Therefore, the observed concentrations during July 2015–April 2016 were TGM concentrations. However, the GOMconcentrations at Chongming Island accounted for lessthan 1 % of TGM (TGM=GOM+GEM). Thus, the GEMconcentrations were approximated to TGM concentrationsfrom July 2015 to April 2016.
The 2537X analyzer was calibrated automatically every25 h using the internal Hg permeation source inside the in-strument, and the internal permeation source was calibratedevery 12 months with manual injection of Hg by a syringefrom an external Hg source (module 2505). Two zero andtwo span calibrations were performed for each calibration ofgold trap A and B, respectively. The difference between goldtrap A and gold trap B was limited to ±10 %. The impactorplates and quartz filter were changed every 2 weeks. Thesoda lime was changed once a month. The denuders werere-coated once every 2 weeks following the procedure devel-oped by Landis et al. (2002).
In our research, random uncertainties of individual mea-surement had been averaged out and the systematic uncer-tainties need to be considered. The overall practically achiev-able systematic uncertainty would be 10 %, considering thatthe instrument did not perform at an ideal level (Slemr et al.,2015; Steffen et al., 2012). For example, slow deactivationof the traps, contamination of the switching valves, and leakswould increase the uncertainty but were difficult to quantify(Slemr et al., 2015; Steffen et al., 2012). Because of the con-sistency of instrument and the quality assurance/quality con-trol have been paid special attention to during the samplingcampaign, the systematic differences of instrument did notaffect the huge variation between 2014 and 2016.
During the sampling campaigns, PM2.5, O3, NOx , CO,and SO2 were also monitored by Thermo Scientific TEOM1405D, Model 49i O3 Analyzer, Model 48i CO Analyzer,Model 42i-TL NOx Analyzer, and Model 43i SO2 Analyzer,respectively. The detection limits of O3, SO2, NOx , CO,and PM2.5 are 1.0, 0.5, 0.4, 0.04, and 0.1 µg m−3, respec-tively. The meteorological parameters including air temper-ature, wind speed, and wind direction were measured by aVantage Pro2 weather station (Davis Instruments). The in-
struments were tested and calibrated periodically. All datawere averaged hourly in this study.
2.3 Sources apportionment of atmospheric Hgpollution
2.3.1 PSCF model
To identify the source areas for pollutants with a relativelylong lifetime such as GEM (Xu and Akhtar, 2010), the PSCFvalues for mean GEM concentrations in grid cells in a studydomain were calculated by counting the trajectory segmentendpoints that terminate within each cell. The number of end-points that fall in the ij th cell are designated nij . The num-ber of endpoints for which GEM concentrations correspondto arrival times higher than a specific criterion at the monitor-ing site for the same cell are defined by mij . The criterion inthis study is set as the average Hg concentration during ourstudy period. The PSCF value for the ij th cell is then definedas
PSCFij =mij
nij
Wij , (1)
where Wij is an empirical weight to reduce the effects of gridcells with small nij values. In this study, Wij is defined as inthe following formula, in which Avg is the mean nij of allgrid cells with nij greater than zero:
Wij =
1.0 nij > 2 ·Avg0.7 Avg < nij ≤ 2 ·Avg0.42 0.5 ·Avg < nij ≤ Avg0.17 nij ≤ 0.5 ·Avg
. (2)
The PSCF value indicates the probability of a grid cellthrough which polluted events occur. More method detailscan be found in the study of Polissar et al. (1999). Inthis study, the domain that covered the potential contribu-tion source region (105–135◦ E, 15–45◦ N) was divided into22 500 grid cells with 0.2◦× 0.2◦ resolution. The 72 h backtrajectories were generated hourly from 1 March 2014 to 31December 2015 and from 26 March to 31 December 2016by TrajStat, software which includes HYSPLIT for trajec-tory calculation with trajectory statistics modules (Wang etal., 2009). The PSCF map was plotted using ArcGIS version10.1.
2.3.2 Principal component analysis (PCA)
Principal component analysis between Hg and other pollu-tant concentrations was used to identify potential sources.Strong positive loading (loading > 0.40) with SO2 and PM2.5typically indicates the impact of coal combustion, and strongpositive loading with GEM and CO has often been used asan indicator for regional transport because both pollutantshave similar source and stable chemical properties (Lin etal., 2006; Pirrone et al., 1996). In this study, PCA was ap-plied to infer the possible influencing factors of GEM in
www.atmos-chem-phys.net/18/8279/2018/ Atmos. Chem. Phys., 18, 8279–8291, 2018
8282 Y. Tang et al.: Recent decrease trend of atmospheric mercury concentrations in East China
2014 and 2016. Prior to analysis, each variable was normal-ized by dividing its mean, and pollutant concentrations (SO2,CO, NOx , PM2.5) were averaged to 1 h sampling intervals tomatch the hourly Hg monitoring during the sampling period.The results in 2016 had no CO data due to the instrument be-ing broken. Statistics analyses were carried out using SPSS19.0 software.
2.4 Quantification method of source contribution
To further quantitatively assess the effect of change inemissions from different regions on air concentration vari-ation at a certain monitoring site, a quantitative estimationmethod which coupled trajectories with air Hg concentra-tions was developed. We firstly identified the trajectoriesusing the National Oceanic and Atmospheric Administra-tion (NOAA) Hybrid Single-Particle Lagrangian IntegratedTrajectory (HYSPLIT) model. The gridded meteorologicaldata at a horizontal resolution of 1◦× 1◦ were obtained fromthe Global Data Assimilation System (GDAS) (Draxler andHess, 1998). The starting height was set to be 500 m aboveground level to represent the center height of the boundarylayer, where pollutants are usually well mixed. Secondly,each trajectory was assigned a GEM concentration by match-ing the arriving time at the Chongming site. Third, the back-ward trajectories which were coupled with Hg concentrationswere clustered into groups according to transport patterns us-ing NOAA HYSPLIT 4.7. Thus, the grouped clusters wereapplied to identify the Hg source regions. The Hg averageconcentration of the cluster j was calculated as shown inEq. (3), and the trajectory-weighted concentration in the clus-ter j was calculated as shown in Eq. (4). Finally, the contri-bution of reduction at a certain region to Hg concentration atthe monitoring sites in a certain period can be calculated asshown in Eq. (5).
Cj,t=
n∑i=1
Ci,j,t
n∑i=1
Ni,j,t
(3)
TWCj,t = AR×Cj,t , (4)
where N refers to a certain trajectory, j refers to a certaincluster, t is the studied period, n is the number of trajectory,and m is the number of the cluster. C is the GEM concen-tration, in ng m−3. TWC refers to the trajectory-weightedconcentration, in ng m−3. In order to reduce the influenceof trajectory changes in different regions between calculatedyears, the average ratio (AR) was used here for calculatingTWC.
CRj =TWCj,t2 −TWCj,t1
m∑j=1
TWCj,t2 −
m∑j=1
TWCj,t1
, (5)
where CR refers to the contribution of GEM reduction, andt1 and t2 refer to the two periods that are compared in thisstudy, namely the years 2014 and 2016, respectively.
This approach is a simple method to quantify the influenceof anthropogenic emissions on GEM concentration variation.It should be noted that uncertainties always exist in calculat-ing trajectories, causing uncertainties in all trajectory-basedapproaches. Trajectory errors vary considerably in differentsituation. Draxler (1996) suggested uncertainties might be10 % of the travel distance. In addition, meteorological con-ditions were pretty similar in 2014 and 2016 so as to reducethe interference from meteorology (Table S2 in the Supple-ment).
2.5 Regional atmospheric Hg emissions
Regional anthropogenic GEM emissions by month werecalculated using both the technology-based emission fac-tor method and transformed normal distribution functionmethod. A detailed introduction of these two methods and thespeciation profile of the emitted Hg for each sector were de-scribed in our previous study (Wu et al., 2016). Conventionalair pollutant (SO2, PM2.5, and NOx) emissions were calcu-lated following the study of Zhao et al. (2013). The source re-gions included in the emission inventory consisted of Shang-hai, Jiangsu, Zhejiang, and Anhui provinces, according tothe PSCF results (See Sect. 3.3). The studied emission sec-tors included coal-fired power plants, coal-fired industrialboilers, residential coal-combustion, cement clinker produc-tion, iron and steel production, mobile oil combustion, andother small emission sectors (e.g., zinc smelting, lead smelt-ing, municipal solid incineration, copper smelting, aluminumproduction, gold production, other coal combustion, station-ary oil combustion, and cremation). The monthly Hg emis-sions were mainly distributed according to fuel combustionor product production by month (Table S1). For small emis-sion sectors, the annual emissions were equally distributedinto monthly emissions.
The GEM emissions from natural sources EN were calcu-lated as follows:
EN =∑
i
Fi ×Ai × t, (6)
where Fi is a bidirectional Hg flux of canopy i,ng km−2 yr−1; A is the studied area, km−2; t is the studiedyear, yr. The bidirectional Hg flux was obtained from thestudy of Wang et al. (2016) directly. It should be pointed outthat the natural emission was a concept of net emission inthis paper, which reflected a net effect of two competing pro-cesses (Zhang et al., 2009): total Hg natural emissions andtotal Hg deposition. The total natural emissions included pri-mary natural release and re-emission of legacy Hg stored inthe terrestrial and water surface (Wang et al., 2016). Whenthe value is positive, it means the net effect is Hg emissionsto air. Otherwise, Hg is deposited.
Atmos. Chem. Phys., 18, 8279–8291, 2018 www.atmos-chem-phys.net/18/8279/2018/
Y. Tang et al.: Recent decrease trend of atmospheric mercury concentrations in East China 8283
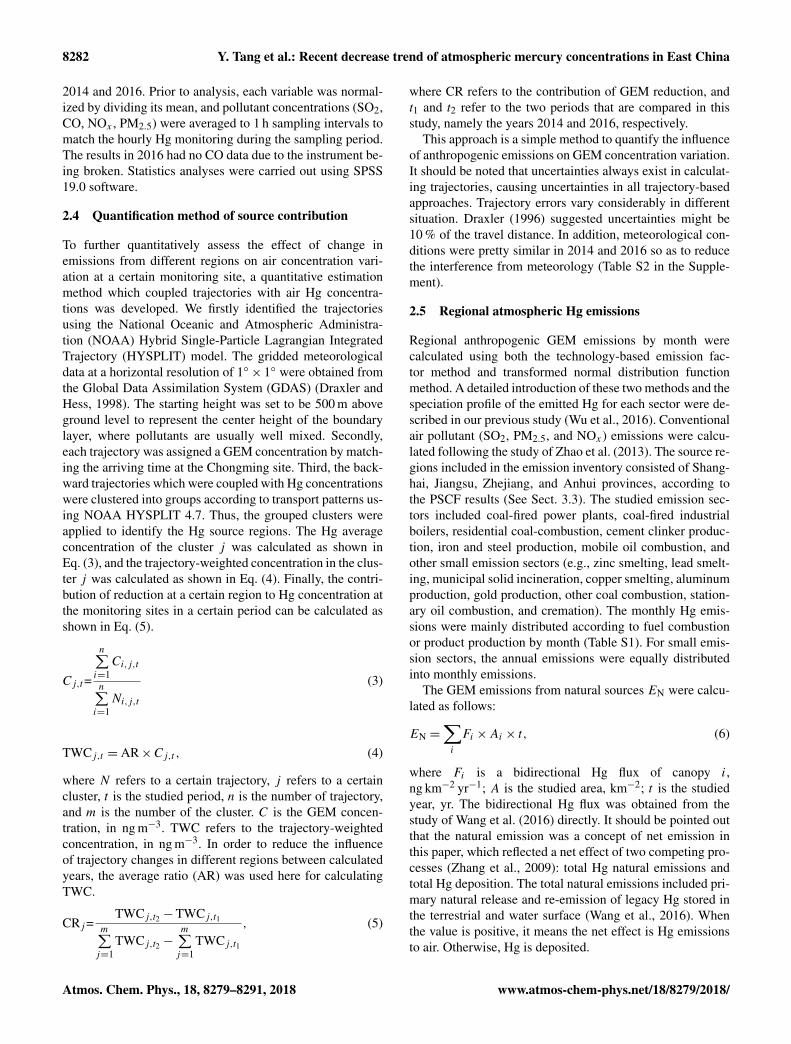
Figure 2. Monthly average GEM concentrations during the studied period: (a) observed monthly GEM concentrations, (b) GEM trendafter decomposition, (c) GEM seasonality after decomposition, and (d) GEM random concentration after decomposition. Note that theobserved concentrations during July 2015–April 2016 were TGM concentrations due to the problems of Tekran 1130/1135. However, theGOM concentrations at Chongming Island accounted for less than 1 % of TGM. Thus, the GEM concentrations were approximated to TGMconcentrations during July 2015–April 2016.
3 Results and discussions
3.1 Decreasing trends of atmospheric Hg during2014–2016
The average concentrations of GEM in 2014 (March toDecember), 2015, and 2016 (March to December) were2.68± 1.07, 2.14± 0.82, and 1.60± 0.56 ng m−3, respec-tively. The GEM concentrations in 2014 were higher (t test,p < 0.01) than the Northern Hemisphere background concen-trations (about 1.5 ng m−3) (Sprovieri et al., 2010) and thosemeasured in other remote and rural locations in China (H.Zhang et al., 2015; Fu et al., 2008a, 2009). However, in 2016,the GEM concentrations were similar to the backgroundconcentrations in the Northern Hemisphere. During this pe-riod, monthly GEM concentrations showed a significant de-crease, at a rate of −0.60± 0.08 ng m−3 yr−1 (R2
= 0.64,p < 0.01 significance level, n= 32) (Fig. 2a). The amountof valid data for each mouth was shown in Table S3. Inaddition, the trend decomposition of the GEM concentra-tion signal (signal= trend+ seasonal+ random) from March2014 to December 2016 is shown in Fig. 2 (https://anomaly.io/seasonal-trend-decomposition-in-r/, last access: 26 May2018). By using this method, we also observed a pronouncedtrend (Fig. 2b), and the random concentration was limited inthe range of −0.24–0.24 ng m−3(Fig. 2d).
One potential worry was that the calculated trend was sen-sitive to seasonal variation and the missing data in Januaryand February 2016 might impact the downward trend. To
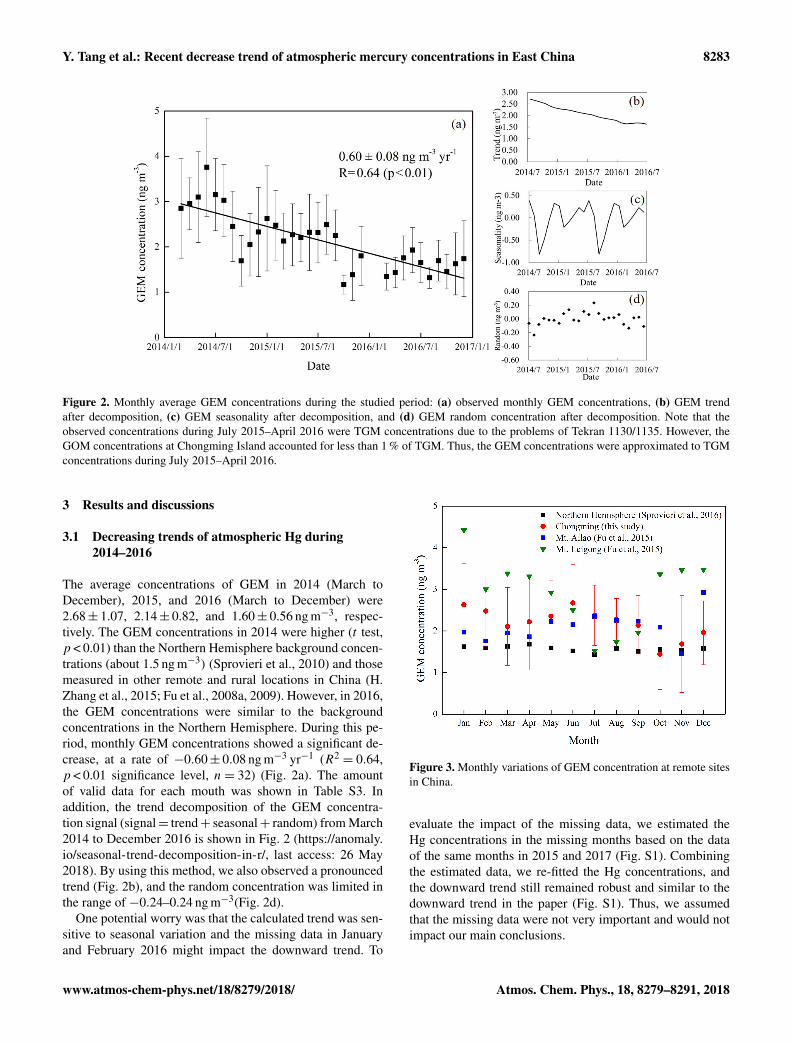
Figure 3. Monthly variations of GEM concentration at remote sitesin China.
evaluate the impact of the missing data, we estimated theHg concentrations in the missing months based on the dataof the same months in 2015 and 2017 (Fig. S1). Combiningthe estimated data, we re-fitted the Hg concentrations, andthe downward trend still remained robust and similar to thedownward trend in the paper (Fig. S1). Thus, we assumedthat the missing data were not very important and would notimpact our main conclusions.
www.atmos-chem-phys.net/18/8279/2018/ Atmos. Chem. Phys., 18, 8279–8291, 2018
8284 Y. Tang et al.: Recent decrease trend of atmospheric mercury concentrations in East China
Table 1. PCA component loading of GEM and other air pollutants.
Airpollutants
2014 Airpollutants
2016
Factor 1 Factor 2 Factor 1 Factor 2
SO2 0.76 0.14 SO2 0.82 −0.09NOx 0.76 −0.20 NOx 0.70 −0.52O3 −0.11 0.98 O3 −0.41 0.97PM2.5 0.85 0.05 PM2.5 0.88 0.05GEM 0.66 0.02 GEM 0.78 −0.19CO 0.79 0.12
Component Combustion Transport of Component Combustion Transport ofair mass air mass
from stratosphere from stratosphere
Variance 49.36 17.53 Variance 50.63 25.10explained explained(%) (%)
Note that values in bold were regarded as high loading (factor loading > 0.40 or <−0.40).
Table S4 showed the Hg variation trends in different re-gions. A significant decrease of GEM concentrations in theNorthern Hemisphere over the past 2 decades has been welldocumented (Weigelt et al., 2015; Cole et al., 2013; Kimet al., 2016). All the stations in Table S4 used Tekran in-struments, except for the observations in South Korea. Dif-ferent instruments could cause potential differences in theobservation, but they were comparable and did not affectthe conclusion of comparison of the downward trend (Slemret al., 2015; Sprovieri et al., 2016). Weigelt et al. (2015)showed that GEM concentrations decreased from 1.75 in1996 to 1.4 ng m−3 in 2009 at Mace Head, Ireland. The 10-year trends of GEM concentrations at six ground-based sitesin the Arctic and Canada also showed a decreasing trend at arate of 13–35 pg m−3 yr−1 (Cole et al., 2013). In South Ko-rea, the observed GEM concentration also showed a signif-icant decrease in recent years (Kim et al., 2016). In SouthAfrica, annual average GEM concentration at Cape Point de-creased from 1.29 in 1996 to 1.19 ng m−3 in 2004 (Slemr etal., 2008) and increased from 0.93 ng m−3 in 2007 (Slemret al., 2015) until 2016 (Martin et al, 2017). However, lim-ited GEM monitoring sites and relative short -time spans inChina restricted the view of long-term trends in atmosphericHg concentration in this region. A preliminary assessment in-dicated that atmospheric Hg concentrations in China kept in-creasing before 2012 (Fu et al., 2015). The decreasing trendobserved in our study was accordant with reported data atMt. Changbai during 2014–2015 cited in the review of Fuet al. (2015). The atmospheric Hg at Chongming was influ-enced by and in turn reflected regional Hg emission and itscycle. Although the decline in atmospheric Hg was observedat many sites of the Northern Hemisphere, a much sharperdecrease of Hg concentrations was observed at Chongming
in our study. The specific reasons for the Hg concentrationdecrease in our study will be discussed in Sect. 3.4.
3.2 Seasonal variation of GEM concentrations
According to the decomposition result (Fig. 2c), we observeda strong seasonal cycle at Chongming. The GEM concentra-tions were highest in July and lowest in September, so GEMconcentrations in the same month from different years wereaveraged to understand the detrended seasonal circle (Fig. 3).The error bars in the Fig. 3 represent the standard deviation ofthe monthly average. Observed GEM concentrations showedan obvious seasonal cycle. The mean GEM concentration inthe warm season (from April to September) was 0.29 ng m−3
higher than that in the cold season. Such a seasonal varia-tion trend was also observed at Nanjing, Miyun, Mt. Ailao,Mt. Waliguan, and Shangri-La (Zhang et al., 2013, 2016; Fuet al., 2015; Zhu et al., 2012). On the other hand, the GEMconcentrations at Mt. Gongga, Mt. Daimei, Mt. Leigong, andMt. Changbai in China were relatively higher in cold seasons.The average of atmospheric Hg concentrations in the North-ern Hemisphere also had a trough value in summer (Sprovieriet al., 2016).
Seasonal variations of GEM concentration were generallyattributed to the following factors, including natural and an-thropogenic emissions, atmospheric chemical reactions, andair mass transport. The higher Hg concentrations in the coldseason at Mt. Leigong were mainly explained by coal com-bustion for urban and residential heating during the cold sea-son, whereas increasing solar radiation and soil/air tempera-ture dominated the higher Hg concentrations at Mt. Ailao. Inaddition, sites in southern, eastern, and northeastern Chinawere also impacted by anthropogenic emissions of GEMfrom the north and west by the northerly winter monsoon,while the sites located in western, southwestern, and northern
Atmos. Chem. Phys., 18, 8279–8291, 2018 www.atmos-chem-phys.net/18/8279/2018/
Y. Tang et al.: Recent decrease trend of atmospheric mercury concentrations in East China 8285
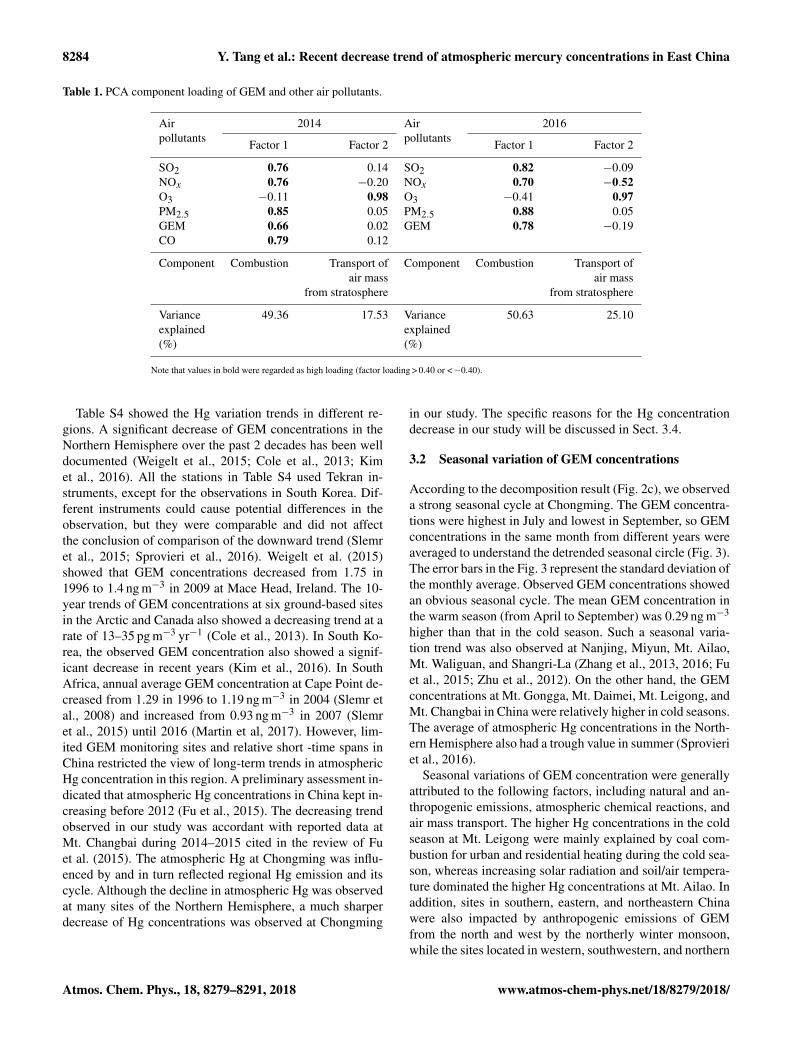
Table 2. Emissions of the main air pollutants in the YRD region in2014.
Emission sectorsAnnual emissions
SO2 NOx PM2.5 GEM(kt) (kt) (kt) (t)
Coal-fired power plants 918.31 991.62 118.42 14.00Coal-fired industrial boilers 311.03 271.94 79.91 9.80Residential coal combustion 68.48 42.11 163.93 0.40Cement clinker production 207.48 371.13 208.02 4.70Iron and steel production 480.97 142.80 169.84 2.30Mobile oil combustion 38.43 1786.74 98.00 1.90Other sectors 348.83 316.28 382.48 2.50
China were impacted in the warm season (Fu et al., 2015). Asat most sites in the Northern Hemisphere, high wet Hg pre-cipitation, probably induced by faster GEM oxidation, led tolower Hg concentrations in summer.
Source emission was a significant factor that affectedGEM concentrations in the air. The GEM concentrations ata remote site were generally regarded under the impact ofregional emissions. Therefore, the emissions in the YRD re-gions (Anhui, Zhejiang, Jiangsu, and Shanghai) were calcu-lated during 2014–2016. However, the anthropogenic emis-sions were in the range of 2.5–2.7 t, which was almost un-changed. Compared to the anthropogenic emissions, we ob-served almost synchronized trends between natural emis-sions and air Hg concentrations in Fig. 4. The natural emis-sions showed a huge seasonal variation, from −5.4 to 8.4 t.The largest natural emissions were observed in summer whenthe highest GEM concentrations were monitored. In the au-tumn, the natural emissions performed as the largest depo-sition direction amount and the GEM concentrations werethe lowest in the whole year. Therefore, natural emissions in-stead of anthropogenic emissions were supposed to be a sig-nificant factor that affected the seasonal cycle of GEM con-centrations (Fig. 4). The seasonal trend of natural emissionswas closely related with the canopy types in YRD areas,where widely subtropical forests, paddy fields, and dry farm-ing were observed (Fig. S2). The high temperature will speedup decomposition of organic compound in soil, which leadsto Hg emissions from farmland and forest in the YRD re-gion in summer (Luo et al., 2016; Yu et al., 2018). In autumnand winter, with the decrease of temperature (Table S2), therole of soil changed from Hg source to sink, which reducedthe Hg concentrations in the air (Wang et al., 2016). At thesame time, the growing vegetation in autumn also absorbedair Hg, resulting in lower Hg concentrations compared tothose in winter. Transport also overall enhanced the observedseasonal variation of GEM concentrations at Chongming Is-land. According to the statistics of backward trajectories inSect. 3.4, the GEM concentrations in the air mass which didnot pass via the YRD regions also showed high GEM con-centration in the warm season in 2014 (Fig. S3).
Figure 4. Seasonal cycle of GEM concentrations, anthropogenicemissions, and natural emissions during 2014–2016. The error barsrepresent the standard deviation of seasonal average. Negative val-ues of natural emissions represent mercury deposition, and positivevalues of natural emissions represent natural emissions.
From Fig. 2, we also observed more pronounced seasonalvariation in 2014, which could be attributed to the lower wetdeposition and GEM oxidation. On the one hand, as a coastalsite, the Chongming Island was abundant with ·OH. The in-crease of O3 concentration from the summer of 2014 to 2016may contribute to a higher oxidation of GEM in 2016. On theother hand, higher wet Hg deposition in summer was approx-imately 6.6 times that in the winter at Chongming (Zhang etal., 2010). Meanwhile, the rainfall in 2016 summer (546 mm)was higher than the rainfall in 2014 (426 mm). Therefore, thehigher oxidation and wet deposition rate of Hg in the summerof 2016 would reduce the concentration difference betweensummer and winter, which led to a less pronounced seasonalvariation in 2016. Meanwhile, the higher oxidation and wetdeposition in 2016 also contributed to the downward trendof GEM by reducing the seasonality in spring and summer(Fig. S3).
3.3 Source apportionment of atmospheric Hg pollution
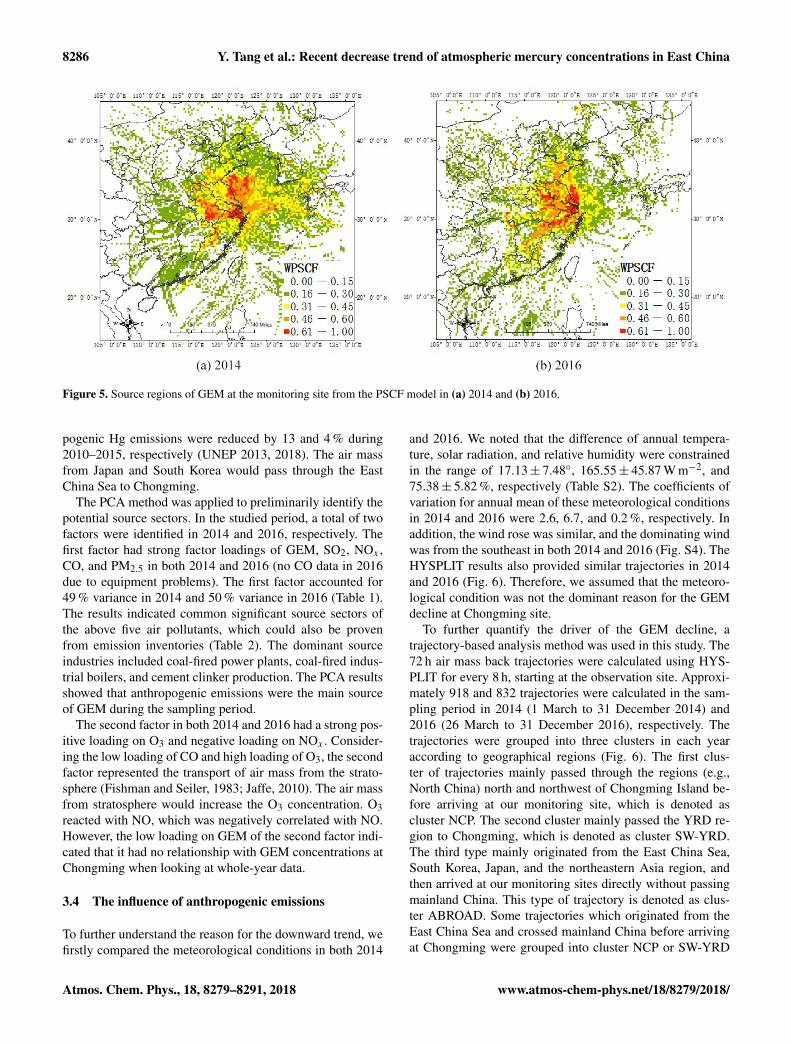
According to the PSCF result, the YRD region, includingShanghai, Jiangsu, Anhui, and Zhejiang provinces, was thedominant source region in both 2014 and 2016 (Fig. 5).Therefore, Hg emissions from these areas would contributeto high proportion of Hg pollution at Chongming Island. Theoffshore area mainly around Jiangsu province also had a highPSCF value because some trajectories from North China, es-pecially Shandong province, transport to Chongming Islandthrough this area. Compared to the result in 2014, the PSCFvalue showed an obvious decline in the East China Sea in2016. The decline from the East China Sea may be causedby the downward trend of GEM concentrations in South Ko-rea and Japan (Kim et al., 2013, 2016), where the anthro-
www.atmos-chem-phys.net/18/8279/2018/ Atmos. Chem. Phys., 18, 8279–8291, 2018
8286 Y. Tang et al.: Recent decrease trend of atmospheric mercury concentrations in East China
Figure 5. Source regions of GEM at the monitoring site from the PSCF model in (a) 2014 and (b) 2016.
pogenic Hg emissions were reduced by 13 and 4 % during2010–2015, respectively (UNEP 2013, 2018). The air massfrom Japan and South Korea would pass through the EastChina Sea to Chongming.
The PCA method was applied to preliminarily identify thepotential source sectors. In the studied period, a total of twofactors were identified in 2014 and 2016, respectively. Thefirst factor had strong factor loadings of GEM, SO2, NOx ,CO, and PM2.5 in both 2014 and 2016 (no CO data in 2016due to equipment problems). The first factor accounted for49 % variance in 2014 and 50 % variance in 2016 (Table 1).The results indicated common significant source sectors ofthe above five air pollutants, which could also be provenfrom emission inventories (Table 2). The dominant sourceindustries included coal-fired power plants, coal-fired indus-trial boilers, and cement clinker production. The PCA resultsshowed that anthropogenic emissions were the main sourceof GEM during the sampling period.
The second factor in both 2014 and 2016 had a strong pos-itive loading on O3 and negative loading on NOx . Consider-ing the low loading of CO and high loading of O3, the secondfactor represented the transport of air mass from the strato-sphere (Fishman and Seiler, 1983; Jaffe, 2010). The air massfrom stratosphere would increase the O3 concentration. O3reacted with NO, which was negatively correlated with NO.However, the low loading on GEM of the second factor indi-cated that it had no relationship with GEM concentrations atChongming when looking at whole-year data.
3.4 The influence of anthropogenic emissions
To further understand the reason for the downward trend, wefirstly compared the meteorological conditions in both 2014
and 2016. We noted that the difference of annual tempera-ture, solar radiation, and relative humidity were constrainedin the range of 17.13± 7.48◦, 165.55± 45.87 W m−2, and75.38± 5.82 %, respectively (Table S2). The coefficients ofvariation for annual mean of these meteorological conditionsin 2014 and 2016 were 2.6, 6.7, and 0.2 %, respectively. Inaddition, the wind rose was similar, and the dominating windwas from the southeast in both 2014 and 2016 (Fig. S4). TheHYSPLIT results also provided similar trajectories in 2014and 2016 (Fig. 6). Therefore, we assumed that the meteoro-logical condition was not the dominant reason for the GEMdecline at Chongming site.
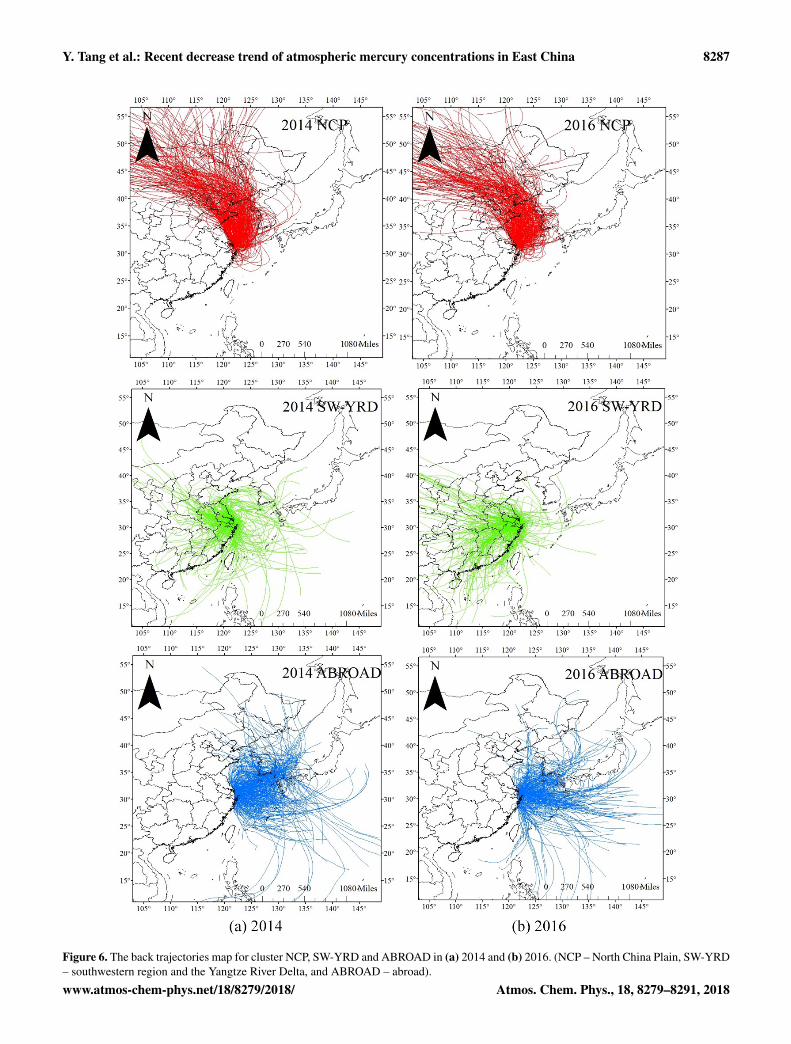
To further quantify the driver of the GEM decline, atrajectory-based analysis method was used in this study. The72 h air mass back trajectories were calculated using HYS-PLIT for every 8 h, starting at the observation site. Approxi-mately 918 and 832 trajectories were calculated in the sam-pling period in 2014 (1 March to 31 December 2014) and2016 (26 March to 31 December 2016), respectively. Thetrajectories were grouped into three clusters in each yearaccording to geographical regions (Fig. 6). The first clus-ter of trajectories mainly passed through the regions (e.g.,North China) north and northwest of Chongming Island be-fore arriving at our monitoring site, which is denoted ascluster NCP. The second cluster mainly passed the YRD re-gion to Chongming, which is denoted as cluster SW-YRD.The third type mainly originated from the East China Sea,South Korea, Japan, and the northeastern Asia region, andthen arrived at our monitoring sites directly without passingmainland China. This type of trajectory is denoted as clus-ter ABROAD. Some trajectories which originated from theEast China Sea and crossed mainland China before arrivingat Chongming were grouped into cluster NCP or SW-YRD
Atmos. Chem. Phys., 18, 8279–8291, 2018 www.atmos-chem-phys.net/18/8279/2018/
Y. Tang et al.: Recent decrease trend of atmospheric mercury concentrations in East China 8287
Figure 6. The back trajectories map for cluster NCP, SW-YRD and ABROAD in (a) 2014 and (b) 2016. (NCP – North China Plain, SW-YRD– southwestern region and the Yangtze River Delta, and ABROAD – abroad).
www.atmos-chem-phys.net/18/8279/2018/ Atmos. Chem. Phys., 18, 8279–8291, 2018
8288 Y. Tang et al.: Recent decrease trend of atmospheric mercury concentrations in East China
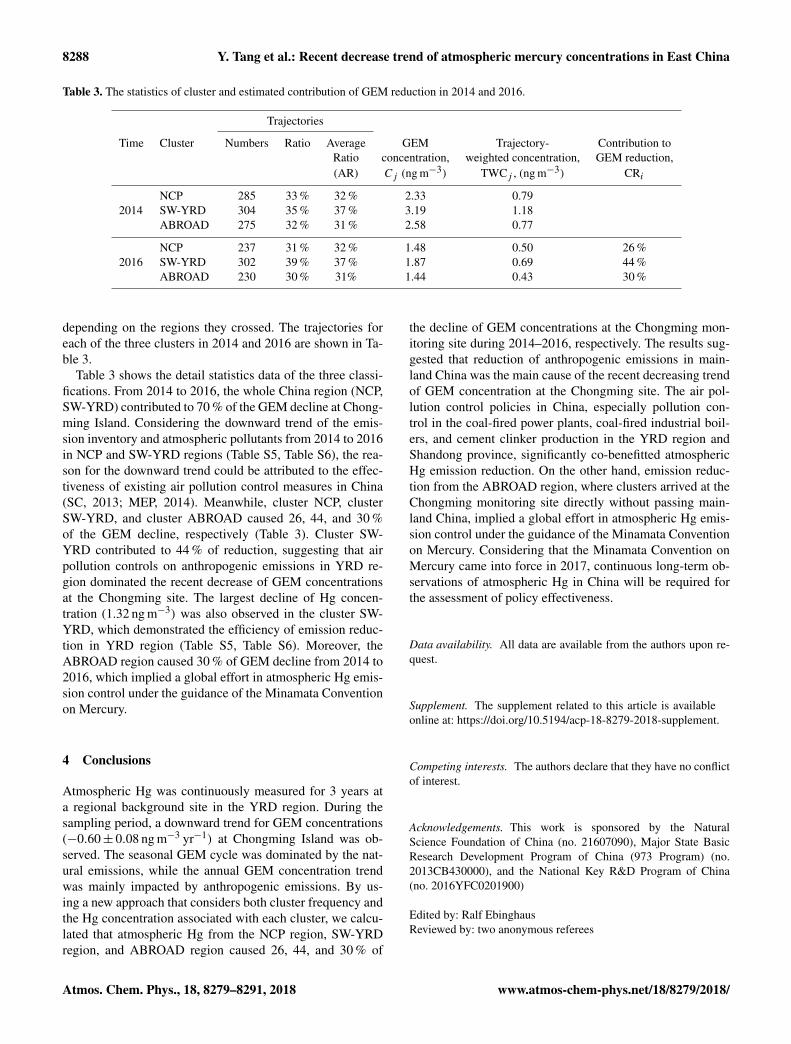
Table 3. The statistics of cluster and estimated contribution of GEM reduction in 2014 and 2016.
Trajectories
Time Cluster Numbers Ratio Average GEM Trajectory- Contribution toRatio concentration, weighted concentration, GEM reduction,(AR) Cj (ng m−3) TWCj , (ng m−3) CRi
NCP 285 33 % 32 % 2.33 0.792014 SW-YRD 304 35 % 37 % 3.19 1.18
ABROAD 275 32 % 31 % 2.58 0.77
NCP 237 31 % 32 % 1.48 0.50 26 %2016 SW-YRD 302 39 % 37 % 1.87 0.69 44 %
ABROAD 230 30 % 31% 1.44 0.43 30 %
depending on the regions they crossed. The trajectories foreach of the three clusters in 2014 and 2016 are shown in Ta-ble 3.
Table 3 shows the detail statistics data of the three classi-fications. From 2014 to 2016, the whole China region (NCP,SW-YRD) contributed to 70 % of the GEM decline at Chong-ming Island. Considering the downward trend of the emis-sion inventory and atmospheric pollutants from 2014 to 2016in NCP and SW-YRD regions (Table S5, Table S6), the rea-son for the downward trend could be attributed to the effec-tiveness of existing air pollution control measures in China(SC, 2013; MEP, 2014). Meanwhile, cluster NCP, clusterSW-YRD, and cluster ABROAD caused 26, 44, and 30 %of the GEM decline, respectively (Table 3). Cluster SW-YRD contributed to 44 % of reduction, suggesting that airpollution controls on anthropogenic emissions in YRD re-gion dominated the recent decrease of GEM concentrationsat the Chongming site. The largest decline of Hg concen-tration (1.32 ng m−3) was also observed in the cluster SW-YRD, which demonstrated the efficiency of emission reduc-tion in YRD region (Table S5, Table S6). Moreover, theABROAD region caused 30 % of GEM decline from 2014 to2016, which implied a global effort in atmospheric Hg emis-sion control under the guidance of the Minamata Conventionon Mercury.
4 Conclusions
Atmospheric Hg was continuously measured for 3 years ata regional background site in the YRD region. During thesampling period, a downward trend for GEM concentrations(−0.60± 0.08 ng m−3 yr−1) at Chongming Island was ob-served. The seasonal GEM cycle was dominated by the nat-ural emissions, while the annual GEM concentration trendwas mainly impacted by anthropogenic emissions. By us-ing a new approach that considers both cluster frequency andthe Hg concentration associated with each cluster, we calcu-lated that atmospheric Hg from the NCP region, SW-YRDregion, and ABROAD region caused 26, 44, and 30 % of
the decline of GEM concentrations at the Chongming mon-itoring site during 2014–2016, respectively. The results sug-gested that reduction of anthropogenic emissions in main-land China was the main cause of the recent decreasing trendof GEM concentration at the Chongming site. The air pol-lution control policies in China, especially pollution con-trol in the coal-fired power plants, coal-fired industrial boil-ers, and cement clinker production in the YRD region andShandong province, significantly co-benefitted atmosphericHg emission reduction. On the other hand, emission reduc-tion from the ABROAD region, where clusters arrived at theChongming monitoring site directly without passing main-land China, implied a global effort in atmospheric Hg emis-sion control under the guidance of the Minamata Conventionon Mercury. Considering that the Minamata Convention onMercury came into force in 2017, continuous long-term ob-servations of atmospheric Hg in China will be required forthe assessment of policy effectiveness.
Data availability. All data are available from the authors upon re-quest.
Supplement. The supplement related to this article is availableonline at: https://doi.org/10.5194/acp-18-8279-2018-supplement.
Competing interests. The authors declare that they have no conflictof interest.
Acknowledgements. This work is sponsored by the NaturalScience Foundation of China (no. 21607090), Major State BasicResearch Development Program of China (973 Program) (no.2013CB430000), and the National Key R&D Program of China(no. 2016YFC0201900)
Edited by: Ralf EbinghausReviewed by: two anonymous referees
Atmos. Chem. Phys., 18, 8279–8291, 2018 www.atmos-chem-phys.net/18/8279/2018/
Y. Tang et al.: Recent decrease trend of atmospheric mercury concentrations in East China 8289
References
Arctic Monitoring and Assessment Programme and United Na-tions Environment Programme (AMAP/UNEP): Global Hg as-sessment 2013: sources, emissions, releases and environmentaltransport, AMAP/UNEP, Geneva, Switzerland, 2013.
Arctic Monitoring and Assessment Programme and United Na-tions Environment Programme (AMAP/UNEP): Global mer-cury assessment 2018 – draft technical background document,AMAP/UNEP, Geneva, Switzerland, 2018.
Chen, L., Zhang, W., Zhang, Y., Tong, Y., Liu, M., Wang, H., Xie,H., and Wang, X.: Historical and future trends in global source-receptor relationships of mercury, Sci. Total Environ., 610–611,24–31, 2018.
Cole, A. S., Steffen, A., Pfaffhuber, K. A., Berg, T., Pilote, M.,Poissant, L., Tordon, R., and Hung, H.: Ten-year trends of atmo-spheric mercury in the high Arctic compared to Canadian sub-Arctic and mid-latitude sites, Atmos. Chem. Phys., 13, 1535–1545, https://doi.org/10.5194/acp-13-1535-2013, 2013.
Draxler, R. R.: Trajectory Optimization for Balloon Flight Planning,Int. J. Numer. Meth. Fl., 5, 13–23, 1996.
Draxler, R. R. and Hess, G. D.: An overview of the hysplit-4 mod-eling system for trajectories, Aust. Meteorol. Mag., 47, 295–308,1998.
Fishman, J. and Seiler, W.: Correlative Nature of Ozone and CarbonMonoxide in the Troposphere: Implications for the TroposphericOzone Budget, J. Geophys. Res., 88, 3662–3670, 1983.
Fu, X. W., Feng, X. B, Zhu, W. Z., Wang, S. F., and Lu, J. L.: To-tal gaseous mercury concentrations in ambient air in the easternslope of Mt. Gongga, South-Eastern fringe of the Tibetan plateau,China, Atmos. Environ., 42, 970–979, 2008a.
Fu, X. W., Feng, X. B., Zhu, W. Z., Zheng, W., Wang, S. F., and Lu,J. Y.: Total particulate and reactive gaseous mercury in ambientair on the eastern slope of the Mt. Gongga area, China, Appl.Geochem., 23, 408–418, 2008b.
Fu, X. W., Feng, X. B., Wang, S., Rothenberg, S., Shang, L., Li, Z.,and Qiu, G.: Temporal and spatial distributions of total gaseousmercury concentrations in ambient air in a mountainous areain southwestern China: implications for industrial and domesticmercury emissions in remote areas in China, Sci. Total Environ.,407, 2306–2314, 2009.
Fu, X. W., Feng, X. B., Qiu, G. L., Shang, L. H., and Zhang, H.: Spe-ciated atmospheric mercury and its potential source in Guiyang,China, Atmos. Environ., 45, 4205–4212, 2011.
Fu, X. W., Zhang, H., Yu, B., Wang, X., Lin, C.-J., andFeng, X. B.: Observations of atmospheric mercury in China:a critical review, Atmos. Chem. Phys., 15, 9455–9476,https://doi.org/10.5194/acp-15-9455-2015, 2015.
Hong, Q., Xie, Z., Liu, C., Wang, F., Xie, P., Kang, H., Xu, J.,Wang, J., Wu, F., He, P., Mou, F., Fan, S., Dong, Y., Zhan, H.,Yu, X., Chi, X., and Liu, J.: Speciated atmospheric mercury onhaze and non-haze days in an inland city in China, Atmos. Chem.Phys., 16, 13807–13821, https://doi.org/10.5194/acp-16-13807-2016, 2016.
Hui, M. L., Wu, Q. R., Wang, S. X., Liang, S., Zhang, L., Wang, F.Y., Lenzen, M., Wang, Y. F., Xu, L. X., Lin, Z. T., Yang, H., Lin,Y., Larssen, T., Xu, M., and Hao, J. M.: Mercury flows in Chinaand global drivers, Environ. Sci. Technol., 51, 222–231, 2017.
Jaffe, D.: Relationship betwen surface and free tropospheric ozonein the western U.S., Environ. Sci. Technol., 45, 432–438, 2010.
Kim, K.-H., Yoon, H.-O., Brown, R. J. C., Jeon, E.-C., Sohn, J.-R., Jung, K., Park, C.-G., and Kim, I.-S.: Simultaneous monitor-ing of total gaseous mercury at four urban monitoring stations inSeoul, Korea, Atmos. Res., 132–133, 199–208, 2013.
Kim, K. H., Brown, R. J. C., Kwon, E., Kim, I. S., and Sohn, J. R.:Atmospheric mercury at an urban station in Korea across threedecades, Atmos. Environ., 131, 124–132, 2016.
Landis, M. S., Stevens, R. K., Schaedlich, F., and Prestbo, E.M.: Development and characterization of an annular denudermethodology for the measurement of divalent inorganic reac-tive gaseous mercury in ambient air, Environ. Sci. Technol., 36,3000–3009, 2002.
Li, S., Gao, W., Wang, S. X., Zhang, L., Li, Z. J., Wang, L., andHao, J. M.: Characteristics of Speciated Atmospheric Mercuryin Chongming Island, Shanghai, Environ. Sci., 37, 3290–3299,2016.
Lin, C. J., Pongprueksa, P., Lindberg, S. E., Pehkonen, S. O., Byun,D., and Jang, C.: Scientific uncertainties in atmospheric mercurymodels I: Model science evaluation, Atmos. Environ., 40, 2911–2928, 2006.
Lindberg, S., Bullock, R., Ebinghaus, R., Engstrom, D., Feng, X.B., Fitzgerald, W., Pirrone, N., Prestbo, E., and Seigneur, C.: Asynthesis of progress and uncertainties in attributing the sourcesof mercury in deposition, Ambio, 36, 19–33, 2007.
Luo, Y., Duan, L., Driscoll, C. T., Xu, G., Shao, M., Taylor, M.,Wang, S. X, and Hao, J. M.: Foliage/atmosphere exchange ofmercury in a subtropical coniferous forest in south China, J. Geo-phys. Res.-Biogeo., 121, 2006–2016, 2016.
Martin, L. G., Labuschagne, C., Brunke, E.-G., Weigelt, A., Ebing-haus, R., and Slemr, F.: Trend of atmospheric mercury con-centrations at Cape Point for 1995–2004 and since 2007, At-mos. Chem. Phys., 17, 2393–2399, https://doi.org/10.5194/acp-17-2393-2017, 2017.
Mason, R. P., Reinfelder, J. R., and Morel, F. M. M.: Bioaccu-mulation of mercury and methylmercury, Springer, Netherlands,1995.
Ministry of Environmental Protection (MEP) and State Adminis-tration for Quality Supervision and Inspection and Quarantine(AQSIQ): Emission standard of air pollutants for boilers, MEP,Beijing, China, 2014.
Pacyna, J. M., Travnikov, O., De Simone, F., Hedgecock, I.M., Sundseth, K., Pacyna, E. G., Steenhuisen, F., Pirrone, N.,Munthe, J., and Kindbom, K.: Current and future levels of mer-cury atmospheric pollution on a global scale, Atmos. Chem.Phys., 16, 12495–12511, https://doi.org/10.5194/acp-16-12495-2016, 2016.
Pirrone, N., Keeler, G. J., and Nriagu, J. O.: Regional differencesin worldwide emissions of mercury to the atmosphere, Atmos.Environ., 30, 2981–2987, 1996.
Polissar, A. V., Hopke, P. K., Paatero, P., Kaufmann, Y. J., Hall, D.K., Bodhaine, B. A., Dutton, E. G., and Harris, J. M.: The aerosolat Barrow, Alaska: long-term trends and source locations, Atmos.Environ., 33, 2441–2458, 1999.
Schroeder, W. H. and Munthe, J.: Atmospheric mercury – Anoverview, Atmos. Environ., 32, 809–822, 1998.
Slemr, F., Brunke, E. G., Labuschagne, C., and Ebinghaus, R.: Totalgaseous mercury concentrations at the Cape Point GAW stationand their seasonality, Geophys. Res. Lett., 35, 213–226, 2008.
www.atmos-chem-phys.net/18/8279/2018/ Atmos. Chem. Phys., 18, 8279–8291, 2018
8290 Y. Tang et al.: Recent decrease trend of atmospheric mercury concentrations in East China
Slemr, F., Angot, H., Dommergue, A., Magand, O., Barret, M.,Weigelt, A., Ebinghaus, R., Brunke, E.-G., Pfaffhuber, K. A., Ed-wards, G., Howard, D., Powell, J., Keywood, M., and Wang, F.:Comparison of mercury concentrations measured at several sitesin the Southern Hemisphere, Atmos. Chem. Phys., 15, 3125–3133, https://doi.org/10.5194/acp-15-3125-2015, 2015.
Sprovieri, F., Pirrone, N., Ebinghaus, R., Kock, H., andDommergue, A.: A review of worldwide atmospheric mer-cury measurements, Atmos. Chem. Phys., 10, 8245–8265,https://doi.org/10.5194/acp-10-8245-2010, 2010.
Sprovieri, F., Pirrone, N., Bencardino, M., D’Amore, F., Car-bone, F., Cinnirella, S., Mannarino, V., Landis, M., Ebinghaus,R., Weigelt, A., Brunke, E.-G., Labuschagne, C., Martin, L.,Munthe, J., Wängberg, I., Artaxo, P., Morais, F., Barbosa, H.D. M. J., Brito, J., Cairns, W., Barbante, C., Diéguez, M. D.C., Garcia, P. E., Dommergue, A., Angot, H., Magand, O.,Skov, H., Horvat, M., Kotnik, J., Read, K. A., Neves, L. M.,Gawlik, B. M., Sena, F., Mashyanov, N., Obolkin, V., Wip,D., Feng, X. B., Zhang, H., Fu, X., Ramachandran, R., Cossa,D., Knoery, J., Marusczak, N., Nerentorp, M., and Norstrom,C.: Atmospheric mercury concentrations observed at ground-based monitoring sites globally distributed in the framework ofthe GMOS network, Atmos. Chem. Phys., 16, 11915–11935,https://doi.org/10.5194/acp-16-11915-2016, 2016.
Sprovieri, F., Pirrone, N., Bencardino, M., D’Amore, F., Angot,H., Barbante, C., Brunke, E.-G., Arcega-Cabrera, F., Cairns, W.,Comero, S., Diéguez, M. D. C., Dommergue, A., Ebinghaus, R.,Feng, X. B., Fu, X., Garcia, P. E., Gawlik, B. M., Hageström,U., Hansson, K., Horvat, M., Kotnik, J., Labuschagne, C., Ma-gand, O., Martin, L., Mashyanov, N., Mkololo, T., Munthe, J.,Obolkin, V., Ramirez Islas, M., Sena, F., Somerset, V., Spandow,P., Vardè, M., Walters, C., Wängberg, I., Weigelt, A., Yang, X.,and Zhang, H.: Five-year records of mercury wet deposition fluxat GMOS sites in the Northern and Southern hemispheres, At-mos. Chem. Phys., 17, 2689–2708, https://doi.org/10.5194/acp-17-2689-2017, 2017.
State Council of the People’s Republic of China (SC): Action planof national air pollution prevention and control, SC, Beijing,China, 2013.
Steffen, A., Scherz, T., Olson, M., Gay, D., and Blanchard, P.: Acomparison of data quality control protocols for atmosphericmercury speciation measurements, J. Environ. Monit., 14, 752–765, 2012.
Streets, D. G., Devane, M. K., Lu, Z., Bond, T. C., Sunderland, E.M., and Jacob, D. J.: All-Time releases of mercury to the atmo-sphere from human activities, Environ. Sci. Technol., 45, 10485–10491, 2011.
Sung, J.-H., Roy, D., Oh, J.-S., Back, S.-K., Jang, H.-N., Kim, S.-H., Seo, Y.-C., Kim, J.-H., Lee, C. B., and Han, Y.-J.: Trans-boundary movement of mercury in the Northeast Asian regionpredicted by CAMQ-Hg from anthropogenic emissions distribu-tion, Atmos. Res., 203, 197–206, 2018.
Wang, X., Lin, C.-J., Yuan, W., Sommar, J., Zhu, W., and Feng, X.:Emission-dominated gas exchange of elemental mercury vaporover natural surfaces in China, Atmos. Chem. Phys., 16, 11125–11143, https://doi.org/10.5194/acp-16-11125-2016, 2016.
Wang, Y. Q., Zhang, X. Y., and Draxler, R. R.: TrajStat: GIS-basedsoftware that uses various trajectory statistical analysis methodsto identify potential sources from long-term air pollution mea-
surement data, Elsevier Science Publishers B. V., New York,938–939, 2009.
Weigelt, A., Ebinghaus, R., Manning, A. J., Derwent, R. G., Sim-monds, P. G., Spain, T. G., Jennings, S. G., and Slemr, F.: Anal-ysis and interpretation of 18 years of mercury observations since1996 at Mace Head, Ireland, Atmos. Environ., 100, 85–93, 2015.
Wu, Q., Wang, S., Li, G., Liang, S., Lin, C. J., Wang, Y., Cai, S.,Liu, K., and Hao, J.: Temporal trend and spatial distribution ofspeciated atmospheric mercury emissions in China during 1978–2014, Environ. Sci. Technol., 50, 13428–13435, 2016.
Xu, X. and Akhtar, U. S.: Identification of potential regionalsources of atmospheric total gaseous mercury in Windsor,Ontario, Canada using hybrid receptor modeling, Atmos.Chem. Phys., 10, 7073–7083, https://doi.org/10.5194/acp-10-7073-2010, 2010.
Yu, Q., Luo, Y., Wang, S., Wang, Z., Hao, J., and Duan, L.: Gaseouselemental mercury (GEM) fluxes over canopy of two typical sub-tropical forests in south China, Atmos. Chem. Phys., 18, 495–509, https://doi.org/10.5194/acp-18-495-2018, 2018.
Zhang, G. Y., Zhou, L. M., Zheng, X. M., and Huang, W. D.: Tem-poral distribution and potential hazards of wet depostion mercuryin Yangtze River Estuary, Urban Environmental & Urban Ecol-ogy, 1–4, 2010.
Zhang, H., Fu, X. W., Lin, C.-J., Wang, X., and Feng, X. B.: Obser-vation and analysis of speciated atmospheric mercury in Shangri-La, Tibetan Plateau, China, Atmos. Chem. Phys., 15, 653–665,https://doi.org/10.5194/acp-15-653-2015, 2015.
Zhang, H., Fu, X., Lin, C.-J., Shang, L., Zhang, Y., Feng, X.,and Lin, C.: Monsoon-facilitated characteristics and transportof atmospheric mercury at a high-altitude background site insouthwestern China, Atmos. Chem. Phys., 16, 13131–13148,https://doi.org/10.5194/acp-16-13131-2016, 2016.
Zhang, L., Wang, S. X., Wang, L., and Hao, J. M.: At-mospheric mercury concentration and chemical speciationat a rural site in Beijing, China: implications of mercuryemission sources, Atmos. Chem. Phys., 13, 10505–10516,https://doi.org/10.5194/acp-13-10505-2013, 2013.
Zhang, L., Wang, S. X., Wang, L., Wu, Y., Duan, L., Wu, Q. R.,Wang, F. Y., Yang, M., Yang, H., Hao, J. M., and Liu, X.: Up-dated emission inventories for speciated atmospheric mercuryfrom anthropogenic sources in China, Environ. Sci. Technol., 49,3185–3194, 2015.
Zhang, L. M., Wright, L. P., and Blanchard, P.: A review of currentknowledge concerning dry deposition of atmospheric mercury,Atmos. Environ., 43, 5853–5864, 2009.
Zhang, Y. X., Jacob, D. J., Horowitz, H. M., Chen, L., Amos, H. M.,Krabbenhoft, D. P., Slemr, F., St Louis, V. L., and Sunderland,E. M.: Observed decrease in atmospheric mercury explained byglobal decline in anthropogenic emissions, Proc. Nat. Acad. Sci.USA, 113, 526–231, 2016.
Zhao, B., Wang, S. X., Liu, H., Xu, J. Y., Fu, K., Klimont, Z.,Hao, J. M., He, K. B., Cofala, J., and Amann, M.: NOx emis-sions in China: historical trends and future perspectives, At-mos. Chem. Phys., 13, 9869–9897, https://doi.org/10.5194/acp-13-9869-2013, 2013.
Atmos. Chem. Phys., 18, 8279–8291, 2018 www.atmos-chem-phys.net/18/8279/2018/
Y. Tang et al.: Recent decrease trend of atmospheric mercury concentrations in East China 8291
Zhu, J., Wang, T., Talbot, R., Mao, H., Hall, C. B., Yang, X., Fu,C., Zhuang, B., Li, S., Han, Y., and Huang, X.: Characteris-tics of atmospheric Total Gaseous Mercury (TGM) observed inurban Nanjing, China, Atmos. Chem. Phys., 12, 12103–12118,https://doi.org/10.5194/acp-12-12103-2012, 2012.
www.atmos-chem-phys.net/18/8279/2018/ Atmos. Chem. Phys., 18, 8279–8291, 2018