Embed Size (px)
Citation preview
ACTA GEOLOGICA HISPANICA, v. 27 (1992). nv-4, pags. 13-32
Recent advances in the understanding of mid-ocean ridge tectonics and volcanism using swath-mapping tools
K.C. MACDONALD('), D.S. SCHEIRER('), S. CARBOTTE(') and P.J. FOX(2)
(1) Department of Geological Sciences and Marine Sciences 1nstitute.University of California. Santa Barbara, CA 03106, USA.
(2) Graduate School of Oceanography. University of Rhode Island. Narragansett, RI 02882, USA.
ABSTRACT RESUMEN
New swath mapping sonar systems have revealed the structure of the mid-ocean ridge (MOR) and sunounding deep ocean floor with unprecedent clarity. These images show that the MOR is partitioned into segments by a variety of offsets such as transform faults, overlap- ping spreading centers and very fine scale discontinuities which are barely detectable. The smallest scale segments are the fundamental building blocks for creation of new oceanic crust. They are only 2-20 km long and are active, distinct units for only =100-10,000 years. At fast spreading centers, the axial neovolcanic zone is a persistent 300- 400 m high elevation produced by the bouyancy of hot rock and mag- ma; it is not a volcanic construction (most of the time and in most pla- c e ~ ) so there is almost no vestige of it off-axis. Along ~ 6 0 % of its length, the spreading center is characterized by an axial summit calde- ra produced by volcanic inflation and collapse. The size and shape of the axial high are very sensitive indicators of a relatively steady and robust magma supply at fast-spreading ndges, and have been used successfuliy to predict the location of magma chambers and to fore- cast recent volcanic emptions including one witnessed from ALVIN in March-Apnl 1991. At intermediate spreading rates, the axial region cools sufficiently for a volcanic constructional edifice to develop epi- sodically and for normal faulting to occur along an axial graben. Un- der these conditions axial volcanoes are split in two by the axial gra- ben and rernnants can be found on the flanks of spreading centers. At slow-spreading ridges, the magma budget is relatively starved as indi- cated by a persistent axial nft valley and a highly discontinuous neo- volcanic zone, and strong asymmetry in profiles along and across the strike of the ridge.
En la década de los 60 se produjeron tres avances significativos en el estudio morfológico de los fondos oceánicos: ecosondas de haz estrecho inmergidas cerca del fondo, sonar de barrido lateral y bati- metría de barrido de multihaz. Los sistemas de multihaz han sido los últimos puestos a disposición de la comunidad oceanográfica civil, ya avanzada la década de los 70. No obstante, aún hoy la mayona de da- tos de multihaz de la U.S. Navy están clasificados, y sólo media doce- na de buques oceanográficos en el mundo proporcionan libremente datos de multihaz. La importancia de los sistemas de multihaz radica en que permiten medir y cartografiar la morfología del lecho marino con una cobertura espacial completa y una resolución relativamente alta. Las particulares condiciones ambientales en los grandes fondos y, especialmente, en las dorsales medio-oceánicas hacen que los ma- pas resultantes devengan directamente mapas estructurales, tectónicos y volcánicos, conviertiéndose en elementos imprescindibles para geó- logos y geofísicos.
Los mapas batimétricos de multihaz muestran que la dorsal me- dio-oceánica (DOMO) está desplazada y dividida en segmentos por diversas discontinuidades, como las fallas transformantes, los centros de expansión solapantes y otras discontinuidades de escala mucho menor y más difíciles de detectar. Los distintos tipos de discontinui- dades y los segmentos de dorsal que delimitan han sido clasificados jerárquicamente en órdenes de magnitud que van del 1 al 4. Los seg- mentos de primer orden están limitados por fallas transforrnantes que permanecen durante millones de años, determinando desplazamientos laterales de decenas a centenares de kilómetros que oponen tramos de dorsal cuya diferencia de edad oscila entre uno y varias decenas de millones de años.
Las discontinuidades de segundo y tercer orden no son estables durante periodos de tiempo largos, y oponen tramos de dorsal separa-
Key words: Swath mapping. Mid-ocean ndge. Spreading rate. Seg- dos por menos de un millón de años de edad, y desplazados a lo sumo ment. Volcanism. Discontinuity. Axial high. Neovolcanic zone. unas pocas decenas de kilómetros. Existe aún un cuarto orden de seg-
mentación superpuesto a los anteriores, que determina la aparición de formas arcuadas de longitud de onda quilométrica a lo largo del eje de la dorsal.
La integración de datos morfológicos, estmcturales, sísmicos y geoquímicos ha llevado a la confección de un modelo de aporte de magma en el que la génesis, el transporte y la distribución de la mez- cla fundida procedente del manto superior están reforzadas debajo de la región central, sornera e hinchada, de cada segmento y debilitadas en los extremos, cerca de las discontinuidades axiales.
Los segmentos de menor orden constitiuyen las unidades elemen- tales en la formación de nueva corteza oceánica. Sólo miden entre 2 y 20 km de longitud y sólo persisten, como elementos activos, entre 100 y 10.000 años.
La naturaleza, las características y la evolución de los segmentos varía, no obstante, según la tasa de expansión, desde las dorsales rápi- das, como la Dorsal del Pacífico Este, hasia las dorsales lentas, como la Dorsal Atlántica, pasando por las intermedias. En los centros de ex- pansión rápidos, la zona neovolcánica axjal está constituida por una elevación persistente, de 300 a 400 m de :altura, debida a la flotabili- dad de la roca sobrecalentada y del magma. Dicha elevación, cuyas dimensiones y fomia indican un aporte sostenido de magma, no es en la mayoría de los casos una auténtica construcción volcánica sino una tumefacción que desaparece cuando, como consecuencia de la separa- ción entre placas, aumenta la distancia al eje de la dorsal. Aproxima- damente a lo largo del 60% de su longitud, el eje de expansión está caracterizado por tina caldera somital axial, de no más de 500 m de anchura, producid8 por la propia intumescencia volcánica y el subsi- guiente colapso. Las características moifométricas de la elevación axial han sido empleadas con éxito en la localización de cámaras magmáticas, y en La predicción y comprobación de erupciones volcá- nicas, como las verificadas en varias inniersiones de los sumergibles ALVIN y CYANA en la Dorsal del Pacífico Este desde 1984 hasta la actualidad. Las predicciones basadas en criterios morfométncos han sido, por otra parte, corroboradas por ciiterios sísmicos obtenidos a partir de la detección del reflector corre:jpondiente al techo de la cá- mara magmática.
En las dorsales con una tasa de expansión intermedia, el aprecia- ble enfriamiento de la región axial y el niayor grosor de la litosfera de edad cero, permiten el desarrollo episódico y el mantenimiento de au- ténticos edificios volcánicos constructi~ros, y la ocurrencia de fallas normales a lo largo de un graben axial. La continuación de la expan- sión conlleva la partición de los volcanes y el alejamiento progresivo de las mitades re!;ultantes preservadas eii los flancos de la dorsal.
En contraste con las dorsales rápidas e intermedias, las dorsales intermedias subalimentadas y las dorsales lentas están caracterizadas por un valle de rift y una zona axial neovolcánica marcadamente dis- contínua, que son consecuencia de un ,aporte muy escaso de magma. Los volcanes, formados enteramente pior coladas de lava, tienen for- mas cónicas y son de pequeño tamaño, levantándose en promedio 60 m sobre los fondos adyacentes.
De lo antepuesto se desprende que las diferencias morfológicas en los ejes de !las dorsales están directamente relacionadas con los aportes locales de magma y que, en la:$ dorsales rápidas, la estructura detallada de la cialdera somital axial está relacionada directamente con la historia eruptiva reciente.
Palabras clave: Cartografía de barrido. Dorsal medio-oceánica. Tasa de expansión. Segmento. Volcanismo. Discontinuidad. Elevación axial. Zona neovolcánica.
SOUNDING THE DEEP OCEAS FLOOR
Great strides have been made in revealing the shape and structure of the ocean floor (Fig. 1). The original soundings of the deep ocean floor were made with hemp ropes in the 1800's and later with wire ropes. With teams of men grunting away at windlasses, a sin- gle sounding could take a full day. A major advance was made in the late 1920's with the development of the echo-sounder, a device which emits a burst of sound and measures how long it takes the ping to echo off the seafloor. With this new instrument and a graphic recorder, continuous profiles with a sounding every 10- 30 seconds were produced. This system has been used routinely on oceanographic vessels for the last forty-fi- ve years. One drawback is that the 60" wide acoustic pulses spread as they travel downward through the oce- an, much like the beam of a flashlight, so that the retur- ned sound energy echoes off a very broad region of the seafloor, as large as 3-5 km2. The resulting depth profi- le is a very noisy and smoothed representation of the seafloor shape.
Three major advances were made in the 1960's. To achieve better accuracy, echo sounders were developed which had narrower beams and were towed close to the seafloor (Spiess and Tyce, 1973). At only 50 m above the seafloor, the "footprint" of the echo sounder was re- duced to 10 m2, so that a very precise profile of the sea- floor could be produced. A limitation was the ship speed, which was reduced to only 3 km/hr. Only small areas (< severa1 hundred square kilometers) thought to be diagnostic of important relationships in processes have been mapped in this way. Side scan sonar was develo- ped in which the amplitude of the echoes sound was re- corded as a function of time. The strength of the echo is a measure of bottom roughness (backscatter) and slope. The images resemble slightly fuzzy black and white photographs and depending on the depth at which they are towed, create acoustic images with swath widths that range from a few hundred meters to 60 km. In ge- neral, there is a trade off between the width of the side scan swath and resolution (Davis et al., 1986). Used in an interferometric mode, side scan sonars such as Sea- MARC 11 can also be used to measure depths in addi- tion to backscatter.
The third advance and the most critica1 in terms of mapping large areas of the seafloor with high resolu- tion, was the development of the multi-beam echo sounder which produces an array of 16-120 beams which are very narrow (1-3"). The array of beams en- sonifies a wide "swath" beneath the ship, 60-30096 of the water depth or 1.5-15 km wide for deep water work. Resolution varies from approximately 5 m for near-vertical beams to 4 0 m for echoes 60" from ver- tical for water depths of 2-6 km (Renard et al., 1991).
Figure 1.- The fast-spreading East Pacific Rise 8ON-18"N. Shaded relief image view toward NE. White boxes show locations of images in Fig. 4 (foreground) and Fig. 7 (see Fig. 4 for color depth scale). The image is 1100 km long by about 350 km wide. The EPR is the elevated N-S trending region in the red-yellow depth range. The Siqueiros transform is in the foreground followed by the 9ON overlapping spre- ading centers, the Clipperton transform, the 1 1°54N OSC and the Orozco transform in the background (image produced at UCSB by S.P. Milier based on data from Macdonald et al., 1992).
Figura 1.- Dorsal rápida del Pacíñco Este entre 8"N y 18'N, en una imagen en relieve vista hacia el NE. Los recuadros blancos muestran la posición de las imágenes de la Fig. 4 (en primer término, recuadro grande) y de la Fig. 7 (en segundo término, recuadro pequeño). Véase la escala de profundidades en color en la Fig. 4. La imagen cubre 1.100 km de largo por unos 350 km de ancho. La DOPE es la región elevada de dirección N-S en el rango de colores rojo y amarillo. A la falia transfonnante de Siqueiros, en primer témino, le siguen los centros de expansión solapantes de 9'N, la falla transformante de Clip- perton, el C m de 1 1°45N y la falia transfonnante de Orozco, en último témino (imagen obtenida en la Universidad de Caiüornia-Santa Bárbara por S.P. Miiier a partir de datos de Macdonald et al., 1992).
The importance of multibeam sysiems is that seafloor shape can be measured with complete spatial coverage while retaining relatively high resoliition. No longer must we engage in the artful guesswork of drawing contours connecting points of equal depth, uiterpolating over tens of kilometers (sele Davis et al., 1986; Tyce, 1987, for mo- re complete and detailed reviews and references on sea- floor mapping systems). Unfortun;ritely, multibeam sys- tems did not beriefit the oceanographic cornmunity until the late 1970's, nearly 15 years after their inception, be- cause multibeam maps were cloaked in the secrecy of the U.S. Navy. Even with the demise of the Soviet Union, most of the U.S. Navy multibeam data is still classified; only data from 'half a dozen civilian and academic ships is generally avaiilable to scientists and the public.
High quality topographic maps of many continental regions have been available for some time, so why are we so excited about high resolution continuous coverage charts of the ocean floor? In continental regions, erosion caused by flowing water and ice, as well as wind, scours and shapes the landscape, maskirig and muting the long and complex irifluence of tectonic:~ and volcanism on to- pography. As vvith the surface of Venus (Head and Saun- ders, 1991), thr, relative lack of erosion on the deep ocean floor, and its relative simple hisf.ory, means that a high resolution bathymetric chart can be translated directly in- to a map of structure, tectonics, and volcanism. This tool is particularly ipowerful in mid-ocean ridge regions which are relatively free of sedirnent burial, and are the birth- place of ~ 6 0 % of the earth's crust and lithosphere.
There are many examples of the powers of bathyme- tric interpretation in understanding fundamental geoiogic processes. On a global scale, for exarnple, Sclater et al. (1971) showed that the depth of the seafloor increases as the square root of its age. This observation showed that the oceanic lithosphere is reasonably approximated by a conductively cooling plate approximately 75 km thick. This observation was also used to predict seafloor age where magnetic anomalies were not interpretable and to locate fossil and jumped spreading centers. We will focus on three exarnples in which high resolution swath bathy- metric maps have helped marine geologists and geophysi- cists to study the processes operating at mid-ocean ridges.
SEGMENTATION OF THE MID-OCEAN RIDGE
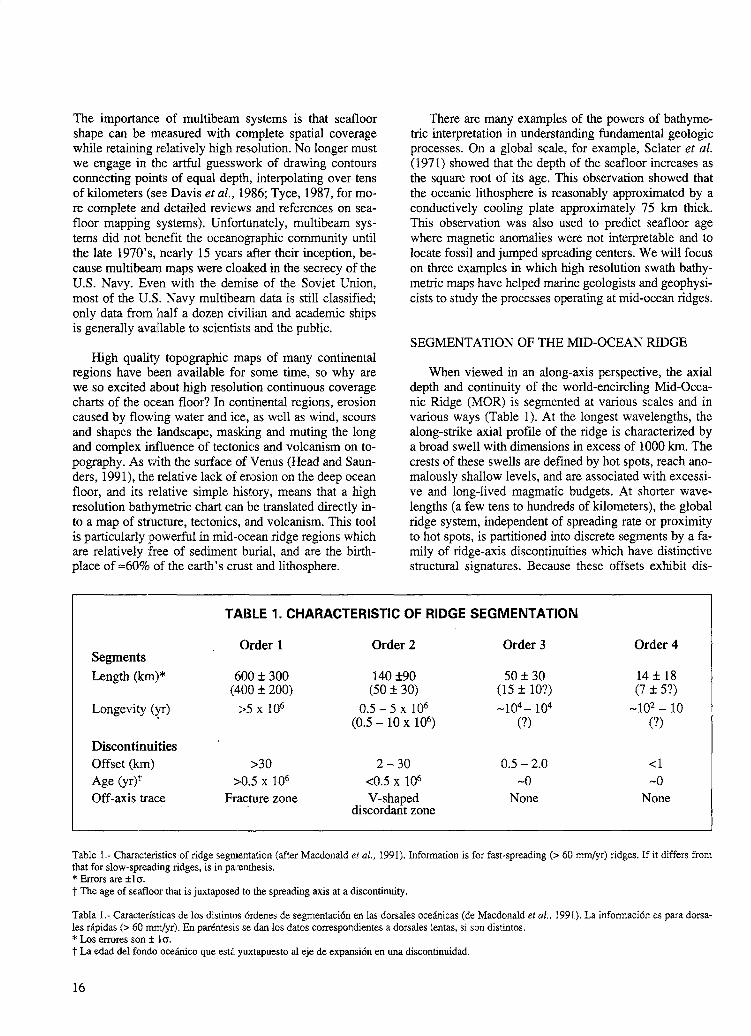
When viewed in an along-axis perspective, the axial depth and continuity of the world-encircling Mid-Ocea- nic Ridge (MOR) is segmented at various scales and in various ways (Table 1). At the longest wavelengths, the along-strike axial profile of the ridge is characterized by a broad swell with dimensions in excess of 1000 km. The crests of these swells are defined by hot spots, reach ano- malously shallow levels, and are associated with excessi- ve and long-lived magmatic budgets. At shorter wave- lengths (a few tens to hundreds of kilometers), the global ridge system, independent of spreading rate or proximity to hot spots, is partitioned into discrete segments by a fa- mily of ridge-axis discontinuities which have distinctive smctural signatures. Because these offsets exhibit dis-
I TABLE 1. CHARACTERISTIC OF RIDGE SEGMENTATION
Order 1 Order 2 Order 3 Order 4 Segments Length (km)* 600 f 300 140 f90 50 i 30 14 i 18
(400 f 200) (50 f 30) (15 f lo?) (7 I 5?)
Longevity (yr) :>5 x lo6 0.5 - 5 x lo6 -lo4- lo4 -lo2 - 10 (0.5 - 10 x lo6) (?> (?>
Discontiiiuities Offset (km) Age (yr)" Off-axis trace
>30 2 - 30 0.5 - 2.0 > , O S x lo6 <OS x lo6 -0
Fracture zone V-shaped None discordant zone
< 1 -0
None
Table 1.- Charactenstics of ridge segmientation (after Macdonald et al., 1991). Information is for fast-spreading (> 60 mmlyr) ndges. If it differs from that for slow-spreading ndges, is in pairenthesis. * Errors are f lo . t The age of seafloor that is juxtaposed to the spreading axis at a discontinuity.
Tabla 1.- Características de los distintos órdenes de segmentación en las dorsales oceánicas (de Macdonald et al., 1991). La información es para dorsa- l
les rápidas (> 60 mm/yr). En parkntesis se dan los datos correspondientes a dorsales lentas, si son distintos. * Los errores son f lo. t La edad del !fondo oceánico que estfi yuxtapuesto al eje de expansión en una discontinuidad.
A. Fast-Spreading Rates
DItransform fault
-20 kml.
-20 km
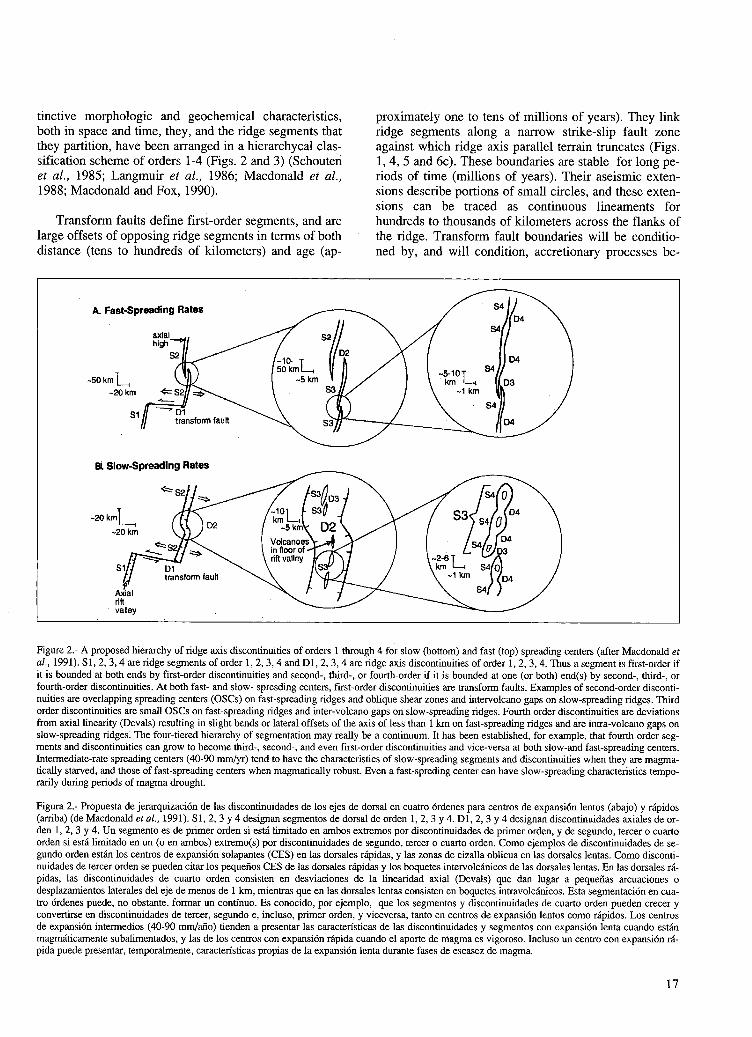
tinctive morphologic and geochemical characteristics,both in space and time, they, and the ridge segments thatthey partition, have been arranged in a hierarchycal clas-sification scheme of orders 1-4 (Figs. 2 and 3) (Schoutenet al., 1985; Langmuir et al., 1986; Macdonald et al.,1988; Macdonald and Fox, 1990).
Transform faults define first-order segments, and arelarge offsets of opposing ridge segments in terms of bothdistance (tens to hundreds of kilometers) and age (ap-
proximately one to tens of millions of years). They linkridge segments along a narrow strike-slip fault zoneagainst which ridge axis parallel terrain truncates (Figs.1, 4, 5 and 6c). These boundaries are stable for long pe-riods of time (millions of years). Their aseismic exten-sions describe portions of small circles, and these exten-sions can be traced as continuous lineaments forhundreds to thousands of kilometers across the flanks ofthe ridge. Transform fault boundaries will be conditio-ned by, and will condition, accretionary processes be-
Figure 2.- A proposed hierarchy of ridge axis discontinuities of orders 1 through 4 for slow (bottom) and fast (top) spreading centers (after Macdonald etal., 1991). Sl, 2, 3, 4 are ridge segments of order 1, 2, 3, 4 and DI, 2, 3, 4 are ridge axis discontinuities of order 1, 2, 3, 4. Thus a segment is first-order ifit is bounded at both ends by first-order discontinuities and second-, third-, or fourth-order if it is bounded at one (or both) end(s) by second-, third-, orfourth-order discontinuities. At both fast- and slow- spresding centers, first-order discontinuities are transform faults. Examples of second-order disconti-nuities are overlapping spreading centers (OSCs) on fast-spreading ridges and oblique shear zones and intervolcano gaps on slow-spreading ridges. Thirdorder discontinuities are small OSCs on fast-spreading ridges and inter-volcano gaps on slow-spreading ridges. Fourth order discontinuities are deviationsfrom axial linearity (Devals) resulting in slight bends or lateral offsets of the axis of less than 1 km on fast-spreading ridges and are intra-volcano gaps onslow-spreading ridges. The four-tiered hierarchy of segmentation may really be a continuum. It has been established, for example, that fourth order seg-ments and discontinuities can grow to become third-, second-, and even first-order discontinuities and vice-versa at both slow-and fast-spreading centers.Intermediate-rate spreading centers (40-90 nrun/yr) tend to have the characteristics of slow-spreading segments and discontinuities when they are magma-tically starved, and those of fast-spreading centers when magmatically robust. Even a fast-spreding center can have slow-spreading characteristics tempo-rarily during periods of magma drought.
Figura 2.- Propuesta de jerarquizaciOn de las discontinuidades de los ejes de dorsal en cuatro Ordenes pars centros de expansion lentos (abajo) y rapidos(arriba) (de Macdonald et al., 1991). Sl, 2, 3 y 4 designan segmentos de dorsal de orden 1, 2, 3 y 4. Dl, 2, 3 y 4 designan discontinuidades axiales de or-den 1, 2, 3 y 4. Un segmento es de primer orden si esta limitado en ambos extremos por discontinuidades de primer orden, y de segundo, tercer o cuartoorden si esta limitado en un (o en ambos) extremo(s) por discontinuidades de segundo, tercer o cuarto orden. Como ejemplos de discontinuidades de Se-gundo orden estan los centros de expansion solapantes (CES) en las dorsales rapidas, y las zonas de cizalla oblicua en las dorsales lentas. Como disconti-nuidades de tercer orden se pueden citar los pequeilos CES de las dorsales rapidas y los boquetes intervolcanicos de las dorsales lentas. En las dorsales ra-pidas, las discontinuidades de cuarto orden consisten en desviaciones de la linearidad axial (Devals) que dan lugar a pequenas arcuaciones odesplazamientos laterales del eje de menos de 1 km, mientras que en las dorsales lentas consisten en boquetes intravolcanicos. Esta segmentation en cua-tro 6rdenes puede, no obstante, formar un continuo. Es conocido, por ejemplo, que los segmentos y discontinuidades de cuarto orden pueden crecer yconvertirse en discontinuidades de tercer, segundo e, incluso, primer orden, y viceversa, tanto en centros de expansion lentos como rapidos. Los centrosde expansion intermedios (40-90 mm/aiio) tienden a presentar las caracteristicas de las discontinuidades y segmentos con expansion lenta cuando estanmagmaticamente subalimentados, y las de los centros con expansion rapida cuando el aporte de magma es vigoroso. Incluso un centro con expansion rd-pida puede presentar, temporahnente, caracteristicas propias de la expansion lenta durante fases de escasez de magma.
17
2000 m.. N
. li
. P a
. 3 a
i 1 Discontinuities ordt:r 1-3 ordier 4 (picked south of 1 4 O N on
! /wl'
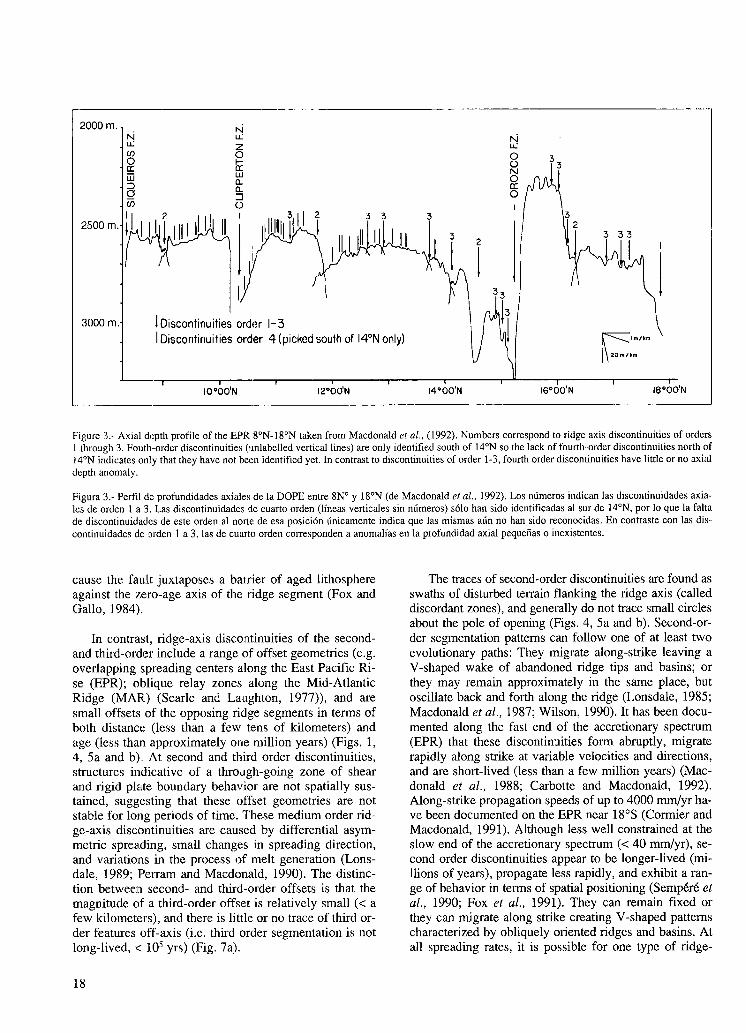
Figure 3.- Axial dcpth profile of the EPR 8ON-18"N taken from Macdonald et ul., (1992). Numbers correspond to ridge axis discontinuities of orders 1 throligh 3. Fouth-order discontinuities (iinlabelled vertical lines) are only identified south of 14ON so the lack of fourth-order discontinuities north of 14'N indirates only that they have not been identified yet. In contrast to discontinuities of order 1-3, fourth order discontinuities have little or no axial dcpth anomaly.
Figura 3.- Perfil de profundidades axialer: de la DOPE entre 8N0 y 18ON (de Macdonald et al., 1992). Los números indican las discontinuidades axia- les de orden 1 a 3. Las discontinuidades de cuarto orden (líneas verticales sin números) sólo han sido identificadas al sur de 14"N, por lo que la falta de discontinuidades de este orden al noríe de esa posición únicamente indica que las mismas aún no han sido reconocidas. En contraste con las dis- continuidades de [orden 1 a 3, las de cuarto orden corresponden a anomalías en la profundidad axial pequeñas o inexistentes.
cause the fau!t juxtaposes a barrier of aged lithosphere against the zero-age axis of the ridge segment (Fox and Gallo, 1984).
In contrast, ridge-axis discontinuities of the second- and third-order include a range c~f offset geometries (e.g. overlapping spreading centers along the East Pacific Ri- se (EPR); oblique relay zones along the Mid-Atlantic Ridge (MAR) (Searle and Laughton, 1977)), and are small offsets of the opposing ridge segments in terms of both distancí: (less than a few tens of kilometers) and age (less thaii approximately orie million years) (Figs. 1, 4, 5a and b) At second and third order discontinuities, structures indicative of a through-going zone of shear and rigid plate boundary behavior are not spatially sus- tained, suggesting that these offset geometries are not stable for loiig periods of time. These medium order nd- ge-axis discontinuities are caused by differential asym- metric spreading, small changes in spreading direction, and variations in the process of melt generation (Lons- dale, 1989; Perram and Macdonald, 1990). The distinc- tion between second- and third-order offsets is that the magnitude of a third-order offset is relatively small (< a few kilometers), and there is little or no trace of third or- der features off-axis (Le. third order segmentation is not long-lived, < 105 yrs) (Fig. 7a).
The traces of second-order discontinuities are found as swaths of disturbed terrain flanking the ndge axis (called discordant zones), and generally do not trace small circles about the pole of opening (Figs. 4, 5a and b). Second-or- der segmentation pattems can follow one of at least twa evolutionary paths: They migrate along-strike leaving a V-shaped wake of abandoned ridge tips and basins; or they may remain approximately in the same place, but oscillate back and forth along the ridge (Lonsdale, 1985; Macdonald et al., 1987; Wilson, 1990). It has been docu- mented along the fast end of the accretionary spectrum (EPR) that these discontinuities form abruptly, migrate rapidly along strike at variable velocities and directions, and are short-lived (less than a few million years) (Mac- donald et al., 1988; Carbotte and Macdonald, 1992). Along-strike propagation speeds of up to 4000 mmlyr ha- ve been documented on the EPR near 18"s (Cormier and Macdonald, 1991). Although less well constrained at the slow end of the accretionary spectrum (< 40 mmlyr), se- cond order discontinuities appear to be longer-lived (mi- llions of years), propagate l e s ~ rapidly, and exhibit a ran- ge of behavior in terms of spatial positioning (Sempéré et al., 1990; Fox et al., 1991). They can remain fixed or they can migrate along strike creating V-shaped pattems characterized by obliquely onented ndges and basins. At al1 spreading rates, it is possible for one type of ridge-
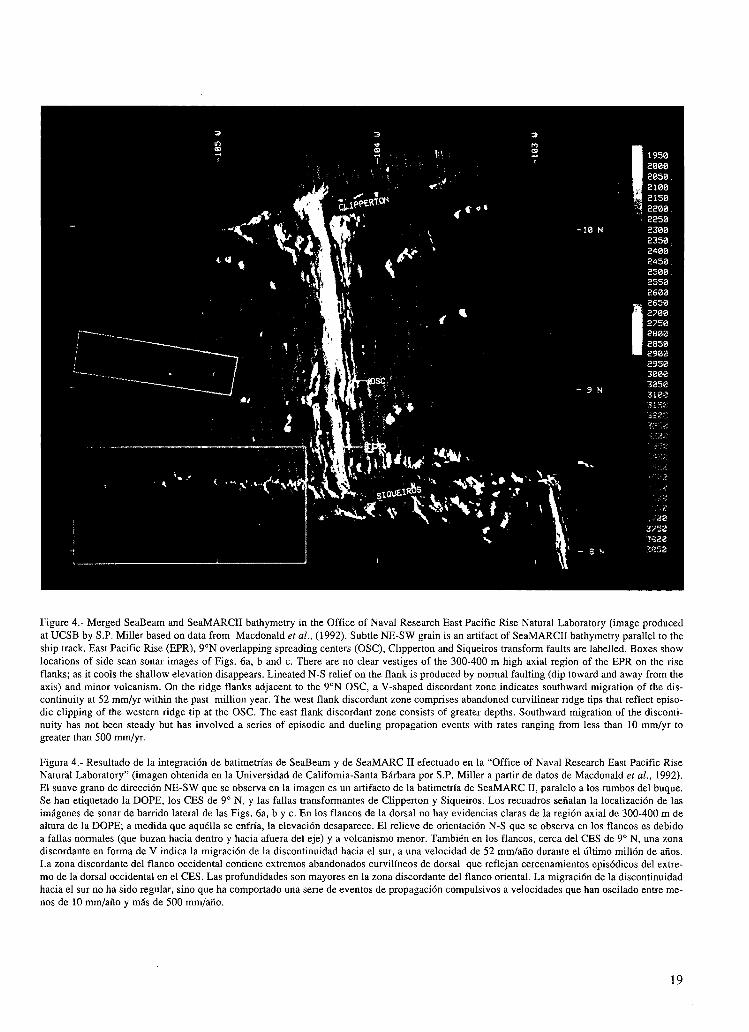
Figure 4.- Merged SeaBeam and SeaMARCII bathymetry in the Office of Naval Research East Pacific Rise Natural Laboratory (image produced at UCSB by S.P. Miller based on data from Macdonald et al., (1992). Subtle NE-SW grain is an artifact of SeaMARCII bathymetry parallel to the ship track. East Pacific Rise (EPR), g3N overlapping spreading centers (OSC), Clipperton and Siqueiros transform faults are labelled. Boxes show locations of side scan sonar images of Figs. 6a, b and c. There are no clear vestiges of the 300-400 m high axial region of the EPR on the rise flanks; as it cools the shallow elevation disappears. Lineated N-S relief on the flank is produced by normal faulting (dip toward and away from the axis) and minor volcanism. On the ridge flanks adjacent to the 9'N OSC, a V-shaped discordant zone indicates southward migration of the dis- continuity at 52 mm/yr within the past million year. The west flank discordant zone comprises abandoned curvilinear ridge tips that reflect episo- dic clipping of the western ridge tip at the OSC. The east flank discordant zone consists of greater depths. Southward migration of the disconti- nuity has not been steady but has involved a series of episodic and dueling propagation events with rates ranging from less than 10 mm/yr to greater than 500 mmlyr.
Figura 4.- Resultado de la integración de batimetrías de SeaBeam y de SeaMARC 11 efectuado en la "Office of Piaval Research East Pacific Rise Natural Laboratory" (imagen obtenida en la Universidad de Califomia-Santa Bárbara por S.P. Miller a partir de datos de Macdonald et al., 1992). El suave grano de dirección NE-SW que se observa en la imagen es un artifacto de la batimetría de SeaMARC 11, paralelo a los rumbos del buque. Se han etiquetado la DOPE, los CES de 9' N, y las fallas transformantes de Clipperton y Siqueiros. Los recuadros señalan la localización de las imágenes de sonar de barrido lateral de las Figs. 6a, b y c. En los flancos de la dorsal no hay evidencias claras de la región axial de 300-400 m de altura de la DOPE; a medida que aquélla se enfría, la elevación desaparece. El relieve de orientación N-S que se observa en los flancos es debido a fallas normales (que buzan hacia dentro y hacia afuera del eje) y a volcanismo menor. También en los flancos, cerca del CES de 9" N, una zona discordante en forma de V indica la migración de la discontinuidad hacia el sur, a una velocidad de 52 mmlaño durante el último millón de años. La zona discordante del flanco occidental contiene extremos abandonados curvilíneos de dorsal que reflejan cercenamientos episódicos del extre- mo de la dorsal occidental en el CES. Las profundidades son mayores en la zona discordante del flanco oriental. La migración de la discontinuidad hacia el sur no ha sido regular, sino que ha comportado una serie de eventos de propagación compulsivos a velocidades que han oscilado entre me- nos de 10 mmlaño y más de 500 mmlaño.
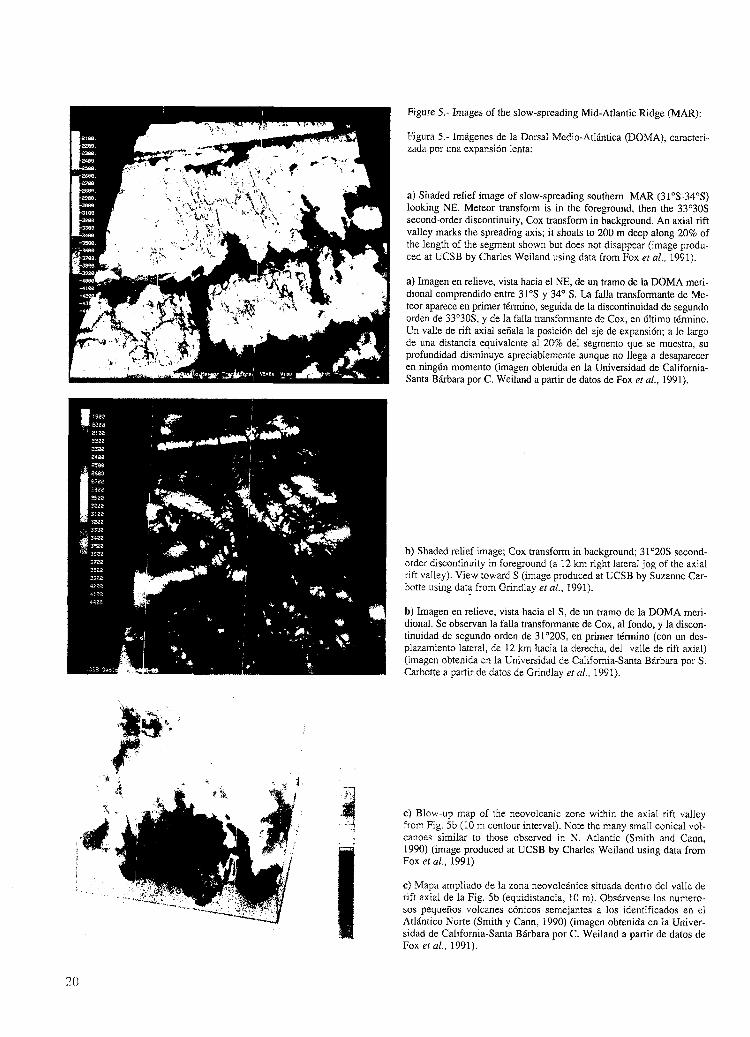
Figure 5.- Images of the slow-spreading Mid-Atlantic Ridge (MAR):
Figura 5.- Imágenes de la Dorsal Medio-Atlántica (DOMA), caracteri- zada por una expansión lenta:
a) Shaded relief image of slow-spreading southem MAR (313-34"s) looking NE. Meteor transform is in the foreground, then the 33'30s second-order discontinuity, Cox transform in background. An axial rift valley marks the spreading mis; it shoals to 200 m deep along 20% of the length of the segment shown but does not disappear (image produ- ced at UCSB by Charles Weiland using data from Fox et al., 1991).
a) Imagen en relieve, vista hacia el NE, de un tramo de la DOMA meri- dional comprendido entre 31"s y 34' S. La falla transformante de Me- teor aparece en primer término, seguida de la discontinuidad de segundo orden de 33'308, y de la falla transformante de Cox, en último término. Un vaile de rift axial señala la posición del eje de expansión; a lo largo de una distancia equivalente al 20% del segmento que se muestra, su profundidad disminuye apreciablemente aunque no llega a desaparecer en ningún momento (imagen obtenida en la Universidad de Califomia- Santa Bárbara por C. Weiland a partir de datos de Fox et al., 1991).
b) Shaded relief image; Cox transform in background; 31'20s second- order discontinuity in foreground (a 12 km right lateral jog of the axial rift valley). View toward S (image produced at UCSB by Suzanne Car- botte using data from Grindlay et al., 1991).
b) Imagen en relieve, vista hacia el S, de un tramo de la DOMA meri- dional. Se observan la faiia transformante de Cox, al fondo, y la discon- tinuidad de segundo orden de 31°20S, en primer término (con un des- plazamiento lateral, de 12 km hacia la derecha, del valle de rift axial) (imagen obtenida en la Universidad de Califomia-Santa Bárbara por S. Carbotte a partir de datos de Grindlay et al., 1991).
c) Blow-up map of the neovolcanic zone within the axial rift valley from Fig. 5b (10 m contour interval). Note the many small conical vol- canoes similar to those observed in N. Atlantic (Smith and Cann, 1990) (irnage produced at UCSB by Charles Wciland using data from Fox et al., 1991)
C) Mapa ampliado de la zona neovolcánica situada dentro del valle de rift axial de la Fig. 5b (equidistancia, 10 m). Obsérvense los numero- sos pequeños volcanes cónicos semejantes a los identificados en el Atlántico Norte (Smith y Cann, 1990) (imagen obtenida en la Univer- sidad de California-Santa Bárbara por C. Weiland a oartir de datos de Fox et al., 1991).
axis discontinuity to evolve into another by sustained asymmetric spreading of adjoining ridge segments (Pe-
, rram and Macdonald, 1990; Grindlay et al., 1991). Cha- racteristically, the terrain in close proximity to the discor- dant zonos is highly magnetized, probably reflecting the eruption of highly fractionated basalts (Carbotte and Macdonald, 1992).
The different types of boundaries outlined above par- tition the MOR into ridge segments of variable lengths (tens of kilometers to hundreds of kilometers). Indepen- dent of length, most ridge segments have arched along- strike topographic profiles, i.e., a depth minimum is loca- ted approximately midway along the ndge segment and depths increase towards the ends of the segment (Fig. 3). Each ridge segment is characterized by its own distincti- ve along-strike profile in terms of relief and gradient from central high to segment ends, and depth of the cen- tral high. The extent to which axial depths increase from central high to segment ends ranges from tens to thou- sands of meters with the largest changes in relief associa- ted with ridge segments along more slowly accreting nd- ges (e.g. MAR). At fast-spreading ridges, which usually exhibit axial highs, the axial high increases steadily in cross-sectional area with increasing proxirnity to the ele- vated mid-sections of individual segments (Macdonald and Fox, 1988; Scheirer and Macdonald, in press).
The scale of ridge segmentations discussed above is relatively easy to recognize because the ridge-axis is clearly offset along strike. Recent high resolution ima- ging and sampling of the ridge axis in some areas has defined morphologic, bathymetric and geochemical changes along strike that suggest a finer, fourth-order scale of segmentation that is supenmposed on the tens to hundreds of kilometer-long segmentation discussed abo- ve (Fig. 2) (Langmuir et al., 1986). The along-strike arch-shaped architecture is retained at this small scale but the wavelength is on the order of kilometers and the relief is low. Individual fault traces and volcanic structu- res along the axis often reflect these deviations in axial linearity by exhibiting right- or left-stepping (<1 km) en échelon pattems (Figs. 6a and 7b).
A host of geological observations including the regu- lar undulation of the crest of the ridge, which correlates with its cross-sectional area (Scheirer and Macdonald, in press), seisrnic evidence for an axial melt reservoir (De- trick et al., 1987; Vera et al., 1990; Harding et al., 1993; Toomey et al., 1990), geochernical anomalies, and the lo- cations of discontinuities has led to the development of a magma supply model for ridge segmentation. In the mag- ma supply model, the generation, transport and distribu- tion of melt from the upper mantle is enhanced beneath the shallow, swollen region of each segment and is deple- ted at the ends of each segment near overlapping sprea- ding centers (OSCs) and other discontinuities (Macdonald
et al., 1991; Langmuir et al., 1986; Sinton and Detrick, 1992; Solomon and Toomey, 1992). As the plates spread apart, partial melting of mantle rocks occurs due to adia- batic decompression at depths of 30 to 60 km. The buo- yant melt segregates from residual solid mantle and as- cends to fill shallow magma chambers within the crust along the ndge axis. These melts locally swell the crustal magma reservoirs, and buoyant forces associated with the melt and a surrounding halo of hot, melt-impregnated low-density rock create a local shoaling of the ridge crest. Continuous injection of melt leads to local eruptions, mi- gration of magma away from the locus of upwelling, and expansion of the axial magma chamber along strike.The laterally migrating magma loses hydraulic heat with in- creasing distance from the center of magma replenish- ment; as a result the depth of the ndge axis steadily increases along strike. As magma migrates at depth along the ridge, continued extension fractures the overlying brit- tle carapace of frozen lava. Magmas then use these fractu- res as conduits to the seafloor and volcanic eruptions fo- llow the advancing crack front. The process outlined above occurs repeatedly as plate separation continues. In this magmatic model for a spreading center, ridge-axis discontinuities occur at the disial ends of magmatic pulses and define the ends of ridge segrnents (Figs. 3a and 5a).
At slow-spreading ridges, seismic studies have not re- vealed a magma reservoir (Detrick et al., 1990). Howe- ver, a similar pattem of segmented upwelling may still occur there, and very small pockets of melt or highly epi- sodic magma chambers may be present (Smith and Cann, 1990). Large "bulls-eye"-shaped gravity anomalies occur over ridge segments defined by second-order discontinui- ties on the MAR (Lin et al., 1990; Kuo and Forsyth, 1988; Blackman and Forsyth, 1991). Corrected to remo- ve the gravitational effects of topography, these anoma- lies indicate that low-density upper mantle or thickened oceanic crust is present beneath the rnidsections of seg- ments. Kuo and Forsyth (1988) proposed that these ano- malies are best explained by a three-dimensional pattem of upwelling hot mantle material. The pattem of mantle upwelling may become less three dimensional (Lin and Phipps Morgan, 1992), and magma migration within axial magma reservoirs may be more efficient at higher spreading rates (Cochran et al., 1993).
VOLCANISM ON MID-OCEAN RIDGES
The narrow nbbon of active volcanism along sprea- ding axes is called the neovolcanic zone (Macdonald, 1982). The neovolcanic zone is characterized by elonga- te axial highs tens of kilometers long at fast spreading centers (Searle, 1984); generally shorter (depending on local magmatic budget), discontinuous volcanoes at in- termediate rates (Luyendyk and Macdonald, 1985); and a coalesced patchwork of hundreds of small conical to
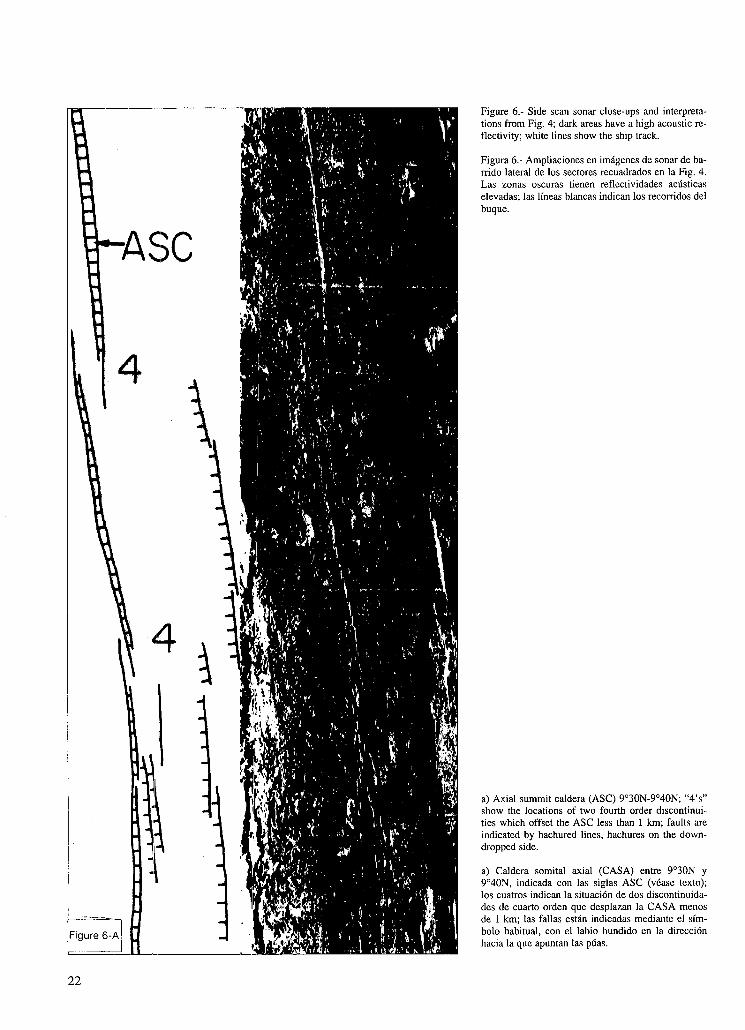
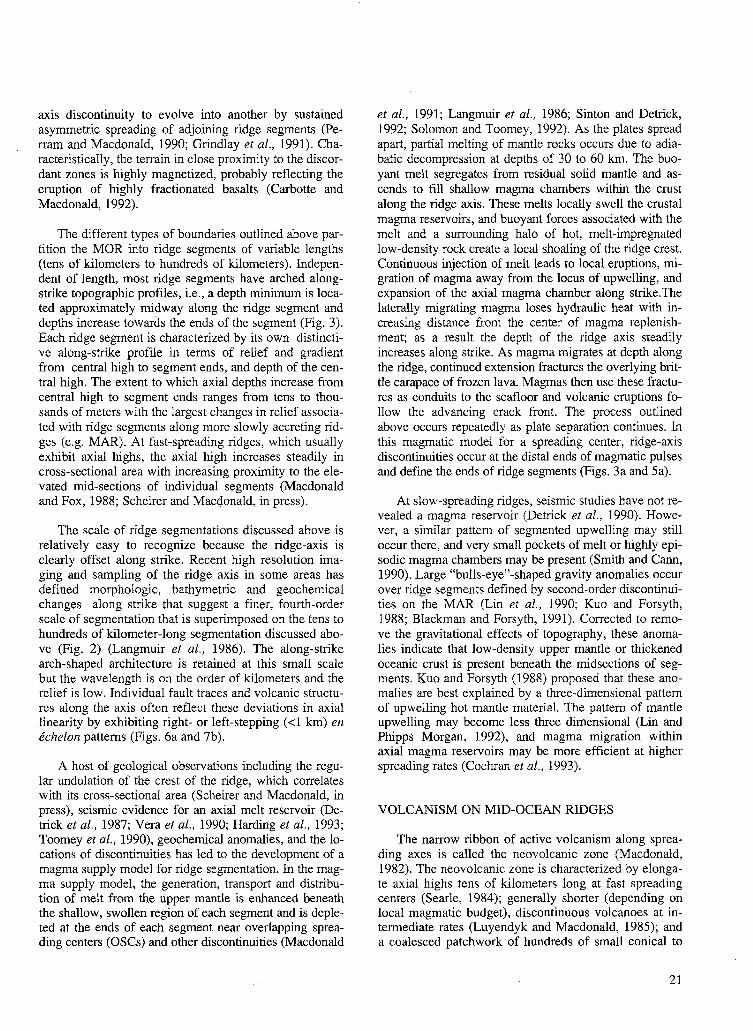
Figure 6.- Side scan sonar close-ups and interpreta- tions from Fig. 4; dark areas have a high acoustic re- flectivity; white lines show the ship track.
Figura 6.- Ampliaciones en imágenes de sonar de ba- rrido lateral de los sectores recuadrados en la Fig. 4. Las zonas oscuras tienen reflectividades acústicas elevadas; las líneas blancas indican los recorridos del buque.
a) Axial summit caldera (ASC) 9°30N-9040N, "4's" show the locations of two fourth order discontinui- ties which offset the ASC less than 1 km; faults are indicated by hachured lines, hachures on the down- dropped side.
a) Caldera somital axial (CASA) entre gC30N y g040N, indicada con las siglas ASC (véase texto); los cuatros indican la situación de dos discontinuida- des de cuarto orden que desplazan la CASA menos de 1 km; las fallas están indicadas mediante el sím- bolo habitual, con el labio hundido en la dirección hacia la que apuntan las púas.
b) Seamount chain; the highly reflective hollows around the seamounts indicate lava flows which are younger than the crust they lie upon.
b) Cadena de montes submarinos cuyos halos altamente reflectivos corresponden a coladas de lava más jóvenes que la corteza sobre la que reposan.
I 1
-
Figure 6-c I I I
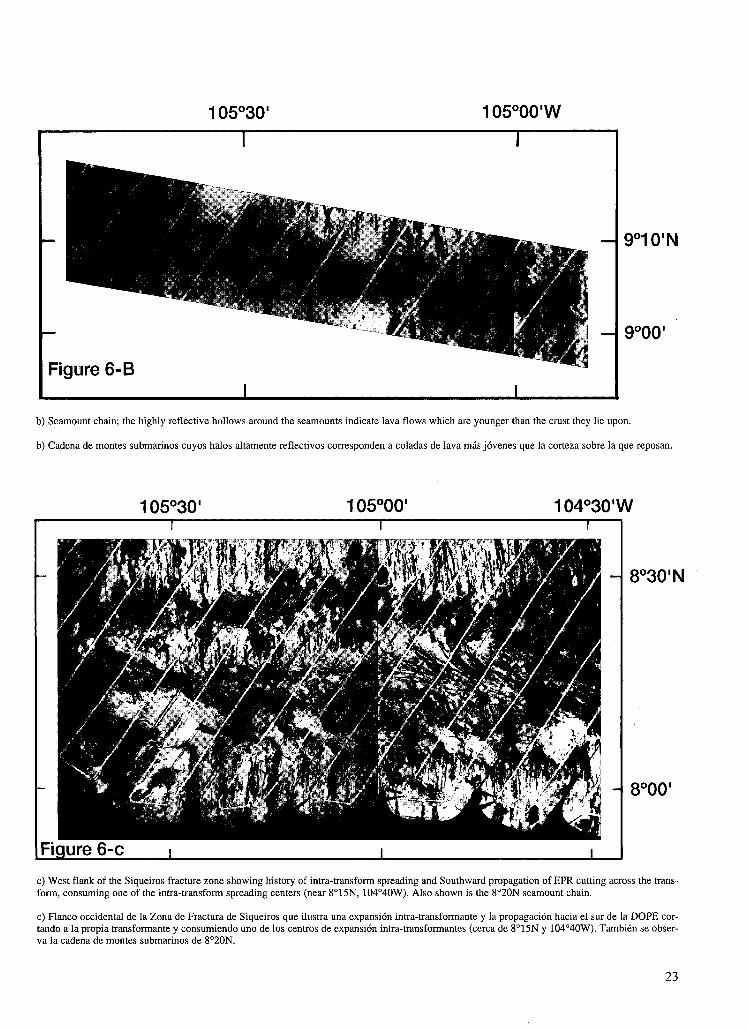
c) West flank of the Siqueiros fracture zone showing history of intra-transform spreading and Southward propagation of EPR cutting across the trans- form, consuming one of the intra-transform spreading centers (near g015N, 104O40W). Also shown is the 8"20N searnount chain.
c) Flanco occidental de la Zona de Fractura de Siqueiros que ilustra una expansión intra-transformante y la propagación hacia el sur de la DOPE cor- tando a la propia transformante y consumiendo uno de los centros de expansión intra-transformantes (cerca de 8"15N y 104"40W). También se obser- va la cadena de montes submarinos de 8'20N.
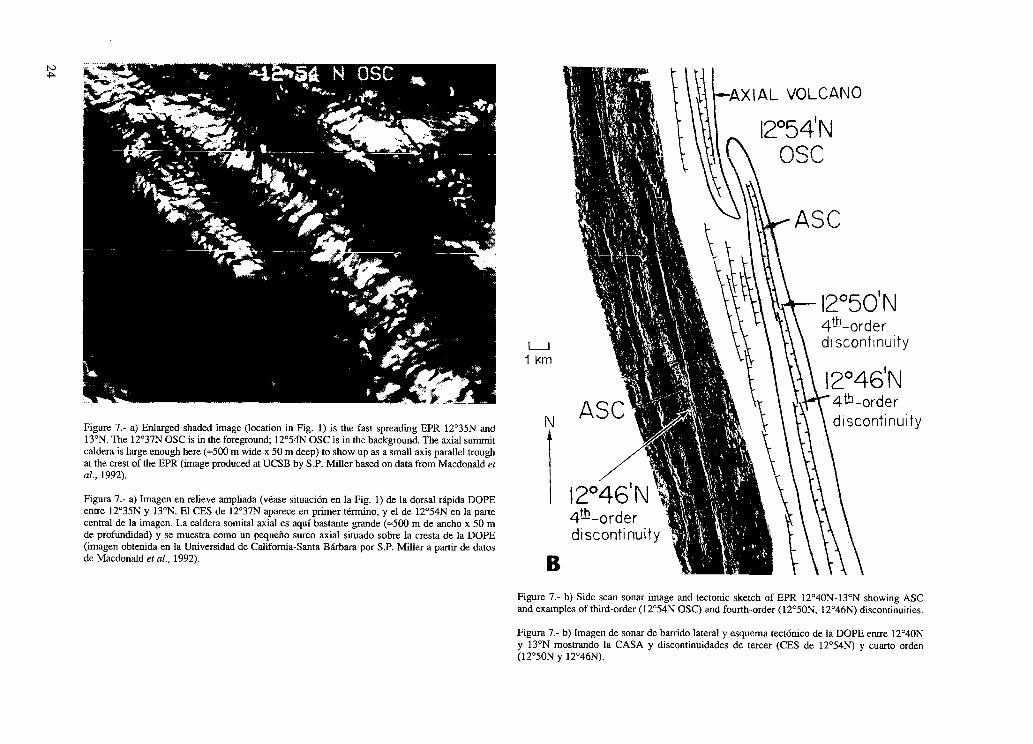
Figure 7.- a) Enlarged shaded image (location in Fig. 1) is the fast spreading EPR 12"35N and 13ON. The 12"37N OSC is in the foreground; 12'54N OSC is in the background. The axial summit caldera is large enough here ( ~ 5 0 0 m wide x 50 m deep) to show up as a small axis parallel trough at the crest of the EPR (image produced at UCSB by S.P. Miller based on data from Macdonald et al., 1992).
Figura 7.- a) Imagen en relieve ampliada (véase situación en la Fig. 1) de la dorsal rápida DOPE entre 12'35N y 13"N. El CES de 12'37N aparece en primer término, y el de 12"54N en la parte central de la imagen. La caldera somital axial es aquí bastante grande ( ~ 5 0 0 m de ancho x 50 m de profundidad) y se muestra como un pequeño surco axial situado sobre la cresta de la DOPE (imagen obtenida en la Universidad de Califomid-Santa Bárbara por S.P. Miller a partir de datos de Macdonald et al., 1992).
Figure 7.- b) Side scan sonar image and tectonic sketch of EPR 12'40N-13"N showing ASC and examples of third-order (12"54N OSC) and fourth-order (12'50N, 12"46N) discontinuities.
Figura 7.- b) Imagen de sonar de barrido lateral y esquema tectónico de la DOPE entre 12'40N y 13"N mostrando la CASA y discontinuidades de tercer (CFS de 12'54N) y cuarto orden (12'50N y 12O46N.
slightly elongate volcanic constructions at slow sprea- ding rates (Smith and Cann, 1992). It is so narrow (=1-3 km) that axial volcanoes are occasionally split in two and rafted away as the plates separate (Fig. 8) (Macdo- nald et al., 1980, 1983; Kappel and Ryan, 1986). Yet the most extensive high-resolution study of a fast-spreading ridge to date shows that there are very few structures on the flanks of the EPR which resemble the 300-400 m axial high or split halves of it. The EPR axial elevation seems to disappear completely off-axis (Fig. 4). How can this be? The answer to this question becomes clear when one considers how the neovolcanic zone varies with spreading rate and magma supply.
The axial high on fast spreading centers indicates that the supply of magma is steady and robust, and is able to keep up with the rate of plate separation (Fig. 4). The shape and cross-sectional area of the axial high are sensitive indicators of the local magma supply. The re- duction in cross-sectional area and change in shape to a narrow triangular cross-section near many discontinui- ties indicates a reduction in magma supply near the ends of ridge segments; conversely, magma supply is gene- rally greater along the mid-sections of segments (Mac- donald and Fox, 1988; Scheirer and Macdonald, in press). Active volcanism is dominated by linear fissure eruptions along the crest of the rise and extensive out- pourings of sheet flows (Choukroune et al., 1984; Mac- donald et al., 1989). These lavas erupt from a long, linear trough which occurs along the crest of the axial high (Figs. 5a, 7a and b). This trough is referred to as an axial summit caldera because it is produced by collapse of the frozen volcanic carapace when underlying magma drains away, rather than by block faulting (Haymon et al., 1991a). The caldera is tens of kilometers long and ty- pically 40-500 m wide (Macdonald et al., 1984; Searle, 1984). Occurrence of the axial summit caldera (Macdo- nald and Fox, 1988) coincides almost perfectly with a
bright, phased-reversed seismic reflector (Detrick et al., 1987; Harding et al., 1993) which is interpreted to be the roof of a crustal magma chamber beneath the rise. The caldera is also restricted to 60% of the rise where the shape and cross-sectional area indicate a robust magma- tic budget, Le., not near discontinuities of orders 1-3.
The axial high on fast spreading centers has been compared to terrestrial shield volcanoes (Lonsdaie, 1977). While this is a very fruitful analogy in understan- ding the structure and morphology of many submarine volcanic products, this analogy can be misleading be- cause the axial high is not a volcanic construction clear down to the Moho as is Hawaii, for exarnple. Rather, as outlined in the preceeding section, the elevation of the axial high is created primarily by the buoyancy of hot rock and magma which upwell beneath the rise. For example, if the magma supply to Hawaii were cut off, the island would sink beneath the waters of the Pacific due to subsidence of the lithosphere on which it rides, however it would not disappear as it follows the evolu- tionary path of its predecessors along the Hawaii-Empe- ror seamount chain. In contrast, the axial high at fast spreading centers will disappear if cut off from its mag- ma supply (Macdonald, 1990). The thickness of the ac- cumulated volcanics is actually thinnest along the axis where the elevation is greatest (Christeson et al., 1992). Thus, while the axial high looks like a shield volcano, it is actually more akin to a long, skinny magma-filled balloon whose diameter is a sensitive measure of magma supply. This is why we see little vestige of the axial "volcano", split or whole, on the flanks of the EPR. As it splits in two, moves off axis and cools, most of it disappears. Only a muted representation of the axial neovolcanic zo- ne survives off-axis (Figs. 1 and 4) (Tighe and Fox, 1991), most commonly within the discordant zones of second order discontinuities where abandoned ridge tips may be supported by thicker lithosphere (Fig. 4).
2500 m
A 0 Axis C' I I I I I
1:soo VE x 5.2
10 5 O 5 10
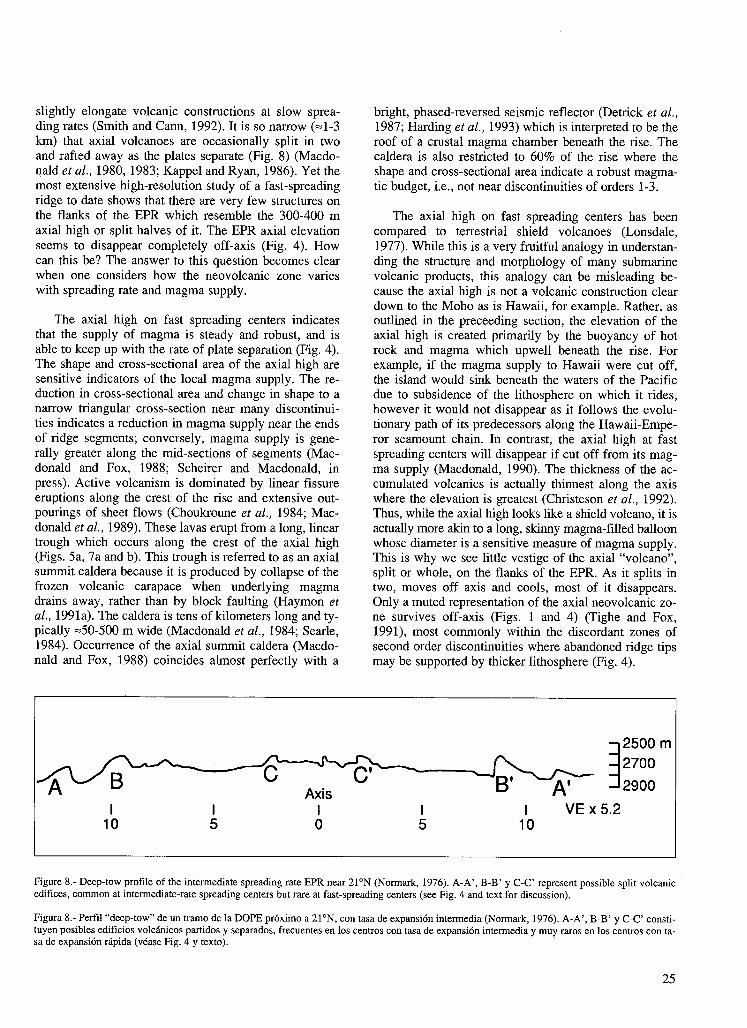
Figure 8.- Deep-tow profile of the intermediate spreading rate EPR near 21°N (Normark, 1976). A-A', B-B' y C-C' represent possible split volcanic edifices, cornmon at intermediate-rate spreading centers but rare at fast-spreading centers (see Fig. 4 and text for discussion).
Figura 8.- Perfil "deep-tow" de un tramo de la DOPE próximo a 21°N, con tasa de expansión intermedia (Normark, 1976). A-A', B-B' y C-C' consti- tuyen posibles edificios volcánicos partidos y separados, frecuentes en los centros con tasa de expansión intermedia y muy raros en los centros con ta- sa de expansión rápida (véase Fig. 4 y texto).
In contrast, significant volcanic constructional edifi- ces may develop on the ridge axis at intermediate-rate spreading centers (40-90 mmlyr). A more episodic mag- ma supply (Macdonald, 1982) combmed with thicker ze- ro-age lithosphere (Purdy et al., 1992:) allows axial volca- noes to be constructed and supported. along the spreading axis. This thicker zero-age lithosphere also provides suf- ficient overburdein so that normal faulting may occur right along the spreading axis (as opposed to tensional failure and collaprie along the axes of most fast-spreading centers where the 1ithosPhere is not sufficiently thick for normal faulting to occur until it has moved 2-5 km offa- xis (Carbotte and Macdonald, 1990). Thus, as spreading continues, the episodically forming axial volcano on in- termediate-rate spreading centers splits by normal faul- ting and the two halves of the volcano are rafted away and preserved on the flanks, creating the "bow forms" found by Kappel and Ryan (1986). A direct test of this split volcano hypothesis is that the volcanic section (layer 2A) of the oceanic crust should be thicker beneath abys- sal hills than the intervening valleys at intermediate-rate spreading centers, but should have a relatively uniform thickness indeperident of abyssal hills on fast-spreading centers. Seisrnic data at fast (Kappus et al., 1992; Har- ding et al., 1993) and at intermediate-rate spreading cen- ters (Rohr et al., 1992) support this hypothesis. These da- ta also support tolpographic observations that some of the abyssal hill topography flanking int~ermediate-rate sprea- ding centers (Fig., 8) may have a vslcanic constructional component while the relief associated with lineated hills flanking the fast-spreading EPR is prirnarily faulted in origin (Lonsdale, 1977; Bicknell et al., 1988; Carbotte and Macdonald, 1,990).
In contrast to magmatically robilst fast- and interme- diate-rate spreadjng centers, magmiitically starved inter- mediate- and slow-spreading centers are characterized by a rift valley alnd an axial neovolcanic zone which is discontinuous (Figs. 5a and b) (Macdonald, 1986). Some have argued that the rift valley disappears episodically on slow-spreadirig ridges, so we kiave included one of the touted examples of this disappiueance in Figure 5a. The rift valley does not disappear along the entire seg- ment; it is over 400 m deep along 80% of its length. Near mid-segment, however, the valley shoals to a 200 m deep half-graben, but even here it does not vanish. At slow-spreading iidges, the axial rift valley disappears along entire seginents only near hot spots (e.g. Azores and Iceland) and where rare occurrences of seamount volcanism along the axis overprint the rift valley (e.g. near 26"S, Grindlay et al., 1991).
SeaBeam charts show that the ne,ovolcanic zone within the rift valley inner floor is dottecl by numerous small, conical volcanoes averaging 60 ni in height (Fig. 5c) (Kong et al., 1988; Smith and Cann, 1992), and less fre- quently by long, linear volcanic ridges (Pockalny et al.,
1988). In contrast to the buouyantly supported axial high at fast-spreading centers, these edifices are true volcanic constructions whose elevations are produced entirely by lava flows, primarily pillow flows (Bryan and Moore, 1977). These discontinuous conical volcanoes suggest point source volcanism from many isolated pockets of magma, in contrast to the remarkably continuous magma reservoir beneath fast spreading centers. Smith and Cann (1992) suggest than hundreds of these volcanoes coalesee to create the volcanic layer on slow-spreading ridges. If so, then the crust created at slow spreading centers is a he- terogeneous patchwork of lozenge-shaped volcanic units in contrast to the more continuous "conveyor belt" style of volcanism at fast spreading centers. As at intermediate- rate spreading centers, these volcanoes occasionally split in two (Atwater, 1979), but more often are dismembered with oniy parts of the volcanoes being preserved as "lips" at the edges of large fault blocks (Macdonald and Lu- yendyk, 1977; Ballard and van Andel, 1977).
USING TOPOGRAPHY TO FORECAST SEAFLOOR VOLCANIC ERUPTIONS AND AXIAL MAGMA CHAMBERS
Based on SeaBeam maps of the EPR between 9ON- 13'N, we suggested that the shape and cross-sectional area of a fast-spreading rise is an indirect measure of its magma supply (Macdonald et al., 1984). A narrow "triangular" cross-section indicates a starved magma supply, while a broad "domed" or "rectangular" cross- section indicates a robust supply of magma. In 1987, De- trick et al. published multi-channel seismic results which were consistent with this hypothesis. A bright, phase-re- versed reflector, interpreted to be the roof of a narrow crustal magma chamber was observed 1.2-2.0 km beneath the seafloor where the nse axis is domed or rectangular in cross-section, but was absent where the profile is trian- gular. Furthermore, we found an excellent correlation between the presence of an axial sumrnit caldera (then called an "axial summit graben") and the magma cham- ber reflector (Macdonald and Fox, 1988). In only two lo- cations between 9ON and 13ON (9'42N-9'55N and near 1O0N) did we observe a magmatically robust, dome ridge cross-section, underlain by a bright magma chamber re- flector, that was lacking a summit caldera (Fig. 9). We reasoned that these two anomalous locations were in a magmatically robust phase, swollen with underlying magma and smoothed by fresh lavas that had not yet collapsed to form a caldera. Such a location seemed to be a good candidate for a ridge which is in active eruptive phase of its evolution (Macdonald and Fox, 1988).
In 1989, Haymon et al. (1991a) conducted a detailed ARGO visual survey of the EPR 9'09N-9'54N for an Ocean Drilling Program site survey. Where we had no- ted the absence of an axial summit caldera in 1987, the-
re existed in 1989 a narrow caldera (40-70 m wide). Our SeaMARC 11 survey in 1987 did not detect the fea- ture, indicating that it was either too small to detect with SeaMARC 11 (unlikely) or that caldera collapse had occurred between 1987-89. During a return submer- sible program to the same area in April 1991, divers in ALVIN witnessed many indications that an eruption was occurring beneath and around them (Haymon et al., 1991b and submitted). Thriving colonies of tube worms documented to exist during the 1989 ARGO survey we- re largely buried in fresh glassy lava, but there were scattered about a few scorched corpses. Crabs and other mobil predators were absent in April 1991, but were vo- raciously feasting on broiled tube woms in May (Hay- mon et al., 1991~). Large (=lo0 m2) white bacteria1 mats grew around new hydrothermal vents. High tem- perature fluids issued forth directly from cracks in the fresh lava flows; there had been no time for fast-gro- wing sulfate/sulfide edifices to form. Based on 210Pof 1°Pb dating, the basalt samples collected at
9'50.6N from ALVIN during April 1-14, 1991 must ha- ve erupted during March 26-April 6, 1991 (Rubin and Macdougall, 1991). Evidence of eruption was found at severa1 sites extending throughout the 9'45N-9'52N in- terval forecasted in 1988 (Haymon et al., 1991c), and appeared to have propagated along an eruptive fissure north to at least 9O54N.
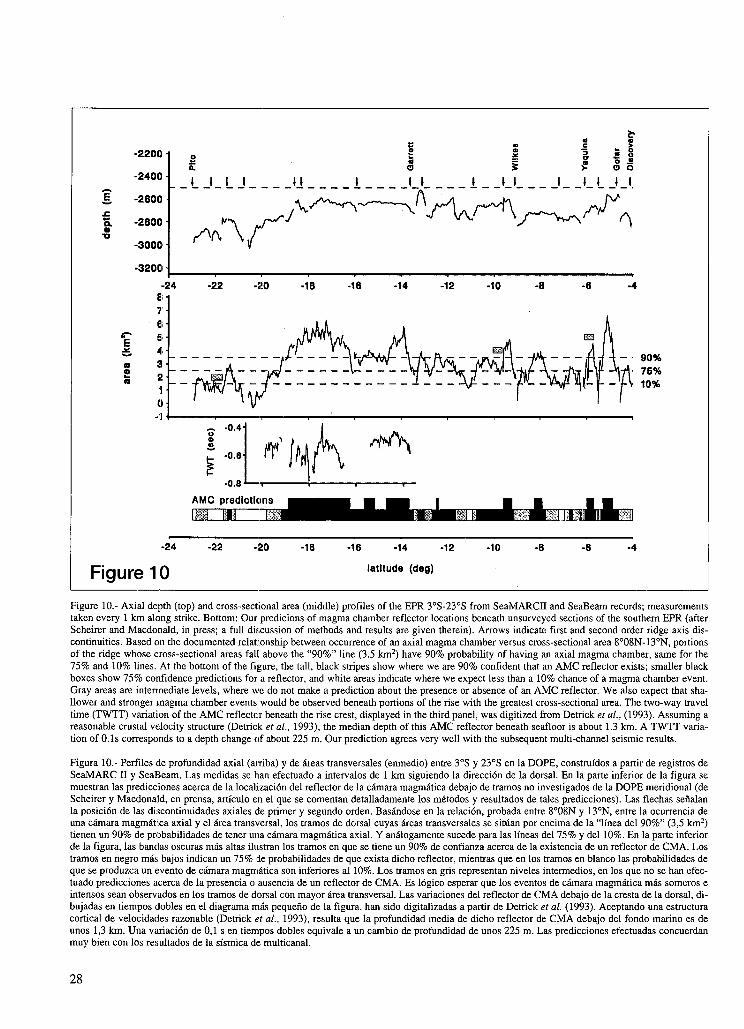
Bouyed by this one apparent forecast success, we inspected our southern EPR SeaMARC 11 data and found two more sites where we believe eruptions are occurring or will occur very soon; near 14'30s and between 17°20S-17030S (Macdonald, 1991). The significant ma- ximum in cross-sectional area (Fig. 10) and a =20 km stretch where the axial surnmit caldera is filled and not yet collapsed convinced us that the case for 17'20s- 17'30s was particularly compelling, so that area was presented as our next forecast at the 1991 Fa11 AGU me- eting. In the same AGU session, Detrick and Harding presented the first multi-channel results for the very fast-
ROBUST MAGMA SUPPLY AXl AL
CALDERA AMC INFERRED BUT NO AXlAL CALDERA: ERUPTION PREDICTED
REFLECTOR 1 03O50' -
I
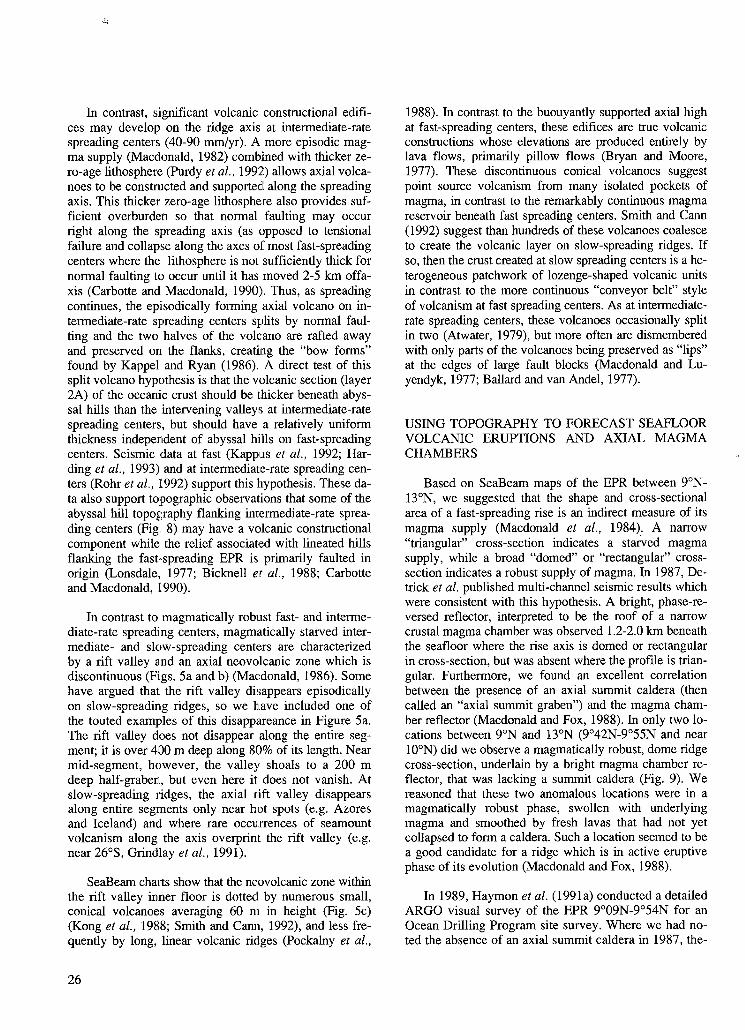
9O 1 oO Figure 9.- Enlargement of Macdonald and Fox (1988) Fig. 2 showing basis for forecast of 1991 emption. Thick line shows location of axial magma chamber seismic reflector (from Detrick et al., 1987), axial shape indicative of robust or starved magma supply as shown, thin line parallel to axis shows where an axial caldera is present, "+" shows the regions where a cross-sectional shape indicates a robust magma supply but absence of an axial summit caldera, presumably due to pcent flooding by lavas. There are only two "+" regions on the EPR between 9'N -13ON, these are the locations where volcanic eruptions were forecast (Macdonald and Fox, 1988). Most of the go45N-9"54N region has experienced post-1989 volcanism (Haymon et al., 1991c), and a documented eruption ocurred in late March-early April 1991 near 9"51N (Haymon et al., 1991b). ALVIN dives near 10°N in March 1992 document evidence for very recent volcanic activity here as well.
Figura 9.- Ampliación de la Fig. 2 de Macdonald y Fox (1988) en la que se ilustran los fundamentos de la predicción de la empción de 1991. El per- fil axial indica si el aporte de magma es abundante o escaso. La línea gruesa señala la localización del reflector sísrnico de la cámara magmáhca axial (según Detnck et al., 1987), la línea fina paralela al eje traza la caldera axial, y las cruces marcan las regiones en que el perfil transversal indica un aporte magmático abundante en ausencia de caldera somital axial. En la DOPE, entre 9"N y 13'N, sólo hay dos regiones con cruces, las cuáles se co- rresponden con los lugares en que se predijeron empciones (Macdonald y Fox, 1988). En la mayor parte de la región entre 9'45N y 9'54N ha habido manifestaciones volcánicas después de 1989 (Haymon et al., 1991c), produciéndose una empción bien documentada cerca de 9'51N entre finales de Marzo y comienzos de Abril de 1991 (Haymon et al., 1991b). Las inmersiones efectuadas por el ALVTN cerca de 10°N, en Marzo de 1992, también aportaron evidencias de actividad volcánica muy reciente en ese lugar.
1 Figure 10 latltude (deg)
Figure 10.- Axial depth (top) and cross-sectional area (middle) profiles of the EPR 3OS-23OS from SeaMARCII and SeaBeam records; measurements taken every 1 km along strike. Bottom: Our predicions of magma chamber reflector locations beneath unsurveyed sections of the southem EPR (after Scheirer and Macdoilald, in press; a full discussion of methods and results are given therein). Arrows indicate first and second order ridge axis dis- continuities. Based on the documented relationship between occurrence of an axial magma chamber versus cross-sectional area 8'08N-l3'N, portions of the ridge whose cross-sectional areas fall. above the "90%" line (3.5 km2) have 90% probability of having an axial magma chamber, same for the 75% and 10% lines. At the bottom of the figure, the tall, black stripes show where we are 90% confident that an AMC reflector exists; smaller black boxes show 75% cortfidence predictions for a reflector, and white areas indicate where we expect less than a 10% chance of a magma chamber event. Gray areas are intennediate levels, where we do not make a prediction about the presence or absence of an AMC reflector. We also expect that sha- llower and stronger magma chamber events would be observed beneath portions of the rise with the greatest cross-sectional area. The two-way travel time (TWTT) variation of the AMC reflecto~r beneath the rise crest, displayed in the third panel, was digitized from Detnck et al., (1993). Assuming a reasonable cmstal velocity structure (Detrick et al., 1993), the median depth of this AMC reflector beneath seafioor is about 1.3 km. A TWTT varia- tion of 0.1s corresponds to a depth change of about 225 m. Our prediction agrees very well with the subsequent multi-channel seismic results.
Figura 10.- Perfiles de profundidad axial (ainba) y de áreas transversales (enmedio) entre 3's y 23's en la DOPE, constniídos a partir de registros de SeaMARC iI y SeaBeam. Las medidas se han efectuado a intervalos de 1 km siguiendo la dirección de la dorsal. En la parte inferior de la figura se muestran las predicciones acerca de la localización del reflector de la cámara magmática debajo de tramos no investigados de la DOPE meridional (de Scheirer y Macdonald, en prensa, artículo en el que se comentan detalladamente los métodos y resultados de tales predicciones). Las flechas señalan la posición de las discontinuidades axiales de primer y segundo orden. Basándose en la relación, probada entre 8'08N y 13'N, entre la ocurrencia de una cámara magmática axial y el área transversal, los tramos de dorsal cuyas áreas transversales se sitúan por encima de la "línea del 90%" ( 3 3 km2) tienen un 90% de probabilidades de tener una cámara magmática axial. Y análogamente sucede para las líneas del 75% y del 10%. En la parte inferior de la figura, las bandas oscuras más altas iliistran los tramos en que se tiene un 90% de confianza acerca de la existencia de un reflector de CMA. Los tramos en negro más bajos indican un 75% de probabilidades de que exista dicho reflector, mientras que en los tramos en blanco las probabilidades de que se produzca un evento de cámara magmática son inferiores al 10%. Los tramos en gris representan niveles intermedios, en los que no se han efec- tuado predicciones acerca de la presencia o ausencia de un reflector de CMA. Es lógico esperar que los eventos de cámara magmática más someros e intensos sean observados en los tramos de dorsal con mayor área transversal. Las variaciones del reflector de CMA debajo de la cresta de la dorsal, di- bujadas en tiempos dobles en el diagrama más pequeño de la figura, han sido digitalizadas a partir de Detrick et al. (1993). Aceptando una estructura cortical de velocidaties razonable (Detrick iet al., 1993), resulta que la profundidad media de dicho reflector de CMA debajo del fondo marino es de unos 1.3 km. Una variación de 0,l s en tienipos dobles equivale a un cambio de profundidad de unos 225 m. Las predicciones efectuadas concuerdan muy bien con los resultados de la sísmica de multicanal.
spreading EPR 13"s-20"s (Detrick et al., 1991; Harding et al., 1991). They showed that the magma chamber re- flector is bright and narrow, and present along approxi- mately 60% of the rise, very similar to the EPR 9"N- 13"N observations. However, the reflector is shallower than 9ON-13"N (-1 km) and at 17'20S, the reflector is less than 900 m beneath the seafloor (Detrick et al., 1993)! When we presented the analysis of our first fore- cast for 9'45N-9'54N and the reasoning behind our next forecast for 17°20S-17030S, Vincent Renard, who had conducted three reconnaissance dives with the French submersible CYANA in 1984 near 17"25S-l7"27S (Re- nard et al., 1985), related how they had seen large areas of fresh glassy lava, the same mysterious white bacteria1 mats blowing out of fissures in the lava carapace, and hy- drothermal fluids venting straight out of cracks in the la- va flow with no sulfide edifices developed yet; most of the same indicators of active eruption observed near 9O50N (Haymon et al., 1991b). The sulfateJsulfide edifi- ces grow in height at a rate of about 10 cmlday (Hekinian et al., 1984), so this limits the age of the eruption to being very recent or ongoing. We think this is a second successful forecast of a deep seafloor volcanic eruption or perhaps a back-cast, an accepted practice in fly-fishing if not in volcanology. Subsequently, a preliminary analy- sis.of March 1992 ALVIN dive observations near 10°N indicate that dike injection and minor volcanism may ha- ve occurred since 1991 in the 10°N-10°02N area (Mac- donald, unpublished cruise report).
Recent seismic results also provided an opportunity to test our prediction of where axial magma chambers should be found between 3"s-23"s on the EPR (Fig. 10) (Macdonald and Fox, 1988). We refined this prediction by making a sequence of cross-sectional area calculations for the rise crest at 1 km intervals along strike using our digital bathymetric data base (Scheirer and Macdonald, 1991). At the Fall 1991 AGU, Detrick showed where the magma chamber had been irnaged between 13"s-20"s (Detrick et al., 1991). In Scheirer's talk, immediately following Detrick's, the predicted magma chamber loca- tions, based on excessive or maximum cross-sectional area and shape, had a better than 80% agreement with seismic detection of a magma chamber reflector (we had only predicted occurrence, not depth or width of the magma chamber). Our earlier magma chamber predic- tion, based solely on shape of the axial high and presen- ce of an axial summit caldera, was almost as succesful, and the predicted locations are published in Macdonald and Fox (1988) for comparison with the seismic results. Some of the axial relief we measure may be caused by variations in the thickness of the volcanic carapace (es- pecially at ridges which spread at an intermediate rate), reflecting a longer term average of the magma supply than is measured seismically (Harding et al., 1993). This is the most likely explanation for the 20% of the ridge where our prediction method fails.
While it is exciting to forecast submarine eruptions and the locations of magma chambers based on such a simple analysis of seafloor topography, the real scienti- fic importance is not in the forecast itself but in the suc- cesful test of two important hypotheses: (1) a distinctive morphology of the ridge axis is linked to the local mag- ma supply, and (2) the fine-scale structure of the axial summit caldera is linked to the recent eruption history.
CONCLUSIONS
Precise mapping of the shape of the seafloor near rnid- ocean ridges, in concert with other studies, has revealed a great deal about the genesis and tectonic processes res- ponsible for the creation and evolution of oceanic crust. The mid-ocean ridge is segmented in a pattem which re- flects magma supply. There is a hierarchy of segmenta- tion such that short segments (=lo km) tend to be short- lived (102-105 yrs), while long segments may last for millions of years. Presumably, the longer the segment, the deeper source (i.e. 1000 km long hot spot centers tap the lower mantle, intermediate wavelength expressions of segmentation severa1 tens to hundreds of kilometers long tap sources in the upper mantle -50-60 km deep). The axial high at fast spreading centers is characterized by an axial surnrnit caldera along its crest. The 300-400 m ele- vation of the high is produced by the buoyancy of hot rock and magma beneath the newly created edges of the spreading plates. The elevation is not a volcanic cons- truction, so there is little vestige of it off-axis. At inter- mediate spreading rates, there is sufficicient cooling for a volcanic edifice to develop and sufficient thickening of the lithosphere on-axis for accumulation of strain and true normal faulting to occur. Splitting of axial volcanoes and axial grabens occur under these circumstances. Half- volcanoes, with their steep fault-bounded sides facing the spreading axis are preserved on the flanks of the ridge. Where axial nft valleys occur, at slow spreading centers and magma deficient intermediate-rate spreading centers, the neovolcanic zone lies within the inner floor of the rift valley. Numerous small conical volcanoes, which may coalesce into larger edifices, and elongated ridges created by fissure eruptions contribute to volcanic constructional terrain. On fast spreading ridges, the morphology and fi- ne-scale structure of the ridge is sufficiently sensitive to magma supply to permit forecasts of magma chamber lo- cations and even eruptions.
These are only a few examples taken largely from our own research of how useful precise measurements of seafloor topography can be. Many other examples could be cited; determining the history of and changes in plate motion; determining the relative importance of faulting, volcanism, sedimentation, and mass wasting in shaping the ocean floor; exploring the causes of linear seamount chains, and so on (e.g. Searle, 1992). Satellite measure-
ments have also provided low resolution glimpses of lar-ge uncharted areas of the seafloor (Marks et al., 1991).While we have emphasized the importance of topogra-phic measurements, marine geology/geophysics is verymuch an interdisciplinary area of research, and thecharts and structural maps reviewed here provide a com-mon base which draws together geochemists, seismolo-gists, structural geologists and even biologists and che-mists. Hopefully we will catch up with the successfulmission to map the surface of Venus before the end ofthe millennium. The long term goal is the constructionof a global-scale high resolution map of the seafloor thatwill define patterns of crustal evolution during the past200 my and provoke fundamental insights into processesthat shape the planet in space and time.
ACKNOWLEDGEMENTS
We thank ONR and NSF for the support of swath-mapping and ALVIN cruises which have made these ob-servations possible, and appreciate reviews by R. Hay-mon. A shortened version of this paper appeared in GSAToday in the January and February, 1993 issues. Spanishabstract, and Table and figure captions have been trans-lated by the editors.
REFERENCES
ATWATER, T., 1979: Constraints from the Famous area concerningthe structure of the oceanic section. In: M. Talwani, C.G. Harri-son and D.E. Hayes eds. Deep Drilling Results in the AtlanticOcean: Ocean Crust. pp. 33-42, Washington, Maurice Ewing Se-ries 2, AGU.
BALLARD, R.D. and VAN ANDEL, T.H., 1977: Morphology andtectonics of the inner rift valley at lat 36°50N on the Mid-AtlanticRidge. Geol. Soc. Am. Bull., 88: 507-530.
BICKNELL, J.D., SEMPERE, J.C., MACDONALD, K.C. and FOX,P.J., 1988: Tectonics of afast spreading center: A Deep-Tow andSeaBeam survey at EPR 19°30S. Mar. Geophys. Res., 9: 25-46.
BLACKMAN, D.K. and FORSYTH, D.W., 1991: Isostatic compensa-tion of tectonic features of the Mid-Atlantic Ridge: 25°S-27°30S.J. Geophys. Res., 96: 11741-11758.
BRYAN, W.B. and MOORE, J.G., 1977: Compositional variations ofyoung basalts on the Mid-Atlantic Ridge rift valley near 36°49N.Geol. Soc. Am. Bull., 88: 556-570.
CARBOTTE, S.M and MACDONALD, K.C., 1990: Causes of varia-tion in faulting-facing direction on the ocean floor. Geology, 18:749-752.
CARBOTTE, S.M and MACDONALD, K.C., 1992: East Pacific Rise8°N-10°30N: Evolution of ridge segments and discontinuitiesfrom SeaMARC II and three-dimensional magnetic studies. J.Geophys. Res., 97: 6959-6982.
CHOUKROUNE, P., FRANCHETEAU, J. and HEKINIAN, R., 1984:Tectonics of the East Pacific Rise near 12°50N: A submersiblestudy. Earth Planet. Sci. Lett., 68: 115-127.
CHRISTESON, G.L., PURDY, G.M. and FRYER, G.J., 1992: Struc-ture of young upper crust at the East Pacific Rise near 9°30N. Ge-ophys. Res. Lett., 19: 115-127.
COCHRAN, J.R., GOFF, J.A. MALINVERNO, A., FORNARI, D.,KEELEY, J. and WANG, X., 1993: Morphology of a "superfast"mid-ocean ridge crest and flanks: The East Pacific Rise 7°S-9°S.Mar. Geophys. Res., 15: 65-75.
CORMIER, M.H. and MACDONALD, K.C., 1991: Asymmetricspreading by rapid propagation of overlapping spreading centers.EOS Trans. AGU, 72: 506.
DAVIS, E.E., CURRIE, R.G., SAWYER, B.S. and KOSALOS, J.G.,1986: The use of swath bathymetric and acoustic image mappingtools in marine geoscience. Mar. Technol. Soc. J., 20: 17-27.
DETRICK, R.S., BUHL, P., VERA, E., ORCUTT, J., MADSEN, J. andBROCHER, T., 1987: Multi-channel seismic imaging of a crustalmagma chamber along the East Pacific Rise. Nature, 326: 35-41.
DETRICK, R.S., MUTTER, J.C., BUHL, P. and KIM, LI., 1990: Noevidence from multichannel reflection data for a crustal magmachamber in the MARK area on the Mid-Atlantic Ridge. Nature,347: 61-63.
DETRICK, R.S., HARDING, A.J., ORCUTT, J., KENT, G., BUHL,P., MUTTER, J. and VERA, E., 1991: A two ship multi-channelseismic reflection and OBS experiment on the East Pacific Risesouth of the Garrett fracture zone. EOS Trans. AGU, 72: 506.
DETRICK, R.S., HARDING, A.J., KENT, G.M., ORCUTT, J.A.,MUTTER, J.C. and BUHL, P., 1993: Seismic structure of thesouthern East Pacific Rise. Science, 259: 499-503.
FOX, P.J. and GALLO, D.G., 1984: A tectonic model for ridge-trans-form-ridge plate boundaries: Implications for the structure ofoceanic lithosphere. Tectonophysics, 104: 205-242.
FOX, P.J., GRINDLAY, N.R. and MACDONALD, K.C., 1991: TheMid-Atlantic Ridge (31°S-34°S): Temporal and spatial variationsof accretionary processes. Mar. Geophys. Res., 13: 1-20.
GRINDLAY, N.R., FOX, P.J. and MACDONALD, K.C., 1991: Se-cond-order ridge axis discontinuities in the South Atlantic: Mor-phology, structure and evolution. Mar. Geophys. Res., 13: 21-49.
HARDING, A.J., ORCUTT, J.A., KENT, G.M., DETRICK, R.S.,MUTTER, J.C., BUHL, P. and VERA, E.E., 1991: Ocean bottomseismograph experiments at 14°15S, 15°55S, and 17°15S on theEast Pacific Rise. EOS Trans. AGU, 72: 506.
HARDING, A.J., KENT, G.M. and ORCUTT, J.A., 1993: A multi-channel seismic investigation of upper crustal structure at 9°N onthe East Pacific Rise: Implications for crustal accretion. J. Geo-phys. Res., 98: 13925-13944.
HAYMON, R.M., FORNARI, D.J., EDWARDS, M.H., CARBOTTE,S., WRIGHT, D. and MACDONALD, K.C., 1991a: Hydrothermalvent distribution along the East Pacific Rise crest (9°09N-9°54N)and its relationship to magmatic and tectonic processes on fast-spreading mid-ocean ridges. Earth Planet. Sci. Lett., 104: 513-534.
30
HAYMON, R.M. and 17 others, 1991b: Eruption of the EPR crest at 9'45N-9'52N since late 1989 and its effects on hydrothermai ven- ting: Results of the ADVENTURE Program, an ODP site survey with ALVIN. EOS Trans. AGU. 72: 480.
HAYMON, R.M. and 18 others, 1991c: Active eruption seen on East Pacific Rise. EOS Trans. AGU. 72: 505-507.
HAYMON, R.M. and 14 others, submitted: Volcanic eruption of the mid-ocean ndge along the East Pacific Rise crest at 9"45-9'52N: 1. Direct submersible observations of seafloor phenomena associa- ted with an eruption event in Apnl, 1991. Earth Planet. Sci. Lett.
HEAD, J.W. and SAUNDERS, R.S., 1991: Geology of Venus: A pers- pective from early Magellan Mission results. GSA Today, 11 49- 60.
HEKINIAY, R., RENARD, V. and CHEMINEE, J.L., 1984: Hydro- thermal deposits on the East Pacific Rise near 13"N: Geologicai setting and distribution of activew suifide chimneys. In: P.A. Ro- na, K. Bostrom, L. Laubier and K. Smith eds. Hydrothermal pro- cesses at spreading centers. pp. 571-594, New York, Plenum Publ. Co.
KAPPEL, E.S. and RYAN, W.B.F., 1986: Volcanic episodicity and a non-steady state nft vailey aiong norteast Pacific spreading cen- ters: Evidence from SeaMARC 1. J. Geophys. Res., 91: 13925- 13940.
KAPPUS, M.E., HARDING, J.A. and ORCUTT, J.A., 1992: Cons- traints on the support of axiai topography along the East Pacific Rise based on the velocity structure of the upper crust. EOS Trans. AGU, 73: 274.
KONG, L.S.L., DETRICK, R.S., FOX, P.J., MAYER, L.A. and RYAN, W.B.F., 1988: The morphology and tectonics of the MARK area from SeaBeam and SeaMARC 1 observations. Mar. Geophys. Res., 10: 59-90.
KUO, B.Y. and FORSYTH, D.W., 1988: Gravity anomaiies of the Ridge-Transform system in the South Atlantic between 31"s and 34'30s: Upwelling centers and variations in crustai thickness. Mar. Geophys. Res., 10: 205-232.
LANGMLTIR, C.H., BENDER, J.F. and BATIZA, R., 1986: Petrologi- cal and tectonic segmentation of the East Pacific Rise, 5"30N- 14'30N. Nature, 322: 422-429.
LIN, J., PURDY, G.M., SCHOUTEN, H., SEMPERE, J.C. and ZER- VAS, C., 1990: Evidence from gravity data for focussed magmatic accretion aiong the Mid-Atlantic Ridge. Nature, 344: 627-632.
LIN, J. and PHIPPS MORGAN, J., 1992: The spreading rate depen- dence of three-dimensional mid-ocean ridge gravity structure. Geophys. Res. Lett., 19: 13-16.
LONSDALE, P., 1977: Structurai geomorphology of a fast-spreading rise crest: The East Pacific Rise near 3'25s. Mar. Geophys. Res., 3: 251-293.
LONSDALE, P., 1985: Nontransform offsets of the Pacific-Cocos pla- te boundary and their traces on the rise flank. Geol. Soc. Am. Bull., 96: 313-327.
LONSDALE, P., 1989: Segmentation of the Pacific-Nazca spreading center 1°N-20's. J. Geophys. Res., 94: 12197-12226.
LLrYENDYK, B.P. and MACDONALD, K.C., 1985: A geological tran- sect across the crest of the East Pacific Rise at 21°N latitude made from the deep submersible ALm. Mar. Geophys. Res., 7: 467-488.
MACDONALD, K.C., 1982: Mid-Ocean Ridges: Fine scale tectonic, volcanic and hydrothermai processes within the plate boundary zone. Ann. Rev. Earth Planet. Sci.. 10: 155-190.
MACDONALD, K.C., 1986: The crest of the Mid-Atlantic Ridge: Mo- dels for crustal generation processes and tectonics. In: P.R. Vogt and B.E. Tucholke eds. The Geology of North America. The Wes- tern North Atlantic Region. Vol. M, pp. 51-68. Boulder, Colorado. Geol. Soc. Am.
MACDONALD, K.C., 1990: A slow but restless ridge. Nature, 348: 108-109.
MACDONALD, K.C., 1991: The East Pacific Ridge south of Garrett: Volcanic activity predicted for 14"-14"30S. EOS Trans. AGU, 72: 506.
MACDONALD, K.C. and FOX, P.J., 1988: The axial summit graben and cross-sectional shape of the East Pacific Rise as indicators of axiai magma chambers and recent volcanic eruptions. Earth Pla- net. Sci. Lett., 88: 119-131.
MACDONALD, K.C. and FOX, P.J., 1990: The mid-ocean ridge. Scient. Am., 262: 72-79.
MACDONALD, K.C. and LUYENDYK, B.P., 1977: Deep-tow stu- dies of the structure of the Mid-Atlantic Ridge crest near lat 37ON. Geol. Soc. Am. Bull., 88: 621-636.
MACDONALD, K.C., MLLER, S.P., HUESTIS, S.P. and SPIESS, F.N., 1980: Three-dimensional modelling of a magnetic reversal boundary from inversion of deep-tow measurements. J. Geophys. Res., 85: 3670-3680.
MACDONALD, K.C., MILLER, S.P., LUYENDYK, B.P., ATWATER, T.M. and SHURE, L., 1983: Investigation of a Vine-Matthews mag- netic lineation from a submersible: The source and character of mari- ne magnetic anomalies. J. Geophys. Res., 88: 3403-3418.
MACDONALD, K.C., SEMPERE, J.C. and FOX, P.J., 1984: East Paci- fic Rise from Siqueiros to orozco fracture zones: Along-strike conti- nuity of axial neovolcanic zone and structure and evolution of over- lapping spreading centers. J. Geophys. Res., 89: 6049-6069.
MACDONALD, K.C., SEMPERE, J.C., FOX, P.J. and TYCE, R., 1987: Tectonic evolution of rdige-axis discontinuities by the mee- ting, linking, or seif-decapitation of neighboring ridge segments. Geology, 15: 993-997.
MACDONALD, K.C., FOX, P.J., PERRAM, L.J., EISEN, M.F., HAYMON, R.M., MILLER, S.P., CARBOTTE, S.M., COR- MIER, M.H. and SHOR, A.N., 1988: A new view of the mid-ocean ridge from the behavior of ridge-axis discontinuities. Nature, 335: 217-225.
MACDONALD, K.C., HAYMON, R.M. and SHOR, A.N., 1989: A 220 km2 recently erupted lava field on the East Pacific Rise near 8's. Geology, 17: 212-216.
MACDONALD, K.C., SCHEIRER, D.S. and CARBOTTE, S.M., 1991: Mid-ocean ridges: Discontinuities, segments and giant cracks. Science, 253: 986-994.
MACDONALD, ]<.C., FOX, P.J., MLLLER, S.P., CARBOTTE, S.M., EDWARDS, M., EISEN, M., FORNARI, D.J., PERRAM, L.J., POCKALNY, R., SCHEIRER, .D., TIGHE, S., WEILAND, C. and WILSC)N, D., 1992: The East Pacific Rise and its flanks 8"N-18"N: History of segmentation, propagation and spreading direction based on SeaMARC 11 aild SeaBeam studies. Mar. Geophys. Res., 14: 299-344.
MARKS, K.M., MCADOO, D.C. and SATDWELL, D.T., 1991: Geo- sat GM data reveai new details of ocsan floor. EOS Trans. AGU, 72: 145-149.
NORMARK, W.R., 1976: Delineation of the main extrusion zone of the East Pacific Rise at lat 21°N. Geology, 4: 681-685.
PERRAM, L.J. and MACDONALD, K.C., 1990: A one-million-year history of the 11°45N East Pacific Rise discontinuity. J. Geophys. Res., 95: 21363-21381.
POCKALNY, R.A., DETRICK, R.S. and FOX, P.J., 1988: Morpho- logy and tectonics of the Kane transform from SeaBeam bathyme- tnc data. J. Geophys. Res., 93: 3179-3:193.
PURDY, G.M., KONG, L.S.L., CHRISTESON, G.L. and SOLO- MON, S.C., 1992: Relationship between spreading rate and the seismic structurtt of mid-ocean ndges. ,Vature, 355: 815-817.
RENARD, V., HEIWIAN, R., FRANCIlTEAU, J., BALLARD, R.D. and BACiKER, H., 1985: Submersible observations at the axis of the ultra-fast spreading East Pacific Rise (17'30s to 2lC30S). Earth ,Planet. Sci. Lett., 75: 339-353.
RENARD, V., VOISSET, M. and NEEDRAM, H.D., 1991: The rese- arch vessel L'Atalante's mapping system: The EM12 duai echo- sounder. Evaluiition of its performarice for mid-oceanic ndge bathymetric investigations. EOS Trans. AGU, 72: 470.
ROHR, K.M.M., PIJRDY, G.M. and MDCEREIT, B., 1992: Upper oceanic crust: lateraily homogeneous or heterogeneous? EOS Trans. AGU, 73: 274.
RUBIN, K.H. and MACDOUGALL, J.D., 1991: Fine chronology of recent mid-ocean ndge eruptions on ihe southem JDF and 9ON EPR from 226Ra-230Th-238U and 21OPo-210Pb disequilibrium. EOS Trans. AGU. 72: 231.
SCHEIRER, D.S. and MACDONALD, K.C., 1991: Variation of the axiai cross-sectional area aiong the nortllem and southem East Pa- cific Rise. EOS Trans. AGU. 72: 506.
SCHEIRER, D.S. and MACDONALD, K.C., in press: The variation in cross-sectional airea of the axial ridge along the East pacific Rise: Evidence for the magmatic budget of :a fast-spreading center. J. Geophys. Res.
SCHOUTEN, H., Ki.ITGORD, K.D. and WHITEHEAD, J.A., 1985: Segmentation of mid-ocean ndges. Nature, 317: 225-229.
SCLATER, J.G., ANIDERSON, R.N. and BELL, M.L., 197 1: The ele- vation of ndges ,and the evolution of the central Pacific. J. Geo- phys. Res., 76: 7888-7915.
SEARLE, R.C., 1992: The volcano-tecto~c setting of oceanic lithos- phere generation. In: L.M. Parson, B.J. Murton and P. Browning eds. Ophiolites and their modern oceanic analogues. pp. 65-79. Geol. Soc. London Sp. Publ., No 60.
SEARLE, R.C. and LAUGHTON, A.S., 1977: Sonar studies of the Mid-Atlantic Ridge and Kurchatov fracture zone. J. Geophys. Res., 82: 5313-5328.
SEMPERE, J.C., PURDY, G.M. and SCHOUTEN, H., 1990: Scgmen- tation of the Mid-Atlantic Ridge between 24"N and 30°40N. Natu- re, 344: 427-43 1.
SEMPERE, J.C., PALMER, J., CHRISTIE, D.M., PHIPPS MOR- GAN, J. and SHOR, A.N., 1991: Australian-Antarctic discordan- ce. Geology, 19: 429-432.
SINTON, J.M. and DETRICK, R.S., 1992: Mid-ocean ridge magma chambers. J. Geophys. Res., 97: 197-216.
SMITH, D.K. and CANN, J.R., 1990: Hundreds of small volcanoes on the median valley floor of the Mid-Atlantic Ridge at 24'-30C?i. Nature, 348: 1523-1525.
SMITH, D.K. and CANN, J.R., 1992: The role of seamount volcanism in crustal construction at the Mid-Atlantic Ridge (24"-30eN). J. Geophys. Res., 97: 1645-1658.
SOLOMON, S.C. and TOOMEY, D.R., 1992: The structure of mid- ocean ridges. Ann. Rev. Earth Planet. Sci., 20: 329-364.
SPIESS, F.N. and TYCE, R.C., 1973: Marine physical laboratory deep tow instrumentation system. SI0 . Ref. 73-4, 73 p.
TIGHE, S.A and FOX, P.J., 1991: Formation of abyssal hills at fast spreading centers by axiai volcanic subsegments. EOS Trnns. AGU, 72: 465-466.
TOOMEY, D.R., PURDY, G.M., SOLOMON, S.C. and WILCOCK, W.S.D., 1990: The three-dimensional seismic velocity structure of the East Pacific Rise near latitude 9"30N. Nature. 347: 639-645.
TYCE, R.C., 1987: Deep seafloor mapping systems - A review. Mar. Technol. Soc. J. , 20: 4-16.
VERA, E.E., MUTTER, J.C., BUHL, P., ORCUTT, J.A., HARDING, A.J., KAPPUS, M.E., DETRICK, R.S. and BROCHER, T.M., 1990: The structure of O to 0.2 my old oceanic crust at 9"N on the East Pacific Rise from expanded spread profiles. J. Geophys. Res., 95: 15529-15556.
WILSON, D.S., 1990: Kinematics of overlapping rift propagation with cyclic nft failure. Earth Planet. Sci. Lett., 96: 384-392.
SEARLE, R.C., 1984: GLORIA survey of the East Pacific Rise near 3"30S: Tectonic and volcanic characteristics of a fast spreading mid-ocean rise. Tectonophysics, 101: 31!>-344.


![Ticagrelor - CADIME · inestable, infarto de miocardio sin elevación del segmento ST [IMSEST] o infarto de miocardio con elevación del segmento ST [IMCEST]), incluidos los pacientes](https://img.pdfslide.us/doc/110x75/5ba4661709d3f2c0278d5ec2/ticagrelor-inestable-infarto-de-miocardio-sin-elevacion-del-segmento-st.jpg)