Embed Size (px)
Citation preview

© Polish Academy of Sciences (PAN) in Warsaw, 2017; © Institute of Technology and Life Sciences (ITP) in Falenty, 2017
© Polish Academy of Sciences (PAN), Committee on Agronomic Sciences JOURNAL OF WATER AND LAND DEVELOPMENT Section of Land Reclamation and Environmental Engineering in Agriculture, 2017 2017, No. 32 (I–III): 13–23 © Institute of Technology and Life Sciences (ITP), 2017 PL ISSN 1429–7426 Available (PDF): http://www.itp.edu.pl/wydawnictwo/journal; http://www.degruyter.com/view/j/jwld
Received 10.09.2016 Reviewed 20.10.2016 Accepted 03.11.2016 A – study design B – data collection C – statistical analysis D – data interpretation E – manuscript preparation F – literature search
Mapping erosion prone areas in the Bouhamdane watershed (Algeria) using the Revised Universal Soil Loss Equation through GIS
Hamza BOUGUERRA1) BCDEF, Abderrazak BOUANANI1) ADF, Kamel KHANCHOUL2) ABC, Oussama DERDOUS3) DEF ,
Salah Eddine TACHI4) DE
1) University Abou Bakr Belkaid, Faculty of Technology, Department of Hydraulic, Laboratory No 25, BP 119 Tlemcen, 13000, Algeria; e-mail: [email protected]; [email protected]
2) University Badji Mokhtar, Faculty of Earth Sciences, Department of Geology, BP 12 Annaba, 23000, Algeria; e-mail: [email protected]
3) University Kasdi Merbah, Faculty of Applied Sciences, Department of civil engineering and hydraulic, Route Ghardaïa, BP 511, Ouargla, 30000, Algeria; e-mail: [email protected]
4) University Hassiba Ben Bouali Chlef, Laboratory of Water and Energy, Hay Salem National road Nr 19, Chlef 02000, Algeria; e-mail: [email protected]
For citation: Bouguerra H., Bouanani A., Khanchoul K., Derdous O., Tachi S.E. 2017. Mapping erosion prone areas in the Bouhamdane watershed (Algeria) using the Revised Universal Soil Loss Equation through GIS. Journal of Water and Land Development. No. 32 p. 13–23. DOI: 10.1515/jwld-2017-0002
Abstract
Soil erosion by water is a major problem that the Northern part of Algeria witnesses nowadays; it reduces: the productivity of agricultural areas due to the loss of lands, and leads to the loss of storage capacity in reser-voirs, the deterioration of water quality etc. The aim of this study is to evaluate the soil losses due to water ero-sion, and to identify the sectors which are potentially sensitive to water erosion in the Bouhamdane watershed, that is located in the northeastern part of Algeria. To this end, the Revised Universal Soil Loss Equation (RUSLE) was used. The application of this equation takes into account five parameters, namely the rainfall erosivity, to-pography, soil erodibility, vegetative cover and erosion control practices. The product of these parameters under GIS using the RUSLE mathematical equation has enabled evaluating an annual average erosion rate for the Bou-hamdane watershed of 11.18 t·ha–1·y–1. Based on the estimates of soil loss in each grid cell, a soil erosion risk map with five risk classes was elaborated. The spatial distribution of risk classes was 16% very low, 41% low, 28% moderate, 12% high and 3% very high. Most areas showing high and very high erosion risk occurred in the lower Bouhamdane watershed around Hammam Debagh dam. These areas require adequate erosion control prac-tices to be implemented on a priority basis in order to conserve soil resources and reduce siltation in the reser-voir.
Key words: Algeria, Bouhamdane Watershed, GIS, Reservoir of Hammam Debagh, RUSLE, siltation, soil erosion
INTRODUCTION
Water erosion is widespread phenomenon in the watersheds. It is the grignotage of the soil surface by
water from raindrop, runoff, snowmelt, and irrigation. The raindrops affect the surface and go in the form of runoff which is the main factor of water erosion. Soil erosion by water is a very widespread phenomenon in
DOI: 10.1515/jwld-2017-0002

14 H. BOUGUERRA, A. BOUANANI, K. KHANCHOUL, O. DERDOUS, S.E. TACHI
© PAN in Warsaw, 2017; © ITP in Falenty, 2017; Journal of Water and Land Development. No. 32 (I–III)
North Africa, especially in the Maghreb countries (Algeria, Tunisia and Morocco). The specific erosion rates exceed the tolerance thresholds in many areas in the northern part of the Maghreb region; DEMMAK [1982] observed an erosion rate of about 50 t·ha–1·y–1 at the Agrioum River northeastern Algeria. SAIDI [1991] states in his study that the specific erosion rates of the Fodda River (Chellif region) passed 20 t·ha–1·y–1. BENBRAHIM et al. [2004] recorded in Mo-rocco, a soil degradation by water erosion of above 35 t·ha–1·y–1, at Telata River (Western Rif), Lebene River (Prerif) and Ourgha River (Prerif).
In Algeria, the regularized volume in the 64 oper-ating large dams is getting reduced significantly due to the sediment discharge and its accumulation in res-ervoirs. According to the latest bathymetric surveys (2004–2005) conducted by the National Agency of Dams and Transfers; the loss of storage capacity rep-resents 13 % of the initial storage capacity.
The Hammam Debagh Dam (Guelma Province) is amongst the dams seriously affected by siltation. This reservoir lost about 16 hm3 of storage capacity be-tween 1988 and 2004. A situation that compelled us to study water erosion in the watershed feeding the Hammam Debagh dam.
During the last 30 years the Revised Universal Soil Loss Equation (RUSLE) [RENARD et al. 1997; WISCHMEIER, SMITH 1978] was applied widely by hydrologist for predicting erosion risk in Africa [ADE-DIJI et al. 2010; ANGIMA et al. 2003; ANYS 1991; ANYS et al. 1994; BENKADJA et al. 2015; BONN 1998; CHEN et al. 2008; FAGBOHUN et al. 2016; LIGONJA, SHRESTHA 2013; MATI, VEIHE 2001; MEDDI et al. 2016; SMITH 1999]. In this paper, the RUSLE model was applied to quantify soil losses and to map erosion prone areas in the Hammam Debagh watershed.
The thematic layers that represent the implied factors in the RUSLE equation were developed and combined in Geographical Information System (GIS) environment. The results showed a very high annual degradation rate and identified high degradation areas that require urgent intervention in the Bouhamdane watershed.
STUDY AREA
The Bouhamdane watershed, sub-basin of the Seybouse watershed is located north-eastern Algeria between the longitude 6°47'02"and 7°14'44" E and between 36°30'28" and the latitude 36°07'49" N, 150 km from the Algerian-Tunisian border (Fig. 1).
The Bouhamdane River starts at Bordj Sabath in the junction of Sabath and Zenati rivers; it is one of the main tributaries of the Seybouse River. The water-shed has an area of 1056 km2 and a perimeter of 186 km, which give it an elongated shape (Kc = 1.62). The minimum altitude in the basin is 299 m, while the highest point is at the summit of Oum Settas Moun-tain at 1325 m. The watershed basin has a very rough
Fig. 1. Localization of the study area;
source: own elaboration
heterogeneous relief (Fig. 1) characterized by middle- -class to steep slopes.
The study area is dominated by a Mediterranean climate, with a semiarid Southern part receiving an average annual rainfall of 497 mm and a sub-humid northern part where the average annual rainfall is about 618 mm·y–1, while the average annual tempera-ture recorded in Guelma meteorological station is 17.85°C. Two periods can be distinguished; a rela-tively cold and rainy period ranging from November to April with a minimum of 7.2°C recorded in Febru-ary and a hot and dry period from May to October with a maximum degree of 29.7°C recorded in July.
MATERIALS AND METHODS
The soil loss empirical model RUSLE [RENARD et al. 1997] was used to assess the erosive potential in the Bouhamdane watershed. The model was previ-ously proposed by WISCHMEIER and SMITH [1978] in which soil loss in t·ha–1·y–1 is determined at a pixel scale. The map of soil loss is obtained as a product of five factors: rainfall erosivity factor (R), topography (LS), soil erodibility (K), cover-management (C) and support practice (P).
The RUSLE model has been integrated into a geographic information system (GIS). All thematic maps of factors affecting water erosion were devel-oped on an existing database. The superposition of all physical and anthropogenic factors that control the

Mapping erosion prone areas in the Bouhamdane watershed (Algeria) using the Revised Universal Soil Loss Equation… 15
© PAN in Warsaw, 2017; © ITP in Falenty, 2017; Journal of Water and Land Development. No. 32 (I–III)
Fig. 2. Chart of the adopted methodology; source: own elaboration
erosion phenomenon was conducted in raster mode based on the RUSLE mathematical equation:
A = R·LS·K·C·P (1)
The flowchart below (Fig. 2) summarizes all the steps taken to quantify the average annual loss of soil and to assess the vulnerability of soil towards water erosion throughout the Bouhamdane watershed.
R FACTOR
To calculate the annual rainfall erosivity factor in the Bouhamdane watershed, the empirical formula of HEUSCH [1971] developed in Morocco was chosen. This formula takes into account the average annual precipitation and the maximum precipitation in 24 hours on a 20 years return period.
( ) 7,89log143 6
224
10+⋅= PPR (2)
where: R = rainfall erosivity factor (MJ·mm·ha–1· h–1·y–1), P = average annual precipitation (mm); P24 = maximum precipitation in 24 hours of 20 years return period (mm).
The meteorological data used in this study to es-timate the rainfall erosivity factor (R) have been pro-vided by the National Agency of Hydraulic Resources (ANRH) in the form of thematic maps. The first is the map of average annual precipitation in the north of Algeria established by the Hydrological Department in 1993 after an observation period extending from September 1921 until August 1989. Isohyets lines
from the average annual precipitation map of the ANRH were digitized in GIS then interpolated throughout the entire watershed using Topo to Raster interpolation tool (Fig. 3).
According to the average annual precipitation in the Bouhamdane watershed (Fig. 3), a strong North-South gradient is observed with a difference of about 300 mm between the highest and lowest precipita-tions. The GIS interpolation allowed estimating about 575 mm·y–1 as an average annual precipitation in the watershed.
Fig. 3. Map of average annual precipitation
in the Bouhamdane watershed; source: own elaboration

16 H. BOUGUERRA, A. BOUANANI, K. KHANCHOUL, O. DERDOUS, S.E. TACHI
© PAN in Warsaw, 2017; © ITP in Falenty, 2017; Journal of Water and Land Development. No. 32 (I–III)
The spatial distribution of the maximum daily precipitations of decadal frequency in northern Alge-ria, which was carried out on the basis of the maxi-mum daily rainfall records for 38 years, was used to estimate the maximum daily rainfall of 20-years re-turn period through the Montana formula [REMI-NIERAS 1976]:
P(t,T) = a(T)·t(T)–b (3)
where: P = maximum daily precipitation during a re-turn period T (20 years) and duration of precipitation t (24 h), a(T) and b = the Montana coefficients in the studied region.
The transition to maximum precipitation in 24 hours is done by applying Weiss coefficient (Kw) that ranges from 1.114 to 1.141 South to North.
LS FACTOR
The topographic factor (LS), combines two pa-rameters, namely the length of the slope (L) and its inclination (S), which have a significant impact on the runoff regime and consequently on water erosion. The volume and speed of runoff increase when the length and inclination of watershed slope increase.
Many authors such as MOORE, BURCH [1986], MCCOOL et al. [1989], MOORE, WILSON [1992], DESMET, GOVERS [1996], MITASOVA et al. [1996], HICKEY [2000], have modified the original equation of topographic factor (LS) established by WISCH-MEIER and SMITH [1965]. The equation adopted in this article is the one modified by MITASOVA et al. [1996] due to its simplicity and efficiency, the principle of this method is to replace the slope-length by the up-slope contributing area, its application is appropriate when cell resolution varies from 2 to 20 m. The equa-tion is expressed as follow:
( ) ( )nml
UmLS αβsin)1( ⋅⋅+= (4)
where: LS = topographic factor (–), U = upslope con-tributing area per unit width (m2·m–1), l = length of the standard USLE plot (22.1 m), α = slope of the stan-dard USLE plot (9%), β = angle of slope (°), m = ex-ponent related to the ratio of rill to inter-rill erosion, n = exponent related to the steepness of the slopes.
The values of the constants m and n are respec-tively between (0.2–0.6) and between (1.0–1.3) [NE-TELER, MITASOVA 2004] where the lowest values promote a process of diffuse erosion while the highest values promote a process of rill and gully erosion.
MOORE and WILSON [1992] have demonstrated that for the slopes of less than 100 m high and less than 14° of inclination; m = 0.6 and n = 1.3 provide consistent results in the LS factor calculation.
A digital elevation model (DEM) Type SRTM 1 Arc-Second resolution downloaded from the official website of the USGS (US Geological Survey) was used. The DEM was firstly pre-processed in GIS
using the fill tool to correct erroneous sinks and peaks, and then it was used to generate upslope con-tributing areas by calculating flow directions and ac-cumulations. To end, the computation of the topog-raphic factor (LS) in each pixel was performed in the GIS raster calculator using equation (4).
K FACTOR
The Soil erodibility factor (K factor) characterizes the soil particles resistance to particles detachment and transport by water. It depends on the soils intrin-sic properties and their evolution under the influence of cultivation techniques [ROOSE, SARRAILH 1990].
Generally, the K factor is determined by the de-limitation of homogeneous soils from a soil map and then assigning to each soil type a K value based on recognized standards. However, in the present study detailed soil maps of the study area are not available. To overcome this deficiency, we used the results of the studies obtained by the National Office of For-estry Studies of 1988 which determined the physical and chemical properties of 71 soil profiles distributed in the entire Bouhamdane watershed (Fig. 4). We fo-cused particularly on the analysis results at the upper layer (0–30 cm deep) because of water erosion phe-nomenon occurs mainly in this layer.
Fig. 4. Distribution of soil profiles analyzed
in the Bouhamdane watershed; source: own elaboration based on the National of Forestry Studies’ data
Based on the soil texture, the main parameter that influences soil erodibility according to STONE and HILBORN [2012] and the organic matter contents (OMC) for each profile, the value of K factor is ob-tained from the correlation table of STONE and HIL-BORN [2012]. The values obtained from table ex-pressed in (t·ha–1) are converted into (t·ha·h·ha–1· MJ–1·mm–1) (Tab. 1) using the conversion parameters of the Universal Soil Loss Equation [FOSTER et al. 1981].
Mapping erosion prone areas in the Bouhamdane watershed (Algeria) using the Revised Universal Soil Loss Equation… 17
© PAN in Warsaw, 2017; © ITP in Falenty, 2017; Journal of Water and Land Development. No. 32 (I–III)
Table 1. K factor values according to the soil texture and organic matter
Soil erodibility factor t·ha·h·ha–1·MJ–1·mm–1 General soil
texture Detailed soil textureless than 2% OMC
more than2% OMC
average OMC
clay (Cl) 0.0317 0.0276 0.0288 silty clay (SiCl) 0.0358 0.0341 0.0341
Fine
sandy clay (SaCl) – – – clay loam (ClLo) 0.0435 0.0370 0.0394 silty clay loam (SiClLo)
0.0464 0.0394 0.0423 Moderately fine
sandy clay loam (SaClLo)
– 0.0264 0.0264
loam (Lo) 0.0446 0.0341 0.0394 silty loam (SiLo) 0.0540 0.0488 0.0499
Medium
silt (Si) – – – Moderately coarse
sandy loam (SaLo) 0.0182 0.0159 0.0170
loamy sand (LoSa) 0.0065 0.0053 0.0053 Coarse sand (Sa) 0.0041 0.0012 0.0023
Source: own elaboration.
The spatialization of soil erodibility factor throughout the Bouhamdane watershed was con-ducted according to the principle of ordinary kriging, using the values of the K factor attributed to the 71 profiles.
C FACTOR
The C factor of vegetation cover and management is the soil erosion ratio under a well-defined cover comparing to erosion of bare soil. It shows the influ-ence of vegetation cover and cultivation techniques on water erosion. This factor varies from 1 on bare soil to 0.003 under a dense forest [WISCHMEIER, SMITH 1978].
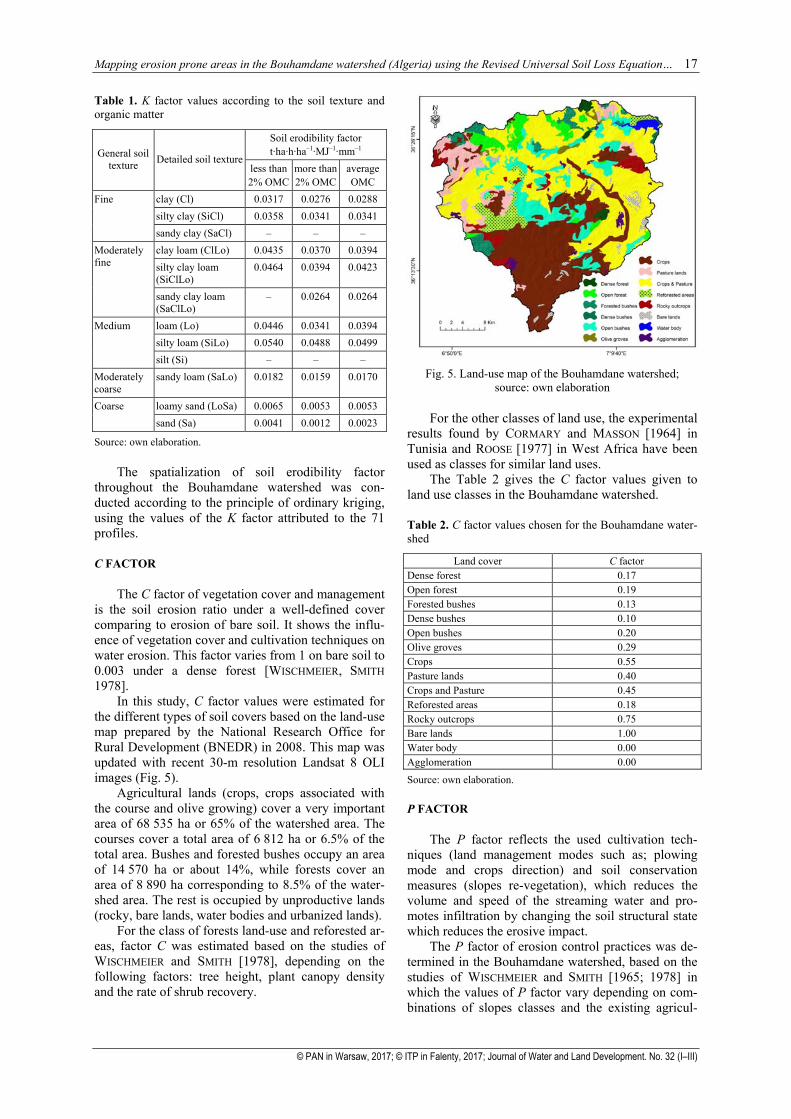
In this study, C factor values were estimated for the different types of soil covers based on the land-use map prepared by the National Research Office for Rural Development (BNEDR) in 2008. This map was updated with recent 30-m resolution Landsat 8 OLI images (Fig. 5).
Agricultural lands (crops, crops associated with the course and olive growing) cover a very important area of 68 535 ha or 65% of the watershed area. The courses cover a total area of 6 812 ha or 6.5% of the total area. Bushes and forested bushes occupy an area of 14 570 ha or about 14%, while forests cover an area of 8 890 ha corresponding to 8.5% of the water-shed area. The rest is occupied by unproductive lands (rocky, bare lands, water bodies and urbanized lands).
For the class of forests land-use and reforested ar-eas, factor C was estimated based on the studies of WISCHMEIER and SMITH [1978], depending on the following factors: tree height, plant canopy density and the rate of shrub recovery.
Fig. 5. Land-use map of the Bouhamdane watershed;
source: own elaboration
For the other classes of land use, the experimental results found by CORMARY and MASSON [1964] in Tunisia and ROOSE [1977] in West Africa have been used as classes for similar land uses.
The Table 2 gives the C factor values given to land use classes in the Bouhamdane watershed.
Table 2. C factor values chosen for the Bouhamdane water-shed
Land cover C factor Dense forest 0.17 Open forest 0.19 Forested bushes 0.13 Dense bushes 0.10 Open bushes 0.20 Olive groves 0.29 Crops 0.55 Pasture lands 0.40 Crops and Pasture 0.45 Reforested areas 0.18 Rocky outcrops 0.75 Bare lands 1.00 Water body 0.00 Agglomeration 0.00
Source: own elaboration.
P FACTOR
The P factor reflects the used cultivation tech-niques (land management modes such as; plowing mode and crops direction) and soil conservation measures (slopes re-vegetation), which reduces the volume and speed of the streaming water and pro-motes infiltration by changing the soil structural state which reduces the erosive impact.
The P factor of erosion control practices was de-termined in the Bouhamdane watershed, based on the studies of WISCHMEIER and SMITH [1965; 1978] in which the values of P factor vary depending on com-binations of slopes classes and the existing agricul-

18 H. BOUGUERRA, A. BOUANANI, K. KHANCHOUL, O. DERDOUS, S.E. TACHI
© PAN in Warsaw, 2017; © ITP in Falenty, 2017; Journal of Water and Land Development. No. 32 (I–III)
tural practices. These practices were identified in the study area using the land management map, visual interpretation of aerial photographs and field observa-tions.
The main cultural practices that exist in the study area are the polyculture system based on mountain arboriculture associated with a wide range of annual crops. Plowing in the opposite direction of the slope and some fodder plantations (strip cropping parallel to contour lines) are seen in lands of medium and steep slopes.
RESULTS AND DISCUSSION
R FACTOR
According to the distribution trends of rainfall erosivity factor (R) in the Bouhamdane watershed (Fig. 6), it is evident that R values increase from the semi-arid climate of the south to the northern part dominated by a sub-humid climate.
Fig. 6. R factor (MJ·mm·ha–1·h–1·y–1) distribution map
in the Bouhamdane watershed; source: own study
Overall, the Bouhamdane watershed has rela-tively moderate annual rainfall aggressiveness with an average of 198 MJ·mm·ha–1·h–1·y–1. While the average annual values of R factor range from 160 to 240 MJ·mm·ha–1·h–1·y–1.
Figure 7 shows that over one third of the Bou-hamdane watershed area is characterized by a high degree of rainfall aggressiveness. While nearly half of the area surface is characterized by moderate aggres-siveness.
LS FACTOR
Using the empirical formula of MITASOVA et al. [1996] have come to the estimation of topographic factor between 0 and 41.79 (Fig. 8). This difference is explained by the relief heterogeneity in our study area.
Fig. 7. Distribution of rainfall erosivity classes;
source: own study
Fig. 8. LS factor distribution map in the Bouhamdane
watershed; source: own study
On average, the Bouhamdane watershed has an LS factor value of 5.76. Larger values are located in northeastern parts of the watershed where high and very high slopes dominate.
K FACTOR
On the Bouhamdane watershed, the K factor of soil erodibility (Fig. 9) has an average value of 0.023 t·ha·h·ha–1·MJ–1·mm–1, which is relatively high. The values of this factor vary from 0.0016 to 0.0342 t·ha·h·ha–1·MJ–1·mm–1; low values located in the northwest of the watershed are explained by the coarse soils that promote the infiltration to the detri-ment of runoff.
According to the classification of soils resistance to erosion by BOLLINNE and ROSSEAU [1978] which is based on the K factor, nearly three-quarters of the studied watershed area is sensitive to erosion, while less than a quarter of the total area is classified as ero-sion-resistant soils (Tab. 3). This high erodibility is due to the loamy silty clay texture dominating the Bouhamdane watershed.
Area
, %
F factor
Rainfall erosivity classes
LS factor

Mapping erosion prone areas in the Bouhamdane watershed (Algeria) using the Revised Universal Soil Loss Equation… 19
© PAN in Warsaw, 2017; © ITP in Falenty, 2017; Journal of Water and Land Development. No. 32 (I–III)
Fig. 9. K factor (t·ha·h·ha–1·MJ–1·mm–1) distribution map in
the Bouhamdane watershed; source: own study
Table 3. Classification of soil resistance at the Bouhamdane watershed according to BOLLINNE and ROSSEAU
Area Erodibility Erodibility
m Classification ha %
< 0.10 < 0.0059 very resistant to erosion 8,734.31 8.27
0.10 to 0.25 0.0059 to 0.0147 resistant to erosion 13,940.13 13.20
0.25 to 0.35 0.0147 to 0.0206
medium resistance to erosion 7,308.22 6.92
0.35 to 0.45 0.0206 to 0.0264 sensitive to erosion 10,180.79 9.64
> 0.45 > 0.0264 very sensitive to erosion 65,436.55 61.97
Source: own study.
C FACTOR
Cover-management factor C was evaluated in all over the Bouhamdane watershed (Fig. 10) based on the researches of WISCHMEIER and SMITH [1978], CORMARY and MASSON [1964] and ROOSE [1977]. The values of this factor range from 1 on bare soil to 0.17 on a ground protected by a dense forest cover with a shrub recovery rate estimated at 25% according to field surveys. The C factor average value which is relatively high and estimated at 0.42 is explained by the presence of a vast agricultural area.
The bar-graph below (Fig. 11) shows that about a quarter of the watershed area has a low to very low vegetation cover factor. This area is usually home to forests and Shrubs that are spread everywhere. Over 70% of moderate C factor area is occupied by agricul-tural land (crop and associated cultures), while less than 5% of Bouhamdane watershed area is character-ized by a high to very high C factor. Generally this land is unproductive.
Fig. 10. C factor distribution map in the Bouhamdane
watershed; source: own study
Fig. 11. Distribution of cover-management classes;
source: own study
P FACTOR
The last factor (P) of the Revised Universal Soil Loss Equation in Bouhamdane watershed as shown in (Fig. 12) vary from 0.1 to 1 depending on the cultiva-tion method and on slope classes. The average value of P factor is relatively high (0.93) at the Bouham-dane watershed, this value is explained by the lack of support practices in 80% of the total area where the P factor is 1. In the rest (20%), low P values (<0.60) were found spread over the upper watershed associ-ated with mild reliefs where plowing in the opposite direction of the slope and strip-cropping are practiced. While higher values (0.60–0.90) occurred in the cen-ter and lower watershed area with moderate to steep slopes mainly protected by arboriculture and contour-ing technics.
RUSLE
In this study, all the factors that typically influ-ence the erosive phenomenon were estimated. The intersection of these factors in raster mode under GIS has allowed us establishing a soil losses map through-out the Bouhamdane watershed (Fig. 13).
K factor
C factor
Area
, %
Cover-management classes

20 H. BOUGUERRA, A. BOUANANI, K. KHANCHOUL, O. DERDOUS, S.E. TACHI
© PAN in Warsaw, 2017; © ITP in Falenty, 2017; Journal of Water and Land Development. No. 32 (I–III)
Fig. 12. P factor distribution map in the Bouhamdane
watershed; source: own study
Fig. 13. Soil loss rates (t·ha–1·y–1) and erosion risk map
in the Bouhamdane watershed; source: own study
The erosion rate varies from one site to another; it is significant (over 20 t·ha–1·y–1) in areas near the dam. These areas characterized with the most eroded soils with steep slopes are seriously threatened by the erosion phenomenon.
The average soil loss of the watershed has been evaluated at 11.18 t·ha–1·y–1. This value exceeds the average limit of tolerance towards soil erosion which is 7 t·ha–1·y–1 according to SADIKI et al. [2009]. How-ever, about 40.15% of the total area is marked by wa-ter erosion rate of less than 7 t·ha–1·y–1 comparing to 14.33 % of the lands that show a very significant soil loss (more than or equal to 20 t·ha–1·y–1). These lands lose in average more than 1 mm of their thickness annually.
Erosion risk map (Fig. 13) shows that the risk does not appear homogenously in Bouhamdane wa-tershed. It is considered as low to moderate on 89 760 ha that makes 85% of the total watershed area which
occurred in mild reliefs (LS) with moderate to high vegetation cover (C). In the rest 15% of the water-shed, erosion risk appears more problematic and ranked from high to very high risk classes (Fig. 14) mainly found in the lower Bouhamdane watershed (northeastern part) around the reservoir of Hammam Debagh, showing high rainfall erosivity values (R > 200), high soil erodibility values (K > 0.0176) and very steep reliefs (LS > 14) combined with moderate vegetation cover factor values (C > 0.30) related to the agricultural activities in this regions.
Fig. 14. Distribution of erosion risk classes
in the Bouhamdane watershed; source: own study
VALIDATION
This section is an attempt to validate the sediment yields obtained by the empirical model of soil loss RUSLE against measured sediment yields.
A bathymetry survey was conducted in March 2004 by the National Agency of Dams and Transfers on Hammam Debagh dam. Siltation of the reservoir from the dam impoundment (December 1988) was evaluated at 15.653 hm3 (Fig. 15) which corresponds to a loss of about 7.826% of its original capacity, i.e. an average annual loss of about 1 025 000 m3·y–1. If a density of 1.5 of settled sludges is considered, the average erosion rate is accordingly 14.56 t·ha–1·y–1.
Fig. 15. Height-capacity curves of Hammam Debagh Dam;
source: own study
According to the instantaneous measures of the combinations (liquid flows – sediment concentrations) performed by the ANRH over a period of 16 years (1988–2004), sediment loads discharged by the draw-ing-off technique during floods were evaluated in hy-
P factor
Soil loss rates Water erosion risk
The
heig
ht, m
Reservoir capacity, hm3

Mapping erosion prone areas in the Bouhamdane watershed (Algeria) using the Revised Universal Soil Loss Equation… 21
© PAN in Warsaw, 2017; © ITP in Falenty, 2017; Journal of Water and Land Development. No. 32 (I–III)
drometric station Medjez Amar located 6 km down-stream Hammam Debagh dam. The relationship that could be established between the liquid flows and concentrations has allowed estimating an average an-nual specific degradation of 1.52 t·ha–1·y–1.
Taking into account the results obtained from the bathymetry survey and the quantification of solid sed-iments transport by the statistical method, the average sediment yield in Bouhamdane watershed is estimated at 16.08 t·ha–1·y–1. This value issued from the meas-ured data is higher than the one found by applying the RUSLE empirical model (11.18 t·ha–1·y–1). This dif-ference can be explained by the fact that this empiri-cal model considers only sheet-rill erosion whose source of energy is rainfall impact and do not include other erosion sources such as channel erosion and especially mass movement processes resulting from landslides which are common in the Bouhamdane watershed according to KHANCHOUL et al. [2009].
CONCLUSION
In the present paper, the integration of soil loss forecast model (RUSLE) in geographic information system (GIS) has allowed us estimating the spatial distribution of soil loss through the Bouhamdane wa-tershed and highlighting areas with critical sensitivity towards water erosion. The results indicated that the watershed losses an average of 11.18 t·ha–1.y–1.
The soil loss map was then classified into five risk classes based on the amount of soil loss; very low (less than 3 t·ha–1·y–1), low (3 to 10 t·ha–1·y–1), moder-ate (10 to 20 t·ha–1·y–1), high (20 to 40 t·ha–1·y–1) very high (more than 40 t·ha–1·y–1) which represented in this study respectively 16%, 41%, 28%, 12% and 3% of the total watershed area.
The results indicated that rainfall erosivity, soil erodibility and topographic factor are the key factors driving soil erosion in the study area. In fact, most erodible soils showing high and very high risk classes were found in the agriculture areas around Hammam Debagh reservoir where high values of these factors were estimated. Cropping systems in these areas should be reviewed, the implementation of alternative techniques such as terracing and ridging may help in reducing sediment yields in Hammam Debagh reser-voir and extend its lifetime.
REFERENCES
ADEDIJI A., TUKUR A.M., ADEPOJU K.A. 2010. Assessment of Revised Universal Soil Loss Equation (RUSLE) in Katsina Area, Katsina State of Nigeria using Remote Sensing (RS) and Geographic Information System (GIS). Iranica Journal of Energy and Environment. Vol. 1. Iss. 3 p. 255–264.
ANGIMA S.D., STOTT D.E., O’NEILI M.K., ONG C.K., WEESIES G.A. 2003. Soil erosion prediction using RUSLE for central Kenyan highland conditions. Agri-culture, Ecosystems and Environment. Vol. 97. Iss. 1 p. 295–308.
ANYS H. 1991. Utilisation des données de télédétection dans un système d'information géographique pour l'étude de l'érosion hydrique du bassin versant de l'Oued Aricha (Settat – Maroc) [Use of remote sensing data in a geo-graphic information system for the study of water ero-sion of the watershed of Aricha river (Settat – Maroc)]. Mémoire de Maîtrise, Département de géographie et télédétection. Université de Sherbrooke, Québec, Canada pp. 83.
ANYS H., BONN F., MERZOUK A. 1994. Remote sensing and GIS based mapping and modeling of water erosion and sediment yield in a semi-arid watershed of Morocco. Geocarto International. Vol. 9. Iss. 1 p. 31–40.
BABATUNDE J.F., ADELEYE Y.B.A., CHRIS O., OLABANJI O.A., ADEGOKE I.A. 2016. GIS-based estimation of soil erosion rates and identification of critical areas in Anambra sub-basin, Nigeria. Modeling Earth Systems and Environment. Vol. 2. Iss. 3 p. 159.
BENBRAHIM K.F., ISMAILI M., BENBRAHIM S.F., TRIBAK A. 2004. Problèmes de dégradation de l’environnement par la désertification et la déforestation: impact du phéno-mène au Maroc [Environmental degradation problems of desertification and deforestation: the impact of the phenomenon in Morocco]. Science et changements planétaires/Sécheresse. Vol. 15. Iss. 4 p. 307–320.
BENKADJA R., BOUSSAG F., BENKADJA A. 2015. Identifi-cation et évaluation du risqué d’érosion sur le bassin versant du K’sob (Est Algérien) [Identification and assessment of the risk of erosion on the watershed K'sob (eastern Algeria)]. Bulletin of Engineering Geology and the Environment. Vol. 74. Iss. 1 p. 91–102.
BOLLINNE A., ROSSEAU P. 1978. Erodibilité des sols de mo-yenne et haute Belgique, utilisation d’une méthode de calcul du facteur K de l’équation universelle de perte en terre [The soil erodibility of the medium and high Bel-gium, using a method of calculating the K factor of the universal soil loss equation]. Bulletin Société Belge d’Etudes Géographiques. Vol. 14. Iss. 4 p. 127–140.
BONN F. 1998. La spatialisation des modèles d'érosion des sols à l'aide de la télédétection et des SIG: possibilités, erreurs et limites [The spatial distribution of soil erosion models using remote sensing and GIS: possibilities and limits errors]. Science et changements planétaires/ Sécheresse. Vol. 9. Iss. 3 p. 185–192.
CHEN H., EL GAROUANI A., LEWIS L.A. 2008. Modelling soil erosion and deposition within a Mediterranean moun-tainous environment utilizing remote sensing and GIS – Wadi Tlata, Morocco. Geographica Helvetica. Vol. 63. Iss. 1 p. 36–47.
CORMARY Y., MASSON J. 1964. Etude de conservation des eaux et du sol au centre de recherches du génie rural de Tunisie, application à un projet type de la formule de perte de sols de Wischmeier [Water and soil conserva-tion research of rural engineering research center of Tunisia, an application of the Wischmeier soil loss formula]. Cahiers ORSTOM, série pédologie. Vol. 2. Iss. 3 p. 3–26.
DEMMAK A. 1982. Contribution à l’étude de l’érosion et des transports solides en Algérie septentrionale [Contri-bution to the study of erosion and sediment transport in northern Algeria]. Doctoral thesis. Paris. Université Pierre et Marie Curie – France pp. 323.
DESMET P.J.J., GOVERS G. 1996. A GIS procedure for auto-matically calculating the USLE LS factor on topog-raphically complex landscape units. Journal of Soil and Water Conservation. Vol. 51. Iss. 5 p. 427–433.

22 H. BOUGUERRA, A. BOUANANI, K. KHANCHOUL, O. DERDOUS, S.E. TACHI
© PAN in Warsaw, 2017; © ITP in Falenty, 2017; Journal of Water and Land Development. No. 32 (I–III)
FAGBOHUN B.J., ANIFOWOSE A.Y.B., ODEYEMI C., ALADE-JANA O.O., ALADEBOYEJE A.I. 2016. GIS-based estima-tion of soil erosion rates and identification of critical ar-eas in Anambra sub-basin, Nigeria. Modeling Earth Systems and Environment. Vol. 2. Iss. 3. 159 p. 1–10.
FOSTER G.R., MCCOOL D.K., RENARD K.G., MOLDENHANER W.C. 1981. Conversion of the universal soil loss equa-tion to SI metric units. Journal of Soil and Water Con-servation. Vol. 36. Iss. 6 p. 355–359.
HEUSCH B. 1971. Estimation et contrôle de l'érosion hydri-que [Estimation and control of water erosion]. Société des sciences naturelles et physiques du Maroc. Vol. 37 p. 41–54.
HICKEY R. 2000. Slope angle and slope length solutions for GIS. Cartography. Vol. 29. Iss. 1 p. 1–8.
KANCHOUL K., ALTSCHUL R., ASSASSI F. 2009. Estimating suspended sediment yield, sedimentation controls and impacts in the Mellah Catchment of Northern Algeria. Arabian Journal of Geosciences. Vol. 2. Iss. 3 p. 257–271.
LIGONJA P.J., SHRESTHA R.P. 2013. Soil erosion assessment in Kondoa eroded area in Tanzania using Universal Soil Loss Equation, Geographic Information Systems and socioeconomic approach. Land Degradation and Devel-opment. Vol. 26. Iss. 4 p. 367–379.
MATI B.M., VEIHE A. 2001. Application of the USLE in a savannah environment: comparative experiences from east and west Africa. Singapore Journal of Tropical Ge-ography. Vol. 22. Iss. 2 p. 138–155.
MCCOOL D.K., FOSTER G.R., MUTCHLER C.K., MEYER L.D. 1989. Revised slope length factor for the Universal Soil Loss Equation. Transactions of the ASAE. Vol. 32. Iss. 5 p. 1571–1576.
MEDDI M., TOUMI S., ASSANI A.A. 2016. Spatial and tempo-ral variability of the rainfall erosivity factor in Northern Algeria. Arabian Journal of Geosciences. Vol. 9. Iss. 4 p. 1–13.
MITASOVA H., HOFIERKA J., ZLOCHA M., IVERSON L.R. 1996. Modeling topographic potential for erosion and deposition using GIS. International Journal of Geogra-phical Information Systems. Vol. 10. Iss. 5 p. 629–641.
MOORE I.D., BURCH G.J. 1986. Physical basis of the length-slope factor in the Universal Soil Loss Equation. Soil Sciences Society America Journal. Vol. 50. Iss. 5 p. 1294–1298.
MOORE I.D., WILSON J.P. 1992. Length-slope factors for the Revised Universal Soil Loss Equation: Simplified method of estimation. Journal of Soils and Water Con-servation.Vol. 47. Iss. 5 p. 423–428.
NETELER M., MITASOVA H. 2004. Open source GIS: A GRASS GIS approach. Using GRASS: Application examples. The International Series in Engineering and Computer Science 773 (Chapter 12) p. 289–325.
REMINIERAS G. 1976. L'hydrologie de l'ingénieur [Hydrolo-gy of engineer]. Paris, France. Eyrolles editions pp. 456.
RENARD K.G., FOSTER G.R., WEESIES G.A., MCCOOL D.K., YODER D.C. 1997. Predicting soil erosion by water: A guide to conservation planning with the Revised Uni-versal Soil Loss Equation (RUSLE). U.S. Department of Agriculture. Agriculture Handbook. No. 703. ISBN 0-16-048938-5 pp. 384.
ROOSE E. 1977. Adaptation des méthodes de conservation des sols aux conditions écologiques et socio-économi-ques de l'Afrique de l'Ouest [Adapting the methods of soil conservation to ecological and socio-economic conditions of West Africa]. Agronomie Tropicale. Vol. 32. Iss. 2 p. 132–140.
ROOSE E., SARRAILH J.M. 1990. Erodibilité de quelques sols tropicaux, vingt années de mesure en parcelles d’érosion sous pluies naturelles [Erodibility of some tropical soils, twenty years of erosion measurement plots under natural rainfall]. Cahiers de l’ORSTOM. Série Pédolo-gique. Vol. 25 p. 7–30.
SADIKI A., FALEH A., ZEZERE J.L., MASTASS H. 2009. Quantification de l’érosion en nappes dans le bassin ver-sant de l’oued Sahla Rif central Maroc [Quantification of sheet erosion in the watershed of Sahla river central Rif Morocco]. Cahiers Géographiques. Vol. 6 p. 59–70.
SAIDI A. 1991. Erosion spécifique et prévision de l’envase-ment [Specific erosion and forecasting siltation]. Colloque sur l’érosion des sols et l’envasement des barrages. Alger Décembre 1991. Publication de l’Agence Nationale des Ressources Hydrauliques (ANRH) p. 204–226.
SMITH H.J. 1999. Application of empirical soil loss models in southern Africa: A review. South African Journal of Plant and Soil. Vol. 16. Iss. 3 p. 158–163.
STONE R.P., HILBORN D. 2012. Universal Soil Loss Equa-tion (USLE). Ontario. Ministry of Agriculture, Food and Rural Affairs pp. 8.
WISCHMEIER W.H., SMITH D.D. 1965. Predicting rainfall erosion losses from cropland east of the rocky moun-tains: Guide for selection of practices for soil and water conservation. U. S. Department of Agriculture. Agricul-ture Handbook. No. 282 pp. 58.
WISCHMEIER W.H., SMITH D.D. 1978. Predicting raifall erosion losses: A guide to conservation planning. U.S. Department of Agriculture. Agriculture Handbook No. 537.
Hamza BOUGUERRA, Abderrazak BOUANANI, Kamel KHANCHOUL, Oussama DERDOUS, Salah Eddine TACHI
Mapowanie obszarów wrażliwych na erozję w zlewni Bouhamdane w Algierii z użyciem równania strat glebowych RUSLE oraz GIS
STRESZCZENIE
Erozja wodna gleb jest głównym problemem, którego obecnie doświadcza północna Algieria. Z powodu strat gleby w wyniku erozji zmniejsza się produktywność obszarów rolniczych. Erozja gleb prowadzi również do zmniejszenia pojemności retencyjnej zbiorników wodnych, pogorszenia jakości wody itp. Celem przedstawio-

Mapping erosion prone areas in the Bouhamdane watershed (Algeria) using the Revised Universal Soil Loss Equation… 23
© PAN in Warsaw, 2017; © ITP in Falenty, 2017; Journal of Water and Land Development. No. 32 (I–III)
nych badań była ocena strat gleby spowodowanych erozją i identyfikacja obszarów potencjalnie zagrożonych erozją w zlewni Bouhamdane zlokalizowanej w północno-wschodniej Algierii. W tym celu wykorzystano rów-nanie strat gleby RUSLE. W równaniu wykorzystuje się pięć parametrów: erozję spowodowaną opadami, topo-grafię, erozyjność gleb, pokrywę roślinną i działania zapobiegające erozji. Na podstawie wyników obliczeń za pomocą tego równania i z wykorzystaniem GIS oszacowano średnią roczną wielkość erozji w zlewni Bouha-mdane na poziomie 11,18 t·ha–1·y–1.
W każdej jednostce sieci pomiarowej sporządzono mapę ryzyka erozji, stosując pięć klas ryzyka, 16% ziem mieściło się w klasie bardzo niskiego ryzyka, 41% w klasie niskiego, 28% w klasie umiarkowanego, 12% w kla-sie wysokiego i 3% w klasie bardzo wysokiego ryzyka. Większość obszaru mieszczącego się w klasach wyso-kiego i bardzo wysokiego ryzyka to dolne partie zlewni Bouhamdane w okolicach zapory Hammam Debagh. Te obszary wymagają priorytetowego wdrożenia działań zapobiegających erozji w celu zachowania zasobów gle-bowych i zmniejszenia zamulania zbiornika. Słowa kluczowe: Algieria, erozja gleb, GIS, RUSLE, zamulanie, zbiornik Hammam Debagh, zlewnia Bouha-mdane