Embed Size (px)
Citation preview

Realizing the Full Potential of Social Safety Nets in Africa

Realizing the Full Potential of Social Safety Nets in Africa
Kathleen Beegle, Aline Coudouel, and Emma Monsalve, Editors
A copublication of the Agence Française de Développement and the World Bank
© 2018 International Bank for Reconstruction and Development / Th e World Bank1818 H Street NW, Washington, DC 20433Telephone: 202-473-1000; Internet: www.worldbank.org
Some rights reserved1 2 3 4 21 20 19 18
Th is work is a product of the staff of Th e World Bank with external contributions. Th e fi ndings, interpretations, and conclusions expressed in this work do not necessarily refl ect the views of Th e World Bank, its Board of Executive Directors, or the governments they represent, or the Agence Française de Développement. Th e World Bank does not guarantee the accuracy of the data included in this work. Th e boundaries, colors, denominations, and other information shown on any map in this work do not imply any judgment on the part of Th e World Bank concerning the legal status of any territory or the endorsement or acceptance of such boundaries.
Nothing herein shall constitute or be considered to be a limitation upon or waiver of the privileges and immunities of Th e World Bank, all of which are specifi cally reserved.
Rights and Permissions
Th is work is available under the Creative Commons Attribution 3.0 IGO license (CC BY 3.0 IGO), http:// creativecommons.org/licenses/by/3.0/igo. Under the Creative Commons Attribution license, you are free to copy, distribute, transmit, and adapt this work, including for commercial purposes, under the following conditions:
Attribution—Please cite the work as follows: Beegle, Kathleen, Aline Coudouel, and Emma Monsalve. 2018. Realizing the Full Potential of Social Safety Nets in Africa. Africa Development Forum series. Washington, DC: World Bank. doi:10.1596/978-1-4648-1164-7. License: Creative Commons Attribution CC BY 3.0 IGO
Translations—If you create a translation of this work, please add the following disclaimer along with the attribution: Th is translation was not created by Th e World Bank and should not be considered an offi cial World Bank translation. Th e World Bank shall not be liable for any content or error in this translation.
Adaptations—If you create an adaptation of this work, please add the following disclaimer along with the attribution: Th is is an adaptation of an original work by Th e World Bank. Views and opinions expressed in the adaptation are the sole responsibility of the author or authors of the adaptation and are not endorsed by Th e World Bank.
Th ird-party content—Th e World Bank does not necessarily own each component of the content contained within the work. Th e World Bank therefore does not warrant that the use of any third-party-owned individual compo-nent or part contained in the work will not infringe on the rights of those third parties. Th e risk of claims resulting from such infringement rests solely with you. If you wish to re-use a component of the work, it is your responsibil-ity to determine whether permission is needed for that re-use and to obtain permission from the copyright owner. Examples of components can include, but are not limited to, tables, fi gures, or images.
All queries on rights and licenses should be addressed to World Bank Publications, Th e World Bank Group, 1818 H Street NW, Washington, DC 20433, USA; fax: 202-522-2625; e-mail: [email protected].
ISBN: 978-1-4648-1164-7eISBN: 978-1-4648-1166-1DOI: 10.1596/978-1-4648-1164-7
Cover layout: Critical Stages, LLC.
Cover photo: © Stephan Gladieu / World Bank. Used with permission. Additional request required for re-use.
Library of Congress Cataloging-in-Publication Data has been applied for.
v
Th e Africa Development Forum Series was created in 2009 to focus on issues of signifi cant relevance to Sub-Saharan Africa’s social and economic develop-ment. Its aim is both to record the state of the art on a specifi c topic and to contribute to ongoing local, regional, and global policy debates. It is designed specifi cally to provide practitioners, scholars, and students with the most up-to-date research results while highlighting the promise, challenges, and opportunities that exist on the continent.
Th e series is sponsored by the Agence Française de Développement and the World Bank. Th e manuscripts chosen for publication represent the high-est quality in each institution and have been selected for their relevance to the development agenda. Working together with a shared sense of mission and interdisciplinary purpose, the two institutions are committed to a common search for new insights and new ways of analyzing the development realities of the Sub-Saharan Africa region.
Advisory Committee Members
Agence Française de DéveloppementGaël Giraud, Executive Director, Research and KnowledgeMihoub Mezouaghi, Deputy Director, Research and KnowledgePierre Icard, Director, Head of Knowledge Department on Sustainable DevelopmentSophie Chauvin, Head, Edition and Publication DivisionHélène Djoufelkit, Deputy Head, Research Department
World BankAlbert G. Zeufack, Chief Economist, Africa RegionMarkus P. Goldstein, Lead Economist, Africa Region
Africa Development Forum Series
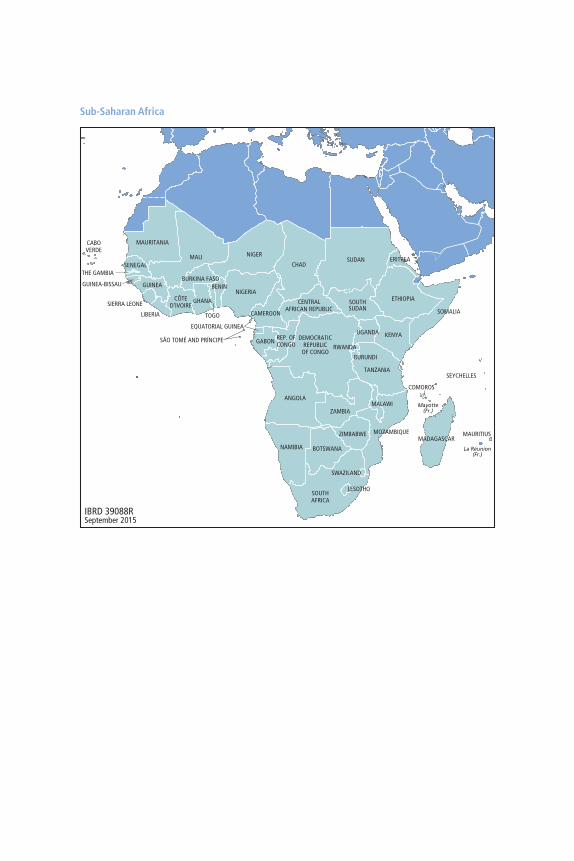
Sub-Saharan Africa
ZIMBABWE
ANGOLA
BURUNDI
RWANDA
CHAD
NIGER
UGANDA KENYA
SOMALIA
ETHIOPIA
ERITREASUDAN
SOUTHSUDAN
CENTRALAFRICAN REPUBLIC
REP. OFCONGO
NIGERIA
TOGO
SENEGAL
LIBERIA
SIERRA LEONE
GUINEA
CÔTED’IVOIRE
GUINEA-BISSAU
DEMOCRATICREPUBLIC
OF CONGO
SOUTHAFRICA
LESOTHO
SWAZILAND
BOTSWANA
ZAMBIA
MOZAMBIQUEMADAGASCAR
COMOROS
SEYCHELLES
MALAWI
TANZANIA
NAMIBIA
MAURITIUS
CAMEROON
GABON
EQUATORIAL GUINEA
SÃO TOMÉ AND PRÍNCIPE
MALI
BENINBURKINA FASO
MAURITANIACABOVERDE
THE GAMBIA
GHANA
La Réunion(Fr.)
Mayotte(Fr.)
IBRD 39088RSeptember 2015
vii
Titles in the Africa Development Forum Series
Africa’s Infrastructure: A Time for Transformation (2010) edited by Vivien Foster and Cecilia Briceño-GarmendiaGender Disparities in Africa’s Labor Market (2010) edited by Jorge Saba Arbache, Alexandre Kolev, and Ewa FilipiakChallenges for African Agriculture (2010) edited by Jean-Claude Deveze Contemporary Migration to South Africa: A Regional Development Issue (2011) edited by Aurelia Segatti and Loren Landau* Light Manufacturing in Africa: Targeted Policies to Enhance Private Investment and Create Jobs, «L’industrie légère en Afrique : Politiques ciblées pour susciter l’investissement privé et créer des emplois» (2012) by Hinh T. Dinh, Vincent Palmade, Vandana Chandra, and Frances Cossar* Informal Sector in Francophone Africa: Firm Size, Productivity, and Institutions, «Le système d’approvisionnement en terres dans les villes d’Afrique de l’Ouest : L’exemple de Bamako» (2012) by Nancy Benjamin and Ahmadou Aly Mbaye* Financing Africa’s Cities: Th e Imperative of Local Investment, «Financer les villes d’Afrique : L’enjeu de l’investissement local» (2012) by Th ierry Paulais* Structural Transformation and Rural Change Revisited: Challenges for Late Developing Countries in a Globalizing World, «Transformations rurales et développement : Les défi s du changement structurel dans un monde globalisé» (2012) by Bruno Losch, Sandrine Fréguin-Gresh, and Eric Th omas WhiteTh e Political Economy of Decentralization in Sub-Saharan Africa: A New Implementation Model (2013) edited by Bernard Daffl on and Th ierry MadièsEmpowering Women: Legal Rights and Economic Opportunities in Africa (2013) by Mary Hallward-Driemeier and Tazeen HasanEnterprising Women: Expanding Economic Opportunities in Africa (2013) by Mary Hallward-DriemeierUrban Labor Markets in Sub-Saharan Africa (2013) edited by Philippe De Vreyer and François RoubaudSecuring Africa’s Land for Shared Prosperity: A Program to Scale Up Reforms and Investments (2013) by Frank F. K. Byamugisha* Youth Employment in Sub-Saharan Africa, «L’emploi des jeunes en Afrique subsaharienne» (2014) by Deon Filmer and Louis Fox
viii TITLES IN THE AFRICA DEVELOPMENT FORUM SERIES
Tourism in Africa: Harnessing Tourism for Growth and Improved Livelihoods (2014) by Iain Christie, Eneida Fernandes, Hannah Messerli, and Louise Twining-Ward* Safety Nets in Africa: Eff ective Mechanisms to Reach the Poor and Most Vulnerable, «Les fi lets sociaux en Afrique : Méthodes effi caces pour cibler les populations pauvres et vulnérables en Afrique» (2015) edited by Carlo del Ninno and Bradford Mills* Land Delivery Systems in West African Cities: Th e Example of Bamako, Mali, «Le système d’approvisionnement en terres dans les villes d’Afrique de l’Ouest: L’exemple de Bamako» (2015) by Alain Durand-Lasserve, Maÿlis Durand-Lasserve, and Harris SelodEnhancing the Climate Resilience of Africa’s Infrastructure: Th e Power and Water Sectors (2015) edited by Raff aello Cervigni, Rikard Liden, James E. Neumann, and Kenneth M. Strzepek* Africa’s Demographic Transition: Dividend or Disaster? «La transition demogra-pique de lAfrique» (2015) edited by David Canning, Sangeeta Raja, and Abdo S. YazbeckTh e Challenge of Fragility and Security in West Africa (2015) by Alexandre Marc, Neelam Verjee, and Stephen MogakaHighways to Success or Byways to Waste: Estimating the Economic Benefi ts of Roads in Africa (2015) by Ali A. Rubaba, Federico Barra, Claudia Berg, Richard Damania, John Nash, and Jason RussConfronting Drought in Africa’s Drylands: Opportunities for Enhancing Resilience (2016) edited by Raff aello Cervigni and Michael Morris* Reaping Richer Returns: Public Spending Priorities for African Agriculture Productivity Growth (2017) by Aparajita Goyal and John NashMining in Africa: Are Local Communities Better Off ? (2017) by Punam Chuhan-Pole, Andrew L. Dabalen, and Bryan Christopher LandRealizing the Full Potential of Social Safety Nets in Africa (2018) edited by Kath-leen Beegle, Aline Coudouel, and Emma Monsalve
* Available in French
All books in the Africa Development Forum series are available for free at https://openknowledge.worldbank.org/handle/10986/2150
ix
Contents
Foreword xixForeword xxiAcknowledgments xxiiiAbout the Authors and Contributors xxvAbbreviations xxxi
Overview: Realizing the Full Potential of Social Safety Nets in Africa 1
Reaching the Poor and Vulnerable in Africa through Social Safety Nets (Chapter 1) 2Social Safety Nets Promote Poverty Reduction, Increase Resilience, and Expand Opportunities (Chapter 2) 11Recognizing and Leveraging Politics to Expand and Sustain Social Safety Nets (Chapter 3) 17Anchoring in Strong Institutions to Expand and Sustain Social Safety Nets (Chapter 4) 26Harnessing Resources to Expand and Sustain Social Safety Nets (Chapter 5) 33Th e Road Ahead for Bringing Social Safety Nets to Scale in Africa 41References 42
Introduction 47
1 Reaching the Poor and Vulnerable in Africa through Social Safety Nets 49Despite Improvements, Poverty and Vulnerability to Shocks Are Widespread 50Social Safety Nets Have Been Expanding Rapidly in Africa 53
x CONTENTS
Th e Design of Social Safety Nets Varies across Africa 57Social Safety Nets Are Evolving 64Social Safety Nets Are Reaching Some, but Many of the Poor Are Not Covered 73Some Countries Spend Heavily, but Programs Need to Be Brought to Scale and Sustained 76Notes 81References 82
2 Social Safety Nets Promote Poverty Reduction, Increase Resilience, and Expand Opportunities 87Social Safety Nets Improve Equity 90Building Resilience through Social Safety Nets 96Increasing Opportunities through Social Safety Nets 103Bringing Social Safety Nets to Scale 112Annex 2A: Programs Included in the Meta-analysis 118Annex 2B: Meta-analysis Methodology 123Annex 2C: Partial and General Equilibrium Methodology 126Notes 128References 129
3 Recognizing and Leveraging Politics to Expand and Sustain Social Safety Nets 139Th e Political Appetite for Adopting and Expanding Social Safety Nets 142Program Parameters Are Political 155Political Impacts May Favor Social Safety Net Sustainability 163Notes 174References 174
4 Anchoring in Strong Institutions to Expand and Sustain Social Safety Nets 183From Frameworks to Commitments: Emerging National Strategies for Social Safety Nets 190Rooting Social Safety Nets in Organizations for Policy Setting, Oversight, Coordination, and Management 195
CONTENTS xi
Ensuring Th at Organizations Can Eff ectively Implement Social Safety Net Programs 206Creating Incentives to Encourage Individual Actors to Deliver Results 218Notes 222References 223
5 Harnessing Resources to Expand and Sustain Social Safety Nets 227Spending and Financing for Social Safety Nets: A Snapshot 228Making Better Use of Existing Resources 231Securing Sustainable Resources to Expand and Sustain Coverage 246Developing a Financing Strategy for a Reliable, Eff ective Emergency Response 253Notes 258References 258
Appendixes
A Definitions and Data Sources 265A.1 Defi nition of Social Safety Nets 265A.2 Typologies Used in Th is Report 265Table A.1 List of Countries and Country Groups 273A.3 Data Sources 277Table A.2 Household Surveys Used 278
B Estimating the Number of Programs, the Number of Beneficiaries, Coverage, and Spending 281B.1 Methodology to Estimate the Number of Programs 281B.2 Methodology to Estimate the Number of Benefi ciaries 282B.3 Methodology to Estimate Coverage Rates 284B.4 Methodology to Estimate Spending on Social Safety Nets 285
C The Country Context 287Table C.1 Main Indicators, by Country 288
xii CONTENTS
D Social Safety Net Institutions and Systems 291Table D.1 Social Protection Policies and Strategies, by Country 292Table D.2 Social Registries, by Country 297Table D.3 Organizational Homes of Selected Social Safety
Net Programs 299
E Typologies of Social Safety Net Programs 305Table E.1 Number of Social Safety Net Programs, by Program
Typology and Country 306Table E.2 Number of Social Safety Net Programs, by Program
Typology and Country Group 310Table E.3 Distribution of Social Safety Net Programs, by Program
Typology and Country Group 314
F Coverage of Social Safety Net Programs 319Table F.1 Coverage of Social Safety Nets, by Program Typology
and Country 320Table F.2 Coverage of Social Safety Nets, by Program Typology
and Country Group 324
G Spending on Social Safety Net Programs 327Table G.1 Spending on Social Safety Nets and Other Sectors,
Tax Revenue, and Humanitarian Assistance, by Country 328Table G.2 Spending on Social Safety Nets, by Program
Typology and Country 331Table G.3 Spending on Social Safety Nets, by Program
Typology and Country Group 335Table G.4 Distribution of Spending on Social Safety Nets, by
Program Typology and Country 339Table G.5 Distribution of Spending on Social Safety Nets, by
Program Typology and Country Group 343Table G.6 Distribution of Social Safety Net Spending Aggregated
within Country Groups 347Table G.7 Distribution of Spending on Social Safety Nets,
by Population Quintile 351Table G.8 Share of Development Partner Financing,
Selected Programs 352Table G.9 Administrative Costs for Selected Programs 359
CONTENTS xiii
H Main Social Safety Net Programs, by Program Type 363Table H.1 Th e Five Largest Programs of Each Type, Ranked
by Number of Benefi ciaries 364Table H.2 Th e Five Largest Programs of Each Type, Ranked
by Coverage as a Share of the Population 367
I Generosity of Social Safety Net Programs 373Table I.1 Generosity of Selected Cash Transfer Programs 374Table I.2 Generosity of Selected Public Works Programs 379Table I.3 Generosity of Selected Social Pensions 382
J Tax Revenue 383Table J.1 Tax Revenue, by Type of Revenue and Country 383Table J.2 Tax Revenue, by Type and Country Group 385
BoxesO.1 Design Lessons in Bringing Social Safety Nets to Scale 161.1 Th e Defi nition of Social Safety Nets and the Typology of Programs 541.2 How Do Public Works Work? 581.3 Th e Links between Social Safety Nets and Gender 601.4 What Are Shock-Responsive Social Safety Nets? 651.5 Cash Transfer Programs: Mechanisms to Promote Investment in
Human Capital 702.1 Unpacking the Findings of the Meta-analysis 912.2 Measuring Spillover and Feedback Eff ects: Th e Ghana Case Study 1132.3 How Does Society Gain When a Poor Household Gains? 1163.1 Social Contracts and Social Safety Nets 1413.2 Changing Beliefs Are Part of Changing the Governance Landscape 1433.3 Social Safety Nets and Human Rights Reinforce Each Other 1523.4 Graduation in Social Safety Net Programs 1573.5 Th e Media Eventually Became Favorable toward the Social
Safety Net in Tanzania 1663.6 Electoral Impacts of Social Safety Net Programs in
Asia and Latin America 1713.7 Distinguishing Electoral Accountability and Clientelism
in Th eory and Practice 1734.1 Defi ning Institutions 185
xiv CONTENTS
4.2 Methodology and Case Study Selection 1894.3 Nigeria’s Process to Establish a Coordination Function 1974.4 Contrasting Social Safety Net Narratives in Tanzania
and Uganda 2054.5 Tools for Coordination 2124.6 Sahel Humanitarian Coordination for Food Security 2145.1 How Are Effi ciency and Eff ectiveness Defi ned and Measured? 2325.2 Key Instruments of Social Safety Net Programs and Systems 2395.3 Ways to Combat Fraud and Errors in Social Safety Nets 2435.4 How Senegal Finances Most of Its Main Social Safety
Net Programs 252B.1 Th e Challenges in Measuring Social Safety Net
Coverage in Africa 283
FiguresO.1 Poverty Is Both Chronic and Transient 3O.2 More Social Safety Net Programs Have Been Launched
in Recent Years 5O.3 Flagship Programs in Africa Are among the Most Rapidly Growing 6O.4 Th e Composition of Social Safety Net Portfolios Is Diverse 8O.5 Social Safety Net Coverage Is Not Proportionate to the
Extent of Poverty 10O.6 Consumption Increases Because of Social Safety Nets 13O.7 Income Opportunities May Respond to Social Safety Nets 15O.8 Politics and Social Safety Nets Interact 18O.9 Development Partners Support a Large Share of Social Safety Nets 21O.10 Poverty Targeting Accounts for Most of Social Safety Net
Spending, but the Elderly Benefi t Most 23O.11 Many Countries Have Adopted Social Protection Strategies 29O.12 Social Ministries Are the Typical—but Not the Only—Policy,
Oversight, and Coordination Entities 30O.13 Spending Is Lower on Social Safety Nets Th an on Other Sectors 34O.14 Administrative Costs Oft en Decline as Programs Grow, but
Not Always 36O.15 Social Safety Nets Are Progressive, but Some Benefi ts
Go to Better-Off Households 38
CONTENTS xv
1.1 Poverty Rates Are Falling in Africa, but the Number of the Poor Is Rising 50
1.2 Poverty Is Both Chronic and Transient 521.3 More Social Safety Net Programs Have Been Launched in
Recent Years 561.4 Th e Composition of Social Safety Net Portfolios Is Diverse 591.5 Program Coverage Varies by Type and Country Group 621.6 Children and the Elderly Are the Most Covered Groups 631.7 Flagship Programs in Africa Are among the Most
Rapidly Growing 641.8 Social Registries Are Oft en Small 721.9 Social Safety Net Coverage Is Not Proportionate to the
Extent of Poverty 741.10 Flagship Programs Benefi t the Poor, but also the Nonpoor 751.11 Social Safety Nets Are Aff ordable at All Income Levels 791.12 Spending on Energy Subsidies Is Greater Th an Spending on
Social Safety Nets 802.1 Conceptual Framework for Considering the Impacts of
Social Safety Nets 882.2 Consumption Increases Because of Social Safety Nets 922.3 A Range of Productive Assets Respond to Social Safety
Net Transfers 972.4 Social Safety Nets May Reduce the Reliance on Child Labor 1002.5 Th e Impact of Social Safety Nets on Savings and Private Transfers 1012.6 School Attendance Is Boosted by Social Safety Nets 1052.7 Income Opportunities May Respond to Social Safety Nets 1102.8 Bringing Programs to Scale May Reduce Poverty 1153.1 Politics and Social Safety Nets Interact 1403.2 Receiving Money without Working for It Is Considered
Humiliating in Africa 1443.3 Development Partners Support a Large Share of Social
Safety Nets 1543.4 Targeting Varies across Regions and Groups 1593.5 Th e Elderly and Children Benefi t Most From Social Safety Nets 160B3.5.1 Press Coverage Increased with the Expansion of the PSSN 166B3.5.2 Th e Media Became More Favorable during Program Expansion 167
xvi CONTENTS
4.1 Th e Institutional Landscape of Social Safety Nets in Africa: A Snapshot 188
4.2 Many Countries Have Adopted Social Protection Strategies 1934.3 Countries Have Diff erent Types of Programs Depending on the
Organization Responsible for Policy Setting, Oversight, and Coordination 196
4.4 Social Ministries Are the Typical—but Not the Only—Policy, Oversight, and Coordination Entities 198
5.1 Spending Is Lower on Social Safety Nets Th an on Other Sectors 2295.2 Administrative Costs Oft en Decline as Programs Grow, but
Not Always 231B5.1.1 Most Countries Can Improve Eff ectiveness 233B5.4.1 Government Spending on Social Safety Nets Has Risen
Considerably since 2004 2525.3 Governments Can Layer Financing Instruments Th at Address
Diff erent Needs 256
TablesO.1 Constitutions Cover Vulnerable Groups 20O.2 Safety Nets in Most Countries Are Anchored in Laws, Policy, or
Constitutions 281.1 Th ree of Five African Countries Have Approved a National
Social Protection Strategy 57B1.4.1 Options for Expanding Social Safety Nets in Response to
Covariate Shocks 661.2 Mechanisms to Encourage Human Capital Investments in
Selected Cash Transfer Programs 691.3 Benefi t Amounts Are Low Relative to Needs in Low-Income
Countries 772.1 Bringing Social Safety Nets to Scale Can Have Large
Impacts on Well-Being 1172A.1 Evaluation Studies Included in the Meta-analysis 1182A.2 Program Acronyms 1232C.1 Country Information and Simulation Parameters 1273.1 Constitutions Cover Vulnerable Groups 151
CONTENTS xvii
4.1 Bringing Social Safety Nets to Scale Requires an Evolution of Institutions and Organizations 187
4.2 Social Safety Nets in Most Countries Are Anchored in Law, Policy, or Constitutions 192
4.3 Organizational Homes of Social Safety Nets Vary in Africa, Selected Programs 200
4.4 Th e Type of Program Aff ects the Complexity of Implementation Arrangements 211
4.5 Decision Making and Implementation May Be Centralized, Delegated, or Devolved 216
4.6 Th ere Are Trade-Off s in the Various Approaches to Staffi ng 220B5.1.1 Eff ectiveness Varies by Country Group 2335.1 Performance Indicators for Selected Programs 2355.2 Options for Increasing Social Safety Net Resources Are Available 257

xix
Foreword
In less than a decade, social safety nets in Sub-Saharan Africa have become a core part of development strategies to address extreme poverty and protect households exposed to increasing shocks from disasters such as droughts, fl oods, epidemics and illnesses, international price shocks, and confl ict. Consider this: every country in the region now has at least one social safety net program, and African countries now spend on average 1.2 percent of gross domestic product (GDP) on social safety nets—a rate slightly lower than the global average of 1.6 percent. Th roughout the continent, cash transfer, public works, and school feeding programs have changed the lives of millions of vulnerable people for the better.
In Ethiopia, a productive social safety nets program is increasing food security while lowering the national poverty rate. Cash-for-work projects in Sierra Leone have increased savings of poor households and provided an incentive for income diversifi cation. In Zambia, providing grants to households with children resulted in increased yields and higher sales of farm output, while increasing the bargaining power of women.
Since the introduction of cash transfer programs, both conditional and unconditional, a major concern has been that benefi ciaries will misuse the cash and spend it on “temptation goods” such as alcohol or tobacco. Contrary to popular belief, a wealth of evidence shows that instead households use the support “productively”: by increasing food security, sending children to school, or expanding income activities. When times get tough, such programs protect households, helping to avoid selling critical assets or taking children out of school. Among Africa’s poor, a small positive shock to incomes can lift many out of poverty. However, though the number of social safety net programs has risen, coverage remains limited in Sub-Saharan Africa, with many of the poorest of the poor not covered. Th ere is untapped potential for social safety nets to eff ectively address equity, raise resilience, and expand opportunities for poor and vulnerable.
xx FOREWORD
What would it take? Bringing social safety nets to scale requires strong political will, technical expertise, and reliable and effi cient spending, as this report highlights.
First, it is critical to understand the role of politics in shaping safety net programs. Such programs are appearing on political platforms and may help establish a relationship between vulnerable people and their government. Th e political appetite for such programs can be shaped by evidence on their eff ectiveness.
Second, programs need to be anchored in eff ective institutions with strong capacity and aligned incentives.
Third, scale-up will require innovative strategies to ensure financial sustainability. Th is includes a focus on ways to increase effi ciency and volumes and to secure new sources of fi nancing, with an emphasis on disaster risk management.
Paying greater attention to political economy, institutional capacity, and fi scal sustainability is a key factor for bringing social safety nets to scale in Africa. Th is report off ers a strategic vision for supporting the scale-up of social safety nets to alleviate poverty and reduce vulnerability in Africa.
Makhtar DiopVice-President, Africa Region
World Bank Group
xxi
Foreword
Social safety nets have arrived in Africa. Th e number of programs is growing. And in several countries the coverage is expanding at a rapid pace. Long gone are the days when doubters dismissed safety nets as irrelevant development policy that was good only for rich or middle-income countries. Th ere is now a strong body of evidence from Africa and other regions which establishes that households use cash and in-kind transfers in ways that benefi t children, empower women, and enable poor and vulnerable households to live better lives. Safety nets enable households to work more and more productively. Th ese programs tackle poverty and social exclusion for the most disenfranchised people. Th ey help connect them with basic social services. And they help households better deal with shocks, without selling their assets or jeopardizing the health, nutrition, or education of their children. Th e case for safety nets has been made.
Africa has become a great innovator in social safety nets, pushing the frontiers in many areas. Other regions are learning from the creative use of technology in some programs (such as targeting in Sierra Leone), or from the way programs are designed with a scalable element to better respond to shock (in Kenya for example), or from the way productive inclusion is weaved into programs. As a partner with government, the World Bank team is at the forefront of the eff ort to innovate and build systems.
Th is report emphasizes various challenges countries face when bringing their social safety nets to scale, and ensuring their sustainability. In addition to important questions related to the technical design of social safety nets and of systemic instruments, this report points to three critical areas that are essential to successful scaling up: politics, institutions, and fi nancing. First, understanding the politics of social safety nets is critical to shift the social contract progressively and achieve strong political support for such programs. Second, strong institutions are critical to implementing programs at large scale in a transparent and professional manner, and to ensuring coordination and effi ciency in their delivery. Finally, bringing safety nets to scale, and reliably keeping them at such
xxii FOREWORD
scale over time, requires innovative strategies to increase resources and to ensure their timely availability, including in the context of shocks and emergencies.
Th is broader focus on issues that go beyond technical considerations is relevant more generally—for regions beyond Africa and for other elements of social protection beyond social safety nets more broadly.
Michal Rutkowski Senior Director and Head of Global Practice
Social Protection and JobsWorld Bank Group
xxiii
Acknowledgments
Th is report has been prepared by a team led by Aline Coudouel and Kathleen Beegle. Th e core team is comprised of Colin Andrews, Th omas Bossuroy, Lucilla Maria Bruni, Sarah Coll-Black, Melis Guven, Maddalena Honorati, Allan Hsiao, Victoria Monchuk, Emma Monsalve, Laura Ralston, and Judith Sandford.
Th e team is grateful to Stefano Paternostro and Dena Ringold for their overall guidance throughout the process. Th e team has also benefi ted greatly from extensive consultations, discussions, and suggestions involving many colleagues throughout the preparation of the report. Th is includes the inputs and guidance of Elena Bardasi, Carlo del Ninno, Eric Zapatero, Dimitris Mavridis, John Van Dyck, and Andrea Vermehren (chapter 1); Ruth Hill, Laura Rawlings, and Jamele Rigolini (chapter 2); Badru Bukenya, Mathison Clore, Sam Hickey, Tom Lavers, Abla Safi r, and Jennifer Turner (chapter 3); Susana Gamez, Mary Green, Sara Giannozzi, Jeff rey Maganya, and Yasuhiko Matsuda (chapter 4); and Francesca Bastagli, Julie Dana, Mareile Beate Stephanie Drechsler, Tina George, Bhavya Jha, Patrick Kabuya, Barry Patrick Maher, Solène Rougeaux, Jennifer Turner, and Sara Troiano (chapter 5). Th e team likewise received cross-cutting advice and inputs from Eva Kloeve, Lynne Sherburne-Benz, Th ibault Van Langenhove, Ruslan Yemtsov, and Albert Zeufack.
Th e thoughtful comments of the peer reviewers—Markus P. Goldstein, Margaret E. Grosh, William Wiseman, and an anonymous reviewer—are greatly appreciated. Th e team appreciates the hard work of the ASPIRE group, particularly Maddalena Honorati, Oleksiy Ivaschenko, Marina Novikova, Claudia P. Rodriguez, and Linghui Zhu.
Special thanks to country teams that collected and validated detailed data on social safety net programs in Africa, including Mahamane Maliki Amadou, Philippe Auff ret, Gbetoho Joachim Boko, Bénédicte de La Brière, Christabel E. Dadzie, Carlo del Ninno, Ivan Drabek, Heba Elgazzar, Randa G. El-Rashidi, Hadyiat El-Tayeb Alyn, Jordi Jose Gallego-Ayala, Rebekka E. Grun, Camilla
xxiv ACKNOWLEDGMENTS
Holmemo, Alex Kamurase, Lisette Khonde, Toni Koleva, Matthieu Lefebvre, Phillippe George Leite, Dimitris Mavridis, Emma S. Mistiaen, Muderis Abdulahi Mohammed, Michael Mutemi Munavu, Suleiman Namara, Maniza B. Naqvi, Ana Ocampo, Foluso Okunmadewa, Serene Praveena Philip, Laura Ralston, Laura B. Rawlings, Nina Rosas Raff o, Solène Rougeaux, Manuel Salazar, Nadia Selim, Endashaw Tadesse Gossa, Cornelia M. Tesliuc, Maurizia Tovo, Fanta Toure, John Van Dyck, Andrea Vermehren, Emily Weedon, Penelope Williams, Briana Wilson, Sulaiman Adesina Yusuf, Giuseppe Zampaglione, and Eric Zapatero Larrio.
Th is task received fi nancial support from the Offi ce of the Chief Economist of the World Bank Group’s Africa Region and the Nordic Trust Fund, which promotes knowledge and learning for human rights and development.
Robert Zimmermann provided assistance in the editing of the report. Lydie Billey supplied support in the management of this task and formatting the report. Gerry Quinn helped with graphic design.
Th e fi ndings, interpretations, and conclusions are those of the authors and do not necessarily refl ect the views of management, the reviewers, and other colleagues consulted or engaged in the preparation of the report.
xxv
About the Authors and Contributors
Colin Andrews is a Senior Economist in the Social Protection and Jobs Global Practice at the World Bank. He has over 10 years of experience working in social protection across Africa and South Asia and at the global policy level. Colin has been working on issues related to social safety net design, service delivery, and sector-related links with agriculture, education, and health. He has most recently been involved in issues in social protection fi nancing, donor harmonization, and impact evaluation. He has published widely and has managed several lending operations in the Africa Region. Prior to joining the World Bank, he worked at the Food and Agriculture Organization of the United Nations, at the European Commission, and within international nongovernmental organizations. He received his master’s degree in Economics from Trinity College, Dublin.
Kathleen Beegle is a Lead Economist in the World Bank’s Africa Region. Based in Accra, she coordinates country programs in Ghana, Liberia, and Sierra Leone in education, health, poverty, social protection, gender, and jobs. She coauthored the 2016 World Bank regional study Poverty in a Rising Africa. She was Deputy Director of World Development Report 2013, on jobs. She was in the World Bank Research Group for over a decade, where her research focused on poverty, labor, and economic shocks. She was also a lead member of the World Bank Living Standards Measurement Study team; she led in the design and implementation of national household surveys for poverty and policy analysis, as well as methodological studies on survey design. Before joining the World Bank Research Group, she worked at RAND Corporation. Kathleen holds a PhD in Economics from Michigan State University.
Th omas Bossuroy is an Economist at the World Bank, where he works primarily on social safety nets and employment programs among the poor in West Africa. In addition to managing operations in Sahel countries, Benin, Nigeria, and Togo, he leads a range of analytical activities and experiments on employment
xxvi ABOUT THE AUTHORS AND CONTRIBUTORS
and in livelihoods programs. In particular, he is managing several impact evaluations of skills development programs, productive inclusion strategies, and school feeding programs. His research also focuses on innovative service delivery strategies in health care, with a focus on combating tuberculosis in India. Prior to joining the World Bank, Th omas was a research fellow at the University of Cape Town, South Africa, where he evaluated national business development programs for the poor and vulnerable. He started his career as Executive Director of J-PAL South Asia, based in Chennai, India, where he oversaw randomized controlled trials and managed a growing organization with presence across India. Aft er dedicating his doctoral research to the dynamics of social and political structures in Africa, Th omas received a PhD in Economics from the Paris School of Economics.
Lucilla Maria Bruni is an Economist in the World Bank’s Social Protection Global Practice. Lucilla focuses on southern Africa, for which she leads a portfolio of operational and analytical activities related to social assistance, demographics, and labor markets. She also leads a series of training exercises on impact evaluation for government offi cers in Poland. In her previous assignments at the World Bank, Lucilla worked on social protection projects in East Asia and the Pacifi c and was on a fi eld assignment in Cambodia. Prior to her work at the World Bank, Lucilla did research on poverty and inequality in Guatemala and was an economics consultant in London. Lucilla holds a Master of Public Administration in International Development from Harvard University and an M.Sc. and B.Sc. from the London School of Economics.
Sarah Coll-Black is a Senior Social Protection Specialist in the Social Protection and Jobs Global Practice at the World Bank. She has over 10 years of experience working on social protection in Africa, managing the design and delivery of safety nets, including links to disaster risk management and humanitarian response, risk fi nancing, and youth employment. She coauthored the World Bank’s Social Protection Strategy for Africa (2012–22) and led the World Bank’s support to the Productive Safety Net Program in Ethiopia; she is currently focusing on West Africa. Prior to joining the World Bank, she worked in the Philippines with international organizations to extend basic services to the poorest people in Asia and the Pacifi c. She holds an MPhil from the Institute of Development Studies, University of Sussex, and an Economics degree from Dalhousie University.
Aline Coudouel is a Lead Economist with the World Bank, where she currently focuses on social assistance, social insurance, and labor markets in West Africa (especially Cabo Verde, Mauritania, and Senegal) aft er spending a few years
ABOUT THE AUTHORS AND CONTRIBUTORS xxvii
working in Latin America and the Caribbean (Colombia, the Dominican Republic, Mexico, Nicaragua, and Panama). Previously, she was part of the poverty team at the World Bank, working on debt relief and poverty reduction strategies and as a member of the team that defi ned and promoted the poverty and social impact analysis of policies. She was a coauthor of the fl agship World Development Report 2012, on gender equality and development, which sought to explain the driving forces behind gender equality and its eff ect on economic growth and helped to enhance the understanding of the role of public action in promoting this important issue. Prior to joining the Bank, she worked as a researcher for the United Nations Children’s Fund, where she focused on the welfare of children and women in Europe and Central Asia. Aline holds a PhD in Economics from the European University Institute in San Domenico di Fiesole, Italy.
Melis Guven is a Senior Social Protection Economist in the World Bank’s Africa Region. Melis focuses on safety nets and pensions and is the focal point and technical lead on pensions in the region. She is currently responsible for the social protection and labor programs of the World Bank in Botswana, Mauritius, and Seychelles. Prior to joining the Africa Region, she worked on a broad range of pension and safety net issues in Albania, Poland, Romania, and Turkey. Previously, Melis worked for the Turkish government (the Turkish Treasury) and was a core member of the health and pension reform team in Turkey. As a result, she has in-depth understanding of decision making and prioritization in governments.
Maddalena Honorati is a Senior Economist who joined the team in the Europe and Central Asia Region aft er working in the unit for strategy and operations and with teams in Africa within the Social Protection and Jobs Global Practice. Her areas of experience include social safety nets, labor market programs, skills, social protection systems, and methodological studies on household survey and administrative data collection for social protection. Before joining the Social Protection team in 2009, she worked for the Development Research Group at the World Bank on fi rm productivity, determinants of informality, and the impact of investment climate regulations on fi rm performance. Recently, her research interest has focused on the design and evaluation of social safety nets and active labor market programs as well as the measurement of social protection system performance. Maddalena holds a PhD in Economics from Bocconi University in Milan, Italy, and an MSc from Pompeu Fabra University in Barcelona, Spain. She has supported the operational implementation of programs in Albania, Armenia, Ecuador, Ghana, Kenya, and the Philippines.
xxviii ABOUT THE AUTHORS AND CONTRIBUTORS
Allan Hsiao is a PhD candidate in Economics at the Massachusetts Institute of Technology, where his research focuses on health care systems in Asia. His current research has involved studies on the rapid expansion of health care infrastructure in Indonesia, where residents benefi t from a multilayered system of hospitals, clinics, and smaller facilities that has greatly enhanced access to health care over the last few decades. Allan’s work applies frontier methods from industrial organization and development economics to draw policy prescriptions relevant to developing countries confronting rising health care needs under signifi cant resource constraints. Other projects have focused on the impacts of large-scale school construction on local labor markets in Indonesia and rural-to-urban migration in China. He has contributed to the medical literature on cardiovascular outcomes and the global burden of disease. Prior to attending the Massachusetts Institute of Technology, he received an MPhil in Economics from the University of Oxford and a bachelor’s degree in Economics from Harvard College.
Victoria Monchuk is a Senior Economist at the World Bank, where her fi elds of interest include social protection and cross-sectoral human development issues. Her work in the Social Protection and Jobs Global Practice has included supporting governments in Central and West Africa in building safety net systems and cash transfer programs. She is currently managing a decentralized service delivery program that seeks to expand equitable access to quality basic services in Ethiopia. She has also been involved in a number of assessments and evaluations of cash transfer, public works, and skills development programs. Previously, she was employed in the Fiscal Aff airs Department of the International Monetary Fund, where she was engaged in analytical work on the effi ciency of public expenditure on public health and education. Her research has focused on the impact of child labor and school achievement in Latin America.
Emma Monsalve is a Consultant in the World Bank’s Social Protection and Jobs Global Practice in Africa. She joined the Bank in 2014 and worked with the Social Protection and Jobs Global Practice and the Poverty and Equity Global Practice in the Latin America and Caribbean Region. Before joining the Bank, she worked with the Inter-American Development Bank and the Central Bank of Colombia. She has developed technical and analytical expertise on a wide array of topics, including social protection and labor, poverty, education, health, and fi scal policy. In her most recent work at the World Bank, she has focused on assessing the effi ciency and redistributional incidence of social spending in several countries in the Africa Region and the Latin America and the Caribbean Region and in designing and implementing poverty diagnostics. She has made numerous contributions to analytical work, systematic country diagnostics,
ABOUT THE AUTHORS AND CONTRIBUTORS xxix
country dialogue, lending operations, and the ASPIRE and Latin America and Caribbean Region Equity Lab databases. She holds a master’s in Applied Economics from Johns Hopkins University and a bachelor’s in Economics from the University of Antioquia in Colombia.
Laura Ralston is an Economist in the Social Protection and Jobs Global Practice at the World Bank, where she works on social insurance, human development, and labor markets. She has an interest in development in fragile and confl ict-aff ected environments and works on Social Protection and Jobs projects in several fragile countries in Africa. She has contributed to the work of the World Bank’s Fragility, Confl ict, and Violence Group by tracking the progress and identifying challenges in projects and programs in these environments. She is seeking to develop cooperative approaches within the World Bank and with external partners, with a focus on innovation and the sharing of ideas. Toward these goals, she has coordinated impact evaluations across sectors in Africa, East Asia, Latin America and the Caribbean, and South Asia and has performed confl ict and fragility analysis and monitoring in Africa and the Middle East. Laura received her PhD in Empirical Applied Microeconomics from the Massachusetts Institute of Technology. Her work there involved research on the determinants of confl ict and violence using a wide range of methodologies, including quasi-experimental regression analysis, laboratory experiments, geospatial data science, and statistical learning.
Judith Sandford is a Social Protection and Food Security Specialist with 20 years of experience, currently working as an independent consultant. She has supported the design and implementation of government-led interventions and programs of nongovernmental organizations in Sub-Saharan Africa. Her experience includes long-term support for the Productive Safety Net Program in Ethiopia (PSNP) and the National Safety Net Program (NSNP) in Kenya.

xxxi
Abbreviations
ASPIRE Atlas of Social Protection Indicators of Resilience and Equity (database)
CfW Cash for Work Program of the Youth Employment Support Project (Sierra Leone)
CGE computable general equilibrium (model)CSR corporate social responsibilityGDP gross domestic productHIV/AIDS human immunodefi ciency virus and acquired
immunodefi ciency syndromeHSNP Hunger Safety Net Program (Kenya)IDP internally displaced personIMF International Monetary FundLEAP Livelihood Empowerment against Poverty Program
(Ghana)MASAF PWP Malawi Social Action Fund Public Works ProgramMIS management information systemNGO nongovernmental organizationOVC Program Orphans and Vulnerable Children Program (Kenya)PIU project implementation unitPNBSF Programme National de Bourses de Sécurité Familiale
(National Program of Family Security Transfers) (Senegal)PPP purchasing power parityPSNP Productive Safety Net Program (Ethiopia)PSSN Productive Social Safety Net (Tanzania)SAGA semiautonomous government agency (may also refer to a
fully autonomous government agency)
xxxii ABBREVIATIONS
SCTP Social Cash Transfer Program (Malawi)UNICEF United Nations Children’s FundVUP Vision 2020 Umurenge Program (Rwanda)WDI World Development Indicators (World Bank)
All dollar amounts are in U.S. dollars, unless otherwise noted.
1
Despite economic growth and improvements in many dimensions of welfare, poverty remains a pervasive and complex phenomenon in Sub-Saharan Africa (Africa hereaft er). Approximately two people in fi ve live in poverty, and, because of shocks, many others are vulnerable to falling into poverty. Part of the agenda to tackle poverty in Africa in recent years has been the launch of social safety net programs. Largely absent from the continent until the early 2000s, social safety nets are now included in development strategies in most countries in Africa. Th e number of social safety net programs has expanded greatly. In sev-eral countries, the expansion has arisen concomitantly with signifi cant invest-ment in core instruments of national social safety net systems—such as targeting systems, social registries, and payment mechanisms—that have progressively strengthened the systems and raised their effi ciency.
Th e shift in social policy toward social safety nets refl ects a progressive evo-lution in the understanding of the role that social safety nets can play in the fi ght against poverty and vulnerability. Evidence shows that these programs can con-tribute signifi cantly and effi ciently to reducing poverty, building resilience, and boosting opportunities among the poorest.
For the full potential of social safety nets to be realized in addressing equity, resilience, and the opportunities available to poor and vulnerable populations in Africa, programs need to be brought to scale and sustained. Th is involves solving a series of technical issues to identify the parameters, tools, and pro-cesses that can deliver maximum benefi t to the poor and the vulnerable. However, at least as important, this report argues, is the series of decisive shift s that must occur in three critical areas—political, institutional, and fi scal—as follows:
• First, the political processes that shape the extent and nature of social policy need to be recognized and engaged. Th is can be done by stimulating the political appetite for social safety nets, choosing politically appropriate
Overview
Realizing the Full Potential of Social Safety Nets in Africa
2 REALIZING THE FULL POTENTIAL OF SOCIAL SAFETY NETS IN AFRICA
parameters, and harnessing the political impacts of social safety nets to pro-mote sustainability.
• Second, social safety net programs must be anchored in strong institutional arrangements to support their expansion, especially because programs are now more frequently implemented through national channels. Expansion requires anchoring in laws and policies, mechanisms for coordination and oversight, and arrangements for program management and delivery.
• Th ird, in most countries, the level and predictability of the resources devoted to the sector must be expanded so social safety nets can reach the desirable scale. Th is can be achieved through greater effi ciency, more resources, newer sources of fi nancing, and a greater ability to respond eff ectively to shocks.
This report first presents a snapshot of social safety nets in Africa and the mounting evidence for the effectiveness of these programs in promoting the well-being and productive inclusion of the poorest and most vulnerable. It then focuses on the three areas highlighted above: the political, institutional, and fiscal aspects. It does not systematically discuss technical aspects involved in designing social safety nets (see Grosh et al. 2008 for a thorough treatment). Rather, the report highlights the implications that political, institutional, and fiscal aspects have for program choice and design. It argues that these considerations are crucial to ensuring success in raising social safety nets to scale in Africa and maintaining adequate support. Ignoring these areas could lead to technically sound, but practically impos-sible, choices and designs.
Reaching the Poor and Vulnerable in Africa through Social Safety Nets (Chapter 1)
Despite Improvements, Poverty and Vulnerability to Shocks Are WidespreadPoverty rates have been falling in Africa. The share of the poor—people liv-ing on less than $1.90 a day—declined from 57 percent in 1990 to 41 percent in 2013. However, the decline was not sufficiently rapid to allow Africa to reach the Millennium Development Goal of cutting the poverty rate in half by 2015. Moreover, the number of the poor rose from about 280 million people in 1990 to 390 million people in 2013 because of high population growth. Poverty will remain a challenge in Africa even if macroeconomic growth exceeds expectations. Under a range of economic growth assump-tions, global poverty will become increasingly concentrated in Africa and in conflict-affected states (Chandy, Ledlie, and Penciakova 2013; Ravallion 2013; World Bank 2015).
REALIZING THE FULL POTENTIAL OF SOCIAL SAFETY NETS IN AFRICA 3
Poverty is not captured solely by monetary measures. Progress has also been made in Africa in nonmonetary well-being. But the rate of progress is leveling off in some places, and there has been an uptick in violent events. The region shows the worst outcomes relative to other regions on most human development indicators. One primary-school-age child in five is not in school, and children in poor households are the least likely to be in school. More than a third of young children are malnourished (appendix table C.1).
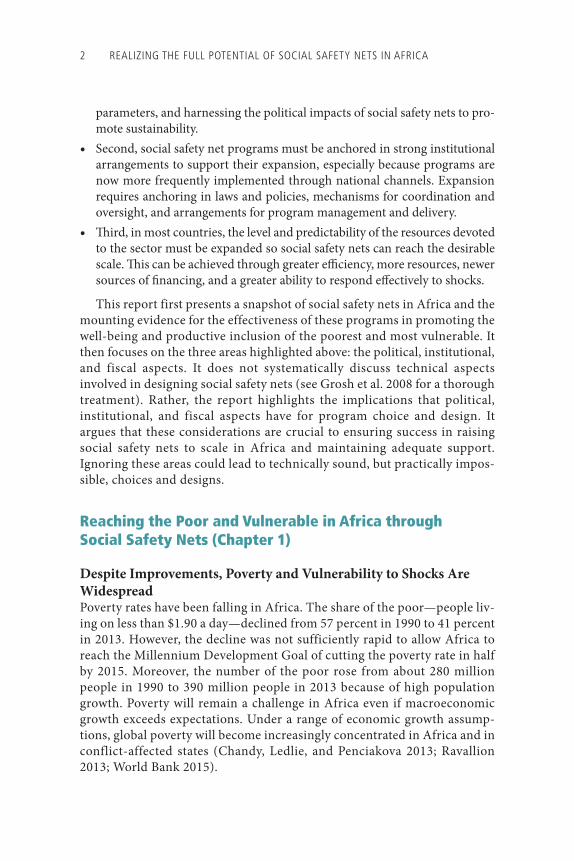
Poverty is not a static condition. Among Africa’s poor, a small positive shock to incomes could lift many out of poverty, but a small negative shock could drive as many of the vulnerable into poverty. In Africa, two poor households in fi ve are among the transient poor; that is, they are moving into or out of pov-erty as income fl uctuates and they become exposed to shocks (fi gure O.1).
Figure O.1 Poverty Is Both Chronic and Transient
0 20 40 60 80 100
MauritaniaBotswana
NigeriaCameroon
Côte d´IvoireSwaziland
GhanaChad
TanzaniaEthiopiaSenegalUganda
AverageSierra Leone
TogoZambia
Burkina FasoRwanda
MozambiqueMalawi
MadagascarCongo, Dem. Rep.
Percent
Tota
l pop
ulat
ion
(mill
ions
)
77.324.217.228.011.618.116.27.36.5
39.015.199.453.514.027.41.322.723.3182.22.34.1
Downwardly mobile Upwardly mobile Never poorChronically poor
Source: Dang and Dabalen 2017.Note: Poverty statistics refer to the latest household survey year for each country. The “chronically poor” category includes households that were poor in both periods of the analysis; “downwardly mobile” refers to households that fell into poverty in the second period; “upwardly mobile” includes those who were poor in the first period but not poor in the second period; and “never poor” includes households that were nonpoor in both periods.
4 REALIZING THE FULL POTENTIAL OF SOCIAL SAFETY NETS IN AFRICA
Many households in Africa are vulnerable to shocks such as illnesses, weather shocks, and confl ict. Th e nature of shocks is evolving and presenting new chal-lenges. As of mid-2016, Africa accounted for 30 percent of the displaced popu-lation worldwide, which represents about 20 million people. Of the top 20 countries in the world in terms of hosting displaced populations, eight are in Africa. Climate change is another obstacle to eradicating poverty in Africa (appendix tables A.1 and C.1). Households in drylands are more likely to be poor than households in other areas (Cervigni and Morris 2016; Hallegatte et al. 2016).
Social Safety Nets Have Been Expanding Rapidly in AfricaMost African countries have recently established social safety net programs as part of a broader strategy to assist the poor and protect the vulnerable (appen-dix table D.1). In this report, social safety nets—also sometimes called social assistance programs—are defi ned as noncontributory benefi ts, provided either in cash or in kind, which are intended to support the poor or the vulnerable. Th ey are a component of the larger social protection system that also includes contributory social insurance, such as pensions and health insurance, as well as labor market policies and programs, and some of the processes analyzed in this report focus more broadly on social protection systems. Programs such as universal child grants or social pensions are included, as they are noncontribu-tory and focus on groups perceived as vulnerable. Th e defi nition in this report also includes measures that facilitate access to basic services, such as health care, education, and housing, through targeted fee waivers, scholarships, and lump sum grants to promote productive inclusion. Consumer price subsidies, includ-ing energy and food subsidies, are not considered social safety net initiatives in this report. Th e objectives of social safety nets diff er and may range from reduc-ing monetary poverty, food insecurity, and vulnerabilities (such as old age, dis-ability, exposure to natural disasters, and confl ict situations) to improving access to basic services among the poor, and to promoting productive inclusion for the poorest.
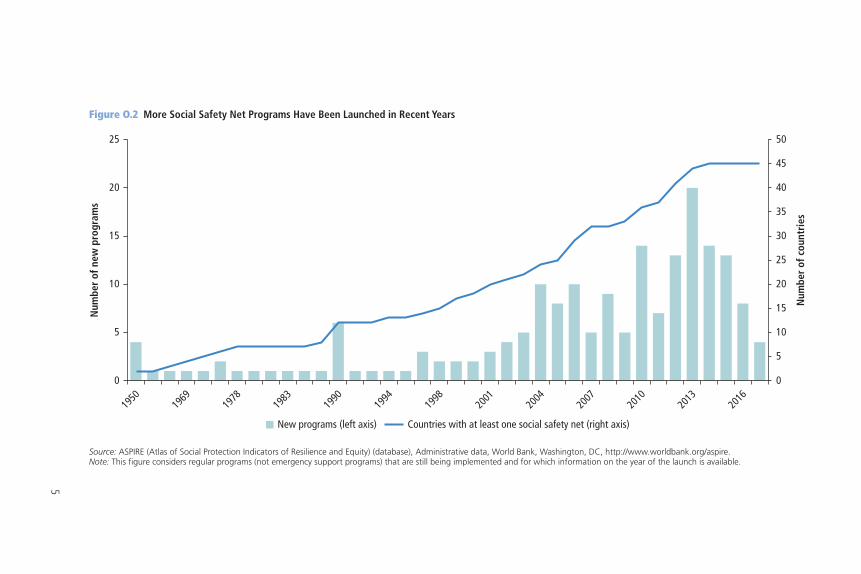
Th e average number of new social safety net programs launched in Africa each year rose from 7 in 2001–09 to 14 in 2010–15 (fi gure O.2). Every African country has at least one social safety net program. Th e average number of pro-grams per country is 15, ranging from 2 in the Republic of Congo and Gabon to 56 in Burkina Faso and 54 in Chad (appendix tables E.1 and E.2). Th is trend has also been a global one. By 2015, every country in the world was implement-ing at least one social safety net program.
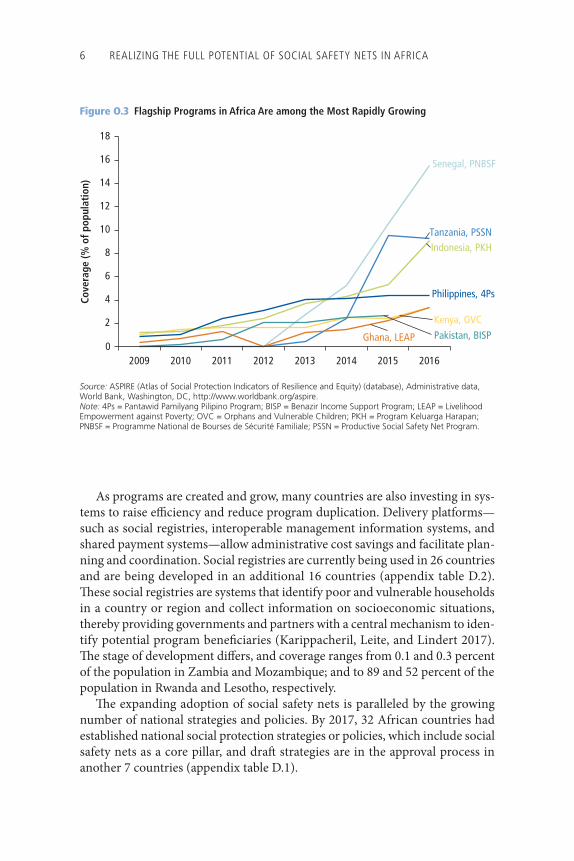
Th ere are success stories of rapid expansion in the region that are unique in the developing world (such as in Ghana, Kenya, Senegal, and Tanzania; see fi gure O.3). However, these remain exceptions in the region, and most programs are implemented on a much smaller scale.
5
Figure O.2 More Social Safety Net Programs Have Been Launched in Recent Years
0
5
10
15
20
25
30
35
40
45
50
0
5
10
15
20
25
1950
1969
1978
1983
1990
1994
1998
2001
2004
2007
2010
2013
2016
Num
ber
of c
ount
ries
Num
ber
of n
ew p
rogr
ams
New programs (left axis) Countries with at least one social safety net (right axis)
Source: ASPIRE (Atlas of Social Protection Indicators of Resilience and Equity) (database), Administrative data, World Bank, Washington, DC, http://www.worldbank.org/aspire.Note: This figure considers regular programs (not emergency support programs) that are still being implemented and for which information on the year of the launch is available.
6 REALIZING THE FULL POTENTIAL OF SOCIAL SAFETY NETS IN AFRICA
As programs are created and grow, many countries are also investing in sys-tems to raise effi ciency and reduce program duplication. Delivery platforms—such as social registries, interoperable management information systems, and shared payment systems—allow administrative cost savings and facilitate plan-ning and coordination. Social registries are currently being used in 26 countries and are being developed in an additional 16 countries (appendix table D.2). Th ese social registries are systems that identify poor and vulnerable households in a country or region and collect information on socioeconomic situations, thereby providing governments and partners with a central mechanism to iden-tify potential program benefi ciaries (Karippacheril, Leite, and Lindert 2017). Th e stage of development diff ers, and coverage ranges from 0.1 and 0.3 percent of the population in Zambia and Mozambique; and to 89 and 52 percent of the population in Rwanda and Lesotho, respectively.
Th e expanding adoption of social safety nets is paralleled by the growing number of national strategies and policies. By 2017, 32 African countries had established national social protection strategies or policies, which include social safety nets as a core pillar, and draft strategies are in the approval process in another 7 countries (appendix table D.1).
Figure O.3 Flagship Programs in Africa Are among the Most Rapidly Growing
0
2
4
6
8
10
12
14
16
18
2009 2010 2011 2012 2013 2014 2015 2016
Cove
rage
(% o
f pop
ulat
ion)
Senegal, PNBSF
Tanzania, PSSNIndonesia, PKH
Philippines, 4Ps
Ghana, LEAP
Kenya, OVCPakistan, BISP
Source: ASPIRE (Atlas of Social Protection Indicators of Resilience and Equity) (database), Administrative data, World Bank, Washington, DC, http://www.worldbank.org/aspire.Note: 4Ps = Pantawid Pamilyang Pilipino Program; BISP = Benazir Income Support Program; LEAP = Livelihood Empowerment against Poverty; OVC = Orphans and Vulnerable Children; PKH = Program Keluarga Harapan; PNBSF = Programme National de Bourses de Sécurité Familiale; PSSN = Productive Social Safety Net Program.
REALIZING THE FULL POTENTIAL OF SOCIAL SAFETY NETS IN AFRICA 7
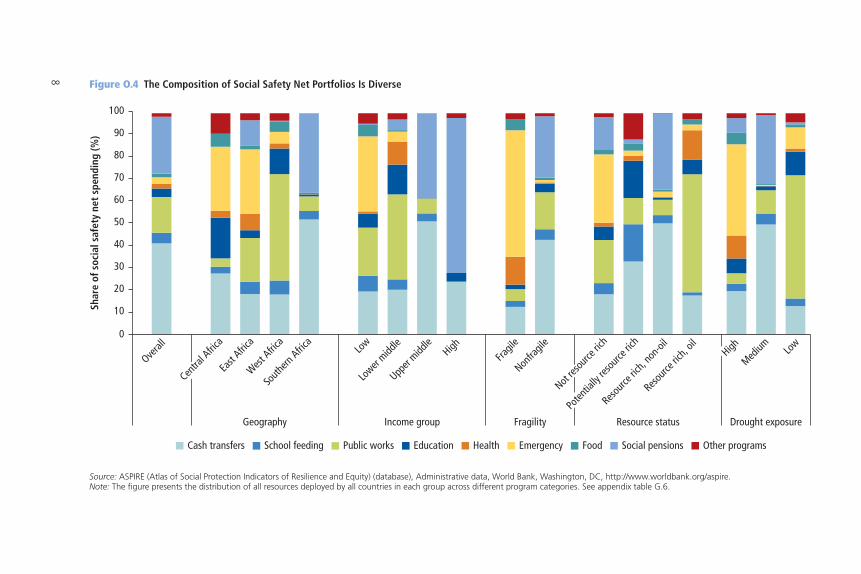
Th e Design of Social Safety Nets Varies across AfricaFigure O.4 highlights the variety in design across the region, as well as patterns observed among groups of countries depending on geographic location, income, fragility, and drought exposure. Cash transfer programs are implemented in almost all countries (46), as well as public works programs (33) and school feeding programs (28) (appendix table E.1). Overall, cash transfers account for 41 percent of total spending, and this share is growing. Social pensions are more prevalent in upper-middle- and high-income coun-tries and in Southern Africa. Public works programs exist in almost all low-income countries and fragile states, especially in West Africa, but are largely absent in middle- and high-income countries. In Central Africa and fragile states, social safety nets are widely used as responses to shocks, and emergency and food-based programs are the most common types of programs.
Social Safety Nets Are EvolvingAs programs have grown in number and size, program design features have also evolved. First, there has been a shift toward more use of cash in social safety nets. Second, social safety nets are playing an expanding role in country responses to climate change and human-made shocks. Th ird, an increasing number of programs are focusing on fostering the productive capacity and resil-ience of benefi ciary households. Similarly, there has been a greater concentra-tion on promoting human capital development, often associated with conditional programs. Because of urbanization and the rising number of the urban poor, recent years have witnessed an increase in social safety nets in urban areas. Finally, countries have gradually been emphasizing the establish-ment of tools and systems to boost program effi ciency and coordination.
Social Safety Nets Are Reaching Some, but Many of the Poor Are Not CoveredTh e programs with the greatest coverage of age-relevant populations are school feeding and fee waiver programs. With a few exceptions, richer countries tend to run larger programs. Th e majority of social safety nets in Africa are directly or indirectly targeted to children because they assist households with children. Of all programs, 29 percent directly target children through nutrition interven-tions, benefi ts aimed at orphans and other vulnerable children, school feeding programs, the provision of school supplies, and education benefi ts or fee waivers (appendix table E.3). As a result, the average coverage of children is 15 percent in Africa (appendix table F.2). (Coverages rates of the elderly are around 100 percent in countries with universal old-age social pensions, such as Botswana, Lesotho, Mauritius, Namibia, Seychelles, and Swaziland; appendix table F.1.)
8
Figure O.4 The Composition of Social Safety Net Portfolios Is Diverse
0
10
20
30
40
50
60
70
80
90
100
East
Africa
West Afric
aSo
uthern
Africa
Upper
middle
High
Nonfra
gile
Resourc
e rich
, non
-oil
Resourc
e rich
, oil
Medium Lo
w
Geography Income group Fragility Resource status Drought exposure
Shar
e of
soc
ial s
afet
y ne
t sp
endi
ng (%
)
Overal
l
Centra
l Afric
a
Low
Lower
middle
Fragil
e
Not res
ource
rich
Poten
tially
reso
urce r
ich
High
Other programsSocial pensionsEmergency FoodHealthEducationPublic worksSchool feedingCash transfers
Source: ASPIRE (Atlas of Social Protection Indicators of Resilience and Equity) (database), Administrative data, World Bank, Washington, DC, http://www.worldbank.org/aspire.Note: The figure presents the distribution of all resources deployed by all countries in each group across different program categories. See appendix table G.6.
REALIZING THE FULL POTENTIAL OF SOCIAL SAFETY NETS IN AFRICA 9
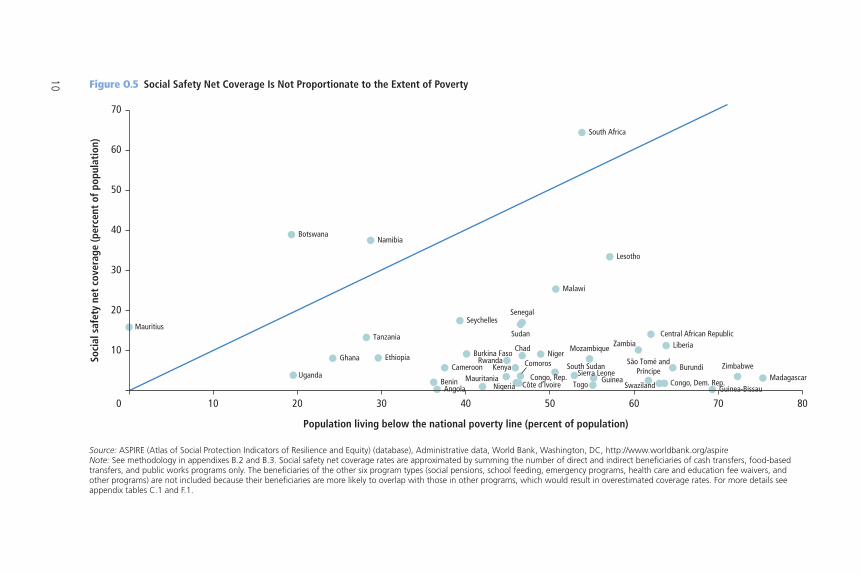
Th ough the number of social safety net programs has risen, coverage is oft en limited. On average, coverage is 10 percent of the African population (appendix tables F.1 and F.2). Poverty rates are higher than coverage rates in most coun-tries (fi gure O.5). So, even if all existing social safety nets were perfectly targeted to the poor, not all poor households would be reached at the current scale of programs (in addition, benefits are typically low compared to needs). Meanwhile, some programs do not exclusively target the poor, but have broader objectives, such as universal old-age social pensions, school lunch programs for all primary-school students, scholarships for all students in tertiary education, or the targeting of specifi c categories in the population deemed vulnerable with-out necessarily taking population welfare characteristics into account.
Notwithstanding the issue of program objectives, the benefi t incidence of selected programs that target on the basis of welfare or vulnerability are gener-ally pro-poor, and the performance of programs in Africa is in line with inter-national experience. For instance, more than 60 percent of the households benefi ting from the South Africa Child Support Grants program belong to the poorest two quintiles of the national consumption distribution, and over 60 percent of the benefi ciaries of the Malawi Social Action Fund are counted among the poor (chapter 1). However, a certain share of resources goes to richer households. Some limitations in targeting are technical: it is diffi cult and costly to assess the welfare status of households eff ectively and dynamically. However, the decision to target particular groups is also a political one. Indeed, selecting eligible groups is sometimes driven by the need to generate support among the population and decision makers for social safety net programs (chapter 3).
Low coverage rates are exacerbated by the fact that many programs are small or temporary initiatives implemented in isolation, in narrow geographical areas, or among discrete population groups. Program duplication also occurs, oft en within a weak institutional environment. Th is is the situation in Uganda and Zimbabwe, for instance, which implement 39 and 29 social safety net programs, respectively (appendix table E.1). Insuffi cient coordination among the develop-ment partners that oft en fund such programs exacerbates fragmentation and ineffi ciencies. Eff orts to consolidate and rationalize programs are on the policy agendas of many countries, including the need to focus on a strong institutional framework for social safety nets (chapter 4).
Benefi t amounts in social safety net programs are low relative to needs in low-income countries in the region. Th e highest benefi ts are usually off ered through old-age social pensions or public works, followed by cash transfer pro-grams. Average cash transfers correspond to 10 percent of the national poverty line in low-income countries, versus 57 percent for public works (see chapter 1, table 1.3 and appendix table I.1, for data and assumptions). Greater effi ciency in implementation would help support a rise in the value of benefi ts, but elevating
10 Figure O.5 Social Safety Net Coverage Is Not Proportionate to the Extent of Poverty
AngolaBenin
Botswana
Burkina Faso
BurundiCameroon
Central African Republic
Chad
Comoros
Congo, Dem. Rep.Congo, Rep.
Côte d’Ivoire
EthiopiaGhana
Guinea-Bissau
Kenya
Lesotho
Liberia
Malawi
MadagascarMauritania
Mauritius
Mozambique
Namibia
Niger
Nigeria
Rwanda São Tomé andPríncipe
SenegalSeychelles
GuineaSierra Leone
South Africa
South Sudan
Sudan
Swaziland
Tanzania
TogoUganda
Zambia
Zimbabwe
0
10
20
30
40
50
60
70
10 20 30 40 50 60 70 80
Population living below the national poverty line (percent of population)
Soci
al s
afet
y ne
t co
vera
ge (p
erce
nt o
f pop
ulat
ion)
Source: ASPIRE (Atlas of Social Protection Indicators of Resilience and Equity) (database), Administrative data, World Bank, Washington, DC, http://www.worldbank.org/aspireNote: See methodology in appendixes B.2 and B.3. Social safety net coverage rates are approximated by summing the number of direct and indirect beneficiaries of cash transfers, food-based transfers, and public works programs only. The beneficiaries of the other six program types (social pensions, school feeding, emergency programs, health care and education fee waivers, and other programs) are not included because their beneficiaries are more likely to overlap with those in other programs, which would result in overestimated coverage rates. For more details see appendix tables C.1 and F.1.
REALIZING THE FULL POTENTIAL OF SOCIAL SAFETY NETS IN AFRICA 11
these programs to scale would also require a focus on sustainable fi nancing for social safety nets (chapter 5).
Some Countries Spend Heavily, but Programs Must Be Brought to Scale and SustainedWhile African countries spend an average 1.2 percent of gross domestic product (GDP) on social safety nets (equivalent to 4.8 percent of total government expenditures), government commitment varies greatly across countries at simi-lar income levels. Th e average spending in the developing world is comparable, at 1.6 percent of GDP, but the fi scal needs in Africa are greater given the depth of poverty.
Notwithstanding the need to raise domestic resources and grow the econ-omy, government spending on other initiatives that have objectives similar to social safety nets can be large. Spending on energy subsidies, for example, is considerable in some countries. In Central Africa, it is more than three times the spending on social safety nets (chapter 1, fi gure 1.12 and appendix table G.1). Because these subsidies benefi t all consumers and because richer house-holds consume larger quantities of energy, such subsidies are regressive. Th is points to the political considerations that underpin government spending choices (chapter 3) and to the potential effi ciency gains from reallocation.
In many countries, the current stock of social safety net programs lacks fi scal sustainability. Development partners fund more than half the social safety net fi nancing in the majority of African countries. Th ere are large variations, though, and the governments of Angola, Botswana, Gabon, Ghana, Kenya, Mauritania, Mauritius, Senegal, Seychelles, and Sudan fi nance over 60 percent of their social safety net spending. Humanitarian aid represents the main source of funding in emergency situations, and the role of development partners is critical in many low-income and fragile contexts.
Social Safety Nets Promote Poverty Reduction, Increase Resilience, and Expand Opportunities (Chapter 2)
In parallel with the expansion of social safety net projects in the region, there has also been growing evidence on the impacts of social safety nets on equity (such as through poverty reduction and food security), resilience, and oppor-tunities among the poor and vulnerable. Th e depth of recent evidence serves as a case for investment in social safety nets, for the eff ective design of programs, and for bringing programs to scale. A meta-analysis has been undertaken to pool evidence systematically across available studies and to facilitate a robust and consistent comparison of the impacts on key outcomes.
12 REALIZING THE FULL POTENTIAL OF SOCIAL SAFETY NETS IN AFRICA
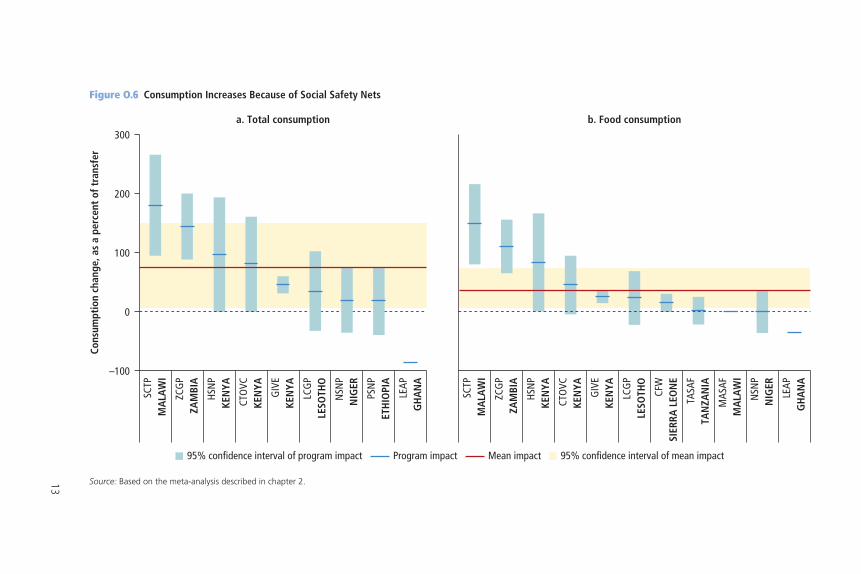
Social Safety Nets Improve EquityTh e equity objective of social safety nets—to ensure that the most vulnerable and poorest households are able to reach a minimum level of consumption and cover their basic needs—is oft en central in low-income settings where poverty is most severe. Social safety nets have been shown to boost consumption and thereby lower poverty. Household consumption rises by an average $0.74 for each $1.00 transferred (fi gure O.6). In Ethiopia in 2011, the direct eff ect of transfers to rural households through the Productive Safety Net Program (PSNP) and food aid has been estimated as equivalent to a reduction of 1.6 percentage points in the national poverty rate. If social safety nets are brought to scale, simulation scenarios show that average transfers of $50 a month can reduce the poverty rate by up to 40 percent.
Households do not spend all the cash from social safety nets on consum-ables; they allocate some to productive investments, lumpy expenditures such as school fees, and savings. Th e vast majority of evidence shows that households do not use transfers on temptation goods, such as alcohol or tobacco.
Cash from social safety nets can also stimulate the demand for retail goods, services, and agricultural goods in local economies. Th rough such spillovers, nonbenefi ciaries can also gain. For each $1 transferred to benefi ciaries, nonben-efi ciaries can experience estimated income increases of $0.30 or more. Together with the impacts on benefi ciaries, these additional income eff ects lead to local economy multipliers of 1.08 to 1.84; that is, each dollar transferred through a social safety net to a benefi ciary household is projected to add more than a dol-lar to the local economy (Taylor, Th ome, and Filipski 2014; Taylor et al. 2013, 2014; Th ome et al. 2014a, 2014b).
Building Resilience through Social Safety NetsSocial safety nets can help build household resilience to shocks. If poor house-holds are able to rely on regular support from safety nets, they can avoid resort-ing to costly and oft en irreversible coping strategies, such as selling their most productive assets at defl ated prices or taking children out of school.
Social safety net programs also help boost savings and foster the inclusion of benefi ciaries in local community networks. Benefi ciary households are between 4 and 20 percentage points more likely to be saving relative to comparable non-benefi ciary households. Given the initial low savings rate among such house-holds, this implies an expansion by a factor of almost two in the incidence of savings. Evaluations suggest that households are also using transfers to reduce borrowing and indebtedness. Social safety net programs do not appear to crowd out private transfers (from family and friends), which can be a critical lifeline for poor families.
Th ere is encouraging evidence suggesting that social safety net transfers can successfully boost investment in productive assets, especially livestock holdings,
13
Figure O.6 Consumption Increases Because of Social Safety Nets
Source: Based on the meta-analysis described in chapter 2.
–100
0
100
200
300a. Total consumption b. Food consumption
Cons
umpt
ion
chan
ge, a
s a
perc
ent
of t
rans
fer
SCTP
MA
LAW
I
ZCG
PZA
MBI
A
HSN
PKE
NYA
CTO
VCKE
NYA
GIV
EKE
NYA
LCG
PLE
SOTH
O
NSN
PN
IGER
PSN
PET
HIO
PIA
LEAP
GH
AN
A
SCTP
MA
LAW
I
ZCG
PZA
MBI
A
HSN
PKE
NYA
CTO
VCKE
NYA
GIV
EKE
NYA
LCG
PLE
SOTH
O
CFW
SIER
RA L
EON
E
TASA
FTA
NZA
NIA
MAS
AFM
ALA
WI
NSN
PN
IGER
LEAP
GH
AN
A
95% confidence interval of program impact 95% confidence interval of mean impactProgram impact Mean impact
14 REALIZING THE FULL POTENTIAL OF SOCIAL SAFETY NETS IN AFRICA
which represent an alternate form of savings. For example, livestock ownership rose an average of 34 percent across seven programs reporting on this outcome.
Adverse coping strategies, including the use of child labor, can also be avoided if households have access to social safety nets. Programs specifi cally targeted at children appear to reduce child labor the most, and strong commu-nication strategies advocating for the rights and well-being of children may help generate these results.
Increasing Opportunities through Social Safety NetsBy fostering opportunities, including through investment in human capital and productive activities, social safety nets grow the incomes of poor households now and for the benefi t of the next generation.
Social safety nets promote investments in children’s education. In Africa, programs lead to an average 6 percent rise in school attendance and a 7 percent improvement in enrollments relative to baseline rates. Th ese impacts are modest and refl ect the high rates of lower-primary enrollment prior to program implementation. Improvements are especially pronounced in upper-primary and secondary school, where the enrollment is lower, though the barriers are also greater. Th e improvements are consistent with decreased child labor and increases in expenditures on schooling, such as the purchase of uniforms and school supplies, as well as fee payments. Th ere is a lack of evidence on the impacts of social safety nets on skills and learning.
Th e impact of social safety nets on health care is limited. Several studies report on this outcome, but no signifi cant average eff ect has been found, refl ect-ing both the demand and supply side constraints and the speed at which pro-gram impacts can be realized. Where promising results emerge, they are oft en related to investments in younger infants, for example, child growth monitoring under South Africa’s Child Support Grant Program or exclusive breastfeeding in Niger’s Safety Net Project. In both health care and education, simulations indicate that social safety nets will have the largest impact on the poorest house-holds that are most likely to otherwise miss out.
Th e transformative potential of social safety nets to boost education and health care outcomes hinges on the adequacy of public services. To realize gains, the quantity and quality of basic services must be improved. Th is is also a prin-ciple in agriculture and in water and sanitation.
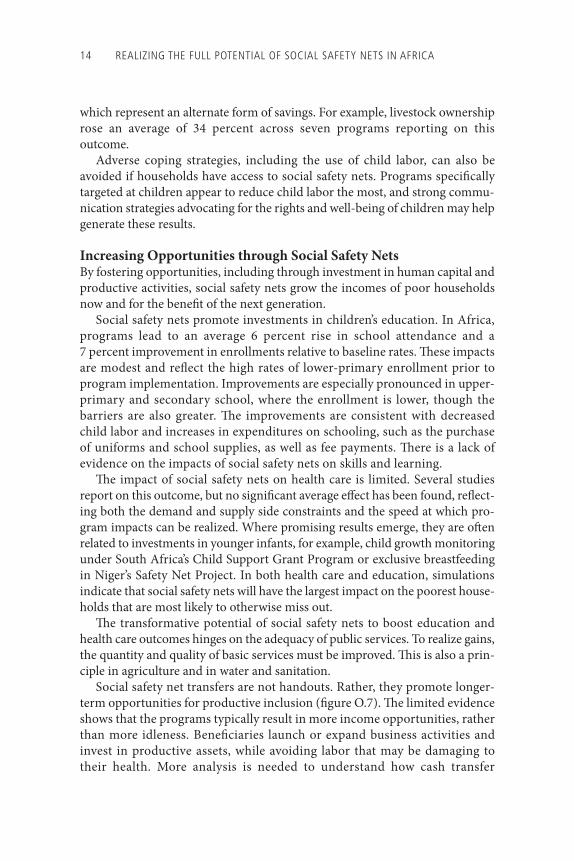
Social safety net transfers are not handouts. Rather, they promote longer-term opportunities for productive inclusion (fi gure O.7). Th e limited evidence shows that the programs typically result in more income opportunities, rather than more idleness. Benefi ciaries launch or expand business activities and invest in productive assets, while avoiding labor that may be damaging to their health. More analysis is needed to understand how cash transfer
15
–100
0
100
250
a. Business b. Farm work c. Earnings
Perc
ent
of b
asel
ine
CFW
SIER
RA L
EON
EHS
NP
KEN
YAPS
NP
ETH
IOPI
AZC
GP
ZAM
BIA
SCTP
MA
LAW
ICT
OVC
KEN
YAG
IVE
KEN
YALE
APG
HA
NA
LCG
PLE
SOTH
OSC
TPP
ETH
IOPI
A
SCTP
MA
LAW
ILC
GP
LESO
THO
HSN
PKE
NYA
ZCG
PZA
MBI
AG
IVE
CTO
VCKE
NYA
KEN
YA
LCG
PLE
SOTH
OZC
GP
ZAM
BIA
SCTP
MA
LAW
ICF
WSI
ERRA
LEO
NE
GIV
EKE
NYA
PSN
PET
HIO
PIA
–50
350
300
200
150
50
95% confidence interval of program impact 95% confidence interval of mean impactProgram impact Mean impact
Figure O.7 Income Opportunities May Respond to Social Safety Nets
Source: Based on the meta-analysis described in chapter 2. “Business” refers to the household operating a nonfarm business (almost always small-scale or microenterprise business activities). Specific definitions of “Earnings” vary across studies.
16 REALIZING THE FULL POTENTIAL OF SOCIAL SAFETY NETS IN AFRICA
programs can become a foundation on which to build engagement in comple-mentary productive programs.
Bringing Social Safety Nets to ScaleSocial safety nets in Africa do not yet cover all poor households. What impacts could be realized if programs were expanded to cover all poor households? Using data available from household surveys, alongside the results of the study’s meta-analysis, this question is explored through simulations for three countries (Ghana, Liberia, and Niger), which assume that the number of benefi ciary households would reach the number of extremely poor households in each country.
Th e simulations show that even relatively modest transfers ($50 per house-hold per month) would have a sizable impact on consumption among benefi -ciaries. If transfers were perfectly targeted, consumption among the poor would increase within a range of 12 percent–17 percent. Th ese consumption gains would generate a decline in poverty rates by as much as 40 percent. Th e most substantial impacts would be realized with perfect targeting, but even imperfect targeting would reduce poverty in all three countries.
Th e impacts of expansion reach other facets of household life. Simulations indicate that ownership of livestock among the poor would rise. Likewise, well-targeted programs may raise landownership. Both can put households on a pathway out of poverty.
Overall, evidence clearly shows that social safety net programs can contrib-ute signifi cantly and effi ciently to reducing poverty, building resilience, and boosting opportunities. For the full potential of social safety nets to be realized, these programs need to be brought up to scale and sustained. While this involves many technical decisions (box O.1), a series of decisive shift s must simultane-ously occur in three other critical areas: political, institutional, and fi scal. Th ese are explored in turn in the following chapters.
BOX O.1
Design Lessons in Bringing Social Safety Nets to ScaleA number of lessons emerge from the evaluations of program impacts in chapter 2 with regard to the design of programs and bringing social safety nets to scale:
• First, the value of a cash transfer matters. Ensuring impacts requires suffi ciently large transfers.
• Second, the impact of programs relies on predictability. If benefi ts are not delivered with regularity, households cannot use them as effectively. As programs go to scale,
(continued next page)
REALIZING THE FULL POTENTIAL OF SOCIAL SAFETY NETS IN AFRICA 17
fi scal sustainability (i.e., regular funding) is needed to ensure that programs reach maximum impact.
• Third, coordination with complementary programs, such as skills training or other employment schemes, is critical for maximizing resilience and promoting productive inclusion. As social safety nets grow, there will be a greater need for a sound institutional framework to tie programs together.
• Fourth, as programs grow, so will the demand for other services, such as schools, health care, and agricultural extension. The access to and quality of services become central instruments in maximizing program impacts. Achieving such impacts will then require institutional coordination as well as more investments in these services.
Box O.1 (continued)
Recognizing and Leveraging Politics to Expand and Sustain Social Safety Nets (Chapter 3)
Th e impressive rate of expansion of social safety nets across Africa in the past decade proves that ideas, preferences, and political platforms can change even in places where the political environment might initially be unsupportive. Political dynamics evolve, and windows of opportunity open. Th ese processes represent an opportunity to build sustainable, large-scale social safety net systems. Th e technical work of designing these systems should not ignore the political dimen-sions of social policy. Understanding and addressing the political processes and political economy behind social policy are as relevant and necessary as any tech-nical assessment for craft ing and implementing ambitious programs.
Th is study considers three main points of interaction between politics and social safety nets (fi gure O.8). First, the scope of social safety nets depends on political acceptability and desirability, which depend on social norms, the prev-alence of poverty, and ideological factors such as the perceived causes of poverty and preferences for redistribution. Second, the choice of program and design parameters is infl uenced by political preferences and incentives and in turn infl uences the commitment to programs. Th ird, there is a feedback loop: the implementation of social safety net programs shapes the political environment. Politicians and citizens adjust their preferences and incentives and redefi ne their relationship as social safety net programs are implemented.
Th e Political Appetite for Adopting and Expanding Social Safety NetsPolitical appetite is critical for expanding social safety nets and bringing them to scale, and for shaping social protection policies and programs more broadly. Th is appetite results from many factors. Here, the focus is on three factors that underpin a country’s appetite for the adoption or expansion of social safety net
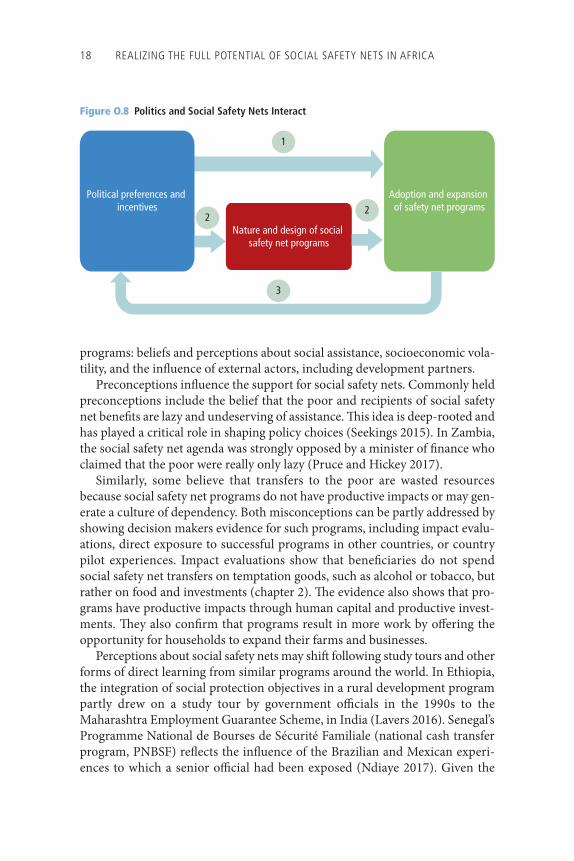
18 REALIZING THE FULL POTENTIAL OF SOCIAL SAFETY NETS IN AFRICA
programs: beliefs and perceptions about social assistance, socioeconomic vola-tility, and the infl uence of external actors, including development partners.
Preconceptions infl uence the support for social safety nets. Commonly held preconceptions include the belief that the poor and recipients of social safety net benefi ts are lazy and undeserving of assistance. Th is idea is deep-rooted and has played a critical role in shaping policy choices (Seekings 2015). In Zambia, the social safety net agenda was strongly opposed by a minister of fi nance who claimed that the poor were really only lazy (Pruce and Hickey 2017).
Similarly, some believe that transfers to the poor are wasted resources because social safety net programs do not have productive impacts or may gen-erate a culture of dependency. Both misconceptions can be partly addressed by showing decision makers evidence for such programs, including impact evalu-ations, direct exposure to successful programs in other countries, or country pilot experiences. Impact evaluations show that benefi ciaries do not spend social safety net transfers on temptation goods, such as alcohol or tobacco, but rather on food and investments (chapter 2). Th e evidence also shows that pro-grams have productive impacts through human capital and productive invest-ments. Th ey also confi rm that programs result in more work by off ering the opportunity for households to expand their farms and businesses.
Perceptions about social safety nets may shift following study tours and other forms of direct learning from similar programs around the world. In Ethiopia, the integration of social protection objectives in a rural development program partly drew on a study tour by government offi cials in the 1990s to the Maharashtra Employment Guarantee Scheme, in India (Lavers 2016). Senegal’s Programme National de Bourses de Sécurité Familiale (national cash transfer program, PNBSF) refl ects the infl uence of the Brazilian and Mexican experi-ences to which a senior offi cial had been exposed (Ndiaye 2017). Given the
Figure O.8 Politics and Social Safety Nets Interact
22
1
3
Political preferences and incentives
Nature and design of social safety net programs
Adoption and expansion of safety net programs
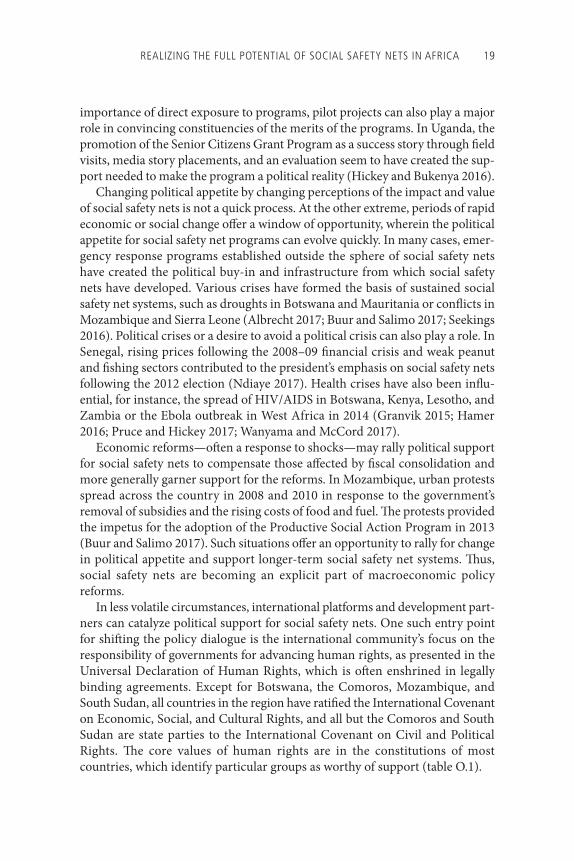
REALIZING THE FULL POTENTIAL OF SOCIAL SAFETY NETS IN AFRICA 19
importance of direct exposure to programs, pilot projects can also play a major role in convincing constituencies of the merits of the programs. In Uganda, the promotion of the Senior Citizens Grant Program as a success story through fi eld visits, media story placements, and an evaluation seem to have created the sup-port needed to make the program a political reality (Hickey and Bukenya 2016).
Changing political appetite by changing perceptions of the impact and value of social safety nets is not a quick process. At the other extreme, periods of rapid economic or social change off er a window of opportunity, wherein the political appetite for social safety net programs can evolve quickly. In many cases, emer-gency response programs established outside the sphere of social safety nets have created the political buy-in and infrastructure from which social safety nets have developed. Various crises have formed the basis of sustained social safety net systems, such as droughts in Botswana and Mauritania or confl icts in Mozambique and Sierra Leone (Albrecht 2017; Buur and Salimo 2017; Seekings 2016). Political crises or a desire to avoid a political crisis can also play a role. In Senegal, rising prices following the 2008–09 fi nancial crisis and weak peanut and fi shing sectors contributed to the president’s emphasis on social safety nets following the 2012 election (Ndiaye 2017). Health crises have also been infl u-ential, for instance, the spread of HIV/AIDS in Botswana, Kenya, Lesotho, and Zambia or the Ebola outbreak in West Africa in 2014 (Granvik 2015; Hamer 2016; Pruce and Hickey 2017; Wanyama and McCord 2017).
Economic reforms—oft en a response to shocks—may rally political support for social safety nets to compensate those aff ected by fi scal consolidation and more generally garner support for the reforms. In Mozambique, urban protests spread across the country in 2008 and 2010 in response to the government’s removal of subsidies and the rising costs of food and fuel. Th e protests provided the impetus for the adoption of the Productive Social Action Program in 2013 (Buur and Salimo 2017). Such situations off er an opportunity to rally for change in political appetite and support longer-term social safety net systems. Th us, social safety nets are becoming an explicit part of macroeconomic policy reforms.
In less volatile circumstances, international platforms and development part-ners can catalyze political support for social safety nets. One such entry point for shift ing the policy dialogue is the international community’s focus on the responsibility of governments for advancing human rights, as presented in the Universal Declaration of Human Rights, which is oft en enshrined in legally binding agreements. Except for Botswana, the Comoros, Mozambique, and South Sudan, all countries in the region have ratifi ed the International Covenant on Economic, Social, and Cultural Rights, and all but the Comoros and South Sudan are state parties to the International Covenant on Civil and Political Rights. Th e core values of human rights are in the constitutions of most countries, which identify particular groups as worthy of support (table O.1).
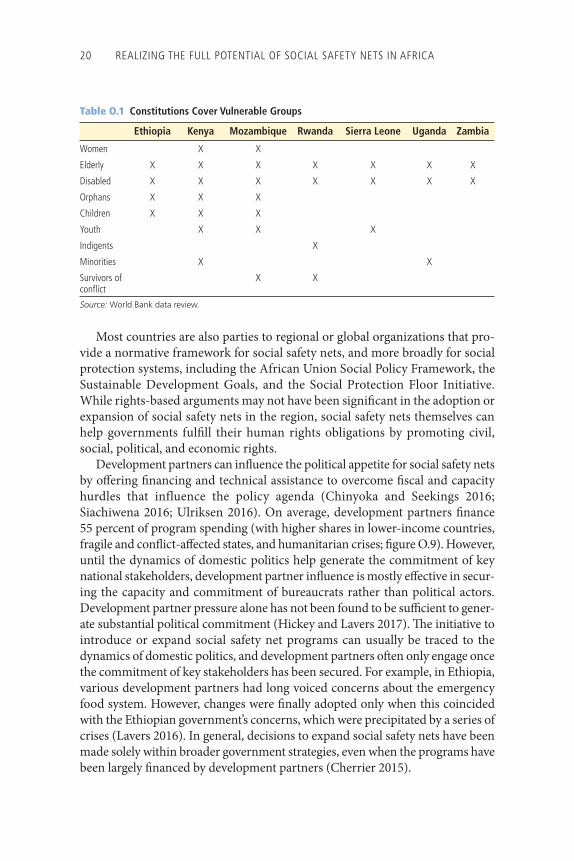
20 REALIZING THE FULL POTENTIAL OF SOCIAL SAFETY NETS IN AFRICA
Table O.1 Constitutions Cover Vulnerable Groups
Ethiopia Kenya Mozambique Rwanda Sierra Leone Uganda Zambia
Women X X
Elderly X X X X X X X
Disabled X X X X X X X
Orphans X X X
Children X X X
Youth X X X
Indigents X
Minorities X X
Survivors of confl ict
X X
Source: World Bank data review.
Most countries are also parties to regional or global organizations that pro-vide a normative framework for social safety nets, and more broadly for social protection systems, including the African Union Social Policy Framework, the Sustainable Development Goals, and the Social Protection Floor Initiative. While rights-based arguments may not have been signifi cant in the adoption or expansion of social safety nets in the region, social safety nets themselves can help governments fulfi ll their human rights obligations by promoting civil, social, political, and economic rights.
Development partners can infl uence the political appetite for social safety nets by off ering fi nancing and technical assistance to overcome fi scal and capacity hurdles that influence the policy agenda (Chinyoka and Seekings 2016; Siachiwena 2016; Ulriksen 2016). On average, development partners fi nance 55 percent of program spending (with higher shares in lower-income countries, fragile and confl ict-aff ected states, and humanitarian crises; fi gure O.9). However, until the dynamics of domestic politics help generate the commitment of key national stakeholders, development partner infl uence is mostly eff ective in secur-ing the capacity and commitment of bureaucrats rather than political actors. Development partner pressure alone has not been found to be suffi cient to gener-ate substantial political commitment (Hickey and Lavers 2017). Th e initiative to introduce or expand social safety net programs can usually be traced to the dynamics of domestic politics, and development partners oft en only engage once the commitment of key stakeholders has been secured. For example, in Ethiopia, various development partners had long voiced concerns about the emergency food system. However, changes were fi nally adopted only when this coincided with the Ethiopian government’s concerns, which were precipitated by a series of crises (Lavers 2016). In general, decisions to expand social safety nets have been made solely within broader government strategies, even when the programs have been largely fi nanced by development partners (Cherrier 2015).
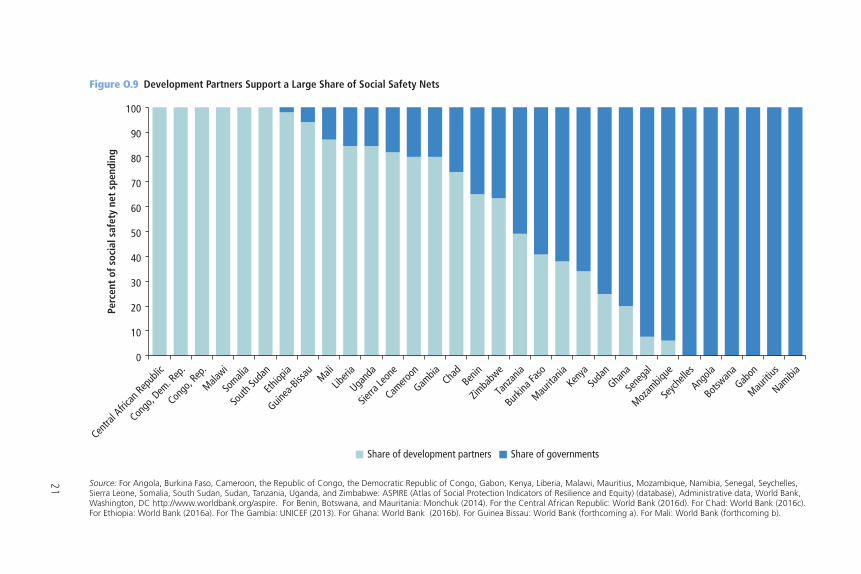
21
Figure O.9 Development Partners Support a Large Share of Social Safety Nets
0
10
20
30
40
50
60
70
80
90
100
Centra
l Afric
an Rep
ublic
Congo
, Dem
. Rep
.Con
go, R
ep.
Malawi
Somali
aSo
uth Su
dan
Ethiop
ia
Guinea
-Bissau Mali
Liberi
aUga
nda
Sierra
Leon
eCam
eroon
Gambia Cha
dBen
inZim
babw
eTa
nzan
iaBurk
ina Fa
soMau
ritania
Kenya
Suda
nGha
naSe
nega
lMoz
ambiq
ueSe
ychell
esAng
olaBots
wana
Gabon
Mauriti
usNam
ibia
Perc
ent
of s
ocia
l saf
ety
net
spen
ding
Share of development partners Share of governments
Source: For Angola, Burkina Faso, Cameroon, the Republic of Congo, the Democratic Republic of Congo, Gabon, Kenya, Liberia, Malawi, Mauritius, Mozambique, Namibia, Senegal, Seychelles, Sierra Leone, Somalia, South Sudan, Sudan, Tanzania, Uganda, and Zimbabwe: ASPIRE (Atlas of Social Protection Indicators of Resilience and Equity) (database), Administrative data, World Bank, Washington, DC http://www.worldbank.org/aspire. For Benin, Botswana, and Mauritania: Monchuk (2014). For the Central African Republic: World Bank (2016d). For Chad: World Bank (2016c). For Ethiopia: World Bank (2016a). For The Gambia: UNICEF (2013). For Ghana: World Bank (2016b). For Guinea Bissau: World Bank (forthcoming a). For Mali: World Bank (forthcoming b).
22 REALIZING THE FULL POTENTIAL OF SOCIAL SAFETY NETS IN AFRICA
Program Parameters Are PoliticalDomestic politics are also crucial for program design. Th e best designs are those that are technically sound, administratively feasible, and politically savvy. Th e elements of technical soundness and administrative feasibility are the main focus during program design, while political palatability is oft en underesti-mated or dealt with reluctantly (Pritchett 2005). At the extreme, a perfect tech-nical design that ignores the politics of support for social safety nets could eventually be the worst option for those it means to serve. Political obstacles can be overcome to some degree by choosing the characteristics and parameters of programs that factor in political preferences or incentives, albeit sometimes with a technical effi ciency trade-off .
Among the features of programs that have a political nature are conditionali-ties. Conditionalities could be introduced with the technical motivation of boosting the impact of programs. Th ey can also be proposed to address percep-tions related to deservingness by requiring benefi ciaries to undertake extra eff orts (such as sending children to school or taking children for regular health checkups). Oft en established as a technical option for self-targeting, work requirements may also help overcome concerns about the alleged laziness of recipients (public works programs, for instance). To promote a productive impact and alleviate concerns about dependency, social safety net programs are sometimes cast as part of a larger development program. Complementary initiatives, such as credit and extension programs, provide a potential route toward graduation. In Tanzania, the productive orientation of the Productive Safety Net Program was a major factor in securing political support because it addressed concerns about dependency and the importance of self-reliance (Ulriksen 2016).
Th e fear of promoting a culture of dependency may also be addressed by including clear time bounds in social safety net programs. Recertifi cation pro-cesses may be considered a fl exible time limitation. For instance, in Senegal, the PNBSF includes households for fi ve years, aft er which a recertifi cation process is planned to evaluate whether the households should stay in or exit the pro-gram. Recertifi cation does not automatically push benefi ciaries out of social safety nets, as in a time-bound design, but it may off er reassurance that the program is based on actual needs.
In some contexts, the response to concerns about deservingness and self-reliance has been to target only those who are thought to be unable to pro-vide for themselves. While most safety net spending is on programs that include poverty, vulnerability, or welfare as targeting criteria (77 percent of total spending on average), in line with national constitutions, some programs in Kenya, Uganda, and Zambia are categorically targeted and, in most cases, means-tested, and target mothers, the elderly, children, and the disabled (see table O.1). Indeed, social safety net spending typically goes to the elderly
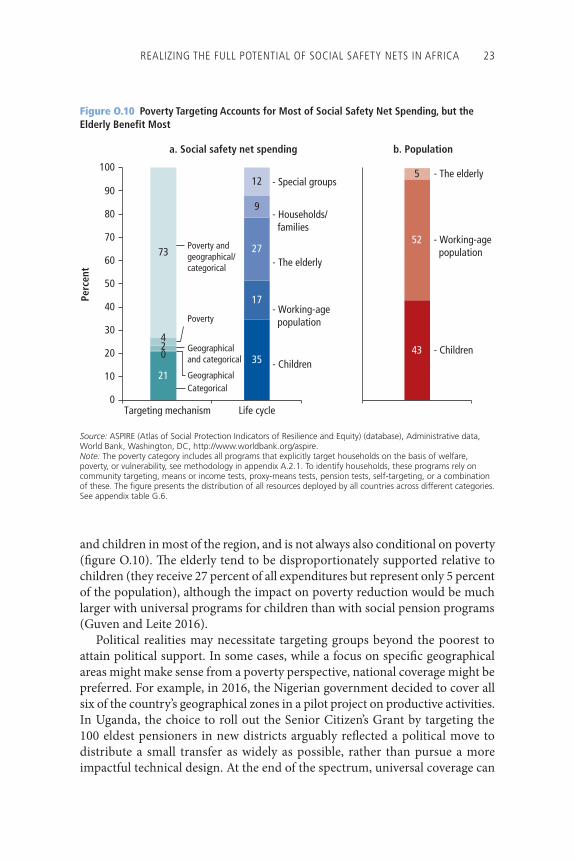
REALIZING THE FULL POTENTIAL OF SOCIAL SAFETY NETS IN AFRICA 23
and children in most of the region, and is not always also conditional on poverty ( fi gure O.10). Th e elderly tend to be disproportionately supported relative to children (they receive 27 percent of all expenditures but represent only 5 percent of the population), although the impact on poverty reduction would be much larger with universal programs for children than with social pension programs (Guven and Leite 2016).
Political realities may necessitate targeting groups beyond the poorest to attain political support. In some cases, while a focus on specifi c geographical areas might make sense from a poverty perspective, national coverage might be preferred. For example, in 2016, the Nigerian government decided to cover all six of the country’s geographical zones in a pilot project on productive activities. In Uganda, the choice to roll out the Senior Citizen’s Grant by targeting the 100 eldest pensioners in new districts arguably refl ected a political move to distribute a small transfer as widely as possible, rather than pursue a more impactful technical design. At the end of the spectrum, universal coverage can
Figure O.10 Poverty Targeting Accounts for Most of Social Safety Net Spending, but the Elderly Benefit Most
43
52
512
0
10
20
30
40
50
60
70
80
90
100
Targeting mechanism Life cycle
Perc
ent
CategoricalGeographical
Poverty
Poverty andgeographical/categorical
- Children
- Working-age population
- The elderly
- Households/ families
- Special groups
a. Social safety net spending b. Population
- Children
- Working-age population
- The elderly
Geographicaland categorical
21
024
73
35
17
27
9
Source: ASPIRE (Atlas of Social Protection Indicators of Resilience and Equity) (database), Administrative data, World Bank, Washington, DC, http://www.worldbank.org/aspire.Note: The poverty category includes all programs that explicitly target households on the basis of welfare, poverty, or vulnerability, see methodology in appendix A.2.1. To identify households, these programs rely on community targeting, means or income tests, proxy-means tests, pension tests, self-targeting, or a combination of these. The figure presents the distribution of all resources deployed by all countries across different categories. See appendix table G.6.
24 REALIZING THE FULL POTENTIAL OF SOCIAL SAFETY NETS IN AFRICA
be the preferred option if the focus is on strict equality in treatment and the avoidance of any form of exclusion.
Similarly, taking political considerations into account in designing a social safety net program may result in technically suboptimal programs. In Rwanda, for example, the emphasis placed on infrastructure development has made ensuring the labor intensity of public works challenging. Political tweaks should be introduced as a last resort, kept to a minimum, and mitigated by a careful focus on program transparency because the tweaks are oft en added at the expense of technical soundness.
Political Impacts May Favor Social Safety Net SustainabilityWhile political realities infl uence program design, the implementation of pro-grams can also change the political landscape. Social safety nets can aff ect the way households relate to governments, and leveraging this can be a means to promote program sustainability. More generally, social safety nets may induce changes in the discourse on poverty and on the role of the government and public policy. Th ese eff orts can help individuals realize that they are rights-holders and governments realize they are duty-bearers. Th is feedback loop shown in fi gure O.8 establishing and enhancing social safety nets can, in prac-tice, generate more political appetite for programs, thereby fostering both expansion and sustainability.
Social safety nets may empower and promote social inclusion and the auton-omy of benefi ciaries within communities (Pavanello et al. 2016). In Kenya, Mozambique, and Zambia, orphans, other vulnerable children, and disabled benefi ciaries have reported that cash transfers raised their sense of self- confi dence, dignity, ability to be more assertive, and perception of future well-being (Attah et al. 2016; Handa et al. 2014a, 2014b; Haushofer and Shapiro 2013; Jones et al. 2016; Seidenfeld, Handa, and Tembo 2013). Greater social and economic inclusion within communities enhances household social support and resilience to shocks. Greater social cohesion and proximity may increase the support of richer households for social safety net programs, thereby contrib-uting to program sustainability.
Programs may have negative impacts on inclusion and solidarity, however, if, for instance, the selection process among benefi ciaries is perceived as unclear or unfair or if poverty rates are high (Ellis 2012). Th e selection process among beneficiaries must discourage stereotyping and resentment among nonbenefi ciaries.
Social safety nets can change communities, and the interventions can result in political mobilization by bringing governments closer to benefi ciaries (Jones et al. 2016). Some programs make explicit eff orts to establish and promote rela-tionships between the government and benefi ciaries. In Cameroon and Mauritania, a contract is signed between benefi ciaries and the government
REALIZING THE FULL POTENTIAL OF SOCIAL SAFETY NETS IN AFRICA 25
during the registration of households for the programs, which highlights the contractual relationship. Th is is similar to the eff orts in some Latin American social safety net programs to reshape the relationships between governments and individuals by signing contracts of co-responsibility, whereby benefi ciaries commit to using basic services, while the government commits to ensuring adequate provision of the services, thereby emphasizing a reciprocal relation-ship (Fiszbein and Schady 2009).
Th ese interventions can reshape the relationship between individuals and the state by increasing the capacity of individuals or groups to access other govern-ment processes, for instance, by supporting households in their eff orts to obtain national identity numbers or identity cards. Th us, showing a valid birth certifi -cate has been a condition for receiving the child support grant in South Africa. Because this requirement eff ectively bars access to the program by certain groups, a new procedure was introduced for delivering birth certifi cates directly to hospitals, thereby giving access to formal identifi cation to new segments of the population (Glassman and Temin 2016).
Social accountability mechanisms may strengthen the political feedback loop by contributing to greater empowerment and voice among benefi ciaries. Program features such as grievance redress and community and benefi ciary participation may contribute to the social contract (Molyneux 2016; Ringold et al. 2012). However, social accountability mechanisms tend to be deployed most eff ectively by better-educated, wealthier, and more able-bodied individu-als rather than those with less capacity to organize and voice their concerns (Giannozzi and Khan 2011; King and Hickey 2017). In Kenya, for example, the lack of political mobilization behind the Hunger Safety Net Program (HSNP) may be attributed to the fact that benefi ciaries were mostly nomadic pastoralists in the north, a marginalized group (Hurrell and MacAuslan 2012). Th e design of social accountability mechanisms is thus critical in maximizing program potential.
Social safety nets may help establish a relationship between the poor and vulnerable and their government. Th ey have also been shown to exert an impact on the political process. Social safety nets have appeared on political platforms. Th ere is some evidence that elections have played a role in catalyzing a policy focus on social safety nets, such as the introduction of the Livelihood Empowerment against Poverty Program (LEAP) before the 2008 elections in Ghana or the correlation between the 2002 and 2007 elections and spikes in social assistance expenditures in Kenya. In Botswana, Ipelegeng, a public works program, specifi cally extended the previously rural-only drought relief pro-grams to urban areas where opposition support had been growing (Hamer 2016). Th e political appetite for expanding social safety nets may also be spurred by concerns around the issues of local government and local politicians. In Kenya and Zambia, for instance, members of Parliament have urged the
26 REALIZING THE FULL POTENTIAL OF SOCIAL SAFETY NETS IN AFRICA
expansion of small-scale pilot programs to new districts because of perceptions that political advantage may be gained by delivering benefi ts to their constituent local communities (Pruce and Hickey 2017; Wanyama and McCord 2017).
Evidence for the eff ect of social safety nets on voting behavior and electoral outcomes is derived mostly from large-scale cash transfer programs in Asia and Latin America. Electoral benefi ts are generally reaped by members of the incumbent party. Impacts may be lasting, but they eventually pale. Voters tend to reward incumbent parties, rather than the parties that initiated the programs. Adopting the programs of previous policy makers and supporting their expan-sion can therefore be rewarded politically. Even in national programs, the politi-cal gains may be local.
Once they expand beyond a certain size and demonstrate favorable impacts, programs can create long-term commitments that are politically diffi cult to dis-continue. In Brazil, Colombia, and Mexico, for instance, programs that have been established for more than a decade and demonstrated positive impacts have been gradually adopted by parties and elites across the board, although each administration typically adjusts the programs to refl ect changing policy objectives or approaches to poverty reduction. Th e name of a program may even be altered though the core features are retained.
Anchoring in Strong Institutions to Expand and Sustain Social Safety Nets (Chapter 4)
Institutions are central to the delivery of social safety nets and infl uence all aspects of program eff ectiveness. If the social safety nets in Africa are to be adequately expanded, institutions must evolve along multiple parameters, including the anchoring in laws and policies, mechanisms for coordination and oversight, and arrangements for management and delivery. Small pilot interven-tions may show results and contribute to building political support for the expansion of social safety nets, but broadening coverage typically requires some consolidation. Oft en, over time, as programs mature, program management will be shift ed to government ministries or agencies; program designs and processes will become standardized; staffi ng will be transferred to the civil service or out-sourced; and more comprehensive rules for the overall social safety net system will be formalized in policies, strategies, and laws.
Institutions impose the rules of the game that shape all aspects of social safety net policy, design, and implementation, ranging from establishing eligi-bility criteria and the regulations and procedures that govern the operations of the organizations that deliver the social safety net programs (including man-dates and human resource policies) to sectoral laws and regulations. Beyond the formal rules, informal institutions—conventions and customary
REALIZING THE FULL POTENTIAL OF SOCIAL SAFETY NETS IN AFRICA 27
practices—infl uence the provision of social safety nets because, for example, they mediate notions of deservingness or support and incentivize civil servants and frontline staff to deliver programs appropriately.
Th ere are multiple paths toward formal and informal rules of the game that enable credible social safety nets in Africa, and many are linked to the develop-ment of broader social protection systems. Building a social protection system does not necessarily require a focus on a single entity or agency to manage multiple programs. Instead, it calls for a focus on the institutions, including the processes, that guide the design and delivery of social safety nets within gov-ernment systems, including both formal and informal structures. Th ere are numerous possible paths in this process. In some countries, such as Ethiopia, the development of a social protection policy took place aft er signifi cant con-solidation of social safety net programs and the achievement of near nation-wide coverage. In other countries—such as Chad, Niger, and Sierra Leone—the development of social protection policies occurred early in the evolution of social safety nets and was accompanied by the implementation of small pilot programs. In Latin America, the need for greater coordination among a grow-ing number of social programs encouraged governments to create coherent social safety net systems, usually within social protection policy and legal frameworks.
From Frameworks to Commitments: Emerging National Strategies for Social Safety NetsAcross the region, countries have increasingly focused on establishing an over-arching institutional framework to advance social safety nets. Oft en, the policy commitments are embedded in international conventions and declarations, attesting to the layering of institutions across local, national, and international levels. Th e presence of these policies and laws or legal frameworks may signal an important step toward the fi rm anchoring of social safety nets in Africa, but it will not be suffi cient to bring social safety nets to scale, as these fi rst need to be matched with political support and fi nancial resources.
Th ere has been widespread adoption across Africa of international treaties related to social safety nets. However, there is variation in the degree to which social safety nets are anchored in national legislation , at times as part of a broader position on social protection. In most countries, legal support is limited to general constitutional provisions for supporting the vulnerable. Th is is the case in 12 of the 16 countries reviewed (table O.2). In Niger, for example, the constitution explains that “the State sees to the elderly through a policy of social protection.”
All countries include social safety nets in their national development strat-egies. Similarly, social protection policies and strategies have become com-mon across Africa—typically covering both social safety nets and social
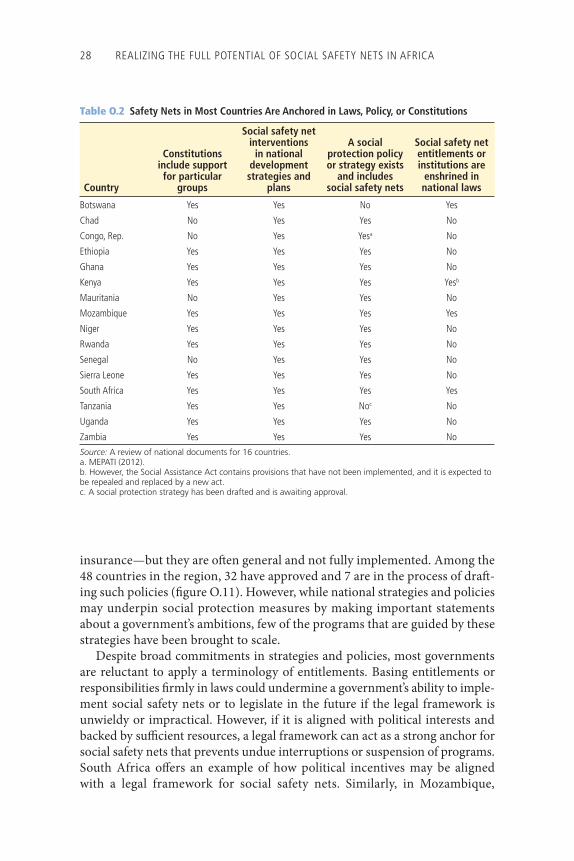
28 REALIZING THE FULL POTENTIAL OF SOCIAL SAFETY NETS IN AFRICA
insurance—but they are oft en general and not fully implemented. Among the 48 countries in the region, 32 have approved and 7 are in the process of draft -ing such policies (fi gure O.11). However, while national strategies and policies may underpin social protection measures by making important statements about a government’s ambitions, few of the programs that are guided by these strategies have been brought to scale.
Despite broad commitments in strategies and policies, most governments are reluctant to apply a terminology of entitlements. Basing entitlements or responsibilities fi rmly in laws could undermine a government’s ability to imple-ment social safety nets or to legislate in the future if the legal framework is unwieldy or impractical. However, if it is aligned with political interests and backed by suffi cient resources, a legal framework can act as a strong anchor for social safety nets that prevents undue interruptions or suspension of programs. South Africa off ers an example of how political incentives may be aligned with a legal framework for social safety nets. Similarly, in Mozambique,
Table O.2 Safety Nets in Most Countries Are Anchored in Laws, Policy, or Constitutions
Country
Constitutions include support for particular
groups
Social safety net interventions
in national development strategies and
plans
A social protection policy or strategy exists
and includes social safety nets
Social safety net entitlements or institutions are
enshrined in national laws
Botswana Yes Yes No Yes
Chad No Yes Yes No
Congo, Rep. No Yes Yesa No
Ethiopia Yes Yes Yes No
Ghana Yes Yes Yes No
Kenya Yes Yes Yes Yesb
Mauritania No Yes Yes No
Mozambique Yes Yes Yes Yes
Niger Yes Yes Yes No
Rwanda Yes Yes Yes No
Senegal No Yes Yes No
Sierra Leone Yes Yes Yes No
South Africa Yes Yes Yes Yes
Tanzania Yes Yes Noc No
Uganda Yes Yes Yes No
Zambia Yes Yes Yes No
Source: A review of national documents for 16 countries.a. MEPATI (2012).b. However, the Social Assistance Act contains provisions that have not been implemented, and it is expected to be repealed and replaced by a new act.c. A social protection strategy has been drafted and is awaiting approval.
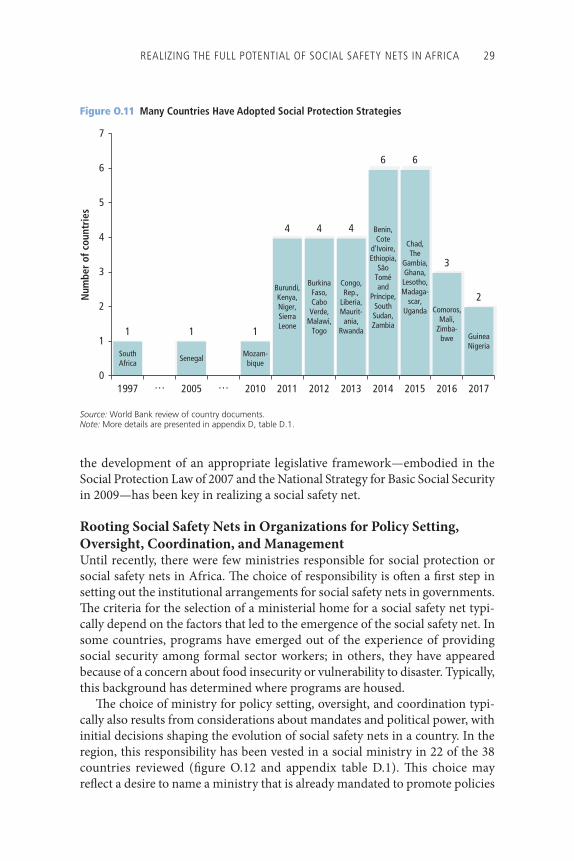
REALIZING THE FULL POTENTIAL OF SOCIAL SAFETY NETS IN AFRICA 29
Figure O.11 Many Countries Have Adopted Social Protection Strategies
1 1 1
4 4 4
6 6
3
2
0
1
2
3
4
5
6
7
1997 … 2005 … 2010 2011 2012 2013 2014 2015 2016 2017
Num
ber
of c
ount
ries
SouthAfrica
Burundi,Kenya,Niger,SierraLeone
BurkinaFaso,CaboVerde,
Malawi,Togo
Congo,Rep.,
Liberia,Maurit-
ania,Rwanda
Benin,Cote
d'Ivoire,Ethiopia,
SãoToméand
Príncipe,SouthSudan,Zambia
Chad,The
Gambia,Ghana,Lesotho,Madaga-
scar,Uganda Comoros,
Mali,Zimba-
bwe GuineaNigeria
SenegalMozam-
bique
the development of an appropriate legislative framework—embodied in the Social Protection Law of 2007 and the National Strategy for Basic Social Security in 2009—has been key in realizing a social safety net.
Rooting Social Safety Nets in Organizations for Policy Setting, Oversight, Coordination, and ManagementUntil recently, there were few ministries responsible for social protection or social safety nets in Africa. Th e choice of responsibility is oft en a fi rst step in setting out the institutional arrangements for social safety nets in governments. Th e criteria for the selection of a ministerial home for a social safety net typi-cally depend on the factors that led to the emergence of the social safety net. In some countries, programs have emerged out of the experience of providing social security among formal sector workers; in others, they have appeared because of a concern about food insecurity or vulnerability to disaster. Typically, this background has determined where programs are housed.
Th e choice of ministry for policy setting, oversight, and coordination typi-cally also results from considerations about mandates and political power, with initial decisions shaping the evolution of social safety nets in a country. In the region, this responsibility has been vested in a social ministry in 22 of the 38 countries reviewed (fi gure O.12 and appendix table D.1). Th is choice may refl ect a desire to name a ministry that is already mandated to promote policies
Source: World Bank review of country documents.Note: More details are presented in appendix D, table D.1.
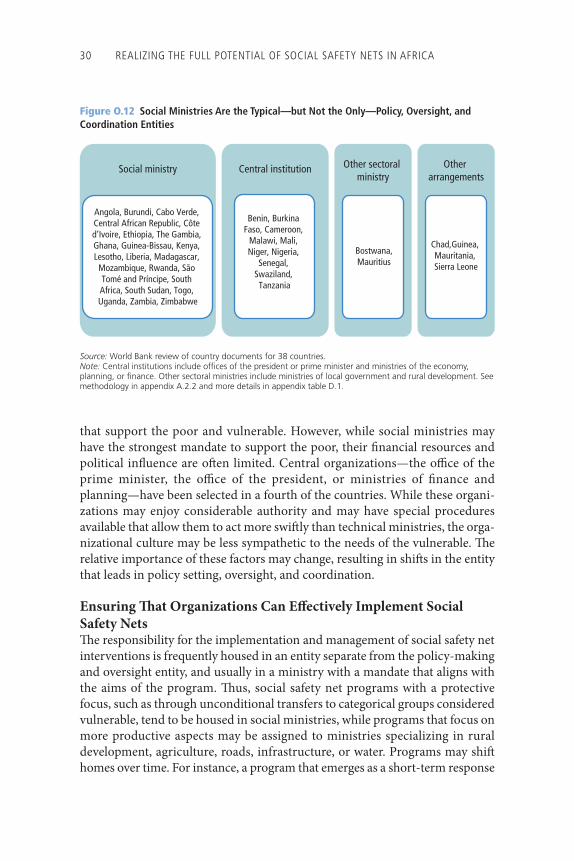
30 REALIZING THE FULL POTENTIAL OF SOCIAL SAFETY NETS IN AFRICA
that support the poor and vulnerable. However, while social ministries may have the strongest mandate to support the poor, their fi nancial resources and political infl uence are oft en limited. Central organizations—the offi ce of the prime minister, the offi ce of the president, or ministries of fi nance and planning—have been selected in a fourth of the countries. While these organi-zations may enjoy considerable authority and may have special procedures available that allow them to act more swift ly than technical ministries, the orga-nizational culture may be less sympathetic to the needs of the vulnerable. Th e relative importance of these factors may change, resulting in shift s in the entity that leads in policy setting, oversight, and coordination.
Ensuring Th at Organizations Can Eff ectively Implement Social Safety NetsTh e responsibility for the implementation and management of social safety net interventions is frequently housed in an entity separate from the policy-making and oversight entity, and usually in a ministry with a mandate that aligns with the aims of the program. Th us, social safety net programs with a protective focus, such as through unconditional transfers to categorical groups considered vulnerable, tend to be housed in social ministries, while programs that focus on more productive aspects may be assigned to ministries specializing in rural development, agriculture, roads, infrastructure, or water. Programs may shift homes over time. For instance, a program that emerges as a short-term response
Social ministry
Angola, Burundi, Cabo Verde, Central African Republic, Côte d’Ivoire, Ethiopia, The Gambia, Ghana, Guinea-Bissau, Kenya, Lesotho, Liberia, Madagascar, Mozambique, Rwanda, São Tomé and Príncipe, South Africa, South Sudan, Togo, Uganda, Zambia, Zimbabwe
Central institution
Benin, Burkina Faso, Cameroon,
Malawi, Mali, Niger, Nigeria,
Senegal, Swaziland, Tanzania
Other sectoral ministry
Bostwana, Mauritius
Other arrangements
Chad,Guinea, Mauritania, Sierra Leone
Figure O.12 Social Ministries Are the Typical—but Not the Only—Policy, Oversight, and Coordination Entities
Source: World Bank review of country documents for 38 countries.Note: Central institutions include offices of the president or prime minister and ministries of the economy, planning, or finance. Other sectoral ministries include ministries of local government and rural development. See methodology in appendix A.2.2 and more details in appendix table D.1.
REALIZING THE FULL POTENTIAL OF SOCIAL SAFETY NETS IN AFRICA 31
to an emergency may be in a high-profi le agency, such as an offi ce of the presi-dent. However, as the program matures, a social ministry or agency with a policy mandate to serve the vulnerable may become a more appropriate home. Because these programs are relatively new in Africa, there are few examples of changes in institutional arrangements, whereas there are examples in countries or regions with more established programs, such as Colombia or Latin America more generally.
Th e choice of ministerial home shapes the evolution of social safety nets. Th us, a program may conform to the vision and mandate of the responsible organization. For instance, social workers in a social ministry may tend to focus on vulnerable groups with specifi c needs that are a refl ection of the professional mandate and priorities of the social workers. Conversely, the coexistence of multiple views of social safety nets may result in institutional fragmentation. In particular, the preferences of development partners may play a decisive role in the selection of a ministry, and this tendency can lead to decisions to locate similar programs in diff erent organizations, as in Tanzania and Uganda.
While the institutional home is tasked with managing the social safety net program or programs, operations are realized through organizations that manage and deliver interventions. Th ere are fi ve main categories of such enti-ties: a preexisting department, a special-purpose department, a project implementation unit, a semiautonomous government agency, and a nongovernmental organization (NGO) or regional or international institution (United Nations agency and so on). Management arrangements vary by context, and the choice infl uences eff ectiveness. For instance, government departments are oft en hampered by the need to abide by ministerial proce-dures, and their fi duciary procedures or hiring standards are typically more restrictive than those that apply to a semiautonomous government agency or a project implementation unit. However, project implementation units are not suitable as a management structure in the long run and as programs are expanded. More sustainable solutions include making use of permanent min-isterial units and local civil servants.
As programs grow, coordination becomes more critical, not least because of limited fi scal space and the need for effi ciency (chapter 5). At this stage, the organizations responsible for delivering social safety nets need to involve mul-tiple sectors and actors depending on design elements. Universal or uncondi-tional programs may be associated with simpler institutional arrangements run broadly through one sectoral entity and local and national representatives. Conditional programs oft en require the engagement of multiple sectors, such as the ministries of health and education, as well as robust procedures for collect-ing information from health centers and schools on compliance with the pro-gram conditions. Public works programs frequently require the involvement of diverse technical staff . Actors charged with implementation may be located in
32 REALIZING THE FULL POTENTIAL OF SOCIAL SAFETY NETS IN AFRICA
the private sector or civil society. Responsibility for the payment of transfers is oft en contracted to payment service providers.
At the higher level, social protection policies oft en include the creation of interministerial coordination committees, which are frequently expected to be chaired by ministers or cabinet secretaries. Forming such committees and call-ing meetings once they are formed are rarely prioritized. In Burkina Faso, for instance, the intersectoral national council for social protection only meets once or twice a year and mainly focuses on information sharing, the main output of which is lists of programs and expenditures. In countries where humanitarian programs are prominent or in fragile settings, NGOs and devel-opment partners oft en play critical roles. Th e coordination and oversight of these large programs implemented outside government are oft en of practical importance because of the size of the programs and the political nature of the response to shocks. In most Sahelian countries, humanitarian actors have initi-ated eff orts to coordinate interventions, capitalize on good practices, and engage in advocacy.
In most African countries, social safety nets are the responsibility of national governments, but implementation arrangements vary. Most programs are funded centrally through the government budget or development partners, and, in all countries, central entities are tasked with policy setting, coordination, and oversight. Delivery may remain centralized or be deconcentrated or devolved. In some countries, such as the Republic of Congo, a national ministry delivers the social safety net program through frontline workers accountable to the ministry. Typically, if implementation occurs through a project implementation unit, as in Burkina Faso and Cameroon, the delivery is centralized, and project staff are recruited to coordinate local implementation. In other cases, the front-line delivery of programs falls to local services (deconcentration) or local gov-ernments (devolution), which are required to follow centralized guidelines and standards.
While standardized guidelines exist for most programs, some delivery choices depend on some local decision making. National standards enable con-sistent implementation, but some tasks may benefi t from devolved decision making so delivery takes local realities into account. Th is fl exibility can result in more eff ective processes, such as in targeting, and can encourage local buy-in. However, it can also lead to distortions or bias in implementation because local norms and practices may favor particular groups or objectives. In many con-texts, in practice, there is variation across locations in the application of guide-lines. Th is can be deliberate or the result of inadequate communication among program implementers.
Creating Incentives to Encourage Individual Actors to Deliver ResultsAs there are multiple ways to manage social safety nets, there are also various options in staffi ng. Programs may be delivered by staff who are fully dedicated
REALIZING THE FULL POTENTIAL OF SOCIAL SAFETY NETS IN AFRICA 33
to the programs or by staff who, besides social safety net activities, are respon-sible for other programs. Staff may be civil servants or temporary staff on fi xed-term contracts. Key functions might also be contracted to private sector providers, such as administering payments, organizing training activities, or even running the program implementation unit. Many programs also make use of voluntary community structures for elements of implementation.
Th e issue of incentives for civil servants is generally critical for eff ective implementation, particularly as programs are taken to scale and shift into national systems. In many countries, the perception that civil servants are paid less than their peers working in the private sector (and less than the technical assistance providers paid by development partners in externally funded proj-ects) and that career progression and accompanying pay increases are limited can produce low motivation and job dissatisfaction. Th e resulting high staff turnover—combined with slow recruitment processes, which may be based on networking rather than expertise—leads to gaps in capacity. Job dissatisfaction and low motivation among staff contribute to poor performance within the civil service. Interagency rivalry and rivalry between permanent and contract staff may also contribute to low capacity and, ultimately, poor performance. While reliance on technical assistance and contracts may deliver results in the short term, longer-term solutions are required to embed social safety nets at the heart of government systems and ensure sustainability.
Harnessing Resources to Expand and Sustain Social Safety Nets (Chapter 5)
Bringing social safety nets to scale has obvious fi scal implications. In light of the current fi scal context in most African countries, expanding the coverage of pro-grams represents a serious challenge. Harnessing resources to expand social safety nets requires a multipronged approach, including achieving opera-tional effi ciency in interventions; enhancing the level and sustainability of fi nancial resources; identifying the proper mix of domestic, foreign, public, and nonpublic funding sources; and deploying a fl exible fi nancing strategy to respond to shocks and crises.
Spending and Financing for Social Safety Nets: A SnapshotAfrica devotes on average 1.2 percent of GDP to social safety nets, compared with the global average of 1.6 percent. Th is spending is lower than spending on other sectors such as energy subsidies, health care, education, and, in some cases, the military (fi gure O.13). In particular, spending on energy subsidies—oft en cited as a means of supporting vulnerable households, but largely regressive in practice—is greater than spending on social safety nets in the region, with par-ticularly high levels in Central and East Africa and in low-income countries.
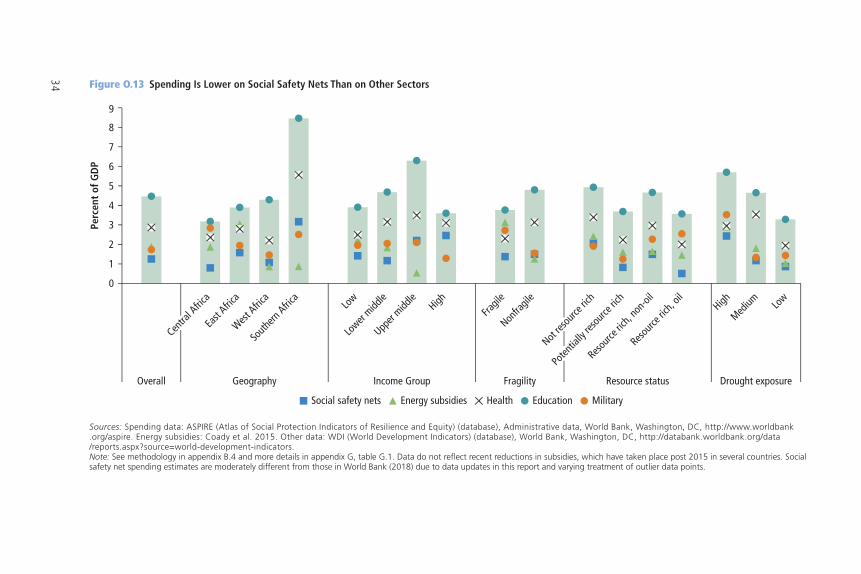
34 Figure O.13 Spending Is Lower on Social Safety Nets Than on Other Sectors
Sources: Spending data: ASPIRE (Atlas of Social Protection Indicators of Resilience and Equity) (database), Administrative data, World Bank, Washington, DC, http://www.worldbank .org /aspire. Energy subsidies: Coady et al. 2015. Other data: WDI (World Development Indicators) (database), World Bank, Washington, DC, http://databank.worldbank.org / data / reports .aspx ? source=world-development-indicators.Note: See methodology in appendix B.4 and more details in appendix G, table G.1. Data do not reflect recent reductions in subsidies, which have taken place post 2015 in several countries. Social safety net spending estimates are moderately different from those in World Bank (2018) due to data updates in this report and varying treatment of outlier data points.
Social safety nets Energy subsidies Health Education Military
0
1
2
3
4
5
6
7
8
9
East
Africa
West Afric
aSo
uthern
Africa
Low
Lower
middle
Upper
middle
High
Fragil
eNon
fragil
eNot
resou
rce ric
h
Poten
tially
reso
urce r
ich
Resourc
e rich
, non
-oil
Resourc
e rich
, oil
HighMed
ium Low
GeographyOverall Income Group Fragility Resource status Drought exposure
Perc
ent
of G
DP
Centra
l Afric
a
REALIZING THE FULL POTENTIAL OF SOCIAL SAFETY NETS IN AFRICA 35
Spending varies across the region. Africa-wide, upper-middle-income coun-tries spend an average 2.2 percent of GDP, while low-income countries spend 1.4 percent, and lower-middle-income countries spend an average 1.0 percent. Southern Africa, with more upper-middle-income countries, spends an average of fi ve times more than Central Africa and two times more than West and East Africa. Spending on social safety nets is lower in fragile states and resource-rich countries. Countries with greater exposure to natural disasters allocate more resources than those facing a low or medium risk of disaster. Particularly high spending is observed in a few countries (Lesotho, Namibia, and South Africa).
Development partners are critical for the fi nancing of social safety nets (see fi gure O.9). On average, governments fi nance 46 percent of program spending, and development partners cover the other 54 percent (appendix table G.8 pres-ents detailed information for selected programs). Th e share of development partners is higher in lower-income countries, in fragile and confl ict-aff ected states, and in humanitarian crises. Given the fi scal constraints facing many governments, development partner support is likely to be crucial for bringing programs to scale in most countries.
Administrative costs may be high early on, but decline with scale. In terms of effi ciency, administrative costs represent an average 17 percent of program spending (appendix table G.9). Th is refl ects both the cost of initial investments in systems and the small size of many programs. While data are limited, the share of administrative costs tends to be lower in public works, school feeding, and social pension programs, possibly because of less costly targeting. Administrative costs tend to fall as programs increase in size. Administrative costs of the Social Safety Net Program in Cameroon also fell, from 65 percent in 2015 to 23 percent in 2016, as the number of benefi ciaries quadrupled ( fi gure O.14). In Mali, the administrative cost of the Jigisemejiri Program declined from 42 percent to 12 percent between 2014 to 2016, while the number of benefi ciaries expanded from about 30,000 to about 375,000 individuals. Th e administrative costs of Mozambique’s Basic Social Subsidy Program decreased slightly when benefi t levels increased. However, expansion does not necessarily immediately lead to savings if programs expand geographically and need to develop new networks and systems, as with the Tanzania fl agship program and the Malawi MASAF public works program (appendix table G.9).
Making Better Use of Existing ResourcesTh ere is substantial space to improve program effi ciency and eff ectiveness. Eff ectiveness (defi ned as the highest coverage possible for a given level of spend-ing) is higher in countries with stronger social safety net systems, with a central institution leading the sector, and with large social registries. On the other hand, the presence of development partners and of a social protection strategy are negatively associated with eff ectiveness, probably linked to the fact that
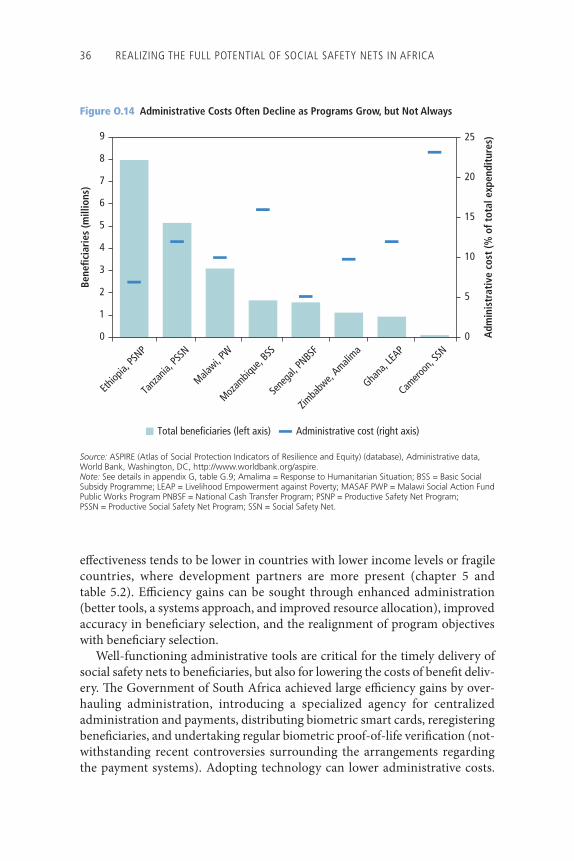
36 REALIZING THE FULL POTENTIAL OF SOCIAL SAFETY NETS IN AFRICA
eff ectiveness tends to be lower in countries with lower income levels or fragile countries, where development partners are more present (chapter 5 and table 5.2). Effi ciency gains can be sought through enhanced administration (better tools, a systems approach, and improved resource allocation), improved accuracy in benefi ciary selection, and the realignment of program objectives with benefi ciary selection.
Well-functioning administrative tools are critical for the timely delivery of social safety nets to benefi ciaries, but also for lowering the costs of benefi t deliv-ery. Th e Government of South Africa achieved large effi ciency gains by over-hauling administration, introducing a specialized agency for centralized administration and payments, distributing biometric smart cards, reregistering benefi ciaries, and undertaking regular biometric proof-of-life verifi cation (not-withstanding recent controversies surrounding the arrangements regarding the payment systems). Adopting technology can lower administrative costs.
Figure O.14 Administrative Costs Often Decline as Programs Grow, but Not Always
Source: ASPIRE (Atlas of Social Protection Indicators of Resilience and Equity) (database), Administrative data, World Bank, Washington, DC, http://www.worldbank.org/aspire.Note: See details in appendix G, table G.9; Amalima = Response to Humanitarian Situation; BSS = Basic Social Subsidy Programme; LEAP = Livelihood Empowerment against Poverty; MASAF PWP = Malawi Social Action Fund Public Works Program PNBSF = National Cash Transfer Program; PSNP = Productive Safety Net Program; PSSN = Productive Social Safety Net Program; SSN = Social Safety Net.
0
5
10
15
20
25
0
1
2
3
4
5
6
7
8
9
Ethiop
ia, PS
NP
Tanz
ania,
PSSN
Malawi, P
W
Mozam
bique
, BSS
Sene
gal, P
NBSF
Zimba
bwe,
Amalima
Ghana
, LEA
P
Camero
on, S
SN
Adm
inis
trat
ive
cost
(% o
f tot
al e
xpen
ditu
res)
Bene
ficia
ries
(mill
ions
)
Total beneficiaries (left axis) Administrative cost (right axis)
REALIZING THE FULL POTENTIAL OF SOCIAL SAFETY NETS IN AFRICA 37
For example, the shift from cash to e-payments removes the complexity of dis-tributing cash and reduces leakage. In Mexico, the integration of e-payments and social assistance—97 percent of 2.6 million pensioners are paid through a centralized system—saves about $900 million in administrative costs annually.
Upgrading administrative processes and introducing technology can be expensive and brings capacity demands in the short term. A review of the use of e-payments for emergency cash transfers in Kenya and Somalia found that e-payments were not immediately cheaper than manual payments because of the higher start-up costs (O’Brien, Hove, and Smith 2013). Th e existing infra-structure and implementation capacity are critical for the successful introduc-tion of new technology. In Zambia, an innovative mobile technology enumeration and registration system for the Social Cash Transfer Program did not outperform the paper system in a small pilot initiative because of challenges related to the poor network and the lack of compatibility with the management information system (IDinsight 2015). However, the situation may change in the medium to long terms.
Adopting a systems approach can also promote effi ciency, especially in contexts with multiple programs. Unifying the tools used across programs to identify and enroll benefi ciaries, make payments, and manage information can lead to economies of scale and help tackle fraud and error (chapter 4). Th e development of information systems and registries can result in signifi cant savings. In Brazil in 2013, by checking data against the National Database of Social Information, which contains records on social security benefi ts, the unemployment insurance program was able to block approximately $385 million in erroneous payments. In Romania in 2013, using a unique personal identifi cation number in all major national databases (tax adminis-tration, social assistance, health care, pensions, disability) allowed cross-checks between social assistance and external data, which led to the recovery of around $1.65 million.
A second avenue for effi ciency gains is allocative effi ciency, the extent to which programs reach the poor and vulnerable. Reaching the intended target population is not devoid of costs or easy to do (chapters 1 and 3). Programs with an explicit goal to target the poor are generally pro-poor, but some resources still go to the nonpoor. In the eight countries presented in fi gure O.15, an aver-age 14 percent of social safety net spending is received by the richest 20 percent of the population, and 20 percent is received by the second-richest quintile. While there is scope for improving targeting and while these programs tend to be better targeted than other government interventions, perfect targeting does not exist, and costs vary depending on context. Th ere is always a trade-off between cost savings and precision in reaching the poor. For example, proxy-means testing is costlier than a categorical or universal approach. Th ere are also political considerations in targeting (chapter 3).
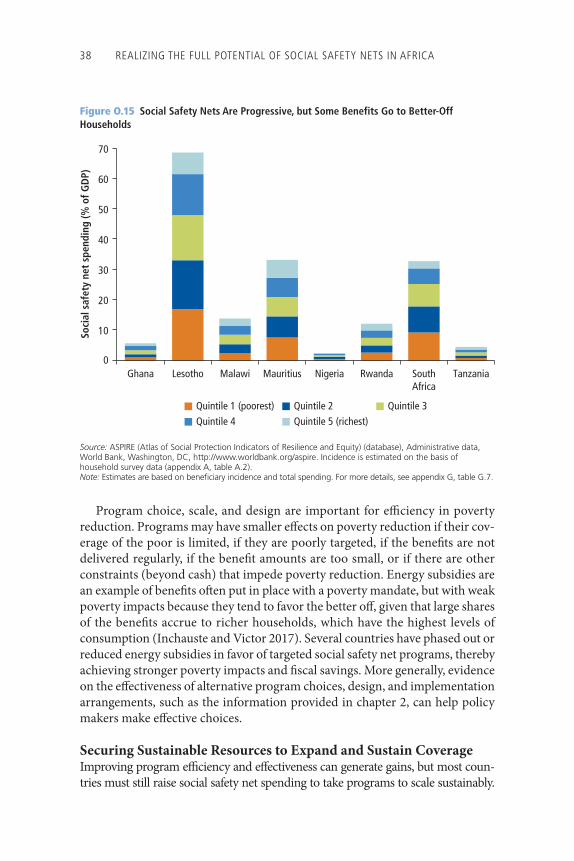
38 REALIZING THE FULL POTENTIAL OF SOCIAL SAFETY NETS IN AFRICA
Program choice, scale, and design are important for effi ciency in poverty reduction. Programs may have smaller eff ects on poverty reduction if their cov-erage of the poor is limited, if they are poorly targeted, if the benefi ts are not delivered regularly, if the benefi t amounts are too small, or if there are other constraints (beyond cash) that impede poverty reduction. Energy subsidies are an example of benefi ts oft en put in place with a poverty mandate, but with weak poverty impacts because they tend to favor the better off , given that large shares of the benefi ts accrue to richer households, which have the highest levels of consumption (Inchauste and Victor 2017). Several countries have phased out or reduced energy subsidies in favor of targeted social safety net programs, thereby achieving stronger poverty impacts and fi scal savings. More generally, evidence on the eff ectiveness of alternative program choices, design, and implementation arrangements, such as the information provided in chapter 2, can help policy makers make eff ective choices.
Securing Sustainable Resources to Expand and Sustain CoverageImproving program effi ciency and eff ectiveness can generate gains, but most coun-tries must still raise social safety net spending to take programs to scale sustainably.
Figure O.15 Social Safety Nets Are Progressive, but Some Benefits Go to Better-Off Households
0
10
20
30
40
50
60
70
Quintile 1 (poorest) Quintile 2 Quintile 3Quintile 4 Quintile 5 (richest)
Ghana Lesotho Malawi Mauritius Nigeria Rwanda SouthAfrica
Tanzania
Soci
al s
afet
y ne
t sp
endi
ng (%
of G
DP)
Source: ASPIRE (Atlas of Social Protection Indicators of Resilience and Equity) (database), Administrative data, World Bank, Washington, DC, http://www.worldbank.org/aspire. Incidence is estimated on the basis of household survey data (appendix A, table A.2).Note: Estimates are based on beneficiary incidence and total spending. For more details, see appendix G, table G.7.
REALIZING THE FULL POTENTIAL OF SOCIAL SAFETY NETS IN AFRICA 39
Further compounding this problem is the fact that the need for social safety nets tends to run countercyclical to macroeconomic conditions. Governments thus typically face fi scal pressures precisely when programs are most needed. During these times, social safety net spending should be protected or even increased to prevent long-lasting negative impacts of fiscal consolidation on the poor (IMF 2017).
Strengthening fi scal systems is the most sustainable option for fi nancing sus-tained social safety nets at scale, given the uncertainties in the global macroeco-nomic and political environment, the rising costs of borrowing, and the unpredictable nature of external fi nancing (IMF 2015). More generally, improv-ing tax systems is a widely recognized imperative in Africa, where tax revenues stood at an average of about 21 percent of GDP between 2011 and 2014, com-pared with over 30 percent in high-income countries. Governments have a number of options for boosting tax revenue through quick, short-term wins and deeper long-term reforms. Curtailing illicit fi nancial fl ows could also free resources for social safety nets. In 2012, almost $1 trillion in illicit fi nancial fl ows are estimated to have moved out of developing countries, and these fl ows amounted to almost 10 times the total aid received by developing countries (Kar, Cartwright-Smith, and Hollingshead 2010; Ortiz, Cummins, and Karunanethy 2015).
Th e increase in domestic revenue is unlikely to be suffi cient to meet the fi nancing required to bring social safety nets to scale in the short term. Governments need to also identify alternative funding sources. Th e fi nancing provided by development partners is an obvious option that is already crucial for fi nancing social safety net spending. It is especially strategic for fi nancing initial investments, for example, establishing the building blocks for delivery. It can also be a catalyst for mobilizing domestic resources for social safety nets. In Mozambique, development partners have been central in advocating for a rise in budget allocations for the social protection strategy and the related plan (Bastagli 2015). Ethiopia’s PSNP is an example of the successful integration of government and development partner funding, as well as of development part-ner harmonization.
Governments could explore more innovative financing options. Development impact bonds could be used to mobilize private sector fi nancing for development objectives, including those of social safety nets. Development impact bonds allow private investors to prefi nance social programs. Public sector agencies then pay back investors the principal, plus a return if the fi nanced programs deliver the expected social outcomes (CGD and Social Finance 2013). Th us, the returns to investments are contingent on the achievement of the envisaged development objectives (Coleman 2016). Similarly, diaspora bonds could be used to direct remittances toward devel-opment goals. Th ey are debt instruments issued by a government to raise fi nancing from a diaspora and have been successfully introduced in India,
40 REALIZING THE FULL POTENTIAL OF SOCIAL SAFETY NETS IN AFRICA
Israel, and Nigeria (Ketkar and Ratha 2007). Relative to other social sectors and regions, corporate social responsibility is an underutilized source for supporting social safety nets in Africa. A few governments have developed strategies and tools to access these resources to fund economic and develop-ment strategies. In Mauritius, all fi rms are requested to spend 2 percent of their profi ts on corporate social responsibility activities approved by the gov-ernment or to transfer these funds for the government to invest in social and environmental projects.
Developing a Financing Strategy for Reliable, Eff ective Emergency ResponseTo manage the impacts of shocks eff ectively, ensure timely access to resources, and ultimately mitigate long-term fi scal impacts, governments are adopting a strategic approach to risk fi nancing. In most contexts, disaster risk fi nancing covers only a fraction of disaster losses, oft en in an unpredictable and untimely fashion. Th is leaves many of the vulnerable exposed. Th ere are several fi nancial instruments to address varying needs of governments to manage shock- responsive activities with fi nancing that is timely, predictable, and commensu-rate with the magnitude of the shock.
Contingency or reserve funds can be established to fi nance relief, rehabilita-tion, reconstruction, and prevention activities in emergencies. Th ese are used in, for instance, Colombia, Costa Rica, India, Indonesia, the Marshall Islands, Mexico, the Philippines, the Lao People’s Democratic Republic, and Vietnam. Several African countries are seeking to establish similar funds. In Kenya, the government is in the fi nal stages of operationalizing a national contingency fund dedicated to drought emergencies. Eff orts are also under way to establish such funds in Madagascar and Mozambique. Contingent loans can be used to gain access to liquidity immediately following an exogenous shock. Th ey have been used by multilateral development banks to create lines of credit that can be activated if a shock occurs.
Risk transfer mechanisms, which are fi nancial or insurance instruments, are another option for insuring against shocks. Th ey can be used in the case of risk to specifi c meteorological or geological events—droughts, hurricanes, earth-quakes, and fl oods—or commodity price shocks. Th ese market-based products use scientifi c information and actuarial modeling to estimate the losses that would be sustained because of a specifi c event and then price the risk. Payments are triggered if a prespecifi ed underlying parametric index reaches a certain value (such as a stated level of rainfall, the length and intensity of a drought, or commodity price movements). Examples include the Caribbean Catastrophe Risk Insurance Facility, the Pacifi c Catastrophe Risk Assessment and Financing Initiative, and African Risk Capacity.
REALIZING THE FULL POTENTIAL OF SOCIAL SAFETY NETS IN AFRICA 41
Depending on the frequency and severity of the various risks in a particu-lar country, governments can combine fi nancing instruments. Each instru-ment is adapted to diff erent needs and has diff erent cost implications. Sovereign insurance may provide cost-eff ective coverage against extreme events, but it may be ineffi cient and costly in protecting against recurring low-intensity events. For such frequent events, a dedicated contingency fund may be a more appropriate solution. Combining instruments also enables govern-ments to take into account the evolving needs for funds for emergency response or long-term reconstruction. A government might decide to pur-chase ex ante rapidly disbursable risk transfer instruments to ensure immedi-ate liquidity in the aft ermath of extreme events, but raise the larger sums required to fi nance reconstruction eff orts through ex post budget realloca-tions or by issuing bonds.
The Road Ahead for Bringing Social Safety Nets to Scale in Africa
Governments in Africa are increasingly positioning social safety nets as a core instrument in their strategies to address poverty and vulnerability. Th e number of programs has expanded rapidly, and coverage is growing, albeit slowly. Programs are also evolving to integrate a productive focus and adaptability in the face of shocks. Still, in most countries, most of the poor and vulnerable are not yet covered by social safety net systems. A range of rigorous evaluations have demonstrated that such programs can improve equity, resilience, and opportunities for the benefi t of the poor and vulnerable. For these systems to play this role, however, they need to be brought to scale and provide eff ective coverage in a sustainable fashion.
Bringing social safety nets to scale to reach their full potential in Africa—making them sustainable and eff ective at combating poverty and vulnerability—will require a focus on the political, institutional, and fi scal barriers and opportunities. A strategic approach to engaging in the political process, includ-ing choosing politically informed program parameters, can strengthen social safety net systems. Understanding how to anchor social safety nets in institu-tions for coordination, management, and implementation at scale is critical. Social safety nets require reliable funding, but also effi cient spending. In light of the fi scal constraints that many governments face, smarter spending and new sources of funds are needed, as well as a fi nancing strategy that matches the risk profi le of the country. Overall, strategic choices need to be made to give social safety nets the place they deserve in Africa’s broader national development and poverty reduction strategies.
42 REALIZING THE FULL POTENTIAL OF SOCIAL SAFETY NETS IN AFRICA
References
Albrecht, Peter. 2017. “Th e Political Economy of Social Protection in Sierra Leone.” Background paper, Realizing the Full Potential of Social Safety Nets in Africa, edited by Kathleen Beegle, Aline Coudouel, and Emma Monsalve, forthcoming. World Bank, Washington, DC.
Attah, Ramlatu, Valentina Barca, Andrew Kardan, Ian MacAuslan, Fred Merttens, and Luca Pellerano. 2016. “Can Social Protection Aff ect Psychosocial Wellbeing and Why Does Th is Matter? Lessons from Cash Transfers in Sub-Saharan Africa.” Journal of Development Studies 52 (8): 1115–31.
Bastagli, Francesca. 2015. “Bringing Taxation into Social Protection Analysis and Planning.” ODI Working Paper 421, Overseas Development Institute, London.
Buur, Lars, and Padil Salimo. 2017. “Th e Political Economy of Social Protection in Mozambique.” Background paper, Realizing the Full Potential of Social Safety Nets in Africa, edited by Kathleen Beegle, Aline Coudouel, and Emma Monsalve, forthcom-ing. World Bank, Washington, DC.
Cervigni, Raff aello, and Michael Morris, eds. 2016. Confronting Drought in Africa’s Drylands: Opportunities for Enhancing Resilience. Africa Development Forum Series. Washington, DC: Agence Française de Développement and World Bank.
CGD (Center for Global Development) and Social Finance. 2013. Investing in Social Outcomes: Development Impact Bonds; Th e Report of the Development Impact Bond Working Group. London: Social Finance Ltd; Washington, DC: CGD.
Chandy, Laurence, Natasha Ledlie, and Veronika Penciakova. 2013. “The Final Countdown: Prospects for Ending Extreme Poverty by 2030.” Global Views Policy Paper 2013–04, Brookings Institution, Washington, DC.
Cherrier, Cécile. 2015. “Examining the Catalytic Eff ect of Aid on Domestic Resource Mobilization for Social Transfers in Low-Income Countries.” UNRISD Working Paper 2015-3, United Nations Research Institute for Social Development, Geneva.
Chinyoka, Isaac, and Jeremy Seekings. 2016. “Social Policy Reform under the Government of National Unity in Zimbabwe, 2009–13.” CSSR Working Paper 373, Centre for Social Science Research, University of Cape Town, Cape Town.
Coady, David P., Ian W. H. Parry, Louis Sears, and Baoping Shang. 2015. “How Large Are Global Energy Subsidies?” IMF Working Paper 15/105, International Monetary Fund, Washington, DC.
Coleman, David. 2016. “Variations on the Impact Bond Concept: Remittances as a Funding Source for Impact Bonds in Low- and Middle-Income Countries.” Education Plus Development (blog), September 27.
Dang, Hai-Anh H., and Andrew L. Dabalen. 2017. “Is Poverty in Africa Mostly Chronic or Transient? Evidence from Synthetic Panel Data.” Pol icy Research Working Paper 8033, World Bank, Washington, DC.
Ellis, Frank. 2012. “‘We Are All Poor Here’: Economic Diff erence, Social Divisiveness, and Targeting Cash Transfers in Sub-Saharan Africa.” Journal of Development Studies 48 (2): 201–14.
Fiszbein, Ariel, and Norbert R. Schady. 2009. Conditional Cash Transfers: Reducing Present and Future Poverty. With Francisco H. G. Ferreira, Margaret E. Grosh,
REALIZING THE FULL POTENTIAL OF SOCIAL SAFETY NETS IN AFRICA 43
Niall Keleher, Pedro Olinto, and Emmanuel Skoufi as. World Bank Policy Research Report. Washington, DC: World Bank.
Giannozzi, Sara, and Asmeen Khan. 2011. “Strengthening Governance of Social Safety Nets in East Asia.” Social Protection Discussion Paper 1116, World Bank, Washington, DC.
Glassman, Amanda, and Miriam Temin. 2016. Millions Saved: New Cases of Proven Success in Global Health. Washington, DC: Center for Global Development and Brookings Institution Press.
Granvik, Mia. 2015. “Policy Diff usion, Domestic Politics, and Social Protection in Lesotho, 1998–2012.” CSSR Working Paper 357, Centre for Social Science Research, University of Cape Town, Cape Town.
Grosh, Margaret E., Carlo del Ninno, Emil Tesliuc, and Azedine Ouerghi. 2008. For Protection and Promotion: Th e Design and Implementation of Eff ective Safety Nets. Washington, DC: World Bank.
Guven, Melis U., and Phillippe G. Leite. 2016. “Benefi ts and Costs of Social Pensions in Sub-Saharan Africa.” Social Protection and Labor Discussion Paper 1607, World Bank, Washington, DC.
Hallegatte, Stéphane, Mook Bangalore, Laura Bonzanigo, Marianne Fay, Tomaro Kane, Ulf Narloch, Julie Rozenberg, David Treguer, and Adrien Vogt-Schilb. 2016. Shock Waves: Managing the Impacts of Climate Change on Poverty. Climate Change and Development Series. Washington, DC: World Bank.
Hamer, Sam. 2016. “‘Our Father’s Programmes’: Political Branding around Social Protection in Botswana, 2008–2014.” CSSR Working Paper 370, Centre for Social Science Research, University of Cape Town, Cape Town.
Handa, Sudhanshu, Bruno Martorano, Carolyn Tucker Halpern, Audrey Pettifor, and Harsha Th irumurthy. 2014a. “Th e Government of Kenya’s Cash Transfer Program Reduces the Risk of Sexual Debut among Young People Age 15–25.” PLoS ONE 9 (1).
———. 2014b. “Subjective Well-Being, Risk Perceptions, and Time Discounting: Evidence from a Large-Scale Cash Transfer Programme.” Innocenti Working Paper 2014–02, UNICEF Offi ce of Research, Florence.
Haushofer, Johannes, and Jeremy Shapiro. 2013. “Household Response to Income Changes: Evidence from an Unconditional Cash Transfer Program in Kenya.” Working paper, Abdul Latif Jameel Poverty Action Lab, Massachusetts Institute of Technology, Cambridge, MA.
Hickey, Samuel, and Badru Bukenya. 2016. “Th e Politics of Promoting Social Cash Transfers in Uganda.” ESID Working Paper 69, Eff ective States and Inclusive Development Research Centre, Global Development Institute, School of Environment, Education, and Development, University of Manchester, Manchester, U.K.
Hickey, Samuel, and Tom Lavers. 2017. “Th e Political Economy of the Adoption, Design, and Implementation of Social Protection.” Background paper, Realizing the Full Potential of Social Safety Nets in Africa, edited by Kathleen Beegle, Aline Coudouel, and Emma Monsalve, forthcoming. World Bank, Washington, DC.
Hurrell, Alex, and Ian MacAuslan. 2012. “Th e Political Implications of Cash Transfers in Sub-Saharan Africa: Shaking up the Social System.” Public Management Review 14 (2): 255–72.
44 REALIZING THE FULL POTENTIAL OF SOCIAL SAFETY NETS IN AFRICA
IDinsight. 2015. “Evaluation of M-Tech and Paper Enumeration of Social Cash Transfer Benefi ciaries in Zambia: Implementation Guide.” November 25, IDinsight, New Delhi.
IMF (International Monetary Fund). 2015. Regional Economic Outlook: Sub-Saharan Africa, Navigating Headwinds. World Economic and Financial Surveys. Washington, DC: IMF.
———. 2017. Regional Economic Outlook: Sub-Saharan Africa, Restarting the Growth Engine. World Economic and Financial Surveys (April 17). Washington, DC: IMF.
Inchauste, Gabriela, and David G. Victor, eds. 2017. Th e Political Economy of Energy Subsidy Reform. Directions in Development: Public Sector Governance Series. Washington, DC: World Bank.
Jones, Nicola, Bassam Abu-Hamad, Paola Pereznieto, and Kerry Sylvester. 2016. “Transforming Cash Transfers: Citizens’ Perspectives on the Politics of Programme Implementation.” Journal of Development Studies 52 (8): 1207–24.
Kar, Dev, Devon Cartwright-Smith, and Ann Hollingshead. 2010. “Th e Absorption of Illicit Financial Flows from Developing Countries: 2002–2006.” Global Financial Integrity, Center for International Policy, Washington, DC.
Karippacheril, Tina George, Phillippe George Leite, and Kathy Lindert. 2017. “Guidance Note and Assessment Tool on Social Registries for Social Assistance and Beyond.” Working paper, World Bank, Washington, DC.
Ketkar, Suhas L., and Dilip Ratha. 2007. “Development Finance via Diaspora Bonds: Track Record and Potential.” Policy Research Working Paper 4311, World Bank, Washington, DC.
King, Sophie, and Samuel Hickey. 2017. “Building Democracy from Below: Lessons from Western Uganda.” Journal of Development Studies 53 (10): 1584–99.
Lavers, Tom. 2016. “Social Protection in an Aspiring ‘Developmental State’: Th e Political Drivers of Ethiopia’s PSNP.” WIDER Working Paper 2016/130 (November), United Nations University–World Institute for Development Economics Research, Helsinki.
Molyneux, Maxine. 2016. “Can Cash Transfer Programmes Have ‘Transformative’ Eff ects?” With Nicola Jones and Fiona Samuels. Journal of Development Studies 52 (8): 1087–98.
Monchuk, Victoria. 2014. Reducing Poverty and Investing in People: New Role of Safety Nets in Africa. Directions in Development. Washington, DC: World Bank.
Ndiaye, Alfred. 2017. “The Political Economy of Social Protection in Senegal.” Background paper, Realizing the Full Potential of Social Safety Nets in Africa, edited by Kathleen Beegle, Aline Coudouel, and Emma Monsalve, forthcoming. World Bank, Washington, DC.
O’Brien, Clare, Fidelis Hove, and Gabrielle Smith. 2013. “Factors Aff ecting the Cost-Effi ciency of Electronic Transfers in Humanitarian Programmes.” Oxford Policy Management.
Ortiz, Isabel, Matthew Cummins, and Kalaivani Karunanethy. 2015. “Fiscal Space for Social Protection: Options to Expand Social Investments in 187 Countries.” ESS Working Paper 48, Extension of Social Security, International Labour Offi ce, Geneva.
REALIZING THE FULL POTENTIAL OF SOCIAL SAFETY NETS IN AFRICA 45
Pavanello, Sara, Carol Watson, W. Onyango-Ouma, and Paul Bukuluki. 2016. “Eff ects of Cash Transfers on Community Interactions: Emerging Evidence.” Journal of Development Studies 52 (8): 1147–61.
Pritchett, Lant. 2005. “A Lecture on the Political Economy of Targeted Social Safety Nets.” Social Protection Discussion Paper 0501, World Bank, Washington, DC.
Pruce, Kate, and Samuel Hickey. 2017. “Th e Politics of Promoting Social Protection in Zambia.” ESID Working Paper 75, Eff ective States and Inclusive Development Research Centre, Global Development Institute, School of Environment, Education, and Development, University of Manchester, Manchester, U.K.
Ravallion, Martin. 2013. “How Long Will It Take to Lift One Billion People Out of Poverty?” Policy Research Working Paper 6325, World Bank, Washington, DC.
Ringold, Dena, Alaka Holla, Margaret Koziol, and Santhosh Srinivasan. 2012. Citizens and Service Delivery: Assessing the Use of Social Accountability Approaches in the Human Development Sectors. Directions in Development: Human Development Series. Washington, DC: World Bank.
Seekings, Jeremy. 2015. “Th e ‘Developmental’ and ‘Welfare’ State in South Africa: Lessons for the Southern African Region.” CSSR Working Paper 358, Centre for Social Science Research, University of Cape Town, Cape Town.
———. 2016. “Drought Relief and the Origins of a Conservative Welfare State in Botswana, 1965–1980.” CSSR Working Paper 378, Centre for Social Science Research, University of Cape Town, Cape Town.
Seidenfeld, David, Sudhanshu Handa, and Gelson Tembo. 2013. “24-Month Impact Report for the Child Grant Programme.” September, American Institutes for Research, Washington, DC.
Siachiwena, Hangala. 2016. “Social Protection Policy Reform in Zambia during the Sata Presidency, 2011–2014.” CSSR Working Paper 380, Centre for Social Science Research, University of Cape Town, Cape Town.
Taylor, J. Edward, Justin Kagin, Mateusz Filipski, and Karen Th ome. 2013. “Evaluating General Equilibrium Impacts of Kenya’s Cash Transfer Programme for Orphans and Vulnerable Children (CT-OVC).” PtoP, From Protection to Production Series, Food and Agriculture Organization of the United Nations, Rome.
Taylor, J. Edward, Karen Th ome, Benjamin Davis, David Seidenfeld, and Sudhanshu Handa. 2014. “Evaluating Local General Equilibrium Impacts of Zimbabwe’s Harmonized Social Cash Transfer Programme (HSCT).” PtoP, From Protection to Production Series, Food and Agriculture Organization of the United Nations, Rome.
Taylor, J. Edward, Karen Th ome, and Mateusz Filipski. 2014. “Evaluating Local General Equilibrium Impacts of Lesotho’s Child Grants Programme.” PtoP, From Protection to Production Series, Food and Agriculture Organization of the United Nations, Rome.
Th ome, Karen, J. Edward Taylor, Benjamin Davis, Sudhanshu Handa, David Seidenfeld, and Gelson Tembo. 2014a. “Local Economy-Wide Impact Evaluation (LEWIE) of Zambia’s Child Grant Programme.” PtoP, From Protection to Production Series, Food and Agriculture Organization of the United Nations, Rome.
Th ome, Karen, J. Edward Taylor, Justin Kagin, Benjamin Davis, Robert Darko Osei, and Isaac Osei-Akoto. 2014b. “Local Economy-Wide Impact Evaluation (LEWIE) of
46 REALIZING THE FULL POTENTIAL OF SOCIAL SAFETY NETS IN AFRICA
Ghana’s Livelihood Empowerment against Poverty (LEAP) Programme.” PtoP, From Protection to Production Series, Food and Agriculture Organization of the United Nations, Rome.
Ulriksen, Marianne S. 2016. “Ideational and Institutional Drivers of Social Protection in Tanzania.” WIDER Working Paper 2016/142, United Nations University–World Institute for Development Economics Research, Helsinki.
UNICEF. 2013. “Moving Towards an Integrated and Equitable Social Protection in Th e Gambia: Analysis of Social Protection Systems in Th e Gambia.” UNICEF, New York. https://www.unicef.org/gambia/Moving_towards_an_integrated_and_equitable_social _protection_in_the_Gambia.pdf
Wanyama, Fredrick O., and Anna McCord. 2017. “Th e Politics of Scaling Up Social Protection in Kenya.” ESID Working Paper 87, Eff ective States and Inclusive Development Research Centre, Global Development Institute, School of Environment, Education, and Development, University of Manchester, Manchester, U.K.
World Bank. 2015. A Measured Approach to Ending Poverty and Boosting Shared Prosperity: Concepts, Data, and the Twin Goals. Policy Research Report Series. Washington, DC: World Bank.
———. 2016a. “Ethiopia Public Expenditure Review.” World Bank, Washington, DC. https://openknowledge.worldbank.org/handle/10986/24370.
———. 2016b. “Ghana Social Protection Assessment and Public Expenditure Review.” World Bank, Washington, DC. https://www.openknowledge.worldbank.org / handle/10986/26379.
———. 2016c. “Republic of Chad: Shaping Adaptive Safety Nets to Address Vulnerability.” Washington, DC.
———. 2016d. “République centrafricaine Jeter de nouvelles bases pour la stabilité et la croissance.” Washington, DC.
———. 2018. Th e State of Social Safety Nets 2018. World Bank, Washington, DC.———. Forthcoming a. “Guinea-Bissau: Social Safety Net Assessment.” Washington, DC. ———. Forthcoming b. “Social Protection Financing Diagnostics for Mali.” Washington, DC.
47
In Sub-Saharan Africa (Africa hereaft er), despite strong economic growth and improvements in many dimensions of welfare, poverty remains a pervasive and complex phenomenon. Th e agenda in recent years has included the attempt to tackle poverty through the launch of social safety net programs. Th e shift in social policy that this represents refl ects a progressive evolution in the under-standing of the role that social safety nets can play in the fi ght against poverty and vulnerability.
Th e expansion of social safety nets has been accompanied by shift s in the design of programs. It has also oft en been associated with investments in sys-temic instruments, such as targeting systems, registries, and payment systems, to strengthen the overall system and increase effi ciency.
For countries in Africa to fully realize the potential of social safety nets to help the poorest and most vulnerable seize economic opportunities, there is a need to look beyond the technical aspects of social safety net systems.
Th is report argues that decisive eff orts must focus on three areas: the politi-cal, the institutional, and the fi scal. First, this ambitious agenda implies a shift in the perception and political economy of social safety nets and their potential in national policies for poverty reduction and growth. Second, expansion calls for a strong anchoring of the sector’s programs in institutional arrangements that have the mandate and resources required to deliver these programs as intended. Th ird, in most countries, more attention to the effi ciency, size, and sustainability of resources is necessary if social safety net programs are to reach the desired scale.
Th e report begins with the identifi cation of gaps by contrasting the levels of poverty and vulnerability and the state of social safety net systems in the various subregions and countries of Africa (chapter 1: Reaching the poor and vulnerable in Africa through social safety nets).
Introduction

48 REALIZING THE FULL POTENTIAL OF SOCIAL SAFETY NETS IN AFRICA
Th e report then presents evidence of the impact of social safety nets on equity and poverty reduction, as well as building resilience and expanding opportunities for the poorest and most vulnerable (chapter 2: Social safety nets promote poverty reduction, increase resilience, and expand opportunities).
Th e study then turns to the three systemic shift s that are needed to unleash the full potential of social safety nets in Africa: the need for a shift in the politi-cal economy of social safety nets and their place in society (chapter 3: Recognizing and leveraging politics to sustain and expand social safety nets), the need for strong institutional anchoring to expand social safety nets (chapter 4: Anchoring in strong institutions to expand and sustain social safety nets), and the need for additional fi scal space and greater predictability in funding (chapter 5: Harnessing resources to expand and sustain social safety nets). Th roughout these three chapters, the study systematically highlights recommendations for the adoption of good practices in terms of the nuts and bolts of social safety nets, including the adoption of design innovations to facilitate scaling up these programs.
49
Chapter 1
Reaching the Poor and Vulnerable in Africa through Social Safety NetsKathleen Beegle, Maddalena Honorati, and Emma Monsalve
Although there has been progress in improving socioeconomic conditions, pov-erty and vulnerability remain pervasive in Africa. Because of high population growth, the number of the poor rose from about 280 million to 390 million in the period 1990–2013 despite the falling poverty rate. Many people lack ade-quate water and sanitation, and many children are in poor health and lack quality education opportunities. Vulnerability to shocks is substantial because numerous households live in risky environments.
To tackle these challenges, every African country has established at least one social safety net program, and many have several. Th e number of new social safety net programs launched has increased in Africa over the last decade. Some countries, such as Senegal and Tanzania, have rapidly taken their programs to scale.
Program design varies across the region. Programs focused on cash transfers, public works, or school feeding are the most common. As programs have grown in number and size, design features have also evolved. Notable shift s include more use of cash, programs designed to respond to climate change, a concentra-tion on productive capacity and resilience, and programs promoting human capital development. Countries have also been creating tools and systems to boost program effi ciency and coordination.
Nonetheless, existing programs fail to cover most of the poor. Even if there were no errors in targeting the poor, not all needs would be met because poverty rates are higher than coverage rates in most countries.
To realize the full potential of social safety nets for addressing problems in equity, resilience, and opportunity for poor and vulnerable populations in Africa, programs need to be brought to scale and maintained at scale.
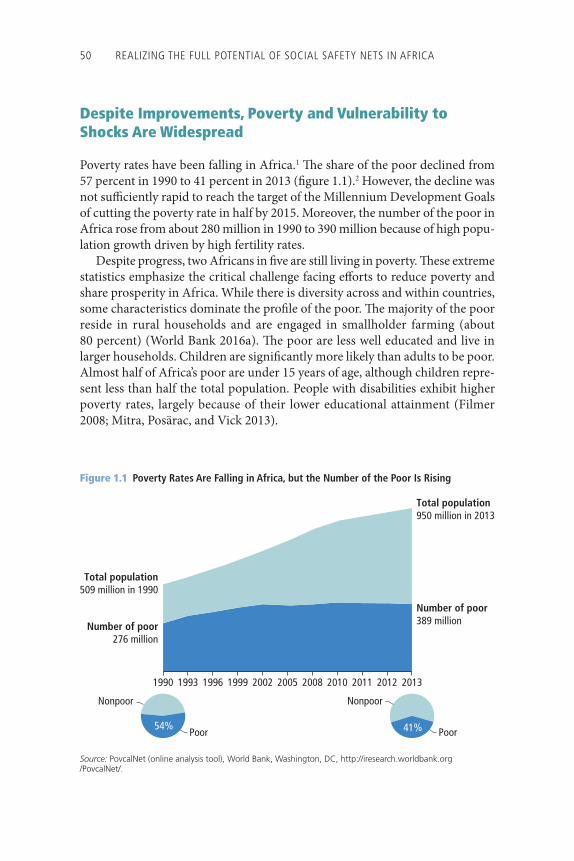
50 REALIZING THE FULL POTENTIAL OF SOCIAL SAFETY NETS IN AFRICA
Despite Improvements, Poverty and Vulnerability to Shocks Are Widespread
Poverty rates have been falling in Africa.1 Th e share of the poor declined from 57 percent in 1990 to 41 percent in 2013 (fi gure 1.1).2 However, the decline was not suffi ciently rapid to reach the target of the Millennium Development Goals of cutting the poverty rate in half by 2015. Moreover, the number of the poor in Africa rose from about 280 million in 1990 to 390 million because of high popu-lation growth driven by high fertility rates.
Despite progress, two Africans in fi ve are still living in poverty. Th ese extreme statistics emphasize the critical challenge facing eff orts to reduce poverty and share prosperity in Africa. While there is diversity across and within countries, some characteristics dominate the profi le of the poor. Th e majority of the poor reside in rural households and are engaged in smallholder farming (about 80 percent) (World Bank 2016a). Th e poor are less well educated and live in larger households. Children are signifi cantly more likely than adults to be poor. Almost half of Africa’s poor are under 15 years of age, although children repre-sent less than half the total population. People with disabilities exhibit higher poverty rates, largely because of their lower educational attainment (Filmer 2008; Mitra, Posärac, and Vick 2013).
Figure 1.1 Poverty Rates Are Falling in Africa, but the Number of the Poor Is Rising
Source: PovcalNet (online analysis tool), World Bank, Washington, DC, http://iresearch.worldbank.org / PovcalNet/.
Poor
Nonpoor
1990 1993 1996 1999 2002 2005 2008 2010 2011 2012 2013
Number of poor389 million
Total population950 million in 2013
Number of poor276 million
Total population509 million in 1990
54% 41% Poor
Nonpoor
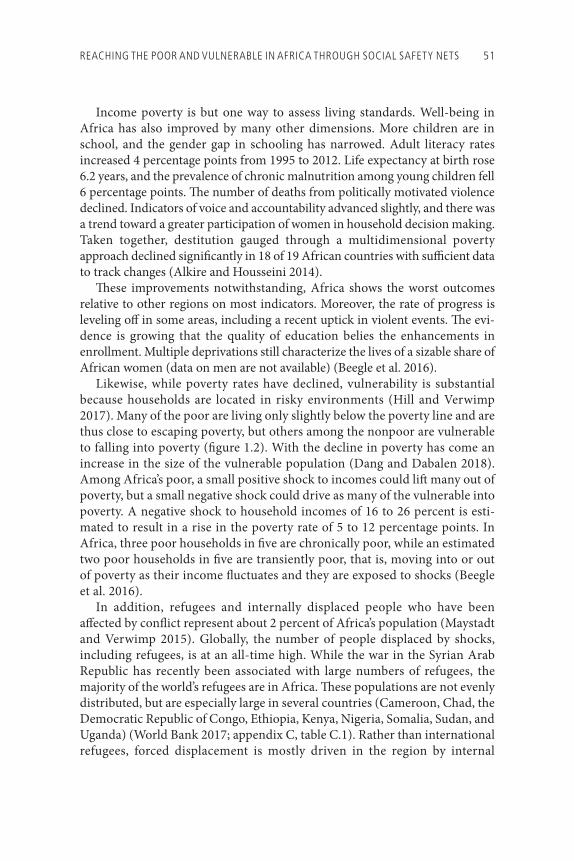
REACHING THE POOR AND VULNERABLE IN AFRICA THROUGH SOCIAL SAFETY NETS 51
Income poverty is but one way to assess living standards. Well-being in Africa has also improved by many other dimensions. More children are in school, and the gender gap in schooling has narrowed. Adult literacy rates increased 4 percentage points from 1995 to 2012. Life expectancy at birth rose 6.2 years, and the prevalence of chronic malnutrition among young children fell 6 percentage points. Th e number of deaths from politically motivated violence declined. Indicators of voice and accountability advanced slightly, and there was a trend toward a greater participation of women in household decision making. Taken together, destitution gauged through a multidimensional poverty approach declined signifi cantly in 18 of 19 African countries with suffi cient data to track changes (Alkire and Housseini 2014).
Th ese improvements notwithstanding, Africa shows the worst outcomes relative to other regions on most indicators. Moreover, the rate of progress is leveling off in some areas, including a recent uptick in violent events. Th e evi-dence is growing that the quality of education belies the enhancements in enrollment. Multiple deprivations still characterize the lives of a sizable share of African women (data on men are not available) (Beegle et al. 2016).
Likewise, while poverty rates have declined, vulnerability is substantial because households are located in risky environments (Hill and Verwimp 2017). Many of the poor are living only slightly below the poverty line and are thus close to escaping poverty, but others among the nonpoor are vulnerable to falling into poverty (fi gure 1.2). With the decline in poverty has come an increase in the size of the vulnerable population (Dang and Dabalen 2018). Among Africa’s poor, a small positive shock to incomes could lift many out of poverty, but a small negative shock could drive as many of the vulnerable into poverty. A negative shock to household incomes of 16 to 26 percent is esti-mated to result in a rise in the poverty rate of 5 to 12 percentage points. In Africa, three poor households in fi ve are chronically poor, while an estimated two poor households in fi ve are transiently poor, that is, moving into or out of poverty as their income fl uctuates and they are exposed to shocks (Beegle et al. 2016).
In addition, refugees and internally displaced people who have been aff ected by confl ict represent about 2 percent of Africa’s population (Maystadt and Verwimp 2015). Globally, the number of people displaced by shocks, including refugees, is at an all-time high. While the war in the Syrian Arab Republic has recently been associated with large numbers of refugees, the majority of the world’s refugees are in Africa. Th ese populations are not evenly distributed, but are especially large in several countries (Cameroon, Chad, the Democratic Republic of Congo, Ethiopia, Kenya, Nigeria, Somalia, Sudan, and Uganda) (World Bank 2017; appendix C, table C.1). Rather than international refugees, forced displacement is mostly driven in the region by internal
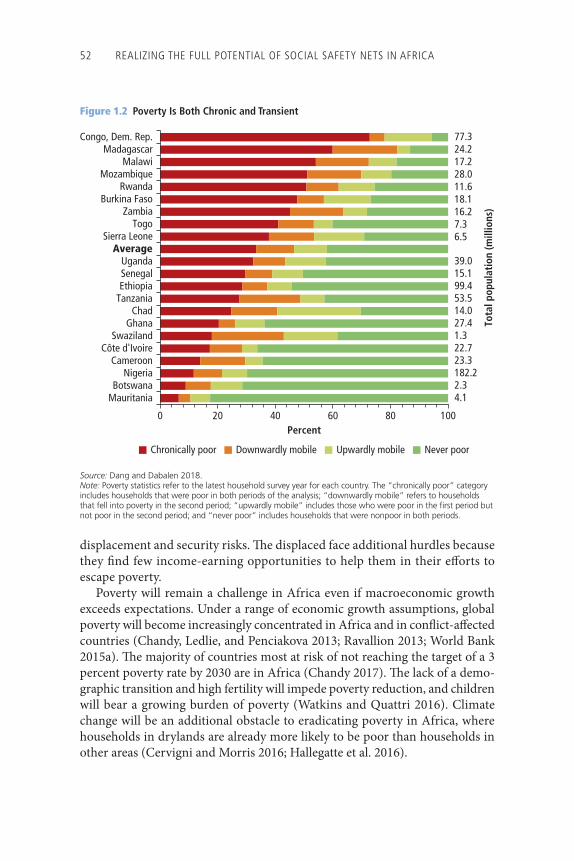
52 REALIZING THE FULL POTENTIAL OF SOCIAL SAFETY NETS IN AFRICA
Figure 1.2 Poverty Is Both Chronic and Transient
Source: Dang and Dabalen 2018.Note: Poverty statistics refer to the latest household survey year for each country. The “chronically poor” category includes households that were poor in both periods of the analysis; “downwardly mobile” refers to households that fell into poverty in the second period; “upwardly mobile” includes those who were poor in the first period but not poor in the second period; and “never poor” includes households that were nonpoor in both periods.
0 20 40 60 80 100
MauritaniaBotswana
NigeriaCameroon
Côte d'IvoireSwaziland
GhanaChad
TanzaniaEthiopiaSenegalUganda
AverageSierra Leone
TogoZambia
Burkina FasoRwanda
MozambiqueMalawi
MadagascarCongo, Dem. Rep.
Percent
Tota
l pop
ulat
ion
(mill
ions
)
77.324.217.228.011.618.116.27.36.5
39.015.199.453.514.027.41.322.723.3182.22.34.1
Downwardly mobile Upwardly mobile Never poorChronically poor
displacement and security risks. Th e displaced face additional hurdles because they fi nd few income-earning opportunities to help them in their eff orts to escape poverty.
Poverty will remain a challenge in Africa even if macroeconomic growth exceeds expectations. Under a range of economic growth assumptions, global poverty will become increasingly concentrated in Africa and in confl ict-aff ected countries (Chandy, Ledlie, and Penciakova 2013; Ravallion 2013; World Bank 2015a). Th e majority of countries most at risk of not reaching the target of a 3 percent poverty rate by 2030 are in Africa (Chandy 2017). Th e lack of a demo-graphic transition and high fertility will impede poverty reduction, and children will bear a growing burden of poverty (Watkins and Quattri 2016). Climate change will be an additional obstacle to eradicating poverty in Africa, where households in drylands are already more likely to be poor than households in other areas (Cervigni and Morris 2016; Hallegatte et al. 2016).
REACHING THE POOR AND VULNERABLE IN AFRICA THROUGH SOCIAL SAFETY NETS 53
Social Safety Nets Have Been Expanding Rapidly in Africa
Most African countries have recently established social safety net programs as part of a broader strategy to protect and promote the poor and the vulnerable. In this report, social safety nets—also sometimes known as social assistance programs—are defi ned as noncontributory benefi ts provided either in cash or in kind and intended to support the poor and the vulnerable (households and individuals particularly exposed to idiosyncratic and covariate risks and lacking suffi cient coping mechanisms or resources to mitigate the impacts). Th ey are a component of the larger social protection systems that also include contributory social insurance, such as pensions and health insurance, as well as labor market policies and programs, and some of the processes analyzed in this report focus more broadly on social protection systems.3
Drawing on the 2012–22 World Bank Social Protection Strategy framework, social safety nets have the three broad objectives of improving the resilience, equity, and opportunities of households (World Bank 2012a, 2012b). Resilience is achieved if well-designed and well-implemented social safety nets help indi-viduals insure against risks (such as illness and natural disasters) and avoid negative coping strategies. Th e equity objective of social safety nets aims to ensure that even the most vulnerable and poorest households reach a minimum level of consumption and cover basic needs. Some social safety net programs have been designed to promote income-generating opportunities and create productive links within local economies. Programs such as universal child grants or social pensions are included, as they are noncontributory and focus on groups perceived as vulnerable. Th e defi nition in this report also includes measures that facilitate the poor’s access to basic services such as health care, education, and housing through targeted fee waivers and scholarships as well as lump-sum grants to promote livelihoods and productive inclusion. General consumer price subsidies, including energy and food subsidies, are not consid-ered to be among social safety net initiatives in this report. Th is study divides programs into nine categories based on the type of benefi t and the permanent or emergency nature of the programs or transfers (box 1.1).
In recent years, social safety nets have been increasingly deployed in the developing world, especially in Africa. By 2015, every country in the world was implementing at least one social safety net program (World Bank 2015b). Most of the recent surge has occurred in Africa (Cirillo and Tebaldi 2016). Mauritius was the fi rst country in Africa to introduce a social safety net program, in 1950, in the form of disability pensions and basic noncontributory allowances for widows and guardians of orphans. Th e number had risen to 18 countries by 2000, then to 32 by 2008 at the onset of the economic crisis, to 36 in 2010, and to 45 in 2017. Th e average number launched each year rose from 7 in 2001–09
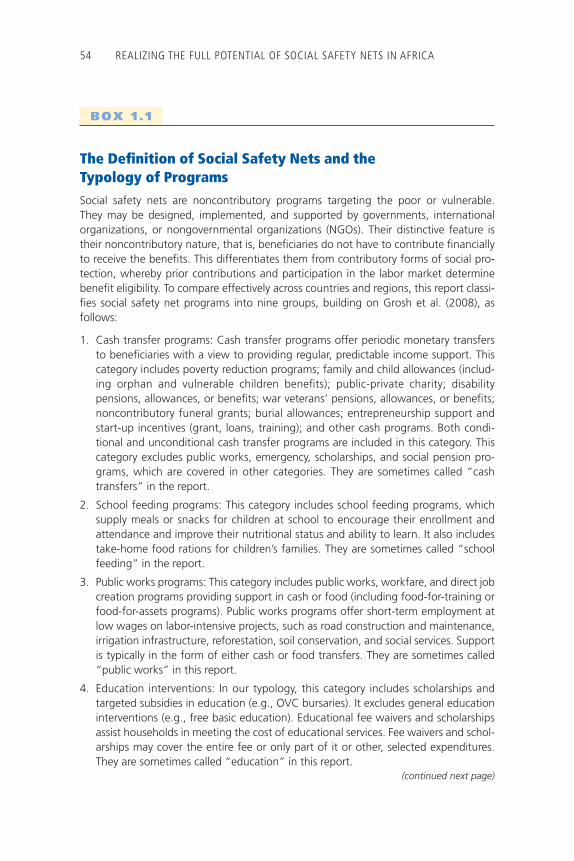
54 REALIZING THE FULL POTENTIAL OF SOCIAL SAFETY NETS IN AFRICA
BOX 1 . 1
The Defi nition of Social Safety Nets and the Typology of ProgramsSocial safety nets are noncontributory programs targeting the poor or vulnerable. They may be designed, implemented, and supported by governments, international organizations, or nongovernmental organizations (NGOs). Their distinctive feature is their noncontributory nature, that is, benefi ciaries do not have to contribute fi nancially to receive the benefi ts. This differentiates them from contributory forms of social pro-tection, whereby prior contributions and participation in the labor market determine benefi t eligibility. To compare effectively across countries and regions, this report classi-fi es social safety net programs into nine groups, building on Grosh et al. (2008), as follows:
1. Cash transfer programs: Cash transfer programs offer periodic monetary transfers to benefi ciaries with a view to providing regular, predictable income support. This category includes poverty reduction programs; family and child allowances (includ-ing orphan and vulnerable children benefi ts); public-private charity; disability pensions, allowances, or benefi ts; war veterans’ pensions, allowances, or benefi ts; noncontributory funeral grants; burial allowances; entrepreneurship support and start-up incentives (grant, loans, training); and other cash programs. Both condi-tional and unconditional cash transfer programs are included in this category. This category excludes public works, emergency, scholarships, and social pension pro-grams, which are covered in other categories. They are sometimes called “cash transfers” in the report.
2. School feeding programs: This category includes school feeding programs, which supply meals or snacks for children at school to encourage their enrollment and attendance and improve their nutritional status and ability to learn. It also includes take-home food rations for children’s families. They are sometimes called “school feeding” in the report.
3. Public works programs: This category includes public works, workfare, and direct job creation programs providing support in cash or food (including food-for-training or food-for-assets programs). Public works programs offer short-term employment at low wages on labor-intensive projects, such as road construction and maintenance, irrigation infrastructure, reforestation, soil conservation, and social services. Support is typically in the form of either cash or food transfers. They are sometimes called “public works” in this report.
4. Education interventions: In our typology, this category includes scholarships and targeted subsidies in education (e.g., OVC bursaries). It excludes general education interventions (e.g., free basic education). Educational fee waivers and scholarships assist households in meeting the cost of educational services. Fee waivers and schol-arships may cover the entire fee or only part of it or other, selected expenditures. They are sometimes called “education” in this report.
(continued next page)
REACHING THE POOR AND VULNERABLE IN AFRICA THROUGH SOCIAL SAFETY NETS 55
5. Health interventions: In our typology, this category includes targeted subsidies and fee waivers in health (e.g., reduced medical fees for vulnerable population). It excludes general health interventions (e.g., free health care/treatments and cam-paigns). Health fee waivers assist selected households in meeting the cost of health services. They are sometimes called “health” in this report.
6. Emergency programs: This category includes programs providing emergency support in cash and in-kind (including support to refugees/returning migrants). Emergency support programs supply cash or in-kind transfers to individuals or households in case of emergency or in response to shocks. The shocks may encompass weather shocks (drought, fl oods), pandemics, food insecurity, human-made crises, and eco-nomic downturns. The transfers are usually temporary, typically over a period of a few months. They are sometimes called “emergency” in this report.
7. Food-based programs: In our typology, food-based programs include programs providing food stamps and vouchers, food distribution programs, and nutritional programs that involve therapeutic feeding distribution and promote good feeding practices. This category excludes food-for-work programs, emergency in-kind trans-fer programs, and meals provided at schools, which are classifi ed in other groups. They are sometimes referred to as “food” in this report.
8. Social pensions: This category includes old-age social pensions, allowances, or benefi ts. Social pensions are regular cash transfers provided exclusively to the elderly. Unlike contributory pensions or social insurance programs, social pensions do not require prior contributions. Social pensions may be universal or targeted to the poor.
9. Other programs: This category includes other noncontributory programs targeting the poor or vulnerable, such as programs distributing school supplies, tax exemp-tions, social care services, and other programs not included in the other eight categories.
Box 1.1 (continued)
to 14 in 2010–15 (fi gure 1.3). Chapter 3 explores the factors behind this growth, including various crises and reforms, as well as evolving social contracts, per-ceptions of the potential of social safety nets, and international infl uence.
Th e widespread adoption of social protection in general and social safety nets in particular is paralleled by the growing number of national strategies or policies (table 1.1; appendix D, table D.1). Social protection has been the focus of attention in numerous national poverty reduction and growth strategies. By 2016, 32 African countries had established national social protection strategies or policies, which include social safety nets as a core pillar. Draft strategies are in the approval process in another seven countries.
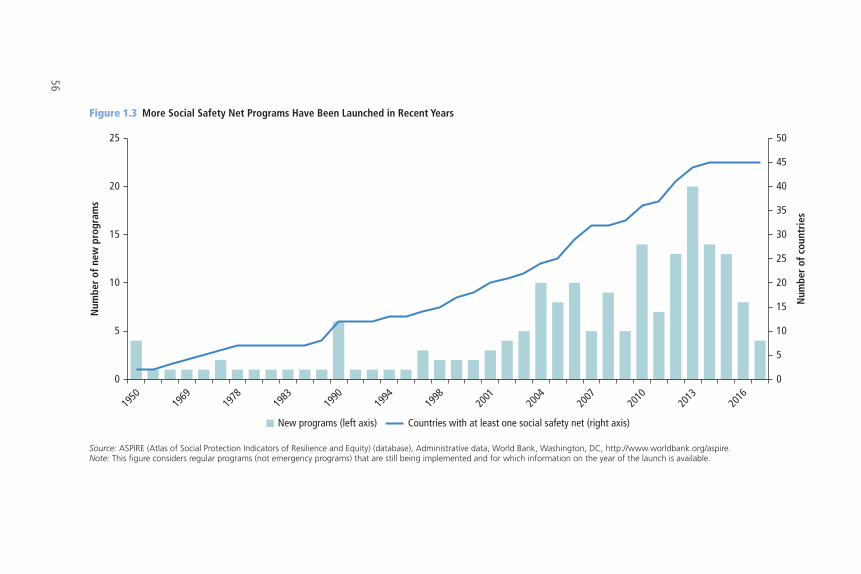
56
Figure 1.3 More Social Safety Net Programs Have Been Launched in Recent Years
Source: ASPIRE (Atlas of Social Protection Indicators of Resilience and Equity) (database), Administrative data, World Bank, Washington, DC, http://www.worldbank.org/aspire.Note: This figure considers regular programs (not emergency programs) that are still being implemented and for which information on the year of the launch is available.
0
5
10
15
20
25
30
35
40
45
50
0
5
10
15
20
25
1950
1969
1978
1983
1990
1994
1998
2001
2004
2007
2010
2013
2016
Num
ber
of c
ount
ries
Num
ber
of n
ew p
rogr
ams
New programs (left axis) Countries with at least one social safety net (right axis)
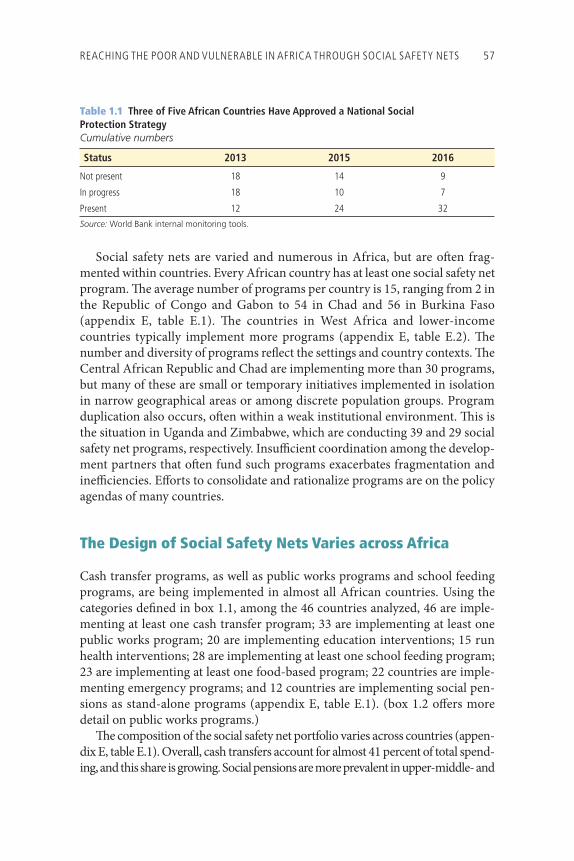
REACHING THE POOR AND VULNERABLE IN AFRICA THROUGH SOCIAL SAFETY NETS 57
Social safety nets are varied and numerous in Africa, but are oft en frag-mented within countries. Every African country has at least one social safety net program. Th e average number of programs per country is 15, ranging from 2 in the Republic of Congo and Gabon to 54 in Chad and 56 in Burkina Faso ( appendix E, table E.1). Th e countries in West Africa and lower-income countries typically implement more programs (appendix E, table E.2). Th e number and diversity of programs refl ect the settings and country contexts. Th e Central African Republic and Chad are implementing more than 30 programs, but many of these are small or temporary initiatives implemented in isolation in narrow geographical areas or among discrete population groups. Program duplication also occurs, oft en within a weak institutional environment. Th is is the situation in Uganda and Zimbabwe, which are conducting 39 and 29 social safety net programs, respectively. Insuffi cient coordination among the develop-ment partners that oft en fund such programs exacerbates fragmentation and ineffi ciencies. Eff orts to consolidate and rationalize programs are on the policy agendas of many countries.
The Design of Social Safety Nets Varies across Africa
Cash transfer programs, as well as public works programs and school feeding programs, are being implemented in almost all African countries. Using the categories defi ned in box 1.1, among the 46 countries analyzed, 46 are imple-menting at least one cash transfer program; 33 are implementing at least one public works program; 20 are implementing education interventions; 15 run health interventions; 28 are implementing at least one school feeding program; 23 are implementing at least one food-based program; 22 countries are imple-menting emergency programs; and 12 countries are implementing social pen-sions as stand-alone programs (appendix E, table E.1). (box 1.2 off ers more detail on public works programs.)
Th e composition of the social safety net portfolio varies across countries (appen-dix E, table E.1). Overall, cash transfers account for almost 41 percent of total spend-ing, and this share is growing. Social pensions are more prevalent in upper-middle- and
Table 1.1 Three of Five African Countries Have Approved a National Social Protection StrategyCumulative numbers
Status 2013 2015 2016
Not present 18 14 9
In progress 18 10 7
Present 12 24 32
Source: World Bank internal monitoring tools.
58 REALIZING THE FULL POTENTIAL OF SOCIAL SAFETY NETS IN AFRICA
BOX 1 .2
How Do Public Works Work?Public works programs have emerged as a critical type of social safety net in low-income settings and fragile states, as well as in middle-income countries (Grosh et al. 2008; Subbarao et al. 2013). These programs typically require that benefi ciaries work before they may become eligible to receive a transfer in cash or in kind. The largest public works programs include the PSNP in Ethiopia and the Employment Guarantee Scheme in Maharashtra and the National Rural Employment Guarantee Act in India. In Africa, 29 of the 48 countries implement public works, though not necessarily on a large scale, and 70 programs have been identifi ed. Public works programs may be pri-marily oriented toward the provision of a social safety net, or they may be primarily oriented toward supplying infrastructure (Subbarao et al. 2013). A a social safety net, the focus of public works are as a means of offering income support to the poor.
Public works programs usually involve labor-intensive activities, tend to operate mostly in rural areas (though some have recently been implemented in urban areas), offer modest wages so the poor self-target into the programs, and are often run off-season, when there are few employment opportunities. They appeal to policy makers and stakeholders because they contribute to a productive economy, create community assets (such as rehabilitated roads, irrigation schemes, and other infrastructure), and are not perceived as supplying handouts, given that they require effort from benefi ciaries.
Public works have been widely promoted as tools to protect poor households in the face of large macroeconomic or agroclimatic shocks (Ravallion 1999). They have recently been garnering attention in fragile and confl ict-affected situations as tools to restart local economic activity quickly or target the employment of high-risk groups, such as young men (Blattman and Ralston 2015). Public works can also contribute to the development of assets, as in Ethiopia, where the PSNP was found to mitigate the risks of climate change by restoring deforested and depredated land (Jirka et al. 2015). As a result, public works programs may smooth consumption among the poor in the short term, such as other social safety net programs, but also create productive assets that contribute to improving livelihoods over the longer term.
Public works may be adapted to a variety of contexts, but there are challenges. Thus, they are generally more diffi cult to implement than simple cash transfer pro-grams; they are institutionally more complex to administer because many line ministries are often involved, as in the Kazi Kwa Vijana (work for youth) Program in Kenya; and they require strong checks and balances against possible error, fraud, and corruption (Subbarao et al. 2013).
high-income countries and in Southern Africa. Public works programs exist in almost all low-income countries and fragile states, especially in West Africa, but are largely absent in middle- and high-income countries. In Central Africa and fragile states, social safety nets are widely used as responses to shocks, and emergency and food-based programs are the most common types of programs (fi gure 1.4).
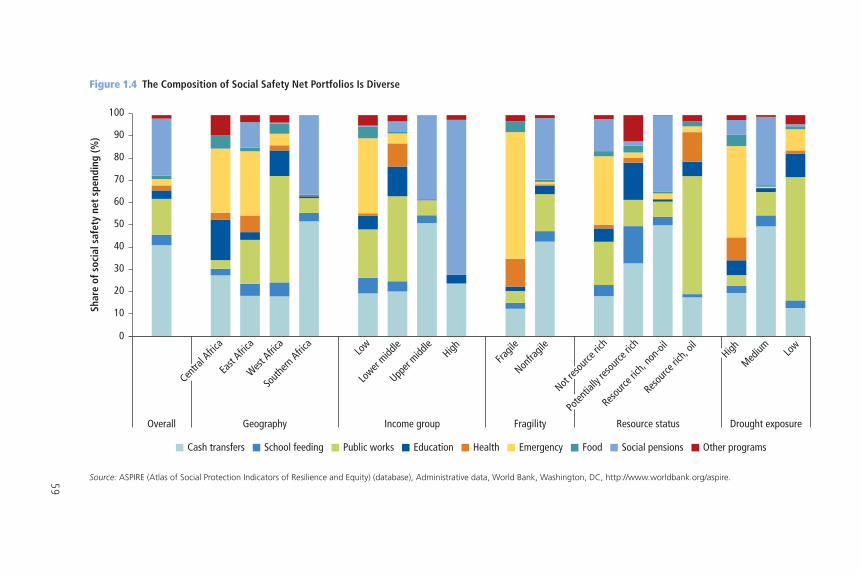
59
Figure 1.4 The Composition of Social Safety Net Portfolios Is Diverse
Source: ASPIRE (Atlas of Social Protection Indicators of Resilience and Equity) (database), Administrative data, World Bank, Washington, DC, http://www.worldbank.org/aspire.
0
10
20
30
40
50
60
70
80
90
100
East
Africa
West Afric
aSo
uthern
Africa
Upper
middle
High
Nonfra
gile
Resourc
e rich
, non
-oil
Resourc
e rich
, oil
Medium Lo
w
GeographyOverall Income group Fragility Resource status Drought exposure
Shar
e of
soc
ial s
afet
y ne
t sp
endi
ng (%
)
Centra
l Afric
a
Low
Lower
middle
Fragil
e
Not res
ource
rich
Poten
tially
reso
urce r
ich
High
Other programsSocial pensionsEmergency FoodHealthEducationPublic worksSchool feedingCash transfers
60 REALIZING THE FULL POTENTIAL OF SOCIAL SAFETY NETS IN AFRICA
Th e vast majority of social safety nets in Africa are targeted to children, either directly or indirectly by assisting households with children (appendix E, table E.3; appendix G, table G.6, presents data on spending). Among all programs, 29 percent directly target children through nutrition interven-tions, benefi ts aimed at orphans and other vulnerable children, school feed-ing programs, the provision of school supplies, and education benefi ts or fee waivers. Among all programs, 31 percent target households more broadly; 19 percent target working-age individuals; 6 percent target the elderly; and 14 percent target other population segments, including the disabled, people living with HIV/AIDS, refugees, and internally displaced people. Th e relative importance of old-age and veterans’ social pensions varies from 7 percent of programs in upper-middle-income countries and 9 percent in Southern Africa to less than 1 percent in low-income countries. Programs are oft en not gender neutral (box 1.3).
Th ough the number of social safety net programs has increased, coverage is oft en limited. Th e combined coverage of programs in Africa is 10 percent of the
BOX 1 .3
The Links between Social Safety Nets and GenderThe substantial gender inequality in Africa is well documented. Huge gaps exist in many spheres of life. Empowering women and girls is thus a critical aspect of economic development. Social safety nets can be a tool for confronting gender inequality. A growing body of evidence indicates that the impact of these programs is not always gender neutral (World Bank 2014). Social safety nets have been shown to empower women, including by reducing the physical abuse of women by men, increasing wom-en’s decision-making power, and curbing risky sexual behavior (Bastagli et al. 2016). Paying cash transfers directly to women has been shown in some contexts to lead to greater household spending on children’s needs, a refl ection of greater empowerment and differential preferences in spending among men and women. This will not be the case everywhere. The channels through which these impacts occur are complex and depend on gender norms and the roles assigned to women by society (World Bank 2014).
Social safety net programs can be more effective at achieving gender-relevant impacts if they are thoughtfully designed with this aim. Common gender-sensitive pro-visions in public works programs include more fl exible working hours, as in the Tanzania Social Action Fund, quotas on women’s participation, less strenuous works for women, and the availability of childcare facilities (Tebaldi 2016). Other gender-sensitive design features include accommodating lower levels of literacy; allowing more fl exibility in the requirements for offi cial documents, such as birth and marriage certifi cates; and locat-ing services near women’s homes.
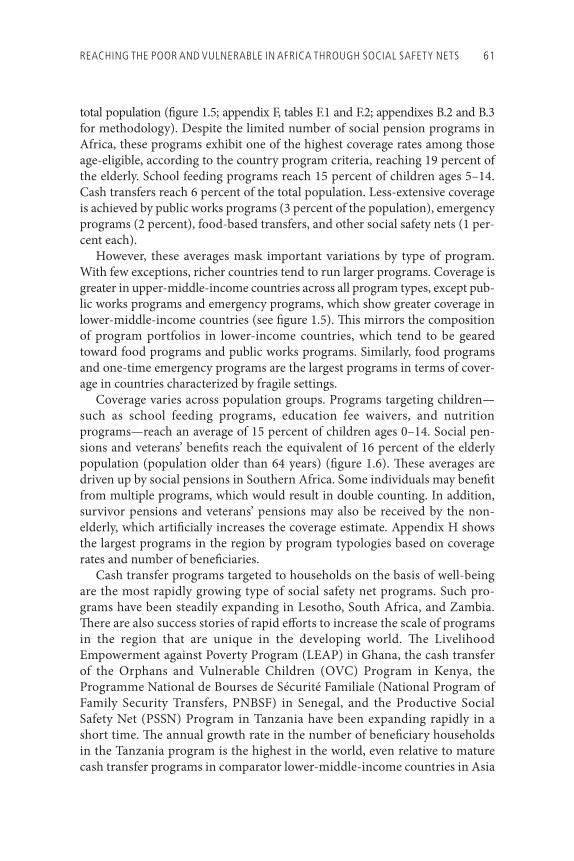
REACHING THE POOR AND VULNERABLE IN AFRICA THROUGH SOCIAL SAFETY NETS 61
total population (fi gure 1.5; appendix F, tables F.1 and F.2; appendixes B.2 and B.3 for methodology). Despite the limited number of social pension programs in Africa, these programs exhibit one of the highest coverage rates among those age-eligible, according to the country program criteria, reaching 19 percent of the elderly. School feeding programs reach 15 percent of children ages 5–14. Cash transfers reach 6 percent of the total population. Less-extensive coverage is achieved by public works programs (3 percent of the population), emergency programs (2 percent), food-based transfers, and other social safety nets (1 per-cent each).
However, these averages mask important variations by type of program. With few exceptions, richer countries tend to run larger programs. Coverage is greater in upper-middle-income countries across all program types, except pub-lic works programs and emergency programs, which show greater coverage in lower-middle-income countries (see fi gure 1.5). Th is mirrors the composition of program portfolios in lower-income countries, which tend to be geared toward food programs and public works programs. Similarly, food programs and one-time emergency programs are the largest programs in terms of cover-age in countries characterized by fragile settings.
Coverage varies across population groups. Programs targeting children—such as school feeding programs, education fee waivers, and nutrition programs—reach an average of 15 percent of children ages 0–14. Social pen-sions and veterans’ benefi ts reach the equivalent of 16 percent of the elderly population (population older than 64 years) (fi gure 1.6). Th ese averages are driven up by social pensions in Southern Africa. Some individuals may benefi t from multiple programs, which would result in double counting. In addition, survivor pensions and veterans’ pensions may also be received by the non-elderly, which artifi cially increases the coverage estimate. Appendix H shows the largest programs in the region by program typologies based on coverage rates and number of benefi ciaries.
Cash transfer programs targeted to households on the basis of well-being are the most rapidly growing type of social safety net programs. Such pro-grams have been steadily expanding in Lesotho, South Africa, and Zambia. Th ere are also success stories of rapid eff orts to increase the scale of programs in the region that are unique in the developing world. Th e Livelihood Empowerment against Poverty Program (LEAP) in Ghana, the cash transfer of the Orphans and Vulnerable Children (OVC) Program in Kenya, the Programme National de Bourses de Sécurité Familiale (National Program of Family Security Transfers, PNBSF) in Senegal, and the Productive Social Safety Net (PSSN) Program in Tanzania have been expanding rapidly in a short time. Th e annual growth rate in the number of benefi ciary households in the Tanzania program is the highest in the world, even relative to mature cash transfer programs in comparator lower-middle-income countries in Asia
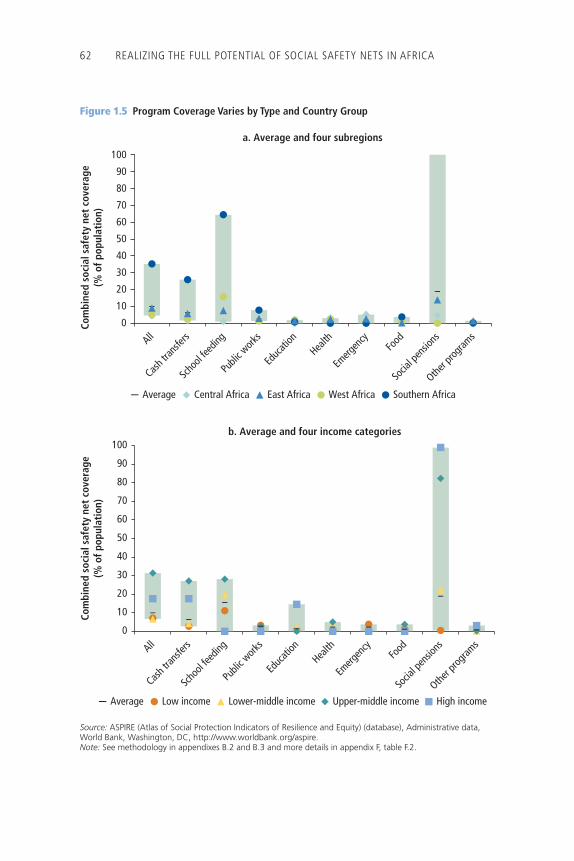
62 REALIZING THE FULL POTENTIAL OF SOCIAL SAFETY NETS IN AFRICA
Figure 1.5 Program Coverage Varies by Type and Country Group
Source: ASPIRE (Atlas of Social Protection Indicators of Resilience and Equity) (database), Administrative data, World Bank, Washington, DC, http://www.worldbank.org/aspire.Note: See methodology in appendixes B.2 and B.3 and more details in appendix F, table F.2.
10
20
30
0
40
50
60
70
80
90
100
Com
bine
d so
cial
saf
ety
net
cove
rage
(% o
f pop
ulat
ion)
a. Average and four subregions
All
Cash t
ransfe
rs
Scho
ol fee
ding
Publi
c work
s
Educ
ation
Health
Emerg
ency
Food
Socia
l pen
sions
Other p
rogram
s
Average Central Africa East Africa West Africa Southern Africa
Average Low income Lower-middle income Upper-middle income High income
0
10
20
30
40
50
60
70
80
90
100
All
Cash tra
nsfer
s
Schoo
l feed
ing
Publi
c work
s
Educ
ation
Health
Emerg
ency
Food
Socia
l pen
sions
Other p
rogram
s
Com
bine
d so
cial
saf
ety
net
cove
rage
(% o
f pop
ulat
ion)
b. Average and four income categories
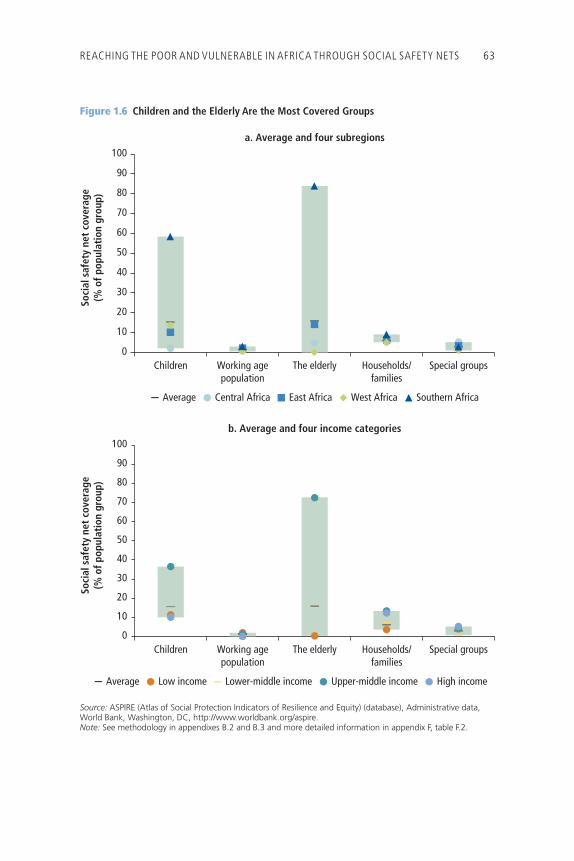
REACHING THE POOR AND VULNERABLE IN AFRICA THROUGH SOCIAL SAFETY NETS 63
Figure 1.6 Children and the Elderly Are the Most Covered Groups
Source: ASPIRE (Atlas of Social Protection Indicators of Resilience and Equity) (database), Administrative data, World Bank, Washington, DC, http://www.worldbank.org/aspire.Note: See methodology in appendixes B.2 and B.3 and more detailed information in appendix F, table F.2.
0
10
20
30
40
50
60
70
80
90
100
Children The elderly Special groups
Soci
al s
afet
y ne
t co
vera
ge(%
of p
opul
atio
n gr
oup)
Working agepopulation
Households/families
a. Average and four subregions
Central Africa East Africa West Africa Southern AfricaAverage
0
10
20
30
40
50
60
70
80
90
100
Children The elderly Special groups
Soci
al s
afet
y ne
t co
vera
ge(%
of p
opul
atio
n gr
oup)
Working agepopulation
Households/families
b. Average and four income categories
Low income Lower-middle income Upper-middle income High incomeAverage
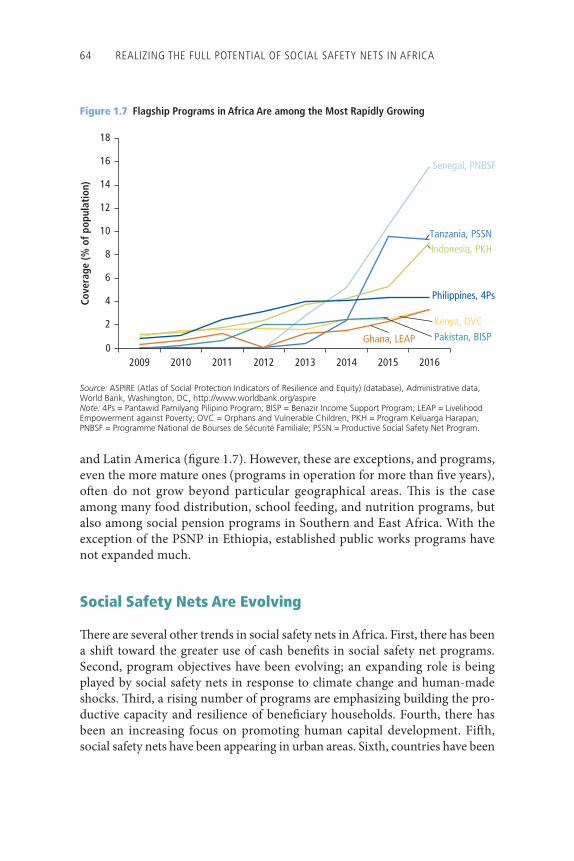
64 REALIZING THE FULL POTENTIAL OF SOCIAL SAFETY NETS IN AFRICA
and Latin America ( fi gure 1.7). However, these are exceptions, and programs, even the more mature ones (programs in operation for more than fi ve years), oft en do not grow beyond particular geographical areas. Th is is the case among many food distribution, school feeding, and nutrition programs, but also among social pension programs in Southern and East Africa. With the exception of the PSNP in Ethiopia, established public works programs have not expanded much.
Social Safety Nets Are Evolving
Th ere are several other trends in social safety nets in Africa. First, there has been a shift toward the greater use of cash benefi ts in social safety net programs. Second, program objectives have been evolving; an expanding role is being played by social safety nets in response to climate change and human-made shocks. Th ird, a rising number of programs are emphasizing building the pro-ductive capacity and resilience of benefi ciary households. Fourth, there has been an increasing focus on promoting human capital development. Fift h, social safety nets have been appearing in urban areas. Sixth, countries have been
Figure 1.7 Flagship Programs in Africa Are among the Most Rapidly Growing
Source: ASPIRE (Atlas of Social Protection Indicators of Resilience and Equity) (database), Administrative data, World Bank, Washington, DC, http://www.worldbank.org/aspireNote: 4Ps = Pantawid Pamilyang Pilipino Program; BISP = Benazir Income Support Program; LEAP = Livelihood Empowerment against Poverty; OVC = Orphans and Vulnerable Children; PKH = Program Keluarga Harapan; PNBSF = Programme National de Bourses de Sécurité Familiale; PSSN = Productive Social Safety Net Program.
0
2
4
6
8
10
12
14
16
18
2009 2010 2011 2012 2013 2014 2015 2016
Cove
rage
(% o
f pop
ulat
ion)
Senegal, PNBSF
Tanzania, PSSNIndonesia, PKH
Philippines, 4Ps
Ghana, LEAP
Kenya, OVCPakistan, BISP
REACHING THE POOR AND VULNERABLE IN AFRICA THROUGH SOCIAL SAFETY NETS 65
gradually concentrating on developing tools and systems to improve program effi ciency and coordination.
Th e progressive shift away from food and in-kind transfers toward cash ben-efi ts likely refl ects a mix of factors, among which were greater perceived effi -ciency and less complexity in coordination across institutions. Changes in technology, the greater concentration of people in urban areas, and greater mar-ket integration are likewise more conducive to the use of cash transfers (World Bank 2016a, 2016b; Garcia and Moore 2012). Cash benefi ts are becoming more common in long-running institutional programs, but also in emergency and crisis situations and in wider discussions of humanitarian assistance (Bailey and Harvey 2017; ODI 2015; World Bank 2016b). Cash transfers have become the primary response in support of disaster-aff ected populations and the preferred option if markets are functioning adequately.
Social safety net programs are increasingly used to respond to climate change and other disasters and shocks (box 1.4). By design and in their delivery
BOX 1 .4
What Are Shock-Responsive Social Safety Nets?Shock-responsive social safety nets are systems that are ready to “meet the anticipated needs of vulnerable populations resulting from the impact of endogenous or exoge-nous shocks which adversely affects livelihoods and labor markets” (McCord 2013). They have traditionally been used to assist the poor and help households manage risks (Grosh et al. 2008). Recently, however, the role of social safety net programs has been expanded to serve as instruments to help cope with covariate shocks, such as natural disasters. These shocks represent special challenges because they affect many large groups of people simultaneously (OPM 2015).
A key feature of shock-responsive social safety net programs is their scalability; that is, the coverage and support they provide may be scaled up rapidly during crises and then scaled back thereafter (Bastagli 2014; Ovadiya 2014a, 2014b; Watson 2016). The rapid expansion can be accomplished in various ways (table B1.4.1).
Several countries have implemented programs with scalable components that allow expansion in response to shocks. While cash transfers are commonly involved in such approaches, food support and public works are also used in shock-responsive social safety net programs. In Ethiopia, for instance, the government has regularly expanded the PSNP to respond to droughts since 2008. Thus, the program was successfully expanded during the Horn of Africa drought in 2011 to support an additional 3.1 million benefi ciaries for three months and to extend the duration of transfers for 6.5 million of the existing 7.6 million benefi ciaries. This response was credited with preventing the worst impacts of the drought, and emerging evidence shows that the program helped protect households from the effects of drought and enabled them to bounce back more quickly after the shock.
(continued next page)
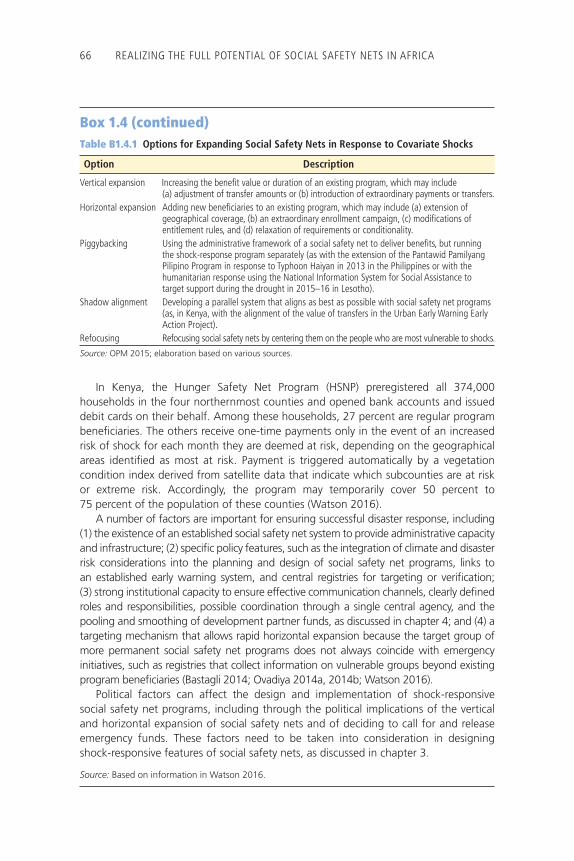
66 REALIZING THE FULL POTENTIAL OF SOCIAL SAFETY NETS IN AFRICA
Table B1.4.1 Options for Expanding Social Safety Nets in Response to Covariate Shocks
Option Description
Vertical expansion Increasing the benefi t value or duration of an existing program, which may include (a) adjustment of transfer amounts or (b) introduction of extraordinary payments or transfers.
Horizontal expansion Adding new benefi ciaries to an existing program, which may include (a) extension of geographical coverage, (b) an extraordinary enrollment campaign, (c) modifi cations of entitlement rules, and (d) relaxation of requirements or conditionality.
Piggybacking Using the administrative framework of a social safety net to deliver benefi ts, but running the shock-response program separately (as with the extension of the Pantawid Pamilyang Pilipino Program in response to Typhoon Haiyan in 2013 in the Philippines or with the humanitarian response using the National Information System for Social Assistance to target support during the drought in 2015–16 in Lesotho).
Shadow alignment Developing a parallel system that aligns as best as possible with social safety net programs (as, in Kenya, with the alignment of the value of transfers in the Urban Early Warning Early Action Project).
Refocusing Refocusing social safety nets by centering them on the people who are most vulnerable to shocks.
Source: OPM 2015; elaboration based on various sources.
In Kenya, the Hunger Safety Net Program (HSNP) preregistered all 374,000 households in the four northernmost counties and opened bank accounts and issued debit cards on their behalf. Among these households, 27 percent are regular program benefi ciaries. The others receive one-time payments only in the event of an increased risk of shock for each month they are deemed at risk, depending on the geographical areas identifi ed as most at risk. Payment is triggered automatically by a vegetation condition index derived from satellite data that indicate which subcounties are at risk or extreme risk. Accordingly, the program may temporarily cover 50 percent to 75 percent of the population of these counties (Watson 2016).
A number of factors are important for ensuring successful disaster response, including (1) the existence of an established social safety net system to provide administrative capacity and infrastructure; (2) specifi c policy features, such as the integration of climate and disaster risk considerations into the planning and design of social safety net programs, links to an established early warning system, and central registries for targeting or verifi cation; (3) strong institutional capacity to ensure effective communication channels, clearly defi ned roles and responsibilities, possible coordination through a single central agency, and the pooling and smoothing of development partner funds, as discussed in chapter 4; and (4) a targeting mechanism that allows rapid horizontal expansion because the target group of more permanent social safety net programs does not always coincide with emergency initiatives, such as registries that collect information on vulnerable groups beyond existing program benefi ciaries (Bastagli 2014; Ovadiya 2014a, 2014b; Watson 2016).
Political factors can affect the design and implementation of shock-responsive social safety net programs, including through the political implications of the vertical and horizontal expansion of social safety nets and of deciding to call for and release emergency funds. These factors need to be taken into consideration in designing shock-responsive features of social safety nets, as discussed in chapter 3.
Source: Based on information in Watson 2016.
Box 1.4 (continued)
REACHING THE POOR AND VULNERABLE IN AFRICA THROUGH SOCIAL SAFETY NETS 67
systems, shock-responsive social safety nets include mechanisms to address the eff ects of slow-onset events such as droughts or environmental degradation and rapid-onset events such as fl oods, cyclones and hurricanes, and pandemics. In some countries, social safety net programs may be modifi ed to respond quickly to predictable shocks or sudden disasters. Th ey may thus combine regular, pre-dictable transfers for the chronically poor and scalable mechanisms that allow the programs to be temporarily expanded to new people or new areas. In other countries, separate programs are set up to be activated in emergencies and then reabsorbed once the crisis is over. In Madagascar, the Intervention Fund for Development was used to deliver cash transfers to people aff ected by a severe drought in 2016. In the Sahel, Burkina Faso, Mali, Mauritania, Niger, and Senegal are testing mechanisms to reach households aff ected by shocks with temporary transfers. Th e PSNP in Ethiopia incorporates several features to respond to climate change, including a contingency budget to help poor house-holds and communities cope with transitory shocks and the use of targeting to identify the communities most vulnerable to climate change.
Social safety net programs were also used to help address the Ebola emergency in West Africa. Despite limitations, governments leveraged modest existing pro-grams and scaled up cash transfers and public works programs. In Sierra Leone, around 5,000 youth participated in public works, and over 10,000 benefi ciaries were enrolled in cash transfer programs in 2015. In Liberia, a public works pro-gram and a cash transfer program were launched to reach over 10,000 poor youth and 10,000 poor households, respectively. In Guinea, the cash-for-work activity continued operating throughout the epidemic, providing 12,000 temporary jobs.Scalable mechanisms have the potential to reduce the cost of emergency response. If crises are recurrent and predictable, it may be more cost-eff ective to invest in social safety net programs or components that may be activated as needed than to rely on emergency aid. Social safety nets will not eliminate the need for human-itarian action because the magnitude of some shocks may still require emergency interventions beyond those provided through social safety nets. Social safety nets are also being considered to support forcibly displaced population groups, which face additional challenges of identifi cation, registration, and social inclusion.
A growing number of social safety net programs include additional activities to support benefi ciary livelihoods. As chapter 2 shows, social safety nets can promote beneficiaries’ income-generation capacity. In addition, various approaches are used to foster the productive inclusion of benefi ciaries, such as enrolling benefi ciaries in agricultural development projects, extension services, microinsurance schemes, fi nancial services, or skills training programs to help foster income-generating activities. Th e PSNP in Ethiopia and the Vision 2020 Umurenge Program (VUP) in Rwanda link benefi ciaries to fi nancial services, while the HSNP in Kenya and the Rural Development Public Works Program in Mali link benefi ciaries to rural development programs. In other contexts, programs off er additional components—such as training, start-up capital,
68 REALIZING THE FULL POTENTIAL OF SOCIAL SAFETY NETS IN AFRICA
and savings support—to promote productive capacity. Thus, the BRAC approach, which combines social safety net transfers with elements of livelihood development and access to fi nance through asset transfers, technical skills train-ing, and life skills coaching, has been piloted in several countries (Hashemi and de Montesquiou 2016). Th is approach is currently being tested in fi ve Sahel countries. Some programs, in particular public works programs, also contribute to the development of community assets to increase resilience to shocks. In some contexts, the productive focus may also respond to political concerns that social safety nets might create dependence among benefi ciaries.
Social safety net programs are increasingly being leveraged to promote investments in human capital, especially among children, to reduce the inter-generational transmission of poverty. Programs have demonstrated positive impacts on child health and education, as described in chapter 2. Programs may promote the adoption of good practices in nutrition, early childhood development, hygiene, education, health care, and so on. Th ey may also stimu-late the use of specifi c basic services by encouraging or requiring health care visits, growth monitoring sessions, or school attendance. Th ese mechanisms or conditionalities used to promote positive behavior or service use include requirements to participate in promotion sessions and to conform with a par-ticular desirable behavior, with or without any verifi cation of compliance, and with or without sanctions for noncompliance. Eff orts to encourage human capital investments have become more frequent, especially in West Africa, including in Burkina Faso, Cameroon, the Republic of Congo, Th e Gambia, Mali, Mauritania, Niger, São Tomé and Príncipe, Senegal, Sierra Leone, and Togo. At least 22 countries in Africa now have programs that use some mecha-nism to promote human capital investments (32 if scholarships are included). Table 1.2 presents a few examples, and box 1.5 discusses these mechanisms in more detail.
As Africa becomes increasingly urbanized, more attention is being given to the introduction or adaptation of social safety net programs to support the urban poor. Urban poverty involves diverse issues, opportunities, and chal-lenges (World Bank 2015b). With the exception of fee waivers and universal social pensions, most social safety nets in Africa have typically been designed with a rural focus. Th ere is a need to create innovative social safety nets to fi t the urban context. Following the 2007–08 food price rises, however, a few programs were launched in urban areas, such as the voucher system in Burkina Faso, the urban cash-for-work program in Mali, the PNBSF cash transfer program in Senegal, and the program to supply free access to water in urban Madagascar. Governments are now considering adjustments in design and implementation arrangements to identify and cover the urban poor more eff ectively. Ethiopia and Tanzania are beginning to implement urban programs, while Mali and Nigeria are planning to do so. Nuts-and-bolts challenges include the
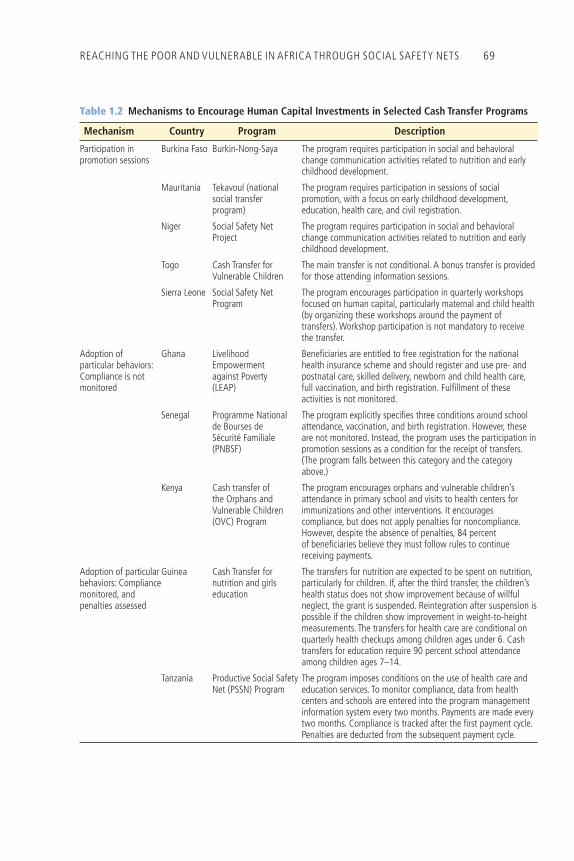
REACHING THE POOR AND VULNERABLE IN AFRICA THROUGH SOCIAL SAFETY NETS 69
Table 1.2 Mechanisms to Encourage Human Capital Investments in Selected Cash Transfer Programs
Mechanism Country Program Description
Participation in promotion sessions
Burkina Faso Burkin-Nong-Saya The program requires participation in social and behavioral change communication activities related to nutrition and early childhood development.
Mauritania Tekavoul (national social transfer program)
The program requires participation in sessions of social promotion, with a focus on early childhood development, education, health care, and civil registration.
Niger Social Safety Net Project
The program requires participation in social and behavioral change communication activities related to nutrition and early childhood development.
Togo Cash Transfer for Vulnerable Children
The main transfer is not conditional. A bonus transfer is provided for those attending information sessions.
Sierra Leone Social Safety Net Program
The program encourages participation in quarterly workshops focused on human capital, particularly maternal and child health (by organizing these workshops around the payment of transfers). Workshop participation is not mandatory to receive the transfer.
Adoption of particular behaviors: Compliance is not monitored
Ghana Livelihood Empowerment against Poverty (LEAP)
Benefi ciaries are entitled to free registration for the national health insurance scheme and should register and use pre- and postnatal care, skilled delivery, newborn and child health care, full vaccination, and birth registration. Fulfi llment of these activities is not monitored.
Senegal Programme National de Bourses de Sécurité Familiale (PNBSF)
The program explicitly specifi es three conditions around school attendance, vaccination, and birth registration. However, these are not monitored. Instead, the program uses the participation in promotion sessions as a condition for the receipt of transfers. (The program falls between this category and the category above.)
Kenya Cash transfer of the Orphans and Vulnerable Children (OVC) Program
The program encourages orphans and vulnerable children’s attendance in primary school and visits to health centers for immunizations and other interventions. It encourages compliance, but does not apply penalties for noncompliance. However, despite the absence of penalties, 84 percent of benefi ciaries believe they must follow rules to continue receiving payments.
Adoption of particular behaviors: Compliance monitored, and penalties assessed
Guinea Cash Transfer for nutrition and girls education
The transfers for nutrition are expected to be spent on nutrition, particularly for children. If, after the third transfer, the children’s health status does not show improvement because of willful neglect, the grant is suspended. Reintegration after suspension is possible if the children show improvement in weight-to-height measurements. The transfers for health care are conditional on quarterly health checkups among children ages under 6. Cash transfers for education require 90 percent school attendance among children ages 7–14.
Tanzania Productive Social Safety Net (PSSN) Program
The program imposes conditions on the use of health care and education services. To monitor compliance, data from health centers and schools are entered into the program management information system every two months. Payments are made every two months. Compliance is tracked after the fi rst payment cycle. Penalties are deducted from the subsequent payment cycle.
70 REALIZING THE FULL POTENTIAL OF SOCIAL SAFETY NETS IN AFRICA
BOX 1 .5
Cash Transfer Programs: Mechanisms to Promote Investment in Human CapitalConditional cash transfer programs have become popular in developing countries over the past two decades. First introduced in Latin America, they were subsequently expanded to Africa, Asia, and the Middle East. Starting with Bolsa Família in Brazil and Prospera in Mexico in 1997, the number of conditional cash transfer programs in the developing world had risen to 27 by 2008 and 64 by 2014. While there are important differences in implementation across countries and regions, the programs share one important feature: they encourage benefi ciaries to adopt positive behaviors. Globally, they typically aim to promote school attendance, improve nutrition practices, or encourage regular immunization and health care visits. Some programs in Africa also focus on civil registration, early childhood development, hygiene, sanitation, and water use.
In Africa, the nature and intensity of the mechanisms deployed to encourage investment in human capital vary greatly, often depending on the supply of basic services and monitoring capacity in a country. Cash transfer programs may be classifi ed along two dimensions: fi rst, depending on the type of action that is required (participate in a promotion session; comply with a simple, punctual behavior; adopt a more complex, continuous behavior; and so on) and, second, depending on the extent to which compliance is compulsory, verifi ed, and associated with the imposition of penalties. In addition to actual program design, the perception of benefi ciaries is also important. Some programs do not impose strict conditions, but communicate strongly around specifi c behaviors. As a result, benefi ciaries perceive a conditionality. Evaluations of the Lesotho Child Grants Program and the Malawi Social Cash Transfer Program highlight the strong messaging and social marketing of the programs on the need to use transfers for the welfare of children, which are perceived by many benefi ciaries as actual conditions (see chapter 2). For each dimension, there is a range of alternative program options. A few examples include the following:
• Programs that foster the adoption of certain behaviors through promotion sessions. This category includes Burkina Faso’s Burkin-Nong-Saya Program, Chad’s cash pro-gram for households in food defi cit, Mauritania’s Tekavoul Program, Niger’s Social Safety Net Project, and Sierra Leone’s Social Safety Net Program. A social safety net program in Togo conditions a bonus transfer on attendance at information sessions as an addition to its main unconditioned cash transfer for pregnant women and mothers of children under age 2. Sessions often cover prenatal and postnatal care, nutrition, early childhood development, child health, education, civil registration, and hygiene. Some programs make participation in these sessions compulsory (for instance, in Mauritania), while others simply encourage participation (Sierra Leone). In practice, even if participation is offi cially compulsory, it is not always rigorously monitored. Evaluations show that, even in the absence of active monitoring,
(continued next page)
REACHING THE POOR AND VULNERABLE IN AFRICA THROUGH SOCIAL SAFETY NETS 71
attendance rates tend to be high. In Cameroon and Niger, for instance, 95 percent of benefi ciaries attend the sessions even though there is no rigorous verifi cation.
• Programs that formally require the adoption of certain behaviors, but do not monitor compliance. These programs typically announce that benefi ciaries must adopt cer-tain behaviors, usually linked to the use of basic services to improve children’s educa-tion, nutrition, and health status. In the cash transfer program in Cameroon, heads of benefi ciary households sign moral contracts that lay out specifi c actions in 15 areas, including health care, schooling, nutrition, civic action, participation in community public works, and training in income-generating activities. Other pro-grams clearly identify and inform benefi ciaries that they need to adopt a set of behaviors—such as school enrollment and attendance, vaccination, and birth regis-tration in the case of Senegal’s PNBSF—but do not monitor compliance. (The PNBSF has also recently made participation in promotion sessions compulsory.) In Ghana, LEAP formally lays out certain expectations of benefi ciaries in the program opera-tions manual for households with under-15-year-olds. (It does not specify these for poor elderly or disabled benefi ciaries.) However, it does not monitor the adoption of these behaviors and actions.
• Programs that require the adoption of certain behaviors, monitor compliance, and impose penalties for noncompliance. In Guinea, cash transfers are conditioned on quarterly health checkups for children under the age of 6 and on 90 percent school attendance among primary-school children. If, after reception of the third cash transfer, a child’s health status has shown no improvement, the grant is suspended. In Kenya, a small pilot intervention among a subset of households benefi ting from the cash transfer of the OVC Program involved monitoring and the application of penalties for noncompliance with conditions on primary-school attendance, immu-nizations, and health checkups among children. This pilot was, however, discontin-ued in 2017 due to a number of operational challenges related to implementing the pilot. The Madagascar Human Development Cash Transfer Program requires benefi ciaries to ensure a minimum of 80 percent attendance by at least two of their children of primary-school age. If households do not comply with the condition, they are penalized through the removal of part of the benefi t. The Tanzania PSSN Program verifi es compliance with school attendance and visits to health clinics. It fully enforces the conditionalities, and benefi ciaries lose the corresponding benefi t if they fail to comply.
A few regional patterns emerge. In West Africa, programs tend to encourage par-ticipation in promotion sessions, and compliance with requirements is often not moni-tored (or penalized). In East and Southern Africa, programs tend to be closer to the Latin American model, wherein conditions are monitored and penalties are enforced for noncompliance.
Sources: Aline Coudouel, based in part on Baird et al. 2014; Fiszbein and Shady 2009; World Bank 2015b.
Box 1.5 (continued)
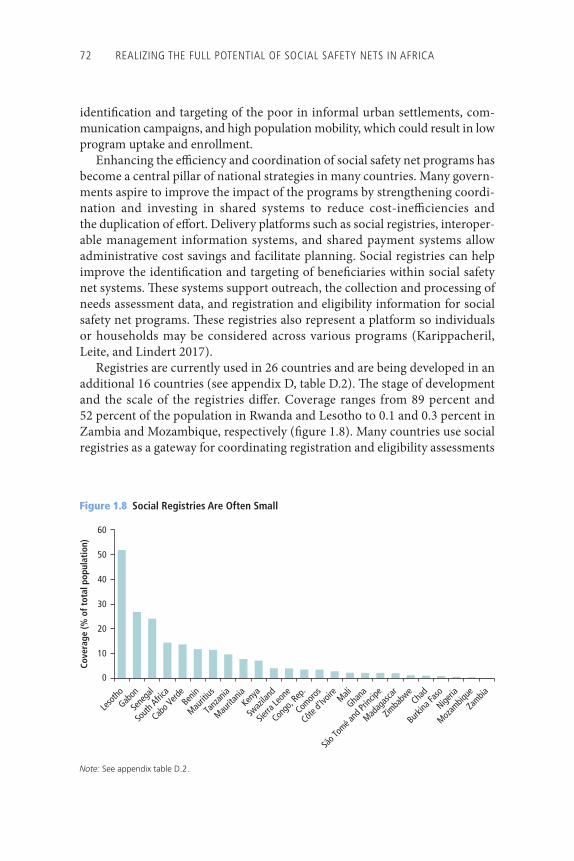
72 REALIZING THE FULL POTENTIAL OF SOCIAL SAFETY NETS IN AFRICA
identifi cation and targeting of the poor in informal urban settlements, com-munication campaigns, and high population mobility, which could result in low program uptake and enrollment.
Enhancing the effi ciency and coordination of social safety net programs has become a central pillar of national strategies in many countries. Many govern-ments aspire to improve the impact of the programs by strengthening coordi-nation and investing in shared systems to reduce cost-ineffi ciencies and the duplication of eff ort. Delivery platforms such as social registries, interoper-able management information systems, and shared payment systems allow administrative cost savings and facilitate planning. Social registries can help improve the identifi cation and targeting of benefi ciaries within social safety net systems. Th ese systems support outreach, the collection and processing of needs assessment data, and registration and eligibility information for social safety net programs. Th ese registries also represent a platform so individuals or households may be considered across various programs (Karippacheril, Leite, and Lindert 2017).
Registries are currently used in 26 countries and are being developed in an additional 16 countries (see appendix D, table D.2). Th e stage of development and the scale of the registries diff er. Coverage ranges from 89 percent and 52 percent of the population in Rwanda and Lesotho to 0.1 and 0.3 percent in Zambia and Mozambique, respectively (fi gure 1.8). Many countries use social registries as a gateway for coordinating registration and eligibility assessments
Figure 1.8 Social Registries Are Often Small
0
10
20
30
40
50
60
Leso
thoGab
on
Sene
gal
South
Africa
Cabo V
erdeBen
in
Mauriti
us
Tanz
ania
Maurita
niaKen
ya
Swaz
iland
Sierra
Leon
e
Congo
, Rep
.
Comoro
s
Côte d’
Ivoire Mali
Ghana
São T
omé a
nd Pr
íncipe
Madag
ascar
Zimba
bwe
Chad
Burkina
Faso
Nigeria
Mozam
bique
Zambia
Cove
rage
(% o
f tot
al p
opul
atio
n)
Note: See appendix table D.2.
REACHING THE POOR AND VULNERABLE IN AFRICA THROUGH SOCIAL SAFETY NETS 73
across social programs, including social safety nets, health care, and other social programs. Th e national household registry being developed in Ghana is intended to replace existing systems to identify the benefi ciaries of the LEAP cash transfer program and the indigent benefi ciaries of the National Health Insurance Scheme, among other programs. Similarly, in Senegal, the registry of poor households is used by social safety net programs and the subsidized health insurance program. In Rwanda, the Ubuehe social registry update was completed in 2017, and the registry covers 2.4 million households and 10.4 million people (almost the entire population). Key building blocks of social safety net delivery systems—especially targeting mechanisms, social reg-istries, and payment systems—are also critical to the development of shock-responsive programs.
Social Safety Nets Are Reaching Some, but Many of the Poor Are Not Covered
Although programs have been expanded, most of the poor in Africa are still not covered by social safety nets. Even if all existing social safety nets were perfectly targeted to the poor, not all poor households would be reached at the current scale of programs (in addition, benefi ts are typically low compared to needs). Th is is because poverty rates are higher than coverage rates in most countries (fi gure 1.9; appendix C, table C.1, and appendix F, table F.1). In practice, in addi-tion, some programs might not target the poor exclusively and may have broader objectives, such as universal social pensions, school feeding programs for all primary-school students, scholarships for all students in tertiary educa-tion, or programs that target specifi c categories deemed vulnerable without necessarily taking into account welfare characteristics.
In addition, benefit leakage contributes to limited coverage of the poor. The benefit incidence of selected programs that target on the basis of pov-erty, welfare, or vulnerability are generally pro-poor, and the performance of programs in Africa is in line with international experience. For instance, more than 60 percent of the households benefiting from the South Africa child support grants programs belong to the poorest two consumption quintiles, and over 60 percent of beneficiaries of the Malawi MASAF Public Works Program (PWP) are among the poor (figure 1.10). However, a cer-tain share of resources goes to richer households. Some limitations in tar-geting are technical because it is hard and costly to assess the welfare status of households effectively and dynamically. However, the decision to target particular groups is also a political one. Indeed, selecting eligible groups is sometimes driven by the need to generate support among the population and decision makers for social safety net programs.
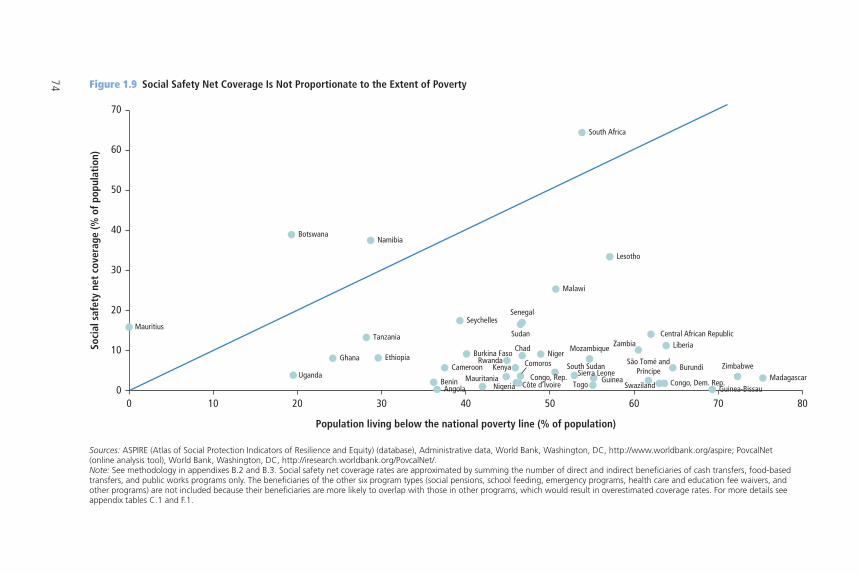
74 Figure 1.9 Social Safety Net Coverage Is Not Proportionate to the Extent of Poverty
AngolaBenin
Botswana
Burkina Faso
BurundiCameroon
Central African Republic
Chad
Comoros
Congo, Dem. Rep.Congo, Rep.
Côte d’Ivoire
EthiopiaGhana
Guinea-Bissau
Kenya
Lesotho
Liberia
Malawi
MadagascarMauritania
Mauritius
Mozambique
Namibia
Niger
Nigeria
Rwanda São Tomé andPríncipe
SenegalSeychelles
GuineaSierra Leone
South Africa
South Sudan
Sudan
Swaziland
Tanzania
TogoUganda
Zambia
Zimbabwe
0
10
20
30
40
50
60
70
0 10 20 30 40 50 60 70 80
Population living below the national poverty line (% of population)
Soci
al s
afet
y ne
t co
vera
ge (%
of p
opul
atio
n)
Sources: ASPIRE (Atlas of Social Protection Indicators of Resilience and Equity) (database), Administrative data, World Bank, Washington, DC, http://www.worldbank.org/aspire; PovcalNet (online analysis tool), World Bank, Washington, DC, http://iresearch.worldbank.org/PovcalNet/.Note: See methodology in appendixes B.2 and B.3. Social safety net coverage rates are approximated by summing the number of direct and indirect beneficiaries of cash transfers, food-based transfers, and public works programs only. The beneficiaries of the other six program types (social pensions, school feeding, emergency programs, health care and education fee waivers, and other programs) are not included because their beneficiaries are more likely to overlap with those in other programs, which would result in overestimated coverage rates. For more details see appendix tables C.1 and F.1.
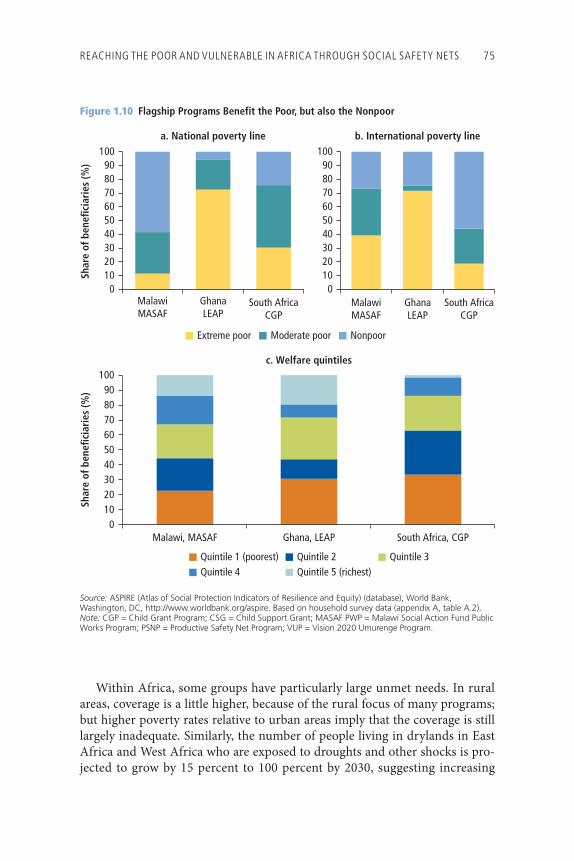
REACHING THE POOR AND VULNERABLE IN AFRICA THROUGH SOCIAL SAFETY NETS 75
Within Africa, some groups have particularly large unmet needs. In rural areas, coverage is a little higher, because of the rural focus of many programs; but higher poverty rates relative to urban areas imply that the coverage is still largely inadequate. Similarly, the number of people living in drylands in East Africa and West Africa who are exposed to droughts and other shocks is pro-jected to grow by 15 percent to 100 percent by 2030, suggesting increasing
Figure 1.10 Flagship Programs Benefit the Poor, but also the Nonpoor
Extreme poor Moderate poor Nonpoor
0102030405060708090
100
MalawiMASAF
GhanaLEAP
South AfricaCGP
Shar
e of
ben
efici
arie
s (%
)
a. National poverty line
0102030405060708090
100
MalawiMASAF
GhanaLEAP
South AfricaCGP
b. International poverty line
Source: ASPIRE (Atlas of Social Protection Indicators of Resilience and Equity) (database), World Bank, Washington, DC, http://www.worldbank.org/aspire. Based on household survey data (appendix A, table A.2).Note: CGP = Child Grant Program; CSG = Child Support Grant; MASAF PWP = Malawi Social Action Fund Public Works Program; PSNP = Productive Safety Net Program; VUP = Vision 2020 Umurenge Program.
0102030405060708090
100
Quintile 1 (poorest) Quintile 2 Quintile 3Quintile 4 Quintile 5 (richest)
Malawi, MASAF Ghana, LEAP South Africa, CGP
c. Welfare quintiles
Shar
e of
ben
efici
arie
s (%
)
76 REALIZING THE FULL POTENTIAL OF SOCIAL SAFETY NETS IN AFRICA
future needs (Cervigni and Morris 2016). Coverage among internally displaced people and refugees is also limited (World Bank 2017).
Benefi t amounts are low relative to the needs in low-income countries. Average benefi ts from cash transfer programs—food, in-kind, and fee waiver programs are not included because the value of the transfers is not directly measurable—vary by program and country groups (table 1.3). Benefi ts usually take into account the cost of basic food items, services, and, sometimes, household size, and are oft en adjusted for urban or rural settings. Th e highest benefi ts are usually off ered through public works or social pensions. Th e latter reach $299 and $84 a month in upper-middle-income countries such as Mauritius and South Africa, representing about 5 percent and 2 percent of per capita gross domestic product (GDP) in these countries, respectively (2011 purchasing power parity [PPP] U.S. dollars; appendix I, table I.3). Public works benefi ts are usually paid per day or per week and are seasonal. Assuming that rotation would allow the same benefi ciary to work 24 days, monthly amounts would be equivalent to $73 in the Malawi MASAF public works program, $155 in the Ethiopia UPSNP, and $153 in the Youth Employment and Skills Development Project in Burkina Faso (in 2011 PPP U.S. dollars; appendix I, table I.2). Th e daily wage is generally similar to the minimum wage. In Ghana, the compensation paid in 2015 by the Labor-Intensive Public Works Program for a six-hour working day averaged $5 in 2011 PPP U.S. dollars, similar to the minimum wage for an eight-hour working day. In low-income countries, cash transfer programs targeted to the poor provide an average of about $30 in 2011 PPP U.S. dollars a month, equivalent to around 4 percent of per capita GDP and 10 percent of the national poverty line in these countries (table 1.3 and appendix I, table I.1). About $20 in 2011 PPP U.S. dollars a month is provided in Tanzania and Uganda. Th e South Africa child support grant program is among the most generous large cash transfer programs, supplying an average of $84 in 2011 PPP U.S. dollars a month, equivalent to 2 percent of per capita GDP. Infl ation will reduce the value, though few programs index benefi ts to price indexes, the minimum wage, or other anchors.
Some Countries Spend Heavily, but Programs Need to Be Brought to Scale and Sustained
African countries spend an average of around 1.2 percent of GDP on social safety nets, compared with a global average of 1.6 percent in the developing world (appendix G, table G.3; World Bank 2015b). Th is represents about 4.6 percent of total government spending. While richer countries invest more on social safety nets on average, the level of government commitment varies across countries with similar GDPs. Indeed, spending may be high even in
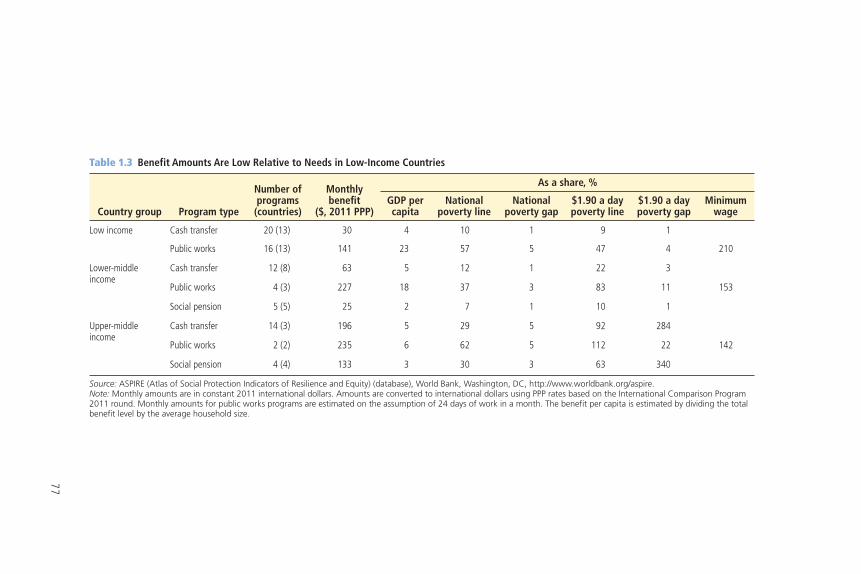
77
Table 1.3 Benefit Amounts Are Low Relative to Needs in Low-Income Countries
Country group Program type
Number of programs (countries)
Monthly benefi t
($, 2011 PPP)
As a share, %
GDP per capita
National poverty line
National poverty gap
$1.90 a day poverty line
$1.90 a day poverty gap
Minimum wage
Low income Cash transfer 20 (13) 30 4 10 1 9 1
Public works 16 (13) 141 23 57 5 47 4 210
Lower-middle income
Cash transfer 12 (8) 63 5 12 1 22 3
Public works 4 (3) 227 18 37 3 83 11 153
Social pension 5 (5) 25 2 7 1 10 1
Upper-middle income
Cash transfer 14 (3) 196 5 29 5 92 284
Public works 2 (2) 235 6 62 5 112 22 142
Social pension 4 (4) 133 3 30 3 63 340
Source: ASPIRE (Atlas of Social Protection Indicators of Resilience and Equity) (database), World Bank, Washington, DC, http://www .worldbank.org/aspire.Note: Monthly amounts are in constant 2011 international dollars. Amounts are converted to international dollars using PPP rates based on the International Comparison Program 2011 round. Monthly amounts for public works programs are estimated on the assumption of 24 days of work in a month. The benefit per capita is estimated by dividing the total benefit level by the average household size.
78 REALIZING THE FULL POTENTIAL OF SOCIAL SAFETY NETS IN AFRICA
countries with low GDP per capita (fi gure 1.11). Chapter 5 argues that expand-ing the scale of social safety nets to cover all the poor and vulnerable requires a strong commitment to prioritize social safety nets in national budgets to realize allocative and administrative effi ciency gains.
Spending levels vary greatly across the region and program type. Upper-middle-income countries in Africa spend an average of 2.2 percent of GDP (6.9 percent of total government expenditures), while low-income countries spend 1.4 percent of GDP (4.8 percent of total government expenditures). Southern Africa spends fi ve times more than Central Africa and two times more than East Africa and West Africa. Non–resource-rich countries devote more than seven times as much to social safety nets (2.1 percent of GDP, or 5.4 percent of government expenditures) as oil-rich countries (0.3 percent of GDP, or 1.8 percent of total government expenditures). Countries with higher exposure to droughts allocate more resources to these programs than countries with low or medium exposure (appendix G, table G.3). When considering all spending going to social safety nets in Africa, the largest category of programs are cash transfer programs, which account for 41 percent of all spending (followed by social pensions, with 26 percent, and public works, with 16 percent), though there are signifi cant regional variations (appendix G, table G.6). Also, the bulk of overall spending is channeled through programs that are targeted according to the poverty, vulner-ability, or well-being status of benefi ciaries (77 percent), once again with signifi -cant variations across country groups (appendix G, table G.6).
Social safety net spending is low relative to government spending on energy subsidies (fi gure 1.12; appendix G, table G.1). For instance, in Central Africa, the spending on energy subsidies is more than three times the spending on social safety nets. Th e equivalent of almost 2.20 percent of GDP in Cameroon is spent on subsidies compared with the 0.10 percent of GDP spent on social safety nets. About 1.90 percent of GDP in the Democratic Republic of Congo is spent on subsidies, compared with 0.7 percent of GDP on social safety nets. In oil-rich countries, energy subsidies are sometimes used as policy instruments to distribute oil revenues among the population. Energy subsidies benefi t all population groups, but are oft en regressive because richer households consume larger quantities of energy.
Humanitarian assistance represents the main source of funding in emer-gency situations, and development partners remain critical in many low-income and fragile contexts. Th e average amount of humanitarian assistance fl owing to fragile countries (3.9 percent of GDP) is larger than the social safety net spend-ing of the governments of these countries (1.4 percent of GDP). Th e Central African Republic and South Sudan are the largest recipients of humanitarian aid (21.6 and 11.3 percent of GDP, respectively), followed by Burundi, Chad, the Democratic Republic of Congo, Liberia, Mali, Niger, and Sierra Leone (appendix G, table G.1). In these countries, humanitarian action provides
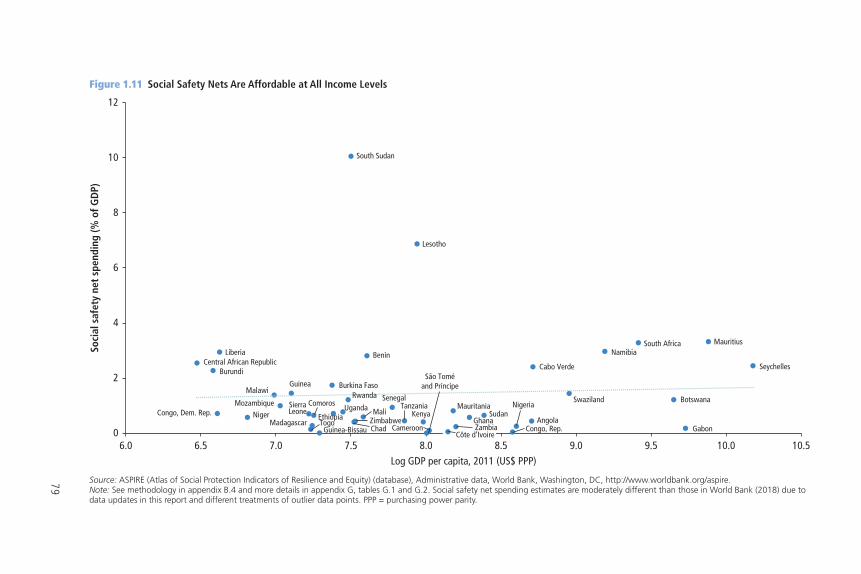
79
Figure 1.11 Social Safety Nets Are Affordable at All Income Levels
0
2
4
6
8
10
12
6.0 6.5 7.0 7.5 8.0 8.5 9.0 9.5 10.0 10.5
Soci
al s
afet
y ne
t sp
endi
ng (%
of G
DP)
Log GDP per capita, 2011 (US$ PPP)
Angola
Benin
Botswana
Burkina Faso
BurundiCabo Verde
Cameroon
Central African Republic
Chad
ComorosCongo, Dem. Rep.
Congo, Rep.Ethiopia
GabonGhana
Guinea
Guinea-Bissau
Kenya
Lesotho
Liberia
Madagascar
Malawi
MaliMauritania
Mauritius
Mozambique
Namibia
NigerNigeria
São Toméand Príncipe
Senegal
Seychelles
South Africa
South Sudan
Sudan
SwazilandTanzania
Togo
Uganda
ZambiaZimbabwe
SierraLeone
Rwanda
Côte d’Ivoire
Source: ASPIRE (Atlas of Social Protection Indicators of Resilience and Equity) (database), Administrative data, World Bank, Washington, DC, http://www.worldbank.org/aspire.Note: See methodology in appendix B.4 and more details in appendix G, tables G.1 and G.2. Social safety net spending estimates are moderately different than those in World Bank (2018) due to data updates in this report and different treatments of outlier data points. PPP = purchasing power parity.
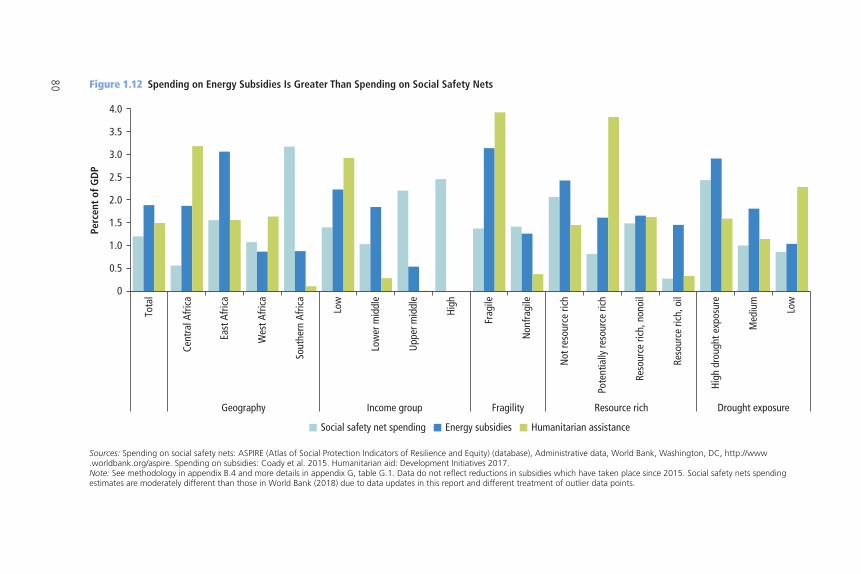
80 Figure 1.12 Spending on Energy Subsidies Is Greater Than Spending on Social Safety Nets
Social safety net spending Energy subsidies Humanitarian assistance
0
0.5
1.0
1.5
2.0
2.5
3.0
3.5
4.0
Tota
l
Cent
ral A
frica
East
Afri
ca
Wes
t Afri
ca
Sout
hern
Afri
ca
Low
Low
er m
iddl
e
Upp
er m
iddl
e
High
Frag
ile
Non
fragi
le
Not
reso
urce
rich
Pote
ntia
lly re
sour
ce ri
ch
Reso
urce
rich
, non
oil
Reso
urce
rich
, oil
High
dro
ught
exp
osur
e
Med
ium
Low
Geography Income group Fragility Resource rich Drought exposure
Perc
ent
of G
DP
Sources: Spending on social safety nets: ASPIRE (Atlas of Social Protection Indicators of Resilience and Equity) (database), Administrative data, World Bank, Washington, DC, http://www .worldbank.org/aspire. Spending on subsidies: Coady et al. 2015. Humanitarian aid: Development Initiatives 2017.Note: See methodology in appendix B.4 and more details in appendix G, table G.1. Data do not reflect reductions in subsidies which have taken place since 2015. Social safety nets spending estimates are moderately different than those in World Bank (2018) due to data updates in this report and different treatment of outlier data points.
REACHING THE POOR AND VULNERABLE IN AFRICA THROUGH SOCIAL SAFETY NETS 81
the core of support to benefi ciaries, and social safety nets play a smaller role. While social safety net spending is channeled through government budgets and government agencies, the resources for humanitarian aid are provided through more diverse channels. Humanitarian aid tends to be supplied through dedi-cated streams fl owing from development partners or the United Nations sys-tem, which typically involves operational humanitarian agencies, not governments. In an eff ort to integrate humanitarian aid through short-term emergency interventions and regular, predictable, long-term social safety net programs, the resources are sometimes distributed from offi cial government delivery platforms if social safety net programs have been established.
Th e role of development partners in expanding social safety nets is critical because they are the main funders of social safety nets in Africa. Development assistance through bilateral and multilateral organizations represents more than half the social safety net fi nancing in the majority of African countries. Some of the important multilateral institutions are the European Union, the United Nations Children’s Fund, the World Bank, the World Food Programme, and several bilateral organizations. Dependence on external fi nancing can jeopar-dize sustainability if programs are 100 percent funded by development partners, though some programs have transitioned from full funding by development partners at inception to gradually increasing support by domestic resources. For instance, Kenya has undertaken a long-term commitment to support safety net programs with domestic resources through its National Safety Net Program, which fully funds some programs and covers more than half the cost of others. Still, in several countries, social safety nets are mostly funded by external fi nanc-ing (the PSNP in Ethiopia and the PSSN in Tanzania) and emergency social safety nets in the Central African Republic (appendix G, table G.5).
Despite progress in reducing poverty in recent decades, the cost of eliminat-ing poverty in Africa will still be high. One way to approximate the resources needed to eliminate poverty is to estimate the aggregate poverty gap, which is the monetary value of the gap between the consumption level of the poor and the poverty line. In Africa, the average poverty gap is about 15 percent of GDP among people living below the national poverty line. Th e poverty gap has been falling as the poverty rate has declined. Still, the average poverty gap as a share of domestic resources (GDP) is large, indicating that domestic resources in most countries are unlikely to be suffi cient to end poverty.4
Notes
1. Th roughout this report, “Africa” refers to the 48 countries in Sub-Saharan Africa. 2. Th e poverty rate is computed as the share of the population living on less than $1.90
a day, the international threshold for global poverty estimates. Th e most recent
82 REALIZING THE FULL POTENTIAL OF SOCIAL SAFETY NETS IN AFRICA
benchmark year for cross-country comparisons is 2013. See PovcalNet (online analysis tool), World Bank, Washington, DC, http://iresearch.worldbank.org / PovcalNet/.
3. Defi nitions of social protection vary, but the term generally refers to policies and programs aimed at preventing or protecting individuals against poverty, vulnerabil-ity, and social exclusion throughout the life cycle, with a particular focus on vulner-able groups. Social protection seeks to build human capital, productive assets, and access to productive jobs. Th e defi nition in this report is consistent with the World Bank Social Protection Strategy 2012–22 and the World Bank Africa Social Protection Strategy (World Bank 2012a, 2012b).
4. Th e gap between need and spending is highly underestimated here because this simple calculation ignores administrative costs and leakages or insuffi cient targeting to reach the poor.
References
Alkire, Sabina, and Bouba Housseini. 2014. “Multidimensional Poverty in Sub-Saharan Africa: Levels and Trends.” OPHI Working Paper 81, Oxford Poverty and Human Development Initiative, University of Oxford, Oxford.
Bailey, Sarah, and Paul Harvey. 2017. “Time for Change: Harnessing the Potential of Humanitarian Cash Transfers.” ODI Report, Overseas Development Institute, London.
Baird, Sarah, Francisco H.G. Ferreira, Berk Özler, and Michael Woolcock. 2014. “Conditional, Unconditional, and Everything in Between: A Systematic Review of the Eff ects of Cash Transfer Programmes on Schooling Outcomes.” Journal of Development Eff ectiveness 6: 1–43.
Bastagli, Francesca. 2014. “Responding to a Crisis: Th e Design and Delivery of Social Protection.” ODI Briefi ng 90, Overseas Development Institute, London.
Bastagli, Francesca, Jessica Hagen-Zanker, Luke Harman, Valentina Barca, Georgina Sturge, and Tanja Schmidt. 2016. Cash Transfers: What Does the Evidence Say? A Rigorous Review of Programme Impact and of the Role of Design and Implementation Features. With Luca Pellerano. London: Overseas Development Institute.
Beegle, Kathleen, Luc Christiaensen, Andrew Dabalen, and Isis Gaddis. 2016. Poverty in a Rising Africa. Africa Poverty Report. Washington, DC: World Bank.
Blattman, Christopher, and Laura Ralston. 2015. “Generating Employment in Poor and Fragile States: Evidence from Labor Market and Entrepreneurship Programs.” Working paper, Columbia University, New York.
Cervigni, Raff aello, and Michael Morris, eds. 2016. Confronting Drought in Africa’s Drylands: Opportunities for Enhancing Resilience. Africa Development Forum Series. Washington, DC: Agence Française de Développement and World Bank.
Chandy, Laurence. 2017. “No Country Left Behind: Th e Case for Focusing Greater Attention on the World’s Poorest Countries.” Global Economy and Development, Brookings Institution, Washington, DC.
REACHING THE POOR AND VULNERABLE IN AFRICA THROUGH SOCIAL SAFETY NETS 83
Chandy, Laurence, Natasha Ledlie, and Veronika Penciakova. 2013. “The Final Countdown: Prospects for Ending Extreme Poverty by 2030.” Global Views Policy Paper 2013–04, Brookings Institution, Washington, DC.
Cirillo, Cristina, and Raquel Tebaldi. 2016. Social Protection in Africa: Inventory of Non-contributory Programmes. Brasília: International Policy Center for Inclusive Growth, United Nations Development Programme.
Coady, David P., Ian W. H. Parry, Louis Sears, and Baoping Shang. 2015. “How Large Are Global Energy Subsidies?” IMF Working Paper 15/105, International Monetary Fund, Washington, DC.
Dang, Hai-Anh H., and Andrew L. Dabalen. 2018. “Is Poverty in Africa Mostly Chronic or Transient? Evidence from Synthetic Panel Data.” Journal of Development Studies.
Development Initiatives. 2017. “Global Humanitarian Assistance Report 2017.” Development Initiatives, Bristol, U.K.
Filmer, Deon. 2008. “Disability, Poverty, and Schooling in Developing Countries: Results from 14 Household Surveys.” World Bank Economic Review 22 (1): 141–63.
Fiszbein, Ariel, and Norbert R. Schady. 2009. Conditional Cash Transfers: Reducing Present and Future Poverty. With Francisco H. G. Ferreira, Margaret E. Grosh, Niall Keleher, Pedro Olinto, and Emmanuel Skoufi as. World Bank Policy Research Report. Washington, DC: World Bank.
Garcia, Marito H., and Charity M. T. Moore. 2012. Th e Cash Dividend: Th e Rise of Cash Transfer Programs in Sub-Saharan Africa. Directions in Development: Human Development Series. Washington, DC: World Bank.
Grosh, Margaret E., Carlo del Ninno, Emil Tesliuc, and Azedine Ouerghi. 2008. For Protection and Promotion: Th e Design and Implementation of Eff ective Safety Nets. Washington, DC: World Bank.
Hallegatte, Stéphane, Mook Bangalore, Laura Bonzanigo, Marianne Fay, Tomaro Kane, Ulf Narloch, Julie Rozenberg, David Treguer, and Adrien Vogt-Schilb. 2016. Shock Waves: Managing the Impacts of Climate Change on Poverty. Climate Change and Development Series. Washington, DC: World Bank.
Hashemi, Syed M., and Aude de Montesquiou. 2016. “Graduation Pathways: Increasing Income and Resilience for the Extreme Poor.” With Katharine McKee. CGAP Brief, Consultative Group to Assist the Poor, World Bank, Washington, DC.
Hill, Ruth, and Philip Verwimp. 2017. “Managing Risk and Confl ict.” In Accelerating Poverty Reduction in Africa, edited by Kathleen Beegle and Luc Christiaensen, chapter 4. Washington, DC: World Bank.
Jirka, Stefan, Dominic Woolf, Dawit Solomon, and Johannes Lehmann. 2015. “Climate Finance for Ethiopia’s Productive Safety Net Programme (PSNP): Comprehensive Report on Accessing Climate Finance and Carbon Markets to Promote Socially and Environmentally Sustainable Public Works Social Safety Net Programs.” World Bank Climate Smart Initiative Report, Cornell University, Ithaca, NY.
Karippacheril, Tina George, Phillippe George Leite, and Kathy Lindert. 2017. “Guidance Note and Assessment Tool on Social Registries for Social Assistance and Beyond.” Working paper, World Bank, Washington, DC.
84 REALIZING THE FULL POTENTIAL OF SOCIAL SAFETY NETS IN AFRICA
Maystadt, Jean-François, and Philip Verwimp. 2015. “Forced Displacement and Refugees in Sub-Saharan Africa: An Economic Inquiry.” Policy Research Working Paper 7517, World Bank, Washington, DC.
McCord, Anna. 2013. “Shockwatch and Social Protection: Shock Response Readiness Appraisal Toolkit.” June, Overseas Development Institute, London.
Mitra, Sophie, Aleksandra Posärac, and Brandon Vick. 2013. “Disability and Poverty in Developing Countries: A Multidimensional Study.” World Development 41 (1): 1–18.
ODI (Overseas Development Institute). 2015. “Doing Cash Diff erently: How Cash Transfers Can Transform Humanitarian Aid; Report of the High Level Panel on Humanitarian Cash Transfers.” September, Center for Global Development, ODI, London.
OPM (Oxford Policy Management). 2015. “Conceptualising Shock-Responsive Social Protection.” Shock-Responsive Social Protection Systems Research Working Paper 1 (October), OPM, Oxford.
Ovadiya, Mirey. 2014a. “Building Flexible and Scalable Social Protection Programs Th at Can Respond to Disasters.” Social Protection and Labor Technical Note 1, World Bank, Washington, DC.
———. 2014b. “Adapting Benefi t Transfer Mechanisms to Respond to Disasters and Climate Change-Related Events.” Social Protection and Labor Technical Note 3, World Bank, Washington, DC.
Ravallion, Martin. 1999. “Appraising Workfare.” World Bank Research Observer 14 (1): 31–48.
———. 2013. “How Long Will It Take to Lift One Billion People out of Poverty?” Policy Research Working Paper 6325, World Bank, Washington, DC.
Subbarao, Kalanidhi, Carlo del Ninno, Colin Andrews, and Claudia Rodríguez-Alas. 2013. Public Works as a Safety Net: Design, Evidence, and Implementation. Directions in Development: Human Development Series. Washington, DC: World Bank.
Tebaldi, Raquel. 2016. “Gender and Social Protection in Sub-Saharan Africa: A General Assessment of Program Design.” Policy Research Brief 58, International Policy Centre for Inclusive Growth, United Nations Development Programme, Brasília.
Watkins, Kevin, and Maria Quattri. 2016. “Child Poverty, Inequality, and Demography: Why Sub-Saharan Africa Matters for the Sustainable Development Goals.” Overseas Development Institute, London.
Watson, Carol. 2016. “Shock-Responsive Social Protection in the Sahel: Community Perspectives.” Shock-Responsive Social Protection Systems Research Working Paper 3, OPM, Oxford.
World Bank. 2012a. World Bank 2012–2022 Social Protection and Labor Strategy: Resilience, Equity, and Opportunity. Washington, DC: World Bank.
———. 2012b. Managing Risk, Promoting Growth: Developing Systems for Social Protection in Africa—Th e World Bank’s Africa Social Protection Strategy 2012–2022. World Bank, Washington, DC.
———. 2014. Th e State of Social Safety Nets 2014. World Bank, Washington, DC.
REACHING THE POOR AND VULNERABLE IN AFRICA THROUGH SOCIAL SAFETY NETS 85
———. 2015a. A Measured Approach to Ending Poverty and Boosting Shared Prosperity: Concepts, Data, and the Twin Goals. Policy Research Report Series. Washington, DC: World Bank.
———. 2015b. Th e State of Social Safety Nets 2015. Washington, DC: World Bank.———. 2016a. Poverty and Shared Prosperity 2016: Taking On Inequality. Washington,
DC: World Bank.———. 2016b. “Strategic Note: Cash Transfers in Humanitarian Contexts—Final
Draft Prepared for the Principals of the Inter-Agency Standing Committee.” June, World Bank, Washington, DC.
———. 2017. Forcibly Displaced: Toward a Development Approach Supporting Refugees, the Internally Displaced, and Th eir Hosts. World Bank, Washington, DC.
———. 2018. Th e State of Social Safety Nets 2018. World Bank, Washington, DC.

87
Chapter 2
Social Safety Nets Promote Poverty Reduction, Increase Resilience, and Expand OpportunitiesColin Andrews, Allan Hsiao, and Laura Ralston
Th ere is growing evidence on the impacts of social safety nets on equity, resilience, and opportunities among the poor and vulnerable in Africa. Th e depth of recent evidence serves to make a case for investment in social safety nets, for the eff ective design of programs, and for bringing programs to scale.
Th e equity objective of social safety nets involves ensuring that the most vulnerable and poorest households reach a minimum level of consumption and are able to cover basic needs. Numerous studies have demonstrated that social safety nets boost consumption and reduce poverty. Th e vast majority of evi-dence indicates that households do not use transfers on temptation goods such as alcohol or tobacco. Th e associated consumption patterns have spillover eff ects in local economies. Social safety nets have been shown to stimulate the demand for retail, services, and agricultural goods.
Social safety nets also help build household resilience to economic shocks through increased savings and investments in productive assets, especially live-stock holdings. Th ey also limit adverse coping strategies among households, including the use of child labor.
Social safety net transfers are not handouts. Instead, they promote longer-term opportunities for productive inclusion. Th ey foster opportunities through investment in human capital: In Africa, programs have been shown to increase school attendance substantially. Th eir impact on health care is more limited and refl ects the demand-side and supply-side constraints to improved health and the speed at which program impacts can be realized. Social safety nets also foster opportunities through investments in productive activities: they lead to the launch or expansion of business activities and more time spent on house-hold farms.
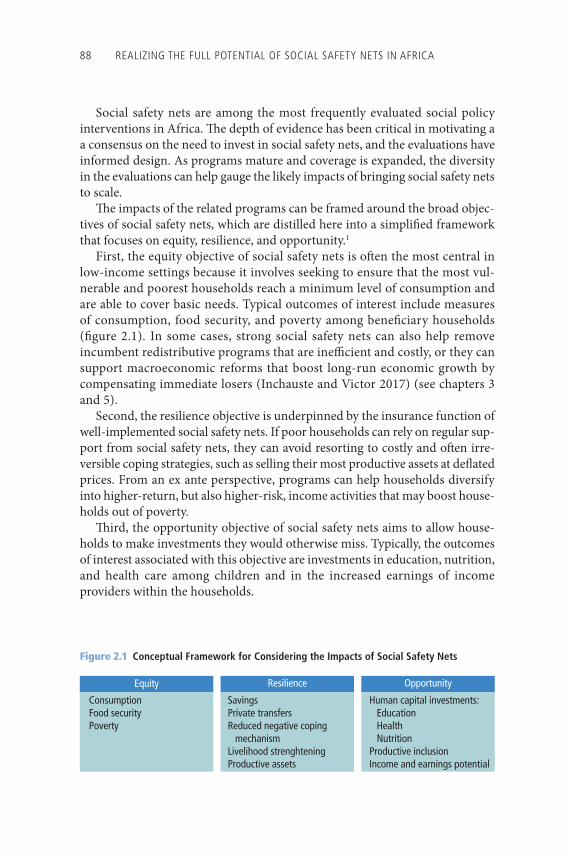
88 REALIZING THE FULL POTENTIAL OF SOCIAL SAFETY NETS IN AFRICA
Social safety nets are among the most frequently evaluated social policy interventions in Africa. Th e depth of evidence has been critical in motivating a a consensus on the need to invest in social safety nets, and the evaluations have informed design. As programs mature and coverage is expanded, the diversity in the evaluations can help gauge the likely impacts of bringing social safety nets to scale.
Th e impacts of the related programs can be framed around the broad objec-tives of social safety nets, which are distilled here into a simplifi ed framework that focuses on equity, resilience, and opportunity.1
First, the equity objective of social safety nets is oft en the most central in low-income settings because it involves seeking to ensure that the most vul-nerable and poorest households reach a minimum level of consumption and are able to cover basic needs. Typical outcomes of interest include measures of consumption, food security, and poverty among benefi ciary households (fi gure 2.1). In some cases, strong social safety nets can also help remove incumbent redistributive programs that are ineffi cient and costly, or they can support macroeconomic reforms that boost long-run economic growth by compensating immediate losers (Inchauste and Victor 2017) (see chapters 3 and 5).
Second, the resilience objective is underpinned by the insurance function of well-implemented social safety nets. If poor households can rely on regular sup-port from social safety nets, they can avoid resorting to costly and oft en irre-versible coping strategies, such as selling their most productive assets at defl ated prices. From an ex ante perspective, programs can help households diversify into higher-return, but also higher-risk, income activities that may boost house-holds out of poverty.
Th ird, the opportunity objective of social safety nets aims to allow house-holds to make investments they would otherwise miss. Typically, the outcomes of interest associated with this objective are investments in education, nutrition, and health care among children and in the increased earnings of income providers within the households.
ConsumptionFood securityPoverty
Human capital investments: Education Health NutritionProductive inclusionIncome and earnings potential
Equity
SavingsPrivate transfersReduced negative coping mechanismLivelihood strenghteningProductive assets
Resilience Opportunity
Figure 2.1 Conceptual Framework for Considering the Impacts of Social Safety Nets
SOCIAL SAFETY NETS AND POVERTY REDUCTION, RESILIENCE, AND OPPORTUNITY 89
Beyond these three objectives of social safety nets, recent discussions have considered the extent to which social safety nets may contribute to economic growth (Alderman and Yemtsov 2013; Barrientos 2012). Channels for growth principally focus on the extent to which social safety nets enable investments and better risk management among benefi ciary households and their commu-nities: pathways that are aligned with the resilience and opportunity objectives.
Th ere is an impressive evidence base, including rigorous impact evaluations and a growing literature, much of which is specifi c to the Africa region.2 Since 2005, 55 impact evaluations, examining 27 social safety net programs in 14 African countries, have been conducted (annex 2A). Th ese studies cover national fl agship social safety net programs in Ethiopia, Ghana, Kenya, Malawi, South Africa, Tanzania, and others. Th ere is also a recent array of literature that aggregates evaluation fi ndings, including systematic reviews of the global evi-dence on various social safety net programs; systematic reviews of specifi c inter-ventions, such as cash transfers; systematic reviews of specifi c outcomes, for example, in education; and comparative country studies (Baird et al. 2013; Bastagli et al. 2016; Davis et al. 2016; Hagen-Zanker, McCord, and Holmes 2011; IEG 2011; Kabeer, Piza, and Taylor 2012; Saavedra and Garcia 2012). One caveat to the recent literature is that Africa-specifi c fi ndings can be diffi cult to glean within global studies, and there are no studies that combine comparable cross-country evidence from Africa to develop the average size of eff ects.
To address these shortcomings, a meta-analysis has been conducted and is presented here. Th e objective of the meta-analysis is to pool evidence across African studies in a systematic way to facilitate a robust and consistent compari-son of impacts on key outcomes. Underpinning the meta-analysis are several important methodological decisions (see annex 2B; Ralston, Andrews, and Hsiao 2017). Conducting a meta-analysis based on a range of impact evalua-tions necessarily focuses on the outcomes of those studies. Some outcomes of interest that are inherently diffi cult to measure are not covered, for instance, the incidence of gender-based violence, social cohesion, and political economy indicators such as trust in government and willingness to accept reforms. A second caveat to this approach is that many impact evaluations are done during early phases of program development, rather than when programs are fully mature and at scale. To speak to this second point, the meta-analysis discussion has been extended to explore the potential impact if programs are brought to scale. Simulations are developed for three countries—Ghana, Liberia, and Niger—to show the scope for poverty reduction, consumption increases, human development improvements, and greater investments in productive assets. A general equilibrium analysis has also been carried out to assess the relative value of social safety net interventions done alone versus those done alongside com-plementary supply-side interventions that may boost aggregate demand.
90 REALIZING THE FULL POTENTIAL OF SOCIAL SAFETY NETS IN AFRICA
While the focus of this analysis is an examination of program impacts on socioeconomic well-being, a number of the studies refl ected on critical design features to maximize the impact of bringing programs to scale. Four broad les-sons emerge. First, the value of a cash transfer is important. Ensuring impacts requires suffi ciently large transfers. Benefi ts need to be updated over time to account for infl ation, which reduces purchasing power. Second, the impact of programs relies on predictability. If benefi ts are not delivered with regularity, households cannot use them as eff ectively. As programs are brought to scale, fi scal sustainability, that is, regular funding, is needed to ensure that they reach maximum impact (see chapter 5). Th ird, coordination with complementary programs, such as skills training or other employment schemes, is crucial in maximizing resilience and promoting productive inclusion. As social safety nets grow, there will be a greater need for a sound institutional framework to tie programs together (see chapter 4). Fourth, as programs grow, so will the demand for key public services, such as schools, health care, and agricultural extension. Th e access to and quality of services can be central factors in maximizing program impacts.
Social Safety Nets Improve Equity
In examining the evidence on equity, the analysis focuses on the impact of social safety net programs on raising household consumption. One of the fundamen-tal purposes of social safety nets is to improve the well-being of the poorest or most vulnerable and lay a foundation for equality of opportunity by allowing families to meet basic needs (World Bank 2012). Household consumption is one of the main channels of the impact of a social safety net intervention because poor households are expected to use the social safety net to satisfy basic house-hold needs, including for food and nonfood staple goods. Hence, in addition to overall household consumption, food consumption is specifi cally examined as a more immediate indicator of impact because food typically constitutes more than half of household consumption among poorer households. Several studies assess food security measures, although the set of indicators is not suffi ciently consistent for the pooled meta-analysis.
Th e literature provides valuable details on individual programs’ impacts on equity. Of 35 cash transfer studies reviewed, including 12 in Africa, 25 (9 in Africa) were found to have a signifi cant impact on raising household consump-tion (Bastagli et al. 2016). Social safety net programs more generally have also been shown to boost consumption, but also to increase frequency and diversity in consumption patterns (Davis et al. 2016).
For the meta-analysis, results from nine programs in Africa were analyzed for impacts on total household consumption.3 On average, total consumption
SOCIAL SAFETY NETS AND POVERTY REDUCTION, RESILIENCE, AND OPPORTUNITY 91
increases by an average $0.74 for each $1.00 transferred, and this result is signifi cant (box 2.1; fi gure 2.2).4 In most programs, there is an increase in household consumption. However, there is considerable heterogeneity across countries in the size of impacts and the precision of estimates. Five programs result in signifi cant increases: the Social Cash Transfer Program (SCTP) in Malawi, the Child Grant Program in Zambia, and Kenya’s Hunger Safety Net Program (HSNP), Orphans and Vulnerable Children (OVC) Program, and
BOX 2 .1
Unpacking the Findings of the Meta-analysisFigures 2.2–2.7 show the results of the meta-analysis. Each fi gure is divided into two panels.
The top panel shows the average size of the effect (the orange horizontal line) and individual program impacts (purple horizontal dashes) expressed in percentage change (to facilitate comparability). The shaded grey bars show the 95 percent confi dence interval for each estimate. The overall confi dence interval is indicated by the yellow shaded area.
The second panel shows the impact of these programs on benefi ciaries. The light blue bar reports baseline measures of the outcome in a standardized way, and the dark blue bars show the incremental change that is attributed to the social safety net pro-gram. The data presented here refl ect more closely what is typically reported in indi-vidual evaluations, but the outcome measures have been converted to comparable units, such as monthly household expenditures or net enrollment rates. All dollar amounts report 2011 purchasing power parity (PPP) U.S. dollars, a price-adjusted com-parable unit across countries.
By way of an illustrative example, consider the fi ndings presented on Kenya’s OVC program (fourth from left) regarding the impacts of total consumption in fi gure 2.2. The top panel reports that household consumption rose by 80 percent of the value of the transfer (at a confi dence interval of 1 percent–160 percent). The second panel reports that the transfer increased total consumption from $346 to $404.
Scanning across programs, as reported in the fi gure note, one may see that monthly transfers varied between $21 and $79, or 8 percent–50 percent of baseline consumption (panel B), and the impacts on consumption varied between reducing consumption by $0.86 per $1.00 transferred (the Livelihood Empowerment against Poverty Program [LEAP] in Ghana) and increasing it by $1.79 per $1.00 transferred (SCTP in Malawi).
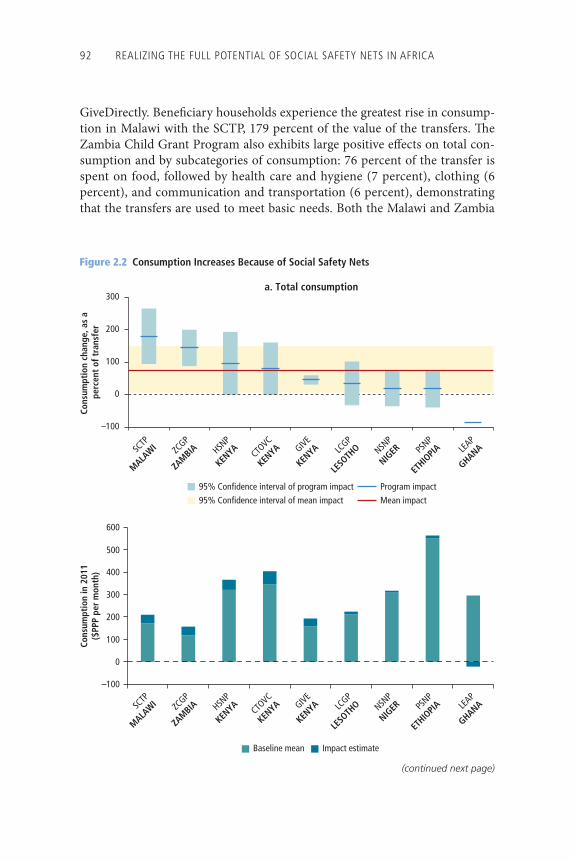
92 REALIZING THE FULL POTENTIAL OF SOCIAL SAFETY NETS IN AFRICA
a. Total consumption
95% Confidence interval of program impact
95% Confidence interval of mean impact
Program impact
Mean impact
–100
0
100
200
300
Cons
umpt
ion
chan
ge, a
s a
perc
ent
of t
rans
fer
SCTP
MALAWI ZC
GP
ZAMBIA HSN
P
KENYA
CTOVC
KENYA GIVE
KENYA LC
GP
LESO
THO NSN
P
NIGER PS
NP
ETHIO
PIA LEAP
GHANA
Baseline mean Impact estimate
0
400
500
300
100
–100
200
600
SCTP
MALAWI ZC
GP
ZAMBIA HSN
P
KENYA
CTOVC
KENYA GIVE
KENYA LC
GP
LESO
THO NSN
P
NIGER PS
NP
ETHIO
PIA LEAP
GHANA
Cons
umpt
ion
in 2
011
($PP
P pe
r m
onth
)
Figure 2.2 Consumption Increases Because of Social Safety Nets
(continued next page)
GiveDirectly. Benefi ciary households experience the greatest rise in consump-tion in Malawi with the SCTP, 179 percent of the value of the transfers. Th e Zambia Child Grant Program also exhibits large positive eff ects on total con-sumption and by subcategories of consumption: 76 percent of the transfer is spent on food, followed by health care and hygiene (7 percent), clothing (6 percent), and communication and transportation (6 percent), demonstrating that the transfers are used to meet basic needs. Both the Malawi and Zambia
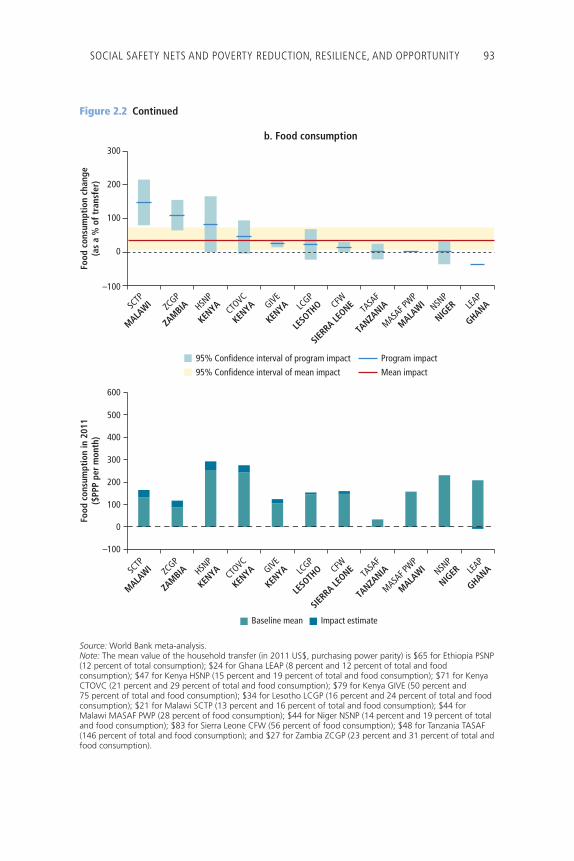
SOCIAL SAFETY NETS AND POVERTY REDUCTION, RESILIENCE, AND OPPORTUNITY 93
Figure 2.2 Continued
Source: World Bank meta-analysis.Note: The mean value of the household transfer (in 2011 US$, purchasing power parity) is $65 for Ethiopia PSNP (12 percent of total consumption); $24 for Ghana LEAP (8 percent and 12 percent of total and food consumption); $47 for Kenya HSNP (15 percent and 19 percent of total and food consumption); $71 for Kenya CTOVC (21 percent and 29 percent of total and food consumption); $79 for Kenya GIVE (50 percent and 75 percent of total and food consumption); $34 for Lesotho LCGP (16 percent and 24 percent of total and food consumption); $21 for Malawi SCTP (13 percent and 16 percent of total and food consumption); $44 for Malawi MASAF PWP (28 percent of food consumption); $44 for Niger NSNP (14 percent and 19 percent of total and food consumption); $83 for Sierra Leone CFW (56 percent of food consumption); $48 for Tanzania TASAF (146 percent of total and food consumption); and $27 for Zambia ZCGP (23 percent and 31 percent of total and food consumption).
–100
0
100
200
300
Food
con
sum
ptio
n ch
ange
(as
a %
of t
rans
fer)
Food
con
sum
ptio
n in
201
1($
PPP
per
mon
th)
95% Confidence interval of program impact
95% Confidence interval of mean impact
Program impact
Mean impact
SCTP
MALAWI ZC
GP
ZAMBIA HSN
P
KENYA CTO
VC
KENYA GIVE
KENYA LC
GP
LESO
THO CFW
SIERRA LE
ONE TASA
F
TANZA
NIA
MASAF P
WP
MALAWI NSN
P
NIGER LE
AP
GHANA
b. Food consumption
SCTP
MALAWI ZC
GP
ZAMBIA HSN
P
KENYA CTO
VC
KENYA GIVE
KENYA LC
GP
LESO
THO CFW
SIERRA LE
ONE TASA
F
TANZA
NIA
MASAF P
WP
MALAWI NSN
P
NIGER LE
AP
GHANA
Baseline mean Impact estimate
0
400
500
300
100
–100
200
600
94 REALIZING THE FULL POTENTIAL OF SOCIAL SAFETY NETS IN AFRICA
programs highlight the multiplier potential of social safety nets, given that the resulting increases in consumption exceed the total transfer received. Overall, the impact as a share of household consumption before the intervention ranges between 0 percent and 33 percent, while the value of the transfer varies between 8 percent and 50 percent of the baseline household consumption.
Th e programs with the largest impact on consumption per dollar targeted poor households on the basis of indicators of household welfare, such as the SCTP in Malawi and the Zambia Child Grant Program. Households in these programs show the lowest levels of baseline consumption, at $172 and $119 per month, respectively (fi gure 2.2, lower panel of a). Th e size of these transfers was modest in relative terms (11 percent to 23 percent of baseline consumption) and absolute terms ($21–$27 per month). Th is fi nding is quite logical: the poorest live on the tightest household budgets, and the extra dollar is likely to have a greater impact on their standards of living. GiveDirectly in Kenya also targets poor households—those living on $157 per month—and realizes robustly posi-tive consumption gains, although at a slightly lower range: about 45 percent of the transfer is spent on consumption. One explanation is that, because the pro-gram has large transfers, ranging from $45 to $160 (a mean of $79) per month, this encouraged greater spending on durable assets (such as roofs), which tend to cost more, rather than daily consumption expenditures. Th e program also explored delivering transfers as a single lump sum rather than monthly and found that this promoted investment over consumption.
The effects on food consumption were also strong for most programs, with a significant average effect of $0.36 per $1.00 transferred. Of the pro-grams, 10 of the 11 available (in eight countries) were associated with rises in food consumption, among which four were significant. Across the pro-grams, food consumption rose by up to 148 percent of the size of the trans-fers and up to 34 percent of food consumption prior to the program (baseline food consumption). The small increase found in the Malawi Social Action Fund public works program (MASAF PWP) appears to reflect a blend of poor design (low transfer value, limited days of employment) and weak implementation (irregular project delivery, low asset creation) (Beegle, Galasso, and Goldberg 2015).
Th e vast majority of the evidence suggests that households do not use the transfers to raise expenditures on temptation goods such as alcohol or tobacco (Evans and Popova 2014; Handa et al. 2017). Even where the fi ndings point to such consumption, it is on a small scale, such as in the Cash for Work Program of the Youth Employment Support Project (CfW) in Sierra Leone (Rosas and Sabarwal 2016).
Aft er household welfare and food consumption, a third category of equity measurement is food security. Several impact evaluations, especially those in which the program transfer is in kind rather than cash, study the impact on
SOCIAL SAFETY NETS AND POVERTY REDUCTION, RESILIENCE, AND OPPORTUNITY 95
food security either as a complement to or in place of consumption measures. Because of the lack of coverage and consistency in measurement, the meta-analysis does not include food security. In some cases, the evaluations show increases in food security, such as in the Productive Safety Net Program (PSNP) and the Social Cash Transfer Pilot Program in Ethiopia, the Niger Safety Net Project, and the Food and Unconditional Cash Transfer Program and the AIDS Support Organization in Uganda. Yet, they fi nd no signifi cant consumption impacts. Generally, the food security increases are captured through expanded dietary diversity, higher food scores, improved anthropometric measures among children, and a reduction in reported food insecurity. All of which can be consistent with no change in the overall consumption value. Ethiopia’s PSNP provides a striking example of the long-term impacts on food security outcomes using the food gap (number of months a household reports food shortages), which represents a broader focus than standardized consumption measures based on shorter recall periods. Between 2006 and 2014, there was substantial improvement in food security, refl ected in a fall in the mean food gap from 3.0 months to 1.9 months (Berhane, Hirvonen, and Hoddinott 2015). Th e improve-ment was the most substantial among households with greater initial food inse-curity. Th e immediate direct eff ect of the transfer to rural households through the PSNP in 2011 has been estimated at a 1.6 percentage point reduction in the national poverty rate (World Bank 2015).
Social safety net programs aff ect not only benefi ciary households but, through local economy eff ects and spillovers, also nonbenefi ciary households. Th us, evaluations fi nd sizable consumption eff ects among nonbenefi ciaries. Based on a combination of survey data collected among households and businesses within local communities, projections indicate that, for each $1.00 equivalent transferred to benefi ciaries, nonbenefi ciaries also see real income increases: $0.26–$0.83 in the Ethiopia Social Cash Transfer Pilot Program, $0.39 in LEAP in Ghana, $0.03–$0.16 in the OVC program in Kenya, $0.33 in the Lesotho Child Grants Program, $0.30 in the Zambia Child Grant Program, and $0.36 in the Zimbabwe Harmonized Social Cash Transfer Program (Taylor, Th ome, and Filipski 2014; Taylor et al. 2013, 2014; Th ome et al. 2014a, 2014b). Th ese income increases are mainly mediated through greater demand for goods and ser-vices in the retail and agriculture sectors of local economies in which other households are also involved. Together with the impacts on benefi ciaries, these additional income eff ects lead to local economy multipliers of 1.08 to 1.84. So, each dollar transferred to a poor household is projected to add more than a dollar to the local economy. Th ese fi ndings are especially relevant in a low-income setting because they highlight the links between social safety nets and the rural economy. However, it is unclear whether these impressive outcomes can be sustained as interventions are implemented at full scale nationally. For example, the models used for the local economy projections assume fi xed input
96 REALIZING THE FULL POTENTIAL OF SOCIAL SAFETY NETS IN AFRICA
prices for goods produced outside communities; but if programs are brought to scale, these prices may adjust upward in response to greater demand, moderat-ing the multiplier eff ects.
Building Resilience through Social Safety Nets
Resilience has become a key focus of social safety nets and within the broader development arena. Resilience in this case is “the ability of coun-tries, communities, and households to manage change by maintaining or transforming living standards in the face of shocks or stress” (DFID 2011, 6). Thanks to resilience, shocks or stresses—such as earthquakes, droughts, or violent conflict—can be confronted without compromising long-term prospects (Alfani et al. 2015). Resilience is linked to the concept of con-sumption smoothing, whereby individuals prefer a stable level of consump-tion despite variations in income and will therefore borrow or save to preserve continuity in consumption. The focus on resilience stems from the recognition that households in developing countries live in risky environ-ments and that the risk is greatest among the poor (Hallegatte et al. 2016; Hill and Verwimp 2017). The emerging emphasis on resilience is also reflected in attempts to strengthen coordination between social safety nets and humanitarian interventions (Clarke and Dercon 2016; Slater, Bailey, and Harvey 2015; see chapters 3 and 5).
Resilience is analyzed through the lens of livelihood strengthening, improved coping strategies, and risk management. Outcomes include the ownership of productive assets for livelihood strengthening, decreases in informal wage work and child labor as indicators of less harmful coping strat-egies, and savings and private transfers for risk management. In terms of pro-ductive assets, because many studies are conducted in rural areas and because smallholder farming is the main livelihood, assets include those associated with agriculture. Th ese outcomes are interconnected with equity and oppor-tunity: the ability to save can improve the ability to send children to school, and more productive assets may lead to higher incomes and then greater con-sumption and less poverty. A challenge in the analysis of resilience revolves around the fact that impact evaluations are not usually devised to capture the direct responses of benefi ciaries to shocks, given the unexpected time-varying nature of shocks and the lack of high-frequency longitudinal studies. Instead, this study focuses on measurable outcomes hypothesized to improve house-hold resilience.
Encouraging evidence suggests that social safety net transfers can success-fully boost investment in productive assets, especially livestock holdings. For most of the poor, livestock holdings, agricultural tools, and other household
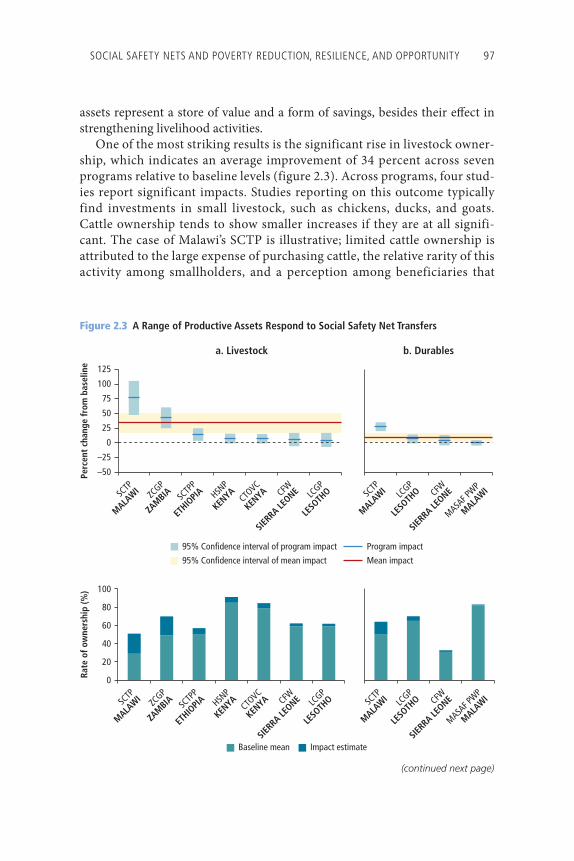
SOCIAL SAFETY NETS AND POVERTY REDUCTION, RESILIENCE, AND OPPORTUNITY 97
Figure 2.3 A Range of Productive Assets Respond to Social Safety Net Transfers
a. Livestock b. Durables
SCTP
MALAWI ZC
GP
ZAMBIA HSN
P
KENYA
CTOVC
KENYA LC
GP
LESO
THOSC
TPP
ETHIO
PIA CFW
SIERRA LE
ONE SCTP
MALAWI LC
GP
LESO
THO
MASAF P
WP
MALAWICFW
SIERRA LE
ONE
Baseline mean Impact estimate
Rate
of o
wne
rshi
p (%
)
0
20
40
60
80
100
SCTP
MALAWI ZC
GP
ZAMBIA HSN
P
KENYA
CTOVC
KENYA LC
GP
LESO
THOSC
TPP
ETHIO
PIA CFW
SIERRA LE
ONE SCTP
MALAWI LC
GP
LESO
THO
MASAF P
WP
MALAWICFW
SIERRA LE
ONE
Perc
ent
chan
ge fr
om b
asel
ine
–50
–25
0
50
25
100
75
125
95% Confidence interval of program impact Program impact
95% Confidence interval of mean impact Mean impact
(continued next page)
assets represent a store of value and a form of savings, besides their eff ect in strengthening livelihood activities.
One of the most striking results is the significant rise in livestock owner-ship, which indicates an average improvement of 34 percent across seven programs relative to baseline levels (figure 2.3). Across programs, four stud-ies report significant impacts. Studies reporting on this outcome typically find investments in small livestock, such as chickens, ducks, and goats. Cattle ownership tends to show smaller increases if they are at all signifi-cant. The case of Malawi’s SCTP is illustrative; limited cattle ownership is attributed to the large expense of purchasing cattle, the relative rarity of this activity among smallholders, and a perception among beneficiaries that
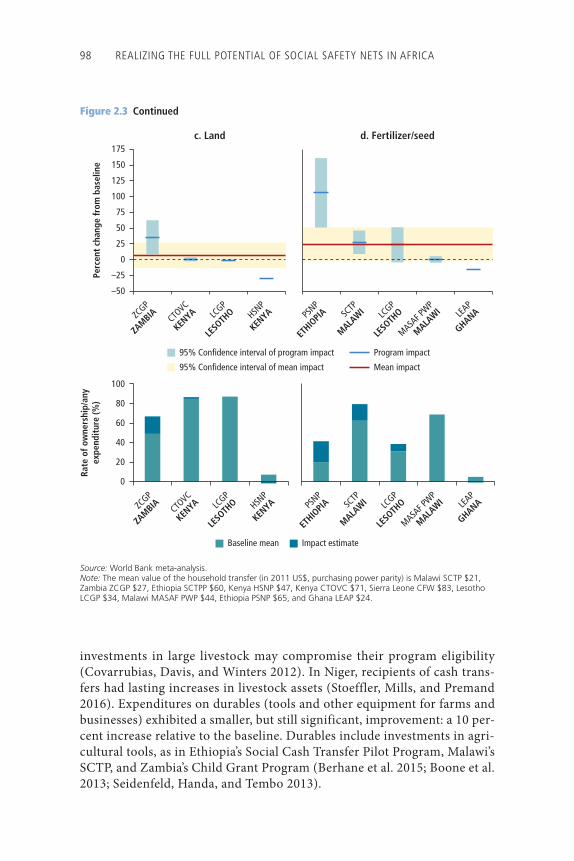
98 REALIZING THE FULL POTENTIAL OF SOCIAL SAFETY NETS IN AFRICA
Figure 2.3 Continued
Source: World Bank meta-analysis.Note: The mean value of the household transfer (in 2011 US$, purchasing power parity) is Malawi SCTP $21, Zambia ZCGP $27, Ethiopia SCTPP $60, Kenya HSNP $47, Kenya CTOVC $71, Sierra Leone CFW $83, Lesotho LCGP $34, Malawi MASAF PWP $44, Ethiopia PSNP $65, and Ghana LEAP $24.
c. Land d. Fertilizer/seed
ZCGP
ZAMBIA CTO
VC
KENYA HSN
P
KENYALC
GP
LESO
THO PS
NP
ETHIO
PIA SCTP
MALAWI
MASAF P
WP
MALAWILC
GP
LESO
THO LE
AP
GHANA
Perc
ent
chan
ge fr
om b
asel
ine
–50
–25
0
50
25
100
75
125
150
175
Baseline mean Impact estimate
ZCGP
ZAMBIA CTO
VC
KENYA HSN
P
KENYALC
GP
LESO
THO PS
NP
ETHIO
PIA SCTP
MALAWI
MASAF P
WP
MALAWILC
GP
LESO
THO LE
AP
GHANA
Rate
of o
wne
rshi
p/an
yex
pend
itur
e (%
)
0
20
40
60
80
100
95% Confidence interval of program impact Program impact
95% Confidence interval of mean impact Mean impact
investments in large livestock may compromise their program eligibility (Covarrubias, Davis, and Winters 2012). In Niger, recipients of cash trans-fers had lasting increases in livestock assets (Stoeffler, Mills, and Premand 2016). Expenditures on durables (tools and other equipment for farms and businesses) exhibited a smaller, but still significant, improvement: a 10 per-cent increase relative to the baseline. Durables include investments in agri-cultural tools, as in Ethiopia’s Social Cash Transfer Pilot Program, Malawi’s SCTP, and Zambia’s Child Grant Program (Berhane et al. 2015; Boone et al. 2013; Seidenfeld, Handa, and Tembo 2013).
SOCIAL SAFETY NETS AND POVERTY REDUCTION, RESILIENCE, AND OPPORTUNITY 99
Resilience is partly captured through ownership of certain types of durable goods. Across programs, the defi nition of durables varies (see Ralston, Andrews, and Hsiao 2017 for details), but they tend to include expenditures for home improvements and sometimes productive tools for farming). We fi nd modest impacts, although in the case of SCTP in Malawi, the defi nition is any durable good. Th ere is additional evidence of social safety nets leading to increases in expenditures for home improvements specifi cally, such as on metal or plastic sheeting for roofs and walls in GiveDirectly in Kenya, the Lesotho Child Grants Program, and the CfW in Sierra Leone (Haushofer and Shapiro 2016; Pellerano et al. 2014; Rosas and Sabarwal 2016).
Two programs are associated with an expansion in the application of fertilizers or seeds (as measured by any expenditure on either), and only one program fi nds an increase in land ownership. Neither outcome is signifi cantly impacted on aver-age across the programs that report on them. Evidence for improved fertilizer and seed use comes from the PSNP in Ethiopia and the SCTP in Malawi, which may demonstrate a shift to higher-risk, higher-return agricultural practices. Th e Ethiopia fi ndings are important for an understanding of mediating factors because this intervention was coupled with an initiative to support household agricultural productivity, namely, the Household Asset Building Program. Only the Zambia Child Grant Program reports a substantial positive impact on outcomes in land ownership: benefi ciaries expanded the area of land they worked by 18 percent (34 percentage points relative to the baseline).
Another indicator of resilience is reduced reliance on child labor as a coping strategy (fi gure 2.4). Child labor can inhibit school attendance, thereby nega-tively aff ecting the future earnings potential of children. Overall, social safety net programs that report on this outcome fi nd no average eff ect. However, some of the programs specifi cally targeted at children show a reduction, including the Burkina Faso Take-Home Rations Program among girls, the Kenya OVC pro-gram, and the Lesotho Child Grants Program. Th ese programs are associated with strong communication strategies advocating for the rights and well-being of children, such as encouraging school attendance, which may help generate these results because, if children are in school, they also have less time to work. Results of programs in Latin America support these fi ndings. Meta-analyses focusing on the impacts of conditional cash transfer programs in Brazil, Colombia, Mexico, Nicaragua, and Uruguay show promising results, particu-larly among children with the highest returns to work, such as young adolescent boys (Kabeer, Piza, and Taylor 2012).
Another possible sign of resilience is reduced reliance on wage work. Poor rural households oft en sell more than the optimal amount of labor off their farms to obtain an immediate income source. In Malawi, this type of work is known as ganyu, is generally low-wage and casual, and may lead to poverty traps (Devereux 1997). Along with signifi cant reductions in such informal wage work associated with the SCTP in Malawi, wage work fell substantially among
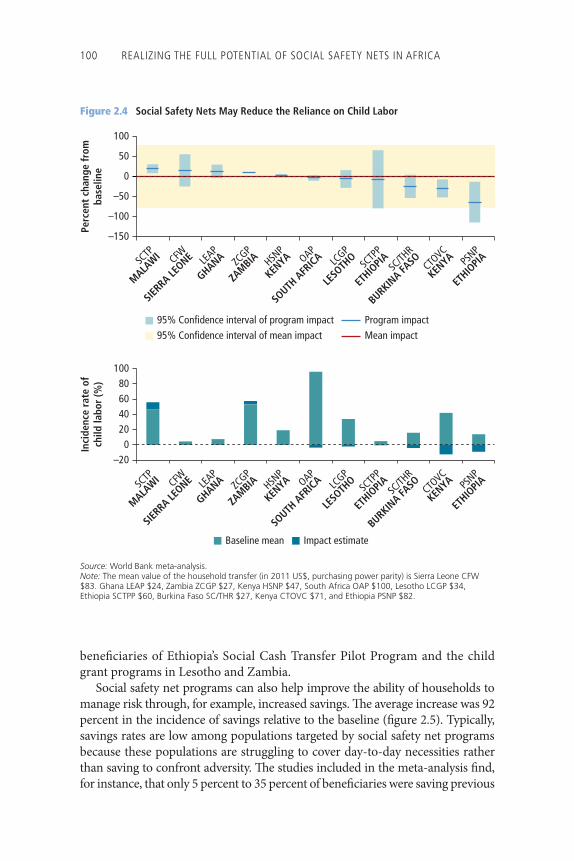
100 REALIZING THE FULL POTENTIAL OF SOCIAL SAFETY NETS IN AFRICA
benefi ciaries of Ethiopia’s Social Cash Transfer Pilot Program and the child grant programs in Lesotho and Zambia.
Social safety net programs can also help improve the ability of households to manage risk through, for example, increased savings. Th e average increase was 92 percent in the incidence of savings relative to the baseline (fi gure 2.5). Typically, savings rates are low among populations targeted by social safety net programs because these populations are struggling to cover day-to-day necessities rather than saving to confront adversity. Th e studies included in the meta-analysis fi nd, for instance, that only 5 percent to 35 percent of benefi ciaries were saving previous
Figure 2.4 Social Safety Nets May Reduce the Reliance on Child Labor
Source: World Bank meta-analysis.Note: The mean value of the household transfer (in 2011 US$, purchasing power parity) is Sierra Leone CFW $83. Ghana LEAP $24, Zambia ZCGP $27, Kenya HSNP $47, South Africa OAP $100, Lesotho LCGP $34, Ethiopia SCTPP $60, Burkina Faso SC/THR $27, Kenya CTOVC $71, and Ethiopia PSNP $82.
SCTP
MALAWI CFW
SIERRA LE
ONE LEAP
GHANA ZCGP
ZAMBIA HSN
P
KENYA OAP
SOUTH
AFR
ICA LCGP
LESO
THO
SCTP
P
ETHIO
PIA SC/TH
R
BURKINA FA
SO CTOVC
KENYA PS
NP
ETHIO
PIA
–150
–100
–50
0
50
100
Perc
ent
chan
ge fr
omba
selin
e
SCTP
MALAWI CFW
SIERRA LE
ONE LEAP
GHANA ZCGP
ZAMBIA HSN
P
KENYA OAP
SOUTH
AFR
ICA LCGP
LESO
THO
SCTP
P
ETHIO
PIA SC/TH
R
BURKINA FA
SO CTOVC
KENYA PS
NP
ETHIO
PIA
Baseline mean Impact estimate
–200
20406080
100
Inci
denc
e ra
te o
fch
ild la
bor
(%)
95% Confidence interval of program impact Program impact95% Confidence interval of mean impact Mean impact
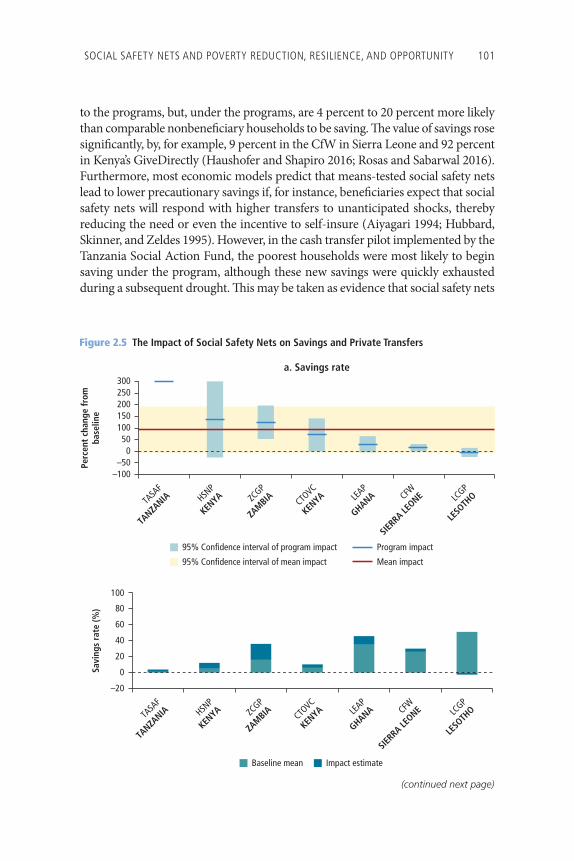
SOCIAL SAFETY NETS AND POVERTY REDUCTION, RESILIENCE, AND OPPORTUNITY 101
Figure 2.5 The Impact of Social Safety Nets on Savings and Private Transfers
TASA
F
TANZA
NIA HSNP
KENYA ZC
GP
ZAMBIA CTO
VC
KENYA LE
AP
GHANA CFW
SIERRA LE
ONE LCGP
LESO
THO
–100–50
050
100150200250300
Perc
ent
chan
ge fr
omba
selin
e
a. Savings rate
TASA
F
TANZA
NIA HSNP
KENYA ZC
GP
ZAMBIA CTO
VC
KENYA LE
AP
GHANA CFW
SIERRA LE
ONE LCGP
LESO
THO
Baseline mean Impact estimate
–20
0
20
40
60
80
100
Savi
ngs
rate
(%)
95% Confidence interval of program impact Program impact
95% Confidence interval of mean impact Mean impact
(continued next page)
to the programs, but, under the programs, are 4 percent to 20 percent more likely than comparable nonbenefi ciary households to be saving. Th e value of savings rose signifi cantly, by, for example, 9 percent in the CfW in Sierra Leone and 92 percent in Kenya’s GiveDirectly (Haushofer and Shapiro 2016; Rosas and Sabarwal 2016). Furthermore, most economic models predict that means-tested social safety nets lead to lower precautionary savings if, for instance, benefi ciaries expect that social safety nets will respond with higher transfers to unanticipated shocks, thereby reducing the need or even the incentive to self-insure (Aiyagari 1994; Hubbard, Skinner, and Zeldes 1995). However, in the cash transfer pilot implemented by the Tanzania Social Action Fund, the poorest households were most likely to begin saving under the program, although these new savings were quickly exhausted during a subsequent drought. Th is may be taken as evidence that social safety nets
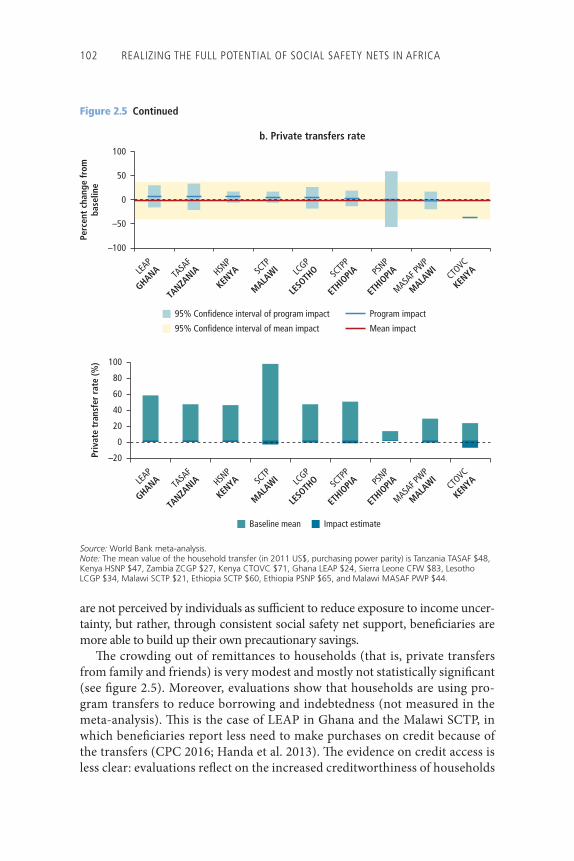
102 REALIZING THE FULL POTENTIAL OF SOCIAL SAFETY NETS IN AFRICA
Source: World Bank meta-analysis.Note: The mean value of the household transfer (in 2011 US$, purchasing power parity) is Tanzania TASAF $48, Kenya HSNP $47, Zambia ZCGP $27, Kenya CTOVC $71, Ghana LEAP $24, Sierra Leone CFW $83, Lesotho LCGP $34, Malawi SCTP $21, Ethiopia SCTP $60, Ethiopia PSNP $65, and Malawi MASAF PWP $44.
Figure 2.5 Continued
LEAP
GHANA TASA
F
TANZA
NIA HSNP
KENYA SC
TP
MALAWI LC
GP
LESO
THO SC
TPP
ETHIO
PIA PSNP
ETHIO
PIA
MASAF P
WP
MALAWI
CTOVC
KENYA
b. Private transfers rate
–100
–50
0
50
100
Perc
ent
chan
ge fr
omba
selin
e
LEAP
GHANA TASA
F
TANZA
NIA HSNP
KENYA SC
TP
MALAWI LC
GP
LESO
THO SC
TPP
ETHIO
PIA PSNP
ETHIO
PIA
MASAF P
WP
MALAWI
CTOVC
KENYA
–20
0
20
40
60
80
100
Priv
ate
tran
sfer
rat
e (%
)
Baseline mean Impact estimate
95% Confidence interval of program impact Program impact
95% Confidence interval of mean impact Mean impact
are not perceived by individuals as suffi cient to reduce exposure to income uncer-tainty, but rather, through consistent social safety net support, benefi ciaries are more able to build up their own precautionary savings.
Th e crowding out of remittances to households (that is, private transfers from family and friends) is very modest and mostly not statistically signifi cant (see fi gure 2.5). Moreover, evaluations show that households are using pro-gram transfers to reduce borrowing and indebtedness (not measured in the meta-analysis). Th is is the case of LEAP in Ghana and the Malawi SCTP, in which benefi ciaries report less need to make purchases on credit because of the transfers (CPC 2016; Handa et al. 2013). Th e evidence on credit access is less clear: evaluations refl ect on the increased creditworthiness of households
SOCIAL SAFETY NETS AND POVERTY REDUCTION, RESILIENCE, AND OPPORTUNITY 103
receiving transfers in, for instance, Ghana LEAP and Kenya HSNP, but there is little evidence that more credit has been forthcoming (Handa et al. 2013; Merttens et al. 2013). In the Ghana LEAP and the Zambia Child Grant Program, the social safety nets help benefi ciaries realign social networks and, in some cases, improve the bargaining power of women (Handa et al. 2013; Seidenfeld, Handa, and Tembo 2013).
Overall, the policy implication is that social safety nets may have a major impact in boosting savings for improved risk management, but they are not suffi cient for households to buff er completely against shocks independently. Nonetheless, social safety net programs are not signifi cantly crowding out pri-vate transfers and are not likely to impact adversely or substitute for other risk management strategies.
Increasing Opportunities through Social Safety Nets
Human capital development and productive inclusion are two important dimensions of the effort to foster opportunity. The dimension of human capital development involves the recognition that social safety nets have long been viewed as a tool for promoting investments in education and health care among children. Well-established conditional cash transfer pro-grams in Latin America, such as Bolsa Família in Brazil and Prospera in Mexico, have the core objective of enabling poor families in rural and urban communities to invest in the human capital of their children by improving outcomes in education, health, and nutrition (Fiszbein and Schady 2009). Compelling evidence documents the positive impacts of these programs, including their longer-term effects, which vary from positive to more mixed (Baez and Camacho 2011; Behrman, Parker, and Todd 2011; Gertler, Martinez, and Rubio-Codina 2012). The dimension of productive inclusion revolves around the effectiveness of social safety nets in promoting a sus-tained exit out of poverty. Such an exit may be fostered by engaging house-holds in more productive activities that lead to higher income trajectories. The previous section touched on this by considering the degree to which social safety nets encourage investments in productive assets. This section investigates whether social safety net programs have led to higher incomes and earning opportunities among beneficiaries.
Social Safety Nets Are Investments in EducationThe literature focuses extensively on the impacts of cash transfer programs on education, though largely outside Africa. Evidence on 19 conditional cash transfer programs in 15 developing countries, including one in Africa (Malawi), finds significant impacts on primary-school enrollment and
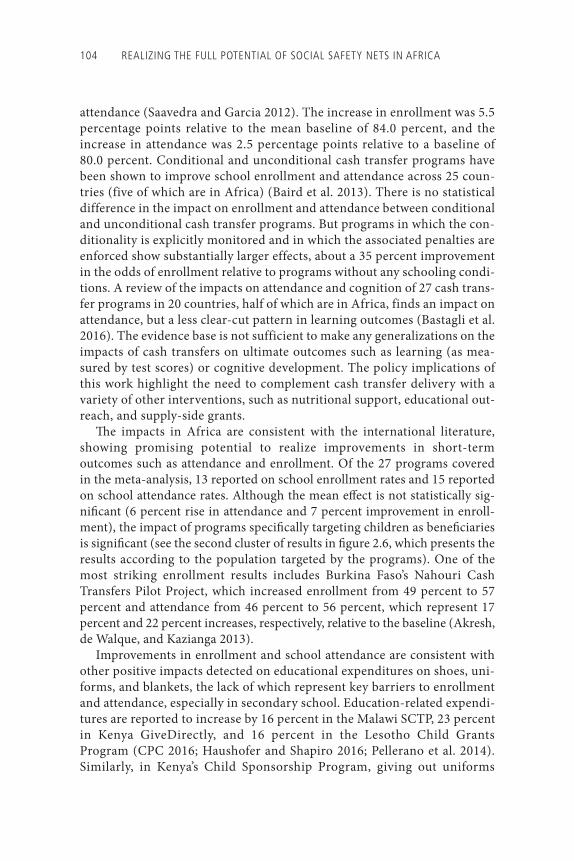
104 REALIZING THE FULL POTENTIAL OF SOCIAL SAFETY NETS IN AFRICA
attendance (Saavedra and Garcia 2012). The increase in enrollment was 5.5 percentage points relative to the mean baseline of 84.0 percent, and the increase in attendance was 2.5 percentage points relative to a baseline of 80.0 percent. Conditional and unconditional cash transfer programs have been shown to improve school enrollment and attendance across 25 coun-tries (five of which are in Africa) (Baird et al. 2013). There is no statistical difference in the impact on enrollment and attendance between conditional and unconditional cash transfer programs. But programs in which the con-ditionality is explicitly monitored and in which the associated penalties are enforced show substantially larger effects, about a 35 percent improvement in the odds of enrollment relative to programs without any schooling condi-tions. A review of the impacts on attendance and cognition of 27 cash trans-fer programs in 20 countries, half of which are in Africa, finds an impact on attendance, but a less clear-cut pattern in learning outcomes (Bastagli et al. 2016). The evidence base is not sufficient to make any generalizations on the impacts of cash transfers on ultimate outcomes such as learning (as mea-sured by test scores) or cognitive development. The policy implications of this work highlight the need to complement cash transfer delivery with a variety of other interventions, such as nutritional support, educational out-reach, and supply-side grants.
Th e impacts in Africa are consistent with the international literature, showing promising potential to realize improvements in short-term outcomes such as attendance and enrollment. Of the 27 programs covered in the meta-analysis, 13 reported on school enrollment rates and 15 reported on school attendance rates. Although the mean eff ect is not statistically sig-nifi cant (6 percent rise in attendance and 7 percent improvement in enroll-ment), the impact of programs specifi cally targeting children as benefi ciaries is signifi cant (see the second cluster of results in fi gure 2.6, which presents the results according to the population targeted by the programs). One of the most striking enrollment results includes Burkina Faso’s Nahouri Cash Transfers Pilot Project, which increased enrollment from 49 percent to 57 percent and attendance from 46 percent to 56 percent, which represent 17 percent and 22 percent increases, respectively, relative to the baseline (Akresh, de Walque, and Kazianga 2013).
Improvements in enrollment and school attendance are consistent with other positive impacts detected on educational expenditures on shoes, uni-forms, and blankets, the lack of which represent key barriers to enrollment and attendance, especially in secondary school. Education-related expendi-tures are reported to increase by 16 percent in the Malawi SCTP, 23 percent in Kenya GiveDirectly, and 16 percent in the Lesotho Child Grants Program (CPC 2016; Haushofer and Shapiro 2016; Pellerano et al. 2014). Similarly, in Kenya’s Child Sponsorship Program, giving out uniforms
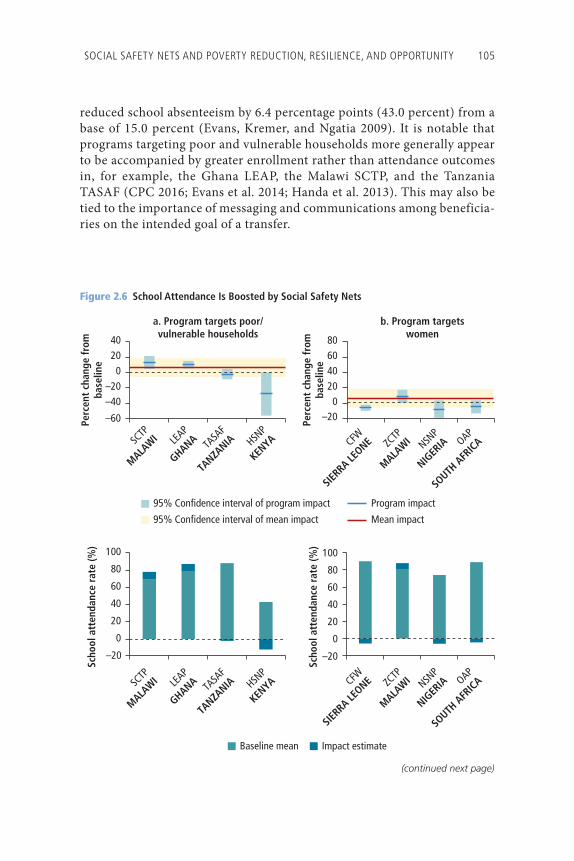
SOCIAL SAFETY NETS AND POVERTY REDUCTION, RESILIENCE, AND OPPORTUNITY 105
reduced school absenteeism by 6.4 percentage points (43.0 percent) from a base of 15.0 percent (Evans, Kremer, and Ngatia 2009). It is notable that programs targeting poor and vulnerable households more generally appear to be accompanied by greater enrollment rather than attendance outcomes in, for example, the Ghana LEAP, the Malawi SCTP, and the Tanzania TASAF (CPC 2016; Evans et al. 2014; Handa et al. 2013). This may also be tied to the importance of messaging and communications among beneficia-ries on the intended goal of a transfer.
Perc
ent
chan
ge fr
omba
selin
e
–60
–40–20
02040
a. Program targets poor/vulnerable households
SCTP
MALAWI LE
AP
GHANA TASA
F
TANZA
NIA HSNP
KENYA
–20
0
20
40
60
80
100
SCTP
MALAWI LE
AP
GHANA TASA
F
TANZA
NIA HSNP
KENYA
Scho
ol a
tten
danc
e ra
te (%
)
Baseline mean Impact estimate
95% Confidence interval of program impact Program impact
95% Confidence interval of mean impact Mean impact
b. Program targetswomen
CFW
SIERRA LE
ONE ZCTP
MALAWI NSN
P
NIGER
IA OAP
SOUTH
AFR
ICA
–200
20406080
Perc
ent
chan
ge fr
omba
selin
e
CFW
SIERRA LE
ONE ZCTP
MALAWI NSN
P
NIGER
IA OAP
SOUTH
AFR
ICA
–20
0
20
40
60
80
100
Scho
ol a
tten
danc
e ra
te (%
)
Figure 2.6 School Attendance Is Boosted by Social Safety Nets
(continued next page)
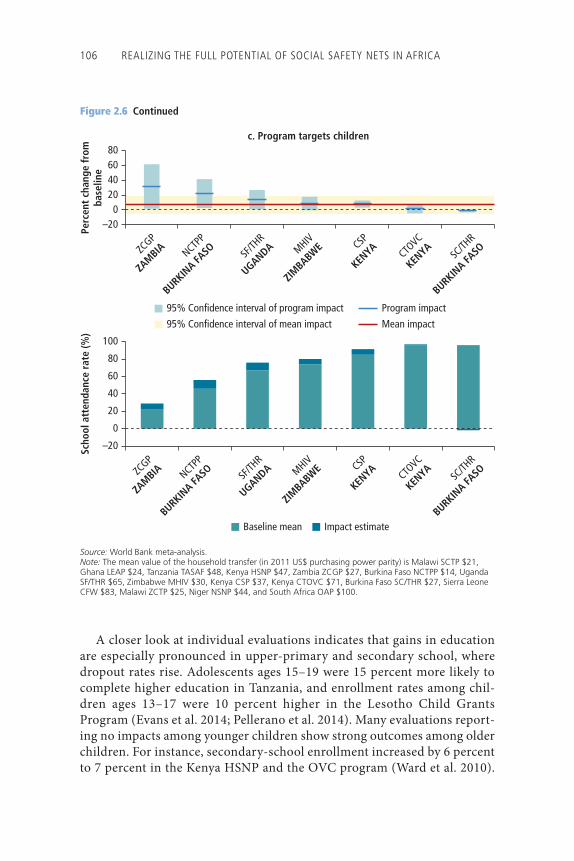
106 REALIZING THE FULL POTENTIAL OF SOCIAL SAFETY NETS IN AFRICA
Source: World Bank meta-analysis.Note: The mean value of the household transfer (in 2011 US$ purchasing power parity) is Malawi SCTP $21, Ghana LEAP $24, Tanzania TASAF $48, Kenya HSNP $47, Zambia ZCGP $27, Burkina Faso NCTPP $14, Uganda SF/THR $65, Zimbabwe MHIV $30, Kenya CSP $37, Kenya CTOVC $71, Burkina Faso SC/THR $27, Sierra Leone CFW $83, Malawi ZCTP $25, Niger NSNP $44, and South Africa OAP $100.
c. Program targets children
ZCGP
ZAMBIA NCTP
P
BURKINA FA
SO SF/TH
R
UGANDA MHIV
ZIMBABWE CSP
KENYA
CTOVC
KENYA
SC/TH
R
BURKINA FA
SO
–200
20406080
Perc
ent
chan
ge fr
omba
selin
e
Baseline mean Impact estimate
ZCGP
ZAMBIA NCTP
P
BURKINA FA
SO SF/TH
R
UGANDA MHIV
ZIMBABWE CSP
KENYA
CTOVC
KENYA
SC/TH
R
BURKINA FA
SO
–20
0
20
40
60
80
100
Scho
ol a
tten
danc
e ra
te (%
)
95% Confidence interval of program impact Program impact
95% Confidence interval of mean impact Mean impact
Figure 2.6 Continued
A closer look at individual evaluations indicates that gains in education are especially pronounced in upper-primary and secondary school, where dropout rates rise. Adolescents ages 15–19 were 15 percent more likely to complete higher education in Tanzania, and enrollment rates among chil-dren ages 13–17 were 10 percent higher in the Lesotho Child Grants Program (Evans et al. 2014; Pellerano et al. 2014). Many evaluations report-ing no impacts among younger children show strong outcomes among older children. For instance, secondary-school enrollment increased by 6 percent to 7 percent in the Kenya HSNP and the OVC program (Ward et al. 2010).
SOCIAL SAFETY NETS AND POVERTY REDUCTION, RESILIENCE, AND OPPORTUNITY 107
In South Africa, adolescents in households currently receiving the Child Support Grant among younger children in the household were absent from school 2.2 fewer days than adolescents in households receiving no grants (DSD, SASSA, and UNICEF 2012). Nonetheless, poor quality and availabil-ity of schools and high financial barriers are considerable constraints on the progression through secondary school, an issue noted even in countries that have achieved positive impacts, such as the Lesotho Child Grants Program (DSD, SASSA, and UNICEF 2012).
Two widely cited evaluations look at the specifi c role of school feeding by comparing diff erent modalities of at-school meals versus take-home rations, but do not fi nd consistent eff ects. In the two main interventions of food for educa-tion programs in Uganda, neither intervention had a signifi cant impact on pri-mary enrollments, but both programs showed impacts on attendance and on upper-primary school (grades 6 and 7). Th e take-home rations intervention showed substantially larger impacts than the in-school feeding intervention (Alderman, Gilligan, and Lehrer 2008). Th e latter, however, exhibited an impact in cognitive gains among preschool children. In Burkina Faso, the school can-teens and take-home rations interventions both raised enrollments among girls by 5 percent, but had variable impacts on attendance depending on the labor constraints within families (Kazianga, de Walque, and Alderman 2009). Absenteeism decreased only among families with a relatively large child labor supply. In addition, take-home rations enhanced anthropometric measures among the younger siblings of benefi ciaries (those ages 1–5). Beyond these evaluations, the literature on the impacts of in-kind transfers on education in Africa is thin (for a discussion, including the mixed global evidence see Gentilini 2014).
Globally and within Africa, the evidence suggests that conditions can strengthen the educational impacts of social safety net programs, but that unconditional programs are also eff ective at improving school attendance and enrollment. Programs in which the conditionality is explicitly monitored and enforced have larger impacts than programs without any schooling conditions, but programs that do not monitor and enforce conditionality perform comparably with those with no conditions (Baird et al. 2013). Within the meta- analysis, 4 programs have conditions associated with schooling; 8 have no conditions; and 3 have both conditional and unconditional components.5 Conditions associated with schooling seem to result in larger impacts. Of the programs with conditions on schooling, 5 of 7 report signifi cant, impacts on attendance, and 3 of 6 report signifi cant impacts on enrollment. Of the pro-grams without schooling conditions, 7 of 11 report signifi cant impacts on atten-dance, and 3 of 9 report signifi cant impacts on enrollment. In the Malawi Zomba Cash Transfer Program, the strongly enforced conditional cash transfer arm achieved a large gain in enrollment and a modest, yet significant, advantage
108 REALIZING THE FULL POTENTIAL OF SOCIAL SAFETY NETS IN AFRICA
in learning. Th e Burkina Faso Nahouri Cash Transfers Pilot Project found that conditional cash transfers had a greater impact than unconditional cash trans-fers in targeting marginal children not already enrolled in school or less likely to enroll and a greater impact on attendance among all children (Akresh, de Walque, and Kazianga 2013; Baird, McIntosh, and Özler 2011). Meanwhile, Zimbabwe’s Manicaland HIV/STD Prevention Program found similar positive signifi cant impacts on school attendance associated with both unconditional and conditional cash transfers.
However, even if they might yield larger impacts, conditions may not always be appropriate in programs in Africa, particularly if access to education is limited or if monitoring and enforcement would be ineffi ciently expensive. In these situ-ations, programs with implicit conditionality may be more suitable (Pellerano et al. 2014; Schüring 2010). Th ere is evidence that perceptions of conditions and encouraging service use and certain behaviors can infl uence program outcomes (Benhassine et al. 2013; Schady and Araujo 2006; for more mixed results from behavior change in Nigeria, see Premand, Barry, and Smitz 2016 and Barry, Maidoka, and Premand 2017). Evidence from the programs covered in this review appear to strongly support this conclusion. Of 17 programs covered in the meta-analysis, 3 have such implicit (unmonitored/unenforced) conditions related to child schooling that are associated with forceful messaging and social marketing: Lesotho’s Child Grants Program, Malawi’s SCTP, and Zambia’s Child Grant Program. Th ese programs increased enrollment or attendance. Unlike the pro-grams with enforced conditions, each of these programs has advanced toward cash transfers that have been brought to scale nationwide.
Evidence of Health Impacts of Social Safety Nets Is LimitedTh e evidence on health outcomes in Africa is more limited. Th e meta-analysis found nine studies that reported on health care expenditures, but the mean impact on monthly spending was not signifi cant (CPC 2016; Evans et al. 2014; Haushofer and Shapiro 2016; Merttens et al. 2013; Pellerano et al. 2014; Premand and del Ninno 2016; Rosas and Sabarwal 2016; Seidenfeld, Handa, and Tembo 2013; Ward et al. 2010). Studies fi nding positive impacts include those examining Kenya’s HSNP and Zambia’s Child Grant Program. In Kenya’s HSNP, households spent more on health per capita without negative impacts on food consumption or asset retention. In Zambia, approximately 5 percent of transfers were related to health and hygiene, and there is some evidence of impact on young children through improved feeding and reductions in wast-ing. Th is evidence suggests that transfers have the potential to improve health outcomes, consistent with the impacts on food security and dietary diversity. However, the meta-analysis shows that the results so far in health expendi-tures are not statistically signifi cant, and, where positive impacts are obtained, determining why is diffi cult.
SOCIAL SAFETY NETS AND POVERTY REDUCTION, RESILIENCE, AND OPPORTUNITY 109
Th e impact of social safety nets on early childhood development is an emerging area of focus in programs and the accompanying evaluations. Th e results to date have been mixed, however. In Kenya’s HSNP and OVC pro-grams, there is little evidence on child nutritional status, and, in both cases, the outcomes are presented with considerable caution. Anthropometric status refl ects multiple complex infl uences and take time to appear, while other out-comes occur more quickly. Th e quality of the anthropometric data gathered—which are widely acknowledged to be challenging, time-varying external factors—and the small sample sizes mean that signifi cant eff ects are diffi cult to detect (Merttens et al. 2013). Several impact evaluations have not involved the collection of anthropometric information, for example, Tanzania’s TASAF (Pellerano et al. 2014).
Despite the challenges and diffi culties, recent evaluations and the broader literature show some promising early childhood outcomes. Th e potential to realize improved childhood outcomes is clear in studies of cash transfer pro-grams in Latin America. Evidence on Nicaragua’s Red de Protección Social and Atención a Crisis programs—a conditional cash transfer program—shows improved nutrition and health outcomes for young children (Barham, Macours, and Maluccio 2013; Macours, Schady, and Vakis 2012). While the evidence in Africa is nascent on this theme, some countries point to potential impacts. A long-term evaluation of South Africa’s Child Support Grant Program shows that the grant raises the likelihood that the growth of children in recipient house-holds will be monitored and that height-for-age scores will improve (DSD, SASSA, and UNICEF 2012). A recent impact evaluation of the Niger Safety Net Project shows that accompanying measures can lead to changes in nutrition practices related to exclusive breastfeeding and complementary feeding, which contribute to improve food security among children (Premand and del Ninno 2016).
Social Safety Nets Foster Productive InclusionFocusing on social safety nets and productive inclusion addresses the critical issue of graduating benefi ciaries from poverty. Specifi cally, it responds to the debate about whether these programs result in investments in productive activities and whether they create work disincentives among benefi ciaries. Several infl uential studies have recently begun to key on the debate. Th us, Blattman, Fiala, and Martinez (2013) conclude that, in Uganda, cash grants targeted on groups of youth can lead to enhanced employment opportunities. Banerjee et al. (2015) fi nd that a multifaceted approach aimed at raising the incomes of the poor can achieve sustainable outcomes cost eff ectively. Such an approach, adopted in several countries, provides a productive asset grant (oft en livestock), training and support, life skills coaching, temporary cash support for consumption, and, typically, access to savings accounts and health
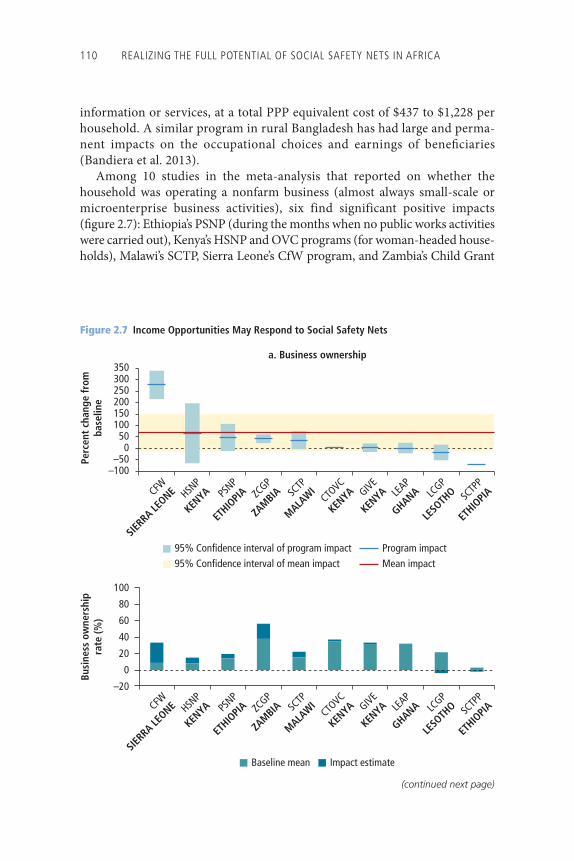
110 REALIZING THE FULL POTENTIAL OF SOCIAL SAFETY NETS IN AFRICA
information or services, at a total PPP equivalent cost of $437 to $1,228 per household. A similar program in rural Bangladesh has had large and perma-nent impacts on the occupational choices and earnings of benefi ciaries (Bandiera et al. 2013).
Among 10 studies in the meta-analysis that reported on whether the household was operating a nonfarm business (almost always small-scale or microenterprise business activities), six find significant positive impacts ( fi gure 2.7): Ethiopia’s PSNP (during the months when no public works activities were carried out), Kenya’s HSNP and OVC programs (for woman-headed house-holds), Malawi’s SCTP, Sierra Leone’s CfW program, and Zambia’s Child Grant
Figure 2.7 Income Opportunities May Respond to Social Safety Nets
Perc
ent
chan
ge fr
omba
selin
e
a. Business ownership
–100
0
100
250
–50
350300
200150
50
CFW
SIERRA LE
ONE HSNP
KENYA PS
NP
ETHIO
PIA ZCGP
ZAMBIA SC
TP
MALAWI
CTOVC
KENYA GIVE
KENYA LE
AP
GHANA LCGP
LESO
THO SC
TPP
ETHIO
PIA
–20
0
20
40
60
80
100
Busi
ness
ow
ners
hip
rate
(%)
Baseline mean Impact estimate
CFW
SIERRA LE
ONE HSNP
KENYA PS
NP
ETHIO
PIA ZCGP
ZAMBIA SC
TP
MALAWI
CTOVC
KENYA GIVE
KENYA LE
AP
GHANA LCGP
LESO
THO SC
TPP
ETHIO
PIA
95% Confidence interval of program impact Program impact95% Confidence interval of mean impact Mean impact
(continued next page)
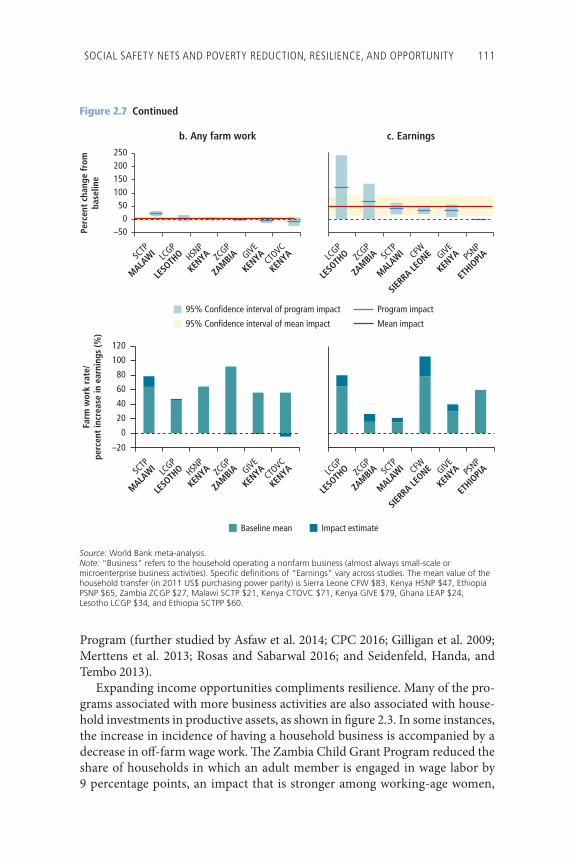
SOCIAL SAFETY NETS AND POVERTY REDUCTION, RESILIENCE, AND OPPORTUNITY 111
Program (further studied by Asfaw et al. 2014; CPC 2016; Gilligan et al. 2009; Merttens et al. 2013; Rosas and Sabarwal 2016; and Seidenfeld, Handa, and Tembo 2013).
Expanding income opportunities compliments resilience. Many of the pro-grams associated with more business activities are also associated with house-hold investments in productive assets, as shown in fi gure 2.3. In some instances, the increase in incidence of having a household business is accompanied by a decrease in off -farm wage work. Th e Zambia Child Grant Program reduced the share of households in which an adult member is engaged in wage labor by 9 percentage points, an impact that is stronger among working-age women,
Figure 2.7 Continued
b. Any farm work c. Earnings
0
100
250
Perc
ent
chan
ge fr
omba
selin
e
–50
200150
50
SCTP
MALAWI LC
GP
LESO
THO HSN
P
KENYA ZC
GP
ZAMBIA GIVE
KENYA
CTOVC
KENYA LC
GP
LESO
THO ZC
GP
ZAMBIA SC
TP
MALAWI CFW
SIERRA LE
ONE GIVE
KENYA PS
NP
ETHIO
PIA
SCTP
MALAWI LC
GP
LESO
THO HSN
P
KENYA ZC
GP
ZAMBIA GIVE
KENYA
CTOVC
KENYA LC
GP
LESO
THO ZC
GP
ZAMBIA SC
TP
MALAWI CFW
SIERRA LE
ONE GIVE
KENYA PS
NP
ETHIO
PIA
–20
0
20
40
60
80
100
120
Farm
wor
k ra
te/
perc
ent
incr
ease
in e
arni
ngs
(%)
Baseline mean Impact estimate
95% Confidence interval of program impact Program impact
95% Confidence interval of mean impact Mean impact
Source: World Bank meta-analysis.Note: “Business” refers to the household operating a nonfarm business (almost always small-scale or microenterprise business activities). Specific definitions of “Earnings” vary across studies. The mean value of the household transfer (in 2011 US$ purchasing power parity) is Sierra Leone CFW $83, Kenya HSNP $47, Ethiopia PSNP $65, Zambia ZCGP $27, Malawi SCTP $21, Kenya CTOVC $71, Kenya GIVE $79, Ghana LEAP $24, Lesotho LCGP $34, and Ethiopia SCTPP $60.
112 REALIZING THE FULL POTENTIAL OF SOCIAL SAFETY NETS IN AFRICA
while the share of benefi ciary households operating an enterprise increased by 17 percentage points (Seidenfeld, Handa, and Tembo 2013). Another resilience-related fi nding is that, under the Old-Age Pension scheme in South Africa, pension-recipient households were more likely to include prime-age adult members who had migrated from the household and were working (Ardington, Case, and Hosegood 2009). Social safety nets have been shown in some pro-grams to facilitate out-migration, in the Sierra Leone CfW and in the Concern International program in the Democratic Republic of Congo, that may generate important new sources of income for households in the form of remittances (Aker 2013; Rosas and Sabarwal 2016).
Turing to work on household farms, these programs generally do not increase or decrease the likelihood of working on the household farm ( fi gure 2.7b). Th e one exception is the SCTP in Malawi, which raised the prob-ability of working on the farm. Th is is not to say that these programs do not increase the intensity of farming, as shown by the increase in inputs resulting from some programs (in fi gure 2.3). Th ese programs do not create dependency in terms of benefi ciaries stopping their work activities once they get social safety net benefi ts.
Finally, the meta-analysis examines the impact of these programs on household earnings, with the caveat that the specifi c defi nition of earnings (in terms of what it covers) varies across studies (see details in Ralston, Andrews, and Hsiao 2017). Household income earnings increase as a result of program participation. Th is refl ects the combination of an increase in households hav-ing a business as well as greater farm productivity or participation. Among the six studies with an earnings outcome, the meta-analysis fi nds a signifi cant positive impact, with a 51 percent rise in monthly earnings. Th e Lesotho Child Grants Program found higher earnings consistent with increased use of pur-chased seeds and fertilizers reported earlier. Increases in agricultural harvest yields and the value of sales were found in the Ethiopia Social Cash Transfer Pilot Program, the Malawi SCTP, and the Zambia Child Grant Program (Berhane et al. 2015; CPC 2016; Seidenfeld, Handa, and Tembo 2013).
Bringing Social Safety Nets to Scale
At the time of their evaluation, most of the programs captured in the review were operating at a scale that is too small to cover all poor households in a population. A logical next question is therefore focused on the impacts that might be realized if the programs were brought to scale to cover all poor house-holds. From a general equilibrium perspective, bringing programs to scale would not only reduce poverty but might also produce economy-wide impacts (box 2.2).
SOCIAL SAFETY NETS AND POVERTY REDUCTION, RESILIENCE, AND OPPORTUNITY 113
BOX 2 .2
Measuring Spillover and Feedback Effects: The Ghana Case StudyIf they are brought to scale, social safety nets have the potential to affect the overall macroeconomy. The relevant spillover effects have been explored through a comput-able general equilibrium model. Taking Ghana as a case study, the impact of expanding LEAP to cover all extremely poor households in the country (as defi ned by the national extreme poverty line)—about 400,000 rural and 43,000 urban households— is mod-eled with the generous assumption of perfect targeting.a The LEAP transfers vary by household size and represent 12 percent of the extreme poverty line or 36 percent of mean consumption among the extremely poor.b Administrative costs are assumed to be add 25 percent to transfer costs. The total cost of the increase is thus 0.6 percent of the 2013 gross domestic product. The model examines outcomes when the program is funded through either a foreign aid grant or domestic tax revenues.
Expanding at current transfer values would reduce the extreme poverty rate in Ghana from 8.2 percent to an estimated 4.2 percent. Agriculture and manufacturing would experience a rise in demand for domestically produced staples and fi nished products as a result of the LEAP being brought to scale. This would lead to modest output increases in these sectors. This is also likely to generate higher incomes among benefi ciaries and other rural households dependent on agriculture, which is labor intensive and is a substantial employer, especially among the poorest households. However, given that the program is small relative to the size of the economy, the percent changes in total consumption or output would be small from the perspective of the national economy. Likewise, the employment expansion would be small.
The source of program fi nancing—grant aid (externally fi nanced) or taxes—has a notable effect on program impacts, including on income distribution and the exchange rate. The source of funding has some effect on the distributional impacts of the program. If the program is externally fi nanced, nonbenefi ciary households would be expected to experience modest consumption gains, on the order of 0.1 percent to 0.2 percent, through the spillover effects of the greater demand and the positive impact of real exchange rate appreciation. In the internally fi nanced program simulations, there are modest consumption losses for nonbenefi ciaries, on the order of 0.2 percent to 1.0 percent, refl ecting the net redistribution effect of tax-funded programs that, in this context, outweighs any consumption spillover effects. The wealthiest households in the economy would experience the largest consumption losses. In total, this leads to about a 0.8 percent rise in private consumption in the externally fi nanced scenario and a 0.1 percent decline in the internally fi nanced scenario. However, there are other implications to consider in comparing these two fi nancing scenarios. For example, if the program is fi nanced through foreign aid, there would be an infl ux of foreign currency into the country, which would lead to real exchange rate appreciation, and this would have a negative impact on exports, namely, the cocoa and mining sectors, which would experience respective projected output declines of 1.5 percent and
(continued next page)
114 REALIZING THE FULL POTENTIAL OF SOCIAL SAFETY NETS IN AFRICA
Th e partial equilibrium impacts of expanding programs are explored through simulations for three countries—Ghana, Liberia, and Niger—based on data available from household surveys, alongside the meta-analysis results (see annex 2C). Th ese countries off er contrasting starting points in terms of social safety net coverage and show diversity in size, the sources of fragility, livelihood vulnerability, sectoral composition, and level of economic develop-ment.6 To ensure comparability, the simulations have been conducted based on assumed monthly transfers to households of $50 (at 2011 PPP prices), equiva-lent to the median amount transferred in programs included in the meta-anal-ysis. Recognizing that perfect targeting may not be achieved, the simulations assume perfect targeting, imperfect targeting (60 percent inclusion accuracy), and no targeting, whereby all households have an equal chance of being covered regardless of their poverty level.
Even relatively modest transfers would have a sizable impact on con-sumption. If transfers were perfectly targeted, consumption among the extremely poor would increase in the range of 12 percent to 17 percent. Under imperfect targeting, the consumption gains would be 7 percent to 10 percent. With no targeting, the gains would be between 0.0 percent and 2.7 percent.
Th ese consumption gains would generate a decline in extreme poverty rates by as much as 40 percent (fi gure 2.8). Th e most substantial impacts on the extreme poverty rate would be realized with perfect targeting: from 8.2 percent to 6.7 percent in Ghana, from 18.2 to 11.6 percent in Liberia, and from 17.0 percent to 12.3 percent in Niger. Th e extreme poverty gap—the mean relative distance of extremely poor households to the extreme poverty line—would fall from 2.2 percent to 1.7 percent in Ghana, from 4.2 percent to
Box 2.2 (continued)
0.4 percent, with labor moving to other, expanding sectors and the combination of less exports and more imports leading to higher consumption at home. These effects would not arise in the tax fi nancing scenario.
Additional aggregate output and consumption gains are possible if the social safety net programs are coupled with complementary sectorwide investment projects. Under the complementary scenarios, aggregate output would expand more, reaching around 0.1 percent of gross domestic product.
Source: Levy and Lofgren 2017; annex 2C.a. This leads to an overestimation of the poverty reduction impact because perfect targeting has not
been achieved.b. The LEAP transfer is approximately twice the transfer explored in the partial equilibrium simulations.
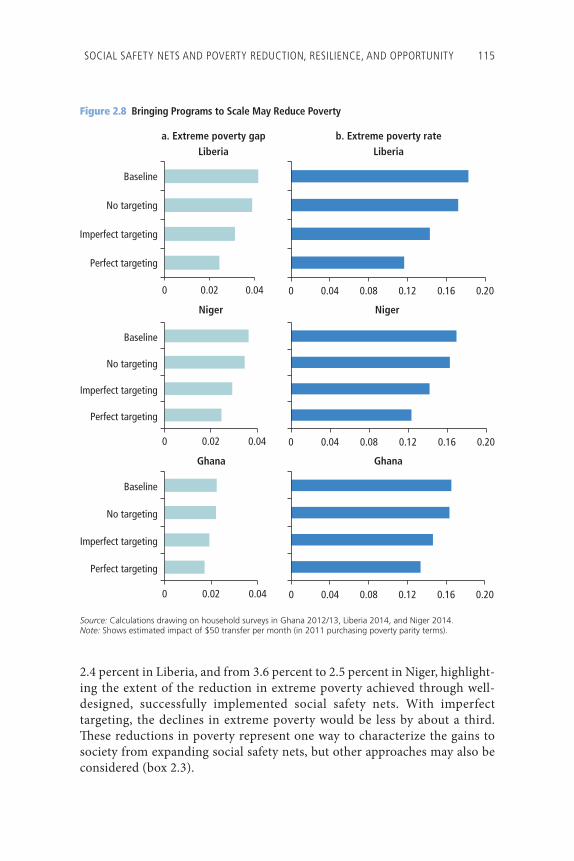
SOCIAL SAFETY NETS AND POVERTY REDUCTION, RESILIENCE, AND OPPORTUNITY 115
2.4 percent in Liberia, and from 3.6 percent to 2.5 percent in Niger, highlight-ing the extent of the reduction in extreme poverty achieved through well-designed, successfully implemented social safety nets. With imperfect targeting, the declines in extreme poverty would be less by about a third. Th ese reductions in poverty represent one way to characterize the gains to society from expanding social safety nets, but other approaches may also be considered (box 2.3).
Figure 2.8 Bringing Programs to Scale May Reduce Poverty
0 0.02 0.04
Perfect targeting
Imperfect targeting
No targeting
Baseline
Liberiaa. Extreme poverty gap
Niger
0 0.02 0.04
Perfect targeting
Imperfect targeting
No targeting
Baseline
Ghana
0 0.02 0.04
Perfect targeting
Imperfect targeting
No targeting
Baseline
0 0.04 0.08 0.12 0.16 0.20
Liberiab. Extreme poverty rate
0.04 0.08 0.12 0.160 0.20
Niger
0.04 0.08 0.12 0.160 0.20
Ghana
Source: Calculations drawing on household surveys in Ghana 2012/13, Liberia 2014, and Niger 2014.Note: Shows estimated impact of $50 transfer per month (in 2011 purchasing poverty parity terms).
116 REALIZING THE FULL POTENTIAL OF SOCIAL SAFETY NETS IN AFRICA
Agriculture is prevalent in the livelihoods of the extremely poor, and many of the poor already own agricultural assets. Assuming eff ective targeting, simula-tions fi nd that programs could expand the ownership of mid- and large-size quantities of livestock among the extremely poor to 51 percent–62 percent in Ghana and to 22 percent–28 percent in Liberia (table 2.1). Similarly, poultry own-ership, oft en the fi rst type of livestock acquired by the extremely poor, would increase to 57 percent–69 percent in Ghana and to 53 percent–67 percent in Liberia. Likewise, well-targeted programs may raise land ownership to 89 percent–92 percent in Ghana and to 100 percent in Niger.
Although social safety net programs are important in helping younger chil-dren living in extremely poor households catch up in schooling, the initial
BOX 2 .3
How Does Society Gain When a Poor Household Gains?An underlying premise of studies on the impact of the provision of support to poor households is that society also gains if poor households experience welfare gains. This is consistent with the assignment of greater weight to the incomes of the poor over the incomes of the wealthy, which is an altruistic approach as well as a utilitarian approach: the notion that the value of an extra dollar of income is relatively higher for a poor household than for a wealthy household (Chenery et al. 1974). A third approach models the trade-off between more or fewer social safety nets for the poor based on assumptions about the extent to which people have an aversion to inequal-ity (Eden 2017). This aversion may arise because people worry about the downside risk of their own future income status—they want to know a program exists in the event they become poor themselves—or because they value less inequality for other personal reasons. Incorporating an inequality risk aversion approach is another way to assess the social welfare gains of social safety nets. It incorporates the administra-tive costs and other economic costs of programs, such as the distortionary effects of taxation (including labor-supply effects) if programs are fi nanced through addi-tional taxation.
Under even highly conservative assumptions, there are social welfare gains from social safety nets that are fi nanced through a uniform increase in taxes on labor incomes (Eden 2017). A greater degree of targeting enhances the estimates of this gain in social welfare. This research is extended to compare these gains with the gains one might obtain through alternative government spending (such as building a road). Here, the evidence is more mixed and sensitive to the assumed parameter values. The optimality of diverting funds from government investment projects to redistributive programs such as social safety nets depends on the rate of return to other government investments, the administrative cost of transfers, the elasticity of labor supply to taxation, and the social aversion to inequality.
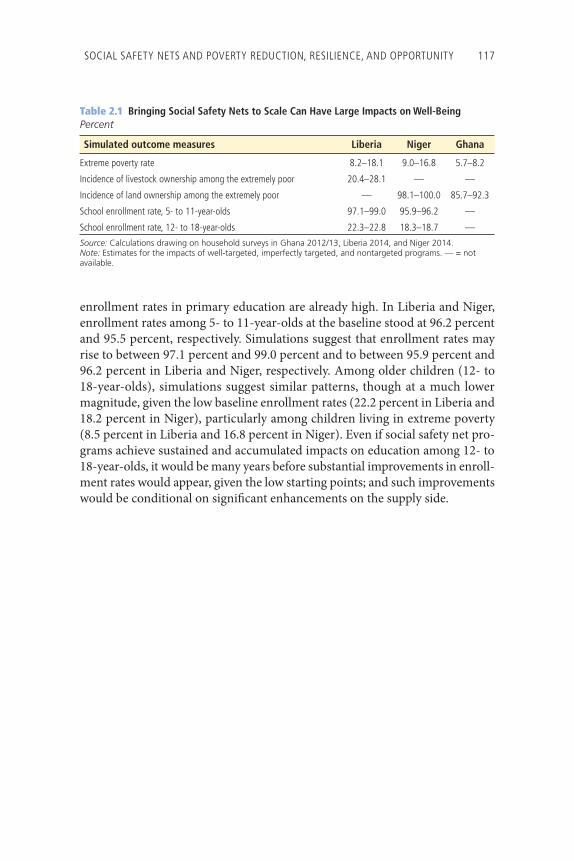
SOCIAL SAFETY NETS AND POVERTY REDUCTION, RESILIENCE, AND OPPORTUNITY 117
Table 2.1 Bringing Social Safety Nets to Scale Can Have Large Impacts on Well-BeingPercent
Simulated outcome measures Liberia Niger Ghana
Extreme poverty rate 8.2–18.1 9.0–16.8 5.7–8.2
Incidence of livestock ownership among the extremely poor 20.4–28.1 — —
Incidence of land ownership among the extremely poor — 98.1–100.0 85.7–92.3
School enrollment rate, 5- to 11-year-olds 97.1–99.0 95.9–96.2 —
School enrollment rate, 12- to 18-year-olds 22.3–22.8 18.3–18.7 —
Source: Calculations drawing on household surveys in Ghana 2012/13, Liberia 2014, and Niger 2014.Note: Estimates for the impacts of well-targeted, imperfectly targeted, and nontargeted programs. — = not available.
enrollment rates in primary education are already high. In Liberia and Niger, enrollment rates among 5- to 11-year-olds at the baseline stood at 96.2 percent and 95.5 percent, respectively. Simulations suggest that enrollment rates may rise to between 97.1 percent and 99.0 percent and to between 95.9 percent and 96.2 percent in Liberia and Niger, respectively. Among older children (12- to 18-year-olds), simulations suggest similar patterns, though at a much lower magnitude, given the low baseline enrollment rates (22.2 percent in Liberia and 18.2 percent in Niger), particularly among children living in extreme poverty (8.5 percent in Liberia and 16.8 percent in Niger). Even if social safety net pro-grams achieve sustained and accumulated impacts on education among 12- to 18-year-olds, it would be many years before substantial improvements in enroll-ment rates would appear, given the low starting points; and such improvements would be conditional on signifi cant enhancements on the supply side.
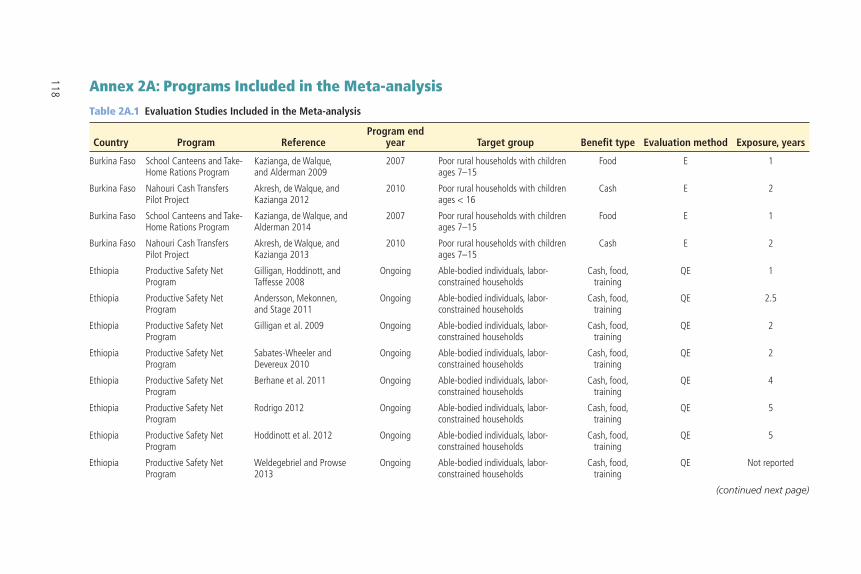
118
Table 2A.1 Evaluation Studies Included in the Meta-analysis
Country Program ReferenceProgram end
year Target group Benefi t type Evaluation method Exposure, years
Burkina Faso School Canteens and Take-Home Rations Program
Kazianga, de Walque, and Alderman 2009
2007 Poor rural households with children ages 7–15
Food E 1
Burkina Faso Nahouri Cash Transfers Pilot Project
Akresh, de Walque, and Kazianga 2012
2010 Poor rural households with children ages < 16
Cash E 2
Burkina Faso School Canteens and Take-Home Rations Program
Kazianga, de Walque, and Alderman 2014
2007 Poor rural households with children ages 7–15
Food E 1
Burkina Faso Nahouri Cash Transfers Pilot Project
Akresh, de Walque, and Kazianga 2013
2010 Poor rural households with children ages 7–15
Cash E 2
Ethiopia Productive Safety Net Program
Gilligan, Hoddinott, and Taffesse 2008
Ongoing Able-bodied individuals, labor-constrained households
Cash, food, training
QE 1
Ethiopia Productive Safety Net Program
Andersson, Mekonnen, and Stage 2011
Ongoing Able-bodied individuals, labor-constrained households
Cash, food, training
QE 2.5
Ethiopia Productive Safety Net Program
Gilligan et al. 2009 Ongoing Able-bodied individuals, labor-constrained households
Cash, food, training
QE 2
Ethiopia Productive Safety Net Program
Sabates-Wheeler and Devereux 2010
Ongoing Able-bodied individuals, labor-constrained households
Cash, food, training
QE 2
Ethiopia Productive Safety Net Program
Berhane et al. 2011 Ongoing Able-bodied individuals, labor-constrained households
Cash, food, training
QE 4
Ethiopia Productive Safety Net Program
Rodrigo 2012 Ongoing Able-bodied individuals, labor-constrained households
Cash, food, training
QE 5
Ethiopia Productive Safety Net Program
Hoddinott et al. 2012 Ongoing Able-bodied individuals, labor-constrained households
Cash, food, training
QE 5
Ethiopia Productive Safety Net Program
Weldegebriel and Prowse 2013
Ongoing Able-bodied individuals, labor-constrained households
Cash, food, training
QE Not reported
(continued next page)
Annex 2A: Programs Included in the Meta-analysis
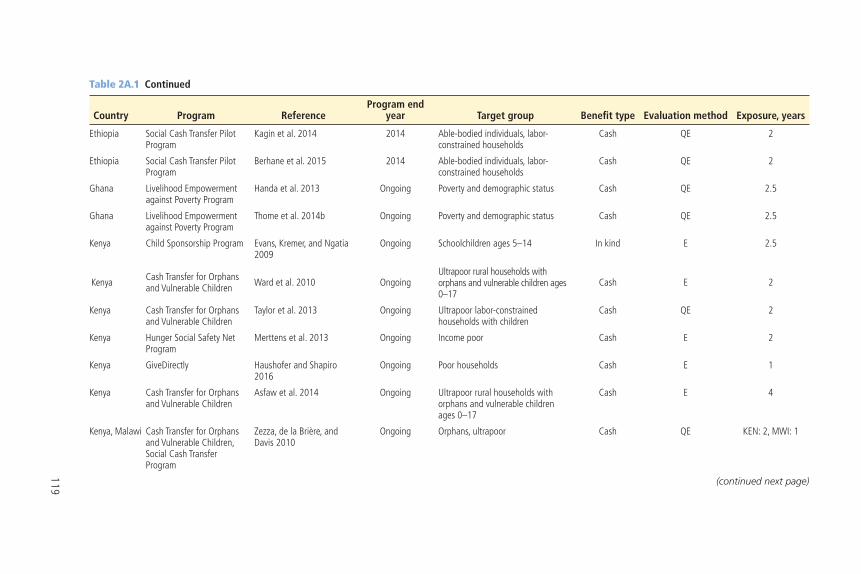
119
Table 2A.1 Continued
Country Program ReferenceProgram end
year Target group Benefi t type Evaluation method Exposure, years
Ethiopia Social Cash Transfer Pilot Program
Kagin et al. 2014 2014 Able-bodied individuals, labor-constrained households
Cash QE 2
Ethiopia Social Cash Transfer Pilot Program
Berhane et al. 2015 2014 Able-bodied individuals, labor-constrained households
Cash QE 2
Ghana Livelihood Empowerment against Poverty Program
Handa et al. 2013 Ongoing Poverty and demographic status Cash QE 2.5
Ghana Livelihood Empowerment against Poverty Program
Thome et al. 2014b Ongoing Poverty and demographic status Cash QE 2.5
Kenya Child Sponsorship Program Evans, Kremer, and Ngatia 2009
Ongoing Schoolchildren ages 5–14 In kind E 2.5
Kenya Cash Transfer for Orphans and Vulnerable Children Ward et al. 2010 Ongoing
Ultrapoor rural households with orphans and vulnerable children ages 0–17
Cash E 2
Kenya Cash Transfer for Orphans and Vulnerable Children
Taylor et al. 2013 Ongoing Ultrapoor labor-constrained households with children
Cash QE 2
Kenya Hunger Social Safety Net Program
Merttens et al. 2013 Ongoing Income poor Cash E 2
Kenya GiveDirectly Haushofer and Shapiro 2016
Ongoing Poor households Cash E 1
Kenya Cash Transfer for Orphans and Vulnerable Children
Asfaw et al. 2014 Ongoing Ultrapoor rural households with orphans and vulnerable children ages 0–17
Cash E 4
Kenya, Malawi Cash Transfer for Orphans and Vulnerable Children, Social Cash Transfer Program
Zezza, de la Brière, and Davis 2010
Ongoing Orphans, ultrapoor Cash QE KEN: 2, MWI: 1
(continued next page)
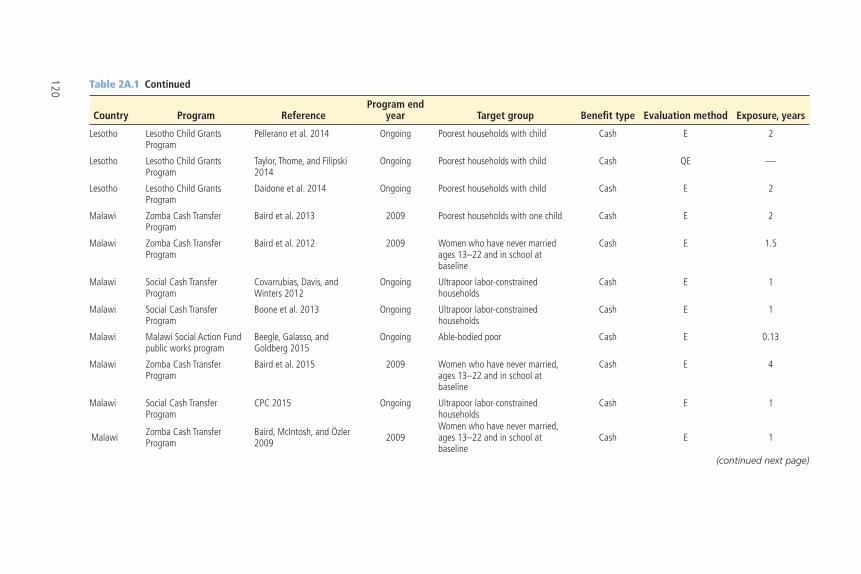
120 Table 2A.1 Continued
Country Program ReferenceProgram end
year Target group Benefi t type Evaluation method Exposure, years
Lesotho Lesotho Child Grants Program
Pellerano et al. 2014 Ongoing Poorest households with child Cash E 2
Lesotho Lesotho Child Grants Program
Taylor, Thome, and Filipski 2014
Ongoing Poorest households with child Cash QE —
Lesotho Lesotho Child Grants Program
Daidone et al. 2014 Ongoing Poorest households with child Cash E 2
Malawi Zomba Cash Transfer Program
Baird et al. 2013 2009 Poorest households with one child Cash E 2
Malawi Zomba Cash Transfer Program
Baird et al. 2012 2009 Women who have never married ages 13–22 and in school at baseline
Cash E 1.5
Malawi Social Cash Transfer Program
Covarrubias, Davis, and Winters 2012
Ongoing Ultrapoor labor-constrained households
Cash E 1
Malawi Social Cash Transfer Program
Boone et al. 2013 Ongoing Ultrapoor labor-constrained households
Cash E 1
Malawi Malawi Social Action Fund public works program
Beegle, Galasso, and Goldberg 2015
Ongoing Able-bodied poor Cash E 0.13
Malawi Zomba Cash Transfer Program
Baird et al. 2015 2009 Women who have never married, ages 13–22 and in school at baseline
Cash E 4
Malawi Social Cash Transfer Program
CPC 2015 Ongoing Ultrapoor labor-constrained households
Cash E 1
Malawi Zomba Cash Transfer Program
Baird, McIntosh, and Özler 2009 2009
Women who have never married, ages 13–22 and in school at baseline
Cash E 1
(continued next page)
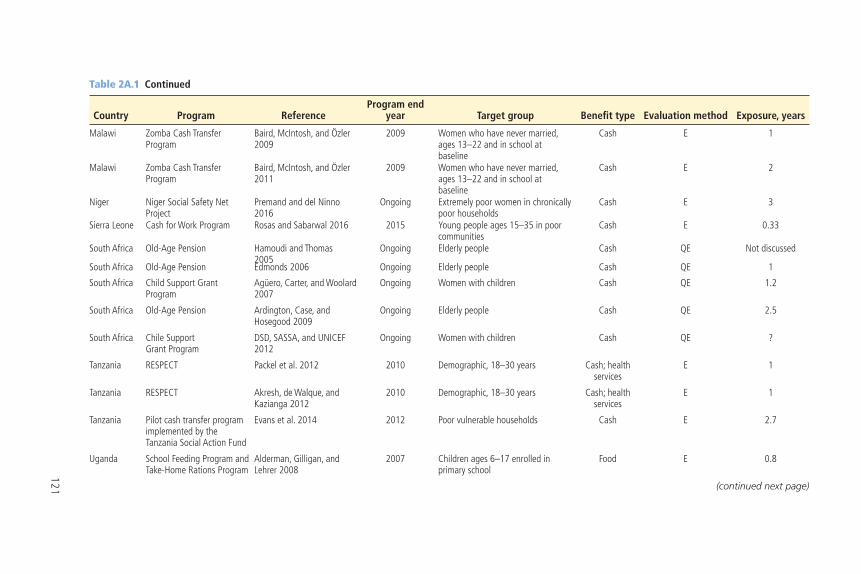
121
Table 2A.1 Continued
Country Program ReferenceProgram end
year Target group Benefi t type Evaluation method Exposure, years
Malawi Zomba Cash Transfer Program
Baird, McIntosh, and Özler 2009
2009 Women who have never married, ages 13–22 and in school at baseline
Cash E 1
Malawi Zomba Cash Transfer Program
Baird, McIntosh, and Özler 2011
2009 Women who have never married, ages 13–22 and in school at baseline
Cash E 2
Niger Niger Social Safety Net Project
Premand and del Ninno 2016
Ongoing Extremely poor women in chronically poor households
Cash E 3
Sierra Leone Cash for Work Program Rosas and Sabarwal 2016 2015 Young people ages 15–35 in poor communities
Cash E 0.33
South Africa Old-Age Pension Hamoudi and Thomas 2005
Ongoing Elderly people Cash QE Not discussed
South Africa Old-Age Pension Edmonds 2006 Ongoing Elderly people Cash QE 1
South Africa Child Support Grant Program
Agüero, Carter, and Woolard 2007
Ongoing Women with children Cash QE 1.2
South Africa Old-Age Pension Ardington, Case, and Hosegood 2009
Ongoing Elderly people Cash QE 2.5
South Africa Chile Support Grant Program
DSD, SASSA, and UNICEF 2012
Ongoing Women with children Cash QE ?
Tanzania RESPECT Packel et al. 2012 2010 Demographic, 18–30 years Cash; health services
E 1
Tanzania RESPECT Akresh, de Walque, and Kazianga 2012
2010 Demographic, 18–30 years Cash; health services
E 1
Tanzania Pilot cash transfer program implemented by the Tanzania Social Action Fund
Evans et al. 2014 2012 Poor vulnerable households Cash E 2.7
Uganda School Feeding Program and Take-Home Rations Program
Alderman, Gilligan, and Lehrer 2008
2007 Children ages 6–17 enrolled in primary school
Food E 0.8
(continued next page)
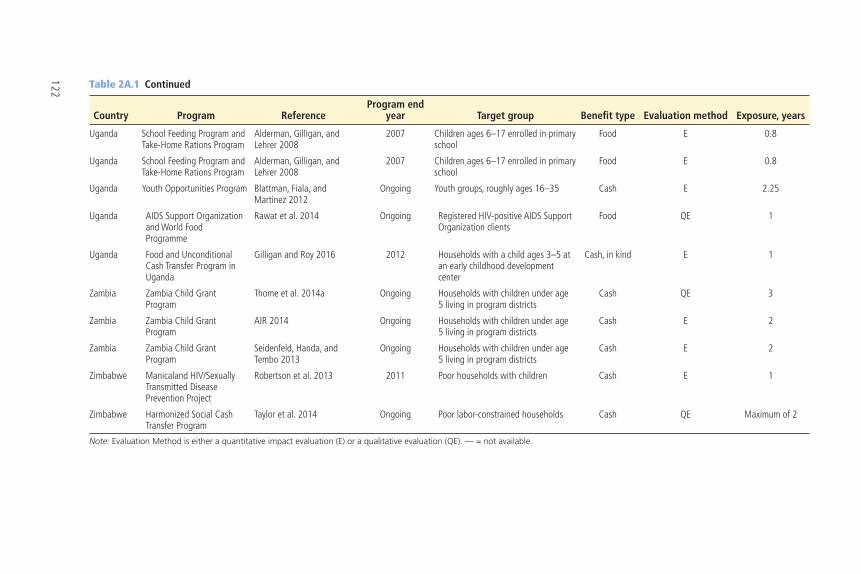
122 Table 2A.1 Continued
Country Program ReferenceProgram end
year Target group Benefi t type Evaluation method Exposure, years
Uganda School Feeding Program and Take-Home Rations Program
Alderman, Gilligan, and Lehrer 2008
2007 Children ages 6–17 enrolled in primary school
Food E 0.8
Uganda School Feeding Program and Take-Home Rations Program
Alderman, Gilligan, and Lehrer 2008
2007 Children ages 6–17 enrolled in primary school
Food E 0.8
Uganda Youth Opportunities Program Blattman, Fiala, and Martinez 2012
Ongoing Youth groups, roughly ages 16–35 Cash E 2.25
Uganda AIDS Support Organization and World Food Programme
Rawat et al. 2014 Ongoing Registered HIV-positive AIDS Support Organization clients
Food QE 1
Uganda Food and Unconditional Cash Transfer Program in Uganda
Gilligan and Roy 2016 2012 Households with a child ages 3–5 at an early childhood development center
Cash, in kind E 1
Zambia Zambia Child Grant Program
Thome et al. 2014a Ongoing Households with children under age 5 living in program districts
Cash QE 3
Zambia Zambia Child Grant Program
AIR 2014 Ongoing Households with children under age 5 living in program districts
Cash E 2
Zambia Zambia Child Grant Program
Seidenfeld, Handa, and Tembo 2013
Ongoing Households with children under age 5 living in program districts
Cash E 2
Zimbabwe Manicaland HIV/Sexually Transmitted Disease Prevention Project
Robertson et al. 2013 2011 Poor households with children Cash E 1
Zimbabwe Harmonized Social Cash Transfer Program
Taylor et al. 2014 Ongoing Poor labor-constrained households Cash QE Maximum of 2
Note: Evaluation Method is either a quantitative impact evaluation (E) or a qualitative evaluation (QE). — = not available.
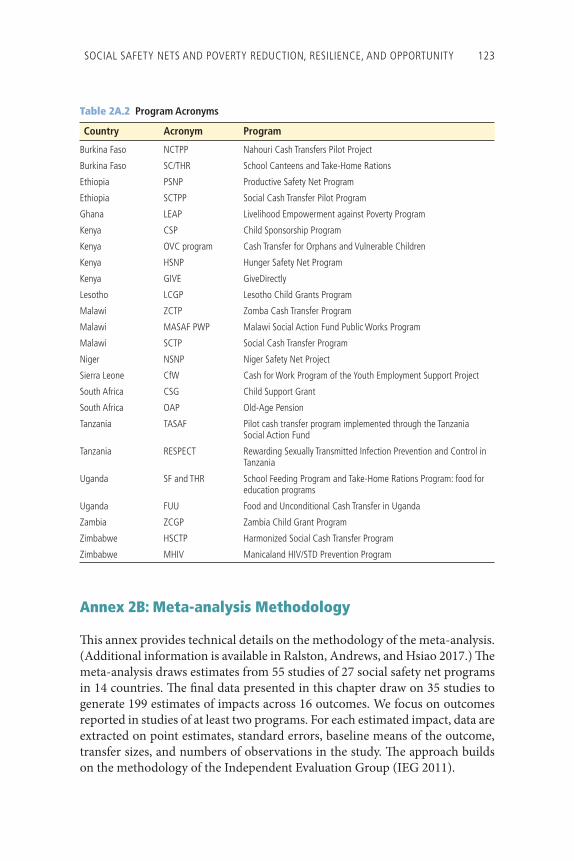
SOCIAL SAFETY NETS AND POVERTY REDUCTION, RESILIENCE, AND OPPORTUNITY 123
Table 2A.2 Program Acronyms
Country Acronym Program
Burkina Faso NCTPP Nahouri Cash Transfers Pilot Project
Burkina Faso SC/THR School Canteens and Take-Home Rations
Ethiopia PSNP Productive Safety Net Program
Ethiopia SCTPP Social Cash Transfer Pilot Program
Ghana LEAP Livelihood Empowerment against Poverty Program
Kenya CSP Child Sponsorship Program
Kenya OVC program Cash Transfer for Orphans and Vulnerable Children
Kenya HSNP Hunger Safety Net Program
Kenya GIVE GiveDirectly
Lesotho LCGP Lesotho Child Grants Program
Malawi ZCTP Zomba Cash Transfer Program
Malawi MASAF PWP Malawi Social Action Fund Public Works Program
Malawi SCTP Social Cash Transfer Program
Niger NSNP Niger Safety Net Project
Sierra Leone CfW Cash for Work Program of the Youth Employment Support Project
South Africa CSG Child Support Grant
South Africa OAP Old-Age Pension
Tanzania TASAF Pilot cash transfer program implemented through the Tanzania Social Action Fund
Tanzania RESPECT Rewarding Sexually Transmitted Infection Prevention and Control in Tanzania
Uganda SF and THR School Feeding Program and Take-Home Rations Program: food for education programs
Uganda FUU Food and Unconditional Cash Transfer in Uganda
Zambia ZCGP Zambia Child Grant Program
Zimbabwe HSCTP Harmonized Social Cash Transfer Program
Zimbabwe MHIV Manicaland HIV/STD Prevention Program
Annex 2B: Meta-analysis Methodology
Th is annex provides technical details on the methodology of the meta-analysis. (Additional information is available in Ralston, Andrews, and Hsiao 2017.) Th e meta-analysis draws estimates from 55 studies of 27 social safety net programs in 14 countries. Th e fi nal data presented in this chapter draw on 35 studies to generate 199 estimates of impacts across 16 outcomes. We focus on outcomes reported in studies of at least two programs. For each estimated impact, data are extracted on point estimates, standard errors, baseline means of the outcome, transfer sizes, and numbers of observations in the study. Th e approach builds on the methodology of the Independent Evaluation Group (IEG 2011).
124 REALIZING THE FULL POTENTIAL OF SOCIAL SAFETY NETS IN AFRICA
Selection of Impact Evaluations to Be Included in the Meta-AnalysisSocial safety net evaluations have been surveyed in the World Bank’s impact evaluation databases, academic journals, and institutions involved directly in impact evaluations. Th e databases of the Africa Impact Evaluation Initiative, Development Impact Evaluation, Spanish Impact Evaluation Fund, and Social Protection Publication Database have been covered.7 Th e institutions surveyed include the Abdul Latif Jameel Poverty Action Lab, the Innovations for Poverty Action Lab, and the International Initiative for Impact Evaluation.8 Th e process of updating the sample for more recent evaluations also involved cross-checks with more recent reviews, including Bastagli et al. (2016) and Davis et al. (2016).
Th e criteria for including an impact evaluation follows the approach of the Independent Evaluation Group (IEG 2011). Four fi lters have been applied, as follows:
• Development focus: Th e evaluated programs have been implemented in developing or transition countries and explicitly evaluated the social safety net component.
• Use of objective methods: Evaluations construct a counterfactual and use standard statistical methods to estimate impact.
• Robustness of fi ndings: Studies address plausible sources of bias and show that results are convincingly robust to a variety of confounding factors. Th e fi nal studies have been published.
• Final inspection: Only studies that demonstrate relevance, technical rigor, and robust fi ndings are included in the sample. To avoid duplication, only the most recent versions of evaluations are retained.
Th ere are limitations inherent in the search criteria applied to select impact evaluations to include in the meta-analysis. First, the inclusion of published rather than unpublished impact evaluations may bias the sample toward more positive results. Second, the analysis focuses only on impact evaluation studies and may not fully capture information covered through routine monitoring and process evaluation assessments. Th is information can provide valuable details on program implementation. Th ird, the approach does not focus on comparing or rating the quality of individual methodological approaches.
Th e dataset is generated from the fi nal set of 55 selected impact evaluations of 27 social safety net programs in 14 countries in Africa. Th ese evaluations were published between 2005 and 2016. Some outcome impacts are estimated multiple times for the same program. In these cases, the estimate generated under the most credible identifi cation strategy is chosen. For example, among the two child labor estimates for the Lesotho Child Grants Program, the esti-mate that is calculated with control variables is retained. Multiple estimates for
SOCIAL SAFETY NETS AND POVERTY REDUCTION, RESILIENCE, AND OPPORTUNITY 125
an outcome from a given paper are recorded only in cases where there are mul-tiple treatment arms (for example, if treatment is conditional or unconditional or involves vouchers versus cash). In the statistical analysis, these arms are aver-aged to obtain a single point estimate and confi dence band per outcome in a given paper.
In the case of household consumption, the households in the studies bene-fi ted from the programs for between four months and three years. Eight impact evaluations cover an exposure period of two or more years; two evaluations cover one year; and three cover shorter seasonal interventions (Kenya GiveDirectly, the Malawi MASAF PWP, and the CfW in Sierra Leone). Th e meta-analysis requires that estimates cover outcomes across at least two programs. Several well-known results in the impact evaluation literature are omitted from the meta-analysis because of this requirement. Th e meta- analysis also requires that raw estimates be suffi ciently comparable to allow for comparison across studies. Specifi cally, the meta-analysis requires consistency in how outcomes are defi ned. It is not appropriate to combine estimates that test fundamentally diff erent outcomes. For example, the food consumption meta-analysis focuses on food expenditures; estimates for food security—on which indicators are constructed diff erently across studies—and caloric intake are omitted.
Standardization across StudiesConverting social safety net transfers into monthly household transfers in 2011 PPP U.S. dollars. Th e size of the social safety net program transfer is recorded in local currency units whenever it is reported in this way in the original evalua-tions. Otherwise, it is reported in U.S. dollars. First, these fi gures are converted into monthly household transfers. Reported annual transfers are divided by 12, and reported workday transfers are multiplied by 20. Reported per capita trans-fers are multiplied by the average household size. Second, exchange rates are applied so that all transfers are measured in local currency units in the baseline year. If a given evaluation reports the size of the transfer in both local currency units and U.S. dollars, the local currency units are used, and an exchange-rate conversion does not need to be carried out in this case. Th ird, country- and year-specifi c infl ation rates are applied to convert the size of all transfers into 2011 terms. Fourth, PPP U.S. dollar conversion factors are applied to convert the size of all transfers to 2011 PPP U.S. dollars. Exchange rates, infl ation rates, and PPP U.S. dollar conversion factors are all taken from World Development Indicators data.9
Standardization of baseline means, impact estimates, and standard errors. For the conversion of baseline means, impact estimates, and impact standard errors into comparable units, a similar methodology is applied. Th e harmonization is required for outcomes measured in monetary terms (consumption, food con-sumption, and earnings). Per capita, annual, and daily measures are converted
126 REALIZING THE FULL POTENTIAL OF SOCIAL SAFETY NETS IN AFRICA
to monthly household measures, and the necessary exchange, infl ation, and PPP adjustments are applied.
Assumptions. A linear-scaling assumption underlies the aforementioned conversions. Th e time-period and household-size conversions applied to trans-fer sizes assume that transfer sizes scale linearly. Th e same assumption underlies the conversions of baseline means, impact estimates, and standard errors. Th is assumption is likely to be the least robust in the case of impact estimates. Th us, it is conceivable that a transfer of $10 for two weeks of work is worth half as much as a transfer of $20 for one month of work, but it is less certain that a household spending $10 over two weeks in response to treatment is equally likely to spend $20 over one month in response to a treatment that is twice as large. One might conclude that the household will focus the additional treat-ment funds on other areas of spending.
Reporting the Impacts on OutcomesFor consumption and food consumption, the household propensity to consume the amount of the social safety net transfer is reported. Th is is calculated simply by dividing the impact estimates by the transfer sizes. For other outcomes, per-centage point increases are calculated relative to baseline means of the outcome by dividing the impact estimates by baseline means. Th e meta-analysis involves plotting these quantities for each outcome and calculating an aggregate mean eff ect. Th e aggregate eff ect weights each estimate by the number of observations used to generate the estimate.
Annex 2C: Partial and General Equilibrium Methodology
Partial and general equilibrium analyses were undertaken to explore the poten-tial impact of programs if they are brought to scale. Th is is a relatively nascent area of analysis for social safety nets in Africa, despite the numerous impact evaluation studies available.
The partial equilibrium approach presented measures the aggregate impact on poverty rates, school enrollment rates, and household investment if the most successful interventions are brought to scale and their impacts, as measured in the meta-analysis, are experienced among a larger population of vulnerable households. Th is takes into account only direct eff ects, and it is con-sidered a partial equilibrium approach because it does not attempt to capture feedback or spillover eff ects that program expansion might entail. Baseline details and parameters are shown in table 2C.1.
Th e simulations allow for a 10 percent to 40 percent increase in the incidence of livestock ownership and a 5 percent to 10 percent increase in the incidence of land ownership; the meta-evaluation revealed average increases of 34 percent
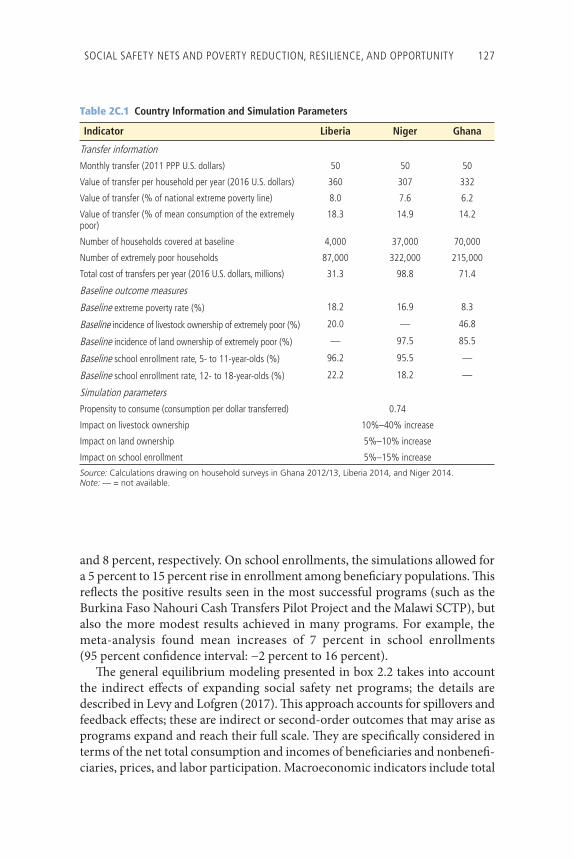
SOCIAL SAFETY NETS AND POVERTY REDUCTION, RESILIENCE, AND OPPORTUNITY 127
and 8 percent, respectively. On school enrollments, the simulations allowed for a 5 percent to 15 percent rise in enrollment among benefi ciary populations. Th is refl ects the positive results seen in the most successful programs (such as the Burkina Faso Nahouri Cash Transfers Pilot Project and the Malawi SCTP), but also the more modest results achieved in many programs. For example, the meta-analysis found mean increases of 7 percent in school enrollments (95 percent confi dence interval: −2 percent to 16 percent).
Th e general equilibrium modeling presented in box 2.2 takes into account the indirect eff ects of expanding social safety net programs; the details are described in Levy and Lofgren (2017). Th is approach accounts for spillovers and feedback eff ects; these are indirect or second-order outcomes that may arise as programs expand and reach their full scale. Th ey are specifi cally considered in terms of the net total consumption and incomes of benefi ciaries and nonbenefi -ciaries, prices, and labor participation. Macroeconomic indicators include total
Table 2C.1 Country Information and Simulation Parameters
Indicator Liberia Niger Ghana
Transfer information
Monthly transfer (2011 PPP U.S. dollars) 50 50 50
Value of transfer per household per year (2016 U.S. dollars) 360 307 332
Value of transfer (% of national extreme poverty line) 8.0 7.6 6.2
Value of transfer (% of mean consumption of the extremely poor)
18.3 14.9 14.2
Number of households covered at baseline 4,000 37,000 70,000
Number of extremely poor households 87,000 322,000 215,000
Total cost of transfers per year (2016 U.S. dollars, millions) 31.3 98.8 71.4
Baseline outcome measures
Baseline extreme poverty rate (%) 18.2 16.9 8.3
Baseline incidence of livestock ownership of extremely poor (%) 20.0 — 46.8
Baseline incidence of land ownership of extremely poor (%) — 97.5 85.5
Baseline school enrollment rate, 5- to 11-year-olds (%) 96.2 95.5 —
Baseline school enrollment rate, 12- to 18-year-olds (%) 22.2 18.2 —
Simulation parameters
Propensity to consume (consumption per dollar transferred) 0.74
Impact on livestock ownership 10%–40% increase
Impact on land ownership 5%–10% increase
Impact on school enrollment 5%–15% increase
Source: Calculations drawing on household surveys in Ghana 2012/13, Liberia 2014, and Niger 2014.Note: — = not available.
128 REALIZING THE FULL POTENTIAL OF SOCIAL SAFETY NETS IN AFRICA
domestic demand, exports, imports, gross domestic product, and production in aggregate sectors. Th ere is a related literature that focuses on the impacts on local economies, but not the eff ects of expansions (see Taylor, Th ome, and Filipski 2014; Taylor et al. 2013, 2014; Th ome et al. 2014b).
Th e general equilibrium modeling is done using a computable general equilibrium model that sets out a fully articulated system of demand and sup-ply functions for each sector of an economy. Such a model also facilitates an analysis of the impacts of alternative policy packages (such as complementary interventions that may be designed to raise productivity) and the conse-quences of various avenues of program funding (such as bilateral aid versus domestic tax revenues). While computable general equilibrium models allow greater modeling detail and can capture more eff ectively the short-run spill-over and feedback eff ects, they are also static and are not well suited to model-ing the intergenerational impacts of investments in the human capital of children that may arise if benefi ciaries are covered by social safety net programs.
Th ese two approaches—the partial equilibrium approach and the general equilibrium approach—have advantages and disadvantages. Th e partial equi-librium estimates translate impact evaluation fi ndings into an aggregate impact of bringing programs to scale and is considered the immediate impact of programs prior to household and producer responses (Caldés, Coady, and Maluccio 2006). Its appeal is that it is a fairly simple and straightforward cal-culation. However, if the scale of the program is suffi ciently large, the eff ects of the program cannot be fully understood without considering the impact on and the feedback from the broader economy. On the other hand, the general equilibrium approach relies on a complex set of equations and assumptions about macroeconomic responses, which oft en are simplifi cations of how the real world works.
Notes
1. For further discussion of frameworks for the study of social safety nets, see Bastagli et al. (2016); Devereux and Sebastes-Wheeler (2004); Grosh et al. (2008); Tirivayi, Knowles, and Davis (2013); and World Bank (2012).
2. Impact evaluations are defi ned as studies that derive the impact of a social safety net program by using robust counterfactual data. Th ey include randomized controlled trials, as well as diff erence-in-diff erences and regression discontinuity methods.
3. Consumption refers to food and a wide range of recurrent nonfood expenditures, but excludes consumer durables (such as a new roof or a car), productive investments (such as farming equipment), or annual expenditure items.
4. Th e two extreme outliers—the Livelihood Empowerment against Poverty Program (LEAP) in Ghana and the Social Cash Transfer Program (SCTP) in Malawi—have
SOCIAL SAFETY NETS AND POVERTY REDUCTION, RESILIENCE, AND OPPORTUNITY 129
been dropped from the meta-estimate of $0.74 per $1.00 equivalent transferred. Including them would increase the meta-estimate to $0.92.
5. Programs with conditions are the food-for-education programs (the School Canteens Program and the Take-Home Rations Program) in Burkina Faso, the OVC program in Kenya, the Tanzania TASAF, and the food for education programs (the School Feeding Program and the Take-Hone Rations Program) in Uganda. Unconditional programs are LEAP in Ghana, the Child Sponsorship Program and the HSNP in Kenya, the Lesotho Child Grants Program, the Niger Safety Net Project, the CfW in Sierra Leone, the Old-Age Pension in South Africa, and the Zambia Child Grant Program. Programs with components with and without conditions are the Nahouri Cash Transfers Pilot Project in Burkina Faso, the Malawi SCTP, and the Manicaland HIV/STD Prevention Program in Zimbabwe.
6. Th e baseline coverage used in these simulations matches the level of coverage of social safety net programs at the time of the most recent household survey. Since then, the size of social safety nets has grown in Ghana and Niger.
7. See AIM (Africa Impact Evaluation Initiative) (database), Africa Region, World Bank, Washington, DC, http://go.worldbank.org/E70Y4QHZW0; DIME (Development Impact Evaluation) (database), World Bank, Washington, DC, http://www.worldbank.org/en/research/dime; SIEF (Spanish Impact Evaluation Fund) (database), World Bank, Washington, DC, http://web.worldbank.org/WBSITE / EXTERNAL/EXTABOUTUS/ORGANIZATION/EXTHDNETWORK/EXTHDOFFICE/0,,contentMDK:23150708~menuPK:8535092~pagePK:64168445~piPK:64168309~theSitePK:5485727,00.html; Social Development Publications Database, World Bank, Washington, DC, http://www-esd.worldbank.org/sdvpubs/.
8. See J-PAL (Abdul Latif Jameel Poverty Action Lab), Massachusetts Institute of Technology, Cambridge, MA, https://www.povertyactionlab.org/; IPA (Innovations for Poverty Action), New Haven, CT, https://www.poverty-action.org/; 3ie (International Initiative for Impact Evaluation), New Delhi, http://www.3ieimpact.org/en/.
9. See WDI (World Development Indicators) (database), World Bank, Washington, DC, http://data.worldbank.org/products/wdi.
References
Agüero, Jorge M., Michael R. Carter, and Ingrid Woolard. 2007. “Th e Impact of Unconditional Cash Transfers on Nutrition: Th e South African Child Support Grant.” Working Paper 39, International Poverty Centre, United Nations Development Programme, Brasília.
Aiyagari, S. Rao. 1994. “Uninsured Idiosyncratic Risk and Aggregate Saving.” Quarterly Journal of Economics 109 (3): 659–84.
AIR (American Institutes for Research). 2014. “Zambia’s Multiple Category Targeting Grant: 36-Month Impact Report.” Draft , AIR, Washington, DC.
Aker, Jenny C. 2013. “Cash or Coupons? Testing the Impacts of Cash versus Vouchers in the Democratic Republic of Congo.” Working Paper 320, Center for Global Development, Washington, DC.
130 REALIZING THE FULL POTENTIAL OF SOCIAL SAFETY NETS IN AFRICA
Akresh, Richard, Damien de Walque, and Harounan Kazianga. 2012. “Alternative Cash Transfer Delivery Mechanisms: Impacts on Routine Preventative Health Clinic Visits in Burkina Faso.” Policy Research Working Paper 5958, World Bank, Washington, DC.
———. 2013. “Cash Transfers and Child Schooling: Evidence from a Randomized Evaluation of the Role of Conditionality.” Policy Research Working Paper 6340, World Bank, Washington, DC.
Alderman, Harold, Daniel O. Gilligan, and Kim Lehrer. 2008. “Th e Impact of Alternative Food for Education Programs on School Participation and Education Attainment in Northern Uganda.” Working paper, International Food Policy Research Institute, Washington, DC.
Alderman, Harold, and Ruslan Yemtsov. 2013. “How Can Safety Nets Contribute to Economic Growth?” Policy Research Working Paper 6437, World Bank, Washington, DC.
Alfani, Federica, Andrew Dabalen, Peter Fisker, and Vasco Molini. 2015. “Can We Measure Resilience? A Proposed Method and Evidence from Countries in the Sahel.” Policy Research Working Paper 7170, World Bank, Washington, DC.
Andersson, Camilla, Alemu Mekonnen, and Jesper Stage. 2011. “Impacts of the Productive Safety Net Program in Ethiopia on Livestock and Tree Holdings of Rural Households.” Journal of Development Economics 94 (1): 119–26.
Ardington, Cally, Anne Case, and Victoria Hosegood. 2009. “Labor Supply Responses to Large Social Transfers: Longitudinal Evidence from South Africa.” American Economic Journal: Applied Economics 1 (1): 22–48.
Asfaw, Solomon, Benjamin Davis, Josh Dewbre, Sudhanshu Handa, and Paul Winters. 2014. “Cash Transfer Programme, Productive Activities, and Labour Supply: Evidence from a Randomized Experiment in Kenya.” Journal of Development Studies 50 (8): 1172–96.
Baez, Javier E., and Adriana Camacho. 2011. “Assessing the Long-Term Eff ects of Conditional Cash Transfers on Human Capital: Evidence from Colombia.” Policy Research Working Paper 5681, World Bank, Washington, DC.
Baird, Sarah Jane, Ephraim Chirwa, Craig T. McIntosh, and Berk Özler. 2015. “What Happens Once the Intervention Ends? Th e Medium-Term Impacts of a Cash Transfer Experiment in Malawi.” 3ie Impact Evaluation Report 27, International Initiative for Impact Evaluation, New Delhi.
Baird, Sarah Jane, Francisco H. G. Ferreira, Berk Özler, and Michael Woolcock. 2013. “Relative Eff ectiveness of Conditional and Unconditional Cash Transfers for Schooling Outcomes in Developing Countries: A Systematic Review.” Campbell Systematic Reviews 8 (September), Campbell Collaboration, Oslo.
Baird, Sarah, Richard S. Garfein, Craig T. McIntosh, and Berk Özler. 2012. “Eff ect of a Cash Transfer Program for Schooling on Prevalence of HIV and Herpes Simplex Type 2 in Malawi: A Cluster Randomized Trial.” Lancet 379 (9823): 1320–29.
Baird, Sarah Jane, Craig T. McIntosh, and Berk Özler. 2009. “Designing Cost-Eff ective Cash Transfer Programs to Boost Schooling among Young Women in Sub-Saharan Africa.” Policy Research Working Paper 5090, World Bank, Washington, DC.
———. 2011. “Cash or Condition? Evidence from a Cash Transfer Experiment.” Quarterly Journal of Economics 126 (4): 1709–53.
SOCIAL SAFETY NETS AND POVERTY REDUCTION, RESILIENCE, AND OPPORTUNITY 131
Bandiera, Oriana, Robin Burgess, Narayan Das, Selim Gulesci, Imran Rasul, and Munshi Sulaiman. 2013. “Can Basic Entrepreneurship Transform the Economic Lives of the Poor?” IZA Discussion Paper 7386, Institute for the Study of Labor, Bonn.
Banerjee, Abhijit, Esther Dufl o, Nathanael Goldberg, Dean Karlan, Robert Osei, William Parienté, Jeremy Shapiro, Bram Thuysbaert, and Christopher Udry. 2015. “A Multifaceted Program Causes Lasting Progress for the Very Poor: Evidence from Six Countries.” Science 348 (6236): 772–89.
Barham, Tania, Karen Macours, and John A. Maluccio. 2013. “More Schooling and More Learning? Eff ects of a Th ree-Year Conditional Cash Transfer Program in Nicaragua aft er 10 Years.” IDB Working Paper IDB-WP-42, Inter-American Development Bank, Washington, DC.
Barrientos, Armando. 2012. “Social Transfers and Growth: What Do We Know? What Do We Need to Find Out?” World Development 40 (1): 11–20.
Barry, Oumar, Ali Mory Maidoka, and Patrick Premand. 2017. “Promoting Positive Parenting Practices in Niger through a Cash Transfer Programme.” Early Childhood Matters.
Bastagli, Francesca, Jessica Hagen-Zanker, Luke Harman, Valentina Barca, Georgina Sturge, and Tanja Schmidt. 2016. Cash Transfers: What Does the Evidence Say? A Rigorous Review of Programme Impact and of the Role of Design and Implementation Features. With Luca Pellerano. London: Overseas Development Institute.
Beegle, Kathleen, Emanuela Galasso, and Jessica Goldberg. 2015. “Direct and Indirect Eff ects of Malawi’s Public Works Program on Food Security.” Policy Research Working Paper 7505, World Bank, Washington, DC.
Behrman, Jere R., Susan W. Parker, and Petra E. Todd. 2011. “Do Conditional Cash Transfers for Schooling Generate Lasting Benefits? A Five-Year Followup of PROGRESA/Oportunidades.” Journal of Human Resources 46 (1): 93–122.
Benhassine, Najy, Florencia Devoto, Esther Dufl o, Pascaline Dupas, and Victor Pouliquen. 2013. “Turning a Shove into a Nudge? A ‘Labeled Cash Transfer’ for Education.” NBER Working Paper 19227, National Bureau of Economic Research, Cambridge, MA.
Berhane, Guush, Stephen Devereux, John F. Hoddinott, Jessica B. Hoel, Keetie Roelen, Kibrewossen Abay, Martha Kimmel, Natasha Ledlie, and Th omas Woldu Assefa. 2015. Evaluation of the Social Cash Transfer Pilot Programme, Tigray Region, Ethiopia: Endline Report. Washington, DC: International Food Policy Research Institute.
Berhane, Guush, Kalle Hirvonen, and John F. Hoddinott. 2015. “Th e Implementation of the Productive Safety Nets Programme, 2014: Highlands Outcomes Report.” International Food Policy Research Institute, Washington, DC.
Berhane, Guush, John F. Hoddinott, Neha Kumar, and Alemayehu Seyoum Taff esse. 2011. “Th e Impact of Ethiopia’s Productive Safety Nets and Household Asset Building Programme: 2006–2010.” Report, International Food Policy Research Institute, Washington, DC.
Blattman, Christopher, Nathan Fiala, and Sebastian Martinez. 2012. “Employment Generation in Rural Africa: Mid-term Results from an Experimental Evaluation of the Youth Opportunities Program in Northern Uganda.” DIW Discussion Paper 1201, German Institute for Economic Research, Berlin.
132 REALIZING THE FULL POTENTIAL OF SOCIAL SAFETY NETS IN AFRICA
———. 2013. “Th e Economic and Social Returns to Cash Transfers: Evidence from a Ugandan Aid Program.” Working paper, Department of Political Science and Department of International and Public Aff airs, Columbia University, New York.
Boone, Ryan, Katia Covarrubias, Benjamin Davis, and Paul Winters. 2013. “Cash Transfer Programs and Agricultural Production: Th e Case of Malawi.” Agricultural Economics 44 (3): 365–78.
Caldés, Natàlia, David Coady, and John A. Maluccio. 2006. “Th e Cost of Poverty Alleviation Transfer Programs: A Comparative Analysis of Th ree Programs in Latin America.” World Development 34 (5): 818–37.
Chenery, Hollis B., Montek S. Ahluwalia, C. L. G. Bell, John H. Daly, and Richard Jolly. 1974. Redistribution with Growth: Policies to Improve Income Distribution in Developing Countries in the Context of Economic Growth. London: Oxford University Press.
Clarke, Daniel J., and Stefan Dercon. 2016. Dull Disasters? How Planning Ahead Will Make a Diff erence. Washington, DC: World Bank; Oxford Oxford University Press.
Covarrubias, Katia, Benjamin Davis, and Paul Winters. 2012. “From Protection to Production: Productive Impacts of the Malawi Social Cash Transfer Scheme.” Journal of Development Eff ectiveness 4 (1): 50–77.
CPC (Carolina Population Center). 2015. Malawi Social Cash Transfer Program: Midline Impact Evaluation Report. Chapel Hill, NC: CPC, University of North Carolina at Chapel Hill.
———. 2016. Malawi Social Cash Transfer Programme: Endline Impact Evaluation Report. Chapel Hill, NC: CPC, University of North Carolina at Chapel Hill.
Daidone, Silvio, Benjamin Davis, Joshua Dewbre, and Katia Covarrubias. 2014. “Lesotho’s Child Grant Programme: 24-Month Impact Report on Productive Activities and Labour Allocation; Lesotho Country Case Study Report.” PtoP, From Protection to Production Series, Food and Agriculture Organization of the United Nations, Rome.
Davis, Benjamin, Sudhanshu Handa, Nicola Hypher, Natalia Winder Rossi, Paul Winters, and Jennifer Yablonski, eds. 2016. From Evidence to Action: Th e Story of Cash Transfers and Impact Evaluation in Sub-Saharan Africa. Oxford, UK: Oxford University Press.
Devereux, Stephen. 1997. “Household Food Security in Malawi.” IDS Discussion Paper 362 (December), Institute of Development Studies, Brighton, UK.
Devereux, Stephen, and Rachel Sebastes-Wheeler. 2004. “Transformative Social Protection.” IDS Working Paper 232, Institute of Development Studies, Brighton, UK.
DFID (UK Department for International Development). 2011. “Defi ning Disaster Resilience: A DFID Approach Paper.” Department for International Development, London.
DSD (South Africa, Department of Social Development), SASSA (South African Social Security Agency), and UNICEF (United Nations Children’s Fund–South Africa). 2012. “Th e South African Child Support Grant Impact Assessment: Evidence from a Survey of Children, Adolescents, and Th eir Households.” UNICEF–South Africa, Pretoria.
Eden, Maya. 2017. “Is Th ere Enough Redistribution?” Policy Research Working Paper 8003, World Bank, Washington, DC.
SOCIAL SAFETY NETS AND POVERTY REDUCTION, RESILIENCE, AND OPPORTUNITY 133
Edmonds, Eric V. 2006. “Child Labor and Schooling Responses to Anticipated Income in South Africa.” Journal of Development Economics 81 (2): 386–414.
Evans, David K., Stephanie Hausladen, Katrina Kosec, and Natasha Reese. 2014. Community-Based Conditional Cash Transfers in Tanzania: Results from a Randomized Trial. World Bank Study Series. Washington, DC: World Bank.
Evans, David K., Michael Kremer, and Mũthoni Ngatia. 2009. “Th e Impact of Distributing School Uniforms on Children’s Education in Kenya.” Working paper, World Bank, Washington, DC.
Evans, David K., and Anna Popova. 2014. “Cash Transfers and Temptation Goods: A Review of Global Evidence.” Policy Research Working Paper 6886, World Bank, Washington, DC.
Fiszbein, Ariel, and Norbert R. Schady. 2009. Conditional Cash Transfers: Reducing Present and Future Poverty. With Francisco H. G. Ferreira, Margaret E. Grosh, Niall Keleher, Pedro Olinto, and Emmanuel Skoufi as. World Bank Policy Research Report. Washington, DC: World Bank.
Gentilini, Ugo. 2014. “Our Daily Bread: What Is the Evidence on Comparing Cash versus Food Transfers?” Social Protection and Labor Discussion Paper 1420, World Bank, Washington, DC.
Gertler, Paul J., Sebastian Martinez, and Marta Rubio-Codina. 2012. “Investing Cash Transfers to Raise Long-Term Living Standards.” American Economic Journal: Applied Economics 4 (1): 164–92.
Gilligan, Daniel O., John F. Hoddinott, Neha Kumar, and Alemayehu Seyoum Taff esse. 2009. “Can Social Protection Work in Africa? Evidence on the Impact of Ethiopia’s Productive Safety Net Program on Food Security, Assets, and Incentives.” Working paper, International Food Policy Research Institute, Washington, DC.
Gilligan, Daniel O., John F. Hoddinott, and Alemayehu Seyoum Taff esse. 2008. “Th e Impact of Ethiopia’s Productive Safety Net Programme and Its Linkages.” IFPRI Discussion Paper 00839, International Food Policy Research Institute, Washington, DC.
Gilligan, Daniel O., and Shalini Roy. 2016. “Th e Eff ect of Transfers and Preschool on Children’s Cognitive Development in Uganda.” 3ie Impact Evaluation Report 32 (March), International Initiative for Impact Evaluation, New Delhi.
Grosh, Margaret E., Carlo del Ninno, Emil Tesliuc, and Azedine Ouerghi. 2008. For Protection and Promotion: Th e Design and Implementation of Eff ective Safety Nets. Washington, DC: World Bank.
Hagen-Zanker, Jessica, Anna McCord, and Rebecca Holmes. 2011. “Systematic Review of the Impact of Employment Guarantee Schemes and Cash Transfers on the Poor.” With Francesca Booker and Elizabeth Molinari. ODI Systematic Review, Overseas Development Institute, London.
Hallegatte, Stéphane, Mook Bangalore, Laura Bonzanigo, Marianne Fay, Tomaro Kane, Ulf Narloch, Julie Rozenberg, David Treguer, and Adrien Vogt-Schilb. 2016. Shock Waves: Managing the Impacts of Climate Change on Poverty. Climate Change and Development Series. Washington, DC: World Bank.
Hamoudi, Amar, and Duncan Th omas. 2005. “Pension Income and the Well-Being of Children and Grandchildren: New Evidence from South Africa.” On-Line Working
134 REALIZING THE FULL POTENTIAL OF SOCIAL SAFETY NETS IN AFRICA
Paper CCPR 043–05 \ California Center for Population Research, University of California, Los Angeles.
Handa, Sudhanshu, Silvio Daidone, Amber Peterman, Benjamin Davis, Audrey Pereira, Tia Palermo, and Jennifer Yablonski. 2017. “Myth Busting? Confronting Six Common Perceptions about Unconditional Cash Transfers as a Poverty Reduction Strategy in Africa.” Innocenti Working Paper 2017–11, Offi ce of Research, United Nations Children’s Fund, Florence.
Handa, Sudhanshu, Michael Park, Robert Osei Darko, Isaac Osei-Akoto, Benjamin Davis, and Silvio Daidone. 2013. “Livelihood Empowerment against Poverty Program: Impact Evaluation.” Report, Carolina Population Center, University of North Carolina at Chapel Hill, Chapel Hill.
Haushofer, Johannes, and Jeremy Shapiro. 2016. “The Short-Term Impact of Unconditional Cash Transfers to the Poor: Experimental Evidence from Kenya.” Quarterly Journal of Economics 131 (4): 1973–2042.
Hill, Ruth, and Philip Verwimp. 2017. “Managing Risk and Confl ict.” In Accelerating Poverty Reduction in Africa, edited by Kathleen Beegle and Luc Christiaensen, chapter 4. Washington, DC: World Bank.
Hoddinott, John F., Guush Berhane, Daniel O. Gilligan, Neha Kumar, and Alemayehu Seyoum Taff esse. 2012. “Th e Impact of Ethiopia’s Productive Safety Net Programme and Related Transfers on Agricultural Productivity.” Journal of African Economies 21 (5): 761–86.
Hubbard, R. Glenn, Jonathan Skinner, and Stephen P. Zeldes. 1995. “Precautionary Saving and Social Insurance.” Journal of Political Economy 103 (2): 360–99.
IEG (Independent Evaluation Group). 2011. Evidence and Lessons Learned from Impact Evaluations on Social Safety Nets. Washington, DC: World Bank.
Inchauste, Gabriela, and David G. Victor, eds. 2017. Th e Political Economy of Energy Subsidy Reform. Directions in Development: Public Sector Governance Series. Washington, DC: World Bank.
Kabeer, Naila, Caio Piza, and Linnet Taylor. 2012. “What Are the Economic Impacts of Conditional Cash Transfer Programmes? A Systematic Review of the Evidence.” Technical report (December), EPPI-Center, Social Science Research Unit, Institute of Education, University of London, London.
Kagin, Justin, J. Edward Taylor, Federica Alfani, and Benjamin Davis. 2014. “Local Economy-Wide Impact Evaluation (LEWIE) of Ethiopia’s Social Cash Transfer Pilot Programme.” PtoP, From Protection to Production Series, Food and Agriculture Organization of the United Nations, Rome.
Kazianga, Harounan, Damien de Walque, and Harold Alderman. 2009. “Educational and Health Impacts of Two School Feeding Schemes: Evidence from a Randomized Trial in Rural Burkina Faso.” Policy Research Working Paper 4976, World Bank, Washington, DC.
———. 2014 “School Feeding Programs, Intrahousehold Allocation, and the Nutrition of Siblings: Evidence from a Randomized Trial in Rural Burkina Faso.” Journal of Development Economics 106: 15–34.
Levy, Stéphanie, and Hans Lofgren. 2017. “General Equilibrium Eff ects of Social Safety Nets: Th e Case of Ghana’s LEAP Program.” Working paper, World Bank, Washington, DC.
Macours, Karen, Norbert R. Schady, and Renos Vakis. 2012. “Cash Transfers, Behavioral Changes, and Cognitive Development in Early Childhood: Evidence from a Randomized Experiment.” American Economic Journal: Applied Economics 4 (2): 247–73.
SOCIAL SAFETY NETS AND POVERTY REDUCTION, RESILIENCE, AND OPPORTUNITY 135
Merttens, Fred, Alex Hurrell, Marta Marzi, Ramla Attah, Maham Farhat, Andrew Kardan, and Ian MacAuslan. 2013. Kenya Hunger Social Safety Net Programme, Monitoring and Evaluation Component: Impact Evaluation, Final Report, 2009 to 2012. Oxford: Oxford Policy Management.
Packel, Laura, William H. Dow, Damien de Walque, Zachary Isdahl, and Albert Majura. 2012. “Sexual Behavior Change Intentions and Actions in the Context of a Randomized Trial of a Conditional Cash Transfer for HIV Prevention in Tanzania.” Policy Research Working Paper 5997, World Bank, Washington, DC.
Pellerano, Luca, Marta Moratti, Maja Jakobsen, Matěj Bajgar, and Valentina Barca. 2014. Child Grants Programme Impact Evaluation: Follow-up Report. Oxford: Oxford Policy Management.
Premand, Patrick, Oumar Barry, and Marc Smitz. 2016. “Transferts Monétaires, Valeur Ajoutée de Mesures d’Accompagnement Comportemental, et Développement de la Petite Enfance au Niger. Rapport Descriptif de l’Évaluation d’Impact à Court Terme du Projet Filets Sociaux.” Report No: ACS18664. Washington, DC: World Bank, 2016.
Premand, Patrick, and Carlo del Ninno. 2016. “Cash Transfers, Behavioral Accompanying Measures, and Child Development in Niger.” Working paper, World Bank, Washington, DC.
Ralston, Laura, Colin Andrews, and Allan Hsiao. 2017. “A Meta-Analysis of Social Safety Net Programs in Africa.” Policy Research Working Paper 8255, World Bank, Washington, DC.
Rawat, Rahul, Elizabeth Faust, John A. Maluccio, and Suneetha Kadiyala. 2014. “Th e Impact of a Food Assistance Program on Nutritional Status, Disease Progression, and Food Security among People Living with HIV in Uganda.” 3ie Grantee Final Report, International Initiative for Impact Evaluation, New Delhi.
Robertson, Laura, Phyllis Mushati, Jeff rey W. Eaton, Lovemore Dumba, Gideon Mavise, Jeremiah Makoni, Christina Schumacher, et al. 2013. “Eff ects of Unconditional and Conditional Cash Transfers on Child Health and Development in Zimbabwe: A Cluster-Randomised Trial.” Lancet 381 (9874): 1283–92.
Rodrigo, María F. 2012. “Impact Evaluation of the Productive Safety Nets Program in Ethiopia.” Paper presented at the 2013 Agricultural and Applied Economics Association and Canadian Agricultural Economics Society Joint Annual Meeting, Washington, DC, August 4–6.
Rosas, Nina, and Shwetlena Sabarwal. 2016. “Can You Work It? Evidence on the Productive Potential of Public Works from a Youth Employment Program in Sierra Leone.” Policy Research Working Paper 7580, World Bank, Washington, DC.
Saavedra, Juan Esteban, and Sandra Garcia. 2012. “Impacts of Conditional Cash Transfer Programs on Educational Outcomes in Developing Countries: A Meta-analysis.” Labor and Population Working Paper WR-921-1, RAND Corporation, Santa Monica, CA.
Sabates-Wheeler, Rachel, and Stephen Devereux. 2010. “Cash Transfers and High Food Prices: Explaining Outcomes on Ethiopia’s Productive Safety Net Program.” FAC Working Paper 004, Future Agricultures Consortium, University of Sussex, Brighton, UK.
Schady, Norbert R., and María Caridad Araujo. 2006. “Cash Transfers, Conditions, School Enrollment, and Child Work: Evidence from a Randomized Experiment in Ecuador.” Policy Research Working Paper 3930, World Bank, Washington, DC.
136 REALIZING THE FULL POTENTIAL OF SOCIAL SAFETY NETS IN AFRICA
Schüring, Esther. 2010. “Conditions, Conditionality, Conditionalities, Responsibilities: Finding Common Ground.” Working Paper 2010WP014, Maastricht Graduate School of Governance, Maastricht University, Maastricht, the Netherlands.
Seidenfeld, David, Sudhanshu Handa, and Gelson Tembo. 2013. “Social Cash Transfer Scheme: 24-Month Impact Report for the Child Grant Programme.” September, American Institutes for Research, Washington, DC.
Slater, Rachel, Sarah Bailey, and Paul Harvey. 2015. “Can Emergency Cash Transfers ‘Piggyback’ on Existing Social Protection Programmes?” Background note, Overseas Development Institute, London.
Stoeffl er, Quentin, Bradford Mills, and Patrick Premand. 2016. “Poor Households’ Productive Investments of Cash Transfers: Quasi-Experimental Evidence from Niger.” Policy Research Working Paper 7839, World Bank, Washington, DC.
Taylor, J. Edward, Justin Kagin, Mateusz Filipski, and Karen Th ome. 2013. “Evaluating General Equilibrium Impacts of Kenya’s Cash Transfer Programme for Orphans and Vulnerable Children (CT-OVC).” PtoP, From Protection to Production Series, Food and Agriculture Organization of the United Nations, Rome.
Taylor, J. Edward, Karen Th ome, Benjamin Davis, David Seidenfeld, and Sudhanshu Handa. 2014. “Evaluating Local General Equilibrium Impacts of Zimbabwe’s Harmonized Social Cash Transfer Programme (HSCT).” PtoP, From Protection to Production Series, Food and Agriculture Organization of the United Nations, Rome.
Taylor, J. Edward, Karen Th ome, and Mateusz Filipski. 2014. “Evaluating Local General Equilibrium Impacts of Lesotho’s Child Grants Programme.” PtoP, From Protection to Production Series, Food and Agriculture Organization of the United Nations, Rome.
Th ome, Karen, J. Edward Taylor, Benjamin Davis, Sudhanshu Handa, David Seidenfeld, and Gelson Tembo. 2014a. “Local Economy-Wide Impact Evaluation (LEWIE) of Zambia’s Child Grant Programme.” PtoP, From Protection to Production Series, Food and Agriculture Organization of the United Nations, Rome.
Th ome, Karen, J. Edward Taylor, Justin Kagin, Benjamin Davis, Robert Darko Osei, and Isaac Osei-Akoto. 2014b. “Local Economy-Wide Impact Evaluation (LEWIE) of Ghana’s Livelihood Empowerment against Poverty (LEAP) Programme.” PtoP, From Protection to Production Series, Food and Agriculture Organization of the United Nations, Rome.
Tirivayi, Nyasha, Marco Knowles, and Benjamin Davis. 2013. “Th e Interaction between Social Protection and Agriculture: A Review of Evidence.” PtoP, From Protection to Production Series, Food and Agriculture Organization of the United Nations, Rome.
Ward, Patrick, Alex Hurrell, Aly Visram, Nils Riemenschneider, Luca Pellerano, Clare O’Brien, Ian MacAuslan, and Jack Willis. 2010. “Cash Transfer Programme for Orphans and Vulnerable Children (CT-OVC), Kenya: Operational and Impact Evaluation, 2007–2009, Final Report.” Oxford Policy Management, Oxford.
Weldegebriel, Zerihune Berhane, and Martin Prowse. 2013. “Climate Change Adaptation in Ethiopia: To What Extent Does Social Protection Influence Livelihood Diversifi cation?” IOB Working Paper 2012.11, Institute of Development Policy and Management, Universiteit Antwerpen, Antwerp.
World Bank. 2012. World Bank 2012–2022 Social Protection and Labor Strategy: Resilience, Equity, and Opportunity. Washington, DC: World Bank.
SOCIAL SAFETY NETS AND POVERTY REDUCTION, RESILIENCE, AND OPPORTUNITY 137
———. 2015. Ethiopia Poverty Assessment 2014. Report AUS6744. Washington, DC: World Bank.
Zezza, Alberto, Bénédicte de la Brière, and Benjamin Davis. 2010. “Th e Impact of SCTs on Household Economic Decision-Making and Development in Kenya and Malawi.” Paper presented at the Fift h African Economic Conference, “Setting the Agenda for Africa’s Economic Recovery and Long-Term Growth,” Tunis, October 27–29.

139
Chapter 3
Recognizing and Leveraging Politics to Expand and Sustain Social Safety NetsThomas Bossuroy and Aline Coudouel
Social policy is shaped by politics, but it also infl uences politics. Social safety nets are no exception: the political dimensions of policies need to be considered in conjunction with technical decisions.
Th e scope of social safety nets depends on political appetite, that is, acceptability and desirability, which depends on social norms and ideological factors, such as the perceived causes of poverty and the preferences for redistri-bution. Evidence on the impact of programs can be harnessed to change politi-cal appetite. Periods of rapid economic or social change off er a window of opportunity, wherein the political appetite for social safety net programs can evolve quickly. International platforms and development partners can catalyze the political support for social safety nets.
Th e choice of program and design parameters is political. Program design features, such as conditionalities, recertifi cation processes, or a productivity focus, may be important in rallying program support. Political realities may require the targeting of groups beyond the poorest to attain political support. In some cases, while a focus on specifi c geographical areas may make sense from a poverty perspective, nationwide coverage may be preferred.
Th ere is also a feedback loop: the implementation of social safety net pro-grams shapes the political environment. Politicians and citizens adjust their preferences and incentives and redefi ne their relationships as social safety net programs are implemented. Social accountability mechanisms can strengthen this political feedback loop. Grievance redress and community and benefi ciary participation can help maximize program potential by contributing to greater empowerment and voice among benefi ciaries.
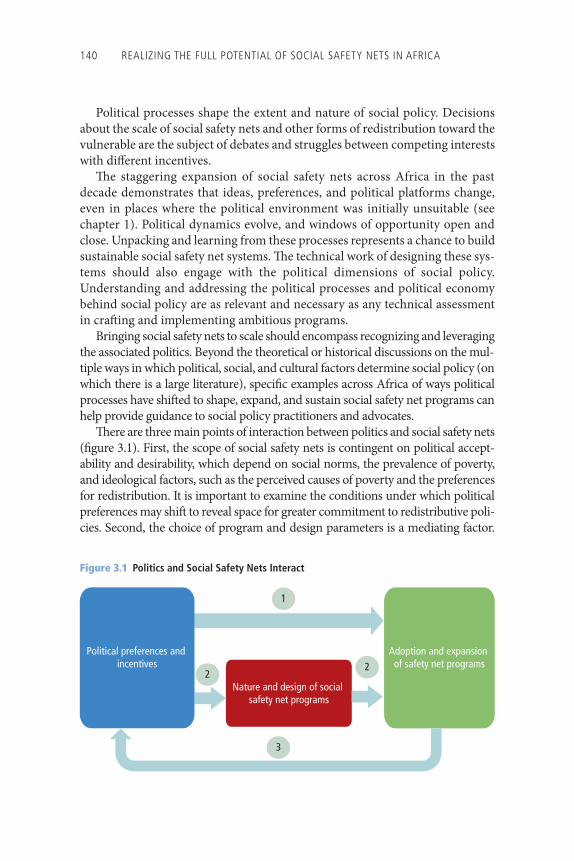
140 REALIZING THE FULL POTENTIAL OF SOCIAL SAFETY NETS IN AFRICA
Political processes shape the extent and nature of social policy. Decisions about the scale of social safety nets and other forms of redistribution toward the vulnerable are the subject of debates and struggles between competing interests with diff erent incentives.
Th e staggering expansion of social safety nets across Africa in the past decade demonstrates that ideas, preferences, and political platforms change, even in places where the political environment was initially unsuitable (see chapter 1). Political dynamics evolve, and windows of opportunity open and close. Unpacking and learning from these processes represents a chance to build sustainable social safety net systems. Th e technical work of designing these sys-tems should also engage with the political dimensions of social policy. Understanding and addressing the political processes and political economy behind social policy are as relevant and necessary as any technical assessment in craft ing and implementing ambitious programs.
Bringing social safety nets to scale should encompass recognizing and leveraging the associated politics. Beyond the theoretical or historical discussions on the mul-tiple ways in which political, social, and cultural factors determine social policy (on which there is a large literature), specifi c examples across Africa of ways political processes have shift ed to shape, expand, and sustain social safety net programs can help provide guidance to social policy practitioners and advocates.
Th ere are three main points of interaction between politics and social safety nets (fi gure 3.1). First, the scope of social safety nets is contingent on political accept-ability and desirability, which depend on social norms, the prevalence of poverty, and ideological factors, such as the perceived causes of poverty and the preferences for redistribution. It is important to examine the conditions under which political preferences may shift to reveal space for greater commitment to redistributive poli-cies. Second, the choice of program and design parameters is a mediating factor.
Figure 3.1 Politics and Social Safety Nets Interact
22
1
3
Political preferences and incentives
Nature and design of social safety net programs
Adoption and expansion of safety net programs
RECOGNIZING AND LEVERAGING POLITICS 141
Oft en infl uenced by political preferences and incentives, it may infl uence the level of commitment to social safety net programs. Th e design process should be a factor in these preferences to maximize buy-in without undermining program impacts. Th ird, there is a feedback loop. Th e implementation of social safety net programs shapes the political environment. Politicians and citizens adjust their preferences and incentives and redefi ne their relationships in the presence of social transfers.
Th e politics of social policy is oft en analyzed in terms of social contracts rather than political regimes (box 3.1). Th e adoption and expansion of social safety nets are not highly correlated with the nature of political regimes. While democratization may promote the greater participation of the poor in the politi-cal process, the voice of the poor may be distorted because of narrow electoral participation among vulnerable citizens, low expectations, limited information on government policies, vote buying or patronage, and the salient role of non-economic issues such as ethnicity or religion (Roemer 1998; van de Walle 2014; Weyland 1996). Meanwhile, because they face the threat of popular uprisings or divisions in ruling coalitions, autocratic regimes also have incentives to secure support from and stability for the majority of the population (Lavers and Hickey 2016). Understanding political commitment to the poor is not as simplistic as
BOX 3 .1
Social Contracts and Social Safety NetsA social contract involves the interplay between a society’s expectations that the state will provide services to and secure revenue from the population, backed by the will of policy makers to direct public resources and the capacity of governments to fulfi ll social expec-tations (OECD 2009; Rousseau 1968). The deployment of social safety net programs, similar to other government interventions, depends on the social contract between the government and citizens (Hickey 2011). In most African countries, the social contract is mostly founded on intragroup solidarity rather than on the government-led provision of benefi ts. Support for the poor and vulnerable is predominantly provided through private solidarity networks shaped by kinship (Hill and Verwimp 2017).
Social contracts evolve as a result of changing contexts. During the period of strong economic growth in the 2000s, social contracts in many Latin American countries changed and led to increased social spending. Public resources were used to promote education and health care spending, as well as transfers to the poorest population groups (Breceda, Rigolini, and Saavedra 2008). Social contracts also shifted rapidly in the Arab world in the early 2010s as a result of growing discontent over limited political accountability and voice from a burgeoning middle class, especially youth, whose aspirations were not being met (Silva, Levin, and Morgandi 2013; World Bank 2015).
Social safety nets have emerged in response to changing social contracts, but their existence also likely modifi es the social contract as a growing number of individuals become familiar with the programs and as the programs demonstrate effectiveness.
142 REALIZING THE FULL POTENTIAL OF SOCIAL SAFETY NETS IN AFRICA
diff erentiating between democratic and autocratic institutions, even though the progress of democracy in Africa opens space for greater representation of the interest of the poor (World Bank 2016).
Th e political economy of social safety nets in Africa is evolving, and policy has a big role to play in changing political preferences and incentives. By recog-nizing this process, stakeholders may harness rather than lament the politics of building and sustaining social safety net systems.
The Political Appetite for Adopting and Expanding Social Safety Nets
Analysis of the evolution of social safety nets in many African countries sug-gests that the appetite for the adoption or expansion of social safety net pro-grams evolves in response to three main factors: beliefs and perceptions about redistribution, a volatile socioeconomic environment and shocks, and the infl u-ence of external actors, including development and humanitarian partners.
Shape the Policy Dialogue to Change MisconceptionsPreconceived ideas on social safety nets may constitute a barrier to political buy-in and adoption. Commonly held preconceptions include the belief that the poor and recipients in social safety nets are undeserving of assistance and may become dependent on handouts and that social safety net programs do not have produc-tive impacts and are therefore a waste of public resources. Th is refl ects a general lack of understanding of social programs that, in the long run, should be addressed through the introduction of relevant curricula in tertiary education. Th us, dealing with concerns carefully in the process of policy dialogue is critical to promoting the adoption of social safety nets (box 3.2).
Th e belief that government support is likely to make people lazy and depen-dent on assistance is deep-rooted. Analysis in the United Kingdom and the United States suggests that attitudes toward people who are poor infl uence the support for programs (Alesina, Glaeser, and Sacerdote 2001; Baumberg 2014; Graham 2002). According to van Oorschot (2000, 43), “whether people in need can be blamed or can be held responsible for their neediness seems to be a general and central criterion for deservingness.” Th is holds true in Africa, too. Ideas about deserving groups have played a critical role in shaping domestic political impera-tives and have oft en proven more signifi cant than programmatic platforms or external pressure (Seekings 2015). In Zambia, for instance, the social safety net agenda was opposed most strongly by a minister of fi nance who denied the exis-tence of poverty in the country by claiming that the poor were really only lazy (Pruce and Hickey 2017). Government offi cials in Mozambique raised concerns
RECOGNIZING AND LEVERAGING POLITICS 143
BOX 3 .2
Changing Beliefs Are Part of Changing the Governance LandscapeGovernance—the process of designing and implementing policy—underlies every aspect of how countries develop and how their institutions function. However, quite often, the governance process fails to deliver. Though they are armed with national development strategies, governments may fail to adopt pro-growth or pro-poor poli-cies, or, if these are adopted, the policies may fail to achieve their intended goals. Putting governance front and center in the development debate is essential to foster-ing sustained economic growth and encouraging more equitable and peaceful societies. It is also critical to successfully bring social safety nets to scale.
Despite the sizable challenges, countries have succeeded in enhancing rules, institu-tions, and processes that have helped them approach development goals. Change occurs not only by reshaping the preferences and beliefs of the powerful, but also by altering incentives and taking into account the interests of previously excluded partici-pants, thereby increasing contestability.
The preferences and beliefs of decision makers are critical in determining whether the outcome of the bargain will enhance welfare and whether the system will be responsive to the interests of those who have less infl uence. Changes in preferences can help jump-start coordination to reach a result that is better for all. Accumulating evidence on the positive impact of social safety nets can change the views of decision makers on social safety nets.
Incentives are fundamental to encouraging commitment in the policy arena, includ-ing policies that benefi t the poor. The low quality of public services, such as schools and health centers, may prompt the more well-off to utilize private services, which weakens the willingness and the incentives of these individuals to contribute fi scally to supporting public services. Appropriate incentives can spur change: The fi rst antipov-erty programs in England and Wales in the 19th century were promoted by wealthy landed gentry who were eager to keep labor in rural areas, against the backdrop of the Industrial Revolution, which was drawing labor to the cities, as well as the threat repre-sented by the French Revolution.
Contestability—who is included or excluded from the policy arena—is determined by the relative power of actors and the barriers to entry. If the procedures for selecting and implementing policies are more contestable, the policies are perceived as fair and induce cooperation more effectively—that is, they are considered legitimate. Participation and ownership in the design of rules can also increase voluntary compli-ance. However, entrenched social norms may make the participation of poor and dis-advantaged groups in policy discussions and policy formulation more diffi cult; participants in civic activities tend to be wealthier and better educated.
Source: World Bank 2017.
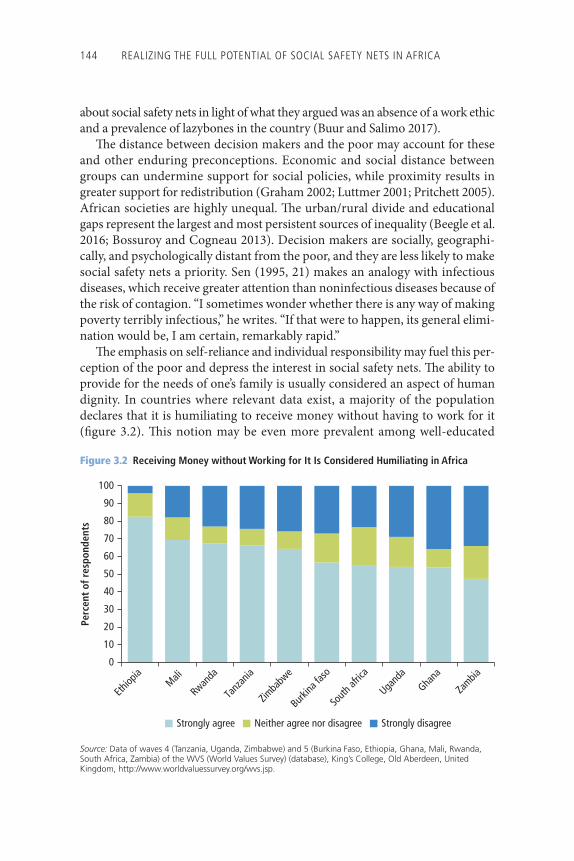
144 REALIZING THE FULL POTENTIAL OF SOCIAL SAFETY NETS IN AFRICA
about social safety nets in light of what they argued was an absence of a work ethic and a prevalence of lazybones in the country (Buur and Salimo 2017).
Th e distance between decision makers and the poor may account for these and other enduring preconceptions. Economic and social distance between groups can undermine support for social policies, while proximity results in greater support for redistribution (Graham 2002; Luttmer 2001; Pritchett 2005). African societies are highly unequal. Th e urban/rural divide and educational gaps represent the largest and most persistent sources of inequality (Beegle et al. 2016; Bossuroy and Cogneau 2013). Decision makers are socially, geographi-cally, and psychologically distant from the poor, and they are less likely to make social safety nets a priority. Sen (1995, 21) makes an analogy with infectious diseases, which receive greater attention than noninfectious diseases because of the risk of contagion. “I sometimes wonder whether there is any way of making poverty terribly infectious,” he writes. “If that were to happen, its general elimi-nation would be, I am certain, remarkably rapid.”
Th e emphasis on self-reliance and individual responsibility may fuel this per-ception of the poor and depress the interest in social safety nets. Th e ability to provide for the needs of one’s family is usually considered an aspect of human dignity. In countries where relevant data exist, a majority of the population declares that it is humiliating to receive money without having to work for it (fi gure 3.2). Th is notion may be even more prevalent among well-educated
Figure 3.2 Receiving Money without Working for It Is Considered Humiliating in Africa
Source: Data of waves 4 (Tanzania, Uganda, Zimbabwe) and 5 (Burkina Faso, Ethiopia, Ghana, Mali, Rwanda, South Africa, Zambia) of the WVS (World Values Survey) (database), King’s College, Old Aberdeen, United Kingdom, http://www.worldvaluessurvey.org/wvs.jsp.
0
10
20
30
40
50
60
70
80
90
100
Ethiop
iaMali
Rwanda
Tanz
ania
Zimba
bwe
Burkina
faso
South
afric
a
Ugand
aGha
na
Zambia
Perc
ent
of r
espo
nden
ts
Strongly agree Neither agree nor disagree Strongly disagree
RECOGNIZING AND LEVERAGING POLITICS 145
segments of the population who were trained in the fundamentals of neoclassi-cal economics, which emphasizes individual endeavor much more than the structural conditions that underpin poverty and vulnerability.
Th ere are also widespread concerns that transfers to the poor are wasted resources. Even though most social safety net programs represent a very small percentage of gross domestic product (GDP, chapters 1 and 5), governments tend to use aff ordability as an argument against adopting or expanding such programs. Th is is usually accompanied by a stated preference for investing in programs that are perceived as more productive or better aligned with the small government model, which is focused on producing public goods, fi xing market failures, and regulating free competition. Th e low-cost criterion of social safety net programs is thus associated with political, normative, and ideological fac-tors rather than simply an assessment of the available fi scal space (Seekings 2016a).
Fears of dependency on social safety nets can be partly addressed through the dissemination of rigorous evidence (see chapter 2). Th ere is growing experi-ence with the positive impact of social safety nets on a range of indicators. Th e claim that social safety nets may represent a work disincentive among benefi -ciaries has been largely disproven (Banerjee et al. 2015a, 2015b). Similarly, it has been found that benefi ciaries do not tend to use social transfers to purchase temptation goods, such as alcohol and tobacco, but rather to smooth consump-tion and raise human capital expenditures (Evans and Popova 2014; Handa et al. 2017).
Growing evidence also shows that cash transfers have productive impacts. Th ese impacts mostly become manifest through investments in human capital through greater expenditures on nutrition and education among children (Alderman and Yemtsov 2013). Social safety nets may be considered an invest-ment in future generations, with potentially large impacts on productivity and growth (Gertler et al. 2014). Th e strong productivity impacts of combinations of cash transfers and productive interventions—such as training, savings, and insurance—have been demonstrated (Argent, Augsburg, and Rasul 2014; Banerjee et al. 2015a, 2015b; Blattman, Fiala, and Martinez 2014; Premand and del Ninno 2016). Th is accumulating evidence is shift ing the policy dialogue away from the preconception that social safety nets promote an alleged culture of dependency and is helping make the case that social safety nets foster poverty reduction and economic advancement.
Th e evidence should be presented in the policy dialogue early in the design stage, with particular attention to the relevance and relatability of the programs discussed. Evidence gathered within the country or neighboring countries car-ries more weight because decision makers may question the validity of results drawn from distant contexts. Th e results of randomized controlled trials are oft en easier to convey to a nonexpert audience and may be better received if one
146 REALIZING THE FULL POTENTIAL OF SOCIAL SAFETY NETS IN AFRICA
assumes the audience has a more general background in experimental methods of evaluating social programs. Th e capacity to bring forth meaningful, contex-tualized, and robust information is a key factor in fostering evidence-based policy making.
Perceptions of social safety nets may shift dramatically following study tours and other forms of direct learning from similar programs around the world. In Ethiopia, the integration of social protection objectives in a rural development program partly drew on a 1990s study tour by government offi cials to the Maharashtra Employment Guarantee Scheme, in India, for inspiration (Lavers 2016a). Senegal’s Programme National de Bourses de Sécurité Familiale (national conditional cash transfer program) refl ects the infl uence of the Brazilian and Mexican experiences, to which a senior offi cial had been exposed in a previous position (Ndiaye 2017). Study tours by government offi cials from Kenya and Uganda to a pilot social cash transfer scheme in Zambia helped spread the model of cash transfers stripped of conditionalities (Hickey and Bukenya 2016; Pruce and Hickey 2017; Wanyama and McCord 2017). Visits to Ethiopia by government delegations from Mozambique, Rwanda, and Tanzania convinced key decision makers of the appeal of the Productive Social Safety Net (PSSN) (Buur and Salimo 2017; Lavers 2016b; Ulriksen 2016). Study tours have helped persuade some erstwhile opponents, as in the case of Uganda (Hickey and Bukenya 2016). In Mozambique, one of the key turning points in the gov-ernment’s decision to embrace social safety nets was a study tour to South Africa, where key offi cials realized that social safety nets would be a useful means of maintaining stability (Buur and Salimo 2017).
Given the importance of direct exposure to programs, pilot projects can help convince constituencies of the merits of a social safety net program. In Zambia, the main mechanism of fresh awareness has been rigorous evaluations of the eff ects of cash transfers at the pilot stage, which created a viable evidence base that civil servants could use later, once a political opening arose. In Uganda, an important factor in stimulating political support for the social safety net agenda has been the rollout of the Senior Citizens Grant Program. Th e promotion of the program as a success story through fi eld visits, media story placements, and an evaluation seems to have created suffi cient support to make the program a political reality that can no longer be challenged (Hickey and Bukenya 2016).
Th e importance of evidence and exposure to programs has stimulated the creation of groups of practitioners across countries that serve as sustainable platforms for sharing experiences and knowledge. Communities of practice on social safety nets have emerged across Africa, oft en facilitated by a development partner or an international agency. Th ey have proved meaningful and effi cient in promoting learning across programs, disseminating study results, and estab-lishing a stable regional coalition of skilled technicians and advocates.
RECOGNIZING AND LEVERAGING POLITICS 147
Carefully countering misconceptions and shift ing beliefs is critical in shap-ing the policy dialogue around social safety nets. Th ere is accumulating evi-dence that addresses the main causes of resistance, such as the notions that social safety nets may represent work disincentives and promote a culture of dependency, or that they do not have productive eff ects and should therefore be allocated a minimal share of public resources. Monitoring, disseminating the resulting evidence, and supplying direct exposure to existing social safety net programs may be fruitful in confronting misconceptions and demonstrating that social safety nets generally do not discourage, but rather promote, produc-tive behavior.
Identify Windows of Opportunity in Rapidly Changing EnvironmentsWhile transforming perceptions and priorities is a long process, crises and shocks have oft en provided momentum for the establishment of social safety net programs. Th e political appetite for social safety net programs may evolve quickly during periods of rapid economic or social change or crises (climate shocks, economic downturns, social confl icts), especially if the ruling coalition perceives the evolution as a potential threat to power. Incentives to create or strengthen social safety nets arise not only from the need to assist the vulnerable households most aff ected by the change or crises, but also from the political need to defuse the risk of political unrest and broaden support.
Th e appetite for expanding social safety nets evolves quickly during looming political crises. In Senegal, rising fuel and food prices following the 2008–09 fi nancial crisis, alongside the decline in the key peanut and fi shing economies, contributed to political demands for regime change and President Macky Sall’s emphasis on social programs following his 2012 election (Ndiaye 2017). Th e 2005 electoral crisis and subsequent large-scale urban protests in Ethiopia alerted the ruling coalition to the threat posed by urban unemployment and poverty and were a major driver of the urban PSNP launched in 2016. A second impetus emerged aft er the 2007 elections, when the program came to be viewed as a means of resolving the political crisis associated with postelection violence.
A similar political mechanism also contributes to shaping responses to humanitarian crises. Emergency responses to confl icts or famines have become the basis of sustained social safety net systems in many countries across Africa. In Ethiopia, a major food crisis in 2002–03 exposed the limitations of the pre-vailing agricultural development strategy and led to the adoption of the PSNP (Lavers 2016a). A large number of programs were launched or expanded in the wake of the food, fuel, and fi nancial crises of 2008–09. Droughts, such as in Botswana or Mauritania, and confl icts, such as in Mozambique and Sierra Leone, have spurred governments to establish emergency programs and lay the foundations of social safety net systems. Social funds, such as the social action
148 REALIZING THE FULL POTENTIAL OF SOCIAL SAFETY NETS IN AFRICA
funds in Malawi and Tanzania, were initially launched to provide community infrastructure in response to economic crises, but evolved into social safety net programs.
Similarly, major health crises have played a signifi cant role in raising interest in improving social safety nets. Th e disruption of solidarity and protection mechanisms caused by the spread of HIV/AIDS, which led to the incapacity or death of many parents, was an important driver of the establishment of social safety nets in Botswana, Kenya, Lesotho, and Zambia (Granvik 2015; Hamer 2016; Pruce and Hickey 2017; Wanyama and McCord 2017). Th e impact on family structures shaped the design of social safety net programs. Th ere was a shared emphasis on supporting the elderly, given their additional care burdens, and sometimes also orphans and vulnerable children. Rapidly expanding social safety nets involving cash transfers also formed a key pillar of the response of the government of Sierra Leone to the widespread socioeconomic impacts of the Ebola outbreak in 2014. A cash transfer program was being introduced at the time of the outbreak. Other social safety net programs were limited to labor-intensive public works. As the epidemic unfolded, the authorities became con-cerned that the disruptions in economic production and the potential for a drop-off in agricultural outputs would result in food shortages and other adverse socioeconomic impacts. In response, the rollout of the cash transfer program was accelerated and expanded to cover four times more benefi ciaries; the benefi t level was doubled; and the targeting mechanisms were rendered more agile and adapted to confront the vulnerabilities associated with the Ebola virus. Th e urgency of the situation also prompted the government to strengthen the quality of program implementation and harmonize delivery by governmen-tal and nongovernmental institutions through the adoption of standard operat-ing procedures. Th e expansion and consolidation of the program have been partially sustained since the Ebola epidemic, and the government has devoted a line to social safety nets in the domestic budget for the fi rst time.
In many cases, emergency response programs established outside the sphere of social safety nets have created the political buy-in and delivery infrastructure on which programs have been developed. Food aid programs have oft en been the foundation of social safety net programs. Social safety nets in Botswana, Ethiopia, and Zimbabwe have been built directly on long-standing emergency drought relief programs involving public works and food aid components (Chinyoka and Seekings 2016; Hamer 2016). In Mozambique, the development partner promotion of social safety nets sought to build on an existing government program, the Food Subsidy Program. In such cases, governments and development partners have leveraged the continuity in pub-lic provisioning. Th is has not only helped secure political support for new initiatives, but has also facilitated implementation by enabling programs to build on existing delivery mechanisms and administrative systems. In some
RECOGNIZING AND LEVERAGING POLITICS 149
contexts, however, strong opposition has developed between stakeholders in humanitarian responses and supporters of social safety nets, resulting in duplication.
The links between crisis response mechanisms and social safety nets are also manifest in the recent development of adaptive social protection pro-grams. These programs strive to embed mechanisms for rapidly expanding the coverage of social safety nets to include households or geographical areas as soon as they are hit by a shock, as in the multicountry Sahel Adaptive Social Protection Program launched in 2014. By building on social safety net delivery systems, these mechanisms boost the efficacy of emergency programs.
Economic reforms, which are oft en a response to shocks, may also raise the political support for social safety nets if there is an anticipated need for com-pensation among certain categories of people and more generally for garner-ing support for the reform. In Mozambique, the urban protests and riots that began in Maputo and spread across the country in 2008 and 2010 focused on the government’s removal of subsidies under pressure from development partners and the rising costs of food and fuel. Th e disturbances constituted existential threats to the Mozambique Liberation Front, the dominant politi-cal party. Th e protests provided the impetus for the adoption of social safety net policies, notably the Productive Social Action Program launched in 2013 (Buur and Salimo 2017).
Social safety nets are becoming an explicit part of macroeconomic policy reforms. In the current context of fi scal tightening, many countries are looking for ways to rationalize and target schemes more eff ectively. Terminating univer-sal subsidies—oft en regressive and expensive programs—may save public resources, but also negatively aff ects segments of the population. In Sierra Leone, the fi rst wave of a removal of subsidies in October 2016 resulted in a price rise that would be potentially harmful to the poor. Th is prompted the government and the International Monetary Fund to discuss linking any fur-ther wave of subsidy removal to additional expansion of the social safety net program. In some countries in Asia, programs have also been broadened as part of an eff ort to stimulate economic growth. Examples include the enlargement of social pension systems in China and Th ailand during the global fi nancial crisis (ADB 2009; Kidd and Damerau 2016; Suwanrada and Wesumperuma 2012).
If they are established or expanded to respond to a particular crisis or source of tension, social safety nets generally have a broader range of objectives than merely poverty reduction. In addition to providing support to the poor, pro-grams may aim at containing migration fl ows, preserving social peace, or tem-porarily mitigating the impact of a shock on population groups beyond the poor. For example, an objective of Ethiopian government policy has been to
150 REALIZING THE FULL POTENTIAL OF SOCIAL SAFETY NETS IN AFRICA
limit the rate of urban migration because of concerns that uncontrolled migration, in the absence of adequate urban employment opportunities, is likely to lead to social and political instability. Faced with a direct threat to its power, the ruling coalition attempted to use the PSNP to slow out-migration from rural areas, while augmenting the urban PSNP to provide greater incentives for peo-ple to move to or stay in small towns and cities, rather than migrate to Addis Ababa (Lavers 2013, 2016a).
Th us, because the political incentives to adopt or expand social safety nets may shift during periods of rapid change, especially if there is a perceived threat to the ruling coalition, stakeholders should monitor windows of opportunity to bring programs to scale. Th e rapid change may be caused by any one of numer-ous factors: climate stress, natural disasters, social tensions, economic crises and reforms, or political confl icts. In providing a clear rationale for direct support to populations, stakeholders may alter the incentives facing decision makers and open the space for shift s in the status quo. It is critical that the decision and policy makers involved in responding to crises or shocks have a good under-standing of the potential of social safety net systems to help achieve policy and political objectives.
Th e Role of International Platforms and PartnersRegional and global organizations in which the large majority of African countries participate provide a normative framework for social safety nets and social protection more generally. Th e growing enthusiasm for social safety nets throughout the world has resulted in initiatives such as the African Union’s Social Policy Framework, the United Nations’ Sustainable Development Goals and associated targets, and the United Nations–wide Social Protection Floor Initiative. Social safety nets fi gure prominently in the Sustainable Development Goals. Goal 1.3 calls for the implementation of “nationally appropriate social protection systems and measures for all, including fl oors” and, by 2030, the achievement of “substantial coverage of the poor and vulnerable.”1 In 2006, the African Union issued the Livingstone Call for Action on Social Protection in Africa, which notes that “the guarantee of basic social protection strengthens the social contract between the state and citizens, enhancing social cohesion” and appeals for the expansion of social transfer programs.2
Most governments have signed agreements to advance human rights, as presented in the universal declaration of human rights, among which are the right to an adequate standard of living and the right to security and protection in case of shocks. Except for Botswana, the Comoros, Mozambique, and South Sudan, all countries in the region have ratifi ed the International Covenant on Economic, Social, and Cultural Rights. As of February 2017, the African
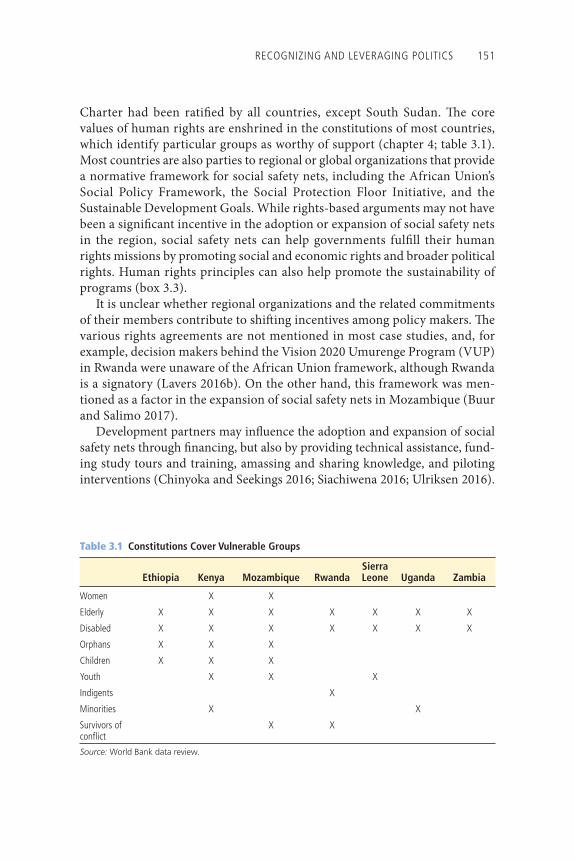
RECOGNIZING AND LEVERAGING POLITICS 151
Table 3.1 Constitutions Cover Vulnerable Groups
Ethiopia Kenya Mozambique RwandaSierra Leone Uganda Zambia
Women X X
Elderly X X X X X X X
Disabled X X X X X X X
Orphans X X X
Children X X X
Youth X X X
Indigents X
Minorities X X
Survivors of confl ict
X X
Source: World Bank data review.
Charter had been ratifi ed by all countries, except South Sudan. Th e core values of human rights are enshrined in the constitutions of most countries, which identify particular groups as worthy of support (chapter 4; table 3.1). Most countries are also parties to regional or global organizations that provide a normative framework for social safety nets, including the African Union’s Social Policy Framework, the Social Protection Floor Initiative, and the Sustainable Development Goals. While rights-based arguments may not have been a signifi cant incentive in the adoption or expansion of social safety nets in the region, social safety nets can help governments fulfi ll their human rights missions by promoting social and economic rights and broader political rights. Human rights principles can also help promote the sustainability of programs (box 3.3).
It is unclear whether regional organizations and the related commitments of their members contribute to shift ing incentives among policy makers. Th e various rights agreements are not mentioned in most case studies, and, for example, decision makers behind the Vision 2020 Umurenge Program (VUP) in Rwanda were unaware of the African Union framework, although Rwanda is a signatory (Lavers 2016b). On the other hand, this framework was men-tioned as a factor in the expansion of social safety nets in Mozambique (Buur and Salimo 2017).
Development partners may infl uence the adoption and expansion of social safety nets through fi nancing, but also by providing technical assistance, fund-ing study tours and training, amassing and sharing knowledge, and piloting interventions (Chinyoka and Seekings 2016; Siachiwena 2016; Ulriksen 2016).
152 REALIZING THE FULL POTENTIAL OF SOCIAL SAFETY NETS IN AFRICA
BOX 3 .3
Social Safety Nets and Human Rights Reinforce Each OtherSocial safety nets can help ensure the social and economic rights of the poor. They are anchored in international standards, particularly the African Charter on Human and Peoples’ Rights; the International Covenant on Economic, Social, and Cultural Rights; and the Universal Declaration of Human Rights.a Under these standards, states are obligated to work toward the realization of a series of rights, including the right to an adequate standard of living, the right to security in case of shocks, and the right to health care and education. In this framework, individuals are rights-holders who may make legitimate claims, and states and other actors are duty-bearers that are responsible and can be held accountable for acts or omissions.
Laws and covenants recognize that governments may require time to safeguard these rights among entire populations, and they provide for the progressive realization of the rights. They highlight the special importance of safeguarding the rights of the most disadvantaged and marginalized groups and prohibit retrogressive measures.
Social safety nets may be central to recognizing these rights. Indeed, in practice, many governments face challenges in reaching the poorest population groups and supplying them with basic health care, nutrition, and education services. Because they usually cover groups, including those living in remote areas, characterized by limited contact with government programs, social safety nets may offer a way for governments to bring these people into the realm of public policy and thus help the most marginalized gain access to health care, education, and markets, in addition to providing them directly with support. This underlines the need to enhance the coverage and outreach of programs among the poorest and to respect the fundamental principle of equality in service delivery: establishing interventions among the poorest that are equal in quality to services and interventions among other population groups.
Social safety nets can promote other rights among the poor and, in particular, empower the poor to participate more broadly in societies and to demand other rights. By bringing the poor into the realm of public policies, offering them benefi ts, and covering them through public services, including identifi cation systems, social safety nets may help the poorest realize other social, economic, and political rights. In small but signifi cant ways, social safety net programs not only protect the poor and vulnerable; they also build democracy from the bottom up by strengthening political rights and contributing to the achievement of social justice.
Human rights also provide guiding principles for the implementation of programs, especially through the principles of equality, participation, and accountability. The principles of equality and nondiscrimination call for designs that avoid discrimination based on criteria other than poverty or vulnerability. They also demand a proactive
(continued next page)
RECOGNIZING AND LEVERAGING POLITICS 153
Box 3.3 (continued)
approach in addressing obstacles that individuals or groups may face, for instance, by deploying outreach. Meaningful and effective participation requires an engagement with civil society in program design and implementation. Transparency and accountability can be realized only through mechanisms to promote adequate public awareness and options for expressing grievances and seeking redress. In practice, following these key principles fosters program support in civil society because the principles are fair and well understood, and failures and omissions can be challenged. This ultimately contributes to program expansion and long-term sustainability.
Source: Prepared by Eva Kloeve.Note: For a detailed discussion of relevant issues, see Sepúlveda and Nyst (2012).a. See “African Charter on Human and Peoples’ Rights,” African Commission on Human and Peoples’ Rights, Banjul, The Gambia, http://www.achpr.org/instruments/achpr/; “International Covenant on Economic, Social, and Cultural Rights,” Offi ce of the United Nations High Commissioner for Human Rights, Geneva, http://www.ohchr.org/EN/ProfessionalInterest/Pages/CESCR.aspx; “Universal Declaration of Human Rights,” United Nations, New York, http://www.un.org/en/universal-declaration-human-rights/.
Development partners fi nance an average 55 percent of program spending; the shares are typically higher in lower-income countries, fragile and confl ict-aff ected states, and nations experiencing humanitarian crises (fi gure 3.3; appendix G, table G.8). Analysis of programs in Ethiopia, Ghana, Kenya, Lesotho, Mozambique, and Zambia suggests that international development partners tend to assign weight to existing national civil society and public sector proponents of social safety nets, help strengthen institutions entrusted with the delivery of programs, and encourage the adoption of mechanisms for more transparent and accountable delivery systems (Cherrier 2015). However, the multiplicity of partners and programs with distinct agendas and priorities may also create fragmentation and prevent the formation of a coherent policy frame-work (see chapter 4).
Development partners have been shown to infl uence the policy agenda through the dissemination of high-level strategic reports and normative frameworks, along with the policy dialogue and technical assistance provided to recipient countries. In many countries, these initiatives have been critical in developing the policy frameworks and instruments for social protection that have been adopted among bureaucrats and advocates in civil and political society.
Development partner involvement alone is not sufficient to achieve a shift toward the political adoption of social safety nets, which often results from attempts to secure or expand existing power in the face of changing
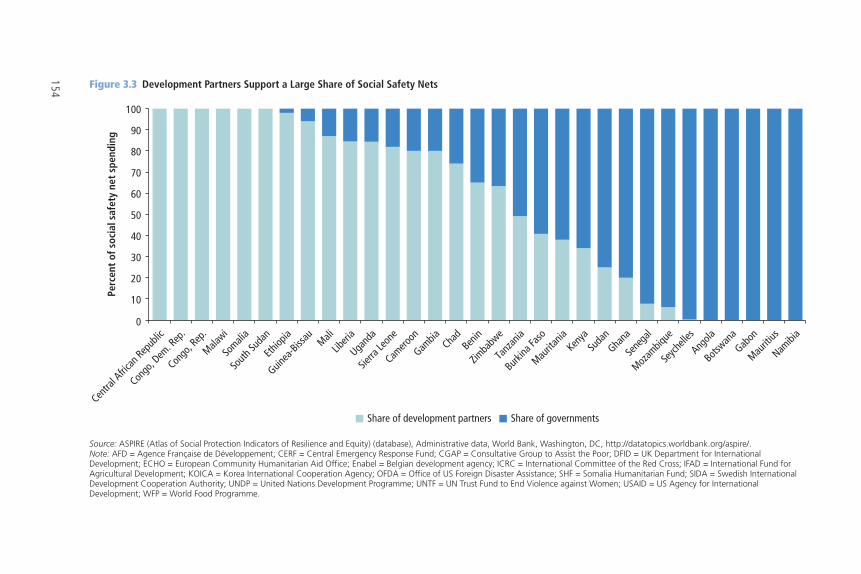
154 Figure 3.3 Development Partners Support a Large Share of Social Safety Nets
0
10
20
30
40
50
60
70
80
90
100
Centra
l Afric
an Rep
ublic
Congo
, Dem
. Rep
.Con
go, R
ep.
Malawi
Somali
aSo
uth Su
dan
Ethiop
ia
Guinea
-Bissau Mali
Liberi
aUga
nda
Sierra
Leon
eCam
eroon
Gambia Cha
dBen
inZim
babw
eTa
nzan
iaBurk
ina Fa
soMau
ritania
Kenya
Suda
nGha
naSe
nega
lMoz
ambiq
ueSe
ychell
esAng
olaBots
wana
Gabon
Mauriti
usNam
ibia
Perc
ent
of s
ocia
l saf
ety
net
spen
ding
Share of development partners Share of governments
Source: ASPIRE (Atlas of Social Protection Indicators of Resilience and Equity) (database), Administrative data, World Bank, Washington, DC, http://datatopics.worldbank.org/aspire/.Note: AFD = Agence Française de Développement; CERF = Central Emergency Response Fund; CGAP = Consultative Group to Assist the Poor; DFID = UK Department for International Development; ECHO = European Community Humanitarian Aid Office; Enabel = Belgian development agency; ICRC = International Committee of the Red Cross; IFAD = International Fund for Agricultural Development; KOICA = Korea International Cooperation Agency; OFDA = Office of US Foreign Disaster Assistance; SHF = Somalia Humanitarian Fund; SIDA = Swedish International Development Cooperation Authority; UNDP = United Nations Development Programme; UNTF = UN Trust Fund to End Violence against Women; USAID = US Agency for International Development; WFP = World Food Programme.
RECOGNIZING AND LEVERAGING POLITICS 155
circumstances (Hickey and Lavers 2017). For example, in Rwanda, the VUP originated in internal government debates over the Poverty Reduction Strategy Paper and the identification of a need for a poverty reduction program, for which the government later approached partners for support (Lavers 2016b). Similarly, in Ethiopia, various development part-ners had long voiced their concerns about the dysfunctional emergency food system constructed beginning in the 1980s and proposed a shift to cash and longer-term, predictable support. The policy agenda was set at a techni-cal level. However, only when this coincided with government concerns precipitated by a series of crises did the government begin to take develop-ment partner proposals seriously (Lavers 2016a). In Senegal, while develop-ment partners had been involved in social protection for some time, the adoption of the national conditional cash transfer program appears to have been an internal decision by the Sall administration—notably, on the rec-ommendation of a key adviser who had been exposed to the Brazilian and Mexican conditional cash transfer schemes (Ndiaye 2017). In general, deci-sions to expand social safety nets have tended to occur within broader gov-ernment strategies, even if they are largely financed by development partners (Cherrier 2015).
Program Parameters Are Political
Politics is important in program design. Program parameters must take pre-vailing preferences, incentives, and perceptions into account. Th e best designs are those that are technically sound, administratively feasible, and politically savvy as they increase political buy-in while maximizing impacts. Th e ele-ments of technical soundness and administrative feasibility are often addressed during program design, but the politically palatable aspect is fre-quently underestimated or dealt with reluctantly (Pritchett 2005). At the extreme, a perfect technical design that ignores the politics of support for social safety nets could eventually be the worst option for those it means to serve. In the words of Pritchett (2005, 5–6), policy makers who “ignored elec-toral politics would not just not do the ‘optimal’ thing for the poor, but would do the ‘pessimal’ thing for the group they were trying to protect,” as becomes clear if support for the program decreases and the budget shrinks accordingly.
Political obstacles can be overcome to some degree by, for instance, choosing the characteristics and parameters of the programs so as to factor in political preferences or adapting targeting to make it compatible with political incen-tives. However, political tweaks need to be introduced as a last resort, kept to a
156 REALIZING THE FULL POTENTIAL OF SOCIAL SAFETY NETS IN AFRICA
minimum, and mitigated by a careful focus on inclusiveness and program transparency to avoid risks of capture.
Prevailing Preferences Should Be Factored In during the Selection of ProgramsSeveral types of programs can be implemented as social safety nets, and various parameters can be included in the design. These encompass public works, cash transfers with or without conditionalities, accompanying mea-sures, program duration, and graduation criteria. Decision making about these parameters is primarily technical and is taken to maximize the antici-pated impact, but political considerations often come into play to maximize buy-in.
Among the features of programs that have a political nature are conditionali-ties. Conditionalities could be introduced with the technical motivation of boosting the impact of programs. Th ey can also be proposed to address percep-tions related to deservingness by requiring benefi ciaries to undertake extra eff orts. To promote investments in the human capital of household members, especially children, some programs condition the receipt of benefi ts on partici-pation in information sessions on good practice behaviors or on actual behav-ioral changes, such as school registration and attendance or regular visits to health care facilities. Th ese conditions, in addition to contributing to invest-ments, can help address perceptions related to deservingness by requiring ben-efi ciaries to undertake extra eff ort (see chapter 1, box 1.5).
Work requirements may help overcome concerns about the alleged laziness of transfer recipients. Labor-intensive public works are used for a range of rea-sons, including the embedded self-targeting mechanism or the need for com-munity infrastructure (see chapter 1, box 1.2). For example, in Rwanda, the VUP offi cially has two objectives: to provide support for the poorest, and to make an economic contribution by building community infrastructure (health care and education facilities and roads). But work requirements also ensure that benefi ciaries exert visible eff ort to receive benefi ts. Concerns about dependency have been dealt with in Ethiopia and Rwanda through a strong focus on public works carried out by all able-bodied benefi ciaries, while unconditional support is provided only to those benefi ciaries who cannot work.
To promote a productive impact, social safety net programs are sometimes cast as a component of a larger productive or developmental program. In several cases, complementary initiatives, such as credit and extension programs, supply a potential route toward graduation (box 3.4). Th e emphasis on self-reliance shows that social safety nets are expected to make an economic contribution or, at least, limit future government fi nancial exposure. Ethiopia’s PSNP and Rwanda’s VUP are intended to be much more than transfer programs, but are explicitly framed as rural development programs, linking protective and
RECOGNIZING AND LEVERAGING POLITICS 157
productive functions through transfers, credit, extension programs, and public works. As a result, while development partners framed the PSNP as the largest social safety net program in Africa, the government continued to describe it as a food security and agricultural program, omitting social protection entirely from national development strategies in 2006 and 2010. In Tanzania, the pro-ductive orientation of the PSSN was a major factor in convincing the govern-ment and securing political support because it linked the program to general concerns about dependency and the importance of self-reliance, an idea that goes back to Nyerere, but also to the vision of development advocated by con-temporary governments (Ulriksen 2016). Having a broader productive focus can help a larger range of stakeholders relate to programs and appreciate their value. Similarly, humanitarian interventions are increasingly complemented by resilience-building programs, which focus on helping households raise their ability to face future shocks through increased productivity and diversity in income-generating activities.
Th e fear of promoting a culture of dependency may also be addressed by including clear time bounds in social safety net programs. In some cases, ben-efi ciaries are only eligible to receive benefi ts for a fi xed period (typically between 2 and 5 years). Th e main rationale is generally that, within a restricted budget, limiting duration is a condition for expanding coverage and therefore
BOX 3 .4
Graduation in Social Safety Net ProgramsSocial safety nets are designed to support the poor and vulnerable, but usually not on a permanent basis. Ideally, as households acquire resources and improve their ability to provide for themselves, they should graduate from the programs. To complement modest transfers, programs sometimes offer expanded social safety nets to enhance livelihoods, strengthen resilience, and lift people out of poverty (Daidone et al. 2015). The graduation components often include skills training, coaching, asset transfers, and the promotion of savings, in addition to the basic cash transfers. Evidence on the impacts of pilot interventions of a graduation model in six countries shows positive results, and many programs have incorporated elements of graduation in their design (Banerjee et al. 2015a, 2015b).
The VUP in Rwanda provides an example of a coordinated graduation system. The program design allows for (a) a reduction of income poverty through direct support involving cash transfers and public works wages; (b) facilitation of access to basic services for all benefi ciary households, together with access to vocational training; and (c) streams of income generated from livelihood projects supported through fi nancial services and other means (Gahamanyi and Kettlewell 2015). Participants along each of these pathways are expected to graduate to another pathway or exit the program after receiving one or a combination of these benefi ts over a signifi cant period of time.
158 REALIZING THE FULL POTENTIAL OF SOCIAL SAFETY NETS IN AFRICA
maximizing the impact and fairness of the program. However, imposing a clear time limit has also been used as a way to reassure decision makers nervous about encouraging long-term reliance on government-provided support. For example, in 2010, a combination of these reasons led Ethiopian development strategists to adopt the very ambitious target of graduating approximately 80 percent of PSNP participants by 2015 (Lavers 2016a). Recertifi cation pro-cesses can be considered a fl exible time limitation. For instance, in Senegal, the national conditional cash transfer program covers households for fi ve years, aft er which a recertifi cation process is planned to evaluate whether households should stay in or exit the program. Recertifi cation does not automatically push benefi ciaries out of social safety nets, as in a time-bound design, but it may off er reassurance that the program is based on actual needs.
Adjust Targeting to Garner Support for Social Safety NetsPolitical preferences and incentives shape the selection criteria for social safety net benefi ciaries, and targeting methods oft en refl ect a balance between pro-grammatic and political objectives.
In many contexts, the response to concerns about deservingness and self-reliance has been to target only those who are clearly unable to provide for themselves. For instance, programs in Kenya, Uganda, and Zambia are categori-cally targeted, as well as means-tested in most cases, to focus on groups that are considered deserving of support, most notably mothers and the elderly, but also children and the disabled. While overall poverty-targeted programs account for the majority of spending in the region, most of the social safety net spending in Central Africa and West Africa goes to categorically targeted programs ( fi gure 3.4; appendix G, table G.6).
Low-income countries and fragile states also allocate a large share of spend-ing to categorically targeted programs in terms of the life-cycle. In Southern Africa and upper-middle- or high-income countries, signifi cant shares of social safety net spending go to programs focused on the elderly (fi gure 3.5; appendix G, table G.6). Central Africa, East Africa, and fragile states allocate more of their social safety net spending than other country groups to special groups through emergency interventions directed at refugees and returning migrants.
Th e need to support the most vulnerable is sometimes enshrined in legal systems. Constitutions oft en single out categorical groups as worthy of public support, rather than the poor in general (see table 3.1). Of course, programs with objectives diff erent or additional to poverty reduction warrant a categori-cal approach, for example, programs focused on children or pregnant women. And selecting benefi ciaries based on categories that are collectively perceived as vulnerable can also help in advocating for higher levels of resources dedicated to social safety nets.
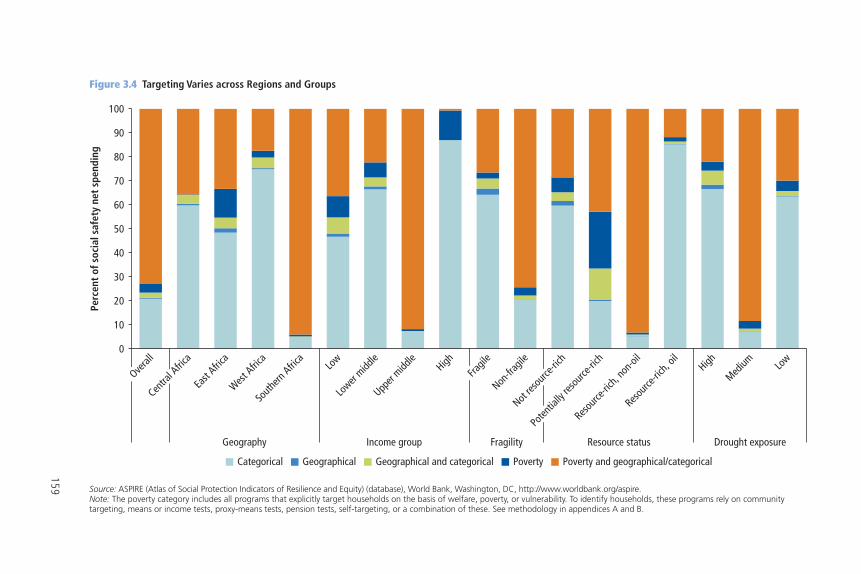
159
Figure 3.4 Targeting Varies across Regions and Groups
Source: ASPIRE (Atlas of Social Protection Indicators of Resilience and Equity) (database), World Bank, Washington, DC, http://www.worldbank.org/aspire.Note: The poverty category includes all programs that explicitly target households on the basis of welfare, poverty, or vulnerability. To identify households, these programs rely on community targeting, means or income tests, proxy-means tests, pension tests, self-targeting, or a combination of these. See methodology in appendices A and B.
Categorical Geographical PovertyGeographical and categorical Poverty and geographical/categorical
0
10
20
30
40
50
60
70
80
90
100
Overal
lCen
tral A
frica
East
Africa
West Afric
aSo
uthern
Africa
Low
Lower
middle
Upper
middle
High
Fragil
eNon
-frag
ileNot
resou
rce-ric
h
Poten
tially
reso
urce-r
ich
Resourc
e-rich
, non
-oil
Resourc
e-rich
, oil
High
Medium Lo
w
Geography Income group Fragility Resource status Drought exposure
Perc
ent
of s
ocia
l saf
ety
net
spen
ding
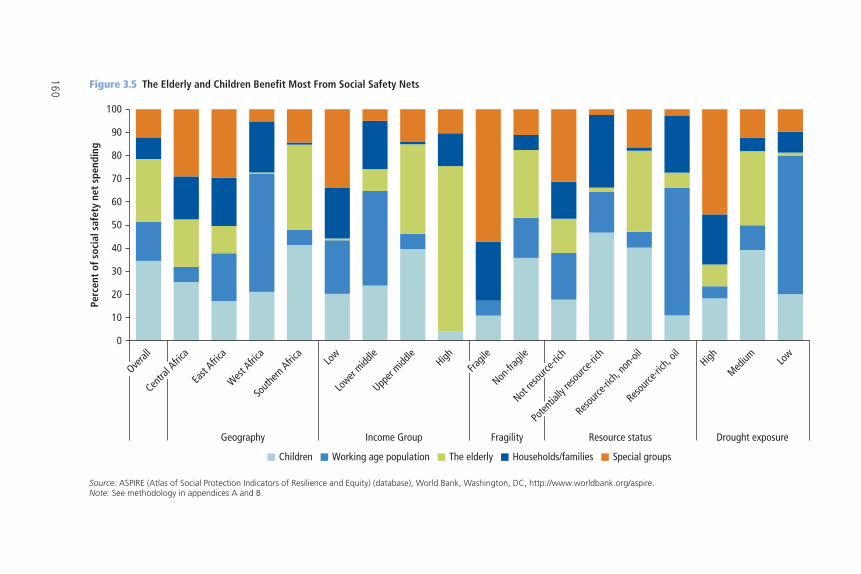
160
Children Working age population Households/familiesThe elderly Special groups
0
10
20
30
40
50
60
70
80
90
100
Overal
lCen
tral A
frica
East
Africa
West Afric
aSo
uthern
Africa
Low
Lower
middle
Upper
middle
High
Fragil
eNon
-frag
ileNot
resou
rce-ric
h
Poten
tially
reso
urce-r
ich
Resourc
e-rich
, non
-oil
Resourc
e-rich
, oil
High
Medium Lo
w
Geography Income Group Fragility Resource status Drought exposure
Perc
ent
of s
ocia
l saf
ety
net
spen
ding
Figure 3.5 The Elderly and Children Benefit Most From Social Safety Nets
Source: ASPIRE (Atlas of Social Protection Indicators of Resilience and Equity) (database), World Bank, Washington, DC, http://www.worldbank.org/aspire.Note: See methodology in appendices A and B.
RECOGNIZING AND LEVERAGING POLITICS 161
Political incentives may also lead to the targeting of groups besides the poor-est to expand support for the program. In some cases, while focusing on specifi c geographical areas would make sense from a poverty perspective, national cov-erage might be necessary to secure support (Gelbach and Pritchett 2002; Moene and Wallerstein 2001; van de Walle 1998). Th is may stem from concerns about equity and universality or the fear of alienating powerful constituents by exclud-ing them. For example, while designing a new national social protection pro-gram in 2016, the Nigerian government determined that, for political reasons, all six geographical zones had to be covered by a pilot program on productive activities, which led to an adjustment of the targeting protocol. In Kenya, the consensus reached by members of parliament was to deliver about 30 percent of all transfers to all constituencies regardless of need (in line with political incentives), while allocating the rest according to the local prevalence of poverty, thereby maintaining pro-poor targeting, while ensuring political support. In Uganda, the choice to roll out the Senior Citizen’s Grant Program by targeting the 100 eldest pensioners in new districts arguably reflects a political consideration to distribute a small transfer as widely as possible, rather than pursue a more technically informed and pro-poor design. At the end of the spectrum, universal coverage may be the preferred option if the focus is on strict equality of treatment and the avoidance of any form of exclusion. Th at is, “the benefi ciaries of thoroughly targeted poverty alleviation programs are oft en quite weak politically and may lack the clout to sustain the programs and main-tain the quality of the services off ered,” writes Sen (1995, 14). “Benefi ts meant exclusively for the poor oft en end up being poor benefi ts.”
Similarly, politically infl uential groups may receive more benefi ts than their economic situation would require. For instance, the elderly tend to be dispro-portionately supported relative to children, even though universal programs for children would have a much larger impact on poverty reduction than social pension programs (Guven and Leite 2016). Th is may be because the elderly can be relatively powerful voters, while children’s voices are not taken into account. Indeed, in Ghana, Nigeria, Rwanda, South Africa, and Zimbabwe, between 60 percent and 70 percent of individuals believe that the elderly enjoy too much political infl uence.3
Even if programs are targeted to poverty, the targeting methodology should be chosen with consideration for the consequences for voice and agency across communities. Targeting based on independent data collection, such as the proxy means test, off ers some guarantees of independence and minimizes the risks of capture, but it may be viewed negatively as an exogenous technical pro-cess with little community involvement. Conversely, community-based target-ing generally fosters ownership and buy-in by communities or local leaders, but exposes programs to risk of local capture if the program is not run properly. Beyond the various statistical properties that distinguish both methodologies,
162 REALIZING THE FULL POTENTIAL OF SOCIAL SAFETY NETS IN AFRICA
choosing to use either one or to combine them may also respond to a need to adapt to political constraints or foster buy-in among certain groups.
A Possible Trade-Off between Political and Technical ImperativesTaking political considerations into account in designing a social safety net pro-gram may result in a technically suboptimal program. In Rwanda, for example, the emphasis placed on infrastructure development has made ensuring the labor intensity of public works challenging. Indeed, faced with strong incentives to meet infrastructure targets, local offi cials have tended to resort to capital-intensive production techniques, thereby reducing the proportion of resources available to wages and favoring strong, able-bodied participants, who might not be the poorest (Lavers 2016a, 2016b). Similarly, imposing conditionalities might result in greater impact; but enforcement can be costly and resource intensive. Meanwhile, imposing time limits or predetermined targets in terms of the num-ber of households expected to graduate from a program can confl ict with the objective of poverty reduction. For instance, the decision by the Ethiopian gov-ernment to graduate a large share of PSNP benefi ciaries is said to have resulted in a signifi cant drop in PSNP enrollment aft er regional governments instructed local administrations to exit participants regardless of the state of food security (Lavers 2016a).
If political considerations inform the choice of target groups, transparency and eff ectiveness are paramount in protecting programs from capture. Th e com-peting tensions between political incentives and more technical approaches to the design of pro-poor programs are particularly evident for the issue of target-ing and the selection of benefi ciaries and districts. For example, the selection of program participants in Kenya was initially conducted by local committees and refl ected the preferences of tribal chiefs, with subsequent validation by the national social protection secretariat. Th is process has been revised subse-quently through the creation of social assistance committees as a result of demands by members of parliament to allow greater involvement in program management in their constituencies, but the number of political appointees on these new committees has triggered fears of patronage (Wanyama and McCord 2017). If this process becomes politicized, the need arises for delivery agencies to become (as far as possible) pockets of bureaucratic eff ectiveness that are not only well led and managed but are also freer of political pressures (Roll 2014).
It is therefore critical to resort to political tweaks to program design only if resistance cannot be addressed through evidence-based dialogue and to impose strict safeguards. Strengthening the foundations of programs can prevent dis-tortionary use of programs for political gain. Clear operational manuals, infor-mation campaigns, and accountability mechanisms can help promote the faithful implementation of programs. While program parameters should not be set too fi rmly, for they may require adjustment as conditions evolve, basic rights
RECOGNIZING AND LEVERAGING POLITICS 163
and principles might be institutionalized to discourage manipulation for politi-cal gain (chapter 4).
Political Impacts May Favor Social Safety Net Sustainability
Th e political environment is not an exogenous, unalterable factor that overde-termines policy choices. Politics and policies have a two-way relationship. By promoting the empowerment of their benefi ciaries and changing the way benefi ciaries relate to governments, social safety nets can shift the incentives faced by decision makers and promote program sustainability.
Social Safety Nets May Foster EmpowermentSocial safety net programs may increase power and promote autonomy among benefi ciary households. In addition to their broader impact on well-being (chapter 2), cash transfer programs enhance self-esteem among individuals. Positive impacts on psychosocial well-being lead to positive impacts on educa-tional performance, participation in social life, and empowerment for decision making. In Kenya, Mozambique, and Zambia, orphans, other vulnerable chil-dren, and disabled benefi ciaries report that the cash transfers have boosted their self-confi dence, sense of dignity, ability to be more assertive, and expectation of future well-being (Attah et al. 2016; Handa et al. 2014a, 2014b; Haushofer and Shapiro 2013; Jones et al. 2016; Seidenfeld, Handa, and Tembo 2013). However, social safety net programs can also be associated with stereotype threat or stigma because their benefi ciaries are labeled as extremely poor (Molyneux 2016). Programs can also have negative side eff ects, such as feelings of shame because of reliance on program support. Any program that requires people to be identifi ed as poor and unable to provide for themselves would, Sen (1995, 12) warns, “tend to have some eff ects on their self-respect as well as on the respect accorded them by others.”
Social safety nets may also promote greater cohesion and empowerment in recipient communities. By improving the living conditions of their benefi cia-ries, programs promote greater inclusion by reducing the stigma of helplessness among people with disabilities in Ghana, ensuring that children can go to school well dressed and clean in Lesotho and Zimbabwe, and, more generally, by raising the social status of the poorest, thereby promoting a greater willing-ness to befriend recipients of cash transfers in Malawi (Attah et al. 2016; MacAuslan and Riemenschneider 2011; Oduro 2014). Greater inclusion is also realized if benefi ciaries meet their social obligations and engage in relations of reciprocity, such as paying church tithes or funeral group fees, contributing to savings groups, and attending weddings (chapter 2; Pavanello et al. 2016).
164 REALIZING THE FULL POTENTIAL OF SOCIAL SAFETY NETS IN AFRICA
Households in Ghana, Lesotho, and Zimbabwe were able to reenter risk-sharing networks (Attah et al. 2016). Investing in these risk-sharing networks improves household social support and resilience to shocks. Cohesion and proximity increase the support of richer households for social safety net programs, thereby contributing to program sustainability.
However, the impact on social cohesion depends on the acceptability of the selection process for nonbenefi ciaries. Indeed, programs may also have negative impacts on inclusion and solidarity, for instance, if the process of selecting ben-efi ciaries is perceived as unclear or unfair or if poverty is signifi cant (Ellis 2012). In Lesotho, tensions between transfer recipients and nonrecipients grew because of a lack of knowledge about selection criteria and the perception that deserving households had been excluded from the program (Attah et al. 2016). Social safety net programs can also alter patterns of informal support within commu-nities, eroding traditional moral obligations toward the poor. In Zimbabwe, nonrecipients were more reluctant to share agricultural inputs or participate in community work to build shared assets; and in Ghana, benefi ciaries expressed fears about the consequences they would face if the program ended, in light of eroding traditional support practices (MacAuslan and Riemenschneider 2011; Oduro 2014).
Introducing social safety nets may therefore aff ect the local political economy. If the selection process is handled in a way that minimizes stereotype threats and the resentment of nonbenefi ciaries, social safety net programs may promote greater empowerment among individual benefi ciaries and greater cohesion in communities. In African countries, as elsewhere, cultural norms are not static and can be infl uenced by policies.
Shift ing the Public’s Expectations of GovernmentsSocial safety net programs can bring governments closer to benefi ciaries by showing how governments can eff ectively respond to needs. New programs can off er important entry points for shift ing interactions between governments and individuals (Jones et al. 2016). In South Africa, social safety net programs reportedly made citizens proud of their country (Plagerson, Harpham, and Kielmann 2012). Programs can shape this relationship by providing space for regular interaction between representatives of the government and individuals. In Ghana, benefi ciary forums and payment cards helped encourage a contract between the government and benefi ciaries and provided a means for benefi cia-ries to make claims and access social services (Oduro 2014). In South Africa, the affi davit required as proof of a benefi ciary’s income was considered a direct channel of communication with the government (Plagerson, Harpham, and Kielmann 2012). In Mauritania, a contract is signed between benefi ciaries and the government as households are registered, which highlights the contractual basis of the program.
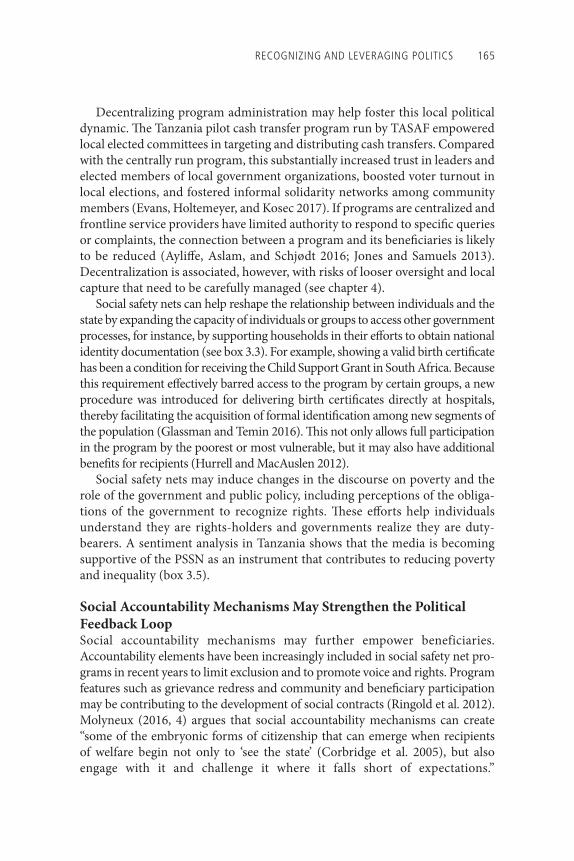
RECOGNIZING AND LEVERAGING POLITICS 165
Decentralizing program administration may help foster this local political dynamic. Th e Tanzania pilot cash transfer program run by TASAF empowered local elected committees in targeting and distributing cash transfers. Compared with the centrally run program, this substantially increased trust in leaders and elected members of local government organizations, boosted voter turnout in local elections, and fostered informal solidarity networks among community members (Evans, Holtemeyer, and Kosec 2017). If programs are centralized and frontline service providers have limited authority to respond to specifi c queries or complaints, the connection between a program and its benefi ciaries is likely to be reduced (Ayliff e, Aslam, and Schjødt 2016; Jones and Samuels 2013). Decentralization is associated, however, with risks of looser oversight and local capture that need to be carefully managed (see chapter 4).
Social safety nets can help reshape the relationship between individuals and the state by expanding the capacity of individuals or groups to access other government processes, for instance, by supporting households in their eff orts to obtain national identity documentation (see box 3.3). For example, showing a valid birth certifi cate has been a condition for receiving the Child Support Grant in South Africa. Because this requirement eff ectively barred access to the program by certain groups, a new procedure was introduced for delivering birth certifi cates directly at hospitals, thereby facilitating the acquisition of formal identifi cation among new segments of the population (Glassman and Temin 2016). Th is not only allows full participation in the program by the poorest or most vulnerable, but it may also have additional benefi ts for recipients (Hurrell and MacAuslen 2012).
Social safety nets may induce changes in the discourse on poverty and the role of the government and public policy, including perceptions of the obliga-tions of the government to recognize rights. Th ese eff orts help individuals understand they are rights-holders and governments realize they are duty- bearers. A sentiment analysis in Tanzania shows that the media is becoming supportive of the PSSN as an instrument that contributes to reducing poverty and inequality (box 3.5).
Social Accountability Mechanisms May Strengthen the Political Feedback LoopSocial accountability mechanisms may further empower beneficiaries. Accountability elements have been increasingly included in social safety net pro-grams in recent years to limit exclusion and to promote voice and rights. Program features such as grievance redress and community and benefi ciary participation may be contributing to the development of social contracts (Ringold et al. 2012). Molyneux (2016, 4) argues that social accountability mechanisms can create “some of the embryonic forms of citizenship that can emerge when recipients of welfare begin not only to ‘see the state’ (Corbridge et al. 2005), but also engage with it and challenge it where it falls short of expectations.”
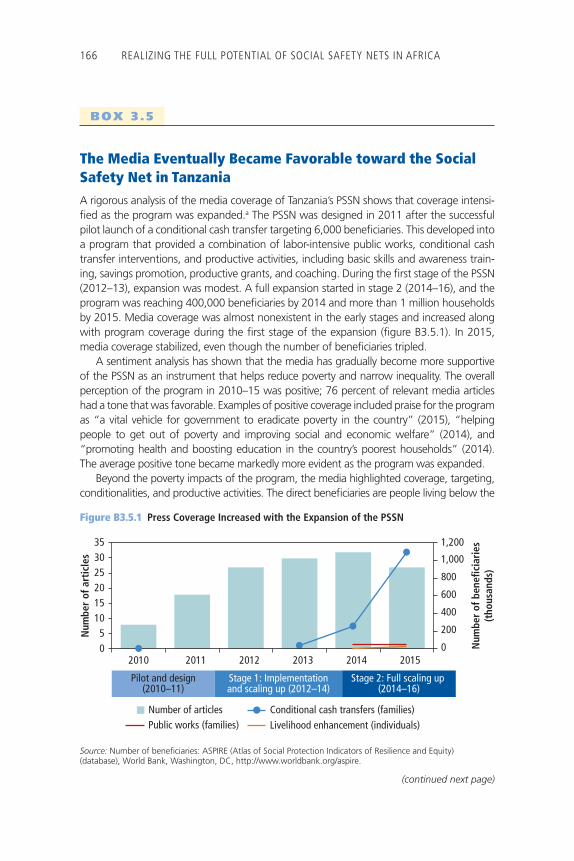
166 REALIZING THE FULL POTENTIAL OF SOCIAL SAFETY NETS IN AFRICA
BOX 3 .5
The Media Eventually Became Favorable toward the Social Safety Net in TanzaniaA rigorous analysis of the media coverage of Tanzania’s PSSN shows that coverage intensi-fi ed as the program was expanded.a The PSSN was designed in 2011 after the successful pilot launch of a conditional cash transfer targeting 6,000 benefi ciaries. This developed into a program that provided a combination of labor-intensive public works, conditional cash transfer interventions, and productive activities, including basic skills and awareness train-ing, savings promotion, productive grants, and coaching. During the fi rst stage of the PSSN (2012–13), expansion was modest. A full expansion started in stage 2 (2014–16), and the program was reaching 400,000 benefi ciaries by 2014 and more than 1 million households by 2015. Media coverage was almost nonexistent in the early stages and increased along with program coverage during the fi rst stage of the expansion (fi gure B3.5.1). In 2015, media coverage stabilized, even though the number of benefi ciaries tripled.
A sentiment analysis has shown that the media has gradually become more supportive of the PSSN as an instrument that helps reduce poverty and narrow inequality. The overall perception of the program in 2010–15 was positive; 76 percent of relevant media articles had a tone that was favorable. Examples of positive coverage included praise for the program as “a vital vehicle for government to eradicate poverty in the country” (2015), “helping people to get out of poverty and improving social and economic welfare” (2014), and “promoting health and boosting education in the country’s poorest households” (2014). The average positive tone became markedly more evident as the program was expanded.
Beyond the poverty impacts of the program, the media highlighted coverage, targeting, conditionalities, and productive activities. The direct benefi ciaries are people living below the
Figure B3.5.1 Press Coverage Increased with the Expansion of the PSSN
Source: Number of beneficiaries: ASPIRE (Atlas of Social Protection Indicators of Resilience and Equity) (database), World Bank, Washington, DC, http://www.worldbank.org/aspire.
0
200
400
600
800
1,000
1,200
05
101520253035
2010 2011 2012 2013 2014 2015
Num
ber
of b
enefi
ciar
ies
(tho
usan
ds)
Num
ber
of a
rtic
les
Number of articles Conditional cash transfers (families)Public works (families) Livelihood enhancement (individuals)
Pilot and design(2010–11)
Stage 1: Implementationand scaling up (2012–14)
Stage 2: Full scaling up (2014–16)
(continued next page)
RECOGNIZING AND LEVERAGING POLITICS 167
poverty line and people temporarily affected by short-term shocks. During the fi rst years of the program, news articles focused on the need to expand the program to “cover every poor person in the targeted areas” (2013) and expressed worry that “the poorest families tend to be left behind” (2014). In general, conditionalities and productive activities were praised as a way to motivate benefi ciaries to participate and commit to the program. For example, the program “helped poor households to engage in economic activities, thus improving their
Box 3.5 (continued)
(continued next page)
Source: The analysis was based on 142 newspaper articles published in English in 2010–15. The list of articles was built from the Factiva database using search-constructs related to PSSN and TASAF and includes articles from Arusha Times, Business Daily, Citizen, East Africa Business Week, Nation, New Times, Observer, and Tanzania Daily. However, Tanzania Daily News accounts for more than 85 percent of the articles. The sentiment analysis indicates the general perception (positive or negative) of the selected articles. It relies on a simple counting methodology of negative and positive words, the list of which is provided in the sentiment dictionary created by Hu and Liu (2004). The method assigns values of 1 to positive words and −1 to negative words. The sentiment index for every article is the normalized sum of positive and negative values. Words such as “poverty” and “poor” that are included in the Hu and Liu negative words list, but do not have this connotation in the context of social safety net programs, have been excluded. For the database, see Factiva (database), Dow Jones and Company, New York, https://www.dowjones.com/products/factiva/.
Figure B3.5.2 The Media Became More Favorable during Program Expansion
Q1 Q2 Q3 Q4 Q1 Q2 Q3 Q4 Q1 Q2 Q3 Q4 Q1 Q2 Q3 Q4 Q1 Q2 Q3 Q4 Q1 Q2 Q3 Q4
2010 2011 2012 2013 2014 2015
Med
ian
sent
imen
t ind
ex
Quarterly index Yearly index
PSSN scaled up (2013–15)Pilot and design (2010–12)
Mor
e Po
sitiv
e vi
ew o
f PSS
N
General Election
Local Electi-
on
General Election
168 REALIZING THE FULL POTENTIAL OF SOCIAL SAFETY NETS IN AFRICA
welfare” and “helped to improve academic performance of children from poor households” through an “increase in school enrollment” (2013). Several news outlets examined the grad-uation strategy and urged benefi ciaries to make proper use of the training and resources supplied through the program to establish income-generating activities, thereby linking the impacts of the program to the values of self-reliance. It was claimed that the program had been “requested by poor households . . . to provide them with training on entrepreneurship and fi nancial management so they would be self-dependent” (2014).
In line with international experience, press coverage of the program was infl uenced by elections (fi gure B3.5.2). In the run-up to the 2010 and 2015 general elections, the media emphasized the president’s achievements during his term. The positive perception of the PSSN rose initially, but decreased as the election drew closer. As in the case for similar programs elsewhere, including in Latin America, some media articles raised ques-tions about the perceived political use of the PSSN before elections. For instance, by the end of 2014, news articles were reporting that “politicians have been warned to stop utilizing the projects implemented under the Tanzania Social Action Fund (TASAF) pro-grams for their political advantages” (2014). Although these reports were not substanti-ated, and whether the incumbent party or the opposition was seeking to benefi t is unclear, the evidence demonstrates the potential for the politicization of cash transfers.
Box 3.5 (continued)
Th ey can stimulate a greater awareness of entitlement and encourage the capacity to make claims (Harland 2014). Osofi an (2011), for instance, fi nds that the Hunger Safety Net Program (HSNP) in northern Kenya, which includes a grievance mech-anism and a rights education component, has helped communities hold local gov-ernment to account. In Sierra Leone, confi dence in the social safety net program has reportedly been greatly enhanced since the independent Anticorruption Commission began handling grievance redress and audits and using technology to shorten the response time.
Social accountability may not function equally in all programs or for all types of benefi ciaries. Social accountability mechanisms tend to be deployed most eff ec-tively by better-educated, wealthier, and more able-bodied citizens rather than poorer and more vulnerable groups with less capacity to organize and voice their concerns (Giannozzi and Khan 2011; King and Hickey 2017). Th e low political mobilization around the HSNP may be attributed to the fact that benefi ciaries were mostly nomadic pastoralists in northern Kenya, a marginalized group “that has tended to stay outside most domestic politics and has little leverage to make large demands” (Hurrell and MacAuslan 2012, 268). Th e poor might also not be part of networks that are critical to distribute information and convey concerns or may have limited agency to raise their concerns (Grandvoinnet, Aslam, and Raha 2015). Programs that are time bound also likely limit the development of a broader sense of rights and entitlement to benefi ts.
RECOGNIZING AND LEVERAGING POLITICS 169
Th e design of appropriate social accountability mechanisms is therefore cru-cial to maximizing programs’ potential. Th e composition of oversight commit-tees appears to be an infl uential determinant of the eff ectiveness and impact on benefi ciaries. Grievance or redress offi ces must therefore be independent of the program implementation system so they can rectify errors rather than strengthen the position of program offi cers (Hurrell and MacAuslan 2012). Social accountability mechanisms may have greater potential if programs facili-tate the formation of groups of benefi ciaries that can leverage collective action, despite the private nature of the good involved and the individual level of targeting. Eff orts to broaden bottom-up accountability mechanisms might be reinforced through stronger incentives for frontline providers (hierarchical dis-cipline associated with top-down governance) (Brett 2003).
Social accountability mechanisms may require time to deliver impacts on power relationships. At early stages, the eff ectiveness of social accountability mechanisms in Africa is likely to be infl uenced by local power dynamics and social norms (Tembo 2012). It takes signifi cant time to build an environment that promotes voice and accountability, and progress is not linear (Grandvoinnet, Aslam, and Raha 2015). In settings where patron-client relations are pervasive, maintaining good relations with powerful individuals is the rational choice for the poor (Cornwall, Robins, and Von Lieres 2011). Social accountability mecha-nisms in social safety nets in Zambia have so far not challenged patron-client networks, although this may partly refl ect the weak eff ort to incorporate such mechanisms within the cash transfer program there (Harland 2014).
Even if their impact is mostly felt in the longer term, feedback loops may be criti-cal at the outset of a program. Indeed, much of the institutionalist literature argues that policy feedback may be particularly infl uential at nascent stages of social policy development in establishing patterns of path dependence (Pierson 1993).
Closing the Loop: Th e Risks and Opportunities of PoliticizationIntroducing or expanding social safety nets aff ects the relationship between the poor and vulnerable and their government. It also modifi es incentives among politicians. Evidence is building that direct support for the poor can become a signifi cant topic in electoral processes and the focus of the campaigns of com-peting parties or candidates. Because of the growing number of closely fought elections across Africa, the ground is becoming more fertile.
Indeed, social safety net programs may be adopted or expanded to strengthen electoral support. Th ere is some evidence that elections have helped catalyze a policy focus on social safety nets, such as the correlation between the 2002 and 2007 elections and spikes in social safety net expenditures in Kenya or the intro-duction of the Livelihood Empowerment against Poverty Program (LEAP) before the 2008 elections in Ghana. In Botswana, the Ipelegeng Public Works Program was used specifi cally to extend rural drought relief programs to urban
170 REALIZING THE FULL POTENTIAL OF SOCIAL SAFETY NETS IN AFRICA
areas where opposition support had been growing (Hamer 2016). In Uganda, pilot initiatives and the subsequent rollout of social safety nets have been shaped by the need of the ruling National Resistance Movement to secure support in the previously opposition-leaning north, especially in the run-up to the 2016 elections (Hickey and Bukenya 2016). In Senegal, President Abdoulaye Wade proposed the Plan Sésame the year before elections in 2007, which may have contributed to his electoral victory, though the plan failed to materialize in the absence of funding and sustained political commitment (Ndiaye 2017).
Th e political appetite for expanding social safety nets may also derive from more local governments and local politicians. Pressure from local members of parliament to expand programs in their districts suggests that they realize the potential rewards that could be produced through social safety net programs. For instance, in Kenya and Zambia, there has been pressure from members of parliament to expand small-scale pilot initiatives to new districts as a result of positive perceptions about the programs and the sense that political benefi ts can be gained from delivering pro-grams to communities (Pruce and Hickey 2017; Wanyama and McCord 2017).
As they gain prominence and visibility, social safety nets become more central as a topic for political branding and electoral campaigns. In many cases, individual leaders seek to become associated with particular programs. Prime Minister Bethuel Pakalitha Mosisili was a key fi gure pushing for the adoption of the Old-Age Pension in Lesotho, to the point that pensioners regularly talked of collecting their Mosisili (Granvik 2015). Similarly, President Ian Khama of Botswana portrayed expanded public employment programs as his direct contribution, leading to the frequent reference to “our father’s programs” (Hamer 2016). To some degree, this mirrors the common reference to the VUP in Rwanda as a gift from President Paul Kagame.
Social safety nets have become an integral part of political debate and electoral promises. In competitive settings, such as Malawi and Sierra Leone, social safety net programs have been used by some presidential candidates as a brand to help diff erentiate themselves from political rivals during election campaigns (Albrecht 2017; Hamer 2016). In Lesotho, the Old-Age Pension became an electoral issue in 2007, when the main opposition party pledged to raise the monthly payment by a factor of more than three. Ultimately, the incumbent won the election, poten-tially partly as a result of the introduction of the pension; but, in the process, the opposition also increased support for the program, helping to consolidate the program’s sustainability (Devereux and White 2010; Granvik 2015).
Voters tend to reward politicians for social safety net programs if these are well implemented. Evidence on the eff ect of social safety nets on voting behav-ior and electoral outcomes is derived mostly from large-scale cash transfer pro-grams in Asia and Latin America (box 3.6). At the national level, electoral benefi ts generally extend to members of the incumbent party. Impacts are last-ing, but eventually taper off . Voters typically reward incumbent parties, rather than the parties that initiated the programs, suggesting that adopting and
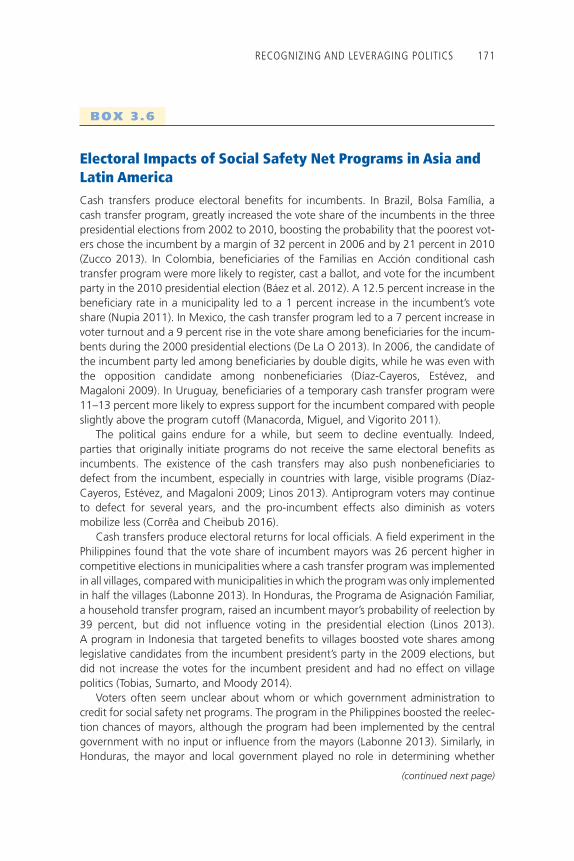
RECOGNIZING AND LEVERAGING POLITICS 171
BOX 3 .6
Electoral Impacts of Social Safety Net Programs in Asia and Latin AmericaCash transfers produce electoral benefi ts for incumbents. In Brazil, Bolsa Família, a cash transfer program, greatly increased the vote share of the incumbents in the three presidential elections from 2002 to 2010, boosting the probability that the poorest vot-ers chose the incumbent by a margin of 32 percent in 2006 and by 21 percent in 2010 (Zucco 2013). In Colombia, benefi ciaries of the Familias en Acción conditional cash transfer program were more likely to register, cast a ballot, and vote for the incumbent party in the 2010 presidential election (Báez et al. 2012). A 12.5 percent increase in the benefi ciary rate in a municipality led to a 1 percent increase in the incumbent’s vote share (Nupia 2011). In Mexico, the cash transfer program led to a 7 percent increase in voter turnout and a 9 percent rise in the vote share among benefi ciaries for the incum-bents during the 2000 presidential elections (De La O 2013). In 2006, the candidate of the incumbent party led among benefi ciaries by double digits, while he was even with the opposition candidate among nonbenefi ciaries (Díaz-Cayeros, Estévez, and Magaloni 2009). In Uruguay, benefi ciaries of a temporary cash transfer program were 11–13 percent more likely to express support for the incumbent compared with people slightly above the program cutoff (Manacorda, Miguel, and Vigorito 2011).
The political gains endure for a while, but seem to decline eventually. Indeed, parties that originally initiate programs do not receive the same electoral benefi ts as incumbents. The existence of the cash transfers may also push nonbenefi ciaries to defect from the incumbent, especially in countries with large, visible programs (Díaz-Cayeros, Estévez, and Magaloni 2009; Linos 2013). Antiprogram voters may continue to defect for several years, and the pro-incumbent effects also diminish as voters mobilize less (Corrêa and Cheibub 2016).
Cash transfers produce electoral returns for local offi cials. A fi eld experiment in the Philippines found that the vote share of incumbent mayors was 26 percent higher in competitive elections in municipalities where a cash transfer program was implemented in all villages, compared with municipalities in which the program was only implemented in half the villages (Labonne 2013). In Honduras, the Programa de Asignación Familiar, a household transfer program, raised an incumbent mayor’s probability of reelection by 39 percent, but did not infl uence voting in the presidential election (Linos 2013). A program in Indonesia that targeted benefi ts to villages boosted vote shares among legislative candidates from the incumbent president’s party in the 2009 elections, but did not increase the votes for the incumbent president and had no effect on village politics (Tobias, Sumarto, and Moody 2014).
Voters often seem unclear about whom or which government administration to credit for social safety net programs. The program in the Philippines boosted the reelec-tion chances of mayors, although the program had been implemented by the central government with no input or infl uence from the mayors (Labonne 2013). Similarly, in Honduras, the mayor and local government played no role in determining whether
(continued next page)
172 REALIZING THE FULL POTENTIAL OF SOCIAL SAFETY NETS IN AFRICA
municipalities were selected for the cash transfer program (Linos 2013). A state-level program in Brazil signifi cantly increased support for incumbent mayors (Corrêa 2015). In Uruguay, however, benefi ciaries seemed able to differentiate between government entities, showing greater approval only for institutions that supported their cash trans-fers (Manacorda, Miguel, and Vigorito 2011).
Source: Based on a literature review by Jennifer Turner.
Box 3.6 (continued)
supporting the expansion of the programs of the previous government can gen-erate political rewards. In the Latin American and Asian studies, local leaders also seem to benefi t, even from nationwide programs. Electoral returns are reported among local offi cials, sometimes in place of the returns for the elected national offi cials, as voters oft en seem unclear about whom to credit for social safety net programs. Th is support does not stop newly elected offi cials from holding the government accountable for poor performance (Pavão 2016).
Th e higher the political stakes, the more program manipulation and cap-ture become attractive. As programs increase in the potential to help secure political support, they begin to fall into the grey area between promising to satisfy the demands of the electorate and vote buying (box 3.7). Th is can encourage the targeting of programs on the basis of patronage rather than need (Lippert-Rasmussen 2011; Stokes 2007). For instance, in Uganda and Zambia, programs that were once relatively well protected are now reportedly being politicized because members of parliament are pressuring technocrats to include their districts in the rollout. Targeting could also be manipulated to reward supporters of a political party and punish opponents.
A strict respect for the guiding principles of human rights, equity, and clear and transparent operating procedures is paramount in avoiding any suspicion of politi-cally motivated fraud or abuse. Th e Benin government pushed for the highly decen-tralized delivery of benefi ts under the Youth Employment Project, including a cash grant. Nationwide, mayors and local elected offi cials actively mobilized their ser-vices and were keen to showcase participation to their constituencies in the hope that this would reap electoral and political benefi ts. To avoid the associated risks of clientelism, the government decided to organize a transparent, random selection of benefi ciaries. Scratch cards showing random numbers were handed out to each applicant at the time of registration, and benefi ciaries were drawn aft er the end of the registration process through a high-profi le public lottery broadcast on national television. Th is process protected the project from any accusation of fraud and eased the pressure on mayors, most of whom expressed relief because they were thus also being protected from local demands for patronage.
RECOGNIZING AND LEVERAGING POLITICS 173
BOX 3 .7
Distinguishing Electoral Accountability and Clientelism in Theory and PracticePoliticians who make promises about the policies and programs they will support once in offi ce are a given of democratic electoral competition. The promises provide voters with information to evaluate the platforms of the various parties and decide how they will vote, but they also enable voters to hold politicians to account for success or failure in delivering on their promises. A functioning competitive democracy depends on the aspiration of politicians to reap electoral benefi t by enacting programs that enhance the welfare of their constituencies.
Clientelism is different. While voter mobilization involves politicians promising and then delivering goods to gain and retain support, regardless of whether the support comes from individuals who voted for the candidate, political clientelism involves an unequal exchange, whereby the patron trades the distribution of money or other resources for votes and other kinds of support (Kitschelt 2000; Stokes 2007; van de Walle 2007). The fundamental difference between the two is whether the promises and provision of support are impersonal or personal.
Political clientelism and vote buying are problematic for two main reasons. First, patronage can undermine democratic processes by enabling political elites to secure the political support of the poor, who are likely to be willing to sell their votes at a lower price, while ignoring the interests of the poor (Stokes 2007). Second, social protection benefi ts delivered as patronage would be distributed based on the political importance rather than the needs of would-be recipients and would therefore likely undermine the objectives of the program.
Individual vote buying is rendered diffi cult by secret ballots, which limit the ability of political parties to monitor individual votes effectively. Argentina’s Peronist party strove to assess individual votes indirectly through the deployment of local agents to monitor people’s attendance at party events or at the polls, but this requires a capacity and manpower that the majority of political parties in Africa lack (Stokes 2007; van de Walle 2014). Moreover, the design of cash transfer programs, which increasingly rely on electronic transfers (rather than programs handing cash directly) and contain oversight mechanisms, present logistical challenges to the use of social safety nets to promote clientelism.
However, in practice, there is a grey area between electoral accountability and vote buying (Lippert-Rasmussen 2011; Stokes 2007). Political parties may reward or punish entire communities based on aggregate votes within a particular district. In some cases, the promises of candidates and the distribution of resources may be viewed as a gift of munifi cence or legislative pork (van de Walle 2007). In contexts in which patronage is deeply embedded in social and political relations, the distribution of benefi ts, though not strictly conditional, may be interpreted by recipients as an obligation to provide political support.
174 REALIZING THE FULL POTENTIAL OF SOCIAL SAFETY NETS IN AFRICA
Once they are expanded suffi ciently and have demonstrated their value, pro-grams create long-term commitments that are politically diffi cult to discon-tinue. In Brazil, Colombia, and Mexico, for instance, programs have been established for more than a decade and have demonstrated their impacts. Th ey have progressively been adopted by parties across the board, even if each new administration typically adjusts the program to refl ect changes in focus on par-ticular policies or approaches to poverty reduction, oft en altering the name of the intervention, while maintaining core features. Th us, in the 2006 Brazilian elections, the four main presidential candidates, despite the great diff erences in their political persuasions, all called for expanding Bolsa Família, which occurred. During the following election, no major candidate called for eliminat-ing the program (Zucco 2013).
Notes
1. See “Sustainable Development Goals: 17 Goals to Transform Our World,” United Nations, New York, http://www.un.org/sustainabledevelopment/.
2. See “Zambia: Social Protection Conference Issues Call to Action,” Pambazuka News, April 12, 2006, https://www.pambazuka.org/resources/zambia-social-protection -conference-issues-call-action.
3. WVS (World Values Survey), Wave 6 (2010–2014) (database), King’s College, Old Aberdeen, United Kingdom, http://www.worldvaluessurvey.org/WVSDocumentation WV6.jsp.
References
ADB (Asian Development Bank). 2009. “Reforming the Rural Pension System in the People’s Republic of China.” Social Protection Project Brief, ADB, Manila.
Albrecht, Peter. 2017. “Th e Political Economy of Social Protection in Sierra Leone.” Background paper for Realizing the Full Potential of Social Safety Nets in Africa, edited by Kathleen Beegle, Aline Coudouel, and Emma Monsalve. Washington, DC: World Bank.
Alderman, Harold, and Ruslan Yemtsov. 2013. “How Can Social Safety Nets Contribute to Economic Growth?” Policy Research Working Paper 6437, World Bank, Washington, DC.
Alesina, Alberto F., Edward Glaeser, and Bruce I. Sacerdote. 2011. “Why Doesn’t the United States Have a European-Style Welfare State?” Brookings Papers on Economic Activity 2: 187–254.
Argent, Jonathan, Britta Augsburg, and Imran Rasul. 2014. “Livestock Asset Transfers with and without Training: Evidence from Rwanda.” Journal of Economic Behavior and Organization 108: 19–39.
RECOGNIZING AND LEVERAGING POLITICS 175
Attah, Ramlatu, Valentina Barca, Andrew Kardan, Ian MacAuslan, Fred Merttens, and Luca Pellerano. 2016. “Can Social Protection Aff ect Psychosocial Wellbeing and Why Does Th is Matter? Lessons from Cash Transfers in Sub-Saharan Africa.” Journal of Development Studies 52 (8): 1115–31.
Ayliff e, Tamsin, Ghazia Aslam, and Rasmus Schjødt. 2016. “Social Accountability in the Delivery of Social Protection: Literature Review.” Working Paper, Development Pathways, Orpington, UK.
Báez, Javier E., Adriana Camacho, Emily Conover, and Román A. Zárate. 2012. “Conditional Cash Transfers, Political Participation, and Voting Behavior.” Policy Research Working Paper 6215, World Bank, Washington, DC.
Banerjee, Abhijit, Esther Dufl o, Nathanael Goldberg, Dean Karlan, Robert Osei, William Parienté, Jeremy Shapiro, Bram Th uysbaert, and Christopher Udry. 2015a. “A Multifaceted Program Causes Lasting Progress for the Very Poor: Evidence from Six Countries.” Science 348 (6236): 772–89.
Banerjee, Abhijit, Rema Hanna, Gabriel Kreindler and Benjamin A. Olken. 2015b. “Debunking the Stereotype of the Lazy Welfare Recipient: Evidence from Cash Transfer Programs Worldwide.” HKS Faculty Working Paper 076, Harvard Kennedy School, Cambridge, MA.
Baumberg, Ben. 2014. “Benefi ts and the Cost of Living: Pressures on the Cost of Living and Attitudes to Benefi t Claiming.” In British Social Attitudes: Th e 31st Report, edited by Alison Park, Caroline Bryson, and John Curtice, 95–122. London: NatCen Social Research.
Beegle, Kathleen, Luc Christiaensen, Andrew Dabalen, and Isis Gaddis. 2016. Poverty in a Rising Africa. Africa Poverty Report. Washington, DC: World Bank.
Blattman, Christopher, Nathan Vincent Fiala, and Sebastian Martinez. 2014. “Generating Skilled Self-Employment in Developing Countries: Experimental Evidence from Uganda.” Quarterly Journal of Economics 129 (2): 697–752.
Bossuroy, Th omas, and Denis Cogneau. 2013. “Social Mobility in Five African Countries.” Review of Income and Wealth 59 (S1): S84–S110.
Breceda, Karla, Jamele Rigolini, and Jaime Saavedra. 2008. “Latin America and the Social Contract: Patterns of Social Spending and Taxation.” Policy Research Working Paper 4604, World Bank, Washington, DC.
Brett, E. A. 2003. “Participation and Accountability in Development Management.” Journal of Development Studies 40 (2): 1–29.
Buur, Lars, and Padil Salimo. 2017. “Th e Political Economy of Social Protection in Mozambique.” Background paper for Realizing the Full Potential of Social Safety Nets in Africa, edited by Kathleen Beegle, Aline Coudouel, and Emma Monsalve. Washington, DC: World Bank.
Cherrier, Cécile. 2015. “Examining the Catalytic Eff ect of Aid on Domestic Resource Mobilization for Social Transfers in Low-Income Countries.” UNRISD Working Paper 2015–3 (February), United Nations Research Institute for Social Development, Geneva.
Chinyoka, Isaac, and Jeremy Seekings. 2016. “Social Policy Reform under the Government of National Unity in Zimbabwe, 2009–13.” CSSR Working Paper 373 (April), Centre for Social Science Research, University of Cape Town, Cape Town.
176 REALIZING THE FULL POTENTIAL OF SOCIAL SAFETY NETS IN AFRICA
Corbridge, Stuart, Glyn Williams, Manoj Srivastava, and René Véron. 2005. Seeing the State: Governance and Governmentality in India. Cambridge: Cambridge University Press.
Cornwall, Andrea, Steven Robins, and Bettina Von Lieres. 2011. “States of Citizenship: Contexts and Cultures of Public Engagement and Citizen Action.” IDS Working Paper 363 (March), Institute of Development Studies, University of Sussex, Brighton, UK.
Corrêa, Diego Sanches. 2015. “Cash Transfers and Mayoral Elections: Th e Case of Sao Paulo’s Renda Mí nima.” Brazilian Political Science Review 9 (2): 109–20.
Corrêa, Diego Sanches, and José Antonio Cheibub. 2016. “Th e Anti-Incumbent Eff ects of Conditional Cash Transfer Programs.” Latin American Politics and Society 58 (1): 49–71.
Daidone, Silvio, Luca Pellerano, Sudhanshu Handa, and Benjamin Davis. 2015. “Is Graduation from Social Safety Nets Possible? Evidence from Sub-Saharan Africa.” IDS Bulletin 46 (2): 93–102.
De La O, Ana L. 2013. “Do Conditional Cash Transfers Aff ect Electoral Behavior? Evidence from a Randomized Experiment in Mexico.” American Journal of Political Science 57 (1): 1–14.
Devereux, Stephen, and Philip White. 2010. “Social Protection in Africa: Evidence, Politics, and Rights.” Poverty and Public Policy 2 (3): 53–77.
Díaz-Cayeros, Alberto, Federico Estévez, and Beatriz Magaloni. 2009. “Welfare Benefi ts, Canvassing, and Campaign Handouts.” In Consolidating Mexico’s Democracy: Th e 2006 Presidential Campaign in Comparative Perspective, edited by Jorge I. Domínguez, Chappell Lawson, and Alejandro Moreno, 229–45. Baltimore: Johns Hopkins University Press.
Ellis, Frank. 2012. “‘We Are All Poor Here’: Economic Diff erence, Social Divisiveness, and Targeting Cash Transfers in Sub-Saharan Africa.” Journal of Development Studies 48 (2): 201–14.
Evans, David K., Brian Holtemeyer, and Katrina Kosec. 2017. “If You Give It, Trust Will Come: Th e Impacts of Community-Managed Cash Transfers in Tanzania.” Working paper, Development Strategy and Governance Division, International Food Policy Research Institute, Washington, DC.
Evans, David K., and Anna Popova. 2014. “Cash Transfers and Temptation Goods: A Review of Global Evidence.” Policy Research Working Paper 6886, World Bank, Washington, DC.
Gahamanyi, Vincent, and Andrew Kettlewell. 2015. “Evaluating Graduation: Insights from the Vision 2020 Umurenge Programme in Rwanda.” IDS Bulletin 46 (2): 48–63.
Gelbach, Jonah B., and Lant Pritchett. 2002. “Is More for the Poor Less for the Poor? Th e Politics of Means-Tested Targeting.” B.E. Journal of Economic Analysis and Policy 2 (1): 1–28.
Gertler, Paul J., James J. Heckman, Rodrigo Pinto, Arianna Zanolini, Christel Vermeersch, Susan P. Walker, Susan M. Chang, and Sally M. Grantham-McGregor. 2014. “Labor Market Returns to an Early Childhood Stimulation Intervention in Jamaica.” Science 344 (6187): 998–1001.
Giannozzi, Sara, and Asmeen Khan. 2011. “Strengthening Governance of Social Safety Nets in East Asia.” Social Protection Discussion Paper 1116, World Bank, Washington, DC.
RECOGNIZING AND LEVERAGING POLITICS 177
Glassman, Amanda, and Miriam Temin. 2016. Millions Saved: New Cases of Proven Success in Global Health. Washington, DC: Center for Global Development and Brookings Institution Press.
Graham, Carol. 2002. “Public Attitudes Matter: A Conceptual Frame for Accounting for Political Economy in Social Safety Nets and Social Assistance Policies.” Social Protection Discussion Paper 0233, World Bank, Washington, DC.
Grandvoinnet, Helene, Ghazia Aslam, and Shomikho Raha. 2015. Opening the Black Box: Th e Contextual Drivers of Social Accountability. New Frontiers of Social Policy Series. Washington, DC: World Bank.
Granvik, Mia. 2015. “Policy Diff usion, Domestic Politics, and Social Protection in Lesotho, 1998–2012.” CSSR Working Paper 357, Centre for Social Science Research, University of Cape Town, Cape Town.
Guven, Melis U., and Phillippe G. Leite. 2016. “Benefi ts and Costs of Social Pensions in Sub-Saharan Africa.” Social Protection and Labor Discussion Paper 1607, World Bank, Washington, DC.
Hamer, Sam. 2016. “‘Our Father’s Programmes’: Political Branding around Social Protection in Botswana, 2008–2014.” CSSR Working Paper 370, Centre for Social Science Research, University of Cape Town, Cape Town.
Handa, Sudhanshu, Silvio Daidone, Amber Peterman, Benjamin Davis, Audrey Pereira, Tia Palermo, and Jennifer Yablonski. 2017. “Myth Busting? Confronting Six Common Perceptions about Unconditional Cash Transfers as a Poverty Reduction Strategy in Africa.” Innocenti Working Paper 2017–11, Offi ce of Research, United Nations Children’s Fund, Florence.
Handa, Sudhanshu, Bruno Martorano, Carolyn Tucker Halpern, Audrey Pettifor, and Harsha Th irumurthy. 2014a. “Th e Government of Kenya’s Cash Transfer Program Reduces the Risk of Sexual Debut among Young People Age 15–25.” PLoS ONE 9 (1): e85473.
———. 2014b. “Subjective Well-Being, Risk Perceptions, and Time Discounting: Evidence from a Large-Scale Cash Transfer Programme.” Innocenti Working Paper 2014–02, Offi ce of Research, United Nations Children’s Fund, Florence.
Harland, Charlotte. 2014. “Can the Expansion of Social Protection Bring about Social Transformation in African Countries? Th e Case of Zambia.” European Journal of Development Research 26 (3): 370–86.
Haushofer, Johannes, and Jeremy Shapiro. 2013. “Household Response to Income Changes: Evidence from an Unconditional Cash Transfer Program in Kenya.” Working paper, Abdul Latif Jameel Poverty Action Lab, Massachusetts Institute of Technology, Cambridge, MA.
Hickey, Samuel. 2011. “Th e Politics of Social Protection: What Do We Get from a ‘Social Contract’ Approach?” Canadian Journal of Development Studies 32 (4): 426–38.
Hickey, Samuel, and Badru Bukenya. 2016. “Th e Politics of Promoting Social Cash Transfers in Uganda.” ESID Working Paper 69, Effective States and Inclusive Development Research Centre, Global Development Institute, School of Environment, Education, and Development, University of Manchester, Manchester.
Hickey, Samuel, and Tom Lavers. 2017. “Th e Political Economy of the Adoption, Design, and Implementation of Social Protection.” Background paper for Realizing the Full
178 REALIZING THE FULL POTENTIAL OF SOCIAL SAFETY NETS IN AFRICA
Potential of Social Safety Nets in Africa, edited by Kathleen Beegle, Aline Coudouel, and Emma Monsalve. Washington, DC: World Bank.
Hill, Ruth, and Philip Verwimp. 2017. “Managing Risk and Confl ict.” In Accelerating Poverty Reduction in Africa, edited by Kathleen Beegle and Luc Christiaensen, chapter 4. Washington, DC: World Bank.
Hu, Minqing, and Bing Liu. 2004. “Mining and Summarizing Customer Reviews.” In KDD ’04: Proceedings of the ACM SIGKDD International Conference on Knowledge Discovery and Data Mining, edited by Special Interest Group on Knowledge Discovery in Data, 168–77. New York: Association for Computing Machinery.
Hurrell, Alex, and Ian MacAuslan. 2012. “Th e Political Implications of Cash Transfers in Sub-Saharan Africa: Shaking Up the Social System.” Public Management Review 14 (2): 255–72.
Jones, Nicola, Bassam Abu-Hamad, Paola Pereznieto, and Kerry Sylvester. 2016. “Transforming Cash Transfers: Citizens’ Perspectives on the Politics of Programme Implementation.” Journal of Development Studies 52 (8): 1207–24.
Jones, Nicola, and Fiona Samuels. 2013. “Holding Cash Transfers to Account: Benefi ciary and Community Perspectives.” With Agnieszka Malachowska. Transforming Cash Transfers Series, Overseas Development Institute, London.
Kidd, Stephen, and Verena Damerau. 2016. “Th e Political Economy of Social Protection for Informal Economy Workers in Asia.” In Social Protection for Information Workers in Asia, edited by Sri Wening Handayani, 120–71. Manila: Asian Development Bank.
King, Sophie, and Samuel Hickey. 2017. “Building Democracy from Below: Lessons from Western Uganda.” Journal of Development Studies 53 (10): 1584–99.
Kitschelt, Herbert. 2000. “Linkages between Citizens and Politicians in Democratic Polities.” Comparative Political Studies 33 (6–7): 845–79.
Labonne, Julien. 2013. “Th e Local Electoral Impacts of Conditional Cash Transfers: Evidence from a Field Experiment.” Journal of Development Economics 104: 73–88.
Lavers, Tom. 2013. “Food Security and Social Protection in Highland Ethiopia: Linking the Productive Social Safety Net to the Land Question.” Journal of Modern African Studies 51 (03): 459–85.
———. 2016a. “Social Protection in an Aspiring ‘Developmental State’: Th e Political Drivers of Ethiopia’s PSNP.” WIDER Working Paper 2016/130, United Nations University–World Institute for Development Economics Research, Helsinki.
———. 2016b. “Understanding Elite Commitment to Social Protection: Rwanda’s Vision 2020 Umurenge Programme.” WIDER Working Paper 2016/093, United Nations University–World Institute for Development Economics Research, Helsinki.
Lavers, Samuel, and Tom Hickey. 2016. “Conceptualising the Politics of Social Protection Expansion in Low Income Countries: Th e Intersection of Transnational Ideas and Domestic Politics.” International Journal of Social Welfare 25 (4): 388–98.
Linos, Elizabeth. 2013. “Do Conditional Cash Transfer Programs Shift Votes? Evidence from the Honduran PRAF.” Electoral Studies 32 (4): 864–74.
Lippert-Rasmussen, Kasper. 2011. “Vote Buying and Election Promises: Should Democrats Care about the Diff erence?” Journal of Political Philosophy 19 (2): 125–44.
RECOGNIZING AND LEVERAGING POLITICS 179
Luttmer, Erzo F. P. 2001. “Group Loyalty and the Taste for Redistribution.” Journal of Political Economy 109 (3): 500–28.
MacAuslan, Ian, and Nils Riemenschneider. 2011. “Richer but Resented: What Do Cash Transfers Do to Social Relations?” IDS Bulletin 42 (6): 60–66.
Manacorda, Marco, Edward Miguel, and Andrea Vigorito. 2011. “Government Transfers and Political Support.” American Economic Journal: Applied Economics 3 (3): 1–28.
Moene, Karl Ove, and Michael Wallerstein. 2001. “Targeting and Political Support for Welfare Spending.” Economics of Governance 2 (1): 3–24.
Molyneux, Maxine. 2016. “Can Cash Transfer Programmes Have ‘Transformative’ Eff ects?” With Nicola Jones and Fiona Samuels. Journal of Development Studies 52 (8): 1087–98.
Ndiaye, Alfred. 2017. “The Political Economy of Social Protection in Senegal.” Background paper for Realizing the Full Potential of Social Safety Nets in Africa, edited by Kathleen Beegle, Aline Coudouel, and Emma Monsalve. Washington, DC: World Bank.
Nupia, Oskar. 2011. “Anti-Poverty Programs and Presidential Election Outcomes: Familias en Acción in Colombia.” Documentos CEDE 14, Centro de Estudios sobre Desarrollo Econó mico, Bogotá.
Oduro, Razak. 2014. “Beyond Poverty Reduction: Conditional Cash Transfers and Citizenship in Ghana.” International Journal of Social Welfare 24 (1): 27–36.
OECD (Organisation for Economic Co-operation and Development). 2009. “Concepts and Dilemmas of State-Building in Fragile Situations: From Fragility to Resilience.” OECD Journal on Development 9 (3): 64–152.
Osofi an, Wale. 2011. “Towards Strengthening State-Citizen Relationship in Fragile States and Environments: Th e Role of Cash Transfer Programmes.” Paper presented at the International Conference “Social Protection for Social Justice,” Institute of Development Studies, Brighton, UK, April 13–15.
Pavanello, Sara, Carol Watson, W. Onyango-Ouma, and Paul Bukuluki. 2016. “Eff ects of Cash Transfers on Community Interactions: Emerging Evidence.” Journal of Development Studies 52 (8): 1147–61.
Pavão, Nara. 2016. “Conditional Cash Transfer Programs and Electoral Accountability: Evidence from Latin America.” Latin American Politics and Society 58 (2): 74–99.
Pierson, Paul. 1993. “When Eff ect Becomes Cause: Policy Feedback and Political Change.” World Politics 45 (4): 595–628.
Plagerson, Sophie, Trudy Harpham, and Karina Kielmann. 2012. “Cash Transfers and Citizenship: Evidence from South Africa.” Journal of Development Studies 48 (7): 969–82.
Premand, Patrick, and Carlo del Ninno. 2016. “Cash Transfers, Behavioral Accompanying Measures, and Child Development in Niger.” Working paper, World Bank, Washington, DC.
Pritchett, Lant. 2005. “A Lecture on the Political Economy of Targeted Social Safety Nets.” Social Protection Discussion Paper 0501, World Bank, Washington, DC.
Pruce, Kate, and Samuel Hickey. 2017. “Th e Politics of Promoting Social Protection in Zambia.” ESID Working Paper 75, Eff ective States and Inclusive Development
180 REALIZING THE FULL POTENTIAL OF SOCIAL SAFETY NETS IN AFRICA
Research Centre, Global Development Institute, School of Environment, Education, and Development, University of Manchester, Manchester.
Ringold, Dena, Alaka Holla, Margaret Koziol, and Santhosh Srinivasan. 2012. Citizens and Service Delivery: Assessing the Use of Social Accountability Approaches in the Human Development Sectors. Directions in Development: Human Development Series. Washington, DC: World Bank.
Roemer, John. 1998. “Why the Poor Do Not Expropriate the Rich: An Old Argument in New Garb.” Journal of Public Economics 70 (3): 399–424.
Roll, Michael, ed. 2014. Th e Politics of Public Sector Performance: Pockets of Eff ectiveness in Developing Countries. Abingdon, UK: Routledge.
Rousseau, Jean-Jacques. 1968. Th e Social Contract. Translated by Maurice Cranston. Penguin Books for Philosophy Series. London: Penguin Books. First published 1762.
Seekings, Jeremy. 2015. “Th e ‘Developmental’ and ‘Welfare’ State in South Africa: Lessons for the Southern African Region.” CSSR Working Paper 358, Centre for Social Science Research, University of Cape Town, Cape Town.
———. 2016a. “‘Aff ordability’ and the Political Economy of Social Protection in Contemporary Africa.” CSSR Working Paper 389, Centre for Social Science Research, University of Cape Town, Cape Town.
———. 2016b. “Drought Relief and the Origins of a Conservative Welfare State in Botswana, 1965–1980.” CSSR Working Paper 378, Centre for Social Science Research, University of Cape Town, Cape Town.
Seidenfeld, David, Sudhanshu Handa, and Gelson Tembo. 2013. “Social Cash Transfer Scheme: 24-Month Impact Report for the Child Grant Programme.” September, American Institutes for Research, Washington, DC.
Sen, Amartya. 1995. “Th e Political Economy of Targeting.” In Public Spending and the Poor: Th eory and Evidence, edited by Dominique van de Walle and Kimberly Nead, 11–24. Washington, DC: World Bank; Baltimore: Johns Hopkins University Press.
Sepúlveda, Magdalena, and Carly Nyst. 2012. “Th e Human Rights Approach to Social Protection.” Elements for Discussion Series, Unit for Development Communications, Ministry for Foreign Aff airs, Helsinki.
Siachiwena, Hangala. 2016. “Social Protection Policy Reform in Zambia during the Sata Presidency, 2011–2014.” CSSR Working Paper 380, Centre for Social Science Research, University of Cape Town, Cape Town.
Silva, Joana, Victoria Levin, and Matteo Morgandi. 2013. Inclusion and Resilience: Th e Way Forward for Social Safety Nets in the Middle East and North Africa. MENA Development Report. Washington, DC: World Bank.
Stokes, Susan C. 2007. “Is Vote Buying Undemocratic?” In Elections for Sale: Th e Causes and Consequences of Vote Buying, edited by Frederic Charles Schaff er, 81–99. Boulder, CO: Lynne Rienner.
Suwanrada, Worawet, and Dharmapriya Wesumperuma. 2012. “Development of the Old-Age Allowance System in Th ailand: Challenges and Policy Implications.” In Social Protection for Older Persons: Social Pensions in Asia, edited by Sri Wening Handayani and Babken Babajanian, 153–67. Manila: Asian Development Bank.
RECOGNIZING AND LEVERAGING POLITICS 181
Tembo, Fletcher. 2012. “Citizen Voice and State Accountability: Towards Th eories of Change That Embrace Contextual Dynamics.” Working Paper 343, Overseas Development Institute, London.
Tobias, Julia E., Sudarno Sumarto, and Habib Moody. 2014. “Assessing the Political Impacts of a Conditional Cash Transfer: Evidence from a Randomized Policy Experiment in Indonesia.” Working Paper, SMERU Research Institute, Jakarta.
Ulriksen, Marianne S. 2016. “Ideational and Institutional Drivers of Social Protection in Tanzania.” WIDER Working Paper 2016/142, United Nations University–World Institute for Development Economics Research, Helsinki.
van de Walle, Dominique. 1998. “Targeting Revisited.” World Bank Research Observer 13 (2): 231–48.
van de Walle, Nicolas. 2007. “Meet the Boss, Same as the Old Boss? Th e Evolution of Political Clientelism in Africa.” In Patrons, Clients, and Policies: Patterns of Democratic Accountability and Political Competition, edited by Herbert Kitschelt and Steven I. Wilkinson, 50–67. New York: Cambridge University Press.
———. 2014. “Th e Democratization of Clientelism in Sub-Saharan Africa.” In Clientelism, Social Policy, and the Quality of Democracy, edited by Diego Abente Brun and Larry Diamond, 230–52. Baltimore: Johns Hopkins University Press.
van Oorschot, Wim. 2000. “Who Should Get What, and Why? On Deservingness Criteria and the Conditionality of Solidarity among the Public.” Policy and Politics 28 (1): 33–48.
Wanyama, Fredrick O., and Anna McCord. 2017. “Th e Politics of Scaling Up Social Protection in Kenya.” ESID Working Paper 87, Eff ective States and Inclusive Development Research Centre, Global Development Institute, School of Environment, Education, and Development, University of Manchester, Manchester.
Weyland, Kurt. 1996. Democracy without Equity: Failures of Reform in Brazil. Pittsburgh: University of Pittsburgh Press.
World Bank. 2015. “Towards a New Social Contract.” MENA Economic Monitor, Middle East and North Africa Region, World Bank, Washington, DC.
———. 2016. Making Politics Work for Development: Harnessing Transparency and Citizen Engagement. Policy Research Report. Washington, DC: World Bank.
———. 2017. World Development Report 2017: Governance and the Law. Washington, DC: World Bank.
Zucco, Cesar, Jr. 2013. “When Payouts Pay Off : Conditional Cash Transfers and Voting Behavior in Brazil 2002–10.” American Journal of Political Science 57 (4): 810–22.

183
Chapter 4
Anchoring in Strong Institutions to Expand and Sustain Social Safety NetsSarah Coll-Black, Victoria Monchuk, and Judith Sandford
Institutions—defined as laws, policies, and strategies—are the backbone of the delivery of effective social safety nets. Often understood or defined as the rules of the game, institutions will need to evolve in several dimen-sions to anchor the expansion of social safety nets in Africa.
For policy setting, oversight, and the coordination of social safety nets, there is no single path. Th e choice of ministerial home typically depends on the factors that led to the emergence of the programs. More than half of the countries reviewed task the social ministry with these responsibilities. Implementation may be located in other agencies separate from the one tasked with policy setting, oversight, and coordination. Th e approaches are varied; but as programs evolve, coordination becomes more critical, not least because of limited fi scal space.
Local frontline workers in countries with decentralized or devolved systems may not be accountable to central agencies. National standards need to be balanced with devolved decision making to account for local realities.
While reliance on technical assistance and contracts may deliver results in the short term, longer-term solutions are required to embed programs in government systems to promote sustainability. Generally, incentives available to civil servants are critical for eff ective implementation, particu-larly as programs are taken to scale and become nationwide systems. Poor incentives can result in high staff turnover. Combined with slow recruit-ment, this can lead to gaps in capacity.
184 REALIZING THE FULL POTENTIAL OF SOCIAL SAFETY NETS IN AFRICA
Institutions—defi ned as laws, policies, and strategies—shape human behav-ior and human interaction and are therefore central to the delivery of social safety nets. Oft en understood or defi ned as the rules of the game, institutions shape all aspects of social safety nets, ranging from establishing the benefi t eli-gibility criteria to the rules that govern the organization that delivers the social safety net program (including its mandate and human resource policies) and the laws that govern the sector (box 4.1). Beyond the formal rules, informal institutions—routines, conventions, and customary practices—infl uence the provision of social safety nets in diverse ways, from mediating notions of deservingness to encourage public support among populations to incentivizing civil servants and frontline staff to deliver programs.
If the social safety nets in Africa are to be expanded to the required scale, governments must make serious investments in strong institutions. Th e institu-tions supporting the social safety nets in Africa are evolving as programs are launched, deliver benefi ts, and become an everyday part of the political and social landscape. Th ese processes can take considerable time and are infl uenced by many factors, including political and fi scal aspects (chapters 3 and 5). More immediately, if the social safety nets are to be brought to scale, institutions that support their operation and help build their legitimacy are required. Th ese insti-tutions may be of many types, embody international best practices or home-grown solutions, and entail both formal and informal rules. Th ese rules of the game will also evolve because they refl ect changing behaviors, beliefs, and power relations within countries.
Th e institutional anchors of social safety nets must be strong, credible, and produce results. Th e anchoring institutions must fulfi ll the following three func-tions if social safety nets are to become sustainable at scale: (1) commitment, that is, the assurance that policies will remain consistent beyond the political cycle; (2) coordination, the ability to convince numerous actors to take coordi-nated action in pursuit of a common good; and (3) cooperation, the ability to prevent free riding or to convince actors to take steps they may consider in their interest (World Bank 2017). Th is chapter explores these aspects of a strong insti-tutional anchoring for social safety nets by considering the policy and legislative context and the organizations that oversee, coordinate, manage, and implement social safety net programs in Africa.
Th ere are multiple paths in the evolution of the rules of the game for social safety nets in Africa, and many are linked to the development of broader social protection systems. Building a social protection system does not necessarily mean focusing on a single entity or agency to manage multiple programs (Robalino, Rawlings, and Walker. 2012). Indeed, Mathauer (2004) explains that, given the multidimensional nature of poverty, social safety nets are naturally multisectoral, thereby requiring the coordination and management of interor-ganizational and intergovernmental relations. Similarly, by design, social safety
ANCHORING SOCIAL SAFETY NETS IN STRONG INSTITUTIONS 185
BOX 4.1
Defi ning InstitutionsOften understood as the rules of the game in society, institutions foster stable and predictable human interactions (North 1989; Ostrom 1990). They represent “durable social rules and procedures, formal or informal, which structure the social, economic, and political relations and interactions of those affected by them” (Leftwich 2006, 2). Institutions do, however, create different incentives that focus on different behaviors and enforcement mechanisms that may lead to different outcomes (Bridges and Woolcock 2017).
The best-studied rules are those that are regulatory, that are viewed as laws or practices monitored and enforced by third parties, and that promise reward or punishment. These differ from normative rules, which are the norms and values that set out what is socially acceptable and thus intrinsically infl uence behavior through feelings of honor and shame. An additional type of rule is one that is cultural-cognitive. This type involves frameworks through which the world may be interpreted, “structuring the way information is received, processed, and given meaning,” and thus biasing decisions, irrespective of other incentives or regulatory mechanisms (Andrews 2013, 42–43).
While these various types of rules may each be referred to separately, Scott (2008, 48) argues that they are all distinct aspects of institutions. “Institutions are comprised of regulatory, normative, and cultural-cognitive elements that, together with associated activities and resources, provide stability and meaning to life,” he writes.
Thus, each institution has formal and informal aspects. Any attempt to introduce a new rule or to change a rule must consider both sorts of aspects. The informal aspects are frequently invisible (Bridges and Woolcock 2017). The formal aspects are regulatory and visible. Andrews (2013) calls them the tip of the iceberg. According to him, if one only reproduces the visible parts, but not the cultural cognitive and normative foundations, one will obtain an iceberg without foundation, the kind that sinks.
Often, “institution” is used interchangeably with “agency” or “organization,” and thus, frequently, the institutions supporting social safety nets are equated with the organizations that are responsible for the design, delivery, management, and oversight of the programs. In an effort to distinguish between institutions and organizations, this chapter defi nes organizations as “the formally or informally coordinated vehicles for the promotion or protection of a mix of individual and shared interests and ideas” (Leftwich and Sen 2010, 18). Thus, if institutions are the rules of the game, then orga-nizations are the players.a Each organization is governed by internal rules, which apply only to the members of the organization, who develop unique systems to monitor and enforce these rules.
a. The political aspects of institutions, which tend also to refl ect informal rules, are discussed in chapter 3. This chapter focuses on formal organizations and agencies.
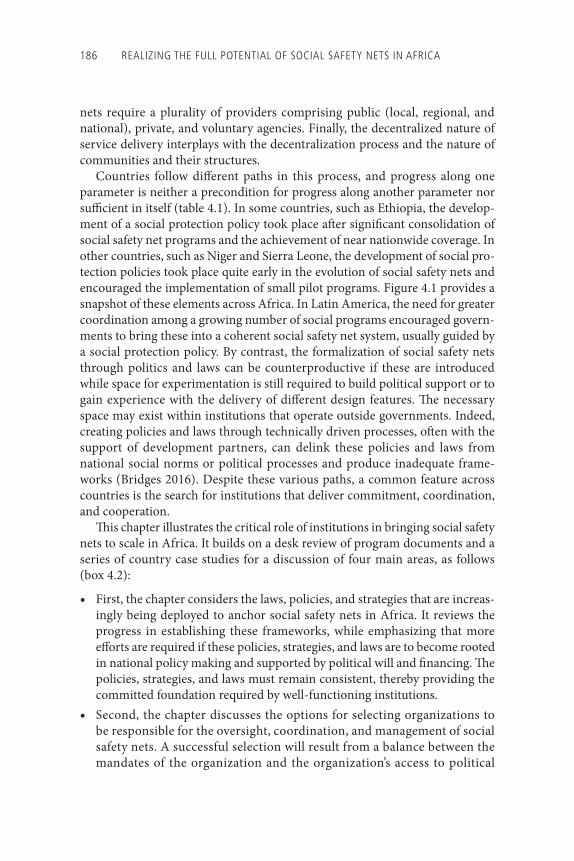
186 REALIZING THE FULL POTENTIAL OF SOCIAL SAFETY NETS IN AFRICA
nets require a plurality of providers comprising public (local, regional, and national), private, and voluntary agencies. Finally, the decentralized nature of service delivery interplays with the decentralization process and the nature of communities and their structures.
Countries follow diff erent paths in this process, and progress along one parameter is neither a precondition for progress along another parameter nor suffi cient in itself (table 4.1). In some countries, such as Ethiopia, the develop-ment of a social protection policy took place aft er signifi cant consolidation of social safety net programs and the achievement of near nationwide coverage. In other countries, such as Niger and Sierra Leone, the development of social pro-tection policies took place quite early in the evolution of social safety nets and encouraged the implementation of small pilot programs. Figure 4.1 provides a snapshot of these elements across Africa. In Latin America, the need for greater coordination among a growing number of social programs encouraged govern-ments to bring these into a coherent social safety net system, usually guided by a social protection policy. By contrast, the formalization of social safety nets through politics and laws can be counterproductive if these are introduced while space for experimentation is still required to build political support or to gain experience with the delivery of diff erent design features. Th e necessary space may exist within institutions that operate outside governments. Indeed, creating policies and laws through technically driven processes, oft en with the support of development partners, can delink these policies and laws from national social norms or political processes and produce inadequate frame-works (Bridges 2016). Despite these various paths, a common feature across countries is the search for institutions that deliver commitment, coordination, and cooperation.
Th is chapter illustrates the critical role of institutions in bringing social safety nets to scale in Africa. It builds on a desk review of program documents and a series of country case studies for a discussion of four main areas, as follows (box 4.2):
• First, the chapter considers the laws, policies, and strategies that are increas-ingly being deployed to anchor social safety nets in Africa. It reviews the progress in establishing these frameworks, while emphasizing that more eff orts are required if these policies, strategies, and laws are to become rooted in national policy making and supported by political will and fi nancing. Th e policies, strategies, and laws must remain consistent, thereby providing the committed foundation required by well-functioning institutions.
• Second, the chapter discusses the options for selecting organizations to be responsible for the oversight, coordination, and management of social safety nets. A successful selection will result from a balance between the mandates of the organization and the organization’s access to political
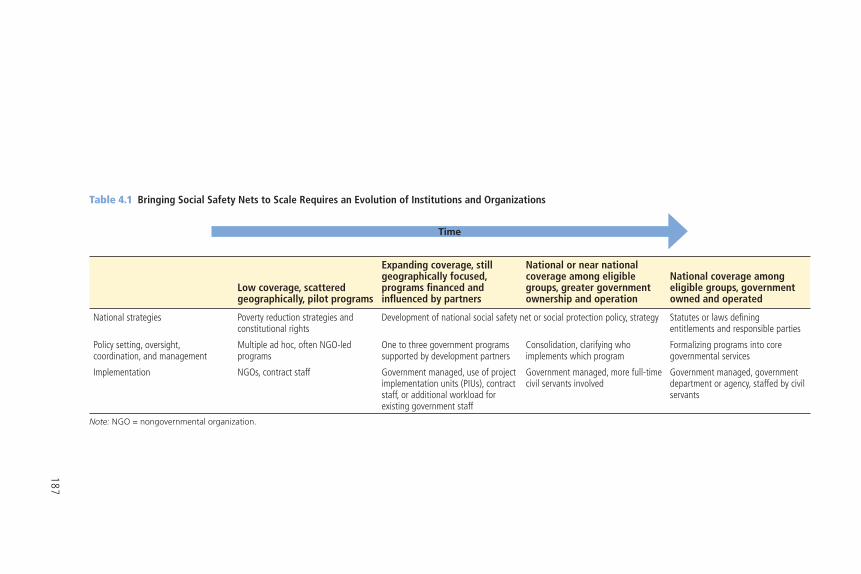
187
Table 4.1 Bringing Social Safety Nets to Scale Requires an Evolution of Institutions and Organizations
Low coverage, scattered geographically, pilot programs
Expanding coverage, still geographically focused, programs fi nanced and infl uenced by partners
National or near national coverage among eligible groups, greater government ownership and operation
National coverage among eligible groups, government owned and operated
National strategies Poverty reduction strategies and constitutional rights
Development of national social safety net or social protection policy, strategy Statutes or laws defi ning entitlements and responsible parties
Policy setting, oversight, coordination, and management
Multiple ad hoc, often NGO-led programs
One to three government programs supported by development partners
Consolidation, clarifying who implements which program
Formalizing programs into core governmental services
Implementation NGOs, contract staff Government managed, use of project implementation units (PIUs), contract staff, or additional workload for existing government staff
Government managed, more full-time civil servants involved
Government managed, government department or agency, staffed by civil servants
Note: NGO = nongovernmental organization.
Time
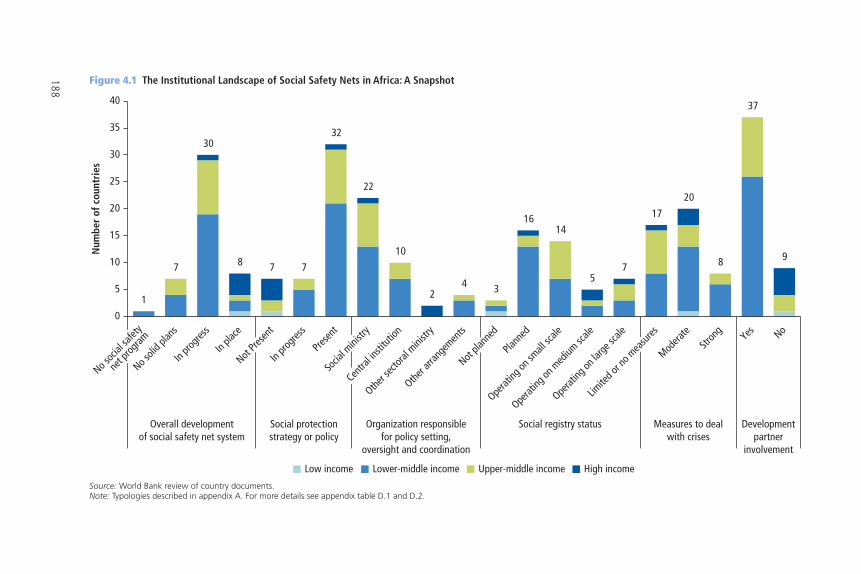
188
Figure 4.1 The Institutional Landscape of Social Safety Nets in Africa: A Snapshot
Source: World Bank review of country documents.Note: Typologies described in appendix A. For more details see appendix table D.1 and D.2.
Low income Lower-middle income Upper-middle income High income
1
7
30
8 7 7
32
22
10
24 3
1614
57
17
20
8
37
9
0
5
10
15
20
25
30
35
40
No soc
ial sa
fety
net p
rogram
No soli
d plan
sIn
progre
ssIn
place
Not Pre
sent
In pro
gress
Presen
tSo
cial m
inistr
y
Centra
l insti
tution
Other s
ectora
l mini
stry
Other a
rrang
emen
tsNot
plann
edPla
nned
Operat
ing on
small
scale
Operat
ing on
med
ium sc
ale
Operat
ing on
large
scale
Limite
d or n
o mea
sures
Modera
te
Stron
g
Yes No
Overall developmentof social safety net system
Social protectionstrategy or policy
Organization responsiblefor policy setting,
oversight and coordination
Social registry status Measures to dealwith crises
Developmentpartner
involvement
Num
ber
of c
ount
ries
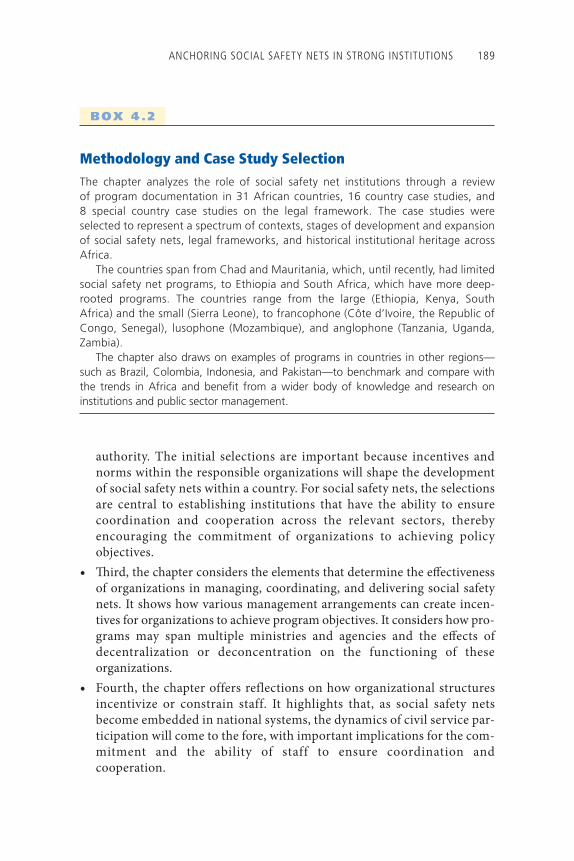
ANCHORING SOCIAL SAFETY NETS IN STRONG INSTITUTIONS 189
authority. The initial selections are important because incentives and norms within the responsible organizations will shape the development of social safety nets within a country. For social safety nets, the selections are central to establishing institutions that have the ability to ensure coordination and cooperation across the relevant sectors, thereby encouraging the commitment of organizations to achieving policy objectives.
• Th ird, the chapter considers the elements that determine the eff ectiveness of organizations in managing, coordinating, and delivering social safety nets. It shows how various management arrangements can create incen-tives for organizations to achieve program objectives. It considers how pro-grams may span multiple ministries and agencies and the eff ects of decentralization or deconcentration on the functioning of these organizations.
• Fourth, the chapter offers reflections on how organizational structures incentivize or constrain staff. It highlights that, as social safety nets become embedded in national systems, the dynamics of civil service par-ticipation will come to the fore, with important implications for the com-mitment and the ability of staff to ensure coordination and cooperation.
BOX 4.2
Methodology and Case Study SelectionThe chapter analyzes the role of social safety net institutions through a review of program documentation in 31 African countries, 16 country case studies, and 8 special country case studies on the legal framework. The case studies were selected to represent a spectrum of contexts, stages of development and expansion of social safety nets, legal frameworks, and historical institutional heritage across Africa.
The countries span from Chad and Mauritania, which, until recently, had limited social safety net programs, to Ethiopia and South Africa, which have more deep-rooted programs. The countries range from the large (Ethiopia, Kenya, South Africa) and the small (Sierra Leone), to francophone (Côte d’Ivoire, the Republic of Congo, Senegal), lusophone (Mozambique), and anglophone (Tanzania, Uganda, Zambia).
The chapter also draws on examples of programs in countries in other regions—such as Brazil, Colombia, Indonesia, and Pakistan—to benchmark and compare with the trends in Africa and benefi t from a wider body of knowledge and research on institutions and public sector management.
190 REALIZING THE FULL POTENTIAL OF SOCIAL SAFETY NETS IN AFRICA
From Frameworks to Commitments: Emerging National Strategies for Social Safety Nets
Across the region, governments are now focusing on creating an institutional framework to advance social safety nets. In addition to establishing the formal rules of implementation for individual programs, many governments are iden-tifying the wider policy context for social safety nets, oft en within a broader framework for social protection. Because, according to the World Bank (2017, 171), “eff ective policies tend to have long-term objectives (extending beyond the political cycle), matching resources and well-aligned incentives for the actors involved,” the elaboration of these policies or strategies can contribute to foster-ing political interest and support for social safety nets.1 Oft en, the policy com-mitments are embedded in international conventions and declarations, attesting to the layering of institutions across local, national, and international activity spaces (Mehta et al. 1999). While the presence of these policies, laws, and legal frameworks signals an important step forward toward the establishment of a stable anchor for social safety nets in Africa, the legitimacy of these formal institutions rests on whether they will be enforced, which is a function of sup-port for them politically and the will to implement them (World Bank 2017).
Laws, policies, and strategies are largely formal, but informal rules are critical to ensuring credibility. Informal elements “can undermine, reinforce, or even substitute for the functioning of formal institutions” (Left wich and Sen 2010, 25). Th is interplay between formal and informal rules implies that setting up formal institutions is more than a technical exercise focused on getting the laws right. It requires understanding the politics of social safety nets, including how poli-cies, strategies, and laws refl ect or change cultural understandings of poverty and entitlements (chapter 3). Th e alignment of formal and informal rules cre-ates the belief that laws and policies will be enforced. Th e focus here is on the evolution of the formal rules for social safety nets.
Across many countries in Africa, international and regional commitments have provided a springboard for the mobilization of support for social safety nets among politicians and technocrats, thus infl uencing national policies on social safety nets. Most African countries are signatories of international agreements and declarations that encompass social safety nets (chapter 3). Th e Universal Declaration of Human Rights commits governments to recognizing and fulfi lling the right to social protection, which is also articulated in article 9 of the International Covenant on Economic, Social, and Cultural Rights.2 Th is commit-ment has been translated into law through treaties, customary international law, general principles, regional agreements, and domestic law that express and guar-antee human rights. Th e African Charter on Human and Peoples’ Rights reinforces the relevant covenants.3 More specifi c commitments are implied in other regional and international declarations. Recommendation R202 of the International
ANCHORING SOCIAL SAFETY NETS IN STRONG INSTITUTIONS 191
Labour Organization provides guidance on extending and adapting social protec-tion fl oors to national circumstances.4 Th e Ouagadougou Declaration and Plan of Action (2004), the Livingstone Call for Action (2006), the Social Policy Framework for Africa (2008), and the Yaoundé Declaration (2011) all include commitments by African governments to improve the living conditions of vulnerable people through better social protection services.5 While soft and nonbinding, such inter-national commitments can be evoked in securing the commitment of govern-ments to social safety nets, an approach that has proven useful across countries in Africa in advancing social safety nets. Such international commitments can potentially build momentum at the national level for bringing social safety nets to scale (Kaltenborn et al. 2017).
Despite the widespread adoption of international treaties across Africa, there is signifi cant variation in the degree to which social safety nets are anchored in national legislation—at times as part of a broader position on social protection (table 4.2). Constitutions have recognized the right to social safety nets in some countries, while the constitutions in others off er general provisions for basic rights or the protection of vulnerable groups. Th e Constitution of Kenya stipu-lates the “right for every person . . . to social security and binds the State to provide appropriate social security to individuals who are unable to support themselves and their dependents.” In Niger, the Constitution explains that everyone “has the right to life, to health, to physical and moral integrity, to a healthy and suffi cient food supply, to potable water, to education and instruc-tion in the conditions specifi ed by the law;” and “the State sees to the elderly through a policy of social protection.” In Rwanda, “Th e State shall, within the limits of its capacity, take special measures for the welfare of survivors of geno-cide who were rendered destitute by genocide committed in Rwanda from October 1, 1990 to December 31st, 1994, the disabled, the indigent, and the elderly as well as other vulnerable groups.”6 Embedding social safety nets in national development strategies or plans is an opportunity to create cross-sec-toral synergies in order to improve well-being (Carroll 2011).
Social protection policies and strategies have become common among Africa countries, but they are oft en quite general, which may undermine their credibility. Among the 48 countries in the region, 39 have approved or are in the process of draft ing such policies (see chapter 1, table 1.1, appendix table D.1). In most counties, the strategies or policies are quite recent. Except for South Africa (1997), they date from 2005 or later (fi gure 4.2). Th ey typi-cally present the overarching principles that govern social safety net programs nationwide. Th ese set out a vision for programs, the main target groups, and the types of benefi ts. Th ese are agreed upon across various government agen-cies and development partners. While national strategies and policies make important statements about a government’s ambitions, the generic nature of the provisions, which also tend to be quite ambitious in prevailing contexts,
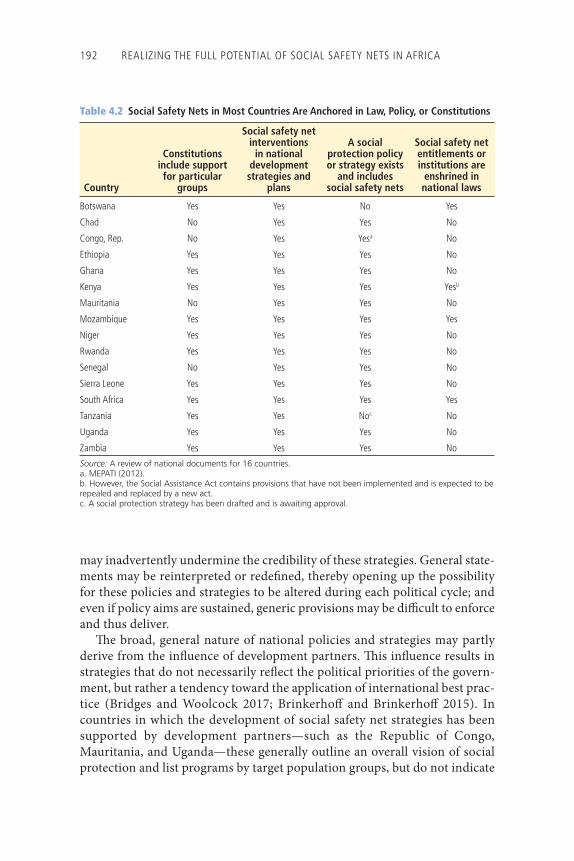
192 REALIZING THE FULL POTENTIAL OF SOCIAL SAFETY NETS IN AFRICA
Table 4.2 Social Safety Nets in Most Countries Are Anchored in Law, Policy, or Constitutions
Country
Constitutions include support for particular
groups
Social safety net interventions
in national development strategies and
plans
A social protection policy or strategy exists
and includes social safety nets
Social safety net entitlements or institutions are
enshrined in national laws
Botswana Yes Yes No Yes
Chad No Yes Yes No
Congo, Rep. No Yes Yesa No
Ethiopia Yes Yes Yes No
Ghana Yes Yes Yes No
Kenya Yes Yes Yes Yesb
Mauritania No Yes Yes No
Mozambique Yes Yes Yes Yes
Niger Yes Yes Yes No
Rwanda Yes Yes Yes No
Senegal No Yes Yes No
Sierra Leone Yes Yes Yes No
South Africa Yes Yes Yes Yes
Tanzania Yes Yes Noc No
Uganda Yes Yes Yes No
Zambia Yes Yes Yes No
Source: A review of national documents for 16 countries.a. MEPATI (2012).b. However, the Social Assistance Act contains provisions that have not been implemented and is expected to be repealed and replaced by a new act.c. A social protection strategy has been drafted and is awaiting approval.
may inadvertently undermine the credibility of these strategies. General state-ments may be reinterpreted or redefi ned, thereby opening up the possibility for these policies and strategies to be altered during each political cycle; and even if policy aims are sustained, generic provisions may be diffi cult to enforce and thus deliver.
Th e broad, general nature of national policies and strategies may partly derive from the infl uence of development partners. Th is infl uence results in strategies that do not necessarily refl ect the political priorities of the govern-ment, but rather a tendency toward the application of international best prac-tice (Bridges and Woolcock 2017; Brinkerhoff and Brinkerhoff 2015). In countries in which the development of social safety net strategies has been supported by development partners—such as the Republic of Congo, Mauritania, and Uganda—these generally outline an overall vision of social protection and list programs by target population groups, but do not indicate
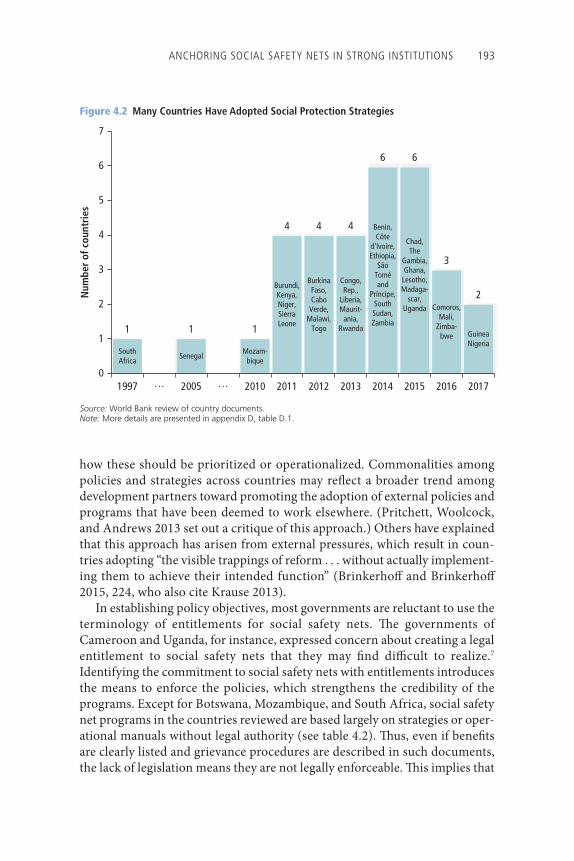
ANCHORING SOCIAL SAFETY NETS IN STRONG INSTITUTIONS 193
how these should be prioritized or operationalized. Commonalities among policies and strategies across countries may refl ect a broader trend among development partners toward promoting the adoption of external policies and programs that have been deemed to work elsewhere. (Pritchett, Woolcock, and Andrews 2013 set out a critique of this approach.) Others have explained that this approach has arisen from external pressures, which result in coun-tries adopting “the visible trappings of reform . . . without actually implement-ing them to achieve their intended function” (Brinkerhoff and Brinkerhoff 2015, 224, who also cite Krause 2013).
In establishing policy objectives, most governments are reluctant to use the terminology of entitlements for social safety nets. Th e governments of Cameroon and Uganda, for instance, expressed concern about creating a legal entitlement to social safety nets that they may fi nd diffi cult to realize.7 Identifying the commitment to social safety nets with entitlements introduces the means to enforce the policies, which strengthens the credibility of the programs. Except for Botswana, Mozambique, and South Africa, social safety net programs in the countries reviewed are based largely on strategies or oper-ational manuals without legal authority (see table 4.2). Th us, even if benefi ts are clearly listed and grievance procedures are described in such documents, the lack of legislation means they are not legally enforceable. Th is implies that
Figure 4.2 Many Countries Have Adopted Social Protection Strategies
Source: World Bank review of country documents.Note: More details are presented in appendix D, table D.1.
1 1 1
4 4 4
6 6
3
2
0
1
2
3
4
5
6
7
1997 … 2005 … 2010 2011 2012 2013 2014 2015 2016 2017
Num
ber
of c
ount
ries
SouthAfrica
Burundi,Kenya,Niger,SierraLeone
BurkinaFaso,CaboVerde,
Malawi,Togo
Congo,Rep.,
Liberia,Maurit-
ania,Rwanda
Benin,Côte
d'Ivoire,Ethiopia,
SãoToméand
Príncipe,SouthSudan,Zambia
Chad,The
Gambia,Ghana,Lesotho,Madaga-
scar,Uganda Comoros,
Mali,Zimba-
bwe GuineaNigeria
SenegalMozam-
bique
194 REALIZING THE FULL POTENTIAL OF SOCIAL SAFETY NETS IN AFRICA
there is no legal obligation to address complaints that arise if the programs are not delivered as intended.
Th e introduction of legal frameworks for social safety nets can assure greater commitment to the sector, but only if the frameworks build policy objectives that are widely supported (World Bank 2017). For instance, in 2012, the Kenyan Parliament passed a private member’s social assistance bill. However, the result-ing Act was informed neither by the benefi ts or the targeting criteria of existing social safety net programs, nor by existing or planned institutional arrange-ments. Th us, the Act was not enforceable because the government’s social safety nets could not deliver on the objectives of the policy, and the policy did not refl ect the aims of the ministers responsible for social safety nets. To correct this, the ministry responsible for social protection is currently trying to codify existing social assistance provisions into law, but will need to repeal the 2012 Act before passing a new bill, a more complex and time-consuming process than passing a bill for the fi rst time. Meanwhile, the existing bill has created a misunderstanding. Potential benefi ciaries of existing social safety net programs are unable to understand the rationing and poverty targeting that are part of the eligibility assessment process.
Legal frameworks for social safety nets can generate sustained political com-mitment to delivery on their objectives if they are enforced. South Africa off ers an example of how political incentives are aligned with a legal framework for social safety nets, thereby resulting in credible enforcement of the laws. Th ere, the Constitution includes a Bill of Rights that guarantees the right of all South Africans “to have access to social security, including if they are unable to sup-port themselves and their dependents” (Black Sash 2010, 2). Th is right has been formally recognized in the Social Assistance Act of 2004, which defi nes eligibil-ity criteria and other parameters of the social grant system. Th e ability to realize these entitlements derives from the Independent Tribunal for Social Assistance Appeals, which allows citizens to mount a legal challenge if they believe they have been denied benefi ts to which they feel entitled or if they feel they have been treated unfairly by the South African Social Security Agency. Such exam-ples are rare in Africa, however. Other means of enforcing commitments to social safety nets are apparent in Africa, where there are examples of political commitments that have been translated into increased budgetary allocations and enhanced capacity to deliver programs. In Mozambique, the development of an appropriate legislative framework has been key to establishing social safety nets. Th e Social Protection Law of 2007 and the National Strategy for Basic Social Security in 2009 resulted in wider coverage and government fi nancing; between 2012 and 2015, budget allocations increased from 0.22 percent to 0.56 percent of gross domestic product (GDP) (ILO, UNICEF, and WFP 2015). Political and social forces can similarly incentivize the enforcement of commit-ments to delivering social safety nets (chapter 3).
ANCHORING SOCIAL SAFETY NETS IN STRONG INSTITUTIONS 195
Rooting Social Safety Nets in Organizations for Policy Setting, Oversight, Coordination, and Management
Th e organizational landscape for social safety nets in Africa has evolved as the responsibilities for policies and programs have become more fi rmly vested in government ministries. Unlike other sectors, such as health and education, few ministries were responsible for social protection or social safety nets in Africa until recently. Selecting the home for social safety nets is oft en thus a fi rst step in strengthening the institutional anchoring because these organiza-tions are central to coordinating multiple actors toward the achievement of common objectives and ensuring compliance and decision making that sup-port and reinforce the commitments to social safety nets, even if these deci-sions are not in the interests of politicians, managers, or technocrats (World Bank 2017). Th e choice typically depends on the factors that led to the emergence of social safety nets because there is no blank slate (Andrews 2013; chapter 3). In some countries, social safety nets have emerged out of the experience with the provision of social security for formal sector workers; in others, they have emerged out of a concern for food insecurity or vulnerability to disasters. Typically, this origin leads governments to build social safety net programs within sectoral ministries or on the foundations of existing pro-grams. Th is is critical to success because organizations are more likely to be successful if they “identify, tap into, and build on preexisting capacity” (Barma, Huybens, and Viñuela 2014, 5).
Choice of Home for Policy Setting, Oversight, and Coordination Balances Mandates and Political PowerOrganizations with the policy mandate for social safety nets are typically selected for their proximity to political power or for the alignment of social safety nets with their mandates. These choices point to strategies that are employed to generate legitimacy for social safety nets by lodging these pro-grams within organizations with a mandate aligned with political interests or within organizations able to generate results—that is, organizations with the structures and the capacity to deliver the programs, including identify-ing eligible beneficiaries, making payments, monitoring activities, and so on. The relative importance of these factors may change. For instance, a program that emerges as a short-term response to an emergency may be located in a high-profile agency, such as the office of the president, where it may respond rapidly and with high visibility. However, as programs become more mature and become better integrated into longer-term social protec-tion policy, a social ministry or agency with a policy mandate to serve the vulnerable may become a more appropriate home. There is a pattern between the chosen entity and the spending profile of programs. A large
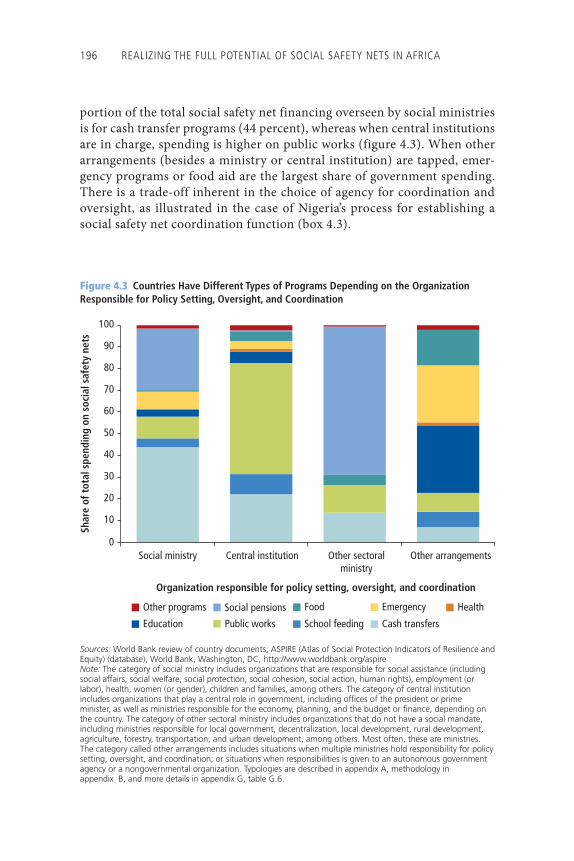
196 REALIZING THE FULL POTENTIAL OF SOCIAL SAFETY NETS IN AFRICA
portion of the total social safety net financing overseen by social ministries is for cash transfer programs (44 percent), whereas when central institutions are in charge, spending is higher on public works ( figure 4.3). When other arrangements (besides a ministry or central institution) are tapped, emer-gency programs or food aid are the largest share of government spending. There is a trade-off inherent in the choice of agency for coordination and oversight, as illustrated in the case of Nigeria’s process for establishing a social safety net coordination function (box 4.3).
Figure 4.3 Countries Have Different Types of Programs Depending on the Organization Responsible for Policy Setting, Oversight, and Coordination
Sources: World Bank review of country documents; ASPIRE (Atlas of Social Protection Indicators of Resilience and Equity) (database), World Bank, Washington, DC, http://www .worldbank.org/aspireNote: The category of social ministry includes organizations that are responsible for social assistance (including social affairs, social welfare, social protection, social cohesion, social action, human rights), employment (or labor), health, women (or gender), children and families, among others. The category of central institution includes organizations that play a central role in government, including offices of the president or prime minister, as well as ministries responsible for the economy, planning, and the budget or finance, depending on the country. The category of other sectoral ministry includes organizations that do not have a social mandate, including ministries responsible for local government, decentralization, local development, rural development, agriculture, forestry, transportation, and urban development, among others. Most often, these are ministries. The category called other arrangements includes situations when multiple ministries hold responsibility for policy setting, oversight, and coordination; or situations when responsibilities is given to an autonomous government agency or a nongovernmental organization. Typologies are described in appendix A, methodology in appendix B, and more details in appendix G, table G.6.
0
10
20
30
40
50
60
70
80
90
100
Social ministry Central institution Other sectoralministry
Other arrangements
Organization responsible for policy setting, oversight, and coordination
Shar
e of
tot
al s
pend
ing
on s
ocia
l saf
ety
nets
Other programs Social pensions Food Emergency Health
Education Public works School feeding Cash transfers
ANCHORING SOCIAL SAFETY NETS IN STRONG INSTITUTIONS 197
Responsibility for policy setting, oversight, and coordination is oft en housed in organizations with a mandate to support vulnerable populations. Across the sample, this responsibility is vested in a social organization in 22 of 38 countries reviewed; social ministries might include ministries of social action or aff airs, labor; women, family and children; or social security ( fi gure 4.4). Th e selection of a social ministry may refl ect a desire to name a ministry that is already mandated to promote policies that support the poor and vulnerable. Th e decision might be to group together aspects of the social protection or social safety net system, such as social pensions or services for children, those aff ected by disability, or those aff ected by illness, an accident, or another emergency (whereas contributory pensions are usually managed by a separate agency). However, while social ministries may have the strongest mandate to support the poor, they oft en have limited fi nancial resources and political infl uence, including limited authority to require other ministries to collaborate and to coordinate activities. Th ese factors may undermine the ability of these ministries to achieve results and point to their limited legiti-macy in some contexts.
BOX 4.3
Nigeria’s Process to Establish a Coordination FunctionIn Nigeria, there were many questions about institutional and coordination functions and structures when the government embarked on the design of an ambitious new national social safety net program in 2015. The political economy of federalism implies a diverse landscape for potential reforms and a complex context for the implementation of national programs. While autonomy gives Nigerian states, particularly those with dynamic and pro-gressive leadership, an opportunity to move ahead on their own, it also poses a challenge for building a national consensus across the various levels of government.
In developing a coordination function, the government of Nigeria refl ected upon analyses of institutional arrangements that were focused on institutional forms and functions in countries with similar national social safety net programs, as well as the experience of countries that have established successful social safety nets. A number of functional capabilities emerged as common across programs, including convening ability, political visibility and infl uence, operational capabilities, ability to coordinate with other social programs, resilience, and transition capacity.
Using these capabilities as a guide, Nigerian agencies that could potentially house a national social safety net program were identifi ed. Attention was paid to the implica-tions of the Nigerian federal system, including the decentralization of roles and respon-sibilities among states. Several roundtable discussions were held with key government stakeholders and development partners. The government decided to house the main body for social safety net coordination and delivery in the Offi ce of the President.
Source: Holmemo and Ort 2017.
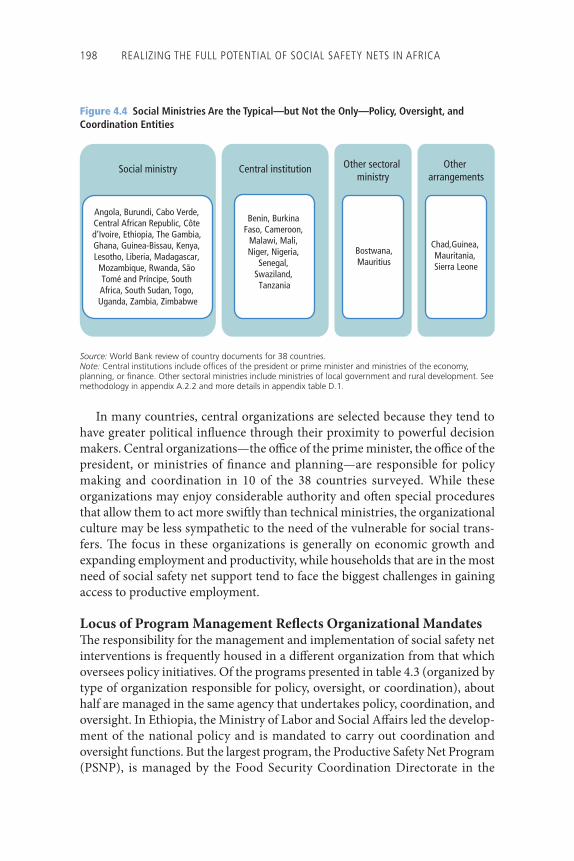
198 REALIZING THE FULL POTENTIAL OF SOCIAL SAFETY NETS IN AFRICA
Figure 4.4 Social Ministries Are the Typical—but Not the Only—Policy, Oversight, and Coordination Entities
Source: World Bank review of country documents for 38 countries.Note: Central institutions include offices of the president or prime minister and ministries of the economy, planning, or finance. Other sectoral ministries include ministries of local government and rural development. See methodology in appendix A.2.2 and more details in appendix table D.1.
Social ministry
Angola, Burundi, Cabo Verde, Central African Republic, Côte d’Ivoire, Ethiopia, The Gambia, Ghana, Guinea-Bissau, Kenya, Lesotho, Liberia, Madagascar, Mozambique, Rwanda, São Tomé and Príncipe, South Africa, South Sudan, Togo, Uganda, Zambia, Zimbabwe
Central institution
Benin, Burkina Faso, Cameroon,
Malawi, Mali, Niger, Nigeria,
Senegal, Swaziland, Tanzania
Other sectoral ministry
Bostwana, Mauritius
Other arrangements
Chad,Guinea, Mauritania, Sierra Leone
In many countries, central organizations are selected because they tend to have greater political infl uence through their proximity to powerful decision makers. Central organizations—the offi ce of the prime minister, the offi ce of the president, or ministries of fi nance and planning—are responsible for policy making and coordination in 10 of the 38 countries surveyed. While these organizations may enjoy considerable authority and oft en special procedures that allow them to act more swift ly than technical ministries, the organizational culture may be less sympathetic to the need of the vulnerable for social trans-fers. Th e focus in these organizations is generally on economic growth and expanding employment and productivity, while households that are in the most need of social safety net support tend to face the biggest challenges in gaining access to productive employment.
Locus of Program Management Refl ects Organizational MandatesTh e responsibility for the management and implementation of social safety net interventions is frequently housed in a diff erent organization from that which oversees policy initiatives. Of the programs presented in table 4.3 (organized by type of organization responsible for policy, oversight, or coordination), about half are managed in the same agency that undertakes policy, coordination, and oversight. In Ethiopia, the Ministry of Labor and Social Aff airs led the develop-ment of the national policy and is mandated to carry out coordination and oversight functions. But the largest program, the Productive Safety Net Program (PSNP), is managed by the Food Security Coordination Directorate in the
ANCHORING SOCIAL SAFETY NETS IN STRONG INSTITUTIONS 199
Ministry of Agriculture and Natural Resources. In countries where social safety net programs are nascent, as in Chad, some programs are typically managed by nongovernmental organizations (NGOs) and involve only limited government participation.
Generally, the management of social safety net programs is vested in min-istries with a mandate that aligns with the aims of the program. Th us, social safety net programs with a protective focus, such as unconditional transfers to categorical groups considered vulnerable, tend to be housed in social minis-tries. Th is is the case of social safety net programs in Kenya (the Cash Transfer for Orphans and Vulnerable Children [OVC] Program, the cash transfer for the elderly, and the case transfer for people with severe disabilities), the Child Support Grant in South Africa, and social pensions in Uganda and Zanzibar. Programs that focus more on productive aspects may be more frequently housed in ministries of rural development, agriculture, roads, infrastructure, or water. One of Ghana’s fl agship social safety net programs, the Labor-Intensive Public Works Program, is managed by Ministry of Local Government and Rural Development. In Lesotho, the Public Works Program is managed by the Ministry of Forestry. In many countries, there are multiple social safety net programs and multiple ministries or agencies responsible for implementation.
In regions with a longer tradition of social safety net programs, the institu-tional arrangements oft en evolve. While programs are relatively new in Africa, and few have changed organizational home, experience in other regions shows that arrangements may alter. In Colombia, the conditional cash transfer pro-gram Familias en Acción was launched in the late 1990s as part of the Social Support Network created to off set the impact on poor households of a severe economic crisis. It was initially set to last three years and, in line with this short-term emergency mandate, was operated by Acción Social. As the crisis subsided, the original emergency role became obsolete, and programs were refocused more broadly on the promotion of human capital. Th e initial arrange-ments had allowed for rapid implementation because the operating rules were less constraining, but this had also resulted in isolating Familias en Acción from other, prevailing social organizations and coordination mechanisms. To establish links to other organizations and contribute to the broader human capital development strategy, the program began to be used as a liaison between service providers and the benefi ciaries—the poorest households. Th is evolu-tion, from emergency initiative to part of a broader social policy, required shift s in organizational arrangements. In 2011, the Departamento Administrativo de Prosperidad Social (Ministry for Social Prosperity) was created and took over the responsibility for management from the Offi ce of the President. Today, Familias en Acción reaches over 2.5 million households, about a quarter of the population, and is strongly anchored in national legislation.
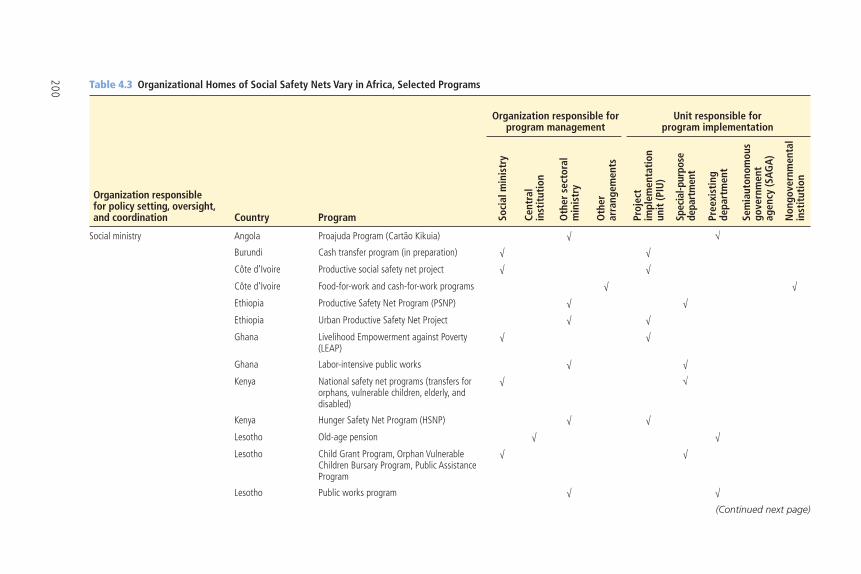
200 Table 4.3 Organizational Homes of Social Safety Nets Vary in Africa, Selected Programs
Organization responsible for policy setting, oversight, and coordination Country Program
Organization responsible for program management
Unit responsible for program implementation
Soci
al m
inis
try
Cent
ral
inst
itut
ion
Oth
er s
ecto
ral
min
istr
y
Oth
er
arra
ngem
ents
Proj
ect
impl
emen
tati
on
unit
(PIU
)
Spec
ial-p
urpo
se
depa
rtm
ent
Pree
xist
ing
depa
rtm
ent
Sem
iaut
onom
ous
gove
rnm
ent
agen
cy (S
AGA
)
Non
gove
rnm
enta
l in
stit
utio
n
Social ministry Angola Proajuda Program (Cartão Kikuia) √ √Burundi Cash transfer program (in preparation) √ √
Côte d’Ivoire Productive social safety net project √ √
Côte d’Ivoire Food-for-work and cash-for-work programs √ √
Ethiopia Productive Safety Net Program (PSNP) √ √
Ethiopia Urban Productive Safety Net Project √ √
Ghana Livelihood Empowerment against Poverty (LEAP)
√ √
Ghana Labor-intensive public works √ √
Kenya National safety net programs (transfers for orphans, vulnerable children, elderly, and disabled)
√ √
Kenya Hunger Safety Net Program (HSNP) √ √
Lesotho Old-age pension √ √
Lesotho Child Grant Program, Orphan Vulnerable Children Bursary Program, Public Assistance Program
√ √
Lesotho Public works program √ √
(Continued next page)
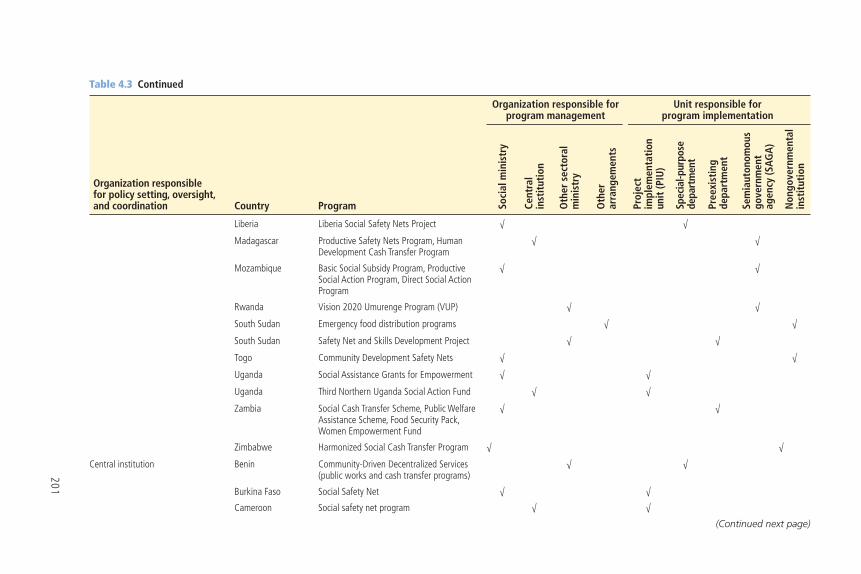
201
Table 4.3 Continued
Organization responsible for policy setting, oversight, and coordination Country Program
Organization responsible for program management
Unit responsible for program implementation
Soci
al m
inis
try
Cent
ral
inst
itut
ion
Oth
er s
ecto
ral
min
istr
y
Oth
er
arra
ngem
ents
Proj
ect
impl
emen
tati
on
unit
(PIU
)
Spec
ial-p
urpo
se
depa
rtm
ent
Pree
xist
ing
depa
rtm
ent
Sem
iaut
onom
ous
gove
rnm
ent
agen
cy (S
AGA
)
Non
gove
rnm
enta
l in
stit
utio
n
Liberia Liberia Social Safety Nets Project √ √
Madagascar Productive Safety Nets Program, Human Development Cash Transfer Program
√ √
Mozambique Basic Social Subsidy Program, Productive Social Action Program, Direct Social Action Program
√ √
Rwanda Vision 2020 Umurenge Program (VUP) √ √
South Sudan Emergency food distribution programs √ √
South Sudan Safety Net and Skills Development Project √ √
Togo Community Development Safety Nets √ √
Uganda Social Assistance Grants for Empowerment √ √
Uganda Third Northern Uganda Social Action Fund √ √
Zambia Social Cash Transfer Scheme, Public Welfare Assistance Scheme, Food Security Pack, Women Empowerment Fund
√ √
Zimbabwe Harmonized Social Cash Transfer Program √ √
Central institution Benin Community-Driven Decentralized Services (public works and cash transfer programs)
√ √
Burkina Faso Social Safety Net √ √
Cameroon Social safety net program √ √
(Continued next page)
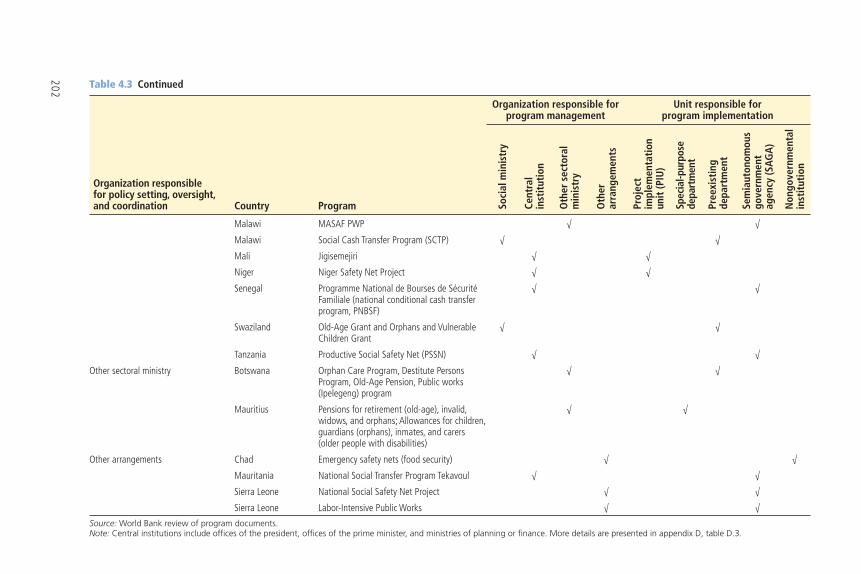
202 Table 4.3 Continued
Organization responsible for policy setting, oversight, and coordination Country Program
Organization responsible for program management
Unit responsible for program implementation
Soci
al m
inis
try
Cent
ral
inst
itut
ion
Oth
er s
ecto
ral
min
istr
y
Oth
er
arra
ngem
ents
Proj
ect
impl
emen
tati
on
unit
(PIU
)
Spec
ial-p
urpo
se
depa
rtm
ent
Pree
xist
ing
depa
rtm
ent
Sem
iaut
onom
ous
gove
rnm
ent
agen
cy (S
AGA
)
Non
gove
rnm
enta
l in
stit
utio
n
Malawi MASAF PWP √ √
Malawi Social Cash Transfer Program (SCTP) √ √
Mali Jigisemejiri √ √
Niger Niger Safety Net Project √ √
Senegal Programme National de Bourses de Sécurité Familiale (national conditional cash transfer program, PNBSF)
√ √
Swaziland Old-Age Grant and Orphans and Vulnerable Children Grant
√ √
Tanzania Productive Social Safety Net (PSSN) √ √
Other sectoral ministry Botswana Orphan Care Program, Destitute Persons Program, Old-Age Pension, Public works (Ipelegeng) program
√ √
Mauritius Pensions for retirement (old-age), invalid, widows, and orphans; Allowances for children, guardians (orphans), inmates, and carers (older people with disabilities)
√ √
Other arrangements Chad Emergency safety nets (food security) √ √
Mauritania National Social Transfer Program Tekavoul √ √
Sierra Leone National Social Safety Net Project √ √
Sierra Leone Labor-Intensive Public Works √ √
Source: World Bank review of program documents.Note: Central institutions include offices of the president, offices of the prime minister, and ministries of planning or finance. More details are presented in appendix D, table D.3.
ANCHORING SOCIAL SAFETY NETS IN STRONG INSTITUTIONS 203
Early Choice of Organizational Home Can Shape the Evolution of Social Safety NetsTh e choice of ministerial home shapes the evolution of the social safety net program, as diff erent organizations—and the people who staff them—tend to focus on diff erent outcomes. Programs tend to conform to the vision and man-date of the responsible organization. Th is occurs through the formal and infor-mal rules that govern organizations. Social workers in a social ministry will focus on the specifi c needs of vulnerable groups—a refl ection of their profes-sional mandate and priorities, as well as their professional “customs” and views. Th is will aff ect how the program design evolves, with the possible inclusion of other vulnerable groups or extension of the program to other services required by these groups. Stakeholders and organizations involved in public works pro-grams may have a diff erent outlook, being more concerned about the contribu-tion of programs to economic growth and graduation out of poverty than inclusion. Th e skills, interests, and incentives for the staff of these ministries—and the political will that backs these ministries—will prioritize those aspects of these programs that achieve the stated (or unstated) objectives. Experience from Kenya and Ethiopia, which is described below, shows how the choice of implementing ministry—and the diff erent founding philosophy that leads to this choice—results in diff erent implementation approaches and diff erent results being achieved, which, in turn, lead to diff erent trajectories.
In Kenya, the cash transfer for orphans and vulnerable children was launched in response to the growing number of children in households aff ected by HIV/AIDS. Th e government was keen to explore options that would provide support to orphans, while avoiding expansion in orphanages. Th e provision of cash transfers was expected to enable households to continue to care for orphans and vulnerable children. Responsibility was given to the unit responsible for the care of orphans, the Department of Children’s Services, which is also supported by the United Nations Children’s Fund (UNICEF), which played a key role in the pilot initiative. Th e early successes of the program infl uenced the Department of Social Development to pilot the cash transfer program for older persons, and for persons with severe disabilities. Th ese pilots also gained political support, and overall coverage of these programs reached about 765,000 households in 2017. A similar trajectory is seen in Ghana.
In contrast, the PSNP in Ethiopia was initiated in response to chronic food insecurity. It was viewed as part of an overall food security strategy (associated with the launch of other resettlement and food security pro-grams) and thus fell under the responsibility of the Ministry of Agriculture and Rural Development. Th us, the productive contribution of the program through the public works (such as investments in soil and water conserva-tion) have been emphasized, with management of the works shift ing to the Natural Resource Management Directorate of the Ministry, together with the
204 REALIZING THE FULL POTENTIAL OF SOCIAL SAFETY NETS IN AFRICA
ability of the social safety net transfers, when combined with livelihood sup-port, to graduate people out of food insecurity. Yet, as the national social protection policy gained traction, the Ministry of Labor and Social Aff airs was given the mandate to manage the aspect of the PSNP that supports those households that have no able-bodied adults and are thus unable to partici-pate in public works.
Organizational Fragmentation Results from Multiple Views of Social Safety NetsIn some countries, there may be multiple views on the role of social safety nets, which reflect differing objectives, social norms, or political aims across countries (chapter 3). There may be a diversity of views within gov-ernment, across development partners, and among other stakeholders on how social safety nets should be designed and operate. The existence of competing narratives enables different approaches to be tested, which can help identify the approach attracting the greatest political support and exerting the greatest impact, both of which are critical to expansion. But multiple approaches can also result in multiple fragmented institutions. In particular, best practice and the diverging preferences of development part-ners can lead to fragmentation. In Tanzania and Uganda, the coexistence of multiple narratives has led to the development of distinct programs, all providing transfers, but with different approaches and housed in different institutions (box 4.4).
Eff ective Coordination Requires Clear Mandates, Objectives, and ResourcesA common feature of social protection policies is that the objectives span multiple sectors and therefore require interministerial collaboration. As such, social protection policies often include the creation of interministerial oversight bodies. These bodies are often chaired by ministers or cabinet secretaries in ministries with lower levels of decision-making and convening power or by ministers in central ministries with competing demands on time. Hence, forming such bodies or calling meetings once they are formed is rarely prioritized. For instance, in Burkina Faso, the intersectoral national council for social protection only meets once or twice a year, and mainly focuses on information sharing, whereby the main output is a list of pro-grams and the resources spent. This lack of prioritization also arises because there are frequently no clear, time-bound outcomes that such committees are expected to produce. Instead, the stated roles include providing over-sight, offering guidance, or ensuring integration. In contrast, successful coordination has involved leadership groups that are assigned specific out-put goals.
ANCHORING SOCIAL SAFETY NETS IN STRONG INSTITUTIONS 205
BOX 4.4
Contrasting Social Safety Net Narratives in Tanzania and UgandaUgandaSocial safety nets have not yet gained a substantial foothold in Uganda. Two develop-ment partners—the UK Department for International Development and the World Bank—have joined with different government ministries on programs refl ecting two approaches. Through the Expanding Social Protection Program, the former is providing support to the Ministry of Gender, Labour, and Social Development. Although this ministry is considered to have limited implementation capacity, it is identifi ed in the social protection policy as the entity responsible for spearheading social protection. Investing in this entity is an appropriate long-term approach. The UK department’s preference for unconditional cash transfers also informed the decision.
World Bank support for social safety nets is channeled through a third phase of the Northern Uganda Social Action Fund, which is managed by the Offi ce of the Prime Minister. This phase will scale up public works. The World Bank’s choice builds on an existing relationship and may help in promoting the government’s commitment to social safety nets. Operational capacity has not been a signifi cant consideration because district governments are responsible for most of the implementation.
TanzaniaIn Tanzania in 2011, the World Bank was supporting pilot public works interventions and conditional cash transfers through the TASAF Tanzania Social Action Fund (under the Offi ce of the President), while other actors were supporting unconditional categori-cal transfers, including the Kwa Wazee Pension Program, in which the main partner was the Ministry of Labour and Employment.
In 2012, the government reoriented the social action fund into the Productive Social Safety Net (PSSN), which provides a combination of unconditional cash transfers, conditional supplements linked to health care and education services, public works, and livelihood support. The PSSN has become a national program and operates in all districts. The fund’s unrivaled capacity and the World Bank’s relationship with the Offi ce of the President have contributed to the decision to retain the institutional arrangements from earlier phases of the fund, despite the forthcoming social protection framework, which identifi es the Ministry of Labour and Employment as the lead oversight agency in social protection.
Even after the launch of the PSSN, many stakeholders retained a strong interest in social pensions, including several NGOs and the United Nations Children’s Fund. In 2016, the semiautonomous region of Zanzibar launched the Zanzibar Universal Pension Scheme, a social pension program to address poverty and vulnerability among the elderly who lacked formal pensions. The program is managed by the Zanzibar Ministry of Labour, Empowerment, Elderly, Youth, Women, and Children.
Source: Interviews with program experts.
206 REALIZING THE FULL POTENTIAL OF SOCIAL SAFETY NETS IN AFRICA
However, social protection policies rarely establish the means by which joint oversight and interministerial collaboration can become functional. Many of the challenges described above may be attributed to the insuffi cient attention paid to identifying and reaching a consensus on the shared objectives of any coordination eff ort, the appropriate coordinating entity, and the targets of coor-dination. Typically, a general need for joint oversight is identifi ed, along with initiatives to establish structures without clearly identifying the purpose and, therefore, the most appropriate mechanisms to achieve all goals. Oft en no spe-cifi c staff members from ministries are assigned to the coordination eff orts, nor are budgets allocated or objectives set out.
Ensuring That Organizations Can Effectively Implement Social Safety Net Programs
Th e Choice of Management Structure Matters for the Implementation of ProgramsAcross Africa, governments have put in place a variety of structures to manage and deliver social safety nets. Within the ministries selected for the manage-ment of social safety net programs, there are fi ve main categories of manage-ment units (see table 4.3), that is, the structure within or outside the ministry that is eff ectively responsible for the daily management of programs, as follows:
• A project implementation unit (PIU): A team or unit that is created within a government organization to manage a project, the members of which are recruited or assigned for the sole purpose of managing the project and paid for by external agencies. Th is is the case for the social safety net programs in Cameroon and Uganda.
• A special-purpose department: A department that is established within a government organization with the specifi c mandate to manage one or several social safety net programs. An example is the Social Assistance Unit in Kenya that manages the OVC Program and cash transfers for the elderly and persons with severe disabilities.
• A preexisting department: A department within a government organization with a set mandate and range of responsibilities to which management of one or several social safety net programs is added. Th is is the case for the Lisungi cash transfer program launched in the Republic of Congo in 2013.
• A semiautonomous government agency (SAGA). A legal entity that has been created by a government to undertake specifi c functions that would have otherwise been carried out by the government. Such an entity is
ANCHORING SOCIAL SAFETY NETS IN STRONG INSTITUTIONS 207
operationally autonomous from government. It may also be a fully autono-mous agency. In Senegal, the National Agency for Social Protection and Solidarity (Délégation Nationale à la Protection Sociale et Solidarité Nationale), which reports to the Offi ce of the President, is responsible for the management of the national cash transfer program and the social registry.
• Nongovernmental institution. Th is category includes nongovernmental orga-nizations (NGOs) and agencies of the United Nations. Th ese are more com-monly used if capacity is limited, in fragile or humanitarian contexts, or for programs that are still small or at the pilot stage (such as in Somalia and South Sudan).
Management structures vary by context, although there is little evidence as to how these may evolve as social safety nets expand. Across a sample of pro-grams examined, the most common form of management structure is the PIU (table 4.3). Th is is particularly the case among countries in which central min-istries have vested responsibility for policy, oversight, and coordination. Th e use of PIUs also dominates if central ministries are responsible for program man-agement. Th ey are also a common form of management arrangement in social ministries. Th e rare exception to this trend seems to occur if management responsibilities are allocated to another sectoral ministry. Th e widespread use of PIUs may refl ect the relatively recent establishment of government-managed social safety nets in many countries in Africa. Th e use of existing departments and SAGAs to manage social safety nets is the next most common type of man-agement structure, followed by specialized departments and then NGOs.
Th e widespread use of PIUs may also refl ect the fact that many government ministries lack the operational capacity and technical skills required to manage these programs. Th is may also be a product of the importance of development partner funding in social safety net programs given that PIUs are perceived to deliver results within the time frame of project fi nancing. Lack of capacity and fi duciary concerns led to the decision to locate the Social Assistance Grants for the Empowerment Program in Uganda in PIUs. Specifi c arrangements were identifi ed to manage the relevant funds, and the PIUs relied mostly on fi xed-term contractors. In addition, PIUs off er other advantages, particularly in the short term. Th ey may attract high-caliber staff through competitive employ-ment terms and conditions (oft en involving consultancy contracts) and may operate outside regular government fi nancial management and procurement systems. However, they are usually dependent on development partner fi nanc-ing and may not build long-term capacity within the public sector.8 Th e experi-ence in other sectors suggests that, while the creation of a PIU can quickly build the capacity that is needed to deliver results, there are risks to creating such islands of effi ciency, which function well but do not respond to more systemic weaknesses within government systems.9 Programs that are launched within
208 REALIZING THE FULL POTENTIAL OF SOCIAL SAFETY NETS IN AFRICA
separate PIUs may be migrated to regular departments within the responsible government organizations as they gain sustainability. For instance, in Indonesia, the management of the Program Keluarga Harapan was initially located within a PIU housed in the Ministry of Social Aff airs and relied largely on consultants. To strengthen institutional sustainability, it was later moved to a directorate of the ministry, where civil servants carried out a greater range of tasks. Colombia has had a similar experience.
If programs are managed by existing government structures, departments are the most common form of management unit. It also appears that the use of existing departments is somewhat more common if social ministries are respon-sible for social safety net programs. If programs are small and new, they may be added as an extra responsibility to a preexisting government department. Selected staff within these departments may be assigned responsibility for the program, either in addition to their existing responsibilities or exclusively. As the programs become larger or more established, a special-purpose department might be established. Such departments tend to be formed only once programs have reached a certain size and governments have made political and fi nancial commitments to ensure long-term implementation. Th is is the case in Kenya, where a social assistance unit was established to manage three programs that were initially run by existing departments within the Ministry of Gender, Children, and Social Development.10 As the three programs were expanded and procedures were harmonized, the new unit was created to take over management.
SAGAs enjoy some degree of autonomy not experienced by core ministerial departments. Th ey are usually answerable to a ministry or the offi ce of the presi-dent and thus form a regular part of the government architecture, but operate under a diff erent set of rules. Th e autonomy may extend to fi nancing, personnel, or organization and may help ensure that the agency’s structure and procedures refl ect its needs and function. Such managerial and fi nancial autonomy can enable the SAGA to make and enforce decisions more rapidly. SAGAs can oft en set up implementation structures that directly reach benefi ciaries, thereby bypassing the multiple levels of government administration and various deci-sion-making processes. For example, in Sierra Leone, the National Commission for Social Action has district offi ces that directly oversee the delivery of social safety net interventions.
Although existing SAGAs may be made responsible for social safety nets, the establishment of a new SAGA usually requires greater government commitment, especially in terms of the resources and the passage of specifi c legislation needed to establish a separate agency. Th us, the establishment of a dedicated SAGA may refl ect strong political support for social safety nets. An example of a SAGA focused on a social safety net is the South African Social Security Agency, which is attached to the Ministry of Social Development. It was formed in response to
ANCHORING SOCIAL SAFETY NETS IN STRONG INSTITUTIONS 209
perceived weak implementation by a ministerial department and decentralized government structures. The National Agency for Social Protection and Solidarity in Senegal is another example. Particularly in countries in which the social safety net program has evolved from a social fund, the responsibility for social safety nets has been allocated to existing SAGAs. In Rwanda, the Vision 2020 Umurenge Program (VUP) is run by the Local Administrative Entities Development Agency, a SAGA responsible for several rural develop-ment programs. In Sierra Leone, the social safety net is managed by the National Commission for Social Action (an autonomous government agency), which originally housed the country’s social fund. Th is is also the case for Madagascar, Malawi, and Tanzania. Th ere is no evidence on whether SAGAs evolve into other entities or if SAGAs may be a preferred type of delivery agency for social safety nets in Africa.
Th e choice of management structure infl uences the eff ectiveness of the orga-nization because these structures may incentivize or constrain management and implementation in various ways. For instance, the functioning of government departments is typically hampered by the need to abide by ministerial proce-dures. In particular, fi duciary procedures or hiring standards and processes are typically more restrictive among departments within government ministries than those among SAGAs or PIUs. However, allocating responsibility for a social safety net to a government department off ers the opportunity to embed the program in regular government systems, which creates management inter-est in and responsibility for the program. It is also a way of concretizing the views on the most appropriate types of programs without undertaking imple-mentation. Reinforcing the mandate of a government department and strength-ening its resources as needed can facilitate the grounding of social safety nets beyond the level of strategies.
Eff ective Implementation Oft en Requires Technical Coordination across Multiple Government ActorsTh e choice of management structure will also refl ect the extent to which techni-cal coordination is required to deliver the social safety net program. Universal or unconditional programs may be associated with simpler institutional arrangements run broadly by one sectoral entity and local and national repre-sentatives. Conditional programs oft en require the engagement of multiple sec-tors, such as ministries of health and education, and robust procedures for collecting information from health centers and schools on the compliance of individuals with conditions. Public works programs oft en require the involve-ment of diverse technical staff . Th eir implementation frequently depends heav-ily on local governments; some programs are eff ectively devolved to local agencies. Th ey also oft en require coordination with departments involved in road, water, and natural resource management.
210 REALIZING THE FULL POTENTIAL OF SOCIAL SAFETY NETS IN AFRICA
Th ere are many examples in Africa of practical coordination across sectors in program implementation. Th e Rwanda VUP and the Tanzania PSSN have achieved signifi cant interagency coordination, particularly at the local level. Th e eff ectiveness of the coordination structures established to implement the PSNP in Ethiopia benefi ted from the Safety Net Support Facility, which provided training and backup on leadership, understanding the terms of reference, pre-paring agendas, chairing meetings, dealing with nonattendance, and document-ing action points. Table 4.4 drills down into details on three large social safety net programs, in Ghana, Rwanda, and Senegal.
Technical coordination can be supported through the development of cen-tralized tools. As social safety nets expand, the need to establish centralized tools that can serve multiple programs becomes apparent. Registries, manage-ment information systems (MISs), and shared payment mechanisms are approaches that have been applied with some success (box 4.5). Th ey help raise effi ciency and foster coordination (chapter 5). However, while these tools and the formal rules that are associated with them can improve coordination, there has been little consideration for how they may interact with the informal rules and norms that shape their use. Most immediately, the technical skills required to design and operate these tools are scarce in many African countries, and hir-ing suitably skilled staff can thus be diffi cult. If such staff are identifi ed, they oft en request higher salaries than those paid to civil servants, which can breed resentment.
Technical Coordination Oft en Extends Beyond GovernmentWhile policy oversight and coordination are increasingly being carried out by governments, nonstate actors are frequently involved in the delivery of social safety nets. The responsibility for certain aspects of social safety net programs is often outsourced to specialized agencies that are based in the private sector, such as payment providers or independent monitors. In many cases, NGOs and United Nations agencies provide social safety nets to hard-to-reach communities or in fragile or conflict-affected areas. The manage-ment of social safety nets thus may include coordination and management of the private sector or NGOs in the effort to achieve a common purpose. In the Democratic Republic of Congo, the United Nations Office for Project Services has become involved in carrying out labor-intensive public works for road rehabilitation. In Guinea, the World Food Programme has been conducting a school feeding initiative. In Burkina Faso, Cameroon, and Niger, social safety net benefit payments are provided through microfinance institutions or money transfer agencies under contract with the agency managing the program. The Urban Safety Net Program in Ethiopia is setting up a payment system through the Commercial Bank of Ethiopia. NGOs may support frontline service delivery, such registration in the case of Senegal
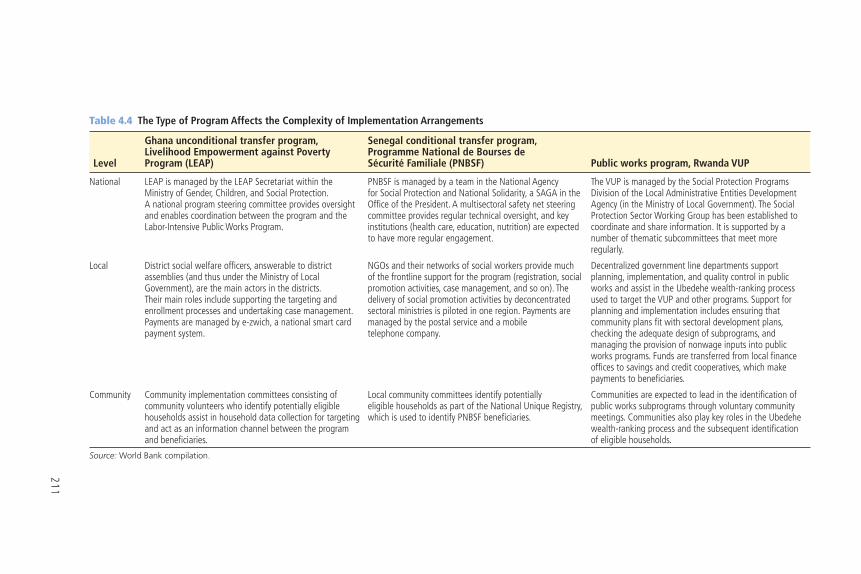
211
Table 4.4 The Type of Program Affects the Complexity of Implementation Arrangements
Level
Ghana unconditional transfer program,Livelihood Empowerment against Poverty Program (LEAP)
Senegal conditional transfer program, Programme National de Bourses de Sécurité Familiale (PNBSF) Public works program, Rwanda VUP
National LEAP is managed by the LEAP Secretariat within the Ministry of Gender, Children, and Social Protection. A national program steering committee provides oversight and enables coordination between the program and the Labor-Intensive Public Works Program.
PNBSF is managed by a team in the National Agency for Social Protection and National Solidarity, a SAGA in the Offi ce of the President. A multisectoral safety net steering committee provides regular technical oversight, and key institutions (health care, education, nutrition) are expected to have more regular engagement.
The VUP is managed by the Social Protection Programs Division of the Local Administrative Entities Development Agency (in the Ministry of Local Government). The Social Protection Sector Working Group has been established to coordinate and share information. It is supported by a number of thematic subcommittees that meet more regularly.
Local District social welfare offi cers, answerable to district assemblies (and thus under the Ministry of Local Government), are the main actors in the districts. Their main roles include supporting the targeting and enrollment processes and undertaking case management. Payments are managed by e-zwich, a national smart card payment system.
NGOs and their networks of social workers provide much of the frontline support for the program (registration, social promotion activities, case management, and so on). The delivery of social promotion activities by deconcentrated sectoral ministries is piloted in one region. Payments are managed by the postal service and a mobile telephone company.
Decentralized government line departments support planning, implementation, and quality control in public works and assist in the Ubedehe wealth-ranking process used to target the VUP and other programs. Support for planning and implementation includes ensuring that community plans fi t with sectoral development plans, checking the adequate design of subprograms, and managing the provision of nonwage inputs into public works programs. Funds are transferred from local fi nance offi ces to savings and credit cooperatives, which make payments to benefi ciaries.
Community Community implementation committees consisting of community volunteers who identify potentially eligible households assist in household data collection for targeting and act as an information channel between the program and benefi ciaries.
Local community committees identify potentially eligible households as part of the National Unique Registry, which is used to identify PNBSF benefi ciaries.
Communities are expected to lead in the identifi cation of public works subprograms through voluntary community meetings. Communities also play key roles in the Ubedehe wealth-ranking process and the subsequent identifi cation of eligible households.
Source: World Bank compilation.
212 REALIZING THE FULL POTENTIAL OF SOCIAL SAFETY NETS IN AFRICA
BOX 4.5
Tools for CoordinationIn Kenya, the launch of the National Safety Net Program (NSNP) represented an attempt to coordinate four existing cash transfers: the Hunger Safety Net Program (HSNP) and cash transfer programs for old people, orphans and vulnerable children (the OVC Program), and people with severe disabilities. The consolidation strategy brought three of the four cash transfers under the management of a single unit, where all key func-tions at the national level are carried out by a single team. The staff of the fourth pro-gram participate in coordination meetings. At the local level, where the programs are implemented, the government has merged local community structures to support complaint processes and case management and is piloting a harmonized targeting approach. A shared registry of benefi ciaries has been created from the MISs of the four programs, as well as data of the Cash for Works and Food for Asset Programs of the World Food Programme. There are plans to expand this registry to additional programs so it can act as a resource for multiple programs that may adopt the harmonized tar-geting approach.
The government of Senegal is building a registry to be used by programs that address chronic poverty and support vulnerable households. In 2012, it created a social protection agency housed in the Offi ce of the President, to lead in the formulation of a social protection strategy, the design of social safety net interventions, and coordination. As a main pillar of this effort, the government has established the Registre National Unique (unifi ed national registry), which, by 2017, included data on the 450,000 poorest households nationwide (around 30 percent of the population) (appendix D, table D.2). It already serves as an entry point for several targeted interventions, including the main conditional cash transfer program and the subsidized health insurance program, and its use is expected to expand, in particular to programs designed to respond to shocks. The registry is housed in a dedicated department, independent of the department in charge of the implementation of national cash transfer programs.
In the Republic of Congo and in Mali, the cash transfer programs have been steadily expanded since their launch in 2013, and the establishment of a unifi ed national registry has been a key part of this process (appendix D, table D.2). The development of these two national registries was undertaken while the programs were being conceived. In Mali, the creation of the Registre Social Unifi é (unifi ed social registry) began with the establishment of the Jigisemejiri Cash Transfer Program. Its objectives are to reduce costs and program coverage overlap, and to facilitate the rapid expansion of programs to respond to shocks. In the Republic of Congo, a registry was developed through the conditional cash transfer program.
Source: Interviews with program experts.
ANCHORING SOCIAL SAFETY NETS IN STRONG INSTITUTIONS 213
(see table 4.4). Similarly, complementary services, such as behavioral change activities that target social safety net beneficiaries, are often managed by specialized United Nations agencies (such as the United Nations Children’s Fund) or NGOs, as in Niger.
In fragile settings or in countries where humanitarian programs are promi-nent, NGOs and development partners frequently play a critical role. Indeed, the coordination and oversight of these large programs implemented outside of government are of large practical importance because of the size of the pro-grams and the political nature of the response to shocks. In most Sahelian coun-tries, humanitarian actors have initiated eff orts to coordinate interventions, capitalize on good practices, and engage in advocacy (box 4.6). Th ese initiatives have sometimes been formalized as alliances, such as in Mauritania, Niger, and Senegal. Th ey can help support government eff orts to coordinate the response to shocks.
Decentralization May Boost Flexibility and Adaptability, but Compromise Equity and TransparencyAcross Africa, government decentralization is aff ecting the design, delivery, and, in some cases, the fi nancing of social safety nets. Most countries have adopted some degree of decentralization, defi ned here to include deconcentra-tion and devolution. Deconcentration occurs when decision making and man-agement responsibilities are distributed to different entities of the central government and oft en involves shift ing responsibilities from central government offi cials to central government actors working in regions, prov-inces, or districts. Devolution occurs when governments transfer authority for decision making, fi nancing, and management to quasi-autonomous units of local governments, such as municipalities that elect their own mayors and councils, raise their own revenues, and exercise independent authority in investment decisions.11 Th e argument in favor of the decentralization of services is that it distributes decision making closer to the people to increase the likeli-hood that the choices made by leaders refl ect the preferences of the people and encourage greater responsiveness to local concerns across a wider range of issues. Th ese is no strong evidence on the eff ects of devolution or deconcentra-tion on the functioning of social safety nets. Two of the largest social safety net programs off er contrasting experiences.
Prospera, the conditional cash transfer program in Mexico, is centralized, while the operation of Brazil’s Bolsa Família is deconcentrated to states. Th e case of South Africa off ers some insights: prior to the launch of the South Africa Social Security Agency, nine provincial governments were responsible for the implementation of seven social grants off ered by the government. Th is devolved implementation was characterized by delays in the processing of grant applica-tions, delayed grant payments, concerns over fraud and corruption, and high
214 REALIZING THE FULL POTENTIAL OF SOCIAL SAFETY NETS IN AFRICA
BOX 4.6
Sahel Humanitarian Coordination for Food SecurityHumanitarian actors in West Africa are seeking to create links with government programs. In particular, technical collaboration has emerged in several countries in building unifi ed national registries to identify and target households during responses to shocks.
In most Sahelian countries, humanitarian actors have initiated efforts to coordinate their interventions on food and nutrition security, capitalize on good practices, and engage in advocacy based on experiences. The nature of the efforts has depended on the country and has sometimes been formalized as an alliance, such as the Cadre Commun in Niger, Alliance Cash in Mauritania, and CORRIANS in Senegal, mainly with the fi nancial support of the ECHO Project.
To harmonize their approaches in addressing food insecurity, humanitarian actors have developed or adopted common tools. For instance, the Cadre Harmonisé (regional framework), a methodology developed by the Permanent Interstate Committee for Drought Control in the Sahel (Comité permanent Inter-Etats de Lutte contre la Sécheresse dans le Sahel, CILSS) to analyze food security, is used for the early identifi cation of areas that are at risk of food insecurity and the number of people projected to be affected. Humanitarian actors also support the collection of primary data, such as through the hunger biomass map of Action Against Hunger and improvements in national early warning systems. They have likewise harmonized a household targeting methodology through a community-based approach, Household Economy Analysis (HEA), which was developed by Save the Children UK in the mid-1990s. Program evaluation activities have been coordinated through a common postdistribution monitoring design (Niger) and a joint grievance mechanism (Senegal). Coordination has recently been strengthened through meetings of regional alliances (Niamey in 2015 and Dakar in 2016).
The coordinated effort of development partners is also promoting the creation of synergies with government programs. In particular, the inclusion of development partner interventions in government-led annual food insecurity response plans has improved coordination and has also highlighted the differences in intervention methods and principles among actors. Strengthening the dialogue between humanitarian actors and governments has helped to overcome misunderstandings linked to the constraints among humanitarian actors, who are limited in their collaboration by the short funding cycle.
A technical collaboration has emerged in several countries to build national unifi ed registries (Burkina Faso, Chad, Niger) and use them in identifying and targeting house-holds during responses to shocks (Mauritania, Senegal).
Source: Interviews with program experts.
ANCHORING SOCIAL SAFETY NETS IN STRONG INSTITUTIONS 215
administrative costs. Th e reform that led to the creation of the new central agency assigned the responsibility for the management and implementation of these grants to one administrative unit with a central offi ce and service offi ces in each province.
In most African countries, most and perhaps all programs are funded centrally, and national organizations set out key parameters and guidelines; the notable exception is NGO-implemented programs that are not overseen or managed by national governments. The delivery of the various elements of social safety nets may remain with central ministries or be deconcen-trated to local staff. Typically, if implementation is carried out through a PIU, as in Burkina Faso, the delivery is centralized, and staff are recruited by the ministry to coordinate local activities. SAGAs, such as in Sierra Leone and South Africa, establish offices or recruit local staff to deliver social safety net services. In other cases, the frontline delivery of social safety nets falls to staff who report directly to local governments (devolution). In these cases, the staff—who are likely the same professional cadre as the respon-sible ministry, such as social workers in the case of a social ministry—are required to follow centrally established guidelines and standards. But, in a devolved context, the national organization responsible for the program does not directly manage frontline workers. These staff are accountable to local authorities. In Botswana, social workers supporting the frontline implementation of the Social Cash Transfer Program are accountable to local authorities. In such situations, local authorities recruit staff based on locally defined criteria and pay them through locally managed budgets, which may be devolved from central authorities. Often, local authorities also establish the local priorities, which may or may not include the aims and objectives of the social safety net programs.
While national, standardized guidelines exist in most programs, these oft en contain provisions for some degree of local decision making. National guide-lines typically describe the various procedures to be followed in implementing program targeting, registration, payments, case management, grievance mecha-nisms, and exits. Th ese guidelines, however, sometimes allow local implement-ers in deconcentrated and devolved settings leeway in adapting programs to local conditions. Indeed, national standards enable consistent implementation, but some tasks can also benefi t from devolved decision making so programs take local realities into account. Th is fl exibility can result in more eff ective pro-cesses, such as in the context of some targeting processes, and can encourage local buy-in, thereby generating legitimacy for the program among communi-ties and local leaders. However, it can also result in distortions or biases in the implementation of programs. In this case, local norms or practices may lead to favoritism, to the advantage of particular groups or objectives. Table 4.5 pro-vides examples of the variation in the delegation of selected tasks and decision
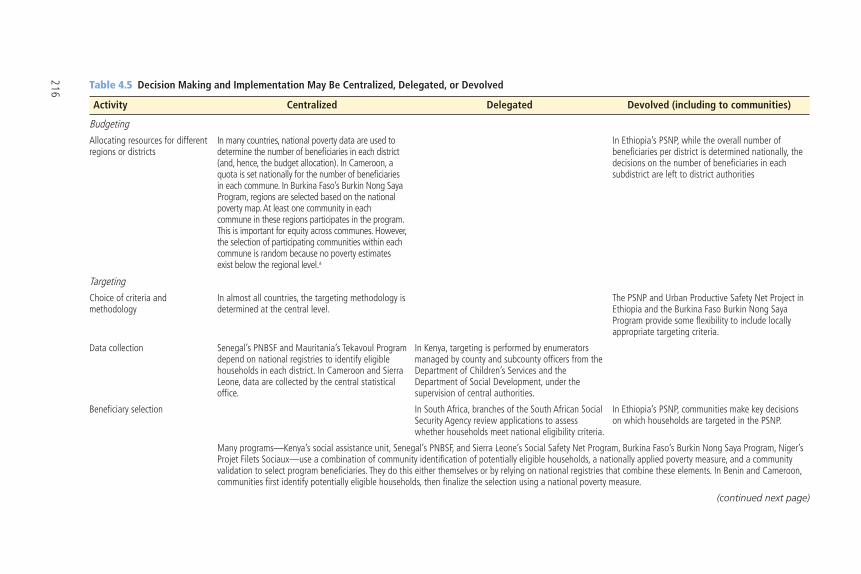
216 Table 4.5 Decision Making and Implementation May Be Centralized, Delegated, or Devolved
Activity Centralized Delegated Devolved (including to communities)
Budgeting
Allocating resources for different regions or districts
In many countries, national poverty data are used to determine the number of benefi ciaries in each district (and, hence, the budget allocation). In Cameroon, a quota is set nationally for the number of benefi ciaries in each commune. In Burkina Faso’s Burkin Nong Saya Program, regions are selected based on the national poverty map. At least one community in each commune in these regions participates in the program. This is important for equity across communes. However, the selection of participating communities within each commune is random because no poverty estimates exist below the regional level.a
In Ethiopia’s PSNP, while the overall number of benefi ciaries per district is determined nationally, the decisions on the number of benefi ciaries in each subdistrict are left to district authorities
Targeting
Choice of criteria and methodology
In almost all countries, the targeting methodology is determined at the central level.
The PSNP and Urban Productive Safety Net Project in Ethiopia and the Burkina Faso Burkin Nong Saya Program provide some fl exibility to include locally appropriate targeting criteria.
Data collection Senegal’s PNBSF and Mauritania’s Tekavoul Program depend on national registries to identify eligible households in each district. In Cameroon and Sierra Leone, data are collected by the central statistical offi ce.
In Kenya, targeting is performed by enumerators managed by county and subcounty offi cers from the Department of Children’s Services and the Department of Social Development, under the supervision of central authorities.
Benefi ciary selection In South Africa, branches of the South African Social Security Agency review applications to assess whether households meet national eligibility criteria.
In Ethiopia’s PSNP, communities make key decisions on which households are targeted in the PSNP.
Many programs—Kenya’s social assistance unit, Senegal’s PNBSF, and Sierra Leone’s Social Safety Net Program, Burkina Faso’s Burkin Nong Saya Program, Niger’s Projet Filets Sociaux—use a combination of community identifi cation of potentially eligible households, a nationally applied poverty measure, and a community validation to select program benefi ciaries. They do this either themselves or by relying on national registries that combine these elements. In Benin and Cameroon, communities fi rst identify potentially eligible households, then fi nalize the selection using a national poverty measure.
(continued next page)
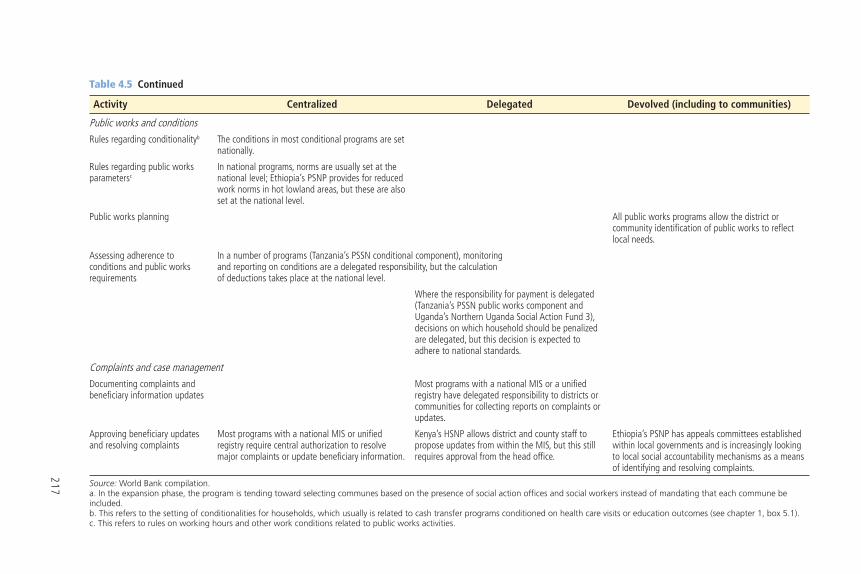
217
Table 4.5 Continued
Activity Centralized Delegated Devolved (including to communities)
Public works and conditions
Rules regarding conditionalityb The conditions in most conditional programs are set nationally.
Rules regarding public works parametersc
In national programs, norms are usually set at the national level; Ethiopia’s PSNP provides for reduced work norms in hot lowland areas, but these are also set at the national level.
Public works planning All public works programs allow the district or community identifi cation of public works to refl ect local needs.
Assessing adherence to conditions and public works requirements
In a number of programs (Tanzania’s PSSN conditional component), monitoring and reporting on conditions are a delegated responsibility, but the calculation of deductions takes place at the national level.
Where the responsibility for payment is delegated (Tanzania’s PSSN public works component and Uganda’s Northern Uganda Social Action Fund 3), decisions on which household should be penalized are delegated, but this decision is expected to adhere to national standards.
Complaints and case management
Documenting complaints and benefi ciary information updates
Most programs with a national MIS or a unifi ed registry have delegated responsibility to districts or communities for collecting reports on complaints or updates.
Approving benefi ciary updates and resolving complaints
Most programs with a national MIS or unifi ed registry require central authorization to resolve major complaints or update benefi ciary information.
Kenya’s HSNP allows district and county staff to propose updates from within the MIS, but this still requires approval from the head offi ce.
Ethiopia’s PSNP has appeals committees established within local governments and is increasingly looking to local social accountability mechanisms as a means of identifying and resolving complaints.
Source: World Bank compilation.a. In the expansion phase, the program is tending toward selecting communes based on the presence of social action offices and social workers instead of mandating that each commune be included.b. This refers to the setting of conditionalities for households, which usually is related to cash transfer programs conditioned on health care visits or education outcomes (see chapter 1, box 5.1).c. This refers to rules on working hours and other work conditions related to public works activities.
218 REALIZING THE FULL POTENTIAL OF SOCIAL SAFETY NETS IN AFRICA
making to local structures. Local decision making may include community involvement in the identifi cation of benefi ciaries, community or district involvement in the choice of projects in public works schemes, district involve-ment in priority setting, and community or district decision making on the penalties for noncompletion of public works projects or failure to meet health care or education objectives.
Many of the challenges associated with coordination experienced at the national level are less apparent among local implementers. Indeed, proximity facilitates communication among the staff of national institutions at the local level in the context of deconcentration. In practice, staff off er mutual support in the implementation of their respective programs.
Beyond the staff and consultants who oversee targeting, make payments, or facilitate local planning, a range of local actors oft en infl uence and shape how various aspects of a social safety net are carried out. Th e involvement of communities—oft en through local leaders or committees comprising teach-ers, extension workers, and representatives of youth groups—is common in Africa (see table 4.5). Th eir involvement is most frequently seen in targeting, which enables communities to use their local knowledge to identify those people or households who meet the eligibility criteria or are considered by the community to deserve support. Th e involvement of local leaders can also lend legitimacy to these processes. In the Afar Regional State in Ethiopia, the regional government sought the participation of religious leaders in the tar-geting process in an eff ort to ensure that the poorest and most deserving of support were selected. Despite this, the extent to which local leaders (tradi-tional chiefs, elders, tribal leaders) are assigned formal roles in social safety net programs varies. If such roles are not defi ned, this can create confusion as these leaders and their communities are left to play the roles appropriate to local dynamics of power.
Creating Incentives to Encourage Individual Actors to Deliver Results
Management structures and coordination mechanisms incentivize or constrain the people who oversee and deliver social safety nets. Programs may be deliv-ered by government staff who are fully dedicated to the program or by govern-ment staff for whom social safety net activities are added to their other workloads. Th ese may be civil servants or consultants. Key functions might also be subcontracted to private sector providers, such as administering payments (contracted to post offi ces and a mobile phone company in Senegal, for instance), organizing training activities (NGOs in Senegal’s PNBSF), or even
ANCHORING SOCIAL SAFETY NETS IN STRONG INSTITUTIONS 219
running the PIU (as is the case of Chad). Government staff may work full time on a program, but social safety net activities may represent only a small part of the labor burden of district staff , and core government staff may also work alongside contract staff . Many programs make use of voluntary community structures to realize elements of program implementation, particularly local planning and benefi ciary selection. Most programs use a combination of these arrangements. Table 4.6 highlights selected strengths and weaknesses of various approaches.
A range of other factors that incentivize or constrain staff performance are becoming increasingly important for social safety nets in Africa. Incentives can come in many forms (de Neubourg 2002). Numerous studies have explored how low salaries, limited career advancement, and poor performance management lead to low motivation and general job dissatisfaction in the public sector. (Th ese management structures are infl uenced to varying degrees by a country’s civil service or public sector management reform; see Brinkerhoff and Brinkerhoff 2015). Th ese factors can also lead to high rates of staff turnover, generating gaps in the capacity of social safety nets in countries such as Ethiopia, Malawi, Rwanda, and Uganda. In Sierra Leone, low remuneration rates have been identifi ed as a key constraint in attracting qualifi ed personal, as suggested by the widespread use of coping arrangements to off set the low public sector pay scale. Srivastava and Larizza (2013) identify the features of these coping arrange-ments as follows: (1) relatively well-paid technical assistance, oft en funded by development partners, in line positions; (2) PIUs; (3) externally funded line agencies; and, (4) other ad hoc salary increases. Interagency rivalry or competi-tion for status or resources among government ministries can also lead to a lack of willingness to cooperate on programs, resulting in poor coordination. As social safety nets expand and are increasingly anchored in government systems, there will be a need to consider how the incentives and constrains inherent in the civil service aff ect the functioning of the program and to engage with and support broader civil service reform.
Development partner funding for social safety nets is oft en accompanied by rules and incentives with short- and long-term implications for staff motivation. Civil servants working on social safety net programs funded by development partners may have heavier workloads or be expected to perform to a higher standard than other civil servants. Yet, their remuneration oft en remains the same, guided by civil service scales and norms. Th is is frequently cited as the rationale for increases in the salaries of civil servants working on these programs, through fuel and telephone vouchers, for instance. In cases in which civil servants and hired externally funded consultants are working side, by side and interacting on a daily basis to deliver, for example, health extension services or agricultural extension services to benefi ciaries (Burkina Faso, Cameroon, Ethiopia), competition and resentment may grow among the civil servants
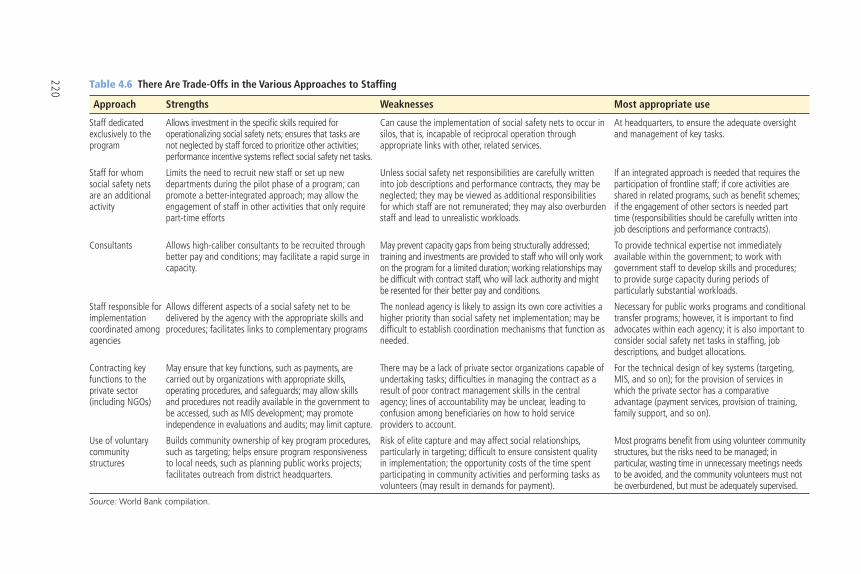
220 Table 4.6 There Are Trade-Offs in the Various Approaches to Staffing
Approach Strengths Weaknesses Most appropriate use
Staff dedicated exclusively to the program
Allows investment in the specifi c skills required for operationalizing social safety nets; ensures that tasks are not neglected by staff forced to prioritize other activities; performance incentive systems refl ect social safety net tasks.
Can cause the implementation of social safety nets to occur in silos, that is, incapable of reciprocal operation through appropriate links with other, related services.
At headquarters, to ensure the adequate oversight and management of key tasks.
Staff for whom social safety nets are an additional activity
Limits the need to recruit new staff or set up new departments during the pilot phase of a program; can promote a better-integrated approach; may allow the engagement of staff in other activities that only require part-time efforts
Unless social safety net responsibilities are carefully written into job descriptions and performance contracts, they may be neglected; they may be viewed as additional responsibilities for which staff are not remunerated; they may also overburden staff and lead to unrealistic workloads.
If an integrated approach is needed that requires the participation of frontline staff; if core activities are shared in related programs, such as benefi t schemes; if the engagement of other sectors is needed part time (responsibilities should be carefully written into job descriptions and performance contracts).
Consultants Allows high-caliber consultants to be recruited through better pay and conditions; may facilitate a rapid surge in capacity.
May prevent capacity gaps from being structurally addressed; training and investments are provided to staff who will only work on the program for a limited duration; working relationships may be diffi cult with contract staff, who will lack authority and might be resented for their better pay and conditions.
To provide technical expertise not immediately available within the government; to work with government staff to develop skills and procedures; to provide surge capacity during periods of particularly substantial workloads.
Staff responsible for implementation coordinated among agencies
Allows different aspects of a social safety net to be delivered by the agency with the appropriate skills and procedures; facilitates links to complementary programs
The nonlead agency is likely to assign its own core activities a higher priority than social safety net implementation; may be diffi cult to establish coordination mechanisms that function as needed.
Necessary for public works programs and conditional transfer programs; however, it is important to fi nd advocates within each agency; it is also important to consider social safety net tasks in staffi ng, job descriptions, and budget allocations.
Contracting key functions to the private sector (including NGOs)
May ensure that key functions, such as payments, are carried out by organizations with appropriate skills, operating procedures, and safeguards; may allow skills and procedures not readily available in the government to be accessed, such as MIS development; may promote independence in evaluations and audits; may limit capture.
There may be a lack of private sector organizations capable of undertaking tasks; diffi culties in managing the contract as a result of poor contract management skills in the central agency; lines of accountability may be unclear, leading to confusion among benefi ciaries on how to hold service providers to account.
For the technical design of key systems (targeting, MIS, and so on); for the provision of services in which the private sector has a comparative advantage (payment services, provision of training, family support, and so on).
Use of voluntary community structures
Builds community ownership of key program procedures, such as targeting; helps ensure program responsiveness to local needs, such as planning public works projects; facilitates outreach from district headquarters.
Risk of elite capture and may affect social relationships, particularly in targeting; diffi cult to ensure consistent quality in implementation; the opportunity costs of the time spent participating in community activities and performing tasks as volunteers (may result in demands for payment).
Most programs benefi t from using volunteer community structures, but the risks need to be managed; in particular, wasting time in unnecessary meetings needs to be avoided, and the community volunteers must not be overburdened, but must be adequately supervised.
Source: World Bank compilation.
ANCHORING SOCIAL SAFETY NETS IN STRONG INSTITUTIONS 221
because consultants are oft en paid higher salaries. More generally, studies in West Africa show that the position of focal point in a project funded by develop-ment partners is highly sought because it provides access to islands of function-ality and resources; civil servants who are not working on these externally funded projects may become apathetic toward project objectives and activities because they do not receive the same benefi ts (Olivier de Sardan 2013).
Within devolved contexts, local administrative structures, priorities, and incen-tive systems oft en determine the motivation of locally recruited staff . In the case of devolution, if local governments manage the staff responsible for implementation, program activities must be adequately refl ected in local government plans. Th e alignment of program objectives with the objectives of the local governments can help ensure the political and managerial support of local authorities. To be eff ective, however, this alignment of aims should be translated into the detailed terms of refer-ences, work plans, and performance reviews of local staff . Even in countries such as Botswana, where the social safety net program is mature and has been fostered mainly by national stakeholders, the widespread reliance on locally hired staff has not translated into the prioritization of the roles and functions of these staff mem-bers by the local authorities who hire and pay. In Rwanda, concerns have been raised about the availability of staff to undertake the tasks associated with the social safety net program in districts because of competing priorities and a lack of clarity on the accountability for monitoring and reporting. Within a devolved setting, the knowledge, priorities, and skills of local managers and elected leaders can thus sig-nifi cantly infl uence social safety net programs. If local managers understand the objectives of the program and are trained in leadership skills, they become more engaged. Experience with the Ethiopia PSNP shows that, for these reasons, local managers paid more attention to the technical experts who were carrying out tasks for the PSNP, such as facilitating local planning, organizing public works, and mak-ing payments. Th ey were more confi dent in encouraging their teams to embrace shared objectives and responsibilities. Th rough a sense of engagement, leaders were able to build trust within their teams. Such changes in leadership have resulted in team members performing at a higher level. In contrast, low-performing districts are more oft en characterized by new or unengaged leaders than by the quality of the skills among the technical experts.12
In many countries, informal practices infl uence the ability and willingness of staff to carry out their functions. For example, it has become common for civil ser-vants to use the per diems associated with training, workshops, and monitoring visits to supplement their salaries. Th e implications of this per diem culture are vari-ous. Th e desire to receive a per diem may bring people together to overcome a bar-rier in decision making or resolve technical issues. Th e desire to collect per diems may also undermine reforms. For instance, the introduction of e-payments and electronic reporting systems may be resisted by staff if these systems reduce the need for monitoring visits by staff , which enable them to draw per diems. In some
222 REALIZING THE FULL POTENTIAL OF SOCIAL SAFETY NETS IN AFRICA
countries, informal networks and personal or political connections infl uence hiring decisions within the civil service, thereby limiting the role played by technical expertise and merit and resulting in suboptimal program staffi ng.
Notes
1. Th is is echoed in the human rights approach to social protection. Th us, “social protection programmes must be enshrined and defi ned in national legal frame-works and supported by a national strategy and plan of action” (Sepúlveda and Nyst 2012, 26).
2. See “International Covenant on Economic, Social, and Cultural Rights,” Offi ce of the United Nations High Commissioner for Human Rights, Geneva, http://www.ohchr .org/EN/ProfessionalInterest/Pages/CESCR.aspx; “Universal Declaration of Human Rights,” United Nations, New York, http://www.un.org/en/universal -declaration-human-rights/.
3. “African Charter on Human and Peoples’ Rights,” African Commission on Human and Peoples’ Rights, Banjul, Th e Gambia, http://www.achpr.org/instruments/achpr/. See chapter 3, box 3.3.
4. See “R202, Social Protection Floors Recommendation, 2012 (No. 202): Recommendation Concerning National Floors of Social Protection,” International Labour Organization, Geneva, http://www.ilo.org/dyn/normlex/en/f?p=NORMLEXPUB:12100:0::NO::P12100_ILO_CODE:R202.
5. See AU (2008); NANHRI (2006). For the Livingstone Call for Action, see “Zambia: Social Protection Conference Issues Call to Action,” Pambazuka News, April 12, 2006, https://www.pambazuka.org/resources/zambia-social-protection-conference -issues-call-action. See also “Ouagadougou Declaration and Plan of Action on Accelerating Prisons and Penal Reforms in Africa,” African Commission on Human and Peoples’ Rights, Banjul, The Gambia, http://www.achpr.org/instruments / ouagadougou-planofaction/; “Yaoundé Declaration on the Implementation of the Sendai Framework in Africa,” Declaration of the Fourth High Level Meeting on Disaster Risk Reduction Held in Yaoundé, Cameroon, on July 23, 2015, African Union, Addis Ababa, http://www.ifrc.org/Global/Publications/IDRL/regional / Yaounde%20Declaration%20DRR%20EN%2023072015.pdf.
6. Even countries without specifi c constitutional provisions—such as Chad, Republic of Congo, Mauritania, and Senegal—shave adapted relevant articles of the International Covenant on Economic, Social, and Cultural Rights and the Universal Declaration of Human Rights in their constitutions.
7. In the case of Uganda, this concern arose, in part, against a backdrop of signifi cant national fi nancing committed to antiretroviral drugs.
8. However, in Burkina Faso, even programs run by consultants fi nanced by develop-ment partners must follow the rules set out in government decrees on hiring and staff compensation.
ANCHORING SOCIAL SAFETY NETS IN STRONG INSTITUTIONS 223
9. For example, Olivier de Sardan (2013) explains that, in West Africa, civil servants and local administrators are oft en focused on gaining formal or informal access to development aid.
10. Th e OVC Program was run by the Department of Children’s Services, while the cash transfer programs for older persons and persons with severe disabilities were run by the Department of Social Development.
11. Deconcentration tends to involve only the delegation of certain tasks and decisions, though the upward accountability to supervising ministries tends to take precedence over any local accountability. Decentralization includes the relinquishment of power by the central government to actors at a lower level in a political-administrative hierarchy. At a minimum, it devolves substantial decision-making powers to locally representative bodies, but it may also include the decentralization of fi scal resources and revenue-generating powers. One type of decentralization is delegation, whereby responsibility for decision making and the administration of public functions are transferred to semiautonomous organizations not wholly controlled by the central government, but ultimately accountable to it, such as public enterprises or corpora-tions, housing authorities, transportation authorities, and semiautonomous school districts. See Ribot (2002).
12. Personal communication, Paul Derksin, August 2017.
References
Andrews, Matt. 2013. Th e Limits of Institutional Reform in Development: Changing Rules for Realistic Solutions. Cambridge: Cambridge University Press.
AU (African Union). 2008. “Social Policy Framework for Africa.” First Session of the AU Conference of Ministers in Charge of Social Development, Windhoek, Namibia, October 27–31, Document CAMSD/EXP/4(I), AU, Addis Ababa.
Barma, Naazneen H., Elisabeth Huybens, and Lorena Viñuela, eds. 2014. Institutions Taking Root: Building State Capacity in Challenging Contexts. New Frontiers in Social Policy Series. Washington, DC: World Bank.
Black Sash. 2010. Social Assistance: A Reference Guide for Paralegals. Cape Town: Black Sash.
Bridges, Kate. 2016. “Why the Iceberg Sinks: A Critical Look at Malawi’s History of Institutional Reform.” Background paper for, Malawi Country Economic Memorandum 2016, World Bank, Washington, DC.
Bridges, Kate, and Michael Woolcock. 2017. “How (Not) to Fix Problems Th at Matter: Assessing and Responding to Malawi’s History of Institutional Reform.” Policy Research Working Paper 8289, World Bank, Washington, DC.
Brinkerhoff , Derick W., and Jennifer M. Brinkerhoff . 2015. “Public Sector Management Reform in Developing Countries: Perspectives beyond NPM Orthodoxy.” Public Administration and Development 35 (4): 222–37.
224 REALIZING THE FULL POTENTIAL OF SOCIAL SAFETY NETS IN AFRICA
Carroll, Kate. 2011. “Addressing Inequality: Framing Social Protection in National Development Strategies.” IDS Bulletin 42 (6): 89–95.
de Neubourg, Chris. 2002. “Incentives and the Role of Institutions in the Provision of Social Safety Nets.” Social Protection Discussion Paper 226, Social Safety Net Primer Series, World Bank, Washington, DC.
d’Iribarne, Philippe, and Alain Henry. 2015. “Th e Cultural Roots of Eff ective Institutions.” Background paper for, World Development Report 2017: Governance and the Law, World Bank, Washington, DC.
Devereux, Stephen. 2010. “Building Social Protection Systems in Southern Africa.” Background paper for, European Report on Development, Centre for Social Protection, Institute of Development Studies, Brighton, UK.
Garcia, Marito H., and Charity M. T. Moore. 2012. Th e Cash Dividend: Th e Rise of Cash Transfer Programs in Sub-Saharan Africa. Directions in Development: Human Development Series. Washington, DC: World Bank.
Goyal, Radhika, Clare Leaver, Sally Murray, Pieter Serneels, and Andrew Zeitlin. 2014. “Strengthening Public Sector Performance Contracts in Rwanda.” IGC Rapid Response Note, International Growth Centre, London School of Economics and Political Science, London.
Grindle, Merilee S. 1997. “Divergent Cultures? When Public Organizations Perform Well in Developing Countries.” World Development 25 (4): 481–95.
Hickey, Samuel. 2012. “Turning Governance Th inking Upside-Down? Insights from the Politics of What Works.” Th ird World Quarterly 33 (7): 1231–47.
Holmemo, Camillla, and Rachel Ort. 2017. “Institutional Design and Coordination of Social Safety Nets: Adapting Good Practice to Institutional and Political Realities in Nigeria.” Working paper, World Bank, Washington, DC.
ILO (International Labour Organization), UNICEF (United Nations Children’s Fund), and WFP (World Food Programme). 2015. “Capitalising on UN Experience: Th e Development of a Social Protection Floor in Mozambique.” United Nations Joint Programme on Social Protection, Maputo, Mozambique.
Kaltenborn, Markus, Abdul-Gafaru Abdulai, Keetie Roelen, and Sarah Hague. 2017. “Th e Infl uence of Policy and Legal Frameworks on the Development of National Social Protection Systems.” IDS Working Paper 501, Centre for Social Protection, Institute of Development Studies, Brighton, UK.
Krause, Philipp. 2013. “Of Institutions and Butterfl ies: Is Isomorphism in Developing Countries Necessarily a Bad Th ing?” Background Note, Overseas Development Institute, London.
Left wich, Adrian. 2006. “What Are Institutions.” IPPG Briefi ng Paper 1, Research Programme Consortium on Improving Institutions for Pro-Poor Growth, University of Manchester, Manchester.
Leftwich, Adrian, and Kunal Sen. 2010. “Beyond Institutions: Institutions and Organizations in the Politics and Economics of Growth and Poverty Reduction, a Thematic Synthesis of Research Evidence.” Research Programme Consortium on Improving Institutions for Pro-Poor Growth, University of Manchester, Manchester.
ANCHORING SOCIAL SAFETY NETS IN STRONG INSTITUTIONS 225
Mathauer, Inke. 2004. “Institutional Analysis for Safety Net Interventions.” Social Protection Discussion Paper 418, World Bank, Washington, DC.
Mehta, Lyla, Melissa Leach, Peter Newell, Ian Scoones, K. Sivaramakrishnan, and Sally-Anne Way. 1999. “Exploring Understandings of Institutions and Uncertainty: New Directions in Natural Resource Management.” IDS Discussion Paper 372, Institute of Development Studies, Brighton, UK.
MEPATI (Republic of Congo, Ministère de l’Economie, du Plan, de l’Administration du Territoire et de l’Intégration). 2012. Document de Stratégie pour la Croissance, l’Emploi et la Réduction de la Pauvreté (DSCERP 2012–2016). Brazzaville: MEPATI.
Monchuk, Victoria. 2014. Reducing Poverty and Investing in People: New Role of Safety Nets in Africa. Directions in Development: Human Development Series. Washington, DC: World Bank.
North, Douglass C. 1989. “Institutions and Economic Growth: A Historical Perspective.” World Development 17 (9): 1319–32.
North, Douglass C., John Joseph Wallis, Steven B. Webb, and Barry R. Weingast. 2007. “Limited Access Orders in the Developing World: A New Approach to the Problems of Development.” Policy Research Working Paper 4359, World Bank, Washington, DC.
Olivier de Sardan, Jean-Pierre. 2013. “Th e Bureaucratic Mode of Governance and Practical Norms in West Africa and Beyond.” In Local Politics and Contemporary Transformations in the Arab World: Governance beyond the Center, edited by Malika Bouziane, Cilja Harders, and Anja Hoff mann, 43–64. Governance and Limited Statehood Series. London: Palgrave Macmillan.
Ostrom, Elinor. 1990. Governing the Commons: Th e Evolution of Institutions for Collective Action. Cambridge, U.K.: Cambridge University Press.
Pritchett, Lant, Michael Woolcock, Matt Andrews. 2013. “Looking Like a State: Techniques of Persistent Failure of State Capability for Implementation.” Journal of Development Studies 49 (1): 1–18.
Ribot, Jesse C. 2002. “African Decentralization: Local Actors, Powers, and Accountability.” Democracy, Governance, and Human Rights Paper 8, United Nations Research Institute for Social Development, Geneva.
Ridde, Valéry. 2010. “Per Diems Undermine Health Interventions, Systems, and Research in Africa: Burying Our Heads in the Sand.” Tropical Medicine and International Health 15 (7): E1–E4.
Robalino, David A., Laura Rawlings, and Ian Walker. 2012. “Building Social Protection and Labor Systems: Concepts and Operational Implications.” Background paper for, Social Protection and Labor Strategy 2012–22, World Bank, Washington, DC.
Rodrik, Dani, and Arvind Subramanian. 2003. “Th e Primacy of Institutions (and What Th is Does and Does Not Mean).” Finance and Development 40 (2): 31–34.
Rubio, Gloria. 2011. “Measuring Governance and Service Delivery in Safety Net Programs.” SP Discussion Paper 1119, World Bank, Washington, DC.
Scott, W. Richard. 2008. Institutions and Organizations: Ideas and Interests, 3rd ed. Th ousand Oaks, CA: Sage Publications.
226 REALIZING THE FULL POTENTIAL OF SOCIAL SAFETY NETS IN AFRICA
Scott, Zoë. 2011. “Evaluation of Public Sector Governance Reforms 2001–2011: Literature Review.” May 31, Oxford Policy Management, Oxford.
Sepúlveda, Magdalena 2014. “Th e Rights-Based Approach to Social Protection in Latin America: From Rhetoric to Practice.” Políticas Sociales 189, United Nations Economic Commission for Latin America and the Caribbean, Santiago.
Sepúlveda, Magdalena, and Carly Nyst. 2012. “Th e Human Rights Approach to Social Protection.” Elements for Discussion Series, Unit for Development Communications, Ministry for Foreign Aff airs, Helsinki.
Simons, Andrew M. 2016. “What Is the Optimal Locus of Control for Social Assistance Programs? Evidence from the Productive Safety Net Programme in Ethiopia.” ESSP Working Paper 86 (April), Ethiopia Strategy Support Program, International Food Policy Research Institute, Washington, DC.
Srivastava, Vivek, and Marco Larizza. 2013. “Working with the Grain for Reforming the Public Service: A Live Example from Sierra Leone.” International Review of Administrative Science 79 (3) 458–85.
UNDP (United Nations Development Programme). 2009. “Capacity Development: A UNDP Primer.” Capacity Development Group, Bureau for Development Policy, UNDP, New York.
UNDP (United Nations Development Programme) and African Management Development Institute Network. 2017. “Report on the State of the Public Service in Africa: Experiences from the Water, Education, and Health Sectors in Selected Countries.” UNDP, New York.
Vian, Taryn, Candace Miller, Zione Th emba, and Paul Bukuluki. 2013. “Perceptions of Per Diems in the Health Sector: Evidence and Implications.” Health Policy and Planning 28 (3): 237–46.
World Bank. 2012. “Th e World Bank’s Approach to Public Sector Management 2011–2020: Better Results from Public Sector Institutions.” February 3, World Bank, Washington, DC.
———. 2015. Th e State of Social Safety Nets 2015. Washington, DC: World Bank.———. 2017. World Development Report 2017: Governance and the Law. Washington,
DC: World Bank.
227
Chapter 5
Harnessing Resources to Expand and Sustain Social Safety NetsLucilla Maria Bruni, Melis Guven, and Emma Monsalve
Expanding the coverage of programs represents a serious fi scal challenge. Currently, governments in Africa are spending about 1.2 percent of gross domestic product (GDP) on social safety nets. Th is is lower than the spend-ing on other sectors, such as energy, health care, education, and, in some cases, the military. Th is level of spending and the predictability of expendi-tures are inadequate to face the high chronic poverty rates and vulnerability to shocks experienced in the region. Bringing these programs to scale will require a multipronged approach to fi scal systems.
First, countries need to make better use of existing resources. Th e operational effi ciency of programs needs to be improved. Th e scale and quality of the opera-tion of administrative tools are critical to greater effi ciency. Governments across the region have recently put considerable emphasis on enhancing administrative processes and systems. Effi ciency gains can also be harvested by raising allocative effi ciency to expand the reach of programs among the poor and vulnerable.
Th e level and sustainability of fi nancial resources must be upgraded. Development partners are crucial in the fi nancing of social safety nets in Africa. Given the fi scal constraints facing many governments, development partner support will continue to be critical to bringing programs to scale in most countries. Governments must fi nd the right mix of domestic, foreign, public, and nonpublic funding. Strengthening fi scal systems is the most sus-tainable option for fi nancing social safety nets at scale because of the uncer-tainties in the global macroeconomic and political environment, the rising costs of borrowing, and the unpredictability of external fi nancing. Reforming tax systems is a widely recognized imperative in Africa.
Finally, fl exible fi nancing strategies are needed to respond to shocks and crises effi ciently and in a timely manner. Contingency or reserve funds could be established to fi nance relief, rehabilitation, reconstruction, and prevention activities to address emergencies. Risk transfer mechanisms, which are fi nan-cial or insurance instruments, are another option to insure against shocks.
228 REALIZING THE FULL POTENTIAL OF SOCIAL SAFETY NETS IN AFRICA
How to fi nance social safety nets at scale sustainably is a pressing issue for policy makers. Th is report argues that bringing social safety nets to scale is key to responding to the challenges of chronic poverty and vulnerability to shocks across the region. However, governments across the world, but especially in Africa, face competing fi scal demands and fi nite budgets.
Financing social safety net programs at scale in Africa is therefore a chal-lenge. Rising to the challenge requires resolving both sides of the fi scal equation: expenditure and revenue. Th at means spending resources more eff ectively and boosting revenue. Considering social protection expenditure and revenue issues jointly boosts the likelihood of achieving revenue suffi ciency for sustained programs.
Spending and Financing for Social Safety Nets: A Snapshot
Chapter 1 highlights the main traits of spending on social safety nets in the region. On average, the region devotes 1.2 percent of GDP on social safety nets (equivalent to 4.6 percent of total government spending), compared with the global average of 1.6 percent. Th is is lower than the spending on other sectors, such as energy subsidies, health care, education, and, in some cases, the military (fi gure 5.1; appendix G, table G.1). In particular, spending on energy subsidies—oft en cited as a means of supporting vulnerable households, but largely regres-sive in practice—is greater than spending on social safety nets in the region, with particularly high levels in Central and Eastern Africa and in low-income countries.
Th ere is great variation across the Africa region in spending on social safety nets as a share of GDP. High-income and upper-middle-income countries spend an average of 2.5 and 2.2 percent of GDP (6.5 and 6.9 percent of total government expenditures, respectively), while low-income countries spend an average 1.4 percent of GDP (4.8 percent of total government expenditures; see fi gure 5.1 and appendix G, table G.3). Southern African countries spend an average 3.2 percent of GDP, three times more than countries in other subregions. Non-resource-rich countries devote more than twice as much to social safety nets (2.1 percent of GDP) as resource-rich countries (1 percent of GDP). Countries with lower exposure to droughts allocate fewer resources to these programs than coun-tries facing high or medium exposure (appendix G, table G.3).
Th e composition of social safety net spending also varies. Overall, cash transfer programs account for 41 percent of all social safety net spending in Africa (chapter 1, fi gure 1.4, and appendix G, table G.6). Social pensions repre-sent the second-highest share of spending (26 percent of total). In Southern Africa and upper-middle- or high-income countries, a larger share of social safety net spending goes to programs focused on the elderly. Spending on public
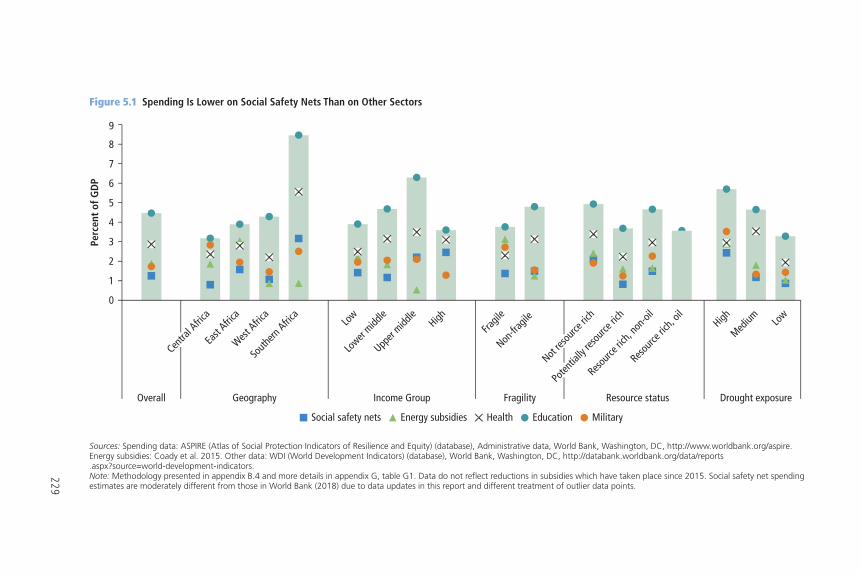
229
Figure 5.1 Spending Is Lower on Social Safety Nets Than on Other Sectors
Sources: Spending data: ASPIRE (Atlas of Social Protection Indicators of Resilience and Equity) (database), Administrative data, World Bank, Washington, DC, http://www.worldbank.org/aspire. Energy subsidies: Coady et al. 2015. Other data: WDI (World Development Indicators) (database), World Bank, Washington, DC, http://databank.worldbank.org/data/reports .aspx?source=world-development-indicators.Note: Methodology presented in appendix B.4 and more details in appendix G, table G1. Data do not reflect reductions in subsidies which have taken place since 2015. Social safety net spending estimates are moderately different from those in World Bank (2018) due to data updates in this report and different treatment of outlier data points.
Social safety nets Energy subsidies Health Education Military
0
1
2
3
4
5
6
7
8
9
East
Africa
West Afric
aSo
uthern
Africa
Low
Lower
middle
Upper
middle
High
Fragil
eNon
-frag
ile
Not res
ource
rich
Poten
tially
reso
urce r
ich
Resourc
e rich
, non
-oil
Resourc
e rich
, oil
HighMed
ium Low
Geography Income Group Fragility Resource status Drought exposure
Perc
ent
of G
DP
Centra
l Afric
a
Overall
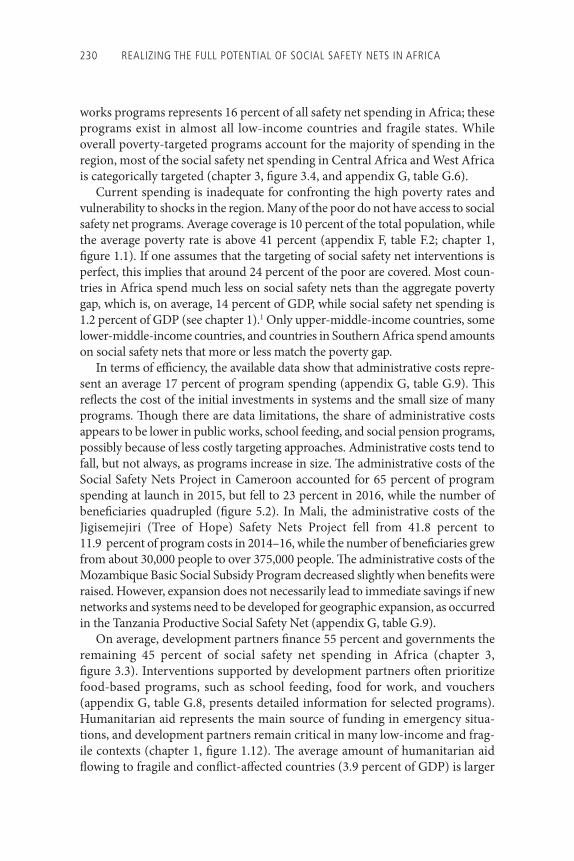
230 REALIZING THE FULL POTENTIAL OF SOCIAL SAFETY NETS IN AFRICA
works programs represents 16 percent of all safety net spending in Africa; these programs exist in almost all low-income countries and fragile states. While overall poverty-targeted programs account for the majority of spending in the region, most of the social safety net spending in Central Africa and West Africa is categorically targeted (chapter 3, fi gure 3.4, and appendix G, table G.6).
Current spending is inadequate for confronting the high poverty rates and vulnerability to shocks in the region. Many of the poor do not have access to social safety net programs. Average coverage is 10 percent of the total population, while the average poverty rate is above 41 percent (appendix F, table F.2; chapter 1, fi gure 1.1). If one assumes that the targeting of social safety net interventions is perfect, this implies that around 24 percent of the poor are covered. Most coun-tries in Africa spend much less on social safety nets than the aggregate poverty gap, which is, on average, 14 percent of GDP, while social safety net spending is 1.2 percent of GDP (see chapter 1).1 Only upper-middle-income countries, some lower-middle-income countries, and countries in Southern Africa spend amounts on social safety nets that more or less match the poverty gap.
In terms of effi ciency, the available data show that administrative costs repre-sent an average 17 percent of program spending (appendix G, table G.9). Th is refl ects the cost of the initial investments in systems and the small size of many programs. Th ough there are data limitations, the share of administrative costs appears to be lower in public works, school feeding, and social pension programs, possibly because of less costly targeting approaches. Administrative costs tend to fall, but not always, as programs increase in size. Th e administrative costs of the Social Safety Nets Project in Cameroon accounted for 65 percent of program spending at launch in 2015, but fell to 23 percent in 2016, while the number of benefi ciaries quadrupled (fi gure 5.2). In Mali, the administrative costs of the Jigisemejiri (Tree of Hope) Safety Nets Project fell from 41.8 percent to 11.9 percent of program costs in 2014–16, while the number of benefi ciaries grew from about 30,000 people to over 375,000 people. Th e administrative costs of the Mozambique Basic Social Subsidy Program decreased slightly when benefi ts were raised. However, expansion does not necessarily lead to immediate savings if new networks and systems need to be developed for geographic expansion, as occurred in the Tanzania Productive Social Safety Net (appendix G, table G.9).
On average, development partners fi nance 55 percent and governments the remaining 45 percent of social safety net spending in Africa (chapter 3, fi gure 3.3). Interventions supported by development partners oft en prioritize food-based programs, such as school feeding, food for work, and vouchers (appendix G, table G.8, presents detailed information for selected programs). Humanitarian aid represents the main source of funding in emergency situa-tions, and development partners remain critical in many low-income and frag-ile contexts ( chapter 1, fi gure 1.12). Th e average amount of humanitarian aid fl owing to fragile and confl ict-aff ected countries (3.9 percent of GDP) is larger
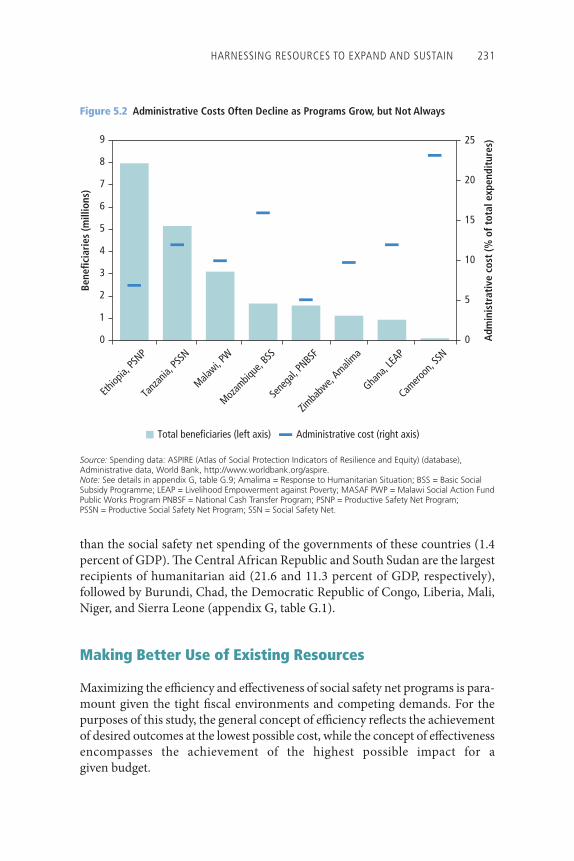
HARNESSING RESOURCES TO EXPAND AND SUSTAIN 231
than the social safety net spending of the governments of these countries (1.4 percent of GDP). Th e Central African Republic and South Sudan are the largest recipients of humanitarian aid (21.6 and 11.3 percent of GDP, respectively), followed by Burundi, Chad, the Democratic Republic of Congo, Liberia, Mali, Niger, and Sierra Leone (appendix G, table G.1).
Making Better Use of Existing Resources
Maximizing the effi ciency and eff ectiveness of social safety net programs is para-mount given the tight fi scal environments and competing demands. For the purposes of this study, the general concept of effi ciency refl ects the achievement of desired outcomes at the lowest possible cost, while the concept of eff ectiveness encompasses the achievement of the highest possible impact for a given budget.
Figure 5.2 Administrative Costs Often Decline as Programs Grow, but Not Always
Source: Spending data: ASPIRE (Atlas of Social Protection Indicators of Resilience and Equity) (database), Administrative data, World Bank, http://www.worldbank.org/aspire.Note: See details in appendix G, table G.9; Amalima = Response to Humanitarian Situation; BSS = Basic Social Subsidy Programme; LEAP = Livelihood Empowerment against Poverty; MASAF PWP = Malawi Social Action Fund Public Works Program PNBSF = National Cash Transfer Program; PSNP = Productive Safety Net Program; PSSN = Productive Social Safety Net Program; SSN = Social Safety Net.
0
5
10
15
20
25
0
1
2
3
4
5
6
7
8
9
Ethiop
ia, PS
NP
Tanz
ania,
PSSN
Malawi, P
W
Mozam
bique
, BSS
Sene
gal, P
NBSF
Zimba
bwe,
Amalima
Ghana
, LEA
P
Camero
on, S
SN
Adm
inis
trat
ive
cost
(% o
f tot
al e
xpen
ditu
res)
Bene
ficia
ries
(mill
ions
)
Total beneficiaries (left axis) Administrative cost (right axis)
232 REALIZING THE FULL POTENTIAL OF SOCIAL SAFETY NETS IN AFRICA
Desired outcomes and impacts depend on policy goals and preferences, coun-try context, and specifi c programs. For example, the desired outcome of a particu-lar cash transfer program could be limited to the immediate reduction of monetary poverty, while that of other programs might include enhancing the human capital of children, social cohesion, or resilience to natural disasters. (Th e discussion below mostly focuses on impact in terms of monetary poverty reduc-tion because of the nature of the available data and the goal of facilitating cross-country comparisons.) Box 5.1 off ers a more detailed discussion of the defi nition and measurement of effi ciency and eff ectiveness in social safety nets used in this report.
BOX 5 .1
How Are Effi ciency and Effectiveness Defi ned and Measured?The concepts of effi ciency and effectiveness represent ways to gauge inputs, outputs, and outcomes (Farrell 1957). The defi nitions of the inputs, outputs, and outcomes of social safety net programs depend on the policy goals and parameters of each pro-gram. The outputs and outcomes of cash transfer programs might relate to child pov-erty, school attendance, earnings, and so on depending on the program objectives. Defi ning the relationship between these variables is challenging, given that most social outcomes are the result of many factors and not a single policy. Empirically, measure-ment is also often diffi cult because appropriate data are often not available or are of poor quality.
The social protection literature presents multiple approaches to measuring effi ciency and effectiveness (Bui et al. 2015; Castro-Leal et al. 1999; Galang, Lavado, and Domingo 2013; Herrmann et al. 2008; Mandl, Dierx, and Ilzkovitz 2008; Nelson 2012; Sudaram, Strokova, and Vandeninden 2014). The two main ones are the analysis of performance indicators and frontier analysis. Performance indicators include metrics such as the coverage and targeting of the poor, benefi t incidence analysis, poverty reduction decomposition, and cost-effectiveness analysis. However, these do not include information on the maximum possible achievements, the yardsticks at the core of effi ciency analysis. In contrast, frontier analysis provides a benchmark to assess effi ciency and effectiveness by building a production possibility frontier based on cross-country data. There are multiple techniques to estimate a production possibility frontier, either parametric (Free Disposal Hull, Data Envelopment Analysis) or nonparametric (econometric methods such as Stochastic Frontier Analysis).
Results of the parametric data envelopment analysis are presented below to illustrate the kind of analysis that may be performed, though this is by no means an exhaustive examination of social safety nets’ effi ciency and effectiveness. The methodology estimates the highest possible level of output that can be reached for a
(continued next page)
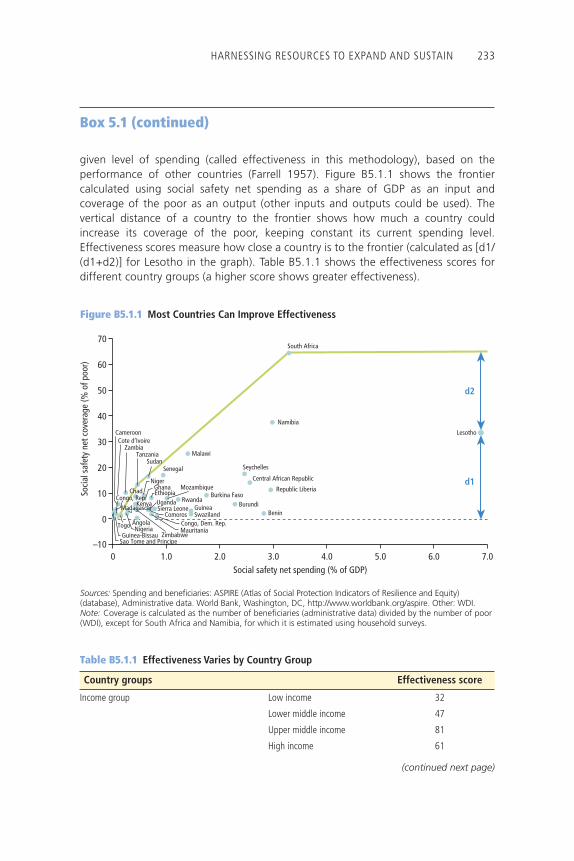
HARNESSING RESOURCES TO EXPAND AND SUSTAIN 233
given level of spending (called effectiveness in this methodology), based on the performance of other countries (Farrell 1957). Figure B5.1.1 shows the frontier calculated using social safety net spending as a share of GDP as an input and coverage of the poor as an output (other inputs and outputs could be used). The vertical distance of a country to the frontier shows how much a country could increase its coverage of the poor, keeping constant its current spending level. Effectiveness scores measure how close a country is to the frontier (calculated as [d1/(d1+d2)] for Lesotho in the graph). Table B5.1.1 shows the effectiveness scores for different country groups (a higher score shows greater effectiveness).
Box 5.1 (continued)
(continued next page)
Table B5.1.1 Effectiveness Varies by Country Group
Country groups Effectiveness score
Income group Low income 32
Lower middle income 47
Upper middle income 81
High income 61
Figure B5.1.1 Most Countries Can Improve Effectiveness
Sources: Spending and beneficiaries: ASPIRE (Atlas of Social Protection Indicators of Resilience and Equity) (database), Administrative data. World Bank, Washington, DC, http://www.worldbank.org/aspire. Other: WDI.Note: Coverage is calculated as the number of beneficiaries (administrative data) divided by the number of poor (WDI), except for South Africa and Namibia, for which it is estimated using household surveys.
0
–10
10
20
30
40
50
60
70
0 1.0 2.0 3.0 4.0 5.0 6.0 7.0
Soci
al s
afet
y ne
t cov
erag
e (%
of p
oor)
Social safety net spending (% of GDP)
d1
d2
Benin
Burkina FasoBurundi
Cameroon
Central African Republic
Republic LiberiaChad
ComorosGuineaSwaziland
Congo, Dem. Rep.
Cote d’Ivoire
EthiopiaGhana
Guinea-Bissau
Kenya
Lesotho
Madagascar
Malawi
MauritaniaTogo
Mozambique
Namibia
Niger
Nigeria
Rwanda
Sao Tome and Principe
Senegal Seychelles
Sierra Leone
South Africa
SudanTanzania
Uganda
Zimbabwe
Zambia
Angola
Congo, Rep.
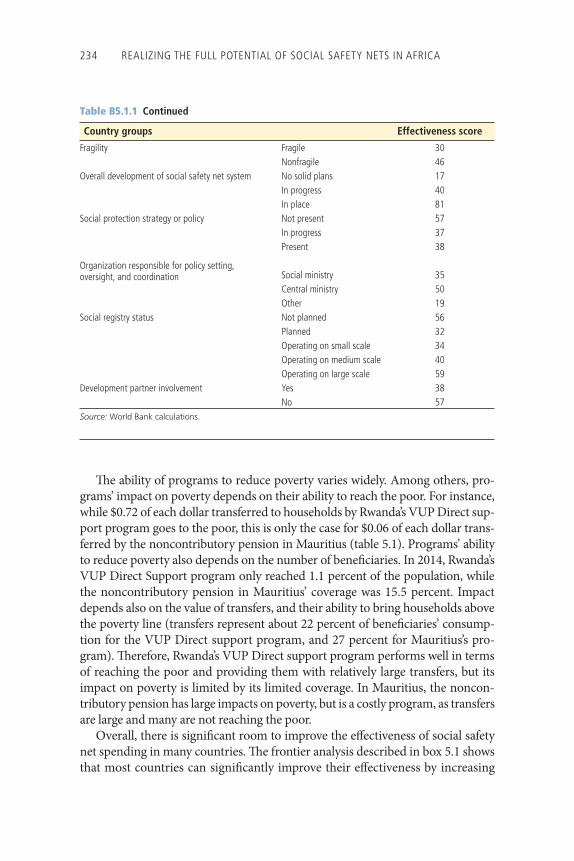
234 REALIZING THE FULL POTENTIAL OF SOCIAL SAFETY NETS IN AFRICA
Th e ability of programs to reduce poverty varies widely. Among others, pro-grams’ impact on poverty depends on their ability to reach the poor. For instance, while $0.72 of each dollar transferred to households by Rwanda’s VUP Direct sup-port program goes to the poor, this is only the case for $0.06 of each dollar trans-ferred by the noncontributory pension in Mauritius (table 5.1). Programs’ ability to reduce poverty also depends on the number of benefi ciaries. In 2014, Rwanda’s VUP Direct Support program only reached 1.1 percent of the population, while the noncontributory pension in Mauritius’ coverage was 15.5 percent. Impact depends also on the value of transfers, and their ability to bring households above the poverty line (transfers represent about 22 percent of benefi ciaries’ consump-tion for the VUP Direct support program, and 27 percent for Mauritius’s pro-gram). Th erefore, Rwanda’s VUP Direct support program performs well in terms of reaching the poor and providing them with relatively large transfers, but its impact on poverty is limited by its limited coverage. In Mauritius, the noncon-tributory pension has large impacts on poverty, but is a costly program, as transfers are large and many are not reaching the poor.
Overall, there is signifi cant room to improve the eff ectiveness of social safety net spending in many countries. Th e frontier analysis described in box 5.1 shows that most countries can signifi cantly improve their eff ectiveness by increasing
Table B5.1.1 Continued
Country groups Effectiveness score
Fragility Fragile 30Nonfragile 46
Overall development of social safety net system No solid plans 17In progress 40In place 81
Social protection strategy or policy Not present 57In progress 37Present 38
Organization responsible for policy setting, oversight, and coordination Social ministry 35
Central ministry 50Other 19
Social registry status Not planned 56Planned 32Operating on small scale 34Operating on medium scale 40Operating on large scale 59
Development partner involvement Yes 38No 57
Source: World Bank calculations.
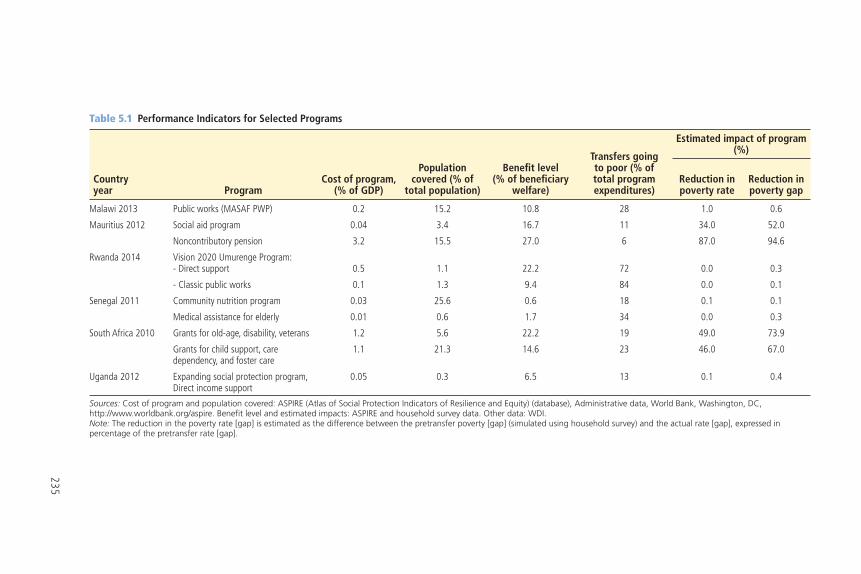
235
Table 5.1 Performance Indicators for Selected Programs
Countryyear Program
Cost of program, (% of GDP)
Population covered (% of
total population)
Benefi t level (% of benefi ciary
welfare)
Transfers going to poor (% of total program expenditures)
Estimated impact of program (%)
Reduction in poverty rate
Reduction in poverty gap
Malawi 2013 Public works (MASAF PWP) 0.2 15.2 10.8 28 1.0 0.6
Mauritius 2012 Social aid program 0.04 3.4 16.7 11 34.0 52.0
Noncontributory pension 3.2 15.5 27.0 6 87.0 94.6
Rwanda 2014 Vision 2020 Umurenge Program:- Direct support 0.5 1.1 22.2 72 0.0 0.3
- Classic public works 0.1 1.3 9.4 84 0.0 0.1
Senegal 2011 Community nutrition program 0.03 25.6 0.6 18 0.1 0.1
Medical assistance for elderly 0.01 0.6 1.7 34 0.0 0.3
South Africa 2010 Grants for old-age, disability, veterans 1.2 5.6 22.2 19 49.0 73.9
Grants for child support, care dependency, and foster care
1.1 21.3 14.6 23 46.0 67.0
Uganda 2012 Expanding social protection program, Direct income support
0.05 0.3 6.5 13 0.1 0.4
Sources: Cost of program and population covered: ASPIRE (Atlas of Social Protection Indicators of Resilience and Equity) (database), Administrative data, World Bank, Washington, DC, http://www.worldbank.org/aspire. Benefit level and estimated impacts: ASPIRE and household survey data. Other data: WDI.Note: The reduction in the poverty rate [gap] is estimated as the difference between the pretransfer poverty [gap] (simulated using household survey) and the actual rate [gap], expressed in percentage of the pretransfer rate [gap].
236 REALIZING THE FULL POTENTIAL OF SOCIAL SAFETY NETS IN AFRICA
their coverage of the poor while maintaining their current level of spending. Generally, countries with a strong social safety net system; with a central institu-tion leading policy setting, oversight, and coordination; and with large social reg-istries tend to be more eff ective (box 5.1, table B5.1.1). On the other hand, the presence of development partners and of a social protection strategy is negatively associated with eff ectiveness; this probably refl ects lower eff ectiveness observed in poorer or fragile countries, where development partners and strategies are also more present. While these measures should only be taken as indicative, they sug-gest signifi cant potential effi ciency gains for many countries’ programs.
Strong Delivery Mechanisms Are the Basis for an Effi cient SystemWell-functioning administrative tools are critical to ensuring the cost-eff ective delivery of social safety net transfers to the intended benefi ciaries, and governments across the world have begun to emphasize improving administrative processes and systems. Th e essential elements of the eff ective administration of a social safety net system include processes for identifi cation, targeting, enrollment, payments, service delivery, and case management. Th e government of South Africa achieved signifi -cant effi ciency gains by overhauling administration, by introducing a specialized agency for centralized administration and payments (the South African Social Security Agency), by introducing biometric smart cards, by reregistering benefi cia-ries, and by undertaking regular biometric proof-of-life verifi cations (notwithstand-ing recent controversies surrounding the arrangements regarding the payment systems) (Alam, Mokate, and Plangemann 2016).
Upgrading administrative processes and introducing technology can be costly, but the benefi ts can be signifi cant in the medium to long terms. During the fi rst seven years of Mexico’s Prospera Program, administrative costs fell from 51 percent of the program’s overall budget to 6 percent. Th is was because of large up-front investments in systems—the purchase of equipment, the design of sys-tems, the defi nition of procedures, and so on—that yielded benefi ts for multiple years, as well as a gradual increase in the number of benefi ciaries served by the systems (Lindert, Skoufi as, and Shapiro 2006). In Africa, the administrative costs associated with Cameroon’s Social Safety Nets Project declined from an initial 60 percent of total spending to 23 percent aft er one year. During the fi rst year of the program, most of the spending was allocated to establishing appropriate infor-mation infrastructure; but, aft er the fi rst year, the program implementation unit (PIU) became more effi cient, and benefi t payments became the largest cost item.
Th e adoption of technology in all aspects of administration can lead in lower-ing the cost of administering social safety net programs. A shift from physical cash transfers to electronic payments generates substantial gains in effi ciency by reduc-ing leakage and allowing the integration of payments with information manage-ment. In Mexico, thanks to a campaign to integrate electronic payments and social assistance, 97 percent of 2.6 million pensioners are paid through
HARNESSING RESOURCES TO EXPAND AND SUSTAIN 237
a centralized electronic system, saving the equivalent of about $900 million annu-ally in administrative costs.
Th e use of biometric smart cards is another example of how technology is able to boost effi ciency by lowering administrative costs. In India, the introduc-tion of biometric smart cards resulted in time savings to benefi ciaries valued at $4.5 million and reduced annual leakage by approximately $38.5 million in the National Rural Employment Guarantee Scheme and $3.2 million in the social security pension program. Th e effi ciency gains are particularly large relative to the total cost of the introduction of the smart cards, $2.3 million (Muralidharan, Niehaus, and Sukhtankar 2016).
Technology can also promote eff ectiveness. Th us, through a recent pilot pro-gram of the Fundación Capital in Colombia, recipients of the Más Familias en Acción conditional cash transfer program gained access to shared tablet com-puters and smartphones to use LISTA, an application designed as an alternative to in- person fi nancial training through a peer-to-peer education methodology. Participants were able to access LISTA from home at their own pace and focus their learning on the choice of topics. Preliminary results indicate signifi cant impacts on fi nancial knowledge, attitudes toward formal fi nancial services, the adoption of good fi nancial practices, and fi nancial outcomes.
Technology also holds promise for decreasing the cost and increasing the accuracy of targeting. Th e governments of Sierra Leone and Tanzania are using innovative spatial statistical modeling approaches to targeting. Georeferenced locational information (geotagged and satellite data) is combined with house-hold survey data to generate poverty maps. In Tanzania, the maps are used to assess geographical targeting performance and will be used to select priority areas for retargeting and any eventual expansion of the social safety net pro-gram. In Sierra Leone, the maps are used to target multiple programs and are overlaid with other data, depending on the needs of each program; they are also used to help harmonize interventions across governmental and nongovernmen-tal institutions (Gething and Rosas 2015; World Bank 2015).
Introducing technology does not guarantee cost savings, however. Th e qual-ity of implementation and local conditions play a big role and there is oft en a learning period. In a cash-for-assets program in Kenya, electronic cash pay-ments were 15 percent less costly to implement than the distribution of food of equivalent value (CGAP 2013). However, in the Malawi Cash and Food for Livelihoods Pilot Program, cash was more expensive to administer than food (though it assured greater food security) because the program was able to pur-chase food at much lower, more stable prices in the context of weak food market integration (Audsley, Halme, and Balzer 2010).
On the basis of international experiences, three crucial factors may be identifi ed in determining whether technology can raise the effi ciency and eff ectiveness of social safety nets. First, the quality of infrastructure and implementation is critical
238 REALIZING THE FULL POTENTIAL OF SOCIAL SAFETY NETS IN AFRICA
for the successful introduction of technology. In four cash transfer programs in low-income settings (Haiti, Kenya, the Philippines, and Uganda), effi ciency gains from the introduction of electronic payments were not immediately realized because of the lack of adequate mobile infrastructure, a high-quality management information system (MIS), technical capacity among administrators, and recipient understand-ing (CGAP 2014). In Zambia, an innovative mobile technology enumeration and registration system for the Social Cash Transfer Program did not outperform the existing paper system in a small pilot initiative, because of challenges largely “related to an isolated design fl aw in the application, logistical challenges with power and the network, and poor compatibility between the m-tech database and the existing management information system” (IDinsight 2015, 1).
Second, the start-up costs of technology are high, either because it requires infrastructure investments or because switching technologies implies transac-tion costs. A review of e-payments for emergency cash transfers in Kenya and Somalia found that the choice of payment modality is not a large determinant of overall costs and that e-payments are not necessarily cheaper than manual payments, oft en because of the higher start-up costs (O’Brien, Hove, and Smith 2013). Nonfi nancial factors (such as timeliness, the burden on benefi ciaries, safety, risk of fraud, and so on) may then be determining factors in the choice of payment modality. An e-voucher pilot initiative of the World Food Programme in Afghanistan found that, although the program was successful in many aspects, costs were not lower than the costs of traditional paper vouchers because of the high costs of monitoring the pilot initiative, costs that would disappear in follow-up phases.
Finally, the legal and procurement aspects of the introduction of technol-ogy need to be carefully managed. Contracting information technology ser-vice providers entails unique challenges because such services may be based on proprietary source codes or other asymmetric information that can create excessive negotiating or market power among the service providers. Governments are advised to manage this risk carefully through appropriate legal and procurement processes or by relying on open source systems to avoid vendor lock-in. While the South African social assistance identifi cation and payment card is one of the most advanced in the world, the South African Constitutional Court declared, in 2014, that the tender process and, thus, the contract for provision were invalid. Th e contract with the service provider was continued to guarantee service, but the court ruled that the South African Social Security Agency must reopen the tender. Since then, the agency has encountered numerous challenges in attempting to comply with court’s fi nd-ing, and the same service provider is still administering payments, despite allegations of abuse of market power through the provision of complementary fi nancial services using personal and biometric data collected through the grants payment system.
HARNESSING RESOURCES TO EXPAND AND SUSTAIN 239
By Joining Programs and Tools, a System-Wide Approach May Promote Effi ciencyAll programs require basic administrative tools to identify and enroll benefi cia-ries, make payments, and manage information (box 5.2). Unifying these admin-istrative tools and systems can lead to economies of scale and result in effi ciency gains. Beyond more effi cient delivery, a system-wide approach also encompasses program and policy integration, which can reduce costs and boost effi ciency. Despite progress in achieving better coordination, social safety net programs in Africa are still largely fragmented, and responsibility for implementation is typi-cally spread over several ministries (chapter 4). Governments can save resources by creating an integrated and coherent social protection system. Th e effi ciency analysis presented above suggests that countries with a social protection strategy embodied in a ministry with a social protection mandate are able to establish a more effi cient nationwide social safety net system. Systems enable governments to respond more effi ciently and eff ectively to poverty and shocks and to promote well-being throughout the life cycle.
BOX 5 .2
Key Instruments of Social Safety Net Programs and SystemsSocial registries support outreach, intake, registration, and the assessment of needs and conditions. Benefi ciary registries and benefi t administration systems support deci-sions and notifi cation along the delivery chain of a program. If several benefi ciary reg-istries are linked or integrated, they can support coordination across programs. Kenya is taking steps to enhance effi ciency by consolidating some social safety net programs, including the Cash Transfer for Orphans and Vulnerable Children (OVC) Program, the cash transfer for older persons, the cash transfer for persons with severe disabilities, the Hunger Safety Net Program (HSNP), and the World Food Programme’s Cash for Assets Program. An integrated benefi ciary registry has been developed, and the new, unifi ed registry has allowed more effi cient program monitoring, reduced double regis-tration, increased transparency and accountability, promoted the effi cient transfer of data, and enhanced the quality of operations.
Unifi ed national identifi cation systems can support social protection systems. Unique identifi ers are needed to integrate social safety net information systems and accomplish the following: (a) facilitate the verifi cation and authentication of the identity of individuals, (b) link individuals to families and households, (c) eliminate duplication among registered individuals, and (d) access other information systems to share data or undertake cross-checks. India’s Aadhaar unique identifi cation number is a 12-digit random number issued to residents based on voluntary enrollment. Aadhar has been used in the rollout of several government social safety nets and other social programs. It is the largest biometric authentication system in the world.
(continued next page)
240 REALIZING THE FULL POTENTIAL OF SOCIAL SAFETY NETS IN AFRICA
Payment systems support the administration and provision of payment services. Linking payment fl ows with other processes is especially critical to ensure the delivery of benefi ts to the intended individuals in a timely manner while minimizing costs. Case management systems support the management of individuals, families, and households participating in one or many programs through needs assessment, service planning and implementation, advocacy, establishing appropriate links with service providers and complementary programs, and monitoring the delivery and use of services, including monitoring conditionalities. Grievance redress mechanisms support eligibility appeals, complaint handling, the engagement of applicants, benefi ciaries and potential benefi ciaries of social programs, and feedback. Business intelligence and analytics support the generation, aggregation, analysis, and visualization of data to inform and facilitate evidence-based policy making and strategic decision support in social programs. Other applications include data mining, report preparation, time series analysis and predictive techniques, online analytical processing, and statistical analysis.
Interoperability protocols for data exchange—including application programming inter-faces, web services, enterprise service bus implementation, and connections to a whole-of-government architecture—are also key components of an integrated social protection information system. Within the broader country context of digital governance, integrated social protection information systems interact with numerous other administrative systems—such as national identifi cation systems, civil registries, and tax authorities—exchanging and cross-checking data across central and subnational governmental entities. The architecture of integrated social protection information systems includes feedback loops between the various information system components, for example, feeding back data on enrollment decisions in a benefi ciary registry to a social registry.
Source: Selected information from World Bank 2017a.
Box 5.2 (continued)
Information systems are a key tool in the implementation of core processes. Th anks to recent improvements in technology, countries have developed meth-odologies to integrate aspects of program management into MISs. MISs are made up of components that automate various functions of the delivery chain in a complementary manner.
Experience across the world shows that the development of information systems can lead to signifi cant savings. Th e National Database of Social Information of Brazil contains records on 34 types of social security benefi ts among 30 million benefi ciaries, or 16 percent of the population. In 2009, the data were deemed legally suffi cient as proof of eligibility for social security benefi ts, meaning that, if a benefi -ciary’s records are complete, there is no need to provide additional documents attesting to the payment of contributions or the periods of employment. Th is led to a reduction of the time necessary to document a retirement to 30 minutes.
HARNESSING RESOURCES TO EXPAND AND SUSTAIN 241
In addition, the unemployment insurance program processes 3.5 million requests per month and uses data from the national database to check in real time whether a person has another job or receives benefi ts. Th e database also provides informa-tion on an individual’s wages during the last three months worked, which serves as the basis for calculating benefi ts. Benefi ts can be received for up to fi ve months, and, every month, an automatic verifi cation is performed to ensure that the eligibility criteria have been met before the benefi t is paid. In 2013, approximately R$900 million ($385 million) in payments were blocked as result of cross-checking.
Various documented experiences in Eastern Europe show similar success (World Bank 2014). In Kazakhstan, people now receive 578 diff erent services through the e-government portal. Since its launch, more than 77 million electronic services have been provided, including various certifi cates or statements. Th e e-government sys-tem has served more than 2.6 million users. In the Kyrgyz Republic, the transition to an automated system for the allocation and payment of social safety nets—the Corporate Information Systems of Social Assistance—has facilitated a signifi cant decrease in the time needed to process cases, from several days to only around two minutes per report. Th e government of Romania is able to carry out cross-checks between social safety nets and external data by using a unique personal identifi ca-tion number in all major national databases (tax administration, social assistance, health care, pensions, and disability). In 2013, these checks led to the recovery of €1.5 million (approximately $1.65 million). Cross matchings are now a regular activity in various social safety net programs and social services. In the Russian Federation, the Moscow city targeted social safety net program switched from paper-based in-kind transfers to an automated system centered on the Moscow Residents Social Card. Th e elderly now receive payments directly on their social cards rather than a box of goods and are able to use the cards like cash in authorized retail stores in Moscow. Th e introduction of this automated system has reduced processing time from weeks to 72 hours.
A reliable public fi nancial management system is a key element in the effi -cient allocation and eff ective use of social safety net resources. A program that is supported by a reliable, transparent, and accurate public fi nancial manage-ment system is more likely to allocate social safety net resources appropriately so that the resources reach eligible benefi ciaries in a timely manner with mini-mal or no leakage. Such a system also enables the preparation and publication of detailed, precise, and comprehensive reports. Such a system can typically be used to ensure policy-based and consultative budget preparation; eff ective bud-get execution processes, including the identifi cation and registration of eligible benefi ciaries and the timely transfer of funds to benefi ciaries; accurate and timely reporting of transactions; and high-quality external audits to satisfy par-liamentary scrutiny and follow-up. Th e system can support a ministry of fi nance in coding social protection expenditures to allow effi cient and transparent social protection expenditure tracking and analysis.
242 REALIZING THE FULL POTENTIAL OF SOCIAL SAFETY NETS IN AFRICA
Enhancing the administrative effi ciency of existing programs can also improve political and public buy-in, thereby facilitating their increase in scale (chapter 3).
A Focus on the Identifi cation of Benefi ciariesSocial safety net programs vary in nature and have diff erent objectives. While poverty reduction is oft en at the core of social safety nets, promoting equity, resilience, and opportunity encompasses a much wider variety of goals (see chapters 1 and 2). Th e specifi c scope and design of social safety net programs oft en depend on social norms and ideological factors and are therefore contin-gent on country-specifi c contexts and preferences (see chapter 3). Inevitably, intended benefi ciary groups diff er across countries and programs, and the methods applied by programs to identify intended beneficiaries vary accordingly.
Whatever the specifi c objective of programs, the programs should provide for carefully selecting and monitoring benefi ciaries to maximize the eff ective-ness of spending. Th e availability of national personal identifi cation systems, sound MISs, and common benefi ciary registries across programs is crucial to the identifi cation and management of benefi ciaries and to reducing fraud and errors (box 5.3). In Lesotho, demographic projections suggest that up to 25 percent of the benefi ciaries of old-age pensions might be ineligible (World Bank 2016a). Th e government is taking action to address this problem by performing periodic cross-checks with other databases (such as the national identifi cation and civil registry database, and the Civil Service Pensions database), introduc-ing regular proof-of-life verifi cation, and implementing a new electronic pay-ment system. Estimates suggest Lesotho could save up to 0.5 percent of GDP annually once these measures are in place.
If the main program objective is poverty reduction, targeting on the basis of poverty (using income, consumption, or welfare indicators) is oft en advocated as a cost-eff ective way to achieve poverty reduction and, more generally, as a way to prioritize among people in allocating scarce resources. Indeed, transfer programs targeted on the basis of poverty (sometimes combined with geo-graphical or categorical targeting) account for the largest share of social safety net expenditures (chapter 1). A number of factors, however, determine whether poverty targeting will improve the cost-eff ectiveness of social safety nets in reducing monetary poverty.
Simulations based on data on Africa and Latin America suggest that income-targeted programs have greater poverty impacts than categorical programs, even if errors in targeting are taken into account (Acosta, Leite, and Rigolini 2011; Guven and Leite 2016). But, the higher the poverty rate, the lower the need for income targeting, because income targeting and universal approaches yield similar benefi ciary groups. In 15 African countries with high poverty rates, perfect poverty targeting (with transfers only made to the poor) and
HARNESSING RESOURCES TO EXPAND AND SUSTAIN 243
BOX 5 .3
Ways to Combat Fraud and Errors in Social Safety NetsThe effi ciency of social safety nets can be improved by systematically tackling fraud and errors. Fraud involves intentional behavior to defraud a program, while errors refer to unintentional mistakes on behalf of benefi t claimants or program staff. Fraud and errors are inevitable in social safety net programs, and steps taken to reduce them should be cost-effective and strike a balance among prevention, deterrence, and detection.
Irrespective of their size and design, all social safety net programs are prone to fraud and errors, including in countries with more sophisticated systems, more transparent processes, and more robust governance structures. Reducing fraud and errors contributes to greater effi ciency and effectiveness by ensuring that more resources reach the intended benefi ciaries. Combating fraud and errors also helps build public confi dence in and support for social safety net programs by demonstrating that taxpayer money is secure and is being used effi ciently (see chapter 3).
Improving the clarity of business processes and introducing automation in the administration of social safety net programs can provide opportunities for program administrators to institute more advanced and effective strategies to reduce fraud and errors. The level of benefi t fraud in the United Kingdom has fallen by over 60 percent since 2010 as a result of the actions taken by the Department for Work and Pensions, the institution responsible for social protection policy. A cost-benefi t analysis has estimated that for every £1 invested in data matching, the automated system identifi es £24 in irregularities (NAO 2008). These matching efforts have meant that fraud in the benefi t system accounts for only 0.7 percent of total expenditures.
In Romania, the government decided to strengthen the institutions in charge of combating errors and fraud in 2010 by (a) implementing data matching across databases at the application stage to prevent ineligible households from registering for income or means-tested benefi ts that are intended for low-income households, (b) using risk profi les to target inspections by social inspectors on high-risk cases, and (c) introducing a sanctions policy to deter potential fraudulent claims and recover misspent resources. These efforts focused on large, high-risk programs and were accompanied by improved information technology and organizational structures. In particular, this included a review of the legislation supporting the legal power of social inspectors, a signifi cant increase in the number of these inspectors, the allocation of inspectors proportionally across programs, the preparation of a manual, and the establishment of a risk analysis and profi ling team. As a result of these efforts, spending decreased by $149 million from 2011 to 2012, and 84,000 benefi ciary fi les were cancelled. In 2013, $58 million in resources misspent because of errors and fraud were recovered from benefi ciaries.
244 REALIZING THE FULL POTENTIAL OF SOCIAL SAFETY NETS IN AFRICA
universal transfers are simulated to have similar impacts on a poverty index (Kakwani, Veras Soares, and Son 2005). Programs that imperfectly target house-holds on the basis of poverty and in which targeting costs 15 percent of admin-istrative costs have been compared in simulations with a universal program in 13 countries in Latin America. Th e simulations indicate that, although poverty targeting tends to deliver higher poverty impacts, categorical targeting (com-bined with geographical targeting) yields better overall results in low-income countries with widespread pockets of poverty. In Nicaragua, for instance, a cat-egorical program only achieves about the same poverty reduction as an imper-fect income-targeted program that costs the same but does not leave out 30 percent of the poor. In contrast, in wealthier and more unequal countries, such as Colombia, the need to transfer larger amounts to a smaller pool of poor benefi ciaries makes an imperfect poverty-targeted system more attractive than categorical targeting (Acosta, Leite, and Rigolini 2011).
Th e costs of implementing the chosen targeting methodology also infl u-ence the cost-eff ectiveness of the program. Th ese include administrative costs associated with gathering the information necessary to determine eligibility, the costs of implementing targeting, and the indirect costs of targeting, such as any distortions in benefi ciary behavior to qualify for benefi ts and the bur-den on benefi ciaries (Samsen, van Niekerk, and Mac Quene 2011; Slater and Farrington 2009). Th ese costs are not oft en calculated, so it is impossible to carry out an empirical analysis comparing the additional costs of targeting. Diff erent targeting mechanisms imply various costs and levels of accuracy. Proxy-means-testing and hybrid mechanisms, such as the combination of community-based mechanisms and proxy-means-testing, are oft en costly to administer, but are relatively eff ective at excluding both the nonpoor and the poor, thereby increasing effi ciency by decreasing leakage, but at the cost of substantial errors of exclusion (Brown, Ravallion, and van de Walle 2016; Karlan and Th uysbaert 2013).
Targeting aff ects the political acceptability of programs, which aff ects the willingness to allocate budgets to programs (chapter 3; Gelbach and Pritchett 2002). Treating budgets as fi xed is therefore a simplistic approach. Depending on the country, there might be more or less support for poverty targeting versus universal or categorical targeting, and that choice might ultimately impact the total amount of resources. Choosing a politically unpalatable option (a narrow poverty-targeted program in a context of strong preferences for a broader or categorical program) might result in fewer resources available for the poor. Th e cost-eff ectiveness of targeting will therefore greatly depend on the country con-text, the methodology chosen, and the available technologies. Governments would therefore benefi t from carefully choosing strategies on the ways to focus spending on the desired benefi ciaries on the basis of eff ectiveness, but also equity within the wider political context.
HARNESSING RESOURCES TO EXPAND AND SUSTAIN 245
A Focus on Programs Th at Have a Proven Impact on Stated ObjectivesThe effectiveness of social safety nets depends heavily on program choice and design. Indeed, even programs that have a poverty reduction mandate could have limited poverty reduction effects if their coverage of the poor is limited, they are poorly targeted, the amounts are too small, or there is a narrow causal link between the intervention and poverty reduction. Evidence on the effectiveness of alternative program choices, design, and implementation arrangements can help policy makers make effective choices (chapter 2).
Energy subsidies are an example of programs that have often been launched with a poverty mandate, but have weak poverty impacts because they tend to benefit the better off in society. Energy subsidies are typically regressive because large shares of benefits accrue to richer households that have the highest levels of consumption (Inchauste and Victor 2017). A num-ber of countries have phased out or reduced energy subsidies in favor of social safety net programs that target the poor and vulnerable, thereby achieving stronger poverty impacts or fiscal savings. A key aspect of suc-cessful reforms has often been the parallel creation or expansion of social safety net programs as a compensation measure. For instance, in Iran in 2010, the government began a large energy subsidy reform, undertaking extensive public communication and using cash transfers as a means to compensate people for the loss of the subsidies. As a result, the reform had positive effects on poverty, inequality, and overall costs (Guillaume, Zytek, and Farzin 2011; Inchauste and Victor 2017). The government of the Dominican Republic adopted a similar approach, replacing an electricity subsidy with a targeted cash transfer to help poor households pay for the first 100 kilowatts of electricity each month. The effort was associated with an extensive community sensitization campaign, as well as the rehabilitation of electrical lines to guarantee access. The number of registered electricity users rose from 1.4 million to 2.3 million in three years, and the government achieved considerable savings, with annual costs of $150 million for the subsidy, versus $55 million for the cash transfer program (Inchauste and Victor 2017).
Overall, choosing programs with greater impact potential and selecting design features that maximize impacts are critical ways to improve the effi-ciency and effectiveness of social safety net spending. (Chapter 2 discussed some of the design features which are more likely to yield strong impacts on poverty and human development outcomes.) Instruments such as public expenditure reviews and distributional program analyses can greatly help assess how resources are being spent and their impact on poverty and other outcomes.
246 REALIZING THE FULL POTENTIAL OF SOCIAL SAFETY NETS IN AFRICA
Securing Sustainable Resources to Expand and Sustain Coverage
While improving the effi ciency and eff ectiveness of programs can bring gains, most countries in Africa will need to increase the amount of resources going to social safety nets to expand coverage to the poor and vulnerable, as well as cre-ate systems to make fi nancing available to scale up coverage during crises. Th is section provides a broad overview of how governments can achieve this. Th e section focuses on ways to strengthen fi scal policy as a cornerstone to increasing government revenue, as well as options for alternative fi nancing sources.
Th e literature on these themes abounds and extends well beyond social pro-tection. For this reason, this section is not meant to be an exhaustive, in-depth discussion on these issues. Rather, it is meant to provide food for thought for policy makers on possible avenues to increase and strengthen fi nancing.
Implement Measures to Boost Domestic RevenueAs with all government functions, strengthening fi scal policy is a cornerstone of the sustainable fi nancing of social safety nets at scale. Given the uncertainties in the global macroeconomic and political context, the rising costs of borrow-ing, and the unpredictability of external fi nancing, domestic revenue mobiliza-tion is the most durable way to create fi scal space (IMF 2015). An improved fi scal system also benefi ts the consolidation of the citizen-state compact and promotes the accountability of government to taxpaying citizens.
“Eff ective tax systems can be associated with a ‘virtuous circle,’” writes Bastagli (2016, 22), “whereby the generation of government tax revenues leads to improved service provision, which in turn increases citizens’ willingness to pay taxes.” Th e reform of tax policy can also enhance overall governance. Expanding a country’s domestic resource mobilization is likely to be politically feasible and sustainable only if it is associated with improved rule-of-law, accountability, and transparency standards (World Bank 2017b).
Th ere is scope to increase the domestic fi scal envelope through increased taxation (IMF 2015; OECD 2017). At current GDP levels, the median country in Africa is estimated to have the potential to increase tax revenue by between 3.0 and 6.5 percentage points of GDP (IMF 2015). Given that average spending on social safety nets in the region is 1.2 [[12]] percent of GDP, such potential increases in tax revenue would allow at least a doubling of social safety net spending on average and still leave room for additional spending in other sec-tors. In Africa, total tax revenues stood at an average of about 21 percent of GDP between 2011 and 2014, compared with over 30 percent in high-income coun-tries. While still comparatively low, this represents a remarkable improvement. Th e region has experienced the largest increase in tax revenue in the world since the turn of the millennium (IMF 2015). With the exception of Botswana,
HARNESSING RESOURCES TO EXPAND AND SUSTAIN 247
Nigeria, Zambia, and a few fragile states, all African countries have managed to increase their tax-to-GDP ratio. Th is improvement partially refl ects the lower starting point of Africa. Even so, progress in the median low-income country in the region was still greater despite a higher starting point than the median low-income country elsewhere in the world. Th e largest contribution to the average change in tax revenue was provided by taxes on income, profi ts, and capital gains, as well as taxes on goods and services (IMF 2015).
Finding the balance between direct and indirect taxes and determining the overall level of taxes are crucial to boosting domestic revenue eff ectively and equitably (IMF 2017). Th e share of direct taxes—such as income, property, and corporate taxes—in overall tax revenue has traditionally been lower in develop-ing countries, refl ecting low per capita incomes, administrative challenges, and the political hurdles of taxing the rich and local elites. However, given their progressive nature and relatively low starting base, direct taxes have the poten-tial to be eff ective instruments for revenue mobilization (World Bank 2017b). Improvements in tax administration, compliance, and formalization can help boost the revenue from direct taxes. At the same time, while oft en dismissed as regressive, indirect taxation—such as value added taxes—presents an opportu-nity for more revenue than other tax instruments in many African countries in the short term (IMF 2015). Th is is because its overall eff ect on distribution can be progressive if it is used to fi nance strongly progressive spending (Bastagli 2015). Furthermore, a shift from labor to consumption taxes (value added taxes, excise taxes, and so on) could boost formal labor demand by lowering nonwage labor costs, which is paramount in light of the emerging potential negative employment impact of automation (Alesina, Battisti, and Zeira 2015; Kuddo and Weber 2017; Santos 2017). Indirect taxes can be implemented with a broad base, a fairly high threshold to avoid overburdening small businesses, and a single or limited number of rates to preserve simplicity and limit opportunities for rent seeking (IMF 2015). Concerns over the regressive burden of indirect taxes can also be mitigated by design options, including ensuring that taxes on the goods most oft en consumed by the poor are low (Bastagli 2016).
Improved tax administration and simplifi ed tax systems are a fundamental pillar in increasing tax revenue and have contributed signifi cantly to increasing fi scal revenue in a number of countries. In Rwanda, the government raised tax revenue by approximately 50 percent between 2001 and 2013 by establishing a revenue authority to cover nontax revenue and rationalize income taxation; introducing a value added tax; aligning the tax system with development priori-ties; introducing tax audits, appeals, and penalties for evasion; and harmonizing the domestic system with the system of the East African Community (IMF 2009). Th rough the expansion in tax revenues, the government was able to increase spending on infrastructure, education, health care, and social protec-tion (AfDB 2010). In South Africa in 2009, the government simplifi ed the tax
248 REALIZING THE FULL POTENTIAL OF SOCIAL SAFETY NETS IN AFRICA
revenue system by introducing a turnover tax on microbusinesses, the value added tax, the provisional tax, the capital gains tax, and the dividends tax. Th e additional revenue generated through the introduction of the turnover tax allowed the government to maintain the country’s large social safety net system.
Innovative research points to the potential impact that behavioral nudging mechanisms can have on increasing tax compliance across the globe, including in Africa. Field experiments have been conducted around the world over the past few years to test mechanisms—such as reminders, messages, or well-designed default options—to incentivize taxpayers to pay their taxes, based on the concept that people evade taxes not only because of the expected net benefi t of evading but also because of social and moral considerations (Kettle et al. 2016; Mascagni 2017). Social norms are more eff ective if tax evasion is per-ceived as an exception and if compliance is considered the norm. Th is is where the image of the tax administration plays an important role (World Bank 2017b). As a pioneer in Africa, the Rwanda Revenue Authority generated almost $9 million in additional revenue by sending messages to tax payers regarding their taxes. Messages highlighting the importance of tax payments for public services and reminders about deadlines were more eff ective than messages focused on deterrence and emphasizing sanctions and penalties for noncompli-ance, and routine mailings outperformed more expensive letters in promoting increases in declared taxes (ICTD 2016; Mascagni, Nell, and Monkam 2017). While the validity of these type of interventions in other African countries has yet to be explored, this is a promising avenue for governments to follow, hand in hand with other policies.
Formalization can boost overall tax revenue, but evidence on the progress and future potential of this phenomenon for fi scal policy is mixed. Informality entails a loss in budget revenues by reducing the payment of taxes and social security contributions and, accordingly, the provision of public goods and ser-vices (Kuddo and Weber 2017). Formalization can be promoted by cutting the cost of compliance and regulation by simplifying administrative processes, enhancing the perceived benefi ts of formalization, and supplying a comprehen-sive package of support to fi rms, such as through training, support in opening business bank accounts, and help in dealing with tax authorities and tax media-tion services.2 However, overall progress in the formalization of employment across the world has been slow, and emerging trends point to the need to rethink traditional fi scal mechanisms such as payroll-based systems (Kuddo and Weber 2017; Palacios 2017). Th e share of people of working age contributing to formal social security systems in developing countries has not increased signifi cantly over the past 20 years. At the same time, there has been a shift in many countries toward shorter-term employment, more fragmented careers, and a progressive deindustrialization process, suggesting that emerging economies might not
HARNESSING RESOURCES TO EXPAND AND SUSTAIN 249
follow the same path of industrialization and experience a premature deindus-trialization (Palacios 2017; Rodrik 2016). Th ese developments point to the need for government leaders of developing countries to think innovatively about fi s-cal strategy.
Technological progress can off er new opportunities for the collection of tax revenue in this context because governments will be able to track and tax earn-ings and incomes without the need for payroll-based systems. Th e impressive innovations in digital payments and e-commerce across the world, but espe-cially in Africa and Asia, over the last 15 years, combined with inclusion, are eff ectively formalizing large parts of economies by opening these transactions as a new source of contribution collection with minimal transaction costs (Palacios 2017). Digital, unique identifi cation systems and linked administra-tive datasets could allow governments to more eff ectively target fi scal policies, such as negative income taxes or subsidies, and to tailor contributions to income levels (Palacios 2017). Given the challenges developed countries might face in reforming or eliminating well-established but obsolete tax systems and their legacies, governments across Africa can potentially leapfrog developed coun-tries in adopting innovative fi scal instruments.
Governments can also explicitly link a specifi c tax revenue source to social safety net fi nancing to help establish a predictable and accountable domestic funding source for social safety nets. In Ghana, a share of value added tax and payroll tax revenues is earmarked to fi nance the country’s National Health Insurance System, improving the consistency of health fi nancing and increasing spending on health care. Th ere is debate about whether earmarking tax revenue for specifi c sectors is desirable (World Bank 2017b). In general, the literature agrees that appropriate levels of taxation of some temptation goods, such as alcohol or tobacco, can be used to fi nance social sector spending directly. In low- and middle-income countries, tax rates on such undesirable goods are relatively modest, and there is large scope for heavier taxation (World Bank 2017b). Raising taxes on tobacco products is a cost-eff ective measure that reduces consumption of products that lead to premature mortality, while gen-erating substantial revenue for health care and other social programs (Savedoff and Alwang 2015; World Bank 2017b). Th rough tobacco tax reform, Moldova raised the value of tobacco taxes from 1 percent to 6 percent of total taxes from 2009 to 2016. Armenia has rapidly increased tobacco taxes, reaching 1 percent of GDP. Th e Philippines boosted tobacco tax revenues by a factor of 1.5 in three years, and this was used to increase the health care budget and the number of people receiving health subsidies (World Bank 2017c).
In resource-rich countries, one option is the use of natural resource reve-nue to fi nance human capital investment, including direct dividend payments, that is, cash transfers (de la Brière et al. 2017; Devarajan and Giugale 2013). Historically, reliance on natural resource revenues has been associated with
250 REALIZING THE FULL POTENTIAL OF SOCIAL SAFETY NETS IN AFRICA
volatility, instability, and fi nancing sustainability concerns, as well as possible lower government accountability before citizens because the revenues are unearned (Bastagli 2016). Some countries have avoided the resource curse and eff ectively promoted long-run development by pursuing a balanced approach that includes investment in human capital (de la Brière et al. 2017). In Mongolia, for instance, the government has levied royalty rates of 5 percent on the extraction of natural resources, applied a 10 percent corporate income tax on profi ts, and established royalties and licensing fees for exploration and production. A fund was created using such revenues to fi nance expenditures on health insurance and pensions, housing payments, cash transfers, and medical and education service payments (ILO 2016). Direct dividend pay-ments could present an opportunity to avoid the resource curse by “using cash transfers to hand the money directly to citizens and thereby protect the social contract between the government and its people” (Devarajan and Giugale 2013, ii). Th e authors’ estimates suggest that a country with a large natural resource base relative to population size would be able to provide citizens with considerable cash transfers fi nanced directly through resource revenues. Angola, Gabon, and Equatorial Guinea could close the poverty gap by distrib-uting 10 percent of resource revenues in cash transfers. Less resource-rich or more highly populated countries would be able to cover less, but still a con-siderable share of the poverty gap, such as Nigeria (39 percent) and Tanzania (26 percent).
Curtailing illicit fi nancial fl ows—that is, capital associated with illegal activi-ties or money that crosses borders that has been illegally earned, transferred, or used—can also help governments raise additional resources for social safety nets (World Bank 2016b). Illicit fi nancial fl ows include traded goods that are mispriced to avoid tariff s, wealth transferred to off shore accounts to evade income taxes, and unreported movements of cash. In 2012, almost $1 trillion in illicit fi nancial fl ows were estimated to have been drained from developing countries, and these fl ows amounted to almost 10 times the total aid received by developing countries (Kar, Cartwright-Smith, and Hollingshead 2010; Ortiz, Cummins, and Karunanethy 2015).
Attracting Alternative ResourcesWhile it is a fundamental instrument, fi scal policy alone may not supply the fi nancing needed to take social safety nets to scale in Africa. Governments can therefore also seek alternative funding sources. An assessment of Ethiopia’s taxation and social protection system fi nds that it does not have the capacity to achieve the desired level of redistribution by applying higher marginal rates on relatively high incomes, nor to close the poverty gap or fully fund the main social safety net program using domestic income sources alone (Hirvonen, Mascagni, and Roelen 2016).
HARNESSING RESOURCES TO EXPAND AND SUSTAIN 251
Development partner fi nancing is an obvious option that already plays an important role in fi nancing social protection spending. It is particularly strate-gic in fi nancing initial investments in the sector, for instance, in establishing the building blocks for delivery. It can also be a catalyst for gathering domestic resources for social protection. In Mozambique, development partners were key in advocating for an increase in budget allocations for the social protection strategy and plan (Bastagli 2015). Responsibility for fi nancing can gradually shift to governments once initial investments have been made and country sys-tems are in place. Th e fi nancing and implementation of social safety nets have gradually been taken over by the governments of Ethiopia, Lesotho, and Senegal (box 5.4). Ethiopia’s Productive Safety Net Program (PSNP) is an example of the successful integration of government and development partner funding, as well as of development partner harmonization. Eleven development partners coalesced and created eff ective implementation arrangements that span multi-ple ministries and now provide a unifi ed stream of technical advice in support of the government-led program (Monchuk 2014).
Other options include development impact bonds, which are innovative tools that governments can use to mobilize private sector fi nancing for development objectives, including those of social safety nets. Development impact bonds “pro-vide funding for development programs by private investors, who are remuner-ated by development partners or host-country governments—and earn a return—if evidence shows that programs achieve pre-agreed outcomes” (CGD and Social Finance 2013). Th e returns to investment are contingent on the achievement of the envisaged development objectives (Coleman 2016). Th e prin-ciple of this approach is that socially motivated private investors provide upfront funding for a development program. Development impact bonds are the devel-oping-country adaptation of social impact bonds, which are used in higher-income countries to promote socially desirable results, mostly in the areas of criminal justice, homelessness, and the workforce. Most development bonds are still at the design stage, but early lessons are emerging (Gustafsson-Wright and Gardiner 2016; Gustafsson-Wright, Gardiner, and Putcha 2015).
Diaspora bonds could also be used to direct remittances toward develop-ment goals. Th ey are debt instruments issued by a government to raise fi nancing from its diaspora (Ketkar and Ratha 2007). Th e bonds are long-dated securities that may be redeemed only upon maturity. Typically, investors who purchase diaspora bonds are motivated by a desire to contribute to the development of their country of origin. Diaspora bonds have been successfully introduced in India, Israel, and Nigeria. Th rough such bonds, the State Bank of India had raised over $11 billion by 2007, while Nigeria issued $100 million in diaspora bonds in 2013, and, given the success of the fi rst issue, decided to raise €300 million from a second diaspora bond issue under the 2016–18 borrowing plan (Ketkar and Ratha 2007; Ozaki 2016).
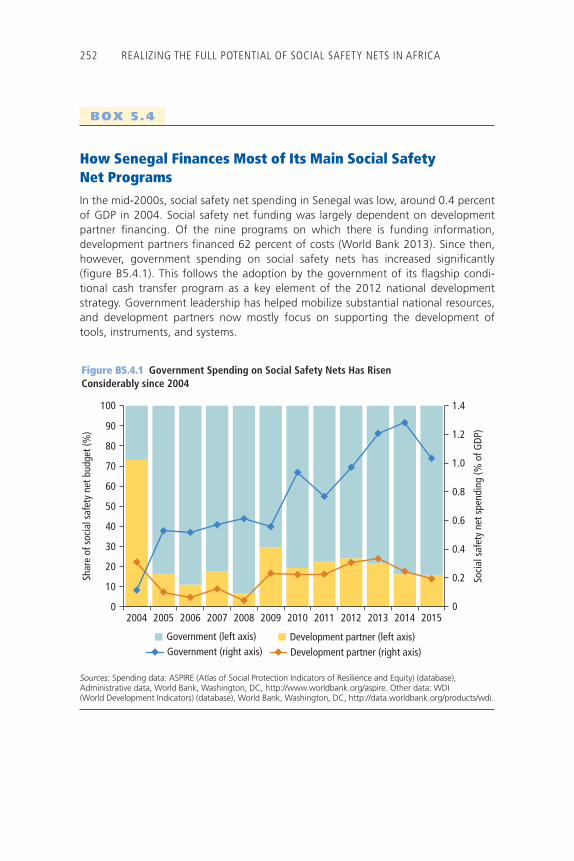
252 REALIZING THE FULL POTENTIAL OF SOCIAL SAFETY NETS IN AFRICA
BOX 5 .4
How Senegal Finances Most of Its Main Social Safety Net ProgramsIn the mid-2000s, social safety net spending in Senegal was low, around 0.4 percent of GDP in 2004. Social safety net funding was largely dependent on development partner fi nancing. Of the nine programs on which there is funding information, development partners fi nanced 62 percent of costs (World Bank 2013). Since then, however, government spending on social safety nets has increased signifi cantly (fi gure B5.4.1). This follows the adoption by the government of its fl agship condi-tional cash transfer program as a key element of the 2012 national development strategy. Government leadership has helped mobilize substantial national resources, and development partners now mostly focus on supporting the development of tools, instruments, and systems.
Figure B5.4.1 Government Spending on Social Safety Nets Has Risen Considerably since 2004
Sources: Spending data: ASPIRE (Atlas of Social Protection Indicators of Resilience and Equity) (database), Administrative data, World Bank, Washington, DC, http://www .worldbank.org/aspire. Other data: WDI (World Development Indicators) (database), World Bank, Washington, DC, http://data.worldbank.org/products/wdi.
0
0.2
0.4
0.6
0.8
1.0
1.2
1.4
0
10
20
30
40
50
60
70
80
90
100
2004 2005 2006 2007 2008 2009 2010 2011 2012 2013 2014 2015
Soci
al s
afet
y ne
t spe
ndin
g (%
of G
DP)
Shar
e of
soc
ial s
afet
y ne
t bud
get (
%)
Development partner (left axis)Development partner (right axis)
Government (left axis)Government (right axis)
HARNESSING RESOURCES TO EXPAND AND SUSTAIN 253
Corporate social responsibility (CSR), relative to other social sectors and regions, might be an underutilized source for fi nancing social safety nets in Africa. A few governments have developed strategies and tools to access these resources to fund economic and development strategies. In El Salvador, multi-national companies have supported the creation of two major foundations in education and in broader socioeconomic development. In Mauritius, the Ministry of Finance requested that all fi rms spend 2 percent of their profi ts on CSR activities approved by the government or transfer the funds to the govern-ment to be used for social and environmental projects. Some elements required for CSR to bring additional funding for social safety net programs in Africa include (1) placing social protection on the global business development agenda as a sector of CSR activity, (2) building government leadership in the develop-ment of CSR within countries, (3) developing a national CSR strategy among public sector companies, (4) ensuring that CSR activities are aligned with the development objectives of social safety nets to maximize synergy, and (5) defi ning the needs in social safety nets that can be eff ectively addressed by CSR activities and resources (Forstater et al. 2010; GIZ 2012; Visser and Tolhurst 2010).
Developing a Financing Strategy for a Reliable, Effective Emergency Response
Current financing strategies to manage crises, including humanitarian support and commercial insurance, cover only a fraction of disaster losses, creating a protection gap that leaves many of the vulnerable exposed. Only around 30 percent of catastrophe losses have been covered by insurance over the past 10 years, which means that close to 70 percent of catastrophe losses have been borne directly by individuals, firms, and gov-ernments (Swiss Re 2016). Furthermore, humanitarian assistance is strug-gling to keep up with growing needs. Almost half the humanitarian appeals of the United Nations were left unmet in 2016 (UNHCR 2017). Finances are strained, and the status quo in financing for disaster response may suffer because of delays in mobilization, during which livelihoods suffer, particu-larly those of the poor.
To manage the risk of shocks eff ectively, ensure predictable and timely access to resources, and ultimately mitigate long-term fi scal impacts, many governments are adopting a strategic approach to disaster risk fi nancing that relies on a range of preplanned, prenegotiated fi nancial instruments. In a number of countries in Africa, these disaster risk fi nancing strategies and shock-responsive social safety nets are being developed or considered. Th is builds on several global initiatives
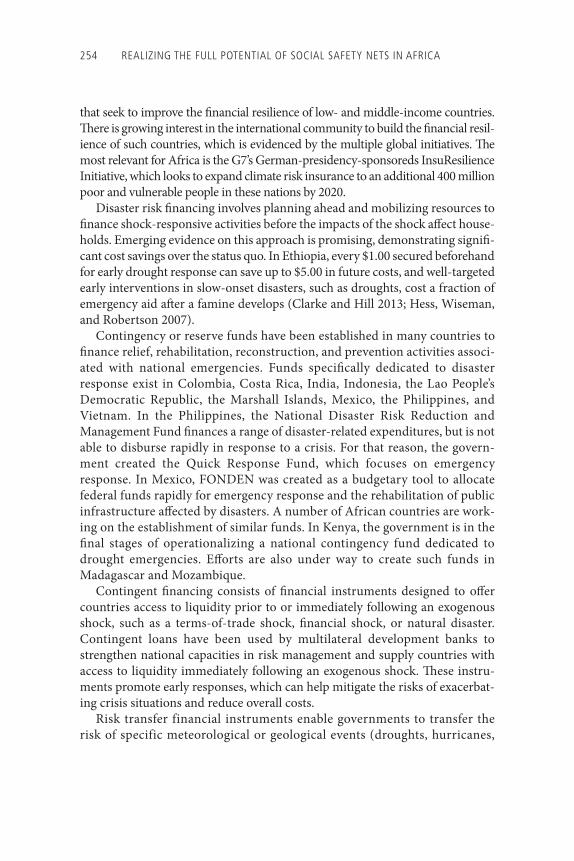
254 REALIZING THE FULL POTENTIAL OF SOCIAL SAFETY NETS IN AFRICA
that seek to improve the fi nancial resilience of low- and middle-income countries. Th ere is growing interest in the international community to build the fi nancial resil-ience of such countries, which is evidenced by the multiple global initiatives. Th e most relevant for Africa is the G7’s German-presidency-sponsoreds InsuResilience Initiative, which looks to expand climate risk insurance to an additional 400 million poor and vulnerable people in these nations by 2020.
Disaster risk fi nancing involves planning ahead and mobilizing resources to fi nance shock-responsive activities before the impacts of the shock aff ect house-holds. Emerging evidence on this approach is promising, demonstrating signifi -cant cost savings over the status quo. In Ethiopia, every $1.00 secured beforehand for early drought response can save up to $5.00 in future costs, and well-targeted early interventions in slow-onset disasters, such as droughts, cost a fraction of emergency aid aft er a famine develops (Clarke and Hill 2013; Hess, Wiseman, and Robertson 2007).
Contingency or reserve funds have been established in many countries to fi nance relief, rehabilitation, reconstruction, and prevention activities associ-ated with national emergencies. Funds specifi cally dedicated to disaster response exist in Colombia, Costa Rica, India, Indonesia, the Lao People’s Democratic Republic, the Marshall Islands, Mexico, the Philippines, and Vietnam. In the Philippines, the National Disaster Risk Reduction and Management Fund fi nances a range of disaster-related expenditures, but is not able to disburse rapidly in response to a crisis. For that reason, the govern-ment created the Quick Response Fund, which focuses on emergency response. In Mexico, FONDEN was created as a budgetary tool to allocate federal funds rapidly for emergency response and the rehabilitation of public infrastructure aff ected by disasters. A number of African countries are work-ing on the establishment of similar funds. In Kenya, the government is in the fi nal stages of operationalizing a national contingency fund dedicated to drought emergencies. Eff orts are also under way to create such funds in Madagascar and Mozambique.
Contingent fi nancing consists of fi nancial instruments designed to off er countries access to liquidity prior to or immediately following an exogenous shock, such as a terms-of-trade shock, fi nancial shock, or natural disaster. Contingent loans have been used by multilateral development banks to strengthen national capacities in risk management and supply countries with access to liquidity immediately following an exogenous shock. Th ese instru-ments promote early responses, which can help mitigate the risks of exacerbat-ing crisis situations and reduce overall costs.
Risk transfer financial instruments enable governments to transfer the risk of specific meteorological or geological events (droughts, hurricanes,
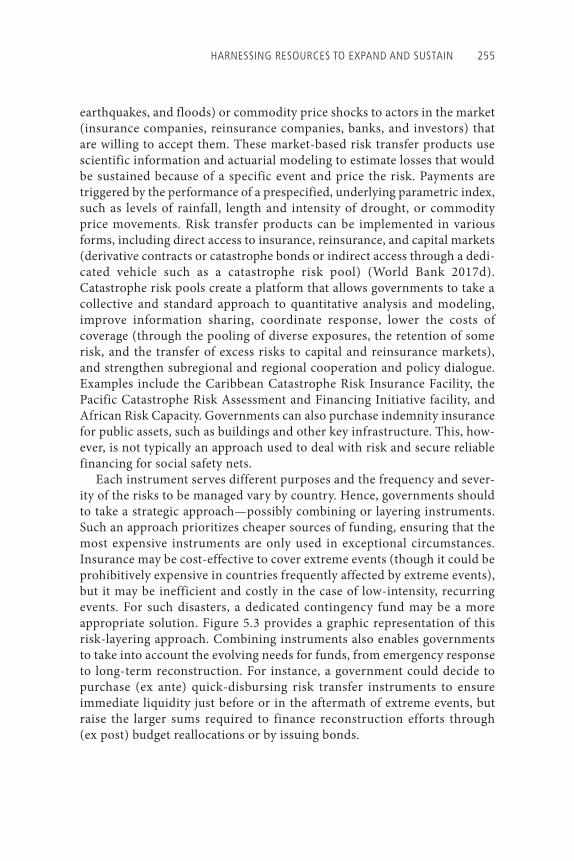
HARNESSING RESOURCES TO EXPAND AND SUSTAIN 255
earthquakes, and floods) or commodity price shocks to actors in the market (insurance companies, reinsurance companies, banks, and investors) that are willing to accept them. These market-based risk transfer products use scientific information and actuarial modeling to estimate losses that would be sustained because of a specific event and price the risk. Payments are triggered by the performance of a prespecified, underlying parametric index, such as levels of rainfall, length and intensity of drought, or commodity price movements. Risk transfer products can be implemented in various forms, including direct access to insurance, reinsurance, and capital markets (derivative contracts or catastrophe bonds or indirect access through a dedi-cated vehicle such as a catastrophe risk pool) (World Bank 2017d). Catastrophe risk pools create a platform that allows governments to take a collective and standard approach to quantitative analysis and modeling, improve information sharing, coordinate response, lower the costs of coverage (through the pooling of diverse exposures, the retention of some risk, and the transfer of excess risks to capital and reinsurance markets), and strengthen subregional and regional cooperation and policy dialogue. Examples include the Caribbean Catastrophe Risk Insurance Facility, the Pacific Catastrophe Risk Assessment and Financing Initiative facility, and African Risk Capacity. Governments can also purchase indemnity insurance for public assets, such as buildings and other key infrastructure. This, how-ever, is not typically an approach used to deal with risk and secure reliable financing for social safety nets.
Each instrument serves different purposes and the frequency and sever-ity of the risks to be managed vary by country. Hence, governments should to take a strategic approach—possibly combining or layering instruments. Such an approach prioritizes cheaper sources of funding, ensuring that the most expensive instruments are only used in exceptional circumstances. Insurance may be cost-effective to cover extreme events (though it could be prohibitively expensive in countries frequently affected by extreme events), but it may be inefficient and costly in the case of low-intensity, recurring events. For such disasters, a dedicated contingency fund may be a more appropriate solution. Figure 5.3 provides a graphic representation of this risk-layering approach. Combining instruments also enables governments to take into account the evolving needs for funds, from emergency response to long-term reconstruction. For instance, a government could decide to purchase (ex ante) quick-disbursing risk transfer instruments to ensure immediate liquidity just before or in the aftermath of extreme events, but raise the larger sums required to finance reconstruction efforts through (ex post) budget reallocations or by issuing bonds.
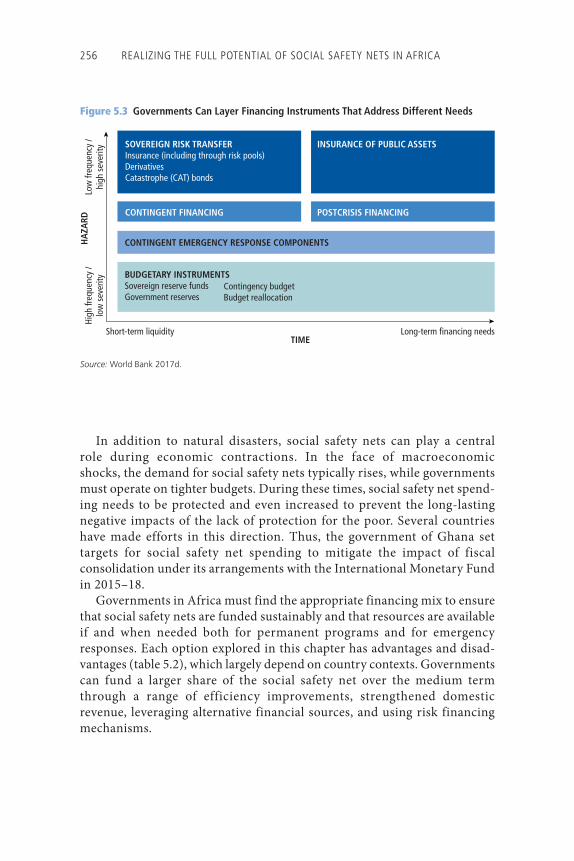
256 REALIZING THE FULL POTENTIAL OF SOCIAL SAFETY NETS IN AFRICA
In addition to natural disasters, social safety nets can play a central role during economic contractions. In the face of macroeconomic shocks, the demand for social safety nets typically rises, while governments must operate on tighter budgets. During these times, social safety net spend-ing needs to be protected and even increased to prevent the long-lasting negative impacts of the lack of protection for the poor. Several countries have made efforts in this direction. Thus, the government of Ghana set targets for social safety net spending to mitigate the impact of fiscal consolidation under its arrangements with the International Monetary Fund in 2015–18.
Governments in Africa must find the appropriate financing mix to ensure that social safety nets are funded sustainably and that resources are available if and when needed both for permanent programs and for emergency responses. Each option explored in this chapter has advantages and disad-vantages (table 5.2), which largely depend on country contexts. Governments can fund a larger share of the social safety net over the medium term through a range of efficiency improvements, strengthened domestic revenue, leveraging alternative financial sources, and using risk financing mechanisms.
Fi gure 5.3 Governments Can Layer Financing Instruments That Address Different Needs
Source: World Bank 2017d.
TIMEShort-term liquidity
High
freq
uenc
y /
low
sev
erity
Low
freq
uenc
y /
high
sev
erity
HA
ZARD
Long-term financing needs
SOVEREIGN RISK TRANSFERInsurance (including through risk pools)DerivativesCatastrophe (CAT) bonds
INSURANCE OF PUBLIC ASSETS
CONTINGENT EMERGENCY RESPONSE COMPONENTS
BUDGETARY INSTRUMENTSSovereign reserve fundsGovernment reserves
Contingency budgetBudget reallocation
CONTINGENT FINANCING POSTCRISIS FINANCING
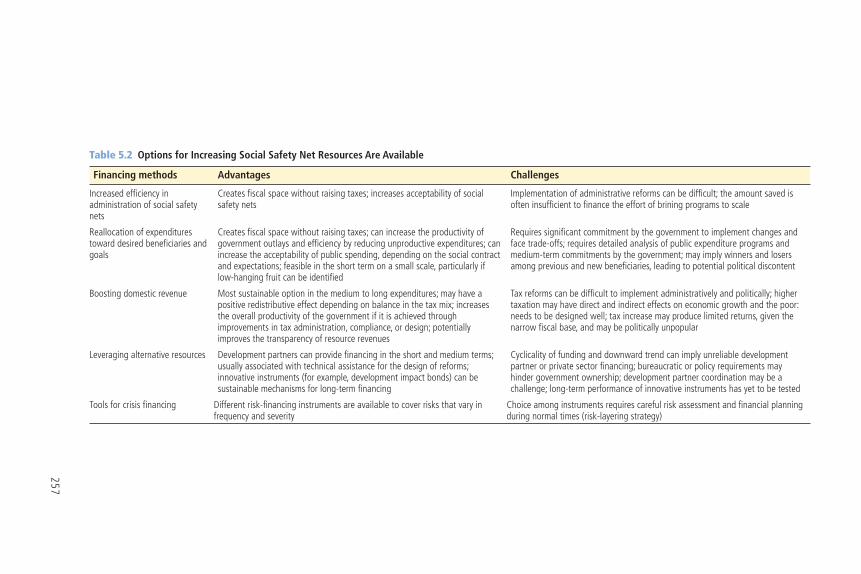
257
T able 5.2 Options for Increasing Social Safety Net Resources Are Available
Financing methods Advantages Challenges
Increased effi ciency in administration of social safety nets
Creates fi scal space without raising taxes; increases acceptability of social safety nets
Implementation of administrative reforms can be diffi cult; the amount saved is often insuffi cient to fi nance the effort of brining programs to scale
Reallocation of expenditures toward desired benefi ciaries and goals
Creates fi scal space without raising taxes; can increase the productivity of government outlays and effi ciency by reducing unproductive expenditures; can increase the acceptability of public spending, depending on the social contract and expectations; feasible in the short term on a small scale, particularly if low-hanging fruit can be identifi ed
Requires signifi cant commitment by the government to implement changes and face trade-offs; requires detailed analysis of public expenditure programs and medium-term commitments by the government; may imply winners and losers among previous and new benefi ciaries, leading to potential political discontent
Boosting domestic revenue Most sustainable option in the medium to long expenditures; may have a positive redistributive effect depending on balance in the tax mix; increases the overall productivity of the government if it is achieved through improvements in tax administration, compliance, or design; potentially improves the transparency of resource revenues
Tax reforms can be diffi cult to implement administratively and politically; higher taxation may have direct and indirect effects on economic growth and the poor: needs to be designed well; tax increase may produce limited returns, given the narrow fi scal base, and may be politically unpopular
Leveraging alternative resources Development partners can provide fi nancing in the short and medium terms; usually associated with technical assistance for the design of reforms; innovative instruments (for example, development impact bonds) can be sustainable mechanisms for long-term fi nancing
Cyclicality of funding and downward trend can imply unreliable development partner or private sector fi nancing; bureaucratic or policy requirements may hinder government ownership; development partner coordination may be a challenge; long-term performance of innovative instruments has yet to be tested
Tools for crisis fi nancing Different risk-fi nancing instruments are available to cover risks that vary in frequency and severity
Choice among instruments requires careful risk assessment and fi nancial planning during normal times (risk-layering strategy)
258 REALIZING THE FULL POTENTIAL OF SOCIAL SAFETY NETS IN AFRICA
Notes
1. Th e poverty gap is the mean shortfall of the total population from the poverty line. It is expressed as a percent share of the poverty line. It counts the shortfall of the nonpoor at 0.0 percent. Th e gap refl ects the incidence and the depth of poverty.
2. Rwanda and South Africa off er examples. See on tax administration reform above in the text. See also Bastagli (2015); Benhassine et al. (2016).
References
Acosta, Pablo, Phillippe G. Leite, and Jamele Rigolini. 2011. “Should Cash Transfers Be Confi ned to the Poor? Implications for Poverty and Inequality in Latin America.” Policy Research Working Paper 5875, World Bank, Washington, DC.
AfDB (African Development Bank). 2010. “Domestic Resource Mobilization for Poverty Reduction in East Africa: Rwanda Case Study.” November, Regional Department East A, AfDB.
Alam, Asad, Renosi Mokate, and Kathrin A. Plangemann, eds. 2016. Making It Happen: Selected Case Studies of Institutional Reforms in South Africa. Directions in Development: Public Sector Governance Series. Washington, DC: World Bank.
Alesina, Alberto, Michele Battisti, and Joseph Zeira. 2015. “Technology and Labor Regulations: Th eory and Evidence.” NBER Working Paper 20841, National Bureau of Economic Research, Cambridge, MA.
Audsley, Blake, Riikka Halme, and Niels Balzer. 2010. “Comparing Cash and Food Transfers: A Cost-Benefi t Analysis from Rural Malawi.” In Revolution: From Food Aid to Food Assistance, Innovations in Overcoming Hunger, edited by Steven Were Omamo, Ugo Gentilini, and Susanna Sandström, 89–102. Rome: World Food Programme.
Bastagli, Francesca. 2015. “Bringing Taxation into Social Protection Analysis and Planning.” ODI Working Paper 421, Overseas Development Institute, London.
———. 2016. “Bringing Taxation into Social Protection Analysis and Planning.” Guidance Note, Overseas Development Institute, London.
Benhassine, Najy, David McKenzie, Victor Pouliquen, and Massimiliano Santini. 2016. “Can Enhancing the Benefi ts of Formalization Induce Informal Firms to Become Formal? Experimental Evidence from Benin.” Policy Research Working Paper 7900, World Bank, Washington, DC.
Brown, Caitlin, Martin Ravallion, and Dominique van de Walle. 2016. “A Poor Means Test? Econometric Targeting in Africa.” Policy Research Working Paper 7915, World Bank, Washington, DC.
Bui, Anthony L., Rouselle F. Lavado, Elizabeth K. Johnson, Benjamin P. Brooks, Michael K. Freeman, Casey M. Graves, Annie Haakenstad, Benjamin Shoemaker, Michael Hanlon, and Joseph L. Dieleman. 2015. “National Health Accounts Data from 1996 to 2010: A Systematic Review.” Bulletin of the World Health Organization 93 (8): 566–76.
Castro-Leal, Florencia, Julia Dayton, Lionel Demery, and Kalpana Mehra. 1999. “Public Social Spending in Africa: Do the Poor Benefi t?” World Bank Research Observer 14 (1): 49–72.
HARNESSING RESOURCES TO EXPAND AND SUSTAIN 259
CGAP (Consultative Group to Assist the Poor). 2013. “Cash for Assets: World Food Programme’s Exploration of the In-Kind to E-Payments Shift for Food Assistance in Kenya.” September, CGAP, World Bank, Washington, DC.
———. 2014. “Electronic G2P Payments: Evidence from Four Lower-Income Countries.” CGAP, World Bank, Washington, DC.
CGD (Center for Global Development) and Social Finance. 2013. Investing in Social Outcomes: Development Impact Bonds—Th e Report of the Development Impact Bond Working Group. London: Social Finance Ltd; Washington, DC: CGD.
Clarke, Daniel J., and Stefan Dercon. 2016. Dull Disasters? How Planning Ahead Will Make a Diff erence. Washington, DC: World Bank; Oxford, U.K.: Oxford University Press.
Clarke, Daniel J., and Ruth Vargas Hill. 2013. “Cost-Benefi t Analysis of the African Risk Capacity Facility.” IFPRI Discussion Paper 1292, International Food Policy Research Institute, Washington, DC.
Coleman, David. 2016. “Variations on the Impact Bond Concept: Remittances as a Funding Source for Impact Bonds in Low- and Middle-Income Countries.” September Brookings Institution, Washington, DC.
de la Brière, Bénédicte, Deon Filmer, Dena Ringold, Dominic Rohner, Karelle Samuda, and Anastasiya Denisova. 2017. From Mines and Wells to Well-Built Minds: Turning Sub-Saharan Africa’s Natural Resource Wealth into Human Capital. Directions in Development: Human Development Series. Washington, DC: World Bank.
Devarajan, Shantayanan, and Marcelo Giugale. 2013. “Th e Case for Direct Transfers of Resource Revenues in Africa.” With Hélène Ehrhart, Tuan Minh Le, and Huong Mai Nguyen. CGD Working Paper 333, Center for Global Development, Washington, DC.
Farrell, Michael James. 1957. “Th e Measurement of Productive Effi ciency.” Journal of the Royal Statistical Society, Series A (General) 120 (3): 253–90.
Forstater, Maya, Simon Zadek, Yang Guang, Kelly Yu, Chen Xiao Hong, and Mark George. 2010. “Corporate Responsibility in African Development: Insights from an Emerging Dialogue.” Corporate Social Responsibility Initiative Working Paper 60 (October), Harvard University, Cambridge, MA.
Galang, Roberto Martin N., Rouselle F. Lavado, and Gabriel Angelo B. Domingo. 2013. “Why Do Asian Firms Say Th at Th eir Governments Are Corrupt: Assessing the Impact of Firm-Level Characteristics on Corruption Perceptions.” AIM Working Paper 14–004, Asian Institute of Management, Makati, Manila.
Gelbach, Jonah B., and Lant H. Pritchett. 2002. “Is More for the Poor Less for the Poor: Th e Politics of Means-Tested Targeting.” B. E. Journal of Economic Analysis and Policy 2 (1): 1–28.
Gething, Peter, and Nina Rosas. 2015 “Developing a Poverty Map for Targeting of Social Safety Net Programs in Sierra Leone.” Social Protection and Labor Global Practice, World Bank, Washington, DC.
GIZ (Deutsche Gesellschaft fü r Internationale Zusammenarbeit). 2012. Shaping CSR in Sub-Saharan Africa: Guidance Notes from a Mapping Survey. Bonn GIZ.
Guillaume, Dominique M., Roman Zytek, and Mohammad Reza Farzin. 2011. “Iran: Th e Chronicles of the Subsidy Reform.” IMF Working Paper 11/167, International Monetary Fund, Washington, DC.
260 REALIZING THE FULL POTENTIAL OF SOCIAL SAFETY NETS IN AFRICA
Gustafsson-Wright, Emily, and Sophie Gardiner. 2016. “Education Plus Development: Educate Girls Development Impact Bond Could Be a Win-Win for Investors and Students.” #GirlsEdu (blog), July 18. https://www.brookings.edu/blog/education -plus-development/2016/07/18/educate-girls-development-impact-bond-could-be-win -win -for-investors-and -students/.
Gustafsson-Wright, Emily, Sophie Gardiner, and Vidya Putcha. 2015. “Th e Potential and Limitations of Impact Bonds: Lessons from the First Five Years of Experience Worldwide.” Global Economy and Development Series, Brookings Institution, Washington, DC.
Guven, Melis U., and Phillippe G. Leite. 2016. “Benefi ts and Costs of Social Pensions in Sub-Saharan Africa.” Social Protection and Labor Discussion Paper 1607, World Bank, Washington, DC.
Herrmann, Peter, Arno Tausch, Almas Heshmati, and Chemen S. J. Bajalan. 2008. “Effi ciency and Eff ectiveness of Social Spending.” IZA Discussion Paper 3482, Institute for the Study of Labor, Bonn.
Hess, Ulrich, William Wiseman, and Tim Robertson. 2007. “Ethiopia: Integrated Risk Financing to Protect Livelihoods and Foster Development.” Discussion Paper (November), World Food Programme, Rome.
Hirvonen, Kalle, Giulia Mascagni, and Keetie Roelen. 2016. “Linking Taxation and Social Protection: Evidence on Redistribution and Poverty Reduction in Ethiopia.” ICTD Working Paper 61 (December), International Centre for Tax and Development, Institute of Development Studies, Brighton, UK.
ICTD (International Centre for Tax and Development). 2016. “Africa’s First Large-Scale Tax Experiment: Researching Compliance in Rwanda.” Summary Brief, ICTD, Institute of Development Studies, Brighton, UK.
IDinsight. 2015. “Evaluation of M-Tech and Paper Enumeration of Social Cash Transfer Benefi ciaries in Zambia: Implementation Guide.” November 25, IDinsight, New Delhi.
ILO (International Labour Organization). 2016. “Delivering Social Protection for All.” Issue Brief, Inter-Agency Task Force on Financing for Development, International Labour Offi ce, Geneva.
IMF (International Monetary Fund). 2009. “Some Observations on Domestic Revenue Mobilization.” IMF staff presentation during mission to Rwanda, October–November, Kigali, Rwanda.
———. 2015. Sub-Saharan Africa: Dealing with the Gathering Clouds. Regional Economic Outlook, October. World Economic and Financial Surveys. Washington, DC: IMF.
———. 2017. Sub-Saharan Africa: Fiscal Adjustment and Economic Diversifi cation. Regional Economic Outlook, October. World Economic and Financial Surveys. Washington, DC: IMF.
Inchauste, Gabriela, Nora Lustig, Mashekwa Maboshe, Catronia Purfi eld, and Ingrid Woolard. 2015. “Th e Distributional Impact of Fiscal Policy in South Africa.” CEQ Working Paper 29, Commitment to Equity, Inter-American Dialogue, Washington, DC; Center for Inter-American Policy and Research and Department of Economics, Tulane University, New Orleans.
Inchauste, Gabriela, and David G. Victor, eds. 2017. Th e Political Economy of Energy Subsidy Reform. Directions in Development: Public Sector Governance Series. Washington, DC: World Bank.
HARNESSING RESOURCES TO EXPAND AND SUSTAIN 261
Kakwani, Nanak, Fábio Veras Soares, and Hyun H. Son. 2005. “Conditional Cash Transfers in African Countries.” Working Paper 9, International Poverty Centre, United Nations Development Programme, Brasília.
Kar, Dev, Devon Cartwright-Smith, and Ann Hollingshead. 2010. “Th e Absorption of Illicit Financial Flows from Developing Countries: 2002–2006.” Global Financial Integrity, Center for International Policy, Washington, DC.
Karlan, Dean, and Bram Th uysbaert. 2013. “Targeting Ultra-Poor Households in Honduras and Peru.” NBER Working Paper 19646, National Bureau of Economic Research, Cambridge, MA.
Ketkar, Suhas L., and Dilip Ratha. 2007. “Development Finance via Diaspora Bonds: Track Record and Potential.” Policy Research Working Paper 4311, World Bank, Washington, DC.
Kettle, Stewart, Marco Hernandez, Simon Ruda, and Michael Sanders. 2016. “Behavioral Interventions in Tax Compliance: Evidence from Guatemala.” Policy Research Working Paper 7690, World Bank, Washington, DC.
Kuddo, Arvo, and Michael Weber. 2017. “Policies on Taxation of Labor.” Working note, World Bank, Washington, DC.
Lindert, Kathy, Emmanuel Skoufi as, and Joseph Shapiro. 2006. “Redistributing Income to the Poor and the Rich: Public Transfers in Latin America and the Caribbean. Social Protection Discussion Paper 0605 (August), Social Safety Nets Primer Series, World Bank, Washington, DC.
Mandl, Ulrike, Adriaan Dierx, and Fabienne Ilzkovitz. 2008. “Th e Eff ectiveness and Effi ciency of Public Spending.” Economic Paper 301, Directorate-General for Economic and Financial Aff airs, European Commission, Brussels.
Mansour, Mario. 2014. “A Tax Revenue Dataset for Sub-Saharan Africa: 1980–2010.” FERDI Working Paper I19, Fondation pour les études et recherches sur le développe-ment international, Clermont-Ferrand, France.
Mascagni, Giulia. 2017. “From the Lab to the Field: A Review of Tax Experiments.” Journal of Economic Surveys. http://onlinelibrary.wiley.com/doi/10.1111/joes.12201 / abstract.
Mascagni, Giulia, Christopher Nell, and Nara Monkam. 2017. “One Size Does Not Fit All: A Field Experiment on the Drivers of Tax Compliance and Delivery Methods in Rwanda.” ICTD Working Paper 58, International Centre for Tax and Development, Institute of Development Studies, Brighton, UK.
Monchuk, Victoria. 2014. Reducing Poverty and Investing in People: New Role of Safety Nets in Africa. Directions in Development: Human Development Series. Washington, DC: World Bank.
Muralidharan, Karthik, Paul Niehaus, and Sandip Sukhtankar. 2016. “Building State Capacity: Evidence from Biometric Smartcards in India.” American Economic Review 106 (10): 2895–2929.
NAO (National Audit Offi ce). 2008. “Tackling External Fraud.” Good Practice Guide, NAO, London.
Nelson, Kenneth. 2012. “Improving the Effi ciency of Social Protection: Synthesis Report.” Peer Review in Social Protection and Social Inclusion Series 2011, European Commission, Brussels.
262 REALIZING THE FULL POTENTIAL OF SOCIAL SAFETY NETS IN AFRICA
O’Brien, Clare, Fidelis Hove, and Gabrielle Smith. 2013. “Factors Aff ecting the Cost-Effi ciency of Electronic Transfers in Humanitarian Programmes.” Oxford Policy Management.
OECD (Organisation for Economic Co-operation and Development). 2017. “Social Protection in East Africa: Harnessing the Future.” OECD, Paris.
Ortiz, Isabel, Matthew Cummins, and Kalaivani Karunanethy. 2015. “Fiscal Space for Social Protection: Options to Expand Social Investments in 187 Countries.” ESS Working Paper 48, Extension of Social Security, International Labour Offi ce, Geneva.
Ozaki, Mayumi. 2016. “Asia Could Use Diaspora Bonds to Finance Development.” Asian Development Blog, May 27. https://blogs.adb.org/blog/asia-could-use-diaspora -bonds-fi nance-development.
Palacios, Robert. 2017. “Death of the Payroll Tax.” Draft policy note, World Bank, Washington, DC.
Rodrik, Dani. 2016. “Premature Deindustrialization.” Journal of Economic Growth 21 (1): 1–3.Samsen, Michael, Ingrid van Niekerk, and Kenneth Mac Quene. 2011. Designing and
Implementing Social Transfer Programmes, 2nd ed. Cape Town: Economic Policy Research Institute.
Santos, Indhira. 2017. “Implications of the Digital Revolution for Social Protection, Taxation, and Labor Market Institutions.” Working paper, World Bank, Washington, DC.
Savedoff , William, and Albert Alwang. 2015. “Th e Single Best Health Policy in the World: Tobacco Taxes.” CGD Policy Paper 062, Center for Global Development, Washington, DC.
Slater, Rachel, and John Farrington. 2009. “Targeting of Social Transfers: A Review for DFID.” With inputs from Marcella Vigneri, Mike Samson, and Shaheen Akter. Overseas Development Institute, London.
Sudaram, Ramia, Victoria Strokova, and Frieda Vandeninden. 2014. “Eff ectiveness and Efficiency of Social Protection in Europe and Central Asia: A Post-Crisis Assessment.” Paper presented at the European Association of Development Research and Training Institute’s 14th General Conference, “Responsible Development in a Polycentric World: Inequality, Citizenship, and the Middle Classes,” June 23–26, Bonn.
Swiss Re (Swiss Reinsurance Company Ltd.). 2016. “Global Insurance Review 2016 and Outlook 2017/18.” Swiss Reinsurance Company Ltd., Zürich.
UNHCR (United Nations High Commissioner for Refugees). 2017. “Biennial Program Budget Data.” Global Focus, UNHCR, Geneva. http://reporting.unhcr.org / fi nancial #tabs-fi nancial-budget.
Visser, Wayne, and Nick Tolhurst, eds. 2010. Th e World Guide to CSR: A Country-by-Country Analysis of Corporate Sustainability and Responsibility. Sheffi eld, UK: Greenleaf.
World Bank. 2013. “Republic of Senegal: Social Safety Net Assessment.” Report ACS7005, World Bank, Washington, DC.
———. 2014. “Impact of Strengthening the Information Systems in Social Assistance Programs.” Working paper, World Bank, Washington, DC.
HARNESSING RESOURCES TO EXPAND AND SUSTAIN 263
———. 2015. “Developing a High Resolution Poverty Map for Tanzania: Final Report.” Social Protection and Labor Global Practice, World Bank, Washington, DC.
———. 2016a. “Project Appraisal Document on a Proposed Credit to the Kingdom of Lesotho for a Social Assistance Project.” Report PAD1377, World Bank, Washington, DC.
———. 2016b. “Th e World Bank Group’s Response to Illicit Financial Flows: A Stocktaking.” World Bank, Washington, DC.
———. 2017a. “Social Protection and Labor Delivery Systems: Taxonomy of Core Terminology.” World Bank, Washington, DC.
———. 2017b. “Strengthening Domestic Resource Mobilization.” World Bank, Washington, DC.
———. 2017c. “Tobacco Taxation Conference: Summary of Proceedings.” World Bank, Washington, DC.
———. 2017d. “Sovereign Climate and Disaster Risk Pooling: World Bank Technical Contribution to the G20.” World Bank, Washington, DC.
———. 2018. Th e State of Social Safety Nets 2018. World Bank, Washington, DC.

265
A.1 Defi nition of Social Safety Nets
Social safety nets are defi ned in this report as noncontributory programs targeting the poor or vulnerable. Th ey may be designed, implemented, and supported by governments, international organizations, or nongovernmental organizations (NGOs). Th eir distinctive feature is their noncontributory nature, that is, benefi ciaries do not have to contribute fi nancially to receive the benefi ts. Th is diff erentiates them from contributory forms of social protection, whereby prior contributions or participation in the labor market determine benefi t eligibility.
Th e defi nition of social safety nets used in this report includes social assistance programs, social care services, and programs that support productive activities. Th e range of programs included is detailed in the next section. In this report, general health care and education interventions or general consumer price subsidies (including energy, electricity, and food subsidies) are not considered part of social safety nets.
A.2 Typologies Used in This Report
A.2.1 Typologies of Social Safety Net ProgramsBuilding on the ASPIRE database classifi cation, this report relies on four typol-ogies to classify social safety net programs. For each typology, the categories have been systematically built to be mutually exclusive. Where relevant, the ASPIRE categories covered under each category are specifi ed to allow readers to compile similar aggregates from the ASPIRE database.
Appendix A
Defi nitions and Data Sources
266 REALIZING THE FULL POTENTIAL OF SOCIAL SAFETY NETS IN AFRICA
Program Typology 1: Program TypeTh is classifi cation groups programs into nine categories, building on Grosh et al. (2008). It refl ects diff erences in program benefi ts, program objectives, and the intended benefi ciaries. See Grosh, Margaret E., Carlo del Ninno, Emil Tesliuc, and Azedine Ouerghi, 2008, For Protection and Promotion: Th e Design and Implementation of Eff ective Safety Nets, Washington, DC: World Bank.
• Cash transfer programs: Cash transfer programs off er periodic monetary transfers to benefi ciaries with a view to providing regular, predictable income support. Th is category includes poverty reduction programs; family and child allowance (including orphan and vulnerable children benefi ts); public-private charity; disability pensions, allowance, or benefi ts; war veterans’ pen-sions, allowances, or benefi ts; noncontributory funeral grants; burial allowances; entrepreneurship support and startup incentives (grants, loans, training); and other cash programs. Both conditional and unconditional cash transfer programs are included in this category. In this report, this cat-egory excludes public works, emergency, scholarships, and social pension programs, which are covered in other categories. Th is corresponds to the following categories in ASPIRE: 1.1.1, 1.1.2, 1.1.3, 1.1.8, 1.1.9, 1.1.10, 1.1.12, 1.2.8, and 3.2.5.
• School feeding programs: Th is category includes school feeding programs, which supply meals or snacks for children at school to encourage their enrollment and attendance and improve their nutritional status and ability to learn. It also includes take-home food rations for children’s families. Th is corresponds to the following category in ASPIRE: 1.2.3.
• Public works programs: Th is category includes public works, workfare, and direct job creation programs providing support in cash or food (including food-for-training or food-for-assets programs). Public works programs off er short-term employment at low wages on labor-intensive projects, such as road construction and maintenance, irrigation infrastructure, reforestation, soil conservation, and social services. Support is typically in the form of either cash or food transfers. Th is corresponds to the following categories in ASPIRE: 1.1.11 and 1.2.10.
• Education interventions: In the report typology, this category includes schol-arships and targeted subsidies in education (for example, orphans and vul-nerable children [OVC] bursaries). It excludes general education interventions (such as free basic education). Educational fee waivers and scholarships assist households in meeting the cost of educational services by covering part of the fees or other selected expenditures. Th is corresponds to the following categories in ASPIRE: 1.1.6. and 1.2.7.
• Health interventions: In the report typology, this category includes targeted subsidies and fee waivers in health (such as reduced medical fees for the
DEFINITIONS AND DATA SOURCES 267
vulnerable population). It excludes general health interventions (for instance, free health care/treatments and campaigns). Th ese programs assist selected households in meeting the costs of health services. Th is corresponds to the following category in ASPIRE: 1.2.6.
• Emergency programs: Th is category includes programs providing emer-gency support in cash and in kind (including support for refugees and returning migrants). Emergency support programs supply cash or in-kind transfers to individuals or households in case of emergency or in response to shocks. Th e shocks may encompass weather shocks (droughts, fl oods), pandemics, food insecurity, human-made crises, and economic down-turns. Th e transfers are usually temporary, typically over a period of a few months. Th is corresponds to the following categories in ASPIRE: 1.1.5 and 1.2.5.
• Food-based programs: In the report typology, food-based programs include programs providing food stamps and vouchers, food distribution programs, and nutritional programs that involve therapeutic feeding distribution and promote good feeding practices. Th is category excludes food-for-work pro-grams, emergency in-kind transfer programs, and meals provided at schools, which are classifi ed in other groups. Th is corresponds to the following cat-egories in ASPIRE: 1.2.1, 1.2.2, and 1.2.4.
• Social pensions: Th is category includes old-age social pensions, allowances, or benefi ts. Social pensions are regular cash transfers provided exclusively to the elderly. Unlike contributory pensions or social insurance programs, social pensions do not require prior contributions. Old-age social pensions may be universal or targeted to the poor. Th is corresponds to the following category in ASPIRE: 1.1.7.
• Other programs: Th is category includes other noncontributory programs tar-geting the poor or vulnerable, such as programs distributing school supplies, tax exemptions, social care services, and other programs not included in the other eight categories. Th is corresponds to the following categories in ASPIRE: 1.2.9, 1.2.11, 1.2.12, and 1.3, 4.
Program Typology 2: Life CycleTh is classifi cation categorizes programs in terms of their targeted population, organized along the life cycle. Th ere are fi ve categories, which are mutually exclusive:
• Children: Th is category includes family and child allowances (including pro-grams for orphans and vulnerable children), scholarships, school feeding programs, education interventions, school supplies, nutritional programs, and care services for children and youth. Th is corresponds to the following categories in ASPIRE: 1.1.2, 1.1.6, 1.2.3, 1.2.7, 1.2.9, 1.2.4, and 4.1.
268 REALIZING THE FULL POTENTIAL OF SOCIAL SAFETY NETS IN AFRICA
• Working-age population: Th is category includes programs that are directed at adults. It includes public works programs, workfare programs, direct job cre-ation programs, entrepreneurship support, start-up incentives, and care ser-vices for vulnerable working-age individuals. Th is corresponds to the following categories in ASPIRE: 1.1.11, 1.2.10, and 4.3.
• Th e elderly: Th is category includes old-age social pensions, allowances, or benefi ts as well as war veterans pensions, allowances, or benefi ts. Th is cor-responds to the following categories in ASPIRE: 1.1.17 and 1.1.9.
• Households and families: Th is category includes programs that target entire households or families, rather than specifi c individuals. It includes poverty reduction programs, public-private charity, allowances for housing and utili-ties, food stamps and vouchers, food distribution programs, targeted subsi-dies in health care and housing or utilities, tax exemptions, noncontributory funeral grants, burial allowances, care services for families, and other social assistance Th is corresponds to the following categories in ASPIRE: 1.1.1, 1.1.3, 1.1.4, 1.2.1, 1.2.2, 1.2.6, 1.2.8, 1.2.11, 1.3, 1.1.10, 1.1.12, and 4.2.
• Special groups: Th is category includes programs that target other groups, out-side the four categories described above. In the report typology, it includes disability social pensions, allowances, and benefi ts and emergency support in cash and in kind (including support for refugees and returning migrants). Th is corresponds to the following categories in ASPIRE: 1.18, 1.1.5, and 1.2.5.
Program Typology 3: Targeting MethodTh is classifi cation categorizes programs according to the method they use to identify benefi ciaries. Programs have been organized into fi ve mutually exclu-sive categories.
• Categorical: Th is category includes programs that target individuals or households that belong to an easily identifi able and specifi c social or demo-graphic group. It typically involves defi ning eligibility in terms of character-istics that are fairly easy to observe and diffi cult to manipulate, such as age, sex, ethnicity, disability status, or land ownership. Age is a commonly used category in cash child allowances, school feeding programs, and social pensions.
• Geographical: Th is category includes programs that only use geographical criteria to identify benefi ciaries (focusing on specifi c regions, villages, neigh-borhoods, and so on).
• Geographical and categorical: Th is category includes programs that combine both geographical and categorical targeting.
• Poverty: Th is category includes programs that only use targeting methods that approximate a potential benefi ciary’s poverty, welfare, or vulnerability status.
DEFINITIONS AND DATA SOURCES 269
Th ese include various methods that are oft en combined, such as methods based on community targeting (whereby the communities identify their poor-est or most vulnerable members); a measure of potential benefi ciary consump-tion or income; indicators that proxy consumption or income (proxy-means-test); receipt or level of pensions received by potential benefi -ciaries; or some form of self-targeting (such as transfers in public works pro-grams designed to attract the poor).
• Poverty and geographical/categorical: Th is category includes programs that combine poverty-based targeting methods with either geographical or cat-egorical targeting or with both.
• N/A: Th is category includes programs for which information on the target-ing method is not available.
Program Typology 4: Nature of Benefi tsTh is classifi cation organizes programs according to the type of benefi ts or ser-vices they provide to the benefi ciaries. Four categories are defi ned, which are mutually exclusive:
• Cash: Th is category includes cash transfer programs that provide only cash benefi ts. It corresponds to the following category in ASPIRE: 1.1, which is also coded as Benefi t type 1.
• Food: Th is category includes food programs that provide only food benefi ts such as food stamps and vouchers, food distribution programs, school feed-ing programs, nutritional programs, and food-for-work programs. Th is cor-responds to the following categories in ASPIRE: 1.2.1, 1.2.2, 1.2.3, 1.2.4, and 1.2.10, which are also coded as Benefi t type 3.
• Other in kind: Th is category includes programs that provide in-kind benefi ts other than food. Th ese include targeted interventions in health care, educa-tion, housing, and utilities; school supplies; tax exemptions; social care ser-vices, and other programs. Th is corresponds to the following categories in ASPIRE: 1.2.5, 1.2.6, 1.2.7, 1.2.8, 1.2.9, 1.2.11, 1.2.12, and 1.3, 4 that are also coded as Benefi t type 2, 3, or 4.
• Mix: Any program with a combination of cash, food, or other in-kind benefi ts. Th is corresponds to all programs coded in ASPIRE as Benefi t type 5.
A.2.2 Typologies of Social Safety Net Institutions and SystemsBuilding on system and program documents, this report uses typologies to compare across countries and regions according to the development of social safety net institutions and systems. Th e categories are mutually exclusive for each typology.
270 REALIZING THE FULL POTENTIAL OF SOCIAL SAFETY NETS IN AFRICA
Institution/System Typology 1: Overall Development of Social Safety Net SystemTh is classifi cation categorizes countries according to the extent of development of their social safety net system. Th e classifi cation of countries is presented in appendix D, table D.3.
• No social safety net program: Th is category includes countries that have no or extremely limited social safety net programs.
• No solid plans: Th is category includes countries that have individual social safety net programs or elements of programs, but have not laid the founda-tions of a coordinated social safety net system.
• In progress: Th is category includes countries that have one or more programs in place, are starting to harmonize development partner involvement, and are working toward a consolidated system.
• In place: Th is category includes countries that have adequate social safety net policies and delivery capacity.
Institution/System Typology 2: Social Protection Strategy or PolicyTh is classifi cation categorizes countries according to the development of their national social safety net or social protection policy or strategy. Th e classifi ca-tion of countries is presented in appendix D, table D.1.
• Not present: If no social safety net or social protection strategy or policy has been draft ed or is in preparation.
• In progress: If the country is in the process of developing or validating a national social safety net or social protection strategy or policy.
• Present: If the country has adopted a national social safety net or social protection strategy or policy.
Institution/System Typology 3: OrganizationsTh is classifi cation is used to categorize organizations. It is used in this analysis to classify organizations responsible for policy setting, oversight, and coordination, as well as the organizations responsible for program management. Th e classifi cation of countries is presented in appendix D, tables D.1 and D.3.
• Social ministry: Th is category includes organizations that are responsible for social assistance (including social aff airs, social welfare, social protection, social cohesion, social action, human rights), employment (or labor), health, women (or gender), and children and families, among others.
• Central institution: Th is category includes organizations that play a central role in government, including offi ces of the president or prime minister, as well as ministries responsible for the economy, planning, budget, or fi nance, depending on the country.
DEFINITIONS AND DATA SOURCES 271
• Other sectoral ministry: Th is category includes organizations that do not have a social mandate, including organizations responsible for local government, decentralization, local development, rural development, agriculture, forestry, transportation, and urban development, among others.
• Other arrangement: Th is category includes situations in which multiple min-istries hold joint responsibility for policy setting, oversight, and coordina-tion; or situations in which responsibilities are given to an autonomous government agency or an NGO.
• N/A: Th is category includes countries for which data on the organization responsible for policy setting, oversight, and coordination is not available, namely: Cabo Verde, Central African Republic, Comoros, Democratic Republic of Congo, the Republic of Congo., Gabon, Guinea, Namibia, São Tomé and Príncipe, Seychelles, Somalia, and Sudan.
Institution/System Typology 4: Unit Responsible for Program ImplementationTh is classifi cation categorizes countries and programs according to the unit responsible for program implementation. Th ere are fi ve categories, which are mutually exclusive. Th e classifi cation of selected programs is presented in appendix D, table D.2.
• Project implementation unit (PIU): A team or unit that is created within a government organization to manage a project and the members of which are recruited or assigned for the sole purpose of managing the project and paid for by a development partner.
• Special-purpose department: A department that is established within a gov-ernment organization with the specifi c mandate to manage one or several social safety net programs.
• Preexisting department: A department within a government organization with a set mandate and range of responsibilities to which the management of one or several social safety net programs is added.
• Semiautonomous government agency (SAGA): A legal entity that has been created by a government to undertake specifi c functions that would have otherwise be carried out by the government. It may be fully or semiautono-mous, but is typically operationally autonomous from the government.
• Nongovernmental institution. Th is category includes NGOs and agencies of the United Nations.
Institution/System Typology 5: Social Registry StatusTh is classifi cation categorizes countries according to the extent of development of their social registry. Social registries can help improve the identifi cation and targeting of benefi ciaries. Th ese systems support outreach, the collection and processing of needs assessment data, and registration and eligibility information
272 REALIZING THE FULL POTENTIAL OF SOCIAL SAFETY NETS IN AFRICA
for social safety net programs. Th ey also represent a platform so individuals or households may be considered across various programs (Karippacheril, Leite, and Lindert 2017). Th e classifi cation of countries is presented in appendix D, table D.2.
• Not planned: Th is category includes countries that do not have a social reg-istry and have no plans to develop one.
• Planned: Th is category includes countries that have plans to implement a social registry, but have not yet started implementation.
• Operating on small scale: Th is category includes countries that have a social registry in place that is operating on a small scale, usually covering less than 5 percent of the population.
• Operating on medium scale: Th is category includes countries that have a social registry in place that is operating on a medium scale, usually covering between 5 percent and 15 percent of the population.
• Operating on large scale: Th is category includes countries that have a social registry in place that is operating on a signifi cant scale, usually covering more than 15 percent of the population.
• N/A: Th is category includes countries for which data on social registries are not available, namely, Namibia.
Institution/System Typology 6: Measures to Deal with CrisesTh is classifi cation categorizes countries according to the extent to which they have taken measures to promote the use of social safety nets in responses to crises. The definition is based on Monchuk (2014, see Data Sources). Th e classifi cation of countries is presented in appendix D, table D.1.
• Limited or no measures: Th is category includes countries that have not put in place any signifi cant measure to use social safety net programs to respond to shocks or crises.
• Moderate: Th is category includes countries that have started to put in place some measures to use social safety net programs during a crisis—for instance, through the use of targeting or payment systems to reach house-holds aff ected by shocks—but have not done so in a systemic manner.
• Strong: Th is category includes countries that have taken systemic measures to use social safety nets or some elements of the social safety net system to respond to shocks and crises.
Institution/System Typology 7: Development Partner InvolvementTh is classifi cation categorizes countries according to the level of development partner involvement in social safety nets. Th e classifi cation of countries is pre-sented in appendix D, table D.2.
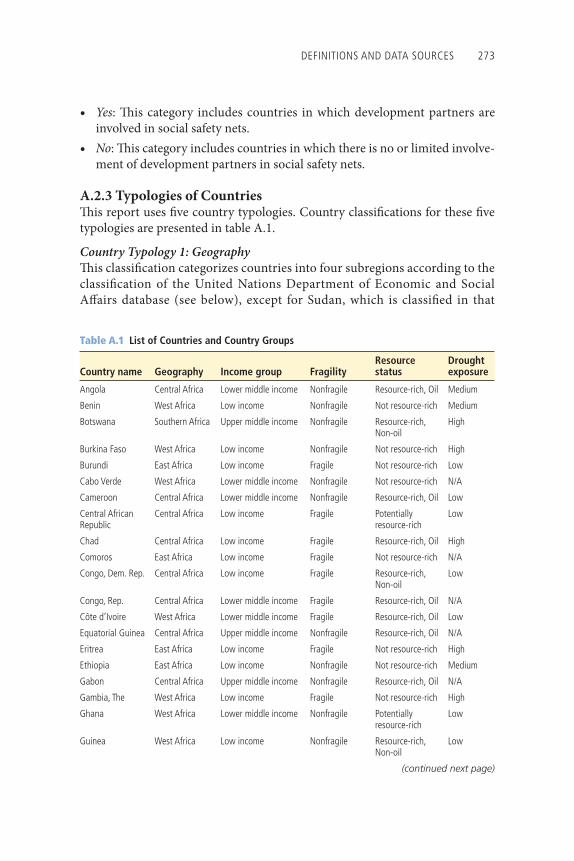
DEFINITIONS AND DATA SOURCES 273
Table A.1 List of Countries and Country Groups
Country name Geography Income group FragilityResource status
Drought exposure
Angola Central Africa Lower middle income Nonfragile Resource-rich, Oil Medium
Benin West Africa Low income Nonfragile Not resource-rich Medium
Botswana Southern Africa Upper middle income Nonfragile Resource-rich, Non-oil
High
Burkina Faso West Africa Low income Nonfragile Not resource-rich High
Burundi East Africa Low income Fragile Not resource-rich Low
Cabo Verde West Africa Lower middle income Nonfragile Not resource-rich N/A
Cameroon Central Africa Lower middle income Nonfragile Resource-rich, Oil Low
Central African Republic
Central Africa Low income Fragile Potentially resource-rich
Low
Chad Central Africa Low income Fragile Resource-rich, Oil High
Comoros East Africa Low income Fragile Not resource-rich N/A
Congo, Dem. Rep. Central Africa Low income Fragile Resource-rich, Non-oil
Low
Congo, Rep. Central Africa Lower middle income Fragile Resource-rich, Oil N/A
Côte d’Ivoire West Africa Lower middle income Fragile Resource-rich, Oil Low
Equatorial Guinea Central Africa Upper middle income Nonfragile Resource-rich, Oil N/A
Eritrea East Africa Low income Fragile Not resource-rich High
Ethiopia East Africa Low income Nonfragile Not resource-rich Medium
Gabon Central Africa Upper middle income Nonfragile Resource-rich, Oil N/A
Gambia, The West Africa Low income Fragile Not resource-rich High
Ghana West Africa Lower middle income Nonfragile Potentially resource-rich
Low
Guinea West Africa Low income Nonfragile Resource-rich, Non-oil
Low
(continued next page)
• Yes: Th is category includes countries in which development partners are involved in social safety nets.
• No: Th is category includes countries in which there is no or limited involve-ment of development partners in social safety nets.
A.2.3 Typologies of CountriesTh is report uses fi ve country typologies. Country classifi cations for these fi ve typologies are presented in table A.1.
Country Typology 1: GeographyTh is classifi cation categorizes countries into four subregions according to the classifi cation of the United Nations Department of Economic and Social Aff airs database (see below), except for Sudan, which is classifi ed in that
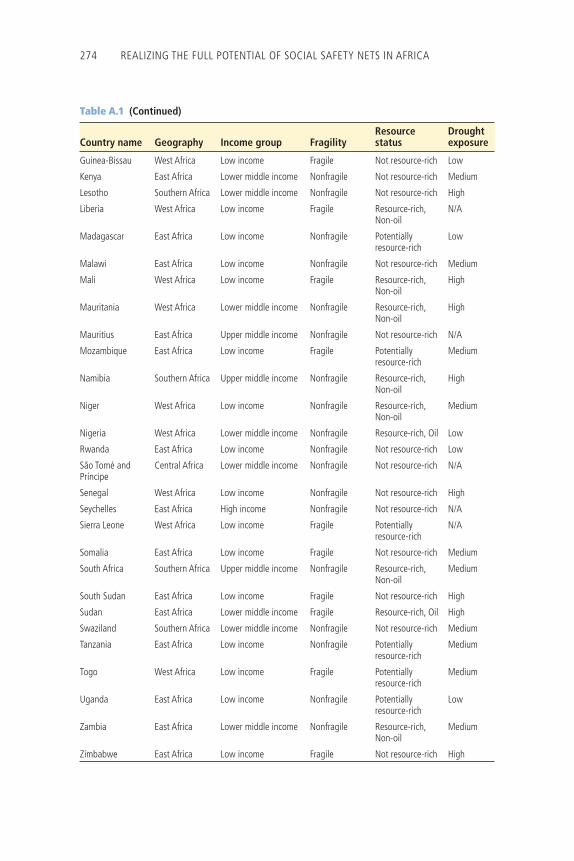
274 REALIZING THE FULL POTENTIAL OF SOCIAL SAFETY NETS IN AFRICA
Table A.1 (Continued)
Country name Geography Income group FragilityResource status
Drought exposure
Guinea-Bissau West Africa Low income Fragile Not resource-rich Low
Kenya East Africa Lower middle income Nonfragile Not resource-rich Medium
Lesotho Southern Africa Lower middle income Nonfragile Not resource-rich High
Liberia West Africa Low income Fragile Resource-rich, Non-oil
N/A
Madagascar East Africa Low income Nonfragile Potentially resource-rich
Low
Malawi East Africa Low income Nonfragile Not resource-rich Medium
Mali West Africa Low income Fragile Resource-rich, Non-oil
High
Mauritania West Africa Lower middle income Nonfragile Resource-rich, Non-oil
High
Mauritius East Africa Upper middle income Nonfragile Not resource-rich N/A
Mozambique East Africa Low income Fragile Potentially resource-rich
Medium
Namibia Southern Africa Upper middle income Nonfragile Resource-rich, Non-oil
High
Niger West Africa Low income Nonfragile Resource-rich, Non-oil
Medium
Nigeria West Africa Lower middle income Nonfragile Resource-rich, Oil Low
Rwanda East Africa Low income Nonfragile Not resource-rich Low
São Tomé and Príncipe
Central Africa Lower middle income Nonfragile Not resource-rich N/A
Senegal West Africa Low income Nonfragile Not resource-rich High
Seychelles East Africa High income Nonfragile Not resource-rich N/A
Sierra Leone West Africa Low income Fragile Potentially resource-rich
N/A
Somalia East Africa Low income Fragile Not resource-rich Medium
South Africa Southern Africa Upper middle income Nonfragile Resource-rich, Non-oil
Medium
South Sudan East Africa Low income Fragile Not resource-rich High
Sudan East Africa Lower middle income Fragile Resource-rich, Oil High
Swaziland Southern Africa Lower middle income Nonfragile Not resource-rich Medium
Tanzania East Africa Low income Nonfragile Potentially resource-rich
Medium
Togo West Africa Low income Fragile Potentially resource-rich
Medium
Uganda East Africa Low income Nonfragile Potentially resource-rich
Low
Zambia East Africa Lower middle income Nonfragile Resource-rich, Non-oil
Medium
Zimbabwe East Africa Low income Fragile Not resource-rich High
DEFINITIONS AND DATA SOURCES 275
system as part of North Africa and which we consider here as part of East Africa.
• Central Africa: Th is category includes Angola, Cameroon, the Central African Republic, Chad, the Democratic Republic of Congo, the Republic of Congo, Equatorial Guinea, Gabon, and São Tomé and Príncipe.
• East Africa: This category includes Burundi, the Comoros, Eritrea, Ethiopia, Kenya, Madagascar, Malawi, Mauritius, Mozambique, Rwanda, Seychelles, Somalia, South Sudan, Sudan, Tanzania, Uganda, Zambia, and Zimbabwe.
• West Africa: Th is category includes Benin, Burkina Faso, Cabo Verde, Côte d’Ivoire, The Gambia, Ghana, Guinea, Guinea-Bissau, Liberia, Mali, Mauritania, Niger, Nigeria, Senegal, Sierra Leone, and Togo.
• Southern Africa: Th is category includes Botswana, Lesotho, Namibia, South Africa, and Swaziland.
Country Typology 2: Income GroupTh is classifi cation categorizes countries according to income level based on the World Development Indicators database for 2017 (see Data Sources).
• Low income: Th is category includes countries with a per capita income of $1,025 or less. It includes Benin, Burkina Faso, Burundi, the Central African Republic, Chad, the Comoros, the Democratic Republic of Congo, Eritrea, Ethiopia, Th e Gambia, Guinea, Guinea-Bissau, Liberia, Madagascar, Malawi, Mali, Mozambique, Niger, Rwanda, Senegal, Sierra Leone, Somalia, South Sudan, Tanzania, Togo, Uganda, and Zimbabwe.
• Lower middle income: Th is category includes countries with a per capita income between $1,026 and $4,035. It includes Angola, Cabo Verde, Cameroon, the Republic of Congo, Côte d’Ivoire, Ghana, Kenya, Lesotho, Mauritania, Nigeria, São Tomé and Príncipe, Sudan, Swaziland, and Zambia.
• Upper middle income: Th is category includes countries with a per capita income between $4,035 and $12,475. It includes Botswana, Gabon, Equatorial Guinea, Mauritius, Namibia, and South Africa.
• High income: Th is category includes countries with a per capita income of $12,476 or more. It includes Seychelles.
Country Typology 3: FragilityTh is classifi cation categorizes countries into two categories and is based on the World Bank Harmonized List of Fragile Situations Fiscal Year 18 (see Data Sources).
• Fragile: Th is category includes Burundi, the Central African Republic, Chad, the Comoros, the Democratic Republic of Congo, the Republic of Congo,
276 REALIZING THE FULL POTENTIAL OF SOCIAL SAFETY NETS IN AFRICA
Côte d’Ivoire, Eritrea, The Gambia, Guinea-Bissau, Liberia, Mali, Mozambique, Sierra Leone, Somalia, South Sudan, Sudan, Togo, and Zimbabwe.
• Nonfragile: Th is category includes Angola, Benin, Botswana, Burkina Faso, Cabo Verde, Cameroon, Equatorial Guinea, Ethiopia, Gabon, Ghana, Guinea, Kenya, Lesotho, Madagascar, Malawi, Mauritania, Mauritius, Namibia, Niger, Nigeria, Rwanda, São Tomé and Príncipe, Senegal, Seychelles, South Africa, Swaziland, Tanzania, Uganda, and Zambia.
Country Typology 4: Resource StatusTh is typology classifi es countries according to the importance of natural resources in the economy, measured in terms of natural resource revenues or exports. It is based on de la Brière et al. (2017, see Data Sources), itself partly based on work of the International Monetary Fund (IMF 2012), which defi nes countries as resource rich if they had either natural resource revenue of at least 20 percent of total revenue or natural resource exports of at least 20 percent of total exports in 2006–10. It also includes additional countries not covered by IMF (2012), such as Côte d’Ivoire, Liberia, Niger, Namibia, and South Africa. Countries are classifi ed in four categories.
• Not resource-rich: Th is category includes Benin, Burkina Faso, Burundi, Cabo Verde, the Comoros, Eritrea, Ethiopia, Th e Gambia, Guinea-Bissau, Kenya, Lesotho, Malawi, Mauritius, Rwanda, São Tomé and Príncipe, Senegal, Seychelles, Somalia, South Sudan, Swaziland, and Zimbabwe.
• Potentially resource-rich: Th is category includes countries with identifi ed reserves where production has not begun or reached signifi cant levels, namely, the Central African Republic, Ghana, Madagascar, Mozambique, Sierra Leone, Tanzania, Togo, and Uganda.
• Resource-rich, non-oil: Th is category includes countries with resources mostly other than oil, namely, Botswana, the Democratic Republic of Congo, Guinea, Liberia, Mali, Mauritania, Namibia, Niger, South Africa, and Zambia.
• Resource-rich, oil: Th is category includes countries with resources mostly oil, namely, Angola, Cameroon, Chad, the Republic of Congo, Côte d’Ivoire, Equatorial Guinea, Gabon, Nigeria, and Sudan.
Country Typology 5: Drought ExposureTh is classifi cation is based on estimations by Cervigni and Morris (2016, see Data Sources) of the share of a country’s population exposed to droughts and other shocks (population living in dryland areas, classifi ed according to the aridity index as hyperarid, arid, semiarid, or dry subhumid).
• High: Th is category includes countries where more than 75 percent of the population lives in dryland areas. It includes Botswana, Burkina Faso, Chad,
DEFINITIONS AND DATA SOURCES 277
Eritrea, Th e Gambia, Lesotho, Mali, Mauritania, Namibia, Senegal, South Sudan, Sudan, and Zimbabwe.
• Medium: Th is category includes countries where 35 to 74 percent of the pop-ulation lives in dryland areas. It includes Angola, Benin, Ethiopia, Kenya, Malawi, Mozambique, Niger, Somalia, South Africa, Swaziland, Tanzania, Togo, and Zambia.
• Low: Th is category includes countries where less than 35 percent of the pop-ulation lives in dryland areas. It includes Burundi, Cameroon, Central African Republic, Democratic Republic of Congo, Côte d’Ivoire, Ghana, Guinea, Guinea-Bissau, Madagascar, Nigeria, Rwanda, and Uganda.
• N/A: Th is category includes countries for which data on dryland areas are not available. It includes Cabo Verde, Comoros, Republic of Congo, Equatorial Guinea, Gabon, Liberia, Mauritius, São Tomé and Príncipe, Seychelles, and Sierra Leone.
A.3 Data Sources
A.3.1 ASPIRE Administrative DataTh e main source of information for this report is the program-level administra-tive data collected in the ASPIRE database for Africa. Th e database contains information on 46 of the 48 countries in the region (Equatorial Guinea and Eritrea are not included for lack of data) and on 695 active social safety net programs. See ASPIRE (Atlas of Social Protection Indicators of Resilience and Equity) (database), World Bank, Washington, DC, http://datatopics.worldbank .org/aspire/.
Sources used to develop the ASPIRE database include primary sources (from offi cial reports and information systems) and secondary sources (from reports analyzing social safety nets, oft en prepared in the context of the elaboration of social safety net strategies and oft en with the support of the ILO, the United Nations Children’s Fund (UNICEF), the World Bank, and other key partners.
Th e database was substantially updated for African countries during 2016–17, building on data collection eff orts by implementing agencies and World Bank teams. Extensive eff orts were made during the preparation of this report to cross-check and verify these data, and signifi cant updates to the ASPIRE database were made during this process. Nonetheless, data limitations, errors, or omissions might remain.
A.3.2 Household Survey DataNationally representative household survey data (income, expenditure, or consumption surveys) are sometimes used in the report to complement the
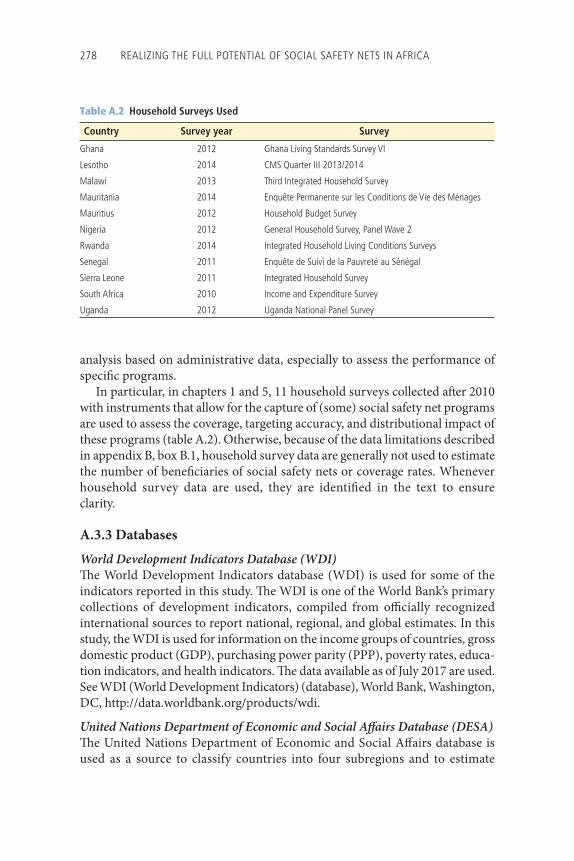
278 REALIZING THE FULL POTENTIAL OF SOCIAL SAFETY NETS IN AFRICA
analysis based on administrative data, especially to assess the performance of specifi c programs.
In particular, in chapters 1 and 5, 11 household surveys collected aft er 2010 with instruments that allow for the capture of (some) social safety net programs are used to assess the coverage, targeting accuracy, and distributional impact of these programs (table A.2). Otherwise, because of the data limitations described in appendix B, box B.1, household survey data are generally not used to estimate the number of benefi ciaries of social safety nets or coverage rates. Whenever household survey data are used, they are identifi ed in the text to ensure clarity.
A.3.3 DatabasesWorld Development Indicators Database (WDI)Th e World Development Indicators database (WDI) is used for some of the indicators reported in this study. Th e WDI is one of the World Bank’s primary collections of development indicators, compiled from offi cially recognized international sources to report national, regional, and global estimates. In this study, the WDI is used for information on the income groups of countries, gross domestic product (GDP), purchasing power parity (PPP), poverty rates, educa-tion indicators, and health indicators. Th e data available as of July 2017 are used. See WDI (World Development Indicators) (database), World Bank, Washington, DC, http://data.worldbank.org/products/wdi.
United Nations Department of Economic and Social Aff airs Database (DESA)Th e United Nations Department of Economic and Social Aff airs database is used as a source to classify countries into four subregions and to estimate
Table A.2 Household Surveys Used
Country Survey year Survey
Ghana 2012 Ghana Living Standards Survey VI
Lesotho 2014 CMS Quarter III 2013/2014
Malawi 2013 Third Integrated Household Survey
Mauritania 2014 Enquête Permanente sur les Conditions de Vie des Ménages
Mauritius 2012 Household Budget Survey
Nigeria 2012 General Household Survey, Panel Wave 2
Rwanda 2014 Integrated Household Living Conditions Surveys
Senegal 2011 Enquête de Suivi de la Pauvreté au Sénégal
Sierra Leone 2011 Integrated Household Survey
South Africa 2010 Income and Expenditure Survey
Uganda 2012 Uganda National Panel Survey
DEFINITIONS AND DATA SOURCES 279
population data. Th e databases can be accessed at https://unstats.un.org/unsd / methodology/m49/ (geographical classifi cation) and https://esa.un.org/unpd /wpp /Download/Standard/Population/ (population).
Harmonized List of Fragile SituationsIn this report, countries in fragile situations are identifi ed on the basis of the list established in http://pubdocs.worldbank.org/en/189701503418416651 /FY18FCSLIST-Final-July-2017.pdf.
Population Statistics Database of the United Nations High Commissioner for Refugees (UNHCR)We use the Offi ce of the United Nations High Commissioner for Refugees data-base, available at http://popstats.unhcr.org/, as a source for data on internally displaced persons (IDPs). Th e data only include people who have been forced to leave their homes or places of habitual residence as a result of confl ict and to whom the Offi ce of the United Nations High Commissioner for Refugees extends protection or assistance. Data available as of January 2017 are used.
World Economic Outlook (IMF WEO) DatabaseTh is report uses the World Economic Outlook database of the IMF for macro-economic data, including government fi nance indicators, such as total spend-ing, tax revenues, and government overall balance (chapter 5). Data available as of April 2017 are used. See WEO (World Economic Outlook Database), International Monetary Fund, Washington, DC, https://www.imf.org/external /pubs/ft /weo/2016/01/weodata/index.aspx.
IMF Country-Level Subsidy EstimatesWe use the information available at www.imf.org/external/np/fad/subsidies/data/codata.xlsx for estimates of energy subsidies. Th ese estimates were pre-pared in the context of the preparation of Coady, David P., Ian W. H. Parry, Louis Sears, and Baoping Shang, 2015, “How Large Are Global Energy Subsidies?” IMF Working Paper 15/105 (May 18), International Monetary Fund, Washington, DC, http://www.imf.org/external/pubs/ft /wp/2015/wp15105.pdf.
Development InitiativesWe use the information for 2014 available at http://devinit.org/methodology and http://data.devinit.org for estimates of humanitarian assistance received by countries, defi ned as the fi nancial resources for humanitarian action, delivered during and in the aft ermath of disasters caused by natural hazards and crises caused by human action. Th e data include the bilateral and multilateral humani-tarian assistance of members of the Development Assistance Committee of the Organisation for Economic Co-operation and Development, as well as assis-tance from development partners (see defi nitions in http://devinit.org/wp -content /uploads/2017/06/GHA-Report-2017-Chapter-6.pdf).
280 REALIZING THE FULL POTENTIAL OF SOCIAL SAFETY NETS IN AFRICA
A.3.4 Reports and Studiesde la Brière et al. (2017)de la Brière, Bénédicte, Deon Filmer, Dena Ringold, Dominic Rohner, Karelle Samuda, and Anastasiya Denisova, 2017, From Mines and Wells to Well-Built Minds: Turning Sub-Saharan Africa’s Natural Resource Wealth into Human Capital, Directions in Development: Human Development Series, Washington, DC: World Bank is used to classify countries according to their resource status.
Cervigni and Morris (2016)Cervigni, Raff aello, and Michael Morris, eds., 2016, Confronting Drought in Africa’s Drylands: Opportunities for Enhancing Resilience, Africa Development Forum Series, Washington, DC: Agence Française de Développement and World Bank is used to classify countries in terms of their level of drought exposure.
Monchuk (2014)Monchuk, Victoria, 2014, Reducing Poverty and Investing in People: New Role of Safety Nets in Africa, Directions in Development: Human Development Series, Washington, DC: World Bank is used to classify countries according to the measures they have in place to use social safety nets to deal with crises and shocks.
281
For each country, the analysis considers programs that were operating as of March 2017. However, because data on benefi ciaries or spending are not systematically available for all programs for 2016 and because there is year-on-year variation, the report’s estimates are based on data over a few years. Th e following rule is applied. Th e reference year for each country is defi ned as the most recent year for which there are data on any programs; for example, the most recent data for Mauritania are for 2016, for one program. Th en, the most recent data are considered for each program going back a maximum of three years before a country’s reference year; thus, in the case of Mauritania, data are included for 2013, 2014, 2015, and 2016. So, if a program was operating in March 2017, but only produced information older than this (the reference year, plus three previous years), then this program was not included. Also, any data that predate 2010 are systematically excluded to avoid using severely outdated information.
Th roughout the report, each country is given equal weight, irrespective of its size, when estimating averages for groups of countries, except where explicitly specifi ed (appendix G, table G.6). Th e results are therefore not population-weighted.
Th e main source of information for estimating the number of benefi ciaries and spending is the ASPIRE administrative database (see Data Sources).
B.1 Methodology to Estimate the Number of Programs
Th e number of social safety net programs for each country is estimated as the number of programs or their components if separated (data presented in appendix E, table E.1). For instance, the Tanzania Productive Social Safety Net (PSSN) is counted as three programs, since it has three distinct components: conditional cash transfer, public works, and livelihood enhancement.
Appendix B
Estimating the Number of Programs, the Number of Benefi ciaries, Coverage, and Spending
282 REALIZING THE FULL POTENTIAL OF SOCIAL SAFETY NETS IN AFRICA
When estimating the average number of social safety net programs for country groups, each country is given an equal weight (data presented in appendix E, table E.2). When a country has no data for a particular category of program, it is assumed that the country has no programs in that category.
When estimating the share of diff erent types of social safety net programs for country groups, the share for a group is the average of the shares of all countries belonging to each country group, giving equal weight to each country (presented in appendix E, table E.3).
B.2 Methodology to Estimate the Number of Benefi ciaries
Th e number of benefi ciaries from social safety net programs is derived from the ASPIRE administrative database and is based on program administrative data (box B.1).
In the ASPIRE database, the number of benefi ciaries is reported either as the number of households or the number of individuals, depending on the nature of each program. One important aspect that has bearing on measuring the number of beneficiaries is the distinction between direct and indirect benefi ciaries. Depending on a program’s target group, its direct benefi ciary may be an individual or a household. For some of the programs that provide benefi ts to individuals, however, the report considers other household members as indirect benefi ciaries if the benefi t is expected to be shared within the household. In other programs, the benefi t is not expected to be shared more broadly, and no indirect benefi ciaries are assumed.
In presenting information on the number of benefi ciaries, this report considers both direct and indirect benefi ciaries for cash transfers, public works, food distribution, emergency programs, and other programs, but only direct benefi ciaries for old-age pensions, school feeding, education fee waivers and scholarships, and health fee waivers.
Within the fi rst group of programs, administrative data typically report both the direct and the indirect benefi ciaries for food distribution programs, emergency interventions, and other programs (that is, the number reported is the total number of people in benefi ciary households), and typically report only the number of direct benefi ciaries for cash transfer programs and public works programs. So, in the case of estimates of the total number of benefi ciaries, or coverage, the number of direct benefi ciaries of cash transfer and public works programs is multiplied by the average household size in the country to obtain estimates of the number of direct and indirect benefi ciaries. If multiple individuals are benefi ciaries within a single household, this will result in an overestimation of the number of total benefi ciaries because the method will count household members multiple times.
ESTIMATING NUMBER OF PROGRAMS, BENEFICIARIES, COVERAGE, AND SPENDING 283
BOX B.1
The Challenges in Measuring Social Safety Net Coverage in AfricaTo measure program coverage in terms of the number of benefi ciaries, there are two potential data sources that can be used: administrative data from programs and household survey data (such as national budget surveys or other surveys that collect socioeconomic data and identify program participation). There are advantages and disadvantages to these sources.
Typically, administrative data are regularly collected, whereas household surveys do not exist annually, may not be available for recent years, and may not collect data on specifi c program participation, in the survey questionnaires.
Administrative data are usually program-specifi c within a country because most countries do not maintain a single database on benefi ciaries of all programs. Double counting will therefore occur if benefi ciaries benefi t from multiple programs. This will result in overestimation of the total number of benefi ciaries. By contrast, household surveys provide information for each household on the set of programs considered in the survey questionnaire, which allows one to avoid double counting in estimating coverage.
Household surveys include information on socioeconomic characteristics, thereby allowing one to profi le benefi ciaries, whereas administrative data offer only basic details on benefi ciaries. Surveys also provide information on nonbenefi ciaries, which can supply information on errors of exclusion.
Household surveys in the region are typically too small in terms of sample size, and too clustered in sample design, to be accurate at representing small programs. Thus, these surveys can, at best, provide accurate information only about larger programs that have broad geographic coverage.
Because of these differences, these two sources often do not produce similar estimates of the number of benefi ciaries in a given country. The shortcomings in the household surveys, together with the low frequency of survey data collection in many countries in Africa, limit the ability of household survey data to report on the number of benefi ciaries or assess the precision of targeting, except in a few countries, such as Ethiopia and South Africa.
As a result, in this report, administrative data are preferred as the main source for the estimates of the number of benefi ciaries. Household surveys are only sometimes used in selected countries, and their use is noted explicitly in such cases.
Because of the data limitations discussed above, country-level estimates of the number of benefi ciaries for a given program type will be overestimated if benefi ciaries receive benefi ts through more than one program of the same type.
In the presentation of information on the overall number of benefi ciaries of social safety net programs, the number of benefi ciaries of cash transfers,
284 REALIZING THE FULL POTENTIAL OF SOCIAL SAFETY NETS IN AFRICA
food-based transfers, and public works programs only are summed. Benefi ciaries of the other six program types—old-age social pension, school feeding, emergency, health fee waivers, education fee waivers, and other programs—are not included because they are more likely to overlap with the benefi ciaries of the three selected types of programs and would likely result in large overestimates of coverage.
B.3 Methodology to Estimate Coverage Rates
In presenting coverage rates by program type, the report relies on diff erent population groups as denominators.
For overall coverage and cash transfers, public works, food distribution, health fee waivers, and other programs, the total population is used as a denominator. For old-age social pensions, school feeding, and educational fee waivers and scholarships, the following age groups are used as denominators: (1) the program’s age-eligibility criteria for old-age social pension programs (Botswana 65, Cabo Verde 60, Kenya 65, Lesotho 70, Mauritius 60, Namibia 60, Nigeria 65, São Tomé and Príncipe 60, Seychelles 63, South Africa 60, Swaziland 60, and Uganda 65), (2) the population of 5- to 14-year-olds for school feeding programs, and (3) the population of 15- to 24-year-olds for educational fee waivers and scholarships. However, specifi c country programs included in each category may not precisely follow these target groups. For instance, individuals below the required age may benefi t from social pensions on other grounds, or a 16-year-old might benefi t from school feeding. As a result, coverage will be overestimated.
In the estimates of coverage rates using the categorization by life cycle, the following population groups are used as denominators: (1) 0- to 14-year-olds for programs for children, (2) 15- to 64-year-olds for programs for the working-age population, (3) 65-year-olds or older people for programs for the elderly; and (4) the entire population for programs for families, households, or special groups. For the estimates of coverage rates using the categorizations by the nature of benefi ts or by the targeting method, the total population is used as the denominator.
Coverage rates for diff erent program types are calculated by summing the number of benefi ciaries for all programs within the category of interest. Th is method could overestimate coverage if there are benefi ciaries who receive benefi ts from more than one program in the same category.
Th e overall coverage rate for social safety nets (presented in overview: fi gure O.5, chapter 1: fi gure 1.9; and appendix F, table F.1) is approximated by summing up the number of direct and indirect benefi ciaries of cash transfers, food-based transfers, and public works programs only. Th e benefi ciaries of the other six program types (old-age social pensions, school feeding, emergency, health and education fee waivers, and other programs) are not included because the
ESTIMATING NUMBER OF PROGRAMS, BENEFICIARIES, COVERAGE, AND SPENDING 285
benefi ciaries of these programs are more likely to overlap with the benefi ciaries of the other programs, which would result in overestimated coverage rates.
In the estimates of coverage rates, 2016 population data are used in the presentations of data for multiple countries, and population data are used for each year in presenting trends for a specifi c country.
When estimating the coverage rate of diff erent types of social safety nets for country groups, the coverage for a group is the average of the coverage rates for all countries belonging to each country group, giving equal weight to each country (presented in chapter 1: fi gure 1.5, 1.6; and appendix F, table F.2). When no data are available for a category of program for a country, we assume that country has zero coverage in that category.
B.4 Methodology to Estimate Spending on Social Safety Nets
The amount spent on social safety nets is derived from program-level administrative data in the ASPIRE database. Th is typically includes spending on benefi ts, as well as on administrative costs. Th ere is no diff erentiation by the source of the funding (whether development partner funds or government revenues). Data on spending are converted to U.S. PPP dollars (at constant 2011 prices) to allow for cross-program and cross-country comparisons. Overall social safety net spending for a country is measured by summing up the program-level amounts for all active programs. When spending is presented as a share of GDP, the information is expressed in terms of the GDP in 2015 (presented in chapter 1: fi gure 1.11; and appendix G, tables G.1 and G.2).
When estimating social safety net spending (as percentage of GDP) for country groups, spending (as percentage of GDP) for a group is the average of the spending (as percentage of GDP) for all countries in each country group, giving equal weight to each country (presented in the overview: fi gure O.12; in chapter 1: fi gure 1.12; in chapter 5: fi gure 5.1; and appendix G, table G.3). When no data are available for a category of program for a country, we assume that country has zero spending in that category.
When estimating the distribution of spending on social safety net programs across categories for country groups, the share of each category for a group is the average of the share of that category for all countries in each country group, giving equal weight to each country (presented in appendix G, table G.5). When no data are available for a category of program for a country, we assume that country has zero spending in that category.
In the section on spending, we also present an additional table which brings together all the resources deployed by all countries belonging to a particular country group (for instance, for the group “fragile,” all the spending in dollars
286 REALIZING THE FULL POTENTIAL OF SOCIAL SAFETY NETS IN AFRICA
incurred in the 18 fragile countries is summed). Table G.6 presents the distribution of all these aggregated resources across program categories—showing, for instance, that 27 percent of all the safety net spending incurred in all countries of Central Africa is devoted to cash transfer programs. In this report, these numbers are used in overview: fi gure O.4 and O.10; in chapter 1: fi gure 1.4; in chapter 3: fi gures 3.4 and 3.5; and in chapter 4: fi gure 4.3.
287
Appendix C
The Country Context
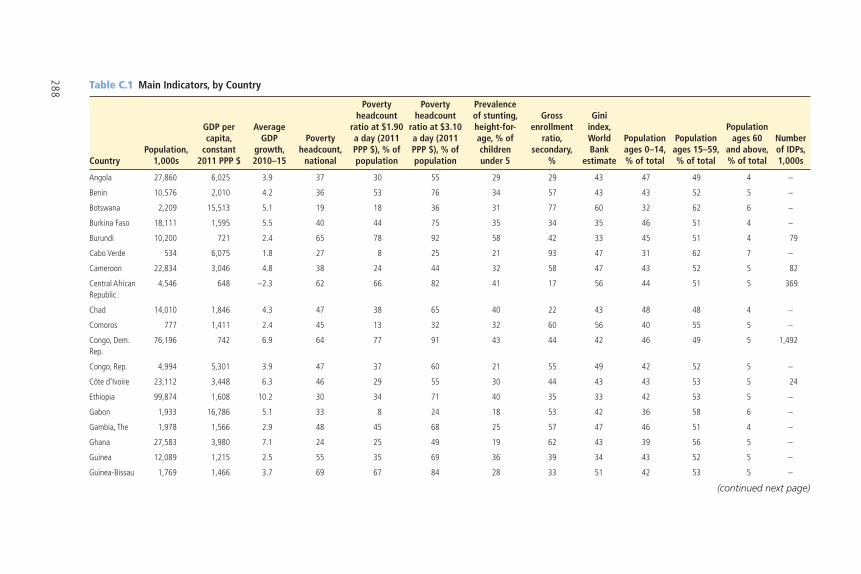
288 Table C.1 Main Indicators, by Country
CountryPopulation,
1,000s
GDP per capita,
constant 2011 PPP $
Average GDP
growth, 2010–15
Poverty headcount,
national
Poverty headcount
ratio at $1.90 a day (2011 PPP $), % of population
Poverty headcount
ratio at $3.10 a day (2011 PPP $), % of population
Prevalence of stunting, height-for-age, % of children under 5
Gross enrollment
ratio, secondary,
%
Gini index, World Bank
estimate
Population ages 0–14, % of total
Population ages 15–59, % of total
Population ages 60
and above, % of total
Number of IDPs, 1,000s
Angola 27,860 6,025 3.9 37 30 55 29 29 43 47 49 4 –
Benin 10,576 2,010 4.2 36 53 76 34 57 43 43 52 5 –
Botswana 2,209 15,513 5.1 19 18 36 31 77 60 32 62 6 –
Burkina Faso 18,111 1,595 5.5 40 44 75 35 34 35 46 51 4 –
Burundi 10,200 721 2.4 65 78 92 58 42 33 45 51 4 79
Cabo Verde 534 6,075 1.8 27 8 25 21 93 47 31 62 7 –
Cameroon 22,834 3,046 4.8 38 24 44 32 58 47 43 52 5 82
Central African Republic
4,546 648 –2.3 62 66 82 41 17 56 44 51 5 369
Chad 14,010 1,846 4.3 47 38 65 40 22 43 48 48 4 –
Comoros 777 1,411 2.4 45 13 32 32 60 56 40 55 5 –
Congo, Dem. Rep.
76,196 742 6.9 64 77 91 43 44 42 46 49 5 1,492
Congo, Rep. 4,994 5,301 3.9 47 37 60 21 55 49 42 52 5 –
Côte d’Ivoire 23,112 3,448 6.3 46 29 55 30 44 43 43 53 5 24
Ethiopia 99,874 1,608 10.2 30 34 71 40 35 33 42 53 5 –
Gabon 1,933 16,786 5.1 33 8 24 18 53 42 36 58 6 –
Gambia, The 1,978 1,566 2.9 48 45 68 25 57 47 46 51 4 –
Ghana 27,583 3,980 7.1 24 25 49 19 62 43 39 56 5 –
Guinea 12,089 1,215 2.5 55 35 69 36 39 34 43 52 5 –
Guinea-Bissau 1,769 1,466 3.7 69 67 84 28 33 51 42 53 5 –
(continued next page)
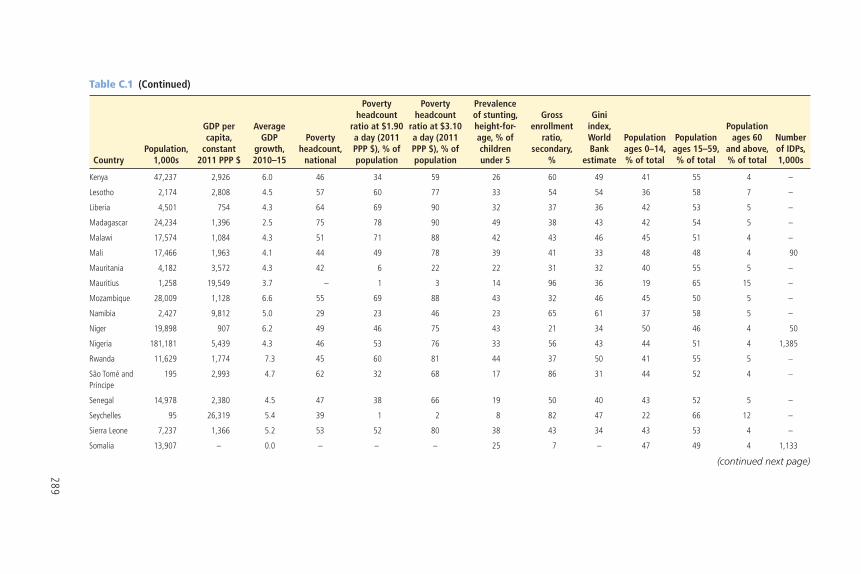
289
Table C.1 (Continued)
CountryPopulation,
1,000s
GDP per capita,
constant 2011 PPP $
Average GDP
growth, 2010–15
Poverty headcount,
national
Poverty headcount
ratio at $1.90 a day (2011 PPP $), % of population
Poverty headcount
ratio at $3.10 a day (2011 PPP $), % of population
Prevalence of stunting, height-for-age, % of children under 5
Gross enrollment
ratio, secondary,
%
Gini index, World Bank
estimate
Population ages 0–14, % of total
Population ages 15–59, % of total
Population ages 60
and above, % of total
Number of IDPs, 1,000s
Kenya 47,237 2,926 6.0 46 34 59 26 60 49 41 55 4 –
Lesotho 2,174 2,808 4.5 57 60 77 33 54 54 36 58 7 –
Liberia 4,501 754 4.3 64 69 90 32 37 36 42 53 5 –
Madagascar 24,234 1,396 2.5 75 78 90 49 38 43 42 54 5 –
Malawi 17,574 1,084 4.3 51 71 88 42 43 46 45 51 4 –
Mali 17,466 1,963 4.1 44 49 78 39 41 33 48 48 4 90
Mauritania 4,182 3,572 4.3 42 6 22 22 31 32 40 55 5 –
Mauritius 1,258 19,549 3.7 – 1 3 14 96 36 19 65 15 –
Mozambique 28,009 1,128 6.6 55 69 88 43 32 46 45 50 5 –
Namibia 2,427 9,812 5.0 29 23 46 23 65 61 37 58 5 –
Niger 19,898 907 6.2 49 46 75 43 21 34 50 46 4 50
Nigeria 181,181 5,439 4.3 46 53 76 33 56 43 44 51 4 1,385
Rwanda 11,629 1,774 7.3 45 60 81 44 37 50 41 55 5 –
São Tomé and Príncipe
195 2,993 4.7 62 32 68 17 86 31 44 52 4 –
Senegal 14,978 2,380 4.5 47 38 66 19 50 40 43 52 5 –
Seychelles 95 26,319 5.4 39 1 2 8 82 47 22 66 12 –
Sierra Leone 7,237 1,366 5.2 53 52 80 38 43 34 43 53 4 –
Somalia 13,907 – 0.0 – – – 25 7 – 47 49 4 1,133
(continued next page)
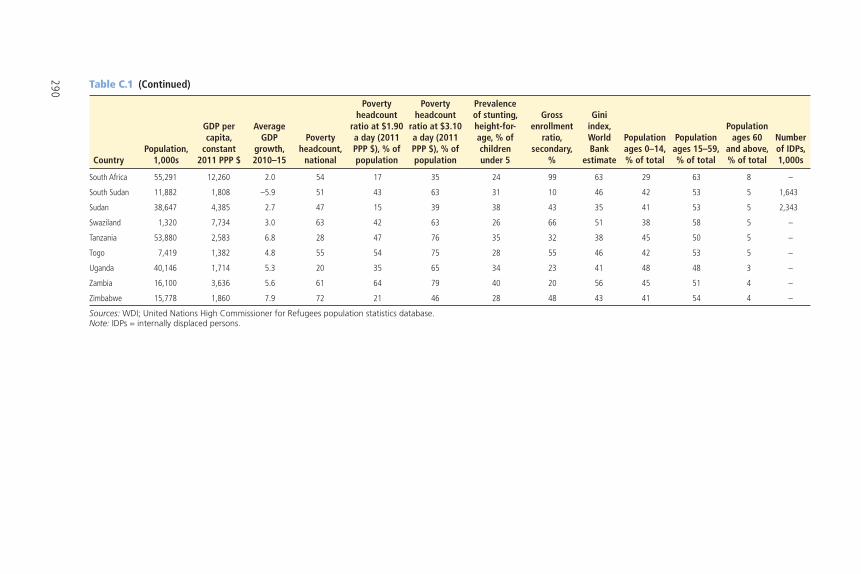
290 Table C.1 (Continued)
CountryPopulation,
1,000s
GDP per capita,
constant 2011 PPP $
Average GDP
growth, 2010–15
Poverty headcount,
national
Poverty headcount
ratio at $1.90 a day (2011 PPP $), % of population
Poverty headcount
ratio at $3.10 a day (2011 PPP $), % of population
Prevalence of stunting, height-for-age, % of children under 5
Gross enrollment
ratio, secondary,
%
Gini index, World Bank
estimate
Population ages 0–14, % of total
Population ages 15–59, % of total
Population ages 60
and above, % of total
Number of IDPs, 1,000s
South Africa 55,291 12,260 2.0 54 17 35 24 99 63 29 63 8 –
South Sudan 11,882 1,808 –5.9 51 43 63 31 10 46 42 53 5 1,643
Sudan 38,647 4,385 2.7 47 15 39 38 43 35 41 53 5 2,343
Swaziland 1,320 7,734 3.0 63 42 63 26 66 51 38 58 5 –
Tanzania 53,880 2,583 6.8 28 47 76 35 32 38 45 50 5 –
Togo 7,419 1,382 4.8 55 54 75 28 55 46 42 53 5 –
Uganda 40,146 1,714 5.3 20 35 65 34 23 41 48 48 3 –
Zambia 16,100 3,636 5.6 61 64 79 40 20 56 45 51 4 –
Zimbabwe 15,778 1,860 7.9 72 21 46 28 48 43 41 54 4 –
Sources: WDI; United Nations High Commissioner for Refugees population statistics database.Note: IDPs = internally displaced persons.
291
Appendix D
Social Safety Net Institutions and Systems
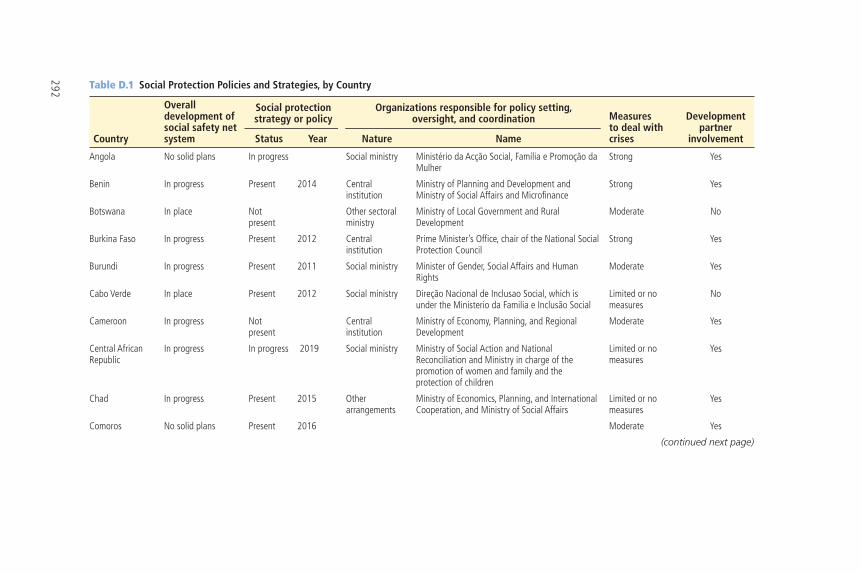
292 Table D.1 Social Protection Policies and Strategies, by Country
Country
Overall development of social safety net system
Social protection strategy or policy
Organizations responsible for policy setting, oversight, and coordination Measures
to deal with crises
Development partner
involvementStatus Year Nature Name
Angola No solid plans In progress Social ministry Ministério da Acção Social, Família e Promoção da Mulher
Strong Yes
Benin In progress Present 2014 Central institution
Ministry of Planning and Development and Ministry of Social Affairs and Microfi nance
Strong Yes
Botswana In place Not present
Other sectoral ministry
Ministry of Local Government and Rural Development
Moderate No
Burkina Faso In progress Present 2012 Central institution
Prime Minister’s Offi ce, chair of the National Social Protection Council
Strong Yes
Burundi In progress Present 2011 Social ministry Minister of Gender, Social Affairs and Human Rights
Moderate Yes
Cabo Verde In place Present 2012 Social ministry Direção Nacional de Inclusao Social, which is under the Ministerio da Familia e Inclusão Social
Limited or no measures
No
Cameroon In progress Not present
Central institution
Ministry of Economy, Planning, and Regional Development
Moderate Yes
Central African Republic
In progress In progress 2019 Social ministry Ministry of Social Action and National Reconciliation and Ministry in charge of the promotion of women and family and the protection of children
Limited or no measures
Yes
Chad In progress Present 2015 Other arrangements
Ministry of Economics, Planning, and International Cooperation, and Ministry of Social Affairs
Limited or no measures
Yes
Comoros No solid plans Present 2016 Moderate Yes
(continued next page)
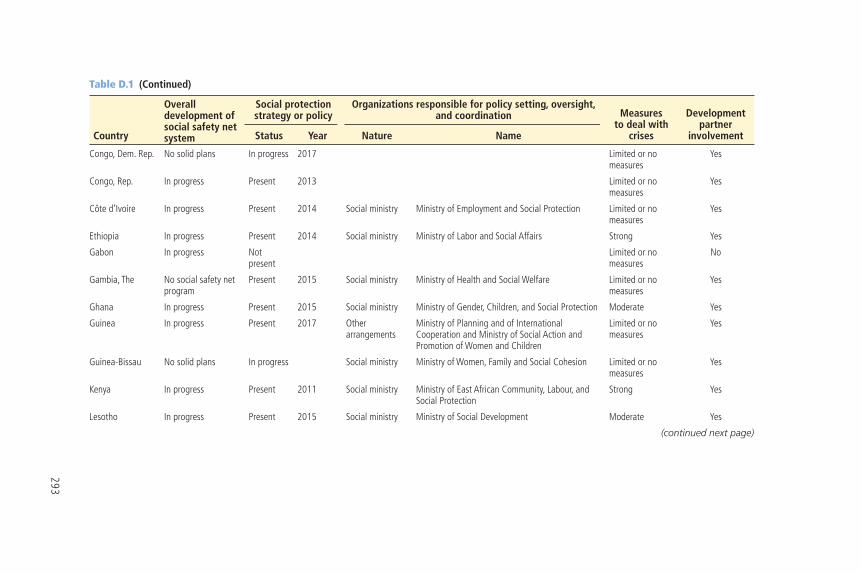
293
Table D.1 (Continued)
Country
Overall development of social safety net system
Social protection strategy or policy
Organizations responsible for policy setting, oversight, and coordination Measures
to deal with crises
Development partner
involvementStatus Year Nature Name
Congo, Dem. Rep. No solid plans In progress 2017 Limited or no measures
Yes
Congo, Rep. In progress Present 2013 Limited or no measures
Yes
Côte d’Ivoire In progress Present 2014 Social ministry Ministry of Employment and Social Protection Limited or no measures
Yes
Ethiopia In progress Present 2014 Social ministry Ministry of Labor and Social Affairs Strong Yes
Gabon In progress Not present
Limited or no measures
No
Gambia, The No social safety net program
Present 2015 Social ministry Ministry of Health and Social Welfare Limited or no measures
Yes
Ghana In progress Present 2015 Social ministry Ministry of Gender, Children, and Social Protection Moderate Yes
Guinea In progress Present 2017 Other arrangements
Ministry of Planning and of International Cooperation and Ministry of Social Action and Promotion of Women and Children
Limited or no measures
Yes
Guinea-Bissau No solid plans In progress Social ministry Ministry of Women, Family and Social Cohesion Limited or no measures
Yes
Kenya In progress Present 2011 Social ministry Ministry of East African Community, Labour, and Social Protection
Strong Yes
Lesotho In progress Present 2015 Social ministry Ministry of Social Development Moderate Yes
(continued next page)
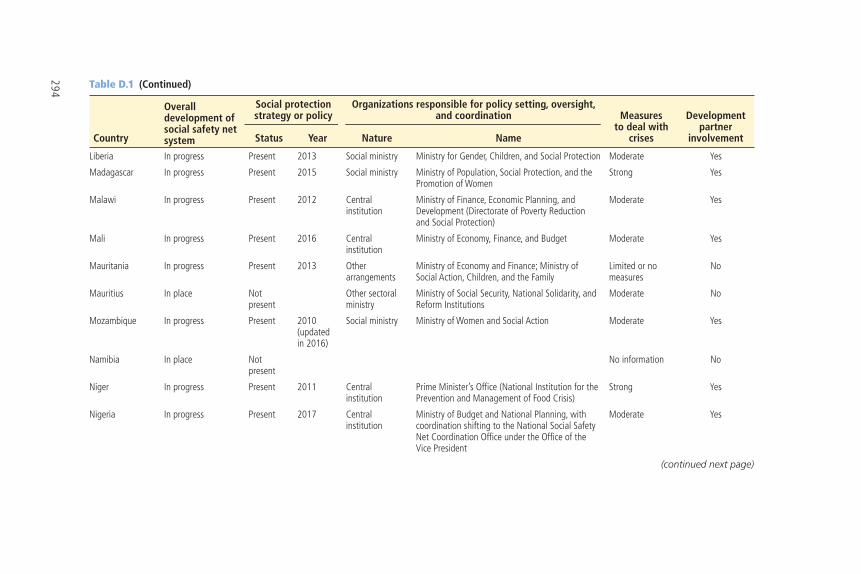
294 Table D.1 (Continued)
Country
Overall development of social safety net system
Social protection strategy or policy
Organizations responsible for policy setting, oversight, and coordination Measures
to deal with crises
Development partner
involvementStatus Year Nature Name
Liberia In progress Present 2013 Social ministry Ministry for Gender, Children, and Social Protection Moderate Yes
Madagascar In progress Present 2015 Social ministry Ministry of Population, Social Protection, and the Promotion of Women
Strong Yes
Malawi In progress Present 2012 Central institution
Ministry of Finance, Economic Planning, and Development (Directorate of Poverty Reduction and Social Protection)
Moderate Yes
Mali In progress Present 2016 Central institution
Ministry of Economy, Finance, and Budget Moderate Yes
Mauritania In progress Present 2013 Other arrangements
Ministry of Economy and Finance; Ministry of Social Action, Children, and the Family
Limited or no measures
No
Mauritius In place Not present
Other sectoral ministry
Ministry of Social Security, National Solidarity, and Reform Institutions
Moderate No
Mozambique In progress Present 2010 (updated in 2016)
Social ministry Ministry of Women and Social Action Moderate Yes
Namibia In place Not present
No information No
Niger In progress Present 2011 Central institution
Prime Minister’s Offi ce (National Institution for the Prevention and Management of Food Crisis)
Strong Yes
Nigeria In progress Present 2017 Central institution
Ministry of Budget and National Planning, with coordination shifting to the National Social Safety Net Coordination Offi ce under the Offi ce of the Vice President
Moderate Yes
(continued next page)
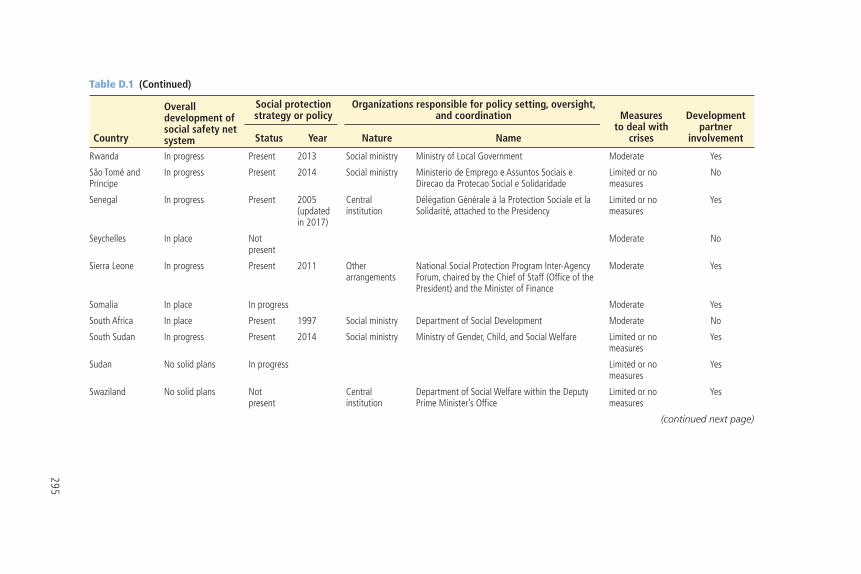
295
Table D.1 (Continued)
Country
Overall development of social safety net system
Social protection strategy or policy
Organizations responsible for policy setting, oversight, and coordination Measures
to deal with crises
Development partner
involvementStatus Year Nature Name
Rwanda In progress Present 2013 Social ministry Ministry of Local Government Moderate Yes
São Tomé and Príncipe
In progress Present 2014 Social ministry Ministerio de Emprego e Assuntos Sociais e Direcao da Protecao Social e Solidaridade
Limited or no measures
No
Senegal In progress Present 2005 (updated in 2017)
Central institution
Délégation Générale à la Protection Sociale et la Solidarité, attached to the Presidency
Limited or no measures
Yes
Seychelles In place Not present
Moderate No
Sierra Leone In progress Present 2011 Other arrangements
National Social Protection Program Inter-Agency Forum, chaired by the Chief of Staff (Offi ce of the President) and the Minister of Finance
Moderate Yes
Somalia In place In progress Moderate Yes
South Africa In place Present 1997 Social ministry Department of Social Development Moderate No
South Sudan In progress Present 2014 Social ministry Ministry of Gender, Child, and Social Welfare Limited or no measures
Yes
Sudan No solid plans In progress Limited or no measures
Yes
Swaziland No solid plans Not present
Central institution
Department of Social Welfare within the Deputy Prime Minister’s Offi ce
Limited or no measures
Yes
(continued next page)
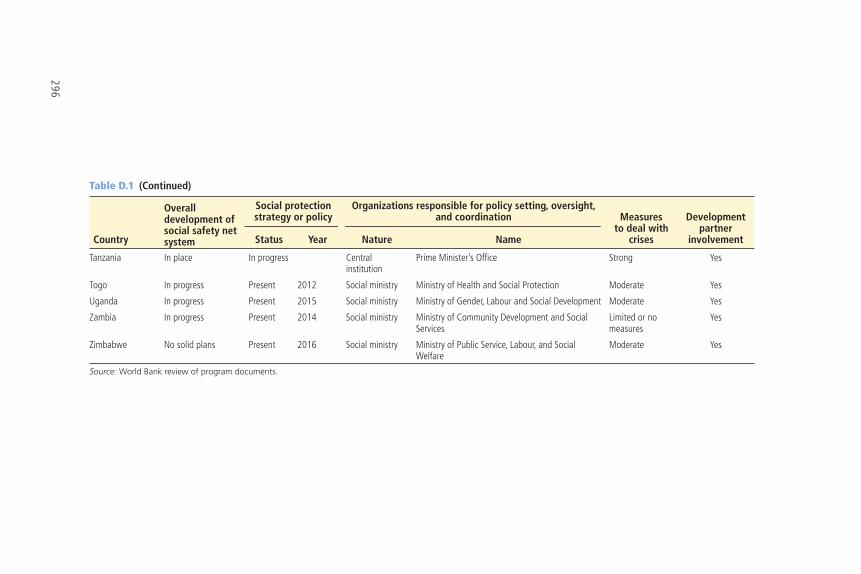
296
Table D.1 (Continued)
Country
Overall development of social safety net system
Social protection strategy or policy
Organizations responsible for policy setting, oversight, and coordination Measures
to deal with crises
Development partner
involvementStatus Year Nature Name
Tanzania In place In progress Central institution
Prime Minister’s Offi ce Strong Yes
Togo In progress Present 2012 Social ministry Ministry of Health and Social Protection Moderate Yes
Uganda In progress Present 2015 Social ministry Ministry of Gender, Labour and Social Development Moderate Yes
Zambia In progress Present 2014 Social ministry Ministry of Community Development and Social Services
Limited or no measures
Yes
Zimbabwe No solid plans Present 2016 Social ministry Ministry of Public Service, Labour, and Social Welfare
Moderate Yes
Source: World Bank review of program documents.
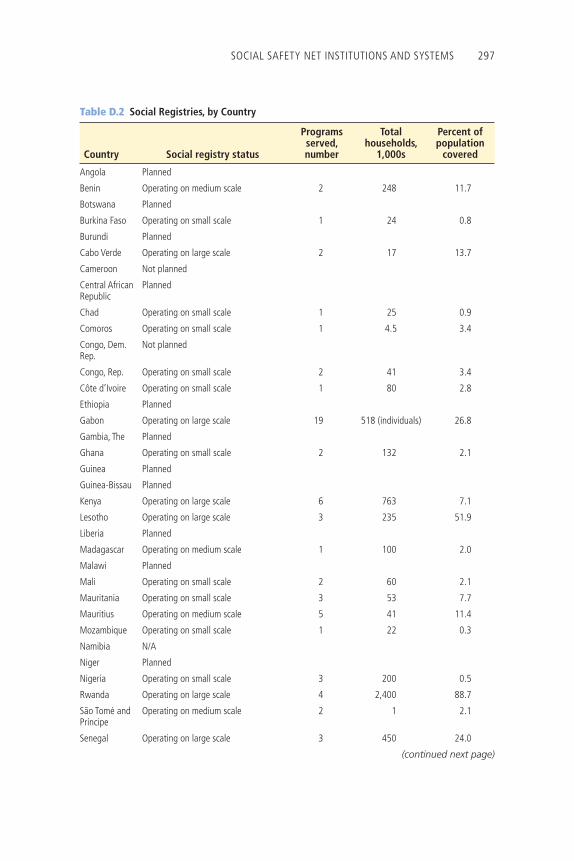
SOCIAL SAFETY NET INSTITUTIONS AND SYSTEMS 297
Table D.2 Social Registries, by Country
Country Social registry status
Programs served, number
Total households,
1,000s
Percent of population
covered
Angola Planned
Benin Operating on medium scale 2 248 11.7
Botswana Planned
Burkina Faso Operating on small scale 1 24 0.8
Burundi Planned
Cabo Verde Operating on large scale 2 17 13.7
Cameroon Not planned
Central African Republic
Planned
Chad Operating on small scale 1 25 0.9
Comoros Operating on small scale 1 4.5 3.4
Congo, Dem. Rep.
Not planned
Congo, Rep. Operating on small scale 2 41 3.4
Côte d’Ivoire Operating on small scale 1 80 2.8
Ethiopia Planned
Gabon Operating on large scale 19 518 (individuals) 26.8
Gambia, The Planned
Ghana Operating on small scale 2 132 2.1
Guinea Planned
Guinea-Bissau Planned
Kenya Operating on large scale 6 763 7.1
Lesotho Operating on large scale 3 235 51.9
Liberia Planned
Madagascar Operating on medium scale 1 100 2.0
Malawi Planned
Mali Operating on small scale 2 60 2.1
Mauritania Operating on small scale 3 53 7.7
Mauritius Operating on medium scale 5 41 11.4
Mozambique Operating on small scale 1 22 0.3
Namibia N/A
Niger Planned
Nigeria Operating on small scale 3 200 0.5
Rwanda Operating on large scale 4 2,400 88.7
São Tomé and Príncipe
Operating on medium scale 2 1 2.1
Senegal Operating on large scale 3 450 24.0
(continued next page)
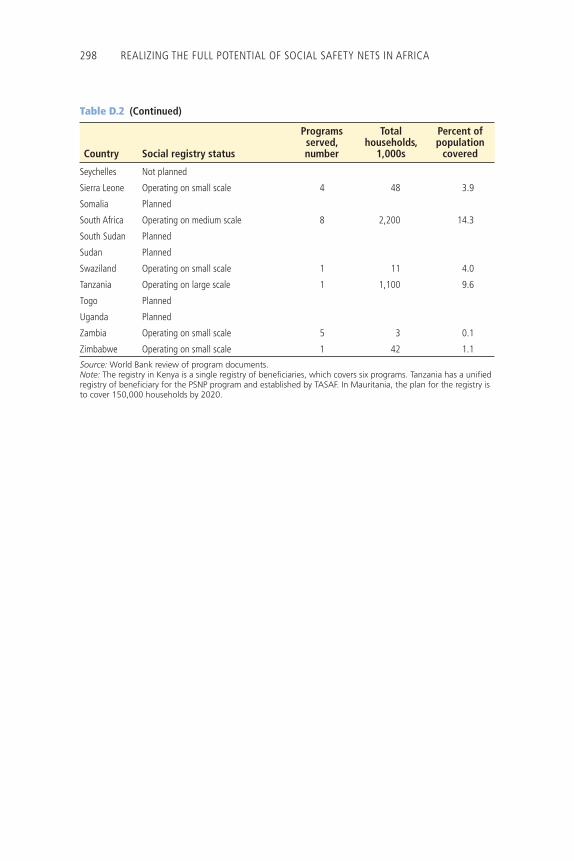
298 REALIZING THE FULL POTENTIAL OF SOCIAL SAFETY NETS IN AFRICA
Table D.2 (Continued)
Country Social registry status
Programs served, number
Total households,
1,000s
Percent of population
covered
Seychelles Not planned
Sierra Leone Operating on small scale 4 48 3.9
Somalia Planned
South Africa Operating on medium scale 8 2,200 14.3
South Sudan Planned
Sudan Planned
Swaziland Operating on small scale 1 11 4.0
Tanzania Operating on large scale 1 1,100 9.6
Togo Planned
Uganda Planned
Zambia Operating on small scale 5 3 0.1
Zimbabwe Operating on small scale 1 42 1.1
Source: World Bank review of program documents.Note: The registry in Kenya is a single registry of beneficiaries, which covers six programs. Tanzania has a unified registry of beneficiary for the PSNP program and established by TASAF. In Mauritania, the plan for the registry is to cover 150,000 households by 2020.
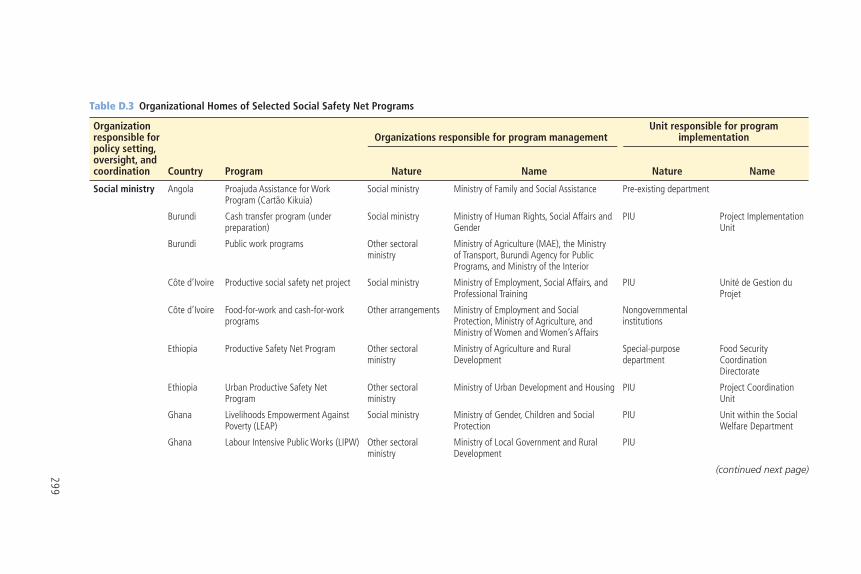
299
Table D.3 Organizational Homes of Selected Social Safety Net Programs
Organization responsible for policy setting, oversight, and coordination Country Program
Organizations responsible for program managementUnit responsible for program
implementation
Nature Name Nature Name
Social ministry Angola Proajuda Assistance for Work Program (Cartão Kikuia)
Social ministry Ministry of Family and Social Assistance Pre-existing department
Burundi Cash transfer program (under preparation)
Social ministry Ministry of Human Rights, Social Affairs and Gender
PIU Project Implementation Unit
Burundi Public work programs Other sectoral ministry
Ministry of Agriculture (MAE), the Ministry of Transport, Burundi Agency for Public Programs, and Ministry of the Interior
Côte d’Ivoire Productive social safety net project Social ministry Ministry of Employment, Social Affairs, and Professional Training
PIU Unité de Gestion du Projet
Côte d’Ivoire Food-for-work and cash-for-work programs
Other arrangements Ministry of Employment and Social Protection, Ministry of Agriculture, and Ministry of Women and Women’s Affairs
Nongovernmental institutions
Ethiopia Productive Safety Net Program Other sectoral ministry
Ministry of Agriculture and Rural Development
Special-purpose department
Food Security Coordination Directorate
Ethiopia Urban Productive Safety Net Program
Other sectoral ministry
Ministry of Urban Development and Housing PIU Project Coordination Unit
Ghana Livelihoods Empowerment Against Poverty (LEAP)
Social ministry Ministry of Gender, Children and Social Protection
PIU Unit within the Social Welfare Department
Ghana Labour Intensive Public Works (LIPW) Other sectoral ministry
Ministry of Local Government and Rural Development
PIU
(continued next page)
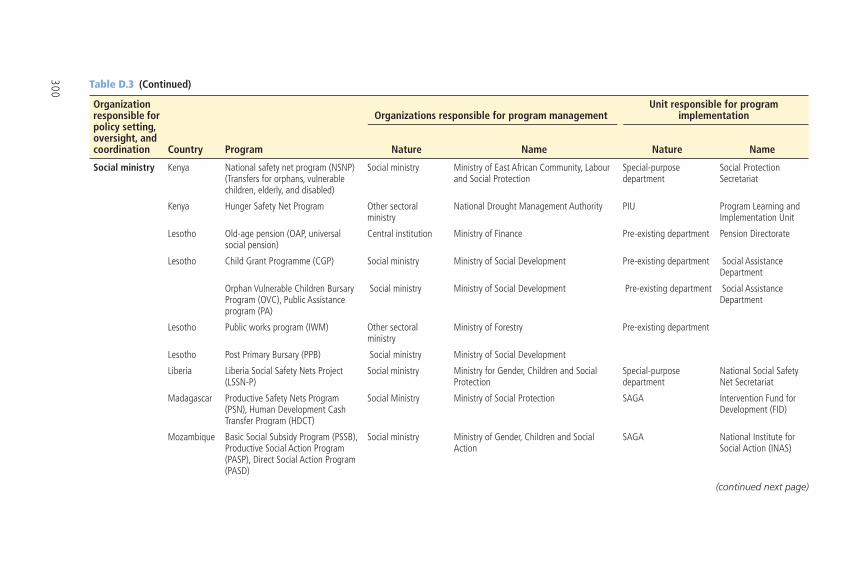
300 Table D.3 (Continued)
Organization responsible for policy setting, oversight, and coordination Country Program
Organizations responsible for program managementUnit responsible for program
implementation
Nature Name Nature Name
Social ministry Kenya National safety net program (NSNP) (Transfers for orphans, vulnerable children, elderly, and disabled)
Social ministry Ministry of East African Community, Labour and Social Protection
Special-purpose department
Social Protection Secretariat
Kenya Hunger Safety Net Program Other sectoral ministry
National Drought Management Authority PIU Program Learning and Implementation Unit
Lesotho Old-age pension (OAP, universal social pension)
Central institution Ministry of Finance Pre-existing department Pension Directorate
Lesotho Child Grant Programme (CGP) Social ministry Ministry of Social Development Pre-existing department Social Assistance Department
Orphan Vulnerable Children Bursary Program (OVC), Public Assistance program (PA)
Social ministry Ministry of Social Development Pre-existing department Social Assistance Department
Lesotho Public works program (IWM) Other sectoral ministry
Ministry of Forestry Pre-existing department
Lesotho Post Primary Bursary (PPB) Social ministry Ministry of Social Development
Liberia Liberia Social Safety Nets Project (LSSN-P)
Social ministry Ministry for Gender, Children and Social Protection
Special-purpose department
National Social Safety Net Secretariat
Madagascar Productive Safety Nets Program (PSN), Human Development Cash Transfer Program (HDCT)
Social Ministry Ministry of Social Protection SAGA Intervention Fund for Development (FID)
Mozambique Basic Social Subsidy Program (PSSB), Productive Social Action Program (PASP), Direct Social Action Program (PASD)
Social ministry Ministry of Gender, Children and Social Action
SAGA National Institute for Social Action (INAS)
(continued next page)
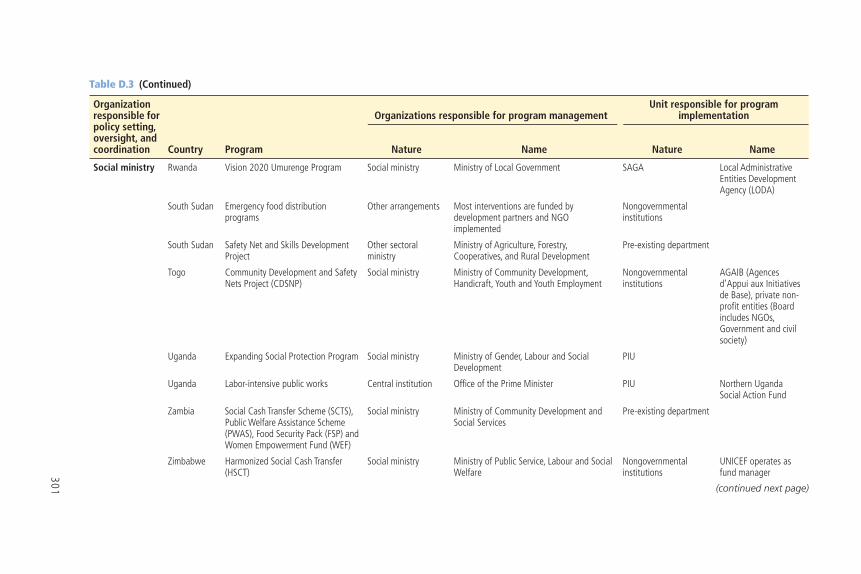
301
Table D.3 (Continued)
Organization responsible for policy setting, oversight, and coordination Country Program
Organizations responsible for program managementUnit responsible for program
implementation
Nature Name Nature Name
Social ministry Rwanda Vision 2020 Umurenge Program Social ministry Ministry of Local Government SAGA Local Administrative Entities Development Agency (LODA)
South Sudan Emergency food distribution programs
Other arrangements Most interventions are funded by development partners and NGO implemented
Nongovernmental institutions
South Sudan Safety Net and Skills Development Project
Other sectoral ministry
Ministry of Agriculture, Forestry, Cooperatives, and Rural Development
Pre-existing department
Togo Community Development and Safety Nets Project (CDSNP)
Social ministry Ministry of Community Development, Handicraft, Youth and Youth Employment
Nongovernmental institutions
AGAIB (Agences d’Appui aux Initiatives de Base), private non-profi t entities (Board includes NGOs, Government and civil society)
Uganda Expanding Social Protection Program Social ministry Ministry of Gender, Labour and Social Development
PIU
Uganda Labor-intensive public works Central institution Offi ce of the Prime Minister PIU Northern Uganda Social Action Fund
Zambia Social Cash Transfer Scheme (SCTS), Public Welfare Assistance Scheme (PWAS), Food Security Pack (FSP) and Women Empowerment Fund (WEF)
Social ministry Ministry of Community Development and Social Services
Pre-existing department
Zimbabwe Harmonized Social Cash Transfer (HSCT)
Social ministry Ministry of Public Service, Labour and Social Welfare
Nongovernmental institutions
UNICEF operates as fund manager
(continued next page)
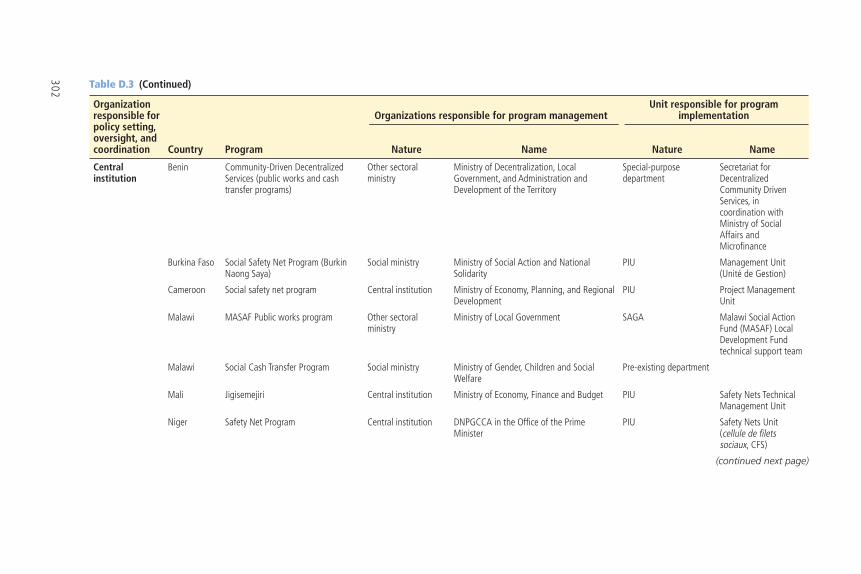
302 Table D.3 (Continued)
Organization responsible for policy setting, oversight, and coordination Country Program
Organizations responsible for program managementUnit responsible for program
implementation
Nature Name Nature Name
Central institution
Benin Community-Driven Decentralized Services (public works and cash transfer programs)
Other sectoral ministry
Ministry of Decentralization, Local Government, and Administration and Development of the Territory
Special-purpose department
Secretariat for Decentralized Community Driven Services, in coordination with Ministry of Social Affairs and Microfi nance
Burkina Faso Social Safety Net Program (Burkin Naong Saya)
Social ministry Ministry of Social Action and National Solidarity
PIU Management Unit (Unité de Gestion)
Cameroon Social safety net program Central institution Ministry of Economy, Planning, and Regional Development
PIU Project Management Unit
Malawi MASAF Public works program Other sectoral ministry
Ministry of Local Government SAGA Malawi Social Action Fund (MASAF) Local Development Fund technical support team
Malawi Social Cash Transfer Program Social ministry Ministry of Gender, Children and Social Welfare
Pre-existing department
Mali Jigisemejiri Central institution Ministry of Economy, Finance and Budget PIU Safety Nets Technical Management Unit
Niger Safety Net Program Central institution DNPGCCA in the Offi ce of the Prime Minister
PIU Safety Nets Unit (cellule de fi lets sociaux, CFS)
(continued next page)
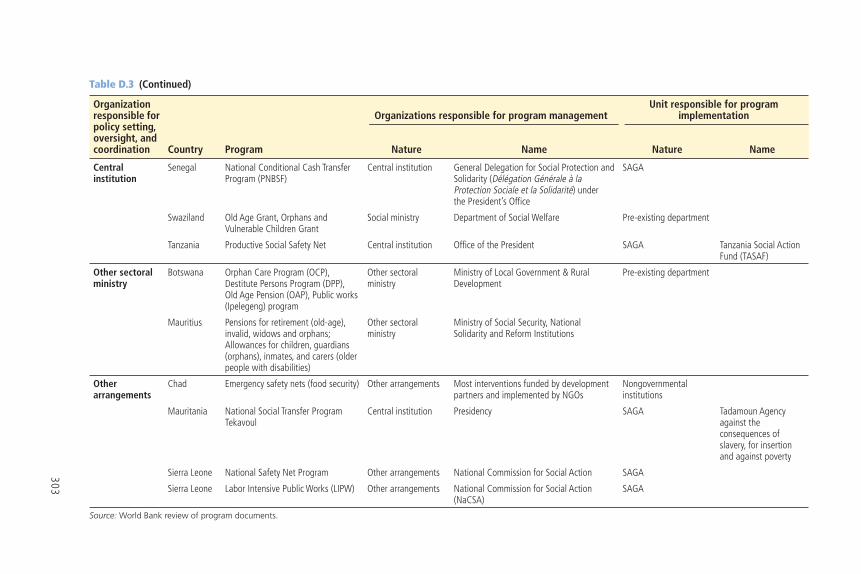
303
Table D.3 (Continued)
Organization responsible for policy setting, oversight, and coordination Country Program
Organizations responsible for program managementUnit responsible for program
implementation
Nature Name Nature Name
Central institution
Senegal National Conditional Cash Transfer Program (PNBSF)
Central institution General Delegation for Social Protection and Solidarity (Délégation Générale à la Protection Sociale et la Solidarité) under the President’s Offi ce
SAGA
Swaziland Old Age Grant, Orphans and Vulnerable Children Grant
Social ministry Department of Social Welfare Pre-existing department
Tanzania Productive Social Safety Net Central institution Offi ce of the President SAGA Tanzania Social Action Fund (TASAF)
Other sectoral ministry
Botswana Orphan Care Program (OCP), Destitute Persons Program (DPP), Old Age Pension (OAP), Public works (Ipelegeng) program
Other sectoral ministry
Ministry of Local Government & Rural Development
Pre-existing department
Mauritius Pensions for retirement (old-age), invalid, widows and orphans; Allowances for children, guardians (orphans), inmates, and carers (older people with disabilities)
Other sectoral ministry
Ministry of Social Security, National Solidarity and Reform Institutions
Other arrangements
Chad Emergency safety nets (food security) Other arrangements Most interventions funded by development partners and implemented by NGOs
Nongovernmental institutions
Mauritania National Social Transfer Program Tekavoul
Central institution Presidency SAGA Tadamoun Agency against the consequences of slavery, for insertion and against poverty
Sierra Leone National Safety Net Program Other arrangements National Commission for Social Action SAGA
Sierra Leone Labor Intensive Public Works (LIPW) Other arrangements National Commission for Social Action (NaCSA)
SAGA
Source: World Bank review of program documents.

305
Appendix E
Typologies of Social Safety Net Programs
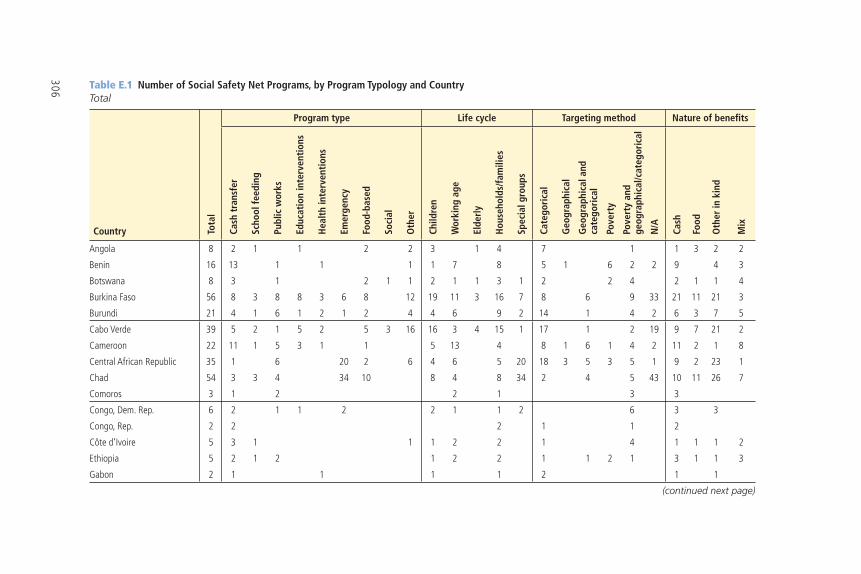
306 Table E.1 Number of Social Safety Net Programs, by Program Typology and Country Total
Country Tota
l
Program type Life cycle Targeting method Nature of benefi ts
Cash
tra
nsfe
r
Scho
ol fe
edin
g
Publ
ic w
orks
Educ
atio
n in
terv
enti
ons
Hea
lth
inte
rven
tion
s
Emer
genc
y
Food
-bas
ed
Soci
al
Oth
er
Child
ren
Wor
king
age
Elde
rly
Hou
seho
lds/
fam
ilies
Spec
ial g
roup
s
Cate
gori
cal
Geo
grap
hica
l
Geo
grap
hica
l and
ca
tego
rica
l
Pove
rty
Pove
rty
and
geog
raph
ical
/cat
egor
ical
N/A
Cash
Food
Oth
er in
kin
d
Mix
Angola 8 2 1 1 2 2 3 1 4 7 1 1 3 2 2
Benin 16 13 1 1 1 1 7 8 5 1 6 2 2 9 4 3
Botswana 8 3 1 2 1 1 2 1 1 3 1 2 2 4 2 1 1 4
Burkina Faso 56 8 3 8 8 3 6 8 12 19 11 3 16 7 8 6 9 33 21 11 21 3
Burundi 21 4 1 6 1 2 1 2 4 4 6 9 2 14 1 4 2 6 3 7 5
Cabo Verde 39 5 2 1 5 2 5 3 16 16 3 4 15 1 17 1 2 19 9 7 21 2
Cameroon 22 11 1 5 3 1 1 5 13 4 8 1 6 1 4 2 11 2 1 8
Central African Republic 35 1 6 20 2 6 4 6 5 20 18 3 5 3 5 1 9 2 23 1
Chad 54 3 3 4 34 10 8 4 8 34 2 4 5 43 10 11 26 7
Comoros 3 1 2 2 1 3 3
Congo, Dem. Rep. 6 2 1 1 2 2 1 1 2 6 3 3
Congo, Rep. 2 2 2 1 1 2
Côte d’Ivoire 5 3 1 1 1 2 2 1 4 1 1 1 2
Ethiopia 5 2 1 2 1 2 2 1 1 2 1 3 1 1 3
Gabon 2 1 1 1 1 2 1 1
(continued next page)
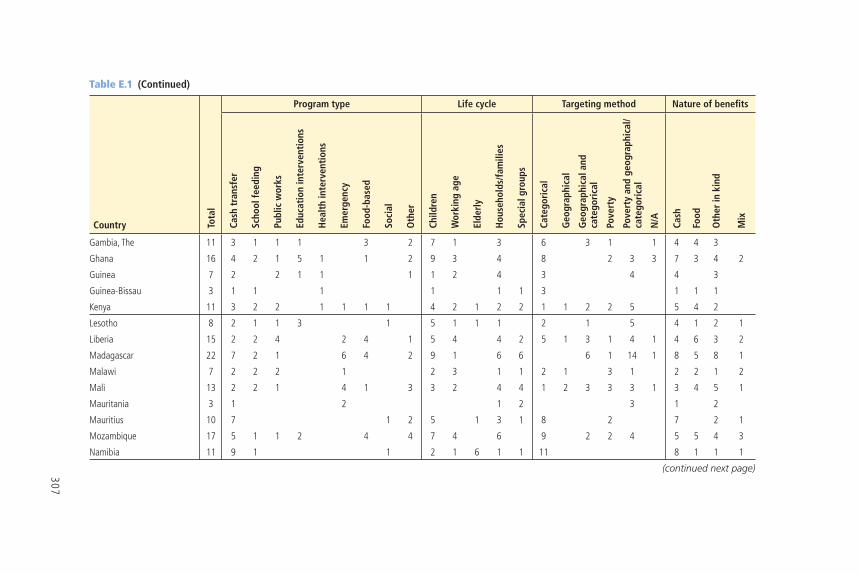
307
Table E.1 (Continued)
Country Tota
l
Program type Life cycle Targeting method Nature of benefi ts
Cash
tra
nsfe
r
Scho
ol fe
edin
g
Publ
ic w
orks
Educ
atio
n in
terv
enti
ons
Hea
lth
inte
rven
tion
s
Emer
genc
y
Food
-bas
ed
Soci
al
Oth
er
Child
ren
Wor
king
age
Elde
rly
Hou
seho
lds/
fam
ilies
Spec
ial g
roup
s
Cate
gori
cal
Geo
grap
hica
l
Geo
grap
hica
l and
ca
tego
rica
l
Pove
rty
Pove
rty
and
geog
raph
ical
/ca
tego
rica
l
N/A
Cash
Food
Oth
er in
kin
d
Mix
Gambia, The 11 3 1 1 1 3 2 7 1 3 6 3 1 1 4 4 3
Ghana 16 4 2 1 5 1 1 2 9 3 4 8 2 3 3 7 3 4 2
Guinea 7 2 2 1 1 1 1 2 4 3 4 4 3
Guinea-Bissau 3 1 1 1 1 1 1 3 1 1 1
Kenya 11 3 2 2 1 1 1 1 4 2 1 2 2 1 1 2 2 5 5 4 2
Lesotho 8 2 1 1 3 1 5 1 1 1 2 1 5 4 1 2 1
Liberia 15 2 2 4 2 4 1 5 4 4 2 5 1 3 1 4 1 4 6 3 2
Madagascar 22 7 2 1 6 4 2 9 1 6 6 6 1 14 1 8 5 8 1
Malawi 7 2 2 2 1 2 3 1 1 2 1 3 1 2 2 1 2
Mali 13 2 2 1 4 1 3 3 2 4 4 1 2 3 3 3 1 3 4 5 1
Mauritania 3 1 2 1 2 3 1 2
Mauritius 10 7 1 2 5 1 3 1 8 2 7 2 1
Mozambique 17 5 1 1 2 4 4 7 4 6 9 2 2 4 5 5 4 3
Namibia 11 9 1 1 2 1 6 1 1 11 8 1 1 1
(continued next page)
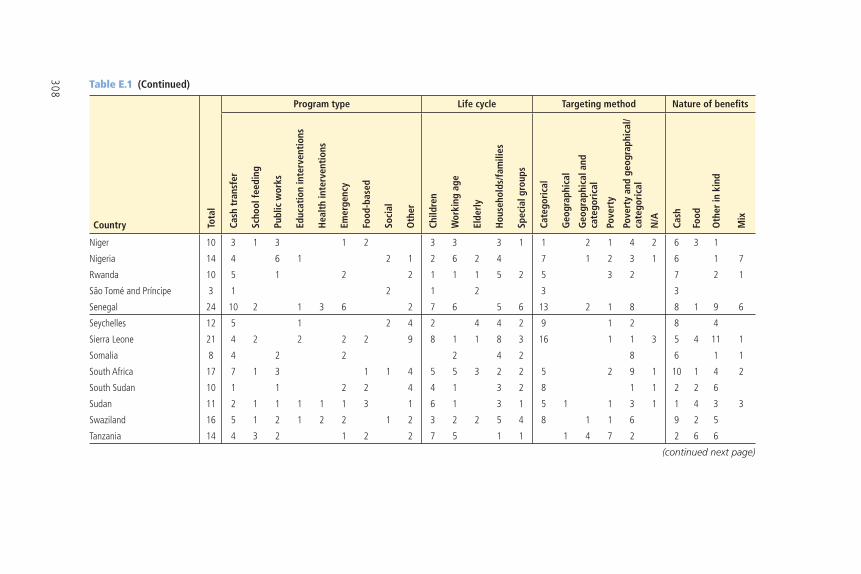
308 Table E.1 (Continued)
Country Tota
l
Program type Life cycle Targeting method Nature of benefi ts
Cash
tra
nsfe
r
Scho
ol fe
edin
g
Publ
ic w
orks
Educ
atio
n in
terv
enti
ons
Hea
lth
inte
rven
tion
s
Emer
genc
y
Food
-bas
ed
Soci
al
Oth
er
Child
ren
Wor
king
age
Elde
rly
Hou
seho
lds/
fam
ilies
Spec
ial g
roup
s
Cate
gori
cal
Geo
grap
hica
l
Geo
grap
hica
l and
ca
tego
rica
l
Pove
rty
Pove
rty
and
geog
raph
ical
/ca
tego
rica
l
N/A
Cash
Food
Oth
er in
kin
d
Mix
Niger 10 3 1 3 1 2 3 3 3 1 1 2 1 4 2 6 3 1
Nigeria 14 4 6 1 2 1 2 6 2 4 7 1 2 3 1 6 1 7
Rwanda 10 5 1 2 2 1 1 1 5 2 5 3 2 7 2 1
São Tomé and Príncipe 3 1 2 1 2 3 3
Senegal 24 10 2 1 3 6 2 7 6 5 6 13 2 1 8 8 1 9 6
Seychelles 12 5 1 2 4 2 4 4 2 9 1 2 8 4
Sierra Leone 21 4 2 2 2 2 9 8 1 1 8 3 16 1 1 3 5 4 11 1
Somalia 8 4 2 2 2 4 2 8 6 1 1
South Africa 17 7 1 3 1 1 4 5 5 3 2 2 5 2 9 1 10 1 4 2
South Sudan 10 1 1 2 2 4 4 1 3 2 8 1 1 2 2 6
Sudan 11 2 1 1 1 1 1 3 1 6 1 3 1 5 1 1 3 1 1 4 3 3
Swaziland 16 5 1 2 1 2 2 1 2 3 2 2 5 4 8 1 1 6 9 2 5
Tanzania 14 4 3 2 1 2 2 7 5 1 1 1 4 7 2 2 6 6
(continued next page)
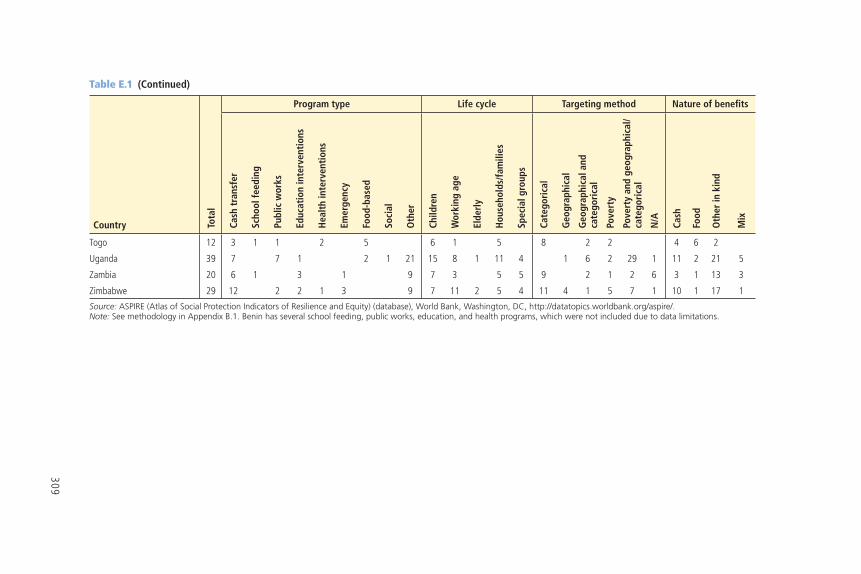
309
Table E.1 (Continued)
Country Tota
l
Program type Life cycle Targeting method Nature of benefi ts
Cash
tra
nsfe
r
Scho
ol fe
edin
g
Publ
ic w
orks
Educ
atio
n in
terv
enti
ons
Hea
lth
inte
rven
tion
s
Emer
genc
y
Food
-bas
ed
Soci
al
Oth
er
Child
ren
Wor
king
age
Elde
rly
Hou
seho
lds/
fam
ilies
Spec
ial g
roup
s
Cate
gori
cal
Geo
grap
hica
l
Geo
grap
hica
l and
ca
tego
rica
l
Pove
rty
Pove
rty
and
geog
raph
ical
/ca
tego
rica
l
N/A
Cash
Food
Oth
er in
kin
d
Mix
Togo 12 3 1 1 2 5 6 1 5 8 2 2 4 6 2
Uganda 39 7 7 1 2 1 21 15 8 1 11 4 1 6 2 29 1 11 2 21 5
Zambia 20 6 1 3 1 9 7 3 5 5 9 2 1 2 6 3 1 13 3
Zimbabwe 29 12 2 2 1 3 9 7 11 2 5 4 11 4 1 5 7 1 10 1 17 1
Source: ASPIRE (Atlas of Social Protection Indicators of Resilience and Equity) (database), World Bank, Washington, DC, http://datatopics.worldbank.org/aspire/.Note: See methodology in Appendix B.1. Benin has several school feeding, public works, education, and health programs, which were not included due to data limitations.
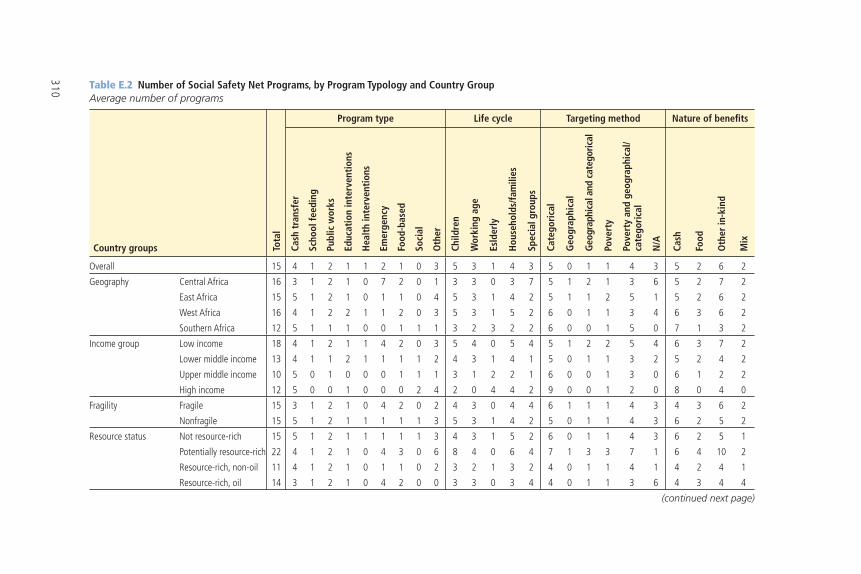
310 Table E.2 Number of Social Safety Net Programs, by Program Typology and Country GroupAverage number of programs
Country groups
Program type Life cycle Targeting method Nature of benefi ts
Tota
l
Cash
tra
nsfe
r
Scho
ol fe
edin
g
Publ
ic w
orks
Educ
atio
n in
terv
enti
ons
Hea
lth
inte
rven
tion
s
Emer
genc
y
Food
-bas
ed
Soci
al
Oth
er
Child
ren
Wor
king
age
Esld
erly
Hou
seho
lds/
fam
ilies
Spec
ial g
roup
s
Cate
gori
cal
Geo
grap
hica
l
Geo
grap
hica
l and
cat
egor
ical
Pove
rty
Pove
rty
and
geog
raph
ical
/ca
tego
rica
l
N/A
Cash
Food
Oth
er in
-kin
d
Mix
Overall 15 4 1 2 1 1 2 1 0 3 5 3 1 4 3 5 0 1 1 4 3 5 2 6 2
Geography Central Africa 16 3 1 2 1 0 7 2 0 1 3 3 0 3 7 5 1 2 1 3 6 5 2 7 2
East Africa 15 5 1 2 1 0 1 1 0 4 5 3 1 4 2 5 1 1 2 5 1 5 2 6 2
West Africa 16 4 1 2 2 1 1 2 0 3 5 3 1 5 2 6 0 1 1 3 4 6 3 6 2
Southern Africa 12 5 1 1 1 0 0 1 1 1 3 2 3 2 2 6 0 0 1 5 0 7 1 3 2
Income group Low income 18 4 1 2 1 1 4 2 0 3 5 4 0 5 4 5 1 2 2 5 4 6 3 7 2
Lower middle income 13 4 1 1 2 1 1 1 1 2 4 3 1 4 1 5 0 1 1 3 2 5 2 4 2
Upper middle income 10 5 0 1 0 0 0 1 1 1 3 1 2 2 1 6 0 0 1 3 0 6 1 2 2
High income 12 5 0 0 1 0 0 0 2 4 2 0 4 4 2 9 0 0 1 2 0 8 0 4 0
Fragility Fragile 15 3 1 2 1 0 4 2 0 2 4 3 0 4 4 6 1 1 1 4 3 4 3 6 2
Nonfragile 15 5 1 2 1 1 1 1 1 3 5 3 1 4 2 5 0 1 1 4 3 6 2 5 2
Resource status Not resource-rich 15 5 1 2 1 1 1 1 1 3 4 3 1 5 2 6 0 1 1 4 3 6 2 5 1
Potentially resource-rich 22 4 1 2 1 0 4 3 0 6 8 4 0 6 4 7 1 3 3 7 1 6 4 10 2
Resource-rich, non-oil 11 4 1 2 1 0 1 1 0 2 3 2 1 3 2 4 0 1 1 4 1 4 2 4 1
Resource-rich, oil 14 3 1 2 1 0 4 2 0 0 3 3 0 3 4 4 0 1 1 3 6 4 3 4 4
(continued next page)
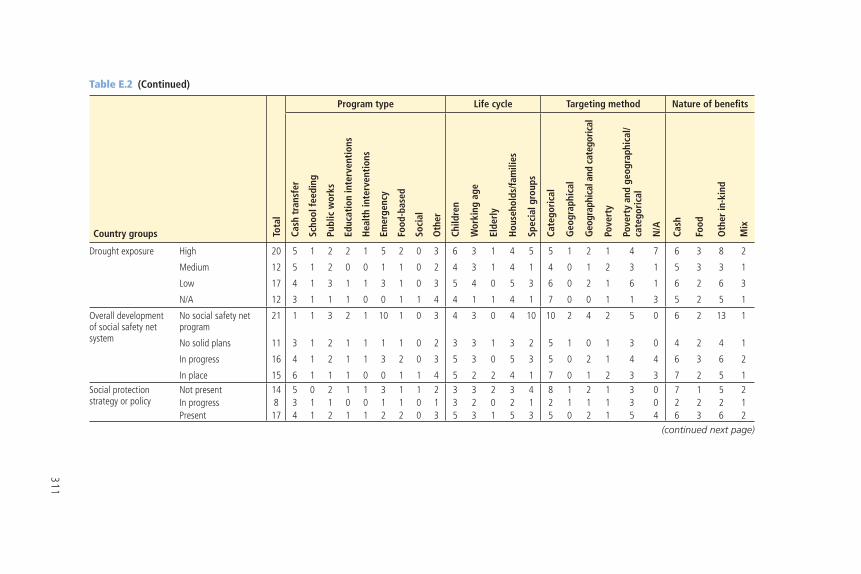
311
Table E.2 (Continued)
Country groups
Program type Life cycle Targeting method Nature of benefi ts
Tota
l
Cash
tra
nsfe
r
Scho
ol fe
edin
g
Publ
ic w
orks
Educ
atio
n in
terv
enti
ons
Hea
lth
inte
rven
tion
s
Emer
genc
y
Food
-bas
ed
Soci
al
Oth
er
Child
ren
Wor
king
age
Elde
rly
Hou
seho
lds/
fam
ilies
Spec
ial g
roup
s
Cate
gori
cal
Geo
grap
hica
l
Geo
grap
hica
l and
cat
egor
ical
Pove
rty
Pove
rty
and
geog
raph
ical
/ca
tego
rica
l
N/A
Cash
Food
Oth
er in
-kin
d
Mix
Drought exposure High 20 5 1 2 2 1 5 2 0 3 6 3 1 4 5 5 1 2 1 4 7 6 3 8 2
Medium 12 5 1 2 0 0 1 1 0 2 4 3 1 4 1 4 0 1 2 3 1 5 3 3 1
Low 17 4 1 3 1 1 3 1 0 3 5 4 0 5 3 6 0 2 1 6 1 6 2 6 3
N/A 12 3 1 1 1 0 0 1 1 4 4 1 1 4 1 7 0 0 1 1 3 5 2 5 1
Overall development of social safety net system
No social safety net program
21 1 1 3 2 1 10 1 0 3 4 3 0 4 10 10 2 4 2 5 0 6 2 13 1
No solid plans 11 3 1 2 1 1 1 1 0 2 3 3 1 3 2 5 1 0 1 3 0 4 2 4 1
In progress 16 4 1 2 1 1 3 2 0 3 5 3 0 5 3 5 0 2 1 4 4 6 3 6 2
In place 15 6 1 1 1 0 0 1 1 4 5 2 2 4 1 7 0 1 2 3 3 7 2 5 1Social protection strategy or policy
Not present 14 5 0 2 1 1 3 1 1 2 3 3 2 3 4 8 1 2 1 3 0 7 1 5 2In progress 8 3 1 1 0 0 1 1 0 1 3 2 0 2 1 2 1 1 1 3 0 2 2 2 1Present 17 4 1 2 1 1 2 2 0 3 5 3 1 5 3 5 0 2 1 5 4 6 3 6 2
(continued next page)
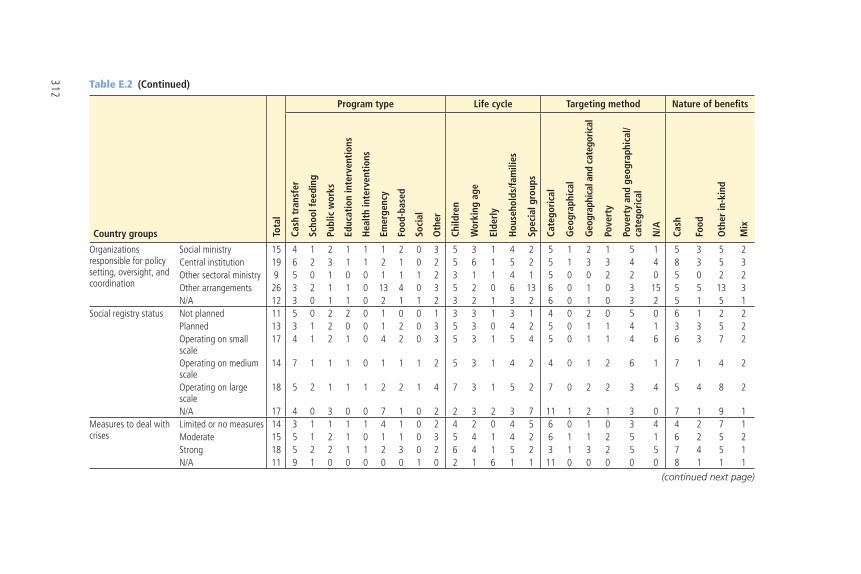
312 Table E.2 (Continued)
Country groups
Program type Life cycle Targeting method Nature of benefi ts
Tota
l
Cash
tra
nsfe
r
Scho
ol fe
edin
g
Publ
ic w
orks
Educ
atio
n in
terv
enti
ons
Hea
lth
inte
rven
tion
s
Emer
genc
y
Food
-bas
ed
Soci
al
Oth
er
Child
ren
Wor
king
age
Elde
rly
Hou
seho
lds/
fam
ilies
Spec
ial g
roup
s
Cate
gori
cal
Geo
grap
hica
l
Geo
grap
hica
l and
cat
egor
ical
Pove
rty
Pove
rty
and
geog
raph
ical
/ca
tego
rica
l
N/A
Cash
Food
Oth
er in
-kin
d
Mix
Organizations responsible for policy setting, oversight, and coordination
Social ministry 15 4 1 2 1 1 1 2 0 3 5 3 1 4 2 5 1 2 1 5 1 5 3 5 2Central institution 19 6 2 3 1 1 2 1 0 2 5 6 1 5 2 5 1 3 3 4 4 8 3 5 3Other sectoral ministry 9 5 0 1 0 0 1 1 1 2 3 1 1 4 1 5 0 0 2 2 0 5 0 2 2Other arrangements 26 3 2 1 1 0 13 4 0 3 5 2 0 6 13 6 0 1 0 3 15 5 5 13 3N/A 12 3 0 1 1 0 2 1 1 2 3 2 1 3 2 6 0 1 0 3 2 5 1 5 1
Social registry status Not planned 11 5 0 2 2 0 1 0 0 1 3 3 1 3 1 4 0 2 0 5 0 6 1 2 2Planned 13 3 1 2 0 0 1 2 0 3 5 3 0 4 2 5 0 1 1 4 1 3 3 5 2Operating on small scale
17 4 1 2 1 0 4 2 0 3 5 3 1 5 4 5 0 1 1 4 6 6 3 7 2
Operating on medium scale
14 7 1 1 1 0 1 1 1 2 5 3 1 4 2 4 0 1 2 6 1 7 1 4 2
Operating on large scale
18 5 2 1 1 1 2 2 1 4 7 3 1 5 2 7 0 2 2 3 4 5 4 8 2
N/A 17 4 0 3 0 0 7 1 0 2 2 3 2 3 7 11 1 2 1 3 0 7 1 9 1Measures to deal with crises
Limited or no measures 14 3 1 1 1 1 4 1 0 2 4 2 0 4 5 6 0 1 0 3 4 4 2 7 1Moderate 15 5 1 2 1 0 1 1 0 3 5 4 1 4 2 6 1 1 2 5 1 6 2 5 2Strong 18 5 2 2 1 1 2 3 0 2 6 4 1 5 2 3 1 3 2 5 5 7 4 5 1N/A 11 9 1 0 0 0 0 0 1 0 2 1 6 1 1 11 0 0 0 0 0 8 1 1 1
(continued next page)
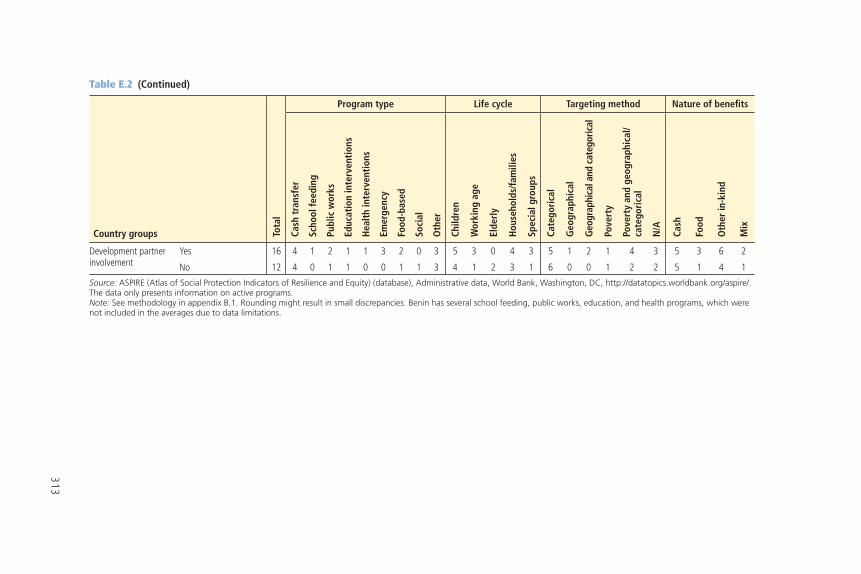
313
Table E.2 (Continued)
Country groups
Program type Life cycle Targeting method Nature of benefi ts
Tota
l
Cash
tra
nsfe
r
Scho
ol fe
edin
g
Publ
ic w
orks
Educ
atio
n in
terv
enti
ons
Hea
lth
inte
rven
tion
s
Emer
genc
y
Food
-bas
ed
Soci
al
Oth
er
Child
ren
Wor
king
age
Elde
rly
Hou
seho
lds/
fam
ilies
Spec
ial g
roup
s
Cate
gori
cal
Geo
grap
hica
l
Geo
grap
hica
l and
cat
egor
ical
Pove
rty
Pove
rty
and
geog
raph
ical
/ca
tego
rica
l
N/A
Cash
Food
Oth
er in
-kin
d
Mix
Development partner involvement
Yes 16 4 1 2 1 1 3 2 0 3 5 3 0 4 3 5 1 2 1 4 3 5 3 6 2
No 12 4 0 1 1 0 0 1 1 3 4 1 2 3 1 6 0 0 1 2 2 5 1 4 1
Source: ASPIRE (Atlas of Social Protection Indicators of Resilience and Equity) (database), Administrative data, World Bank, Washington, DC, http://datatopics.worldbank.org/aspire/. The data only presents information on active programs.Note: See methodology in appendix B.1. Rounding might result in small discrepancies. Benin has several school feeding, public works, education, and health programs, which were not included in the averages due to data limitations.
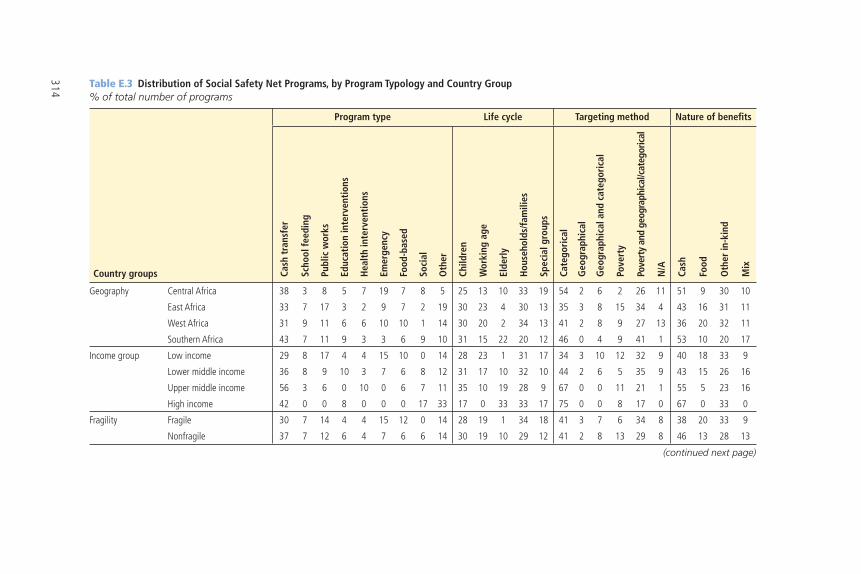
314 Table E.3 Distribution of Social Safety Net Programs, by Program Typology and Country Group % of total number of programs
Country groups
Program type Life cycle Targeting method Nature of benefi ts
Cash
tra
nsfe
r
Scho
ol fe
edin
g
Publ
ic w
orks
Educ
atio
n in
terv
enti
ons
Hea
lth
inte
rven
tion
s
Emer
genc
y
Food
-bas
ed
Soci
al
Oth
er
Child
ren
Wor
king
age
Elde
rly
Hou
seho
lds/
fam
ilies
Spec
ial g
roup
s
Cate
gori
cal
Geo
grap
hica
l
Geo
grap
hica
l and
cat
egor
ical
Pove
rty
Pove
rty
and
geog
raph
ical
/cat
egor
ical
N/A
Cash
Food
Oth
er in
-kin
d
Mix
Geography Central Africa 38 3 8 5 7 19 7 8 5 25 13 10 33 19 54 2 6 2 26 11 51 9 30 10
East Africa 33 7 17 3 2 9 7 2 19 30 23 4 30 13 35 3 8 15 34 4 43 16 31 11
West Africa 31 9 11 6 6 10 10 1 14 30 20 2 34 13 41 2 8 9 27 13 36 20 32 11
Southern Africa 43 7 11 9 3 3 6 9 10 31 15 22 20 12 46 0 4 9 41 1 53 10 20 17
Income group Low income 29 8 17 4 4 15 10 0 14 28 23 1 31 17 34 3 10 12 32 9 40 18 33 9
Lower middle income 36 8 9 10 3 7 6 8 12 31 17 10 32 10 44 2 6 5 35 9 43 15 26 16
Upper middle income 56 3 6 0 10 0 6 7 11 35 10 19 28 9 67 0 0 11 21 1 55 5 23 16
High income 42 0 0 8 0 0 0 17 33 17 0 33 33 17 75 0 0 8 17 0 67 0 33 0
Fragility Fragile 30 7 14 4 4 15 12 0 14 28 19 1 34 18 41 3 7 6 34 8 38 20 33 9
Nonfragile 37 7 12 6 4 7 6 6 14 30 19 10 29 12 41 2 8 13 29 8 46 13 28 13
(continued next page)
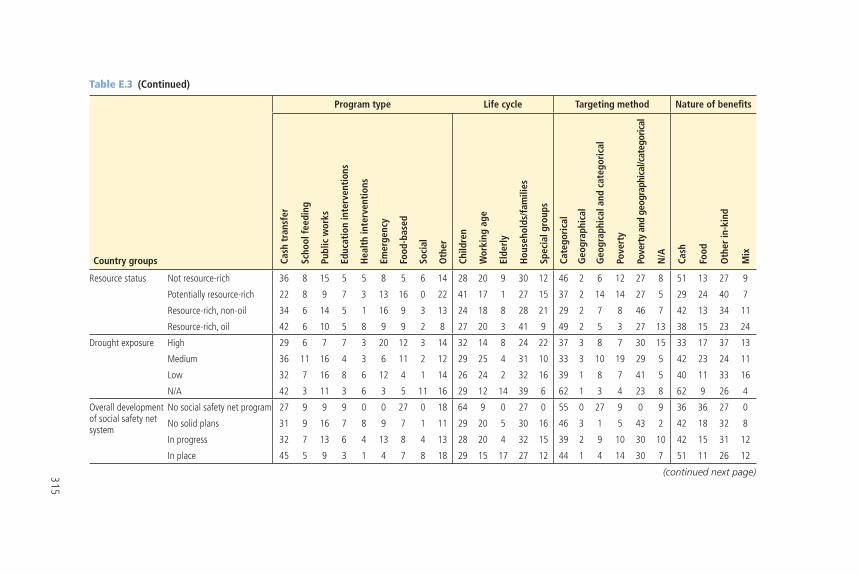
315
Table E.3 (Continued)
Country groups
Program type Life cycle Targeting method Nature of benefi ts
Cash
tra
nsfe
r
Scho
ol fe
edin
g
Publ
ic w
orks
Educ
atio
n in
terv
enti
ons
Hea
lth
inte
rven
tion
s
Emer
genc
y
Food
-bas
ed
Soci
al
Oth
er
Child
ren
Wor
king
age
Elde
rly
Hou
seho
lds/
fam
ilies
Spec
ial g
roup
s
Cate
gori
cal
Geo
grap
hica
l
Geo
grap
hica
l and
cat
egor
ical
Pove
rty
Pove
rty
and
geog
raph
ical
/cat
egor
ical
N/A
Cash
Food
Oth
er in
-kin
d
Mix
Resource status Not resource-rich 36 8 15 5 5 8 5 6 14 28 20 9 30 12 46 2 6 12 27 8 51 13 27 9
Potentially resource-rich 22 8 9 7 3 13 16 0 22 41 17 1 27 15 37 2 14 14 27 5 29 24 40 7
Resource-rich, non-oil 34 6 14 5 1 16 9 3 13 24 18 8 28 21 29 2 7 8 46 7 42 13 34 11
Resource-rich, oil 42 6 10 5 8 9 9 2 8 27 20 3 41 9 49 2 5 3 27 13 38 15 23 24
Drought exposure High 29 6 7 7 3 20 12 3 14 32 14 8 24 22 37 3 8 7 30 15 33 17 37 13
Medium 36 11 16 4 3 6 11 2 12 29 25 4 31 10 33 3 10 19 29 5 42 23 24 11
Low 32 7 16 8 6 12 4 1 14 26 24 2 32 16 39 1 8 7 41 5 40 11 33 16
N/A 42 3 11 3 6 3 5 11 16 29 12 14 39 6 62 1 3 4 23 8 62 9 26 4
Overall development of social safety net system
No social safety net program 27 9 9 9 0 0 27 0 18 64 9 0 27 0 55 0 27 9 0 9 36 36 27 0
No solid plans 31 9 16 7 8 9 7 1 11 29 20 5 30 16 46 3 1 5 43 2 42 18 32 8
In progress 32 7 13 6 4 13 8 4 13 28 20 4 32 15 39 2 9 10 30 10 42 15 31 12
In place 45 5 9 3 1 4 7 8 18 29 15 17 27 12 44 1 4 14 30 7 51 11 26 12
(continued next page)
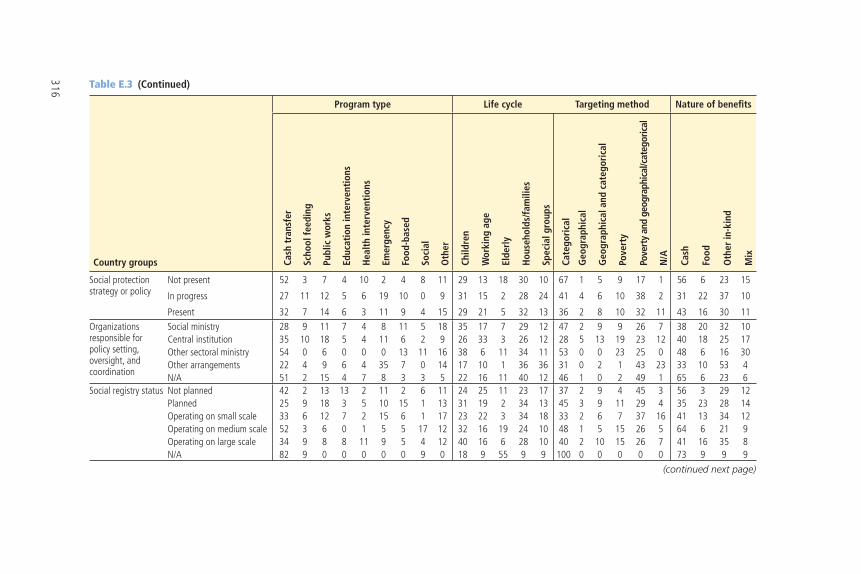
316 Table E.3 (Continued)
Country groups
Program type Life cycle Targeting method Nature of benefi ts
Cash
tra
nsfe
r
Scho
ol fe
edin
g
Publ
ic w
orks
Educ
atio
n in
terv
enti
ons
Hea
lth
inte
rven
tion
s
Emer
genc
y
Food
-bas
ed
Soci
al
Oth
er
Child
ren
Wor
king
age
Elde
rly
Hou
seho
lds/
fam
ilies
Spec
ial g
roup
s
Cate
gori
cal
Geo
grap
hica
l
Geo
grap
hica
l and
cat
egor
ical
Pove
rty
Pove
rty
and
geog
raph
ical
/cat
egor
ical
N/A
Cash
Food
Oth
er in
-kin
d
Mix
Social protection strategy or policy
Not present 52 3 7 4 10 2 4 8 11 29 13 18 30 10 67 1 5 9 17 1 56 6 23 15
In progress 27 11 12 5 6 19 10 0 9 31 15 2 28 24 41 4 6 10 38 2 31 22 37 10
Present 32 7 14 6 3 11 9 4 15 29 21 5 32 13 36 2 8 10 32 11 43 16 30 11Organizations responsible for policy setting, oversight, and coordination
Social ministry 28 9 11 7 4 8 11 5 18 35 17 7 29 12 47 2 9 9 26 7 38 20 32 10Central institution 35 10 18 5 4 11 6 2 9 26 33 3 26 12 28 5 13 19 23 12 40 18 25 17Other sectoral ministry 54 0 6 0 0 0 13 11 16 38 6 11 34 11 53 0 0 23 25 0 48 6 16 30Other arrangements 22 4 9 6 4 35 7 0 14 17 10 1 36 36 31 0 2 1 43 23 33 10 53 4N/A 51 2 15 4 7 8 3 3 5 22 16 11 40 12 46 1 0 2 49 1 65 6 23 6
Social registry status Not planned 42 2 13 13 2 11 2 6 11 24 25 11 23 17 37 2 9 4 45 3 56 3 29 12Planned 25 9 18 3 5 10 15 1 13 31 19 2 34 13 45 3 9 11 29 4 35 23 28 14Operating on small scale 33 6 12 7 2 15 6 1 17 23 22 3 34 18 33 2 6 7 37 16 41 13 34 12Operating on medium scale 52 3 6 0 1 5 5 17 12 32 16 19 24 10 48 1 5 15 26 5 64 6 21 9Operating on large scale 34 9 8 8 11 9 5 4 12 40 16 6 28 10 40 2 10 15 26 7 41 16 35 8N/A 82 9 0 0 0 0 0 9 0 18 9 55 9 9 100 0 0 0 0 0 73 9 9 9
(continued next page)
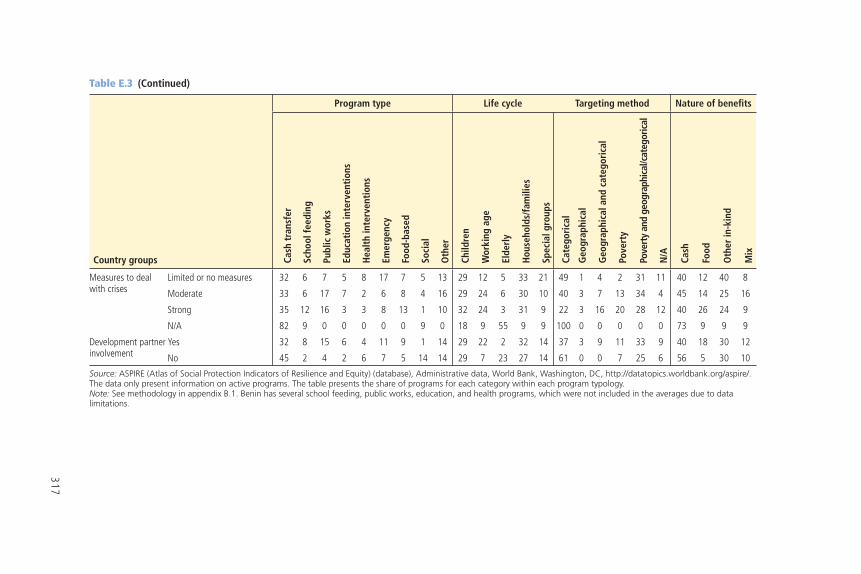
317
Table E.3 (Continued)
Country groups
Program type Life cycle Targeting method Nature of benefi ts
Cash
tra
nsfe
r
Scho
ol fe
edin
g
Publ
ic w
orks
Educ
atio
n in
terv
enti
ons
Hea
lth
inte
rven
tion
s
Emer
genc
y
Food
-bas
ed
Soci
al
Oth
er
Child
ren
Wor
king
age
Elde
rly
Hou
seho
lds/
fam
ilies
Spec
ial g
roup
s
Cate
gori
cal
Geo
grap
hica
l
Geo
grap
hica
l and
cat
egor
ical
Pove
rty
Pove
rty
and
geog
raph
ical
/cat
egor
ical
N/A
Cash
Food
Oth
er in
-kin
d
Mix
Measures to deal with crises
Limited or no measures 32 6 7 5 8 17 7 5 13 29 12 5 33 21 49 1 4 2 31 11 40 12 40 8
Moderate 33 6 17 7 2 6 8 4 16 29 24 6 30 10 40 3 7 13 34 4 45 14 25 16
Strong 35 12 16 3 3 8 13 1 10 32 24 3 31 9 22 3 16 20 28 12 40 26 24 9
N/A 82 9 0 0 0 0 0 9 0 18 9 55 9 9 100 0 0 0 0 0 73 9 9 9
Development partner involvement
Yes 32 8 15 6 4 11 9 1 14 29 22 2 32 14 37 3 9 11 33 9 40 18 30 12
No 45 2 4 2 6 7 5 14 14 29 7 23 27 14 61 0 0 7 25 6 56 5 30 10
Source: ASPIRE (Atlas of Social Protection Indicators of Resilience and Equity) (database), Administrative data, World Bank, Washington, DC, http://datatopics.worldbank.org/aspire/. The data only present information on active programs. The table presents the share of programs for each category within each program typology.Note: See methodology in appendix B.1. Benin has several school feeding, public works, education, and health programs, which were not included in the averages due to data limitations.


319
Appendix F
Coverage of Social Safety Net Programs
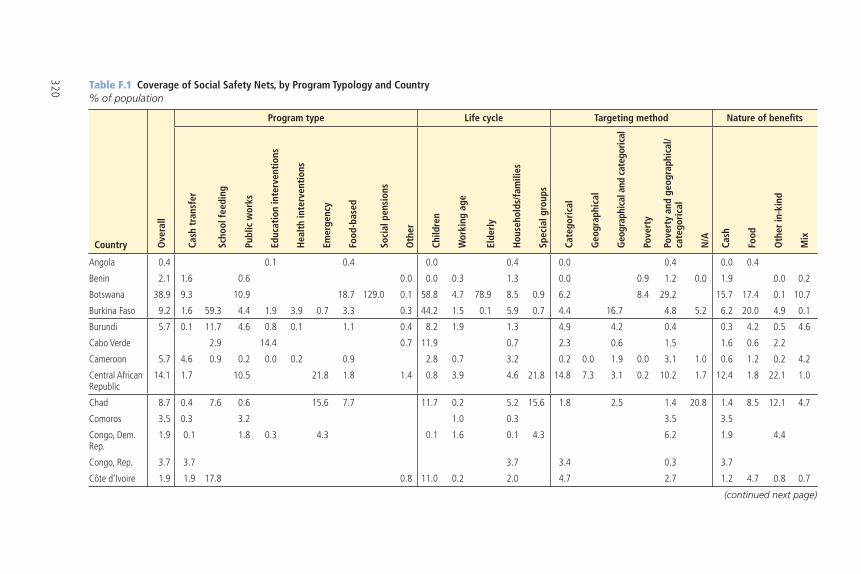
320 Table F.1 Coverage of Social Safety Nets, by Program Typology and Country% of population
Country Ove
rall
Program type Life cycle Targeting method Nature of benefi ts
Cash
tra
nsfe
r
Scho
ol fe
edin
g
Publ
ic w
orks
Educ
atio
n in
terv
enti
ons
Hea
lth
inte
rven
tion
s
Emer
genc
y
Food
-bas
ed
Soci
al p
ensi
ons
Oth
er
Child
ren
Wor
king
age
Elde
rly
Hou
seho
lds/
fam
ilies
Spec
ial g
roup
s
Cate
gori
cal
Geo
grap
hica
l
Geo
grap
hica
l and
cat
egor
ical
Pove
rty
Pove
rty
and
geog
raph
ical
/ca
tego
rica
l
N/A
Cash
Food
Oth
er in
-kin
d
Mix
Angola 0.4 0.1 0.4 0.0 0.4 0.0 0.4 0.0 0.4
Benin 2.1 1.6 0.6 0.0 0.0 0.3 1.3 0.0 0.9 1.2 0.0 1.9 0.0 0.2
Botswana 38.9 9.3 10.9 18.7 129.0 0.1 58.8 4.7 78.9 8.5 0.9 6.2 8.4 29.2 15.7 17.4 0.1 10.7
Burkina Faso 9.2 1.6 59.3 4.4 1.9 3.9 0.7 3.3 0.3 44.2 1.5 0.1 5.9 0.7 4.4 16.7 4.8 5.2 6.2 20.0 4.9 0.1
Burundi 5.7 0.1 11.7 4.6 0.8 0.1 1.1 0.4 8.2 1.9 1.3 4.9 4.2 0.4 0.3 4.2 0.5 4.6
Cabo Verde 2.9 14.4 0.7 11.9 0.7 2.3 0.6 1.5 1.6 0.6 2.2
Cameroon 5.7 4.6 0.9 0.2 0.0 0.2 0.9 2.8 0.7 3.2 0.2 0.0 1.9 0.0 3.1 1.0 0.6 1.2 0.2 4.2
Central African Republic
14.1 1.7 10.5 21.8 1.8 1.4 0.8 3.9 4.6 21.8 14.8 7.3 3.1 0.2 10.2 1.7 12.4 1.8 22.1 1.0
Chad 8.7 0.4 7.6 0.6 15.6 7.7 11.7 0.2 5.2 15.6 1.8 2.5 1.4 20.8 1.4 8.5 12.1 4.7
Comoros 3.5 0.3 3.2 1.0 0.3 3.5 3.5
Congo, Dem. Rep.
1.9 0.1 1.8 0.3 4.3 0.1 1.6 0.1 4.3 6.2 1.9 4.4
Congo, Rep. 3.7 3.7 3.7 3.4 0.3 3.7
Côte d’Ivoire 1.9 1.9 17.8 0.8 11.0 0.2 2.0 4.7 2.7 1.2 4.7 0.8 0.7
(continued next page)
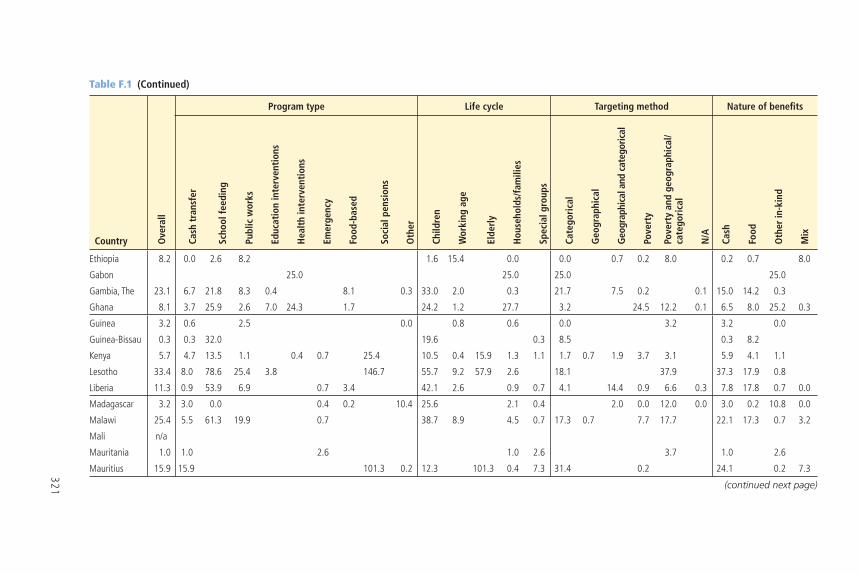
321
Table F.1 (Continued)
Country Ove
rall
Program type Life cycle Targeting method Nature of benefi ts
Cash
tra
nsfe
r
Scho
ol fe
edin
g
Publ
ic w
orks
Educ
atio
n in
terv
enti
ons
Hea
lth
inte
rven
tion
s
Emer
genc
y
Food
-bas
ed
Soci
al p
ensi
ons
Oth
er
Child
ren
Wor
king
age
Elde
rly
Hou
seho
lds/
fam
ilies
Spec
ial g
roup
s
Cate
gori
cal
Geo
grap
hica
l
Geo
grap
hica
l and
cat
egor
ical
Pove
rty
Pove
rty
and
geog
raph
ical
/ca
tego
rica
l
N/A
Cash
Food
Oth
er in
-kin
d
Mix
Ethiopia 8.2 0.0 2.6 8.2 1.6 15.4 0.0 0.0 0.7 0.2 8.0 0.2 0.7 8.0
Gabon 25.0 25.0 25.0 25.0
Gambia, The 23.1 6.7 21.8 8.3 0.4 8.1 0.3 33.0 2.0 0.3 21.7 7.5 0.2 0.1 15.0 14.2 0.3
Ghana 8.1 3.7 25.9 2.6 7.0 24.3 1.7 24.2 1.2 27.7 3.2 24.5 12.2 0.1 6.5 8.0 25.2 0.3
Guinea 3.2 0.6 2.5 0.0 0.8 0.6 0.0 3.2 3.2 0.0
Guinea-Bissau 0.3 0.3 32.0 19.6 0.3 8.5 0.3 8.2
Kenya 5.7 4.7 13.5 1.1 0.4 0.7 25.4 10.5 0.4 15.9 1.3 1.1 1.7 0.7 1.9 3.7 3.1 5.9 4.1 1.1
Lesotho 33.4 8.0 78.6 25.4 3.8 146.7 55.7 9.2 57.9 2.6 18.1 37.9 37.3 17.9 0.8
Liberia 11.3 0.9 53.9 6.9 0.7 3.4 42.1 2.6 0.9 0.7 4.1 14.4 0.9 6.6 0.3 7.8 17.8 0.7 0.0
Madagascar 3.2 3.0 0.0 0.4 0.2 10.4 25.6 2.1 0.4 2.0 0.0 12.0 0.0 3.0 0.2 10.8 0.0
Malawi 25.4 5.5 61.3 19.9 0.7 38.7 8.9 4.5 0.7 17.3 0.7 7.7 17.7 22.1 17.3 0.7 3.2
Mali n/a
Mauritania 1.0 1.0 2.6 1.0 2.6 3.7 1.0 2.6
Mauritius 15.9 15.9 101.3 0.2 12.3 101.3 0.4 7.3 31.4 0.2 24.1 0.2 7.3
(continued next page)
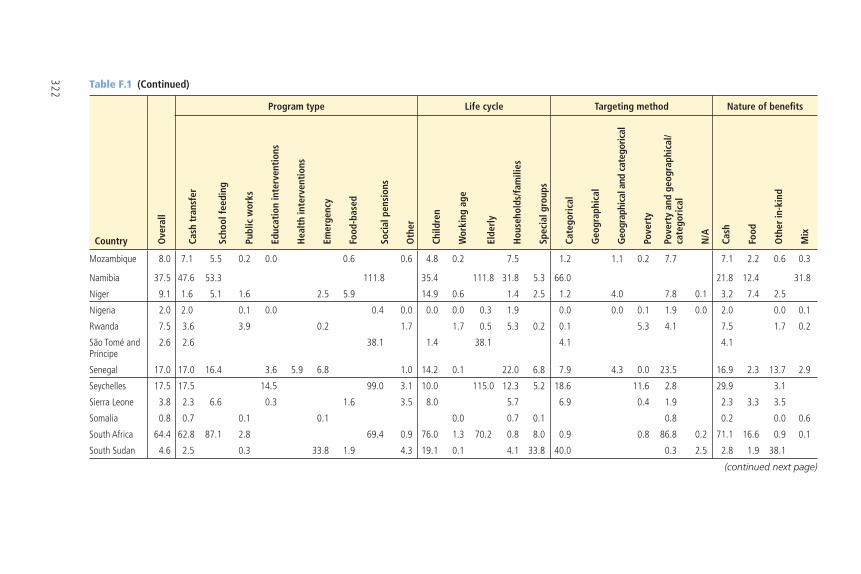
322 Table F.1 (Continued)
Country Ove
rall
Program type Life cycle Targeting method Nature of benefi ts
Cash
tra
nsfe
r
Scho
ol fe
edin
g
Publ
ic w
orks
Educ
atio
n in
terv
enti
ons
Hea
lth
inte
rven
tion
s
Emer
genc
y
Food
-bas
ed
Soci
al p
ensi
ons
Oth
er
Child
ren
Wor
king
age
Elde
rly
Hou
seho
lds/
fam
ilies
Spec
ial g
roup
s
Cate
gori
cal
Geo
grap
hica
l
Geo
grap
hica
l and
cat
egor
ical
Pove
rty
Pove
rty
and
geog
raph
ical
/ca
tego
rica
l
N/A
Cash
Food
Oth
er in
-kin
d
Mix
Mozambique 8.0 7.1 5.5 0.2 0.0 0.6 0.6 4.8 0.2 7.5 1.2 1.1 0.2 7.7 7.1 2.2 0.6 0.3
Namibia 37.5 47.6 53.3 111.8 35.4 111.8 31.8 5.3 66.0 21.8 12.4 31.8
Niger 9.1 1.6 5.1 1.6 2.5 5.9 14.9 0.6 1.4 2.5 1.2 4.0 7.8 0.1 3.2 7.4 2.5
Nigeria 2.0 2.0 0.1 0.0 0.4 0.0 0.0 0.0 0.3 1.9 0.0 0.0 0.1 1.9 0.0 2.0 0.0 0.1
Rwanda 7.5 3.6 3.9 0.2 1.7 1.7 0.5 5.3 0.2 0.1 5.3 4.1 7.5 1.7 0.2
São Tomé and Príncipe
2.6 2.6 38.1 1.4 38.1 4.1 4.1
Senegal 17.0 17.0 16.4 3.6 5.9 6.8 1.0 14.2 0.1 22.0 6.8 7.9 4.3 0.0 23.5 16.9 2.3 13.7 2.9
Seychelles 17.5 17.5 14.5 99.0 3.1 10.0 115.0 12.3 5.2 18.6 11.6 2.8 29.9 3.1
Sierra Leone 3.8 2.3 6.6 0.3 1.6 3.5 8.0 5.7 6.9 0.4 1.9 2.3 3.3 3.5
Somalia 0.8 0.7 0.1 0.1 0.0 0.7 0.1 0.8 0.2 0.0 0.6
South Africa 64.4 62.8 87.1 2.8 69.4 0.9 76.0 1.3 70.2 0.8 8.0 0.9 0.8 86.8 0.2 71.1 16.6 0.9 0.1
South Sudan 4.6 2.5 0.3 33.8 1.9 4.3 19.1 0.1 4.1 33.8 40.0 0.3 2.5 2.8 1.9 38.1
(continued next page)
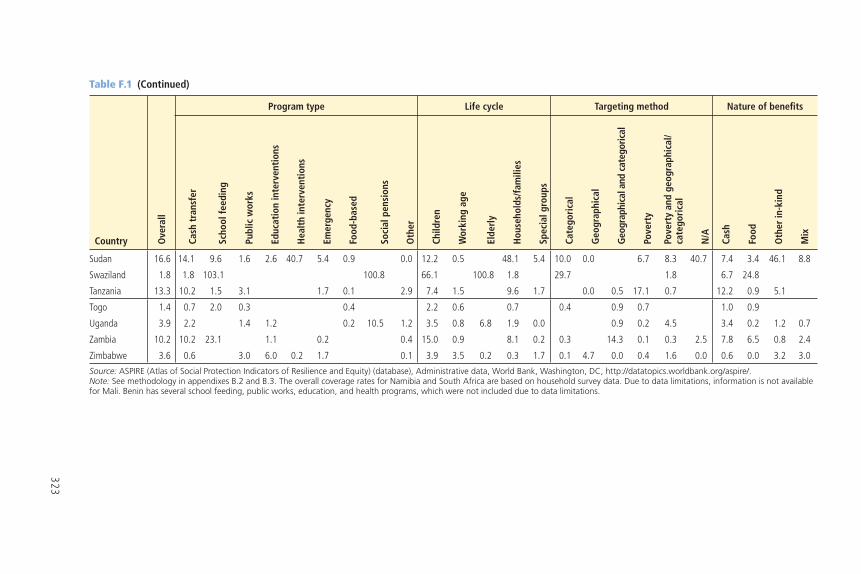
323
Table F.1 (Continued)
Country Ove
rall
Program type Life cycle Targeting method Nature of benefi ts
Cash
tra
nsfe
r
Scho
ol fe
edin
g
Publ
ic w
orks
Educ
atio
n in
terv
enti
ons
Hea
lth
inte
rven
tion
s
Emer
genc
y
Food
-bas
ed
Soci
al p
ensi
ons
Oth
er
Child
ren
Wor
king
age
Elde
rly
Hou
seho
lds/
fam
ilies
Spec
ial g
roup
s
Cate
gori
cal
Geo
grap
hica
l
Geo
grap
hica
l and
cat
egor
ical
Pove
rty
Pove
rty
and
geog
raph
ical
/ca
tego
rica
l
N/A
Cash
Food
Oth
er in
-kin
d
Mix
Sudan 16.6 14.1 9.6 1.6 2.6 40.7 5.4 0.9 0.0 12.2 0.5 48.1 5.4 10.0 0.0 6.7 8.3 40.7 7.4 3.4 46.1 8.8
Swaziland 1.8 1.8 103.1 100.8 66.1 100.8 1.8 29.7 1.8 6.7 24.8
Tanzania 13.3 10.2 1.5 3.1 1.7 0.1 2.9 7.4 1.5 9.6 1.7 0.0 0.5 17.1 0.7 12.2 0.9 5.1
Togo 1.4 0.7 2.0 0.3 0.4 2.2 0.6 0.7 0.4 0.9 0.7 1.0 0.9
Uganda 3.9 2.2 1.4 1.2 0.2 10.5 1.2 3.5 0.8 6.8 1.9 0.0 0.9 0.2 4.5 3.4 0.2 1.2 0.7
Zambia 10.2 10.2 23.1 1.1 0.2 0.4 15.0 0.9 8.1 0.2 0.3 14.3 0.1 0.3 2.5 7.8 6.5 0.8 2.4
Zimbabwe 3.6 0.6 3.0 6.0 0.2 1.7 0.1 3.9 3.5 0.2 0.3 1.7 0.1 4.7 0.0 0.4 1.6 0.0 0.6 0.0 3.2 3.0
Source: ASPIRE (Atlas of Social Protection Indicators of Resilience and Equity) (database), Administrative data, World Bank, Washington, DC, http://datatopics.worldbank.org/aspire/.Note: See methodology in appendixes B.2 and B.3. The overall coverage rates for Namibia and South Africa are based on household survey data. Due to data limitations, information is not available for Mali. Benin has several school feeding, public works, education, and health programs, which were not included due to data limitations.
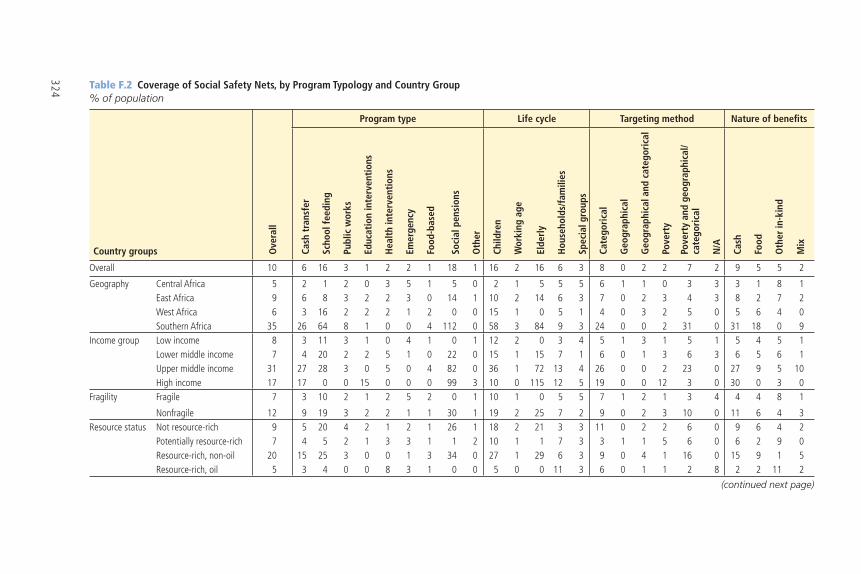
324 Table F.2 Coverage of Social Safety Nets, by Program Typology and Country Group% of population
Country groups Ove
rall
Program type Life cycle Targeting method Nature of benefi ts
Cash
tra
nsfe
r
Scho
ol fe
edin
g
Publ
ic w
orks
Educ
atio
n in
terv
enti
ons
Hea
lth
inte
rven
tion
s
Emer
genc
y
Food
-bas
ed
Soci
al p
ensi
ons
Oth
er
Child
ren
Wor
king
age
Elde
rly
Hou
seho
lds/
fam
ilies
Spec
ial g
roup
s
Cate
gori
cal
Geo
grap
hica
l
Geo
grap
hica
l and
cat
egor
ical
Pove
rty
Pove
rty
and
geog
raph
ical
/ca
tego
rica
l
N/A
Cash
Food
Oth
er in
-kin
d
Mix
Overall 10 6 16 3 1 2 2 1 18 1 16 2 16 6 3 8 0 2 2 7 2 9 5 5 2
Geography Central Africa 5 2 1 2 0 3 5 1 5 0 2 1 5 5 5 6 1 1 0 3 3 3 1 8 1East Africa 9 6 8 3 2 2 3 0 14 1 10 2 14 6 3 7 0 2 3 4 3 8 2 7 2West Africa 6 3 16 2 2 2 1 2 0 0 15 1 0 5 1 4 0 3 2 5 0 5 6 4 0Southern Africa 35 26 64 8 1 0 0 4 112 0 58 3 84 9 3 24 0 0 2 31 0 31 18 0 9
Income group Low income 8 3 11 3 1 0 4 1 0 1 12 2 0 3 4 5 1 3 1 5 1 5 4 5 1Lower middle income 7 4 20 2 2 5 1 0 22 0 15 1 15 7 1 6 0 1 3 6 3 6 5 6 1Upper middle income 31 27 28 3 0 5 0 4 82 0 36 1 72 13 4 26 0 0 2 23 0 27 9 5 10High income 17 17 0 0 15 0 0 0 99 3 10 0 115 12 5 19 0 0 12 3 0 30 0 3 0
Fragility Fragile 7 3 10 2 1 2 5 2 0 1 10 1 0 5 5 7 1 2 1 3 4 4 4 8 1
Nonfragile 12 9 19 3 2 2 1 1 30 1 19 2 25 7 2 9 0 2 3 10 0 11 6 4 3Resource status Not resource-rich 9 5 20 4 2 1 2 1 26 1 18 2 21 3 3 11 0 2 2 6 0 9 6 4 2
Potentially resource-rich 7 4 5 2 1 3 3 1 1 2 10 1 1 7 3 3 1 1 5 6 0 6 2 9 0Resource-rich, non-oil 20 15 25 3 0 0 1 3 34 0 27 1 29 6 3 9 0 4 1 16 0 15 9 1 5Resource-rich, oil 5 3 4 0 0 8 3 1 0 0 5 0 0 11 3 6 0 1 1 2 8 2 2 11 2
(continued next page)
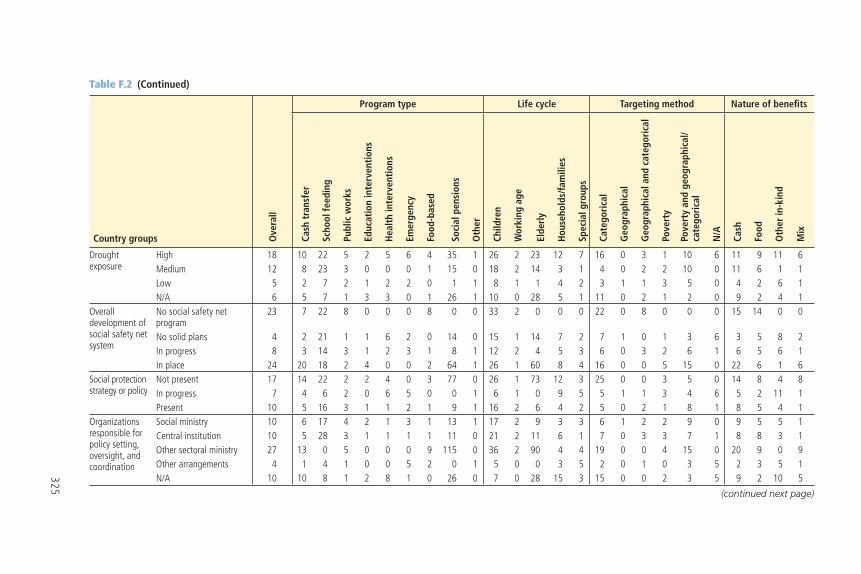
325
Table F.2 (Continued)
Country groups Ove
rall
Program type Life cycle Targeting method Nature of benefi ts
Cash
tra
nsfe
r
Scho
ol fe
edin
g
Publ
ic w
orks
Educ
atio
n in
terv
enti
ons
Hea
lth
inte
rven
tion
s
Emer
genc
y
Food
-bas
ed
Soci
al p
ensi
ons
Oth
er
Child
ren
Wor
king
age
Elde
rly
Hou
seho
lds/
fam
ilies
Spec
ial g
roup
s
Cate
gori
cal
Geo
grap
hica
l
Geo
grap
hica
l and
cat
egor
ical
Pove
rty
Pove
rty
and
geog
raph
ical
/ca
tego
rica
l
N/A
Cash
Food
Oth
er in
-kin
d
Mix
Drought exposure
High 18 10 22 5 2 5 6 4 35 1 26 2 23 12 7 16 0 3 1 10 6 11 9 11 6Medium 12 8 23 3 0 0 0 1 15 0 18 2 14 3 1 4 0 2 2 10 0 11 6 1 1Low 5 2 7 2 1 2 2 0 1 1 8 1 1 4 2 3 1 1 3 5 0 4 2 6 1N/A 6 5 7 1 3 3 0 1 26 1 10 0 28 5 1 11 0 2 1 2 0 9 2 4 1
Overall development of social safety net system
No social safety net program
23 7 22 8 0 0 0 8 0 0 33 2 0 0 0 22 0 8 0 0 0 15 14 0 0
No solid plans 4 2 21 1 1 6 2 0 14 0 15 1 14 7 2 7 1 0 1 3 6 3 5 8 2In progress 8 3 14 3 1 2 3 1 8 1 12 2 4 5 3 6 0 3 2 6 1 6 5 6 1In place 24 20 18 2 4 0 0 2 64 1 26 1 60 8 4 16 0 0 5 15 0 22 6 1 6
Social protection strategy or policy
Not present 17 14 22 2 2 4 0 3 77 0 26 1 73 12 3 25 0 0 3 5 0 14 8 4 8In progress 7 4 6 2 0 6 5 0 0 1 6 1 0 9 5 5 1 1 3 4 6 5 2 11 1Present 10 5 16 3 1 1 2 1 9 1 16 2 6 4 2 5 0 2 1 8 1 8 5 4 1
Organizations responsible for policy setting, oversight, and coordination
Social ministry 10 6 17 4 2 1 3 1 13 1 17 2 9 3 3 6 1 2 2 9 0 9 5 5 1Central institution 10 5 28 3 1 1 1 1 11 0 21 2 11 6 1 7 0 3 3 7 1 8 8 3 1Other sectoral ministry 27 13 0 5 0 0 0 9 115 0 36 2 90 4 4 19 0 0 4 15 0 20 9 0 9Other arrangements 4 1 4 1 0 0 5 2 0 1 5 0 0 3 5 2 0 1 0 3 5 2 3 5 1N/A 10 10 8 1 2 8 1 0 26 0 7 0 28 15 3 15 0 0 2 3 5 9 2 10 5
(continued next page)
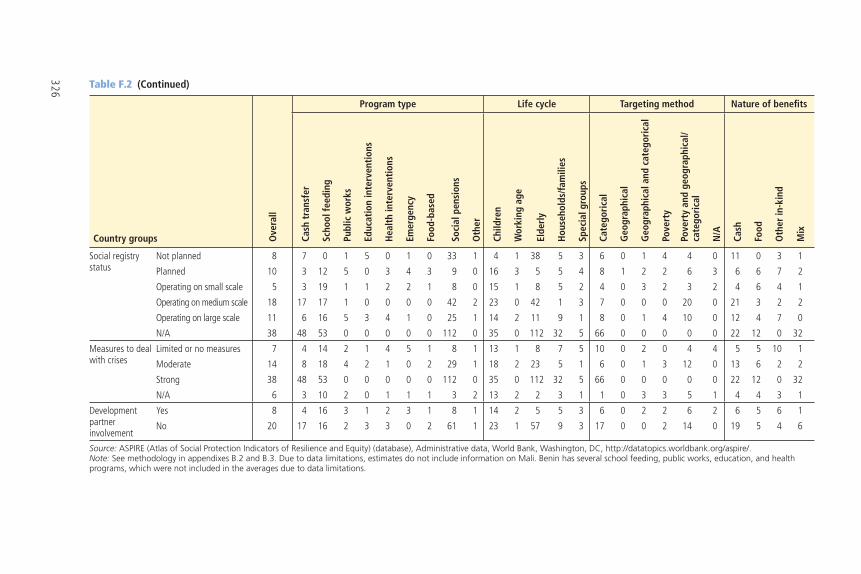
326 Table F.2 (Continued)
Country groups Ove
rall
Program type Life cycle Targeting method Nature of benefi ts
Cash
tra
nsfe
r
Scho
ol fe
edin
g
Publ
ic w
orks
Educ
atio
n in
terv
enti
ons
Hea
lth
inte
rven
tion
s
Emer
genc
y
Food
-bas
ed
Soci
al p
ensi
ons
Oth
er
Child
ren
Wor
king
age
Elde
rly
Hou
seho
lds/
fam
ilies
Spec
ial g
roup
s
Cate
gori
cal
Geo
grap
hica
l
Geo
grap
hica
l and
cat
egor
ical
Pove
rty
Pove
rty
and
geog
raph
ical
/ca
tego
rica
l
N/A
Cash
Food
Oth
er in
-kin
d
Mix
Social registry status
Not planned 8 7 0 1 5 0 1 0 33 1 4 1 38 5 3 6 0 1 4 4 0 11 0 3 1
Planned 10 3 12 5 0 3 4 3 9 0 16 3 5 5 4 8 1 2 2 6 3 6 6 7 2
Operating on small scale 5 3 19 1 1 2 2 1 8 0 15 1 8 5 2 4 0 3 2 3 2 4 6 4 1
Operating on medium scale 18 17 17 1 0 0 0 0 42 2 23 0 42 1 3 7 0 0 0 20 0 21 3 2 2
Operating on large scale 11 6 16 5 3 4 1 0 25 1 14 2 11 9 1 8 0 1 4 10 0 12 4 7 0
N/A 38 48 53 0 0 0 0 0 112 0 35 0 112 32 5 66 0 0 0 0 0 22 12 0 32
Measures to deal with crises
Limited or no measures 7 4 14 2 1 4 5 1 8 1 13 1 8 7 5 10 0 2 0 4 4 5 5 10 1
Moderate 14 8 18 4 2 1 0 2 29 1 18 2 23 5 1 6 0 1 3 12 0 13 6 2 2
Strong 38 48 53 0 0 0 0 0 112 0 35 0 112 32 5 66 0 0 0 0 0 22 12 0 32
N/A 6 3 10 2 0 1 1 1 3 2 13 2 2 3 1 1 0 3 3 5 1 4 4 3 1
Development partner involvement
Yes 8 4 16 3 1 2 3 1 8 1 14 2 5 5 3 6 0 2 2 6 2 6 5 6 1
No 20 17 16 2 3 3 0 2 61 1 23 1 57 9 3 17 0 0 2 14 0 19 5 4 6
Source: ASPIRE (Atlas of Social Protection Indicators of Resilience and Equity) (database), Administrative data, World Bank, Washington, DC, http://datatopics.worldbank.org/aspire/.Note: See methodology in appendixes B.2 and B.3. Due to data limitations, estimates do not include information on Mali. Benin has several school feeding, public works, education, and health programs, which were not included in the averages due to data limitations.
327
Appendix G
Spending on Social Safety Net Programs
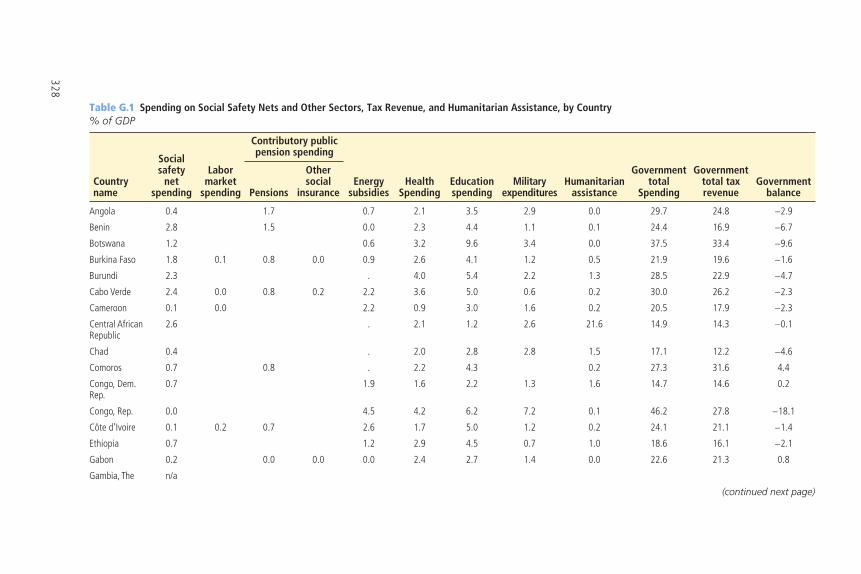
328
Table G.1 Spending on Social Safety Nets and Other Sectors, Tax Revenue, and Humanitarian Assistance, by Country% of GDP
Country name
Social safety
net spending
Labor market
spending
Contributory public pension spending
Energy subsidies
Health Spending
Education spending
Military expenditures
Humanitarian assistance
Government total
Spending
Government total tax revenue
Government balancePensions
Other social
insurance
Angola 0.4 1.7 0.7 2.1 3.5 2.9 0.0 29.7 24.8 −2.9
Benin 2.8 1.5 0.0 2.3 4.4 1.1 0.1 24.4 16.9 −6.7
Botswana 1.2 0.6 3.2 9.6 3.4 0.0 37.5 33.4 −9.6
Burkina Faso 1.8 0.1 0.8 0.0 0.9 2.6 4.1 1.2 0.5 21.9 19.6 −1.6
Burundi 2.3 . 4.0 5.4 2.2 1.3 28.5 22.9 −4.7
Cabo Verde 2.4 0.0 0.8 0.2 2.2 3.6 5.0 0.6 0.2 30.0 26.2 −2.3
Cameroon 0.1 0.0 2.2 0.9 3.0 1.6 0.2 20.5 17.9 −2.3
Central African Republic
2.6 . 2.1 1.2 2.6 21.6 14.9 14.3 −0.1
Chad 0.4 . 2.0 2.8 2.8 1.5 17.1 12.2 −4.6
Comoros 0.7 0.8 . 2.2 4.3 0.2 27.3 31.6 4.4
Congo, Dem. Rep.
0.7 1.9 1.6 2.2 1.3 1.6 14.7 14.6 0.2
Congo, Rep. 0.0 4.5 4.2 6.2 7.2 0.1 46.2 27.8 −18.1
Côte d’Ivoire 0.1 0.2 0.7 2.6 1.7 5.0 1.2 0.2 24.1 21.1 −1.4
Ethiopia 0.7 1.2 2.9 4.5 0.7 1.0 18.6 16.1 −2.1
Gabon 0.2 0.0 0.0 0.0 2.4 2.7 1.4 0.0 22.6 21.3 0.8
Gambia, The n/a
(continued next page)
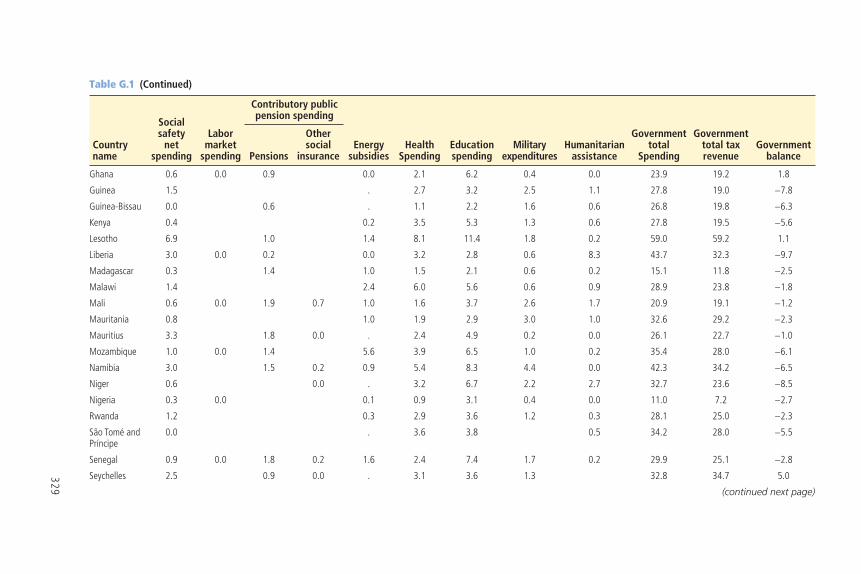
329
Table G.1 (Continued)
Country name
Social safety
net spending
Labor market
spending
Contributory public pension spending
Energy subsidies
Health Spending
Education spending
Military expenditures
Humanitarian assistance
Government total
Spending
Government total tax revenue
Government balancePensions
Other social
insurance
Ghana 0.6 0.0 0.9 0.0 2.1 6.2 0.4 0.0 23.9 19.2 1.8
Guinea 1.5 . 2.7 3.2 2.5 1.1 27.8 19.0 −7.8
Guinea-Bissau 0.0 0.6 . 1.1 2.2 1.6 0.6 26.8 19.8 −6.3
Kenya 0.4 0.2 3.5 5.3 1.3 0.6 27.8 19.5 −5.6
Lesotho 6.9 1.0 1.4 8.1 11.4 1.8 0.2 59.0 59.2 1.1
Liberia 3.0 0.0 0.2 0.0 3.2 2.8 0.6 8.3 43.7 32.3 −9.7
Madagascar 0.3 1.4 1.0 1.5 2.1 0.6 0.2 15.1 11.8 −2.5
Malawi 1.4 2.4 6.0 5.6 0.6 0.9 28.9 23.8 −1.8
Mali 0.6 0.0 1.9 0.7 1.0 1.6 3.7 2.6 1.7 20.9 19.1 −1.2
Mauritania 0.8 1.0 1.9 2.9 3.0 1.0 32.6 29.2 −2.3
Mauritius 3.3 1.8 0.0 . 2.4 4.9 0.2 0.0 26.1 22.7 −1.0
Mozambique 1.0 0.0 1.4 5.6 3.9 6.5 1.0 0.2 35.4 28.0 −6.1
Namibia 3.0 1.5 0.2 0.9 5.4 8.3 4.4 0.0 42.3 34.2 −6.5
Niger 0.6 0.0 . 3.2 6.7 2.2 2.7 32.7 23.6 −8.5
Nigeria 0.3 0.0 0.1 0.9 3.1 0.4 0.0 11.0 7.2 −2.7
Rwanda 1.2 0.3 2.9 3.6 1.2 0.3 28.1 25.0 −2.3
São Tomé and Príncipe
0.0 . 3.6 3.8 0.5 34.2 28.0 −5.5
Senegal 0.9 0.0 1.8 0.2 1.6 2.4 7.4 1.7 0.2 29.9 25.1 −2.8
Seychelles 2.5 0.9 0.0 . 3.1 3.6 1.3 32.8 34.7 5.0
(continued next page)
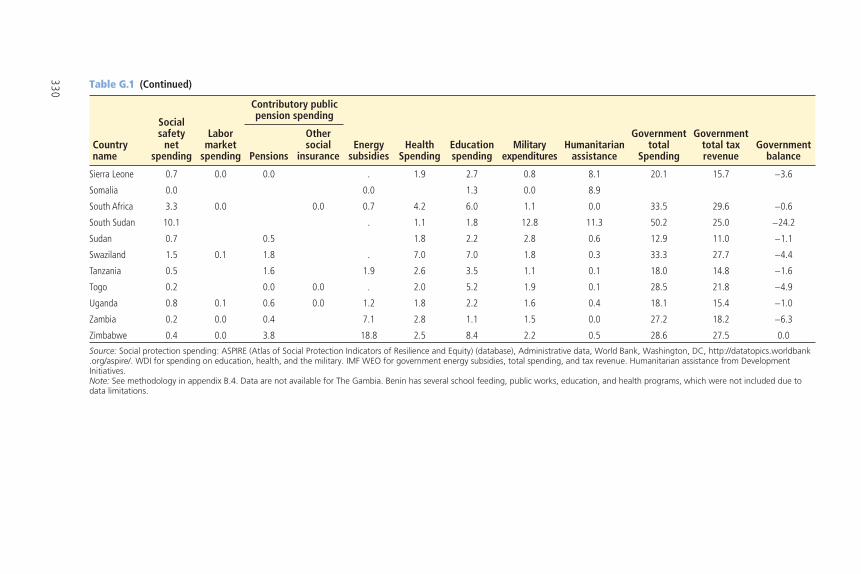
330 Table G.1 (Continued)
Country name
Social safety
net spending
Labor market
spending
Contributory public pension spending
Energy subsidies
Health Spending
Education spending
Military expenditures
Humanitarian assistance
Government total
Spending
Government total tax revenue
Government balancePensions
Other social
insurance
Sierra Leone 0.7 0.0 0.0 . 1.9 2.7 0.8 8.1 20.1 15.7 −3.6
Somalia 0.0 0.0 1.3 0.0 8.9
South Africa 3.3 0.0 0.0 0.7 4.2 6.0 1.1 0.0 33.5 29.6 −0.6
South Sudan 10.1 . 1.1 1.8 12.8 11.3 50.2 25.0 −24.2
Sudan 0.7 0.5 1.8 2.2 2.8 0.6 12.9 11.0 −1.1
Swaziland 1.5 0.1 1.8 . 7.0 7.0 1.8 0.3 33.3 27.7 −4.4
Tanzania 0.5 1.6 1.9 2.6 3.5 1.1 0.1 18.0 14.8 −1.6
Togo 0.2 0.0 0.0 . 2.0 5.2 1.9 0.1 28.5 21.8 −4.9
Uganda 0.8 0.1 0.6 0.0 1.2 1.8 2.2 1.6 0.4 18.1 15.4 −1.0
Zambia 0.2 0.0 0.4 7.1 2.8 1.1 1.5 0.0 27.2 18.2 −6.3
Zimbabwe 0.4 0.0 3.8 18.8 2.5 8.4 2.2 0.5 28.6 27.5 0.0
Source: Social protection spending: ASPIRE (Atlas of Social Protection Indicators of Resilience and Equity) (database), Administrative data, World Bank, Washington, DC, http://datatopics.worldbank .org/aspire/. WDI for spending on education, health, and the military. IMF WEO for government energy subsidies, total spending, and tax revenue. Humanitarian assistance from Development Initiatives.Note: See methodology in appendix B.4. Data are not available for The Gambia. Benin has several school feeding, public works, education, and health programs, which were not included due to data limitations.
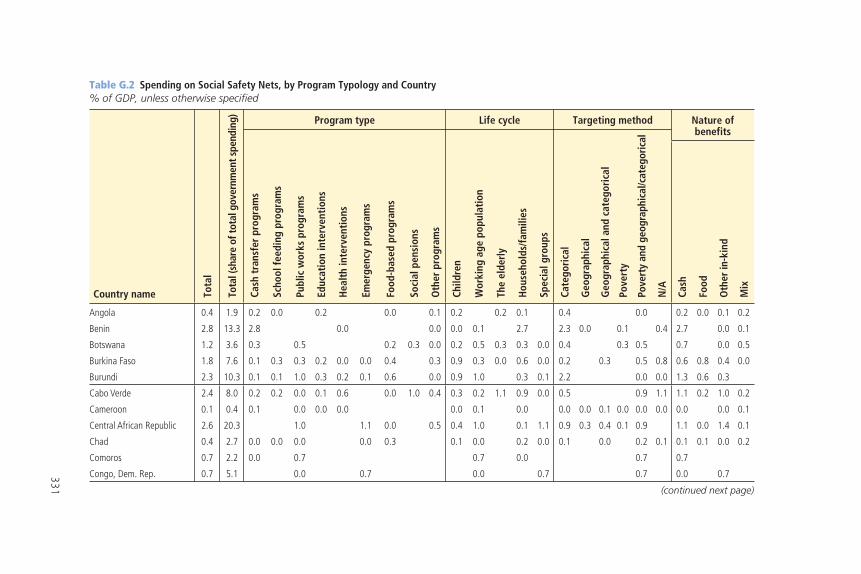
331
Table G.2 Spending on Social Safety Nets, by Program Typology and Country% of GDP, unless otherwise specified
Country name To
tal
Tota
l (sh
are
of to
tal g
over
nmen
t spe
ndin
g) Program type Life cycle Targeting method Nature of benefits
Cash
tra
nsfe
r pr
ogra
ms
Scho
ol fe
edin
g pr
ogra
ms
Publ
ic w
orks
pro
gram
s
Educ
atio
n in
terv
enti
ons
Hea
lth
inte
rven
tion
s
Emer
genc
y pr
ogra
ms
Food
-bas
ed p
rogr
ams
Soci
al p
ensi
ons
Oth
er p
rogr
ams
Child
ren
Wor
king
age
pop
ulat
ion
The
elde
rly
Hou
seho
lds/
fam
ilies
Spec
ial g
roup
s
Cate
gori
cal
Geo
grap
hica
l
Geo
grap
hica
l and
cat
egor
ical
Pove
rty
Pove
rty
and
geog
raph
ical
/cat
egor
ical
N/A
Cash
Food
Oth
er in
-kin
d
Mix
Angola 0.4 1.9 0.2 0.0 0.2 0.0 0.1 0.2 0.2 0.1 0.4 0.0 0.2 0.0 0.1 0.2
Benin 2.8 13.3 2.8 0.0 0.0 0.0 0.1 2.7 2.3 0.0 0.1 0.4 2.7 0.0 0.1
Botswana 1.2 3.6 0.3 0.5 0.2 0.3 0.0 0.2 0.5 0.3 0.3 0.0 0.4 0.3 0.5 0.7 0.0 0.5
Burkina Faso 1.8 7.6 0.1 0.3 0.3 0.2 0.0 0.0 0.4 0.3 0.9 0.3 0.0 0.6 0.0 0.2 0.3 0.5 0.8 0.6 0.8 0.4 0.0
Burundi 2.3 10.3 0.1 0.1 1.0 0.3 0.2 0.1 0.6 0.0 0.9 1.0 0.3 0.1 2.2 0.0 0.0 1.3 0.6 0.3
Cabo Verde 2.4 8.0 0.2 0.2 0.0 0.1 0.6 0.0 1.0 0.4 0.3 0.2 1.1 0.9 0.0 0.5 0.9 1.1 1.1 0.2 1.0 0.2
Cameroon 0.1 0.4 0.1 0.0 0.0 0.0 0.0 0.1 0.0 0.0 0.0 0.1 0.0 0.0 0.0 0.0 0.0 0.1
Central African Republic 2.6 20.3 1.0 1.1 0.0 0.5 0.4 1.0 0.1 1.1 0.9 0.3 0.4 0.1 0.9 1.1 0.0 1.4 0.1
Chad 0.4 2.7 0.0 0.0 0.0 0.0 0.3 0.1 0.0 0.2 0.0 0.1 0.0 0.2 0.1 0.1 0.1 0.0 0.2
Comoros 0.7 2.2 0.0 0.7 0.7 0.0 0.7 0.7
Congo, Dem. Rep. 0.7 5.1 0.0 0.7 0.0 0.7 0.7 0.0 0.7
(continued next page)
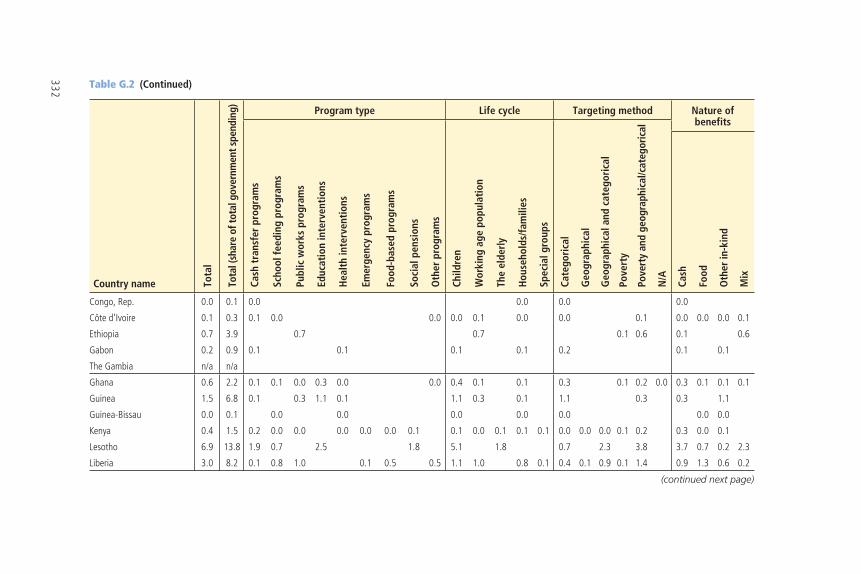
332 Table G.2 (Continued)
Country name To
tal
Tota
l (sh
are
of to
tal g
over
nmen
t spe
ndin
g) Program type Life cycle Targeting method Nature of benefits
Cash
tra
nsfe
r pr
ogra
ms
Scho
ol fe
edin
g pr
ogra
ms
Publ
ic w
orks
pro
gram
s
Educ
atio
n in
terv
enti
ons
Hea
lth
inte
rven
tion
s
Emer
genc
y pr
ogra
ms
Food
-bas
ed p
rogr
ams
Soci
al p
ensi
ons
Oth
er p
rogr
ams
Child
ren
Wor
king
age
pop
ulat
ion
The
elde
rly
Hou
seho
lds/
fam
ilies
Spec
ial g
roup
s
Cate
gori
cal
Geo
grap
hica
l
Geo
grap
hica
l and
cat
egor
ical
Pove
rty
Pove
rty
and
geog
raph
ical
/cat
egor
ical
N/A
Cash
Food
Oth
er in
-kin
d
Mix
Congo, Rep. 0.0 0.1 0.0 0.0 0.0 0.0
Côte d’Ivoire 0.1 0.3 0.1 0.0 0.0 0.0 0.1 0.0 0.0 0.1 0.0 0.0 0.0 0.1
Ethiopia 0.7 3.9 0.7 0.7 0.1 0.6 0.1 0.6
Gabon 0.2 0.9 0.1 0.1 0.1 0.1 0.2 0.1 0.1
The Gambia n/a n/a
Ghana 0.6 2.2 0.1 0.1 0.0 0.3 0.0 0.0 0.4 0.1 0.1 0.3 0.1 0.2 0.0 0.3 0.1 0.1 0.1
Guinea 1.5 6.8 0.1 0.3 1.1 0.1 1.1 0.3 0.1 1.1 0.3 0.3 1.1
Guinea-Bissau 0.0 0.1 0.0 0.0 0.0 0.0 0.0 0.0 0.0
Kenya 0.4 1.5 0.2 0.0 0.0 0.0 0.0 0.0 0.1 0.1 0.0 0.1 0.1 0.1 0.0 0.0 0.0 0.1 0.2 0.3 0.0 0.1
Lesotho 6.9 13.8 1.9 0.7 2.5 1.8 5.1 1.8 0.7 2.3 3.8 3.7 0.7 0.2 2.3
Liberia 3.0 8.2 0.1 0.8 1.0 0.1 0.5 0.5 1.1 1.0 0.8 0.1 0.4 0.1 0.9 0.1 1.4 0.9 1.3 0.6 0.2
(continued next page)
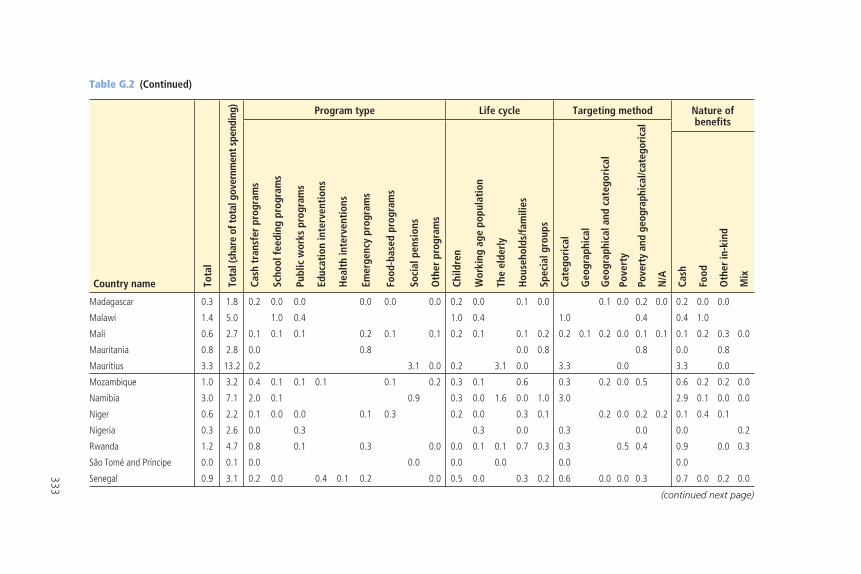
333
Table G.2 (Continued)
Country name To
tal
Tota
l (sh
are
of to
tal g
over
nmen
t spe
ndin
g) Program type Life cycle Targeting method Nature of benefits
Cash
tra
nsfe
r pr
ogra
ms
Scho
ol fe
edin
g pr
ogra
ms
Publ
ic w
orks
pro
gram
s
Educ
atio
n in
terv
enti
ons
Hea
lth
inte
rven
tion
s
Emer
genc
y pr
ogra
ms
Food
-bas
ed p
rogr
ams
Soci
al p
ensi
ons
Oth
er p
rogr
ams
Child
ren
Wor
king
age
pop
ulat
ion
The
elde
rly
Hou
seho
lds/
fam
ilies
Spec
ial g
roup
s
Cate
gori
cal
Geo
grap
hica
l
Geo
grap
hica
l and
cat
egor
ical
Pove
rty
Pove
rty
and
geog
raph
ical
/cat
egor
ical
N/A
Cash
Food
Oth
er in
-kin
d
Mix
Madagascar 0.3 1.8 0.2 0.0 0.0 0.0 0.0 0.0 0.2 0.0 0.1 0.0 0.1 0.0 0.2 0.0 0.2 0.0 0.0
Malawi 1.4 5.0 1.0 0.4 1.0 0.4 1.0 0.4 0.4 1.0
Mali 0.6 2.7 0.1 0.1 0.1 0.2 0.1 0.1 0.2 0.1 0.1 0.2 0.2 0.1 0.2 0.0 0.1 0.1 0.1 0.2 0.3 0.0
Mauritania 0.8 2.8 0.0 0.8 0.0 0.8 0.8 0.0 0.8
Mauritius 3.3 13.2 0.2 3.1 0.0 0.2 3.1 0.0 3.3 0.0 3.3 0.0
Mozambique 1.0 3.2 0.4 0.1 0.1 0.1 0.1 0.2 0.3 0.1 0.6 0.3 0.2 0.0 0.5 0.6 0.2 0.2 0.0
Namibia 3.0 7.1 2.0 0.1 0.9 0.3 0.0 1.6 0.0 1.0 3.0 2.9 0.1 0.0 0.0
Niger 0.6 2.2 0.1 0.0 0.0 0.1 0.3 0.2 0.0 0.3 0.1 0.2 0.0 0.2 0.2 0.1 0.4 0.1
Nigeria 0.3 2.6 0.0 0.3 0.3 0.0 0.3 0.0 0.0 0.2
Rwanda 1.2 4.7 0.8 0.1 0.3 0.0 0.0 0.1 0.1 0.7 0.3 0.3 0.5 0.4 0.9 0.0 0.3
São Tomé and Príncipe 0.0 0.1 0.0 0.0 0.0 0.0 0.0 0.0
Senegal 0.9 3.1 0.2 0.0 0.4 0.1 0.2 0.0 0.5 0.0 0.3 0.2 0.6 0.0 0.0 0.3 0.7 0.0 0.2 0.0
(continued next page)
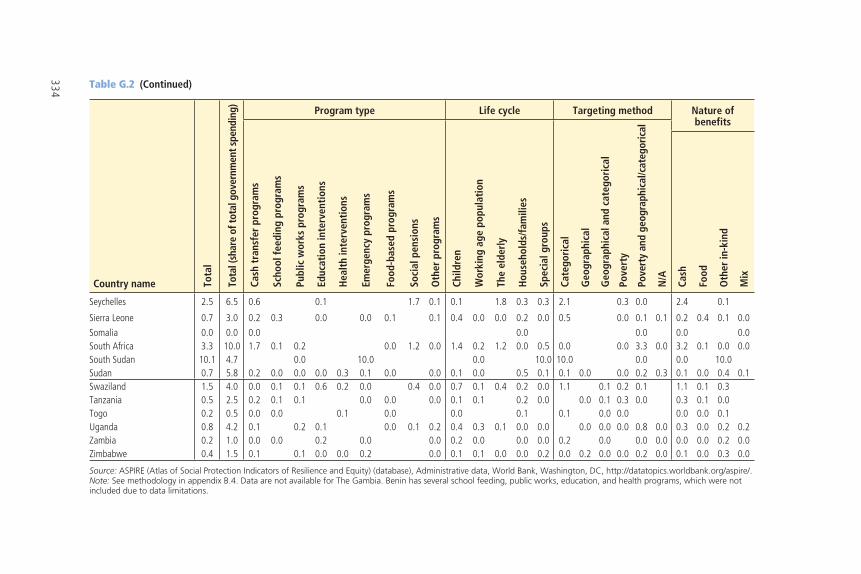
334 Table G.2 (Continued)
Country name To
tal
Tota
l (sh
are
of to
tal g
over
nmen
t spe
ndin
g) Program type Life cycle Targeting method Nature of benefits
Cash
tra
nsfe
r pr
ogra
ms
Scho
ol fe
edin
g pr
ogra
ms
Publ
ic w
orks
pro
gram
s
Educ
atio
n in
terv
enti
ons
Hea
lth
inte
rven
tion
s
Emer
genc
y pr
ogra
ms
Food
-bas
ed p
rogr
ams
Soci
al p
ensi
ons
Oth
er p
rogr
ams
Child
ren
Wor
king
age
pop
ulat
ion
The
elde
rly
Hou
seho
lds/
fam
ilies
Spec
ial g
roup
s
Cate
gori
cal
Geo
grap
hica
l
Geo
grap
hica
l and
cat
egor
ical
Pove
rty
Pove
rty
and
geog
raph
ical
/cat
egor
ical
N/A
Cash
Food
Oth
er in
-kin
d
Mix
Seychelles 2.5 6.5 0.6 0.1 1.7 0.1 0.1 1.8 0.3 0.3 2.1 0.3 0.0 2.4 0.1
Sierra Leone 0.7 3.0 0.2 0.3 0.0 0.0 0.1 0.1 0.4 0.0 0.0 0.2 0.0 0.5 0.0 0.1 0.1 0.2 0.4 0.1 0.0
Somalia 0.0 0.0 0.0 0.0 0.0 0.0 0.0South Africa 3.3 10.0 1.7 0.1 0.2 0.0 1.2 0.0 1.4 0.2 1.2 0.0 0.5 0.0 0.0 3.3 0.0 3.2 0.1 0.0 0.0South Sudan 10.1 4.7 0.0 10.0 0.0 10.0 10.0 0.0 0.0 10.0 Sudan 0.7 5.8 0.2 0.0 0.0 0.0 0.3 0.1 0.0 0.0 0.1 0.0 0.5 0.1 0.1 0.0 0.0 0.2 0.3 0.1 0.0 0.4 0.1Swaziland 1.5 4.0 0.0 0.1 0.1 0.6 0.2 0.0 0.4 0.0 0.7 0.1 0.4 0.2 0.0 1.1 0.1 0.2 0.1 1.1 0.1 0.3 Tanzania 0.5 2.5 0.2 0.1 0.1 0.0 0.0 0.0 0.1 0.1 0.2 0.0 0.0 0.1 0.3 0.0 0.3 0.1 0.0 Togo 0.2 0.5 0.0 0.0 0.1 0.0 0.0 0.1 0.1 0.0 0.0 0.0 0.0 0.1 Uganda 0.8 4.2 0.1 0.2 0.1 0.0 0.1 0.2 0.4 0.3 0.1 0.0 0.0 0.0 0.0 0.0 0.8 0.0 0.3 0.0 0.2 0.2Zambia 0.2 1.0 0.0 0.0 0.2 0.0 0.0 0.2 0.0 0.0 0.0 0.2 0.0 0.0 0.0 0.0 0.0 0.2 0.0Zimbabwe 0.4 1.5 0.1 0.1 0.0 0.0 0.2 0.0 0.1 0.1 0.0 0.0 0.2 0.0 0.2 0.0 0.0 0.2 0.0 0.1 0.0 0.3 0.0
Source: ASPIRE (Atlas of Social Protection Indicators of Resilience and Equity) (database), Administrative data, World Bank, Washington, DC, http://datatopics.worldbank.org/aspire/.Note: See methodology in appendix B.4. Data are not available for The Gambia. Benin has several school feeding, public works, education, and health programs, which were not included due to data limitations.
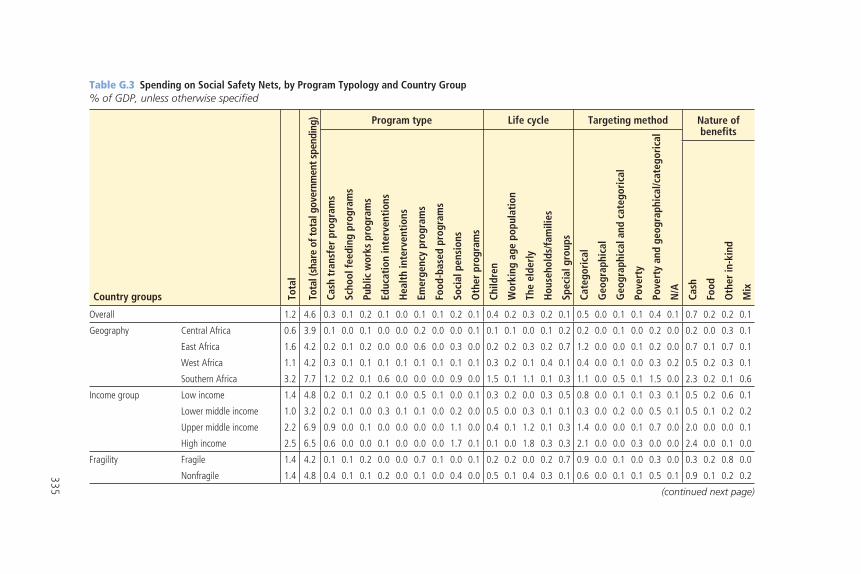
335
Table G.3 Spending on Social Safety Nets, by Program Typology and Country Group % of GDP, unless otherwise specified
Country groups Tota
l
Tota
l (sh
are
of to
tal g
over
nmen
t spe
ndin
g) Program type Life cycle Targeting method Nature of benefits
Cash
tra
nsfe
r pr
ogra
ms
Scho
ol fe
edin
g pr
ogra
ms
Publ
ic w
orks
pro
gram
s
Educ
atio
n in
terv
enti
ons
Hea
lth
inte
rven
tion
s
Emer
genc
y pr
ogra
ms
Food
-bas
ed p
rogr
ams
Soci
al p
ensi
ons
Oth
er p
rogr
ams
Child
ren
Wor
king
age
pop
ulat
ion
The
elde
rly
Hou
seho
lds/
fam
ilies
Spec
ial g
roup
s
Cate
gori
cal
Geo
grap
hica
l
Geo
grap
hica
l and
cat
egor
ical
Pove
rty
Pove
rty
and
geog
raph
ical
/cat
egor
ical
N/A
Cash
Food
Oth
er in
-kin
d
Mix
Overall 1.2 4.6 0.3 0.1 0.2 0.1 0.0 0.1 0.1 0.2 0.1 0.4 0.2 0.3 0.2 0.1 0.5 0.0 0.1 0.1 0.4 0.1 0.7 0.2 0.2 0.1
Geography Central Africa 0.6 3.9 0.1 0.0 0.1 0.0 0.0 0.2 0.0 0.0 0.1 0.1 0.1 0.0 0.1 0.2 0.2 0.0 0.1 0.0 0.2 0.0 0.2 0.0 0.3 0.1
East Africa 1.6 4.2 0.2 0.1 0.2 0.0 0.0 0.6 0.0 0.3 0.0 0.2 0.2 0.3 0.2 0.7 1.2 0.0 0.0 0.1 0.2 0.0 0.7 0.1 0.7 0.1
West Africa 1.1 4.2 0.3 0.1 0.1 0.1 0.1 0.1 0.1 0.1 0.1 0.3 0.2 0.1 0.4 0.1 0.4 0.0 0.1 0.0 0.3 0.2 0.5 0.2 0.3 0.1
Southern Africa 3.2 7.7 1.2 0.2 0.1 0.6 0.0 0.0 0.0 0.9 0.0 1.5 0.1 1.1 0.1 0.3 1.1 0.0 0.5 0.1 1.5 0.0 2.3 0.2 0.1 0.6
Income group Low income 1.4 4.8 0.2 0.1 0.2 0.1 0.0 0.5 0.1 0.0 0.1 0.3 0.2 0.0 0.3 0.5 0.8 0.0 0.1 0.1 0.3 0.1 0.5 0.2 0.6 0.1
Lower middle income 1.0 3.2 0.2 0.1 0.0 0.3 0.1 0.1 0.0 0.2 0.0 0.5 0.0 0.3 0.1 0.1 0.3 0.0 0.2 0.0 0.5 0.1 0.5 0.1 0.2 0.2
Upper middle income 2.2 6.9 0.9 0.0 0.1 0.0 0.0 0.0 0.0 1.1 0.0 0.4 0.1 1.2 0.1 0.3 1.4 0.0 0.0 0.1 0.7 0.0 2.0 0.0 0.0 0.1
High income 2.5 6.5 0.6 0.0 0.0 0.1 0.0 0.0 0.0 1.7 0.1 0.1 0.0 1.8 0.3 0.3 2.1 0.0 0.0 0.3 0.0 0.0 2.4 0.0 0.1 0.0
Fragility Fragile 1.4 4.2 0.1 0.1 0.2 0.0 0.0 0.7 0.1 0.0 0.1 0.2 0.2 0.0 0.2 0.7 0.9 0.0 0.1 0.0 0.3 0.0 0.3 0.2 0.8 0.0
Nonfragile 1.4 4.8 0.4 0.1 0.1 0.2 0.0 0.1 0.0 0.4 0.0 0.5 0.1 0.4 0.3 0.1 0.6 0.0 0.1 0.1 0.5 0.1 0.9 0.1 0.2 0.2
(continued next page)
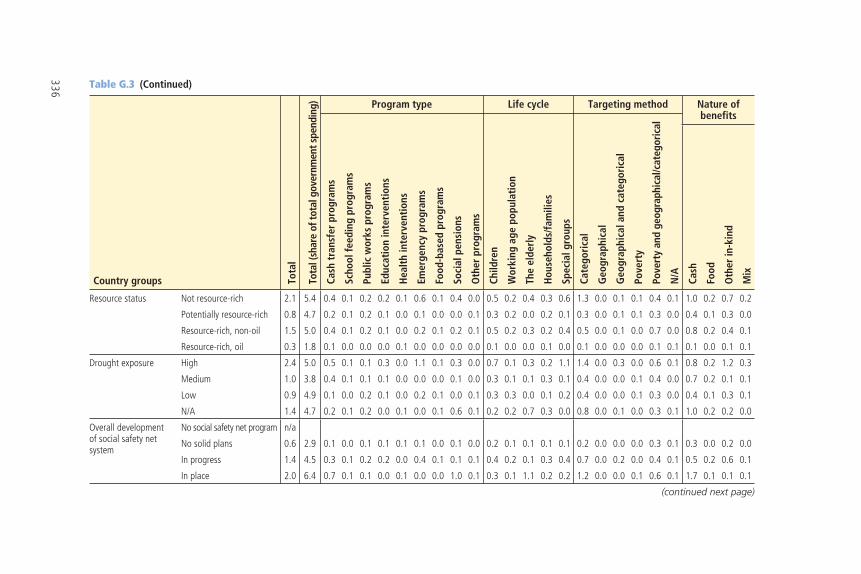
336 Table G.3 (Continued)
Country groups Tota
l
Tota
l (sh
are
of to
tal g
over
nmen
t spe
ndin
g) Program type Life cycle Targeting method Nature of benefits
Cash
tra
nsfe
r pr
ogra
ms
Scho
ol fe
edin
g pr
ogra
ms
Publ
ic w
orks
pro
gram
s
Educ
atio
n in
terv
enti
ons
Hea
lth
inte
rven
tion
s
Emer
genc
y pr
ogra
ms
Food
-bas
ed p
rogr
ams
Soci
al p
ensi
ons
Oth
er p
rogr
ams
Child
ren
Wor
king
age
pop
ulat
ion
The
elde
rly
Hou
seho
lds/
fam
ilies
Spec
ial g
roup
s
Cate
gori
cal
Geo
grap
hica
l
Geo
grap
hica
l and
cat
egor
ical
Pove
rty
Pove
rty
and
geog
raph
ical
/cat
egor
ical
N/A
Cash
Food
Oth
er in
-kin
d
Mix
Resource status Not resource-rich 2.1 5.4 0.4 0.1 0.2 0.2 0.1 0.6 0.1 0.4 0.0 0.5 0.2 0.4 0.3 0.6 1.3 0.0 0.1 0.1 0.4 0.1 1.0 0.2 0.7 0.2
Potentially resource-rich 0.8 4.7 0.2 0.1 0.2 0.1 0.0 0.1 0.0 0.0 0.1 0.3 0.2 0.0 0.2 0.1 0.3 0.0 0.1 0.1 0.3 0.0 0.4 0.1 0.3 0.0
Resource-rich, non-oil 1.5 5.0 0.4 0.1 0.2 0.1 0.0 0.2 0.1 0.2 0.1 0.5 0.2 0.3 0.2 0.4 0.5 0.0 0.1 0.0 0.7 0.0 0.8 0.2 0.4 0.1
Resource-rich, oil 0.3 1.8 0.1 0.0 0.0 0.0 0.1 0.0 0.0 0.0 0.0 0.1 0.0 0.0 0.1 0.0 0.1 0.0 0.0 0.0 0.1 0.1 0.1 0.0 0.1 0.1
Drought exposure High 2.4 5.0 0.5 0.1 0.1 0.3 0.0 1.1 0.1 0.3 0.0 0.7 0.1 0.3 0.2 1.1 1.4 0.0 0.3 0.0 0.6 0.1 0.8 0.2 1.2 0.3
Medium 1.0 3.8 0.4 0.1 0.1 0.1 0.0 0.0 0.0 0.1 0.0 0.3 0.1 0.1 0.3 0.1 0.4 0.0 0.0 0.1 0.4 0.0 0.7 0.2 0.1 0.1
Low 0.9 4.9 0.1 0.0 0.2 0.1 0.0 0.2 0.1 0.0 0.1 0.3 0.3 0.0 0.1 0.2 0.4 0.0 0.0 0.1 0.3 0.0 0.4 0.1 0.3 0.1
N/A 1.4 4.7 0.2 0.1 0.2 0.0 0.1 0.0 0.1 0.6 0.1 0.2 0.2 0.7 0.3 0.0 0.8 0.0 0.1 0.0 0.3 0.1 1.0 0.2 0.2 0.0
Overall development of social safety net system
No social safety net program n/a
No solid plans 0.6 2.9 0.1 0.0 0.1 0.1 0.1 0.1 0.0 0.1 0.0 0.2 0.1 0.1 0.1 0.1 0.2 0.0 0.0 0.0 0.3 0.1 0.3 0.0 0.2 0.0
In progress 1.4 4.5 0.3 0.1 0.2 0.2 0.0 0.4 0.1 0.1 0.1 0.4 0.2 0.1 0.3 0.4 0.7 0.0 0.2 0.0 0.4 0.1 0.5 0.2 0.6 0.1
In place 2.0 6.4 0.7 0.1 0.1 0.0 0.1 0.0 0.0 1.0 0.1 0.3 0.1 1.1 0.2 0.2 1.2 0.0 0.0 0.1 0.6 0.1 1.7 0.1 0.1 0.1
(continued next page)
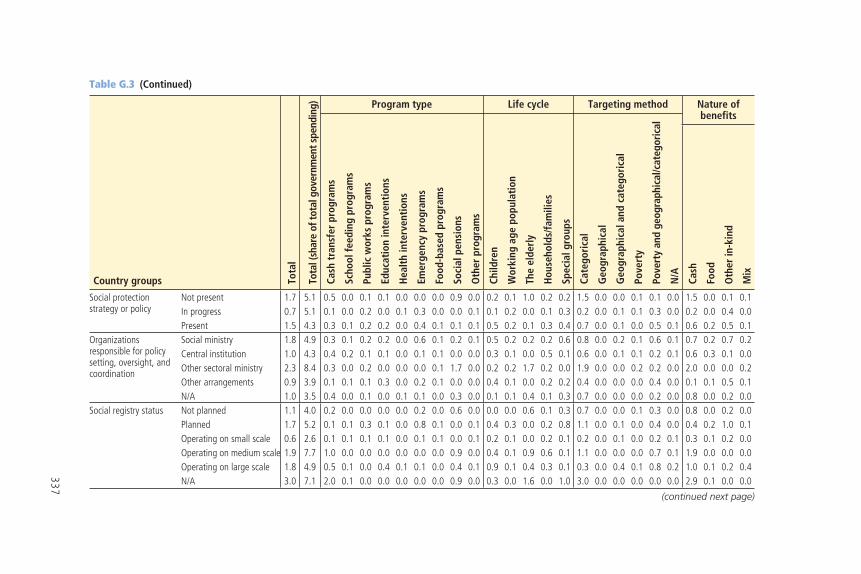
337
Table G.3 (Continued)
Country groups Tota
l
Tota
l (sh
are
of to
tal g
over
nmen
t spe
ndin
g) Program type Life cycle Targeting method Nature of benefits
Cash
tra
nsfe
r pr
ogra
ms
Scho
ol fe
edin
g pr
ogra
ms
Publ
ic w
orks
pro
gram
s
Educ
atio
n in
terv
enti
ons
Hea
lth
inte
rven
tion
s
Emer
genc
y pr
ogra
ms
Food
-bas
ed p
rogr
ams
Soci
al p
ensi
ons
Oth
er p
rogr
ams
Child
ren
Wor
king
age
pop
ulat
ion
The
elde
rly
Hou
seho
lds/
fam
ilies
Spec
ial g
roup
s
Cate
gori
cal
Geo
grap
hica
l
Geo
grap
hica
l and
cat
egor
ical
Pove
rty
Pove
rty
and
geog
raph
ical
/cat
egor
ical
N/A
Cash
Food
Oth
er in
-kin
d
Mix
Social protection strategy or policy
Not present 1.7 5.1 0.5 0.0 0.1 0.1 0.0 0.0 0.0 0.9 0.0 0.2 0.1 1.0 0.2 0.2 1.5 0.0 0.0 0.1 0.1 0.0 1.5 0.0 0.1 0.1In progress 0.7 5.1 0.1 0.0 0.2 0.0 0.1 0.3 0.0 0.0 0.1 0.1 0.2 0.0 0.1 0.3 0.2 0.0 0.1 0.1 0.3 0.0 0.2 0.0 0.4 0.0Present 1.5 4.3 0.3 0.1 0.2 0.2 0.0 0.4 0.1 0.1 0.1 0.5 0.2 0.1 0.3 0.4 0.7 0.0 0.1 0.0 0.5 0.1 0.6 0.2 0.5 0.1
Organizations responsible for policy setting, oversight, and coordination
Social ministry 1.8 4.9 0.3 0.1 0.2 0.2 0.0 0.6 0.1 0.2 0.1 0.5 0.2 0.2 0.2 0.6 0.8 0.0 0.2 0.1 0.6 0.1 0.7 0.2 0.7 0.2Central institution 1.0 4.3 0.4 0.2 0.1 0.1 0.0 0.1 0.1 0.0 0.0 0.3 0.1 0.0 0.5 0.1 0.6 0.0 0.1 0.1 0.2 0.1 0.6 0.3 0.1 0.0Other sectoral ministry 2.3 8.4 0.3 0.0 0.2 0.0 0.0 0.0 0.1 1.7 0.0 0.2 0.2 1.7 0.2 0.0 1.9 0.0 0.0 0.2 0.2 0.0 2.0 0.0 0.0 0.2Other arrangements 0.9 3.9 0.1 0.1 0.1 0.3 0.0 0.2 0.1 0.0 0.0 0.4 0.1 0.0 0.2 0.2 0.4 0.0 0.0 0.0 0.4 0.0 0.1 0.1 0.5 0.1N/A 1.0 3.5 0.4 0.0 0.1 0.0 0.1 0.1 0.0 0.3 0.0 0.1 0.1 0.4 0.1 0.3 0.7 0.0 0.0 0.0 0.2 0.0 0.8 0.0 0.2 0.0
Social registry status Not planned 1.1 4.0 0.2 0.0 0.0 0.0 0.0 0.2 0.0 0.6 0.0 0.0 0.0 0.6 0.1 0.3 0.7 0.0 0.0 0.1 0.3 0.0 0.8 0.0 0.2 0.0Planned 1.7 5.2 0.1 0.1 0.3 0.1 0.0 0.8 0.1 0.0 0.1 0.4 0.3 0.0 0.2 0.8 1.1 0.0 0.1 0.0 0.4 0.0 0.4 0.2 1.0 0.1Operating on small scale 0.6 2.6 0.1 0.1 0.1 0.1 0.0 0.1 0.1 0.0 0.1 0.2 0.1 0.0 0.2 0.1 0.2 0.0 0.1 0.0 0.2 0.1 0.3 0.1 0.2 0.0Operating on medium scale 1.9 7.7 1.0 0.0 0.0 0.0 0.0 0.0 0.0 0.9 0.0 0.4 0.1 0.9 0.6 0.1 1.1 0.0 0.0 0.0 0.7 0.1 1.9 0.0 0.0 0.0Operating on large scale 1.8 4.9 0.5 0.1 0.0 0.4 0.1 0.1 0.0 0.4 0.1 0.9 0.1 0.4 0.3 0.1 0.3 0.0 0.4 0.1 0.8 0.2 1.0 0.1 0.2 0.4N/A 3.0 7.1 2.0 0.1 0.0 0.0 0.0 0.0 0.0 0.9 0.0 0.3 0.0 1.6 0.0 1.0 3.0 0.0 0.0 0.0 0.0 0.0 2.9 0.1 0.0 0.0
(continued next page)
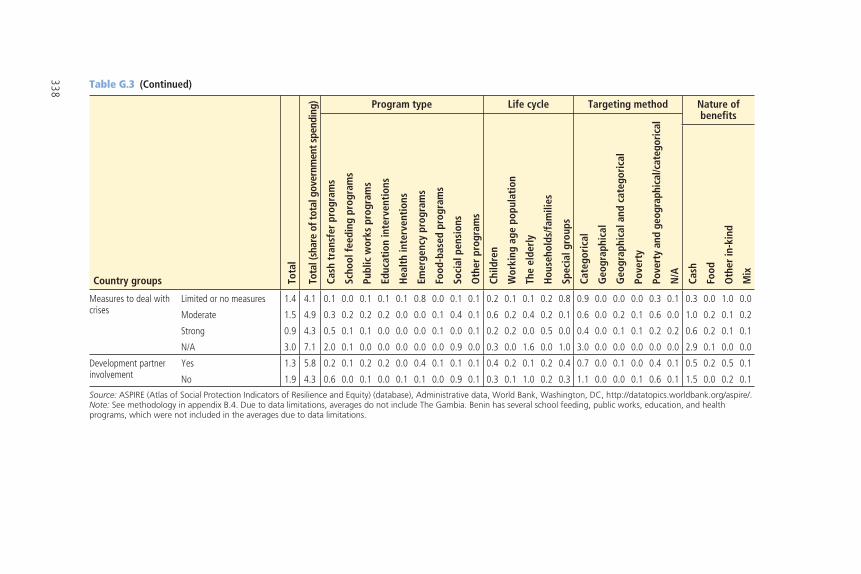
338 Table G.3 (Continued)
Country groups Tota
l
Tota
l (sh
are
of to
tal g
over
nmen
t spe
ndin
g) Program type Life cycle Targeting method Nature of benefits
Cash
tra
nsfe
r pr
ogra
ms
Scho
ol fe
edin
g pr
ogra
ms
Publ
ic w
orks
pro
gram
s
Educ
atio
n in
terv
enti
ons
Hea
lth
inte
rven
tion
s
Emer
genc
y pr
ogra
ms
Food
-bas
ed p
rogr
ams
Soci
al p
ensi
ons
Oth
er p
rogr
ams
Child
ren
Wor
king
age
pop
ulat
ion
The
elde
rly
Hou
seho
lds/
fam
ilies
Spec
ial g
roup
s
Cate
gori
cal
Geo
grap
hica
l
Geo
grap
hica
l and
cat
egor
ical
Pove
rty
Pove
rty
and
geog
raph
ical
/cat
egor
ical
N/A
Cash
Food
Oth
er in
-kin
d
Mix
Measures to deal with crises
Limited or no measures 1.4 4.1 0.1 0.0 0.1 0.1 0.1 0.8 0.0 0.1 0.1 0.2 0.1 0.1 0.2 0.8 0.9 0.0 0.0 0.0 0.3 0.1 0.3 0.0 1.0 0.0
Moderate 1.5 4.9 0.3 0.2 0.2 0.2 0.0 0.0 0.1 0.4 0.1 0.6 0.2 0.4 0.2 0.1 0.6 0.0 0.2 0.1 0.6 0.0 1.0 0.2 0.1 0.2
Strong 0.9 4.3 0.5 0.1 0.1 0.0 0.0 0.0 0.1 0.0 0.1 0.2 0.2 0.0 0.5 0.0 0.4 0.0 0.1 0.1 0.2 0.2 0.6 0.2 0.1 0.1
N/A 3.0 7.1 2.0 0.1 0.0 0.0 0.0 0.0 0.0 0.9 0.0 0.3 0.0 1.6 0.0 1.0 3.0 0.0 0.0 0.0 0.0 0.0 2.9 0.1 0.0 0.0
Development partner involvement
Yes 1.3 5.8 0.2 0.1 0.2 0.2 0.0 0.4 0.1 0.1 0.1 0.4 0.2 0.1 0.2 0.4 0.7 0.0 0.1 0.0 0.4 0.1 0.5 0.2 0.5 0.1
No 1.9 4.3 0.6 0.0 0.1 0.0 0.1 0.1 0.0 0.9 0.1 0.3 0.1 1.0 0.2 0.3 1.1 0.0 0.0 0.1 0.6 0.1 1.5 0.0 0.2 0.1
Source: ASPIRE (Atlas of Social Protection Indicators of Resilience and Equity) (database), Administrative data, World Bank, Washington, DC, http://datatopics.worldbank.org/aspire/.Note: See methodology in appendix B.4. Due to data limitations, averages do not include The Gambia. Benin has several school feeding, public works, education, and health programs, which were not included in the averages due to data limitations.
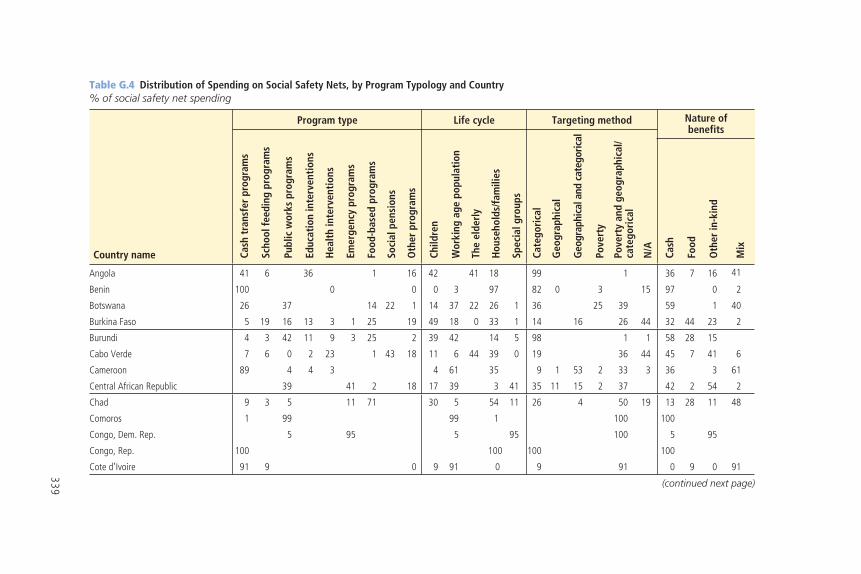
339
Table G.4 Distribution of Spending on Social Safety Nets, by Program Typology and Country% of social safety net spending
Country name
Program type Life cycle Targeting method Nature of benefits
Cash
tra
nsfe
r pr
ogra
ms
Scho
ol fe
edin
g pr
ogra
ms
Publ
ic w
orks
pro
gram
s
Educ
atio
n in
terv
enti
ons
Hea
lth
inte
rven
tion
s
Emer
genc
y pr
ogra
ms
Food
-bas
ed p
rogr
ams
Soci
al p
ensi
ons
Oth
er p
rogr
ams
Child
ren
Wor
king
age
pop
ulat
ion
The
elde
rly
Hou
seho
lds/
fam
ilies
Spec
ial g
roup
s
Cate
gori
cal
Geo
grap
hica
l
Geo
grap
hica
l and
cat
egor
ical
Pove
rty
Pove
rty
and
geog
raph
ical
/ca
tego
rica
l
N/A
Cash
Food
Oth
er in
-kin
d
Mix
Angola 41 6 36 1 16 42 41 18 99 1 36 7 16 41
Benin 100 0 0 0 3 97 82 0 3 15 97 0 2
Botswana 26 37 14 22 1 14 37 22 26 1 36 25 39 59 1 40
Burkina Faso 5 19 16 13 3 1 25 19 49 18 0 33 1 14 16 26 44 32 44 23 2
Burundi 4 3 42 11 9 3 25 2 39 42 14 5 98 1 1 58 28 15
Cabo Verde 7 6 0 2 23 1 43 18 11 6 44 39 0 19 36 44 45 7 41 6
Cameroon 89 4 4 3 4 61 35 9 1 53 2 33 3 36 3 61
Central African Republic 39 41 2 18 17 39 3 41 35 11 15 2 37 42 2 54 2
Chad 9 3 5 11 71 30 5 54 11 26 4 50 19 13 28 11 48
Comoros 1 99 99 1 100 100
Congo, Dem. Rep. 5 95 5 95 100 5 95
Congo, Rep. 100 100 100 100
Cote d’Ivoire 91 9 0 9 91 0 9 91 0 9 0 91
(continued next page)
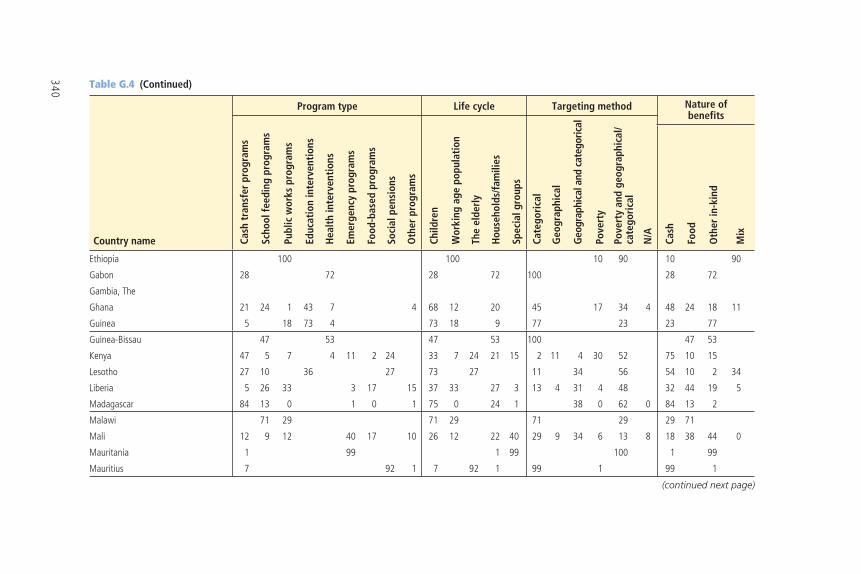
340 Table G.4 (Continued)
Country name
Program type Life cycle Targeting method Nature of benefits
Cash
tra
nsfe
r pr
ogra
ms
Scho
ol fe
edin
g pr
ogra
ms
Publ
ic w
orks
pro
gram
s
Educ
atio
n in
terv
enti
ons
Hea
lth
inte
rven
tion
s
Emer
genc
y pr
ogra
ms
Food
-bas
ed p
rogr
ams
Soci
al p
ensi
ons
Oth
er p
rogr
ams
Child
ren
Wor
king
age
pop
ulat
ion
The
elde
rly
Hou
seho
lds/
fam
ilies
Spec
ial g
roup
s
Cate
gori
cal
Geo
grap
hica
l
Geo
grap
hica
l and
cat
egor
ical
Pove
rty
Pove
rty
and
geog
raph
ical
/ca
tego
rica
l
N/A
Cash
Food
Oth
er in
-kin
d
Mix
Ethiopia 100 100 10 90 10 90
Gabon 28 72 28 72 100 28 72
Gambia, The
Ghana 21 24 1 43 7 4 68 12 20 45 17 34 4 48 24 18 11
Guinea 5 18 73 4 73 18 9 77 23 23 77
Guinea-Bissau 47 53 47 53 100 47 53
Kenya 47 5 7 4 11 2 24 33 7 24 21 15 2 11 4 30 52 75 10 15
Lesotho 27 10 36 27 73 27 11 34 56 54 10 2 34
Liberia 5 26 33 3 17 15 37 33 27 3 13 4 31 4 48 32 44 19 5
Madagascar 84 13 0 1 0 1 75 0 24 1 38 0 62 0 84 13 2
Malawi 71 29 71 29 71 29 29 71
Mali 12 9 12 40 17 10 26 12 22 40 29 9 34 6 13 8 18 38 44 0
Mauritania 1 99 1 99 100 1 99
Mauritius 7 92 1 7 92 1 99 1 99 1
(continued next page)
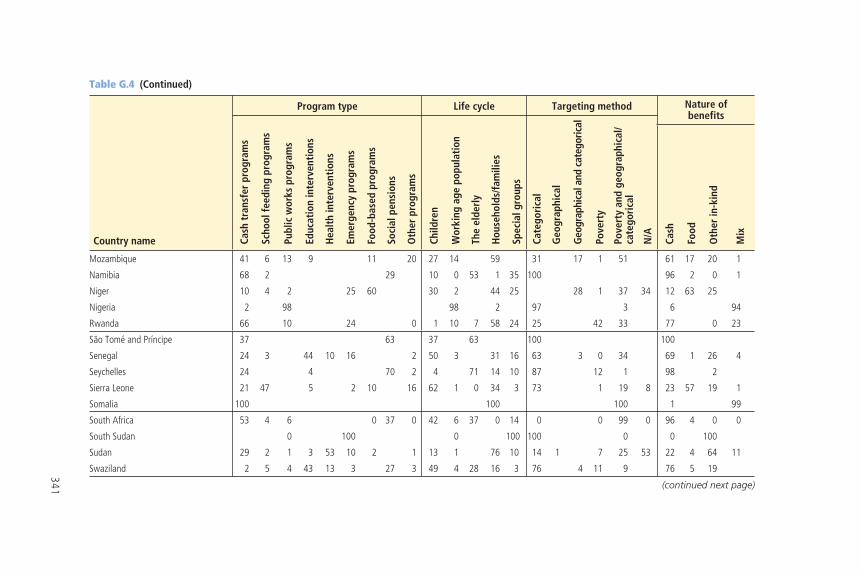
341
Table G.4 (Continued)
Country name
Program type Life cycle Targeting method Nature of benefits
Cash
tra
nsfe
r pr
ogra
ms
Scho
ol fe
edin
g pr
ogra
ms
Publ
ic w
orks
pro
gram
s
Educ
atio
n in
terv
enti
ons
Hea
lth
inte
rven
tion
s
Emer
genc
y pr
ogra
ms
Food
-bas
ed p
rogr
ams
Soci
al p
ensi
ons
Oth
er p
rogr
ams
Child
ren
Wor
king
age
pop
ulat
ion
The
elde
rly
Hou
seho
lds/
fam
ilies
Spec
ial g
roup
s
Cate
gori
cal
Geo
grap
hica
l
Geo
grap
hica
l and
cat
egor
ical
Pove
rty
Pove
rty
and
geog
raph
ical
/ca
tego
rica
l
N/A
Cash
Food
Oth
er in
-kin
d
Mix
Mozambique 41 6 13 9 11 20 27 14 59 31 17 1 51 61 17 20 1
Namibia 68 2 29 10 0 53 1 35 100 96 2 0 1
Niger 10 4 2 25 60 30 2 44 25 28 1 37 34 12 63 25
Nigeria 2 98 98 2 97 3 6 94
Rwanda 66 10 24 0 1 10 7 58 24 25 42 33 77 0 23
São Tomé and Príncipe 37 63 37 63 100 100
Senegal 24 3 44 10 16 2 50 3 31 16 63 3 0 34 69 1 26 4
Seychelles 24 4 70 2 4 71 14 10 87 12 1 98 2
Sierra Leone 21 47 5 2 10 16 62 1 0 34 3 73 1 19 8 23 57 19 1
Somalia 100 100 100 1 99
South Africa 53 4 6 0 37 0 42 6 37 0 14 0 0 99 0 96 4 0 0
South Sudan 0 100 0 100 100 0 0 100
Sudan 29 2 1 3 53 10 2 1 13 1 76 10 14 1 7 25 53 22 4 64 11
Swaziland 2 5 4 43 13 3 27 3 49 4 28 16 3 76 4 11 9 76 5 19
(continued next page)
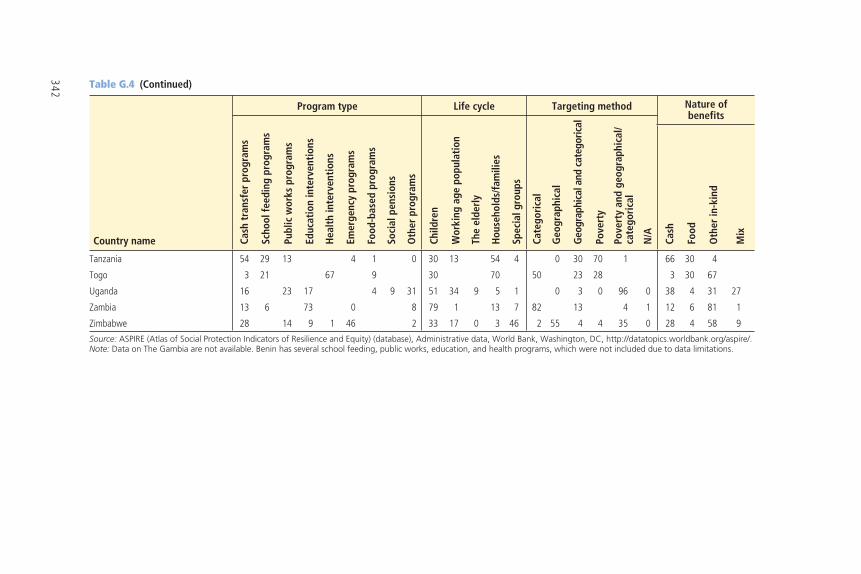
342 Table G.4 (Continued)
Country name
Program type Life cycle Targeting method Nature of benefits
Cash
tra
nsfe
r pr
ogra
ms
Scho
ol fe
edin
g pr
ogra
ms
Publ
ic w
orks
pro
gram
s
Educ
atio
n in
terv
enti
ons
Hea
lth
inte
rven
tion
s
Emer
genc
y pr
ogra
ms
Food
-bas
ed p
rogr
ams
Soci
al p
ensi
ons
Oth
er p
rogr
ams
Child
ren
Wor
king
age
pop
ulat
ion
The
elde
rly
Hou
seho
lds/
fam
ilies
Spec
ial g
roup
s
Cate
gori
cal
Geo
grap
hica
l
Geo
grap
hica
l and
cat
egor
ical
Pove
rty
Pove
rty
and
geog
raph
ical
/ca
tego
rica
l
N/A
Cash
Food
Oth
er in
-kin
d
Mix
Tanzania 54 29 13 4 1 0 30 13 54 4 0 30 70 1 66 30 4
Togo 3 21 67 9 30 70 50 23 28 3 30 67
Uganda 16 23 17 4 9 31 51 34 9 5 1 0 3 0 96 0 38 4 31 27
Zambia 13 6 73 0 8 79 1 13 7 82 13 4 1 12 6 81 1
Zimbabwe 28 14 9 1 46 2 33 17 0 3 46 2 55 4 4 35 0 28 4 58 9
Source: ASPIRE (Atlas of Social Protection Indicators of Resilience and Equity) (database), Administrative data, World Bank, Washington, DC, http://datatopics.worldbank.org/aspire/.Note: Data on The Gambia are not available. Benin has several school feeding, public works, education, and health programs, which were not included due to data limitations.
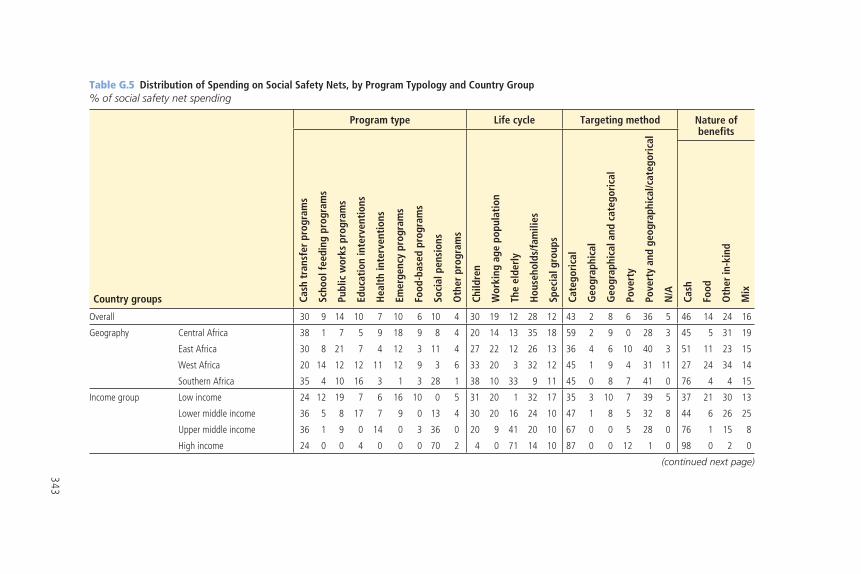
343
Table G.5 Distribution of Spending on Social Safety Nets, by Program Typology and Country Group% of social safety net spending
Country groups
Program type Life cycle Targeting method Nature of benefits
Cash
tra
nsfe
r pr
ogra
ms
Scho
ol fe
edin
g pr
ogra
ms
Publ
ic w
orks
pro
gram
s
Educ
atio
n in
terv
enti
ons
Hea
lth
inte
rven
tion
s
Emer
genc
y pr
ogra
ms
Food
-bas
ed p
rogr
ams
Soci
al p
ensi
ons
Oth
er p
rogr
ams
Child
ren
Wor
king
age
pop
ulat
ion
The
elde
rly
Hou
seho
lds/
fam
ilies
Spec
ial g
roup
s
Cate
gori
cal
Geo
grap
hica
l
Geo
grap
hica
l and
cat
egor
ical
Pove
rty
Pove
rty
and
geog
raph
ical
/cat
egor
ical
N/A
Cash
Food
Oth
er in
-kin
d
Mix
Overall 30 9 14 10 7 10 6 10 4 30 19 12 28 12 43 2 8 6 36 5 46 14 24 16
Geography Central Africa 38 1 7 5 9 18 9 8 4 20 14 13 35 18 59 2 9 0 28 3 45 5 31 19
East Africa 30 8 21 7 4 12 3 11 4 27 22 12 26 13 36 4 6 10 40 3 51 11 23 15
West Africa 20 14 12 12 11 12 9 3 6 33 20 3 32 12 45 1 9 4 31 11 27 24 34 14
Southern Africa 35 4 10 16 3 1 3 28 1 38 10 33 9 11 45 0 8 7 41 0 76 4 4 15
Income group Low income 24 12 19 7 6 16 10 0 5 31 20 1 32 17 35 3 10 7 39 5 37 21 30 13
Lower middle income 36 5 8 17 7 9 0 13 4 30 20 16 24 10 47 1 8 5 32 8 44 6 26 25
Upper middle income 36 1 9 0 14 0 3 36 0 20 9 41 20 10 67 0 0 5 28 0 76 1 15 8
High income 24 0 0 4 0 0 0 70 2 4 0 71 14 10 87 0 0 12 1 0 98 0 2 0
(continued next page)
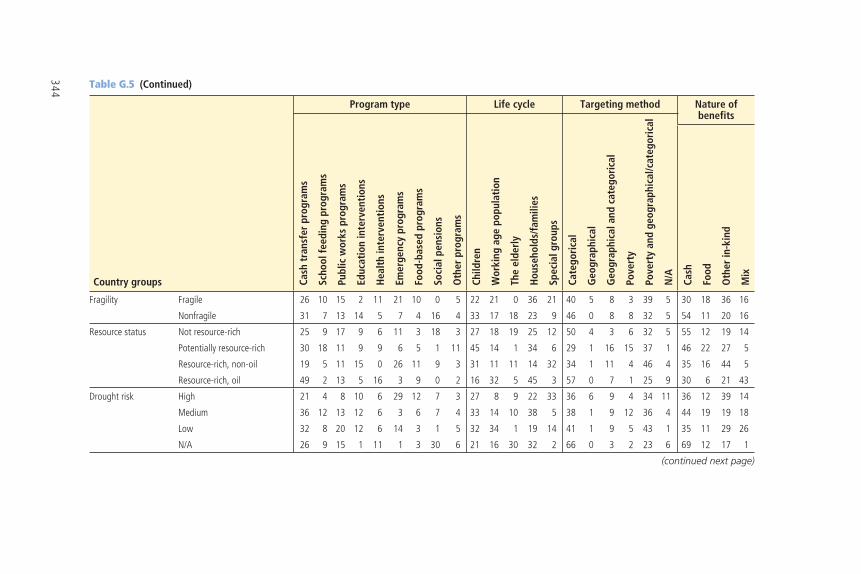
344 Table G.5 (Continued)
Country groups
Program type Life cycle Targeting method Nature of benefits
Cash
tra
nsfe
r pr
ogra
ms
Scho
ol fe
edin
g pr
ogra
ms
Publ
ic w
orks
pro
gram
s
Educ
atio
n in
terv
enti
ons
Hea
lth
inte
rven
tion
s
Emer
genc
y pr
ogra
ms
Food
-bas
ed p
rogr
ams
Soci
al p
ensi
ons
Oth
er p
rogr
ams
Child
ren
Wor
king
age
pop
ulat
ion
The
elde
rly
Hou
seho
lds/
fam
ilies
Spec
ial g
roup
s
Cate
gori
cal
Geo
grap
hica
l
Geo
grap
hica
l and
cat
egor
ical
Pove
rty
Pove
rty
and
geog
raph
ical
/cat
egor
ical
N/A
Cash
Food
Oth
er in
-kin
d
Mix
Fragility Fragile 26 10 15 2 11 21 10 0 5 22 21 0 36 21 40 5 8 3 39 5 30 18 36 16
Nonfragile 31 7 13 14 5 7 4 16 4 33 17 18 23 9 46 0 8 8 32 5 54 11 20 16
Resource status Not resource-rich 25 9 17 9 6 11 3 18 3 27 18 19 25 12 50 4 3 6 32 5 55 12 19 14
Potentially resource-rich 30 18 11 9 9 6 5 1 11 45 14 1 34 6 29 1 16 15 37 1 46 22 27 5
Resource-rich, non-oil 19 5 11 15 0 26 11 9 3 31 11 11 14 32 34 1 11 4 46 4 35 16 44 5
Resource-rich, oil 49 2 13 5 16 3 9 0 2 16 32 5 45 3 57 0 7 1 25 9 30 6 21 43
Drought risk High 21 4 8 10 6 29 12 7 3 27 8 9 22 33 36 6 9 4 34 11 36 12 39 14
Medium 36 12 13 12 6 3 6 7 4 33 14 10 38 5 38 1 9 12 36 4 44 19 19 18
Low 32 8 20 12 6 14 3 1 5 32 34 1 19 14 41 1 9 5 43 1 35 11 29 26
N/A 26 9 15 1 11 1 3 30 6 21 16 30 32 2 66 0 3 2 23 6 69 12 17 1
(continued next page)
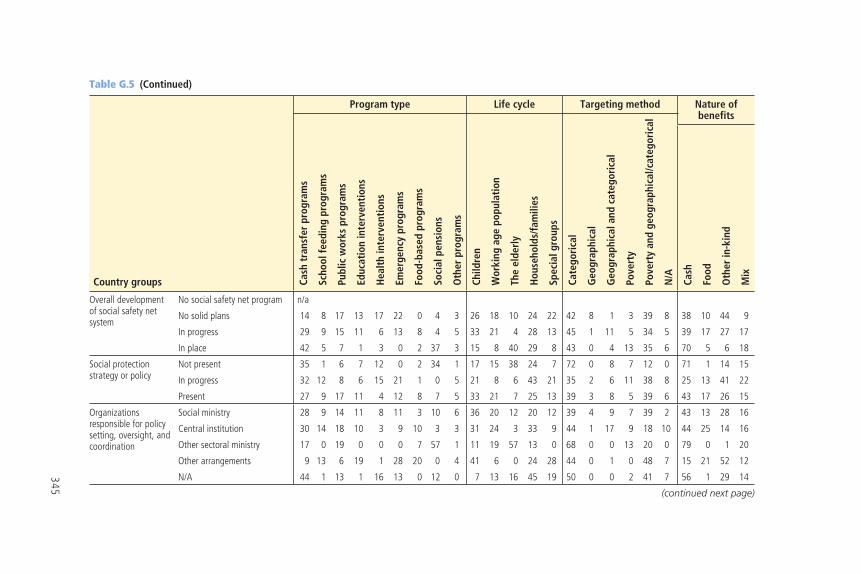
345
Table G.5 (Continued)
Country groups
Program type Life cycle Targeting method Nature of benefits
Cash
tra
nsfe
r pr
ogra
ms
Scho
ol fe
edin
g pr
ogra
ms
Publ
ic w
orks
pro
gram
s
Educ
atio
n in
terv
enti
ons
Hea
lth
inte
rven
tion
s
Emer
genc
y pr
ogra
ms
Food
-bas
ed p
rogr
ams
Soci
al p
ensi
ons
Oth
er p
rogr
ams
Child
ren
Wor
king
age
pop
ulat
ion
The
elde
rly
Hou
seho
lds/
fam
ilies
Spec
ial g
roup
s
Cate
gori
cal
Geo
grap
hica
l
Geo
grap
hica
l and
cat
egor
ical
Pove
rty
Pove
rty
and
geog
raph
ical
/cat
egor
ical
N/A
Cash
Food
Oth
er in
-kin
d
Mix
Overall development of social safety net system
No social safety net program n/a
No solid plans 14 8 17 13 17 22 0 4 3 26 18 10 24 22 42 8 1 3 39 8 38 10 44 9
In progress 29 9 15 11 6 13 8 4 5 33 21 4 28 13 45 1 11 5 34 5 39 17 27 17
In place 42 5 7 1 3 0 2 37 3 15 8 40 29 8 43 0 4 13 35 6 70 5 6 18
Social protection strategy or policy
Not present 35 1 6 7 12 0 2 34 1 17 15 38 24 7 72 0 8 7 12 0 71 1 14 15
In progress 32 12 8 6 15 21 1 0 5 21 8 6 43 21 35 2 6 11 38 8 25 13 41 22
Present 27 9 17 11 4 12 8 7 5 33 21 7 25 13 39 3 8 5 39 6 43 17 26 15
Organizations responsible for policy setting, oversight, and coordination
Social ministry 28 9 14 11 8 11 3 10 6 36 20 12 20 12 39 4 9 7 39 2 43 13 28 16
Central institution 30 14 18 10 3 9 10 3 3 31 24 3 33 9 44 1 17 9 18 10 44 25 14 16
Other sectoral ministry 17 0 19 0 0 0 7 57 1 11 19 57 13 0 68 0 0 13 20 0 79 0 1 20
Other arrangements 9 13 6 19 1 28 20 0 4 41 6 0 24 28 44 0 1 0 48 7 15 21 52 12
N/A 44 1 13 1 16 13 0 12 0 7 13 16 45 19 50 0 0 2 41 7 56 1 29 14
(continued next page)
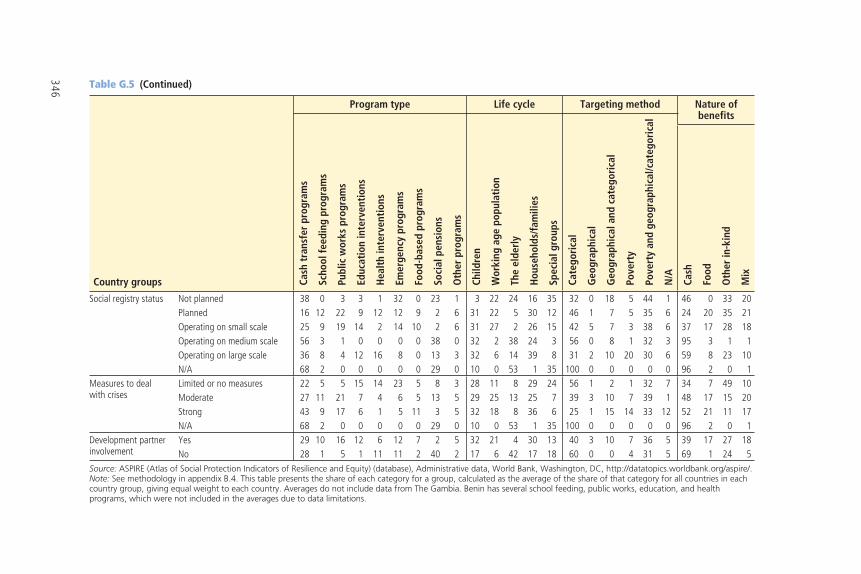
346 Table G.5 (Continued)
Country groups
Program type Life cycle Targeting method Nature of benefits
Cash
tra
nsfe
r pr
ogra
ms
Scho
ol fe
edin
g pr
ogra
ms
Publ
ic w
orks
pro
gram
s
Educ
atio
n in
terv
enti
ons
Hea
lth
inte
rven
tion
s
Emer
genc
y pr
ogra
ms
Food
-bas
ed p
rogr
ams
Soci
al p
ensi
ons
Oth
er p
rogr
ams
Child
ren
Wor
king
age
pop
ulat
ion
The
elde
rly
Hou
seho
lds/
fam
ilies
Spec
ial g
roup
s
Cate
gori
cal
Geo
grap
hica
l
Geo
grap
hica
l and
cat
egor
ical
Pove
rty
Pove
rty
and
geog
raph
ical
/cat
egor
ical
N/A
Cash
Food
Oth
er in
-kin
d
Mix
Social registry status Not planned 38 0 3 3 1 32 0 23 1 3 22 24 16 35 32 0 18 5 44 1 46 0 33 20Planned 16 12 22 9 12 12 9 2 6 31 22 5 30 12 46 1 7 5 35 6 24 20 35 21Operating on small scale 25 9 19 14 2 14 10 2 6 31 27 2 26 15 42 5 7 3 38 6 37 17 28 18Operating on medium scale 56 3 1 0 0 0 0 38 0 32 2 38 24 3 56 0 8 1 32 3 95 3 1 1Operating on large scale 36 8 4 12 16 8 0 13 3 32 6 14 39 8 31 2 10 20 30 6 59 8 23 10N/A 68 2 0 0 0 0 0 29 0 10 0 53 1 35 100 0 0 0 0 0 96 2 0 1
Measures to deal with crises
Limited or no measures 22 5 5 15 14 23 5 8 3 28 11 8 29 24 56 1 2 1 32 7 34 7 49 10Moderate 27 11 21 7 4 6 5 13 5 29 25 13 25 7 39 3 10 7 39 1 48 17 15 20Strong 43 9 17 6 1 5 11 3 5 32 18 8 36 6 25 1 15 14 33 12 52 21 11 17N/A 68 2 0 0 0 0 0 29 0 10 0 53 1 35 100 0 0 0 0 0 96 2 0 1
Development partner involvement
Yes 29 10 16 12 6 12 7 2 5 32 21 4 30 13 40 3 10 7 36 5 39 17 27 18No 28 1 5 1 11 11 2 40 2 17 6 42 17 18 60 0 0 4 31 5 69 1 24 5
Source: ASPIRE (Atlas of Social Protection Indicators of Resilience and Equity) (database), Administrative data, World Bank, Washington, DC, http://datatopics.worldbank.org/aspire/.Note: See methodology in appendix B.4. This table presents the share of each category for a group, calculated as the average of the share of that category for all countries in each country group, giving equal weight to each country. Averages do not include data from The Gambia. Benin has several school feeding, public works, education, and health programs, which were not included in the averages due to data limitations.
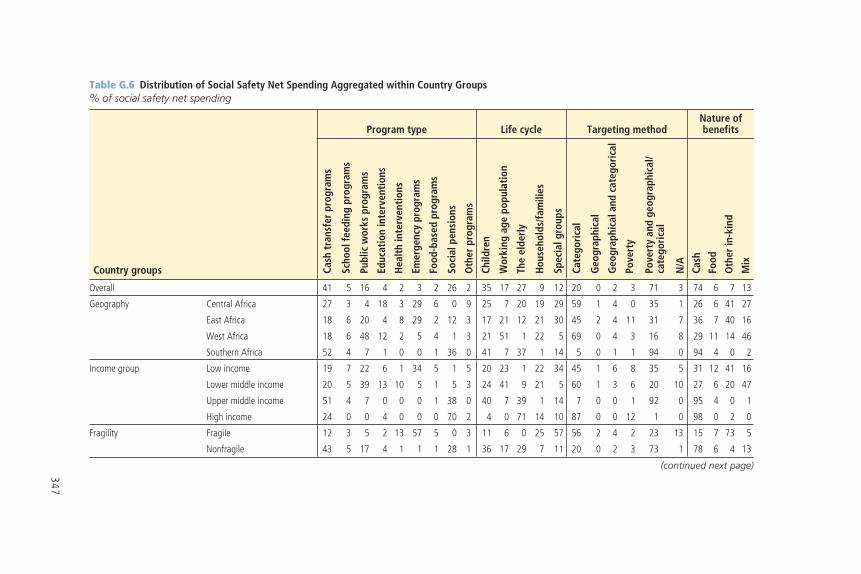
347
Table G.6 Distribution of Social Safety Net Spending Aggregated within Country Groups% of social safety net spending
Country groups
Program type Life cycle Targeting method Nature of benefits
Cash
tra
nsfe
r pr
ogra
ms
Scho
ol fe
edin
g pr
ogra
ms
Publ
ic w
orks
pro
gram
s
Educ
atio
n in
terv
enti
ons
Hea
lth
inte
rven
tion
s
Emer
genc
y pr
ogra
ms
Food
-bas
ed p
rogr
ams
Soci
al p
ensi
ons
Oth
er p
rogr
ams
Child
ren
Wor
king
age
pop
ulat
ion
The
elde
rly
Hou
seho
lds/
fam
ilies
Spec
ial g
roup
s
Cate
gori
cal
Geo
grap
hica
l
Geo
grap
hica
l and
cat
egor
ical
Pove
rty
Pove
rty
and
geog
raph
ical
/ca
tego
rica
l
N/A
Cash
Food
Oth
er in
-kin
d
Mix
Overall 41 5 16 4 2 3 2 26 2 35 17 27 9 12 20 0 2 3 71 3 74 6 7 13
Geography Central Africa 27 3 4 18 3 29 6 0 9 25 7 20 19 29 59 1 4 0 35 1 26 6 41 27
East Africa 18 6 20 4 8 29 2 12 3 17 21 12 21 30 45 2 4 11 31 7 36 7 40 16
West Africa 18 6 48 12 2 5 4 1 3 21 51 1 22 5 69 0 4 3 16 8 29 11 14 46
Southern Africa 52 4 7 1 0 0 1 36 0 41 7 37 1 14 5 0 1 1 94 0 94 4 0 2
Income group Low income 19 7 22 6 1 34 5 1 5 20 23 1 22 34 45 1 6 8 35 5 31 12 41 16
Lower middle income 20 5 39 13 10 5 1 5 3 24 41 9 21 5 60 1 3 6 20 10 27 6 20 47
Upper middle income 51 4 7 0 0 0 1 38 0 40 7 39 1 14 7 0 0 1 92 0 95 4 0 1
High income 24 0 0 4 0 0 0 70 2 4 0 71 14 10 87 0 0 12 1 0 98 0 2 0
Fragility Fragile 12 3 5 2 13 57 5 0 3 11 6 0 25 57 56 2 4 2 23 13 15 7 73 5
Nonfragile 43 5 17 4 1 1 1 28 1 36 17 29 7 11 20 0 2 3 73 1 78 6 4 13
(continued next page)
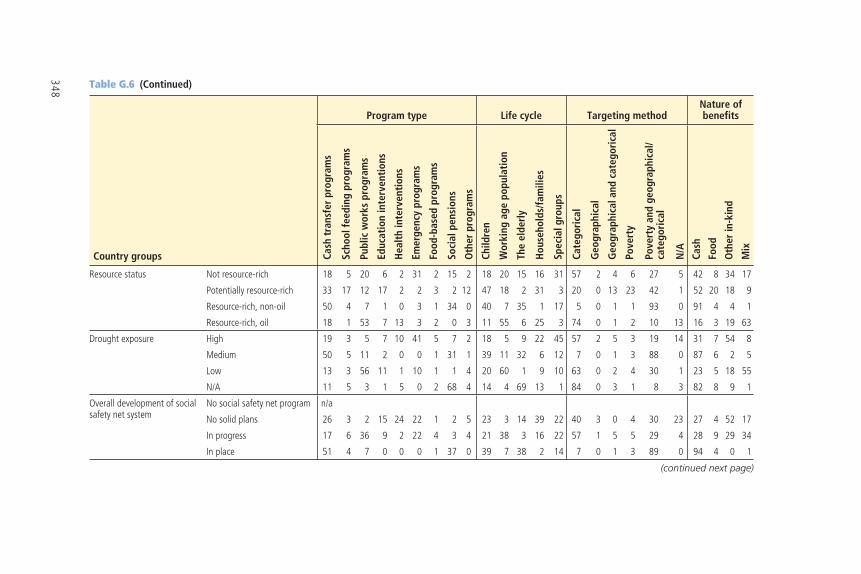
348 Table G.6 (Continued)
Country groups
Program type Life cycle Targeting method Nature of benefits
Cash
tra
nsfe
r pr
ogra
ms
Scho
ol fe
edin
g pr
ogra
ms
Publ
ic w
orks
pro
gram
s
Educ
atio
n in
terv
enti
ons
Hea
lth
inte
rven
tion
s
Emer
genc
y pr
ogra
ms
Food
-bas
ed p
rogr
ams
Soci
al p
ensi
ons
Oth
er p
rogr
ams
Child
ren
Wor
king
age
pop
ulat
ion
The
elde
rly
Hou
seho
lds/
fam
ilies
Spec
ial g
roup
s
Cate
gori
cal
Geo
grap
hica
l
Geo
grap
hica
l and
cat
egor
ical
Pove
rty
Pove
rty
and
geog
raph
ical
/ca
tego
rica
l
N/A
Cash
Food
Oth
er in
-kin
d
Mix
Resource status Not resource-rich 18 5 20 6 2 31 2 15 2 18 20 15 16 31 57 2 4 6 27 5 42 8 34 17
Potentially resource-rich 33 17 12 17 2 2 3 2 12 47 18 2 31 3 20 0 13 23 42 1 52 20 18 9
Resource-rich, non-oil 50 4 7 1 0 3 1 34 0 40 7 35 1 17 5 0 1 1 93 0 91 4 4 1
Resource-rich, oil 18 1 53 7 13 3 2 0 3 11 55 6 25 3 74 0 1 2 10 13 16 3 19 63
Drought exposure High 19 3 5 7 10 41 5 7 2 18 5 9 22 45 57 2 5 3 19 14 31 7 54 8
Medium 50 5 11 2 0 0 1 31 1 39 11 32 6 12 7 0 1 3 88 0 87 6 2 5
Low 13 3 56 11 1 10 1 1 4 20 60 1 9 10 63 0 2 4 30 1 23 5 18 55
N/A 11 5 3 1 5 0 2 68 4 14 4 69 13 1 84 0 3 1 8 3 82 8 9 1
Overall development of social safety net system
No social safety net program n/a
No solid plans 26 3 2 15 24 22 1 2 5 23 3 14 39 22 40 3 0 4 30 23 27 4 52 17
In progress 17 6 36 9 2 22 4 3 4 21 38 3 16 22 57 1 5 5 29 4 28 9 29 34
In place 51 4 7 0 0 0 1 37 0 39 7 38 2 14 7 0 1 3 89 0 94 4 0 1
(continued next page)
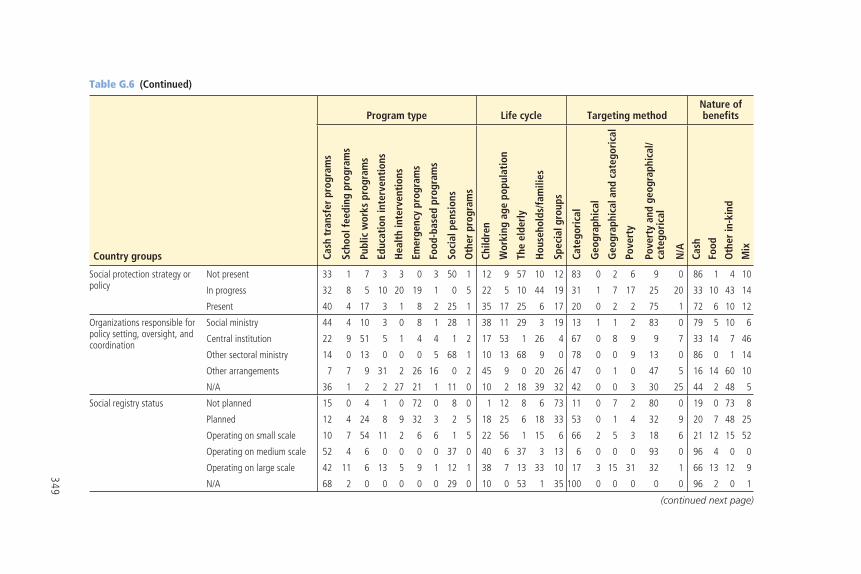
349
Table G.6 (Continued)
Country groups
Program type Life cycle Targeting method Nature of benefits
Cash
tra
nsfe
r pr
ogra
ms
Scho
ol fe
edin
g pr
ogra
ms
Publ
ic w
orks
pro
gram
s
Educ
atio
n in
terv
enti
ons
Hea
lth
inte
rven
tion
s
Emer
genc
y pr
ogra
ms
Food
-bas
ed p
rogr
ams
Soci
al p
ensi
ons
Oth
er p
rogr
ams
Child
ren
Wor
king
age
pop
ulat
ion
The
elde
rly
Hou
seho
lds/
fam
ilies
Spec
ial g
roup
s
Cate
gori
cal
Geo
grap
hica
l
Geo
grap
hica
l and
cat
egor
ical
Pove
rty
Pove
rty
and
geog
raph
ical
/ca
tego
rica
l
N/A
Cash
Food
Oth
er in
-kin
d
Mix
Social protection strategy or policy
Not present 33 1 7 3 3 0 3 50 1 12 9 57 10 12 83 0 2 6 9 0 86 1 4 10
In progress 32 8 5 10 20 19 1 0 5 22 5 10 44 19 31 1 7 17 25 20 33 10 43 14
Present 40 4 17 3 1 8 2 25 1 35 17 25 6 17 20 0 2 2 75 1 72 6 10 12
Organizations responsible for policy setting, oversight, and coordination
Social ministry 44 4 10 3 0 8 1 28 1 38 11 29 3 19 13 1 1 2 83 0 79 5 10 6
Central institution 22 9 51 5 1 4 4 1 2 17 53 1 26 4 67 0 8 9 9 7 33 14 7 46
Other sectoral ministry 14 0 13 0 0 0 5 68 1 10 13 68 9 0 78 0 0 9 13 0 86 0 1 14
Other arrangements 7 7 9 31 2 26 16 0 2 45 9 0 20 26 47 0 1 0 47 5 16 14 60 10
N/A 36 1 2 2 27 21 1 11 0 10 2 18 39 32 42 0 0 3 30 25 44 2 48 5
Social registry status Not planned 15 0 4 1 0 72 0 8 0 1 12 8 6 73 11 0 7 2 80 0 19 0 73 8
Planned 12 4 24 8 9 32 3 2 5 18 25 6 18 33 53 0 1 4 32 9 20 7 48 25
Operating on small scale 10 7 54 11 2 6 6 1 5 22 56 1 15 6 66 2 5 3 18 6 21 12 15 52
Operating on medium scale 52 4 6 0 0 0 0 37 0 40 6 37 3 13 6 0 0 0 93 0 96 4 0 0
Operating on large scale 42 11 6 13 5 9 1 12 1 38 7 13 33 10 17 3 15 31 32 1 66 13 12 9
N/A 68 2 0 0 0 0 0 29 0 10 0 53 1 35 100 0 0 0 0 0 96 2 0 1
(continued next page)
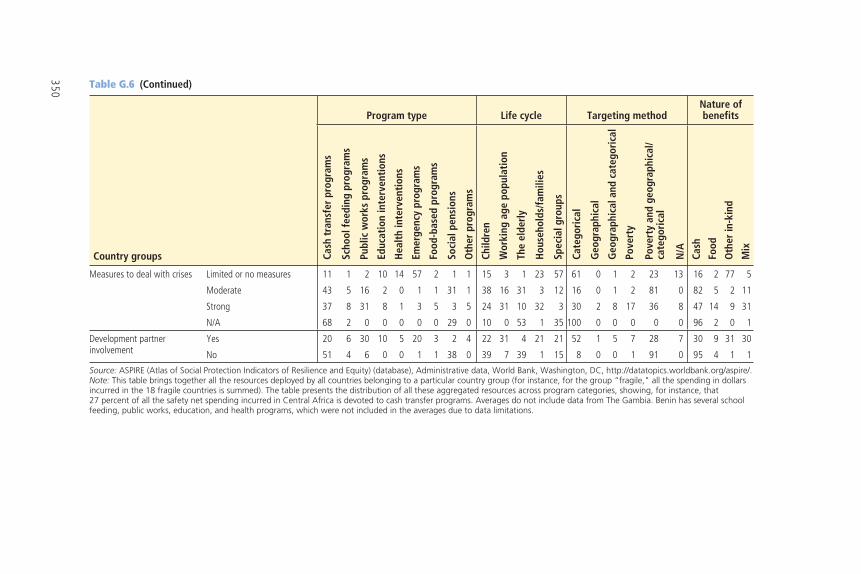
350 Table G.6 (Continued)
Country groups
Program type Life cycle Targeting method Nature of benefits
Cash
tra
nsfe
r pr
ogra
ms
Scho
ol fe
edin
g pr
ogra
ms
Publ
ic w
orks
pro
gram
s
Educ
atio
n in
terv
enti
ons
Hea
lth
inte
rven
tion
s
Emer
genc
y pr
ogra
ms
Food
-bas
ed p
rogr
ams
Soci
al p
ensi
ons
Oth
er p
rogr
ams
Child
ren
Wor
king
age
pop
ulat
ion
The
elde
rly
Hou
seho
lds/
fam
ilies
Spec
ial g
roup
s
Cate
gori
cal
Geo
grap
hica
l
Geo
grap
hica
l and
cat
egor
ical
Pove
rty
Pove
rty
and
geog
raph
ical
/ca
tego
rica
l
N/A
Cash
Food
Oth
er in
-kin
d
Mix
Measures to deal with crises Limited or no measures 11 1 2 10 14 57 2 1 1 15 3 1 23 57 61 0 1 2 23 13 16 2 77 5
Moderate 43 5 16 2 0 1 1 31 1 38 16 31 3 12 16 0 1 2 81 0 82 5 2 11
Strong 37 8 31 8 1 3 5 3 5 24 31 10 32 3 30 2 8 17 36 8 47 14 9 31
N/A 68 2 0 0 0 0 0 29 0 10 0 53 1 35 100 0 0 0 0 0 96 2 0 1
Development partner involvement
Yes 20 6 30 10 5 20 3 2 4 22 31 4 21 21 52 1 5 7 28 7 30 9 31 30
No 51 4 6 0 0 1 1 38 0 39 7 39 1 15 8 0 0 1 91 0 95 4 1 1
Source: ASPIRE (Atlas of Social Protection Indicators of Resilience and Equity) (database), Administrative data, World Bank, Washington, DC, http://datatopics.worldbank.org/aspire/.Note: This table brings together all the resources deployed by all countries belonging to a particular country group (for instance, for the group “fragile," all the spending in dollars incurred in the 18 fragile countries is summed). The table presents the distribution of all these aggregated resources across program categories, showing, for instance, that 27 percent of all the safety net spending incurred in Central Africa is devoted to cash transfer programs. Averages do not include data from The Gambia. Benin has several school feeding, public works, education, and health programs, which were not included in the averages due to data limitations.
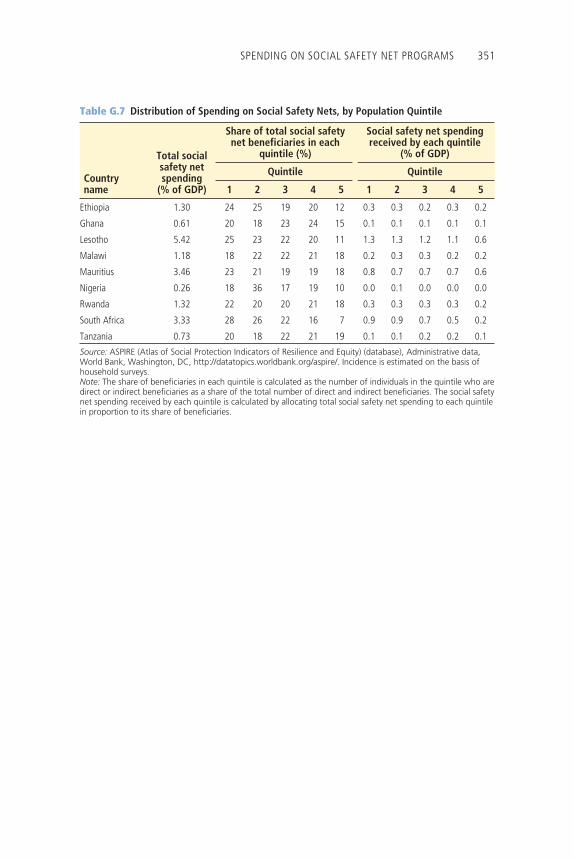
SPENDING ON SOCIAL SAFETY NET PROGRAMS 351
Table G.7 Distribution of Spending on Social Safety Nets, by Population Quintile
Country name
Total social safety net spending
(% of GDP)
Share of total social safety net beneficiaries in each
quintile (%)
Social safety net spending received by each quintile
(% of GDP)
Quintile Quintile
1 2 3 4 5 1 2 3 4 5
Ethiopia 1.30 24 25 19 20 12 0.3 0.3 0.2 0.3 0.2
Ghana 0.61 20 18 23 24 15 0.1 0.1 0.1 0.1 0.1
Lesotho 5.42 25 23 22 20 11 1.3 1.3 1.2 1.1 0.6
Malawi 1.18 18 22 22 21 18 0.2 0.3 0.3 0.2 0.2
Mauritius 3.46 23 21 19 19 18 0.8 0.7 0.7 0.7 0.6
Nigeria 0.26 18 36 17 19 10 0.0 0.1 0.0 0.0 0.0
Rwanda 1.32 22 20 20 21 18 0.3 0.3 0.3 0.3 0.2
South Africa 3.33 28 26 22 16 7 0.9 0.9 0.7 0.5 0.2
Tanzania 0.73 20 18 22 21 19 0.1 0.1 0.2 0.2 0.1
Source: ASPIRE (Atlas of Social Protection Indicators of Resilience and Equity) (database), Administrative data, World Bank, Washington, DC, http://datatopics.worldbank.org/aspire/. Incidence is estimated on the basis of household surveys.Note: The share of beneficiaries in each quintile is calculated as the number of individuals in the quintile who are direct or indirect beneficiaries as a share of the total number of direct and indirect beneficiaries. The social safety net spending received by each quintile is calculated by allocating total social safety net spending to each quintile in proportion to its share of beneficiaries.
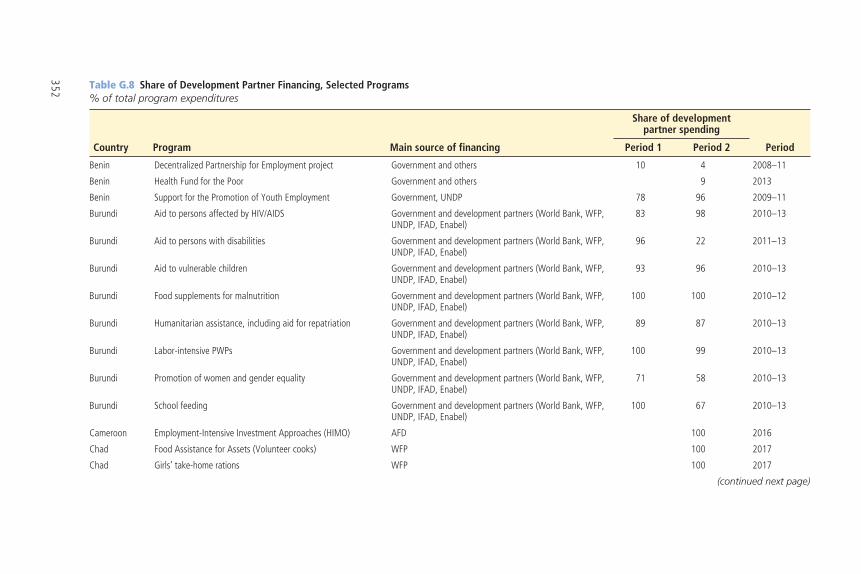
352 Table G.8 Share of Development Partner Financing, Selected Programs% of total program expenditures
Country Program Main source of financing
Share of development partner spending
PeriodPeriod 1 Period 2
Benin Decentralized Partnership for Employment project Government and others 10 4 2008–11
Benin Health Fund for the Poor Government and others 9 2013
Benin Support for the Promotion of Youth Employment Government, UNDP 78 96 2009–11
Burundi Aid to persons affected by HIV/AIDS Government and development partners (World Bank, WFP, UNDP, IFAD, Enabel)
83 98 2010–13
Burundi Aid to persons with disabilities Government and development partners (World Bank, WFP, UNDP, IFAD, Enabel)
96 22 2011–13
Burundi Aid to vulnerable children Government and development partners (World Bank, WFP, UNDP, IFAD, Enabel)
93 96 2010–13
Burundi Food supplements for malnutrition Government and development partners (World Bank, WFP, UNDP, IFAD, Enabel)
100 100 2010–12
Burundi Humanitarian assistance, including aid for repatriation Government and development partners (World Bank, WFP, UNDP, IFAD, Enabel)
89 87 2010–13
Burundi Labor-intensive PWPs Government and development partners (World Bank, WFP, UNDP, IFAD, Enabel)
100 99 2010–13
Burundi Promotion of women and gender equality Government and development partners (World Bank, WFP, UNDP, IFAD, Enabel)
71 58 2010–13
Burundi School feeding Government and development partners (World Bank, WFP, UNDP, IFAD, Enabel)
100 67 2010–13
Cameroon Employment-Intensive Investment Approaches (HIMO) AFD 100 2016
Chad Food Assistance for Assets (Volunteer cooks) WFP 100 2017
Chad Girls’ take-home rations WFP 100 2017
(continued next page)
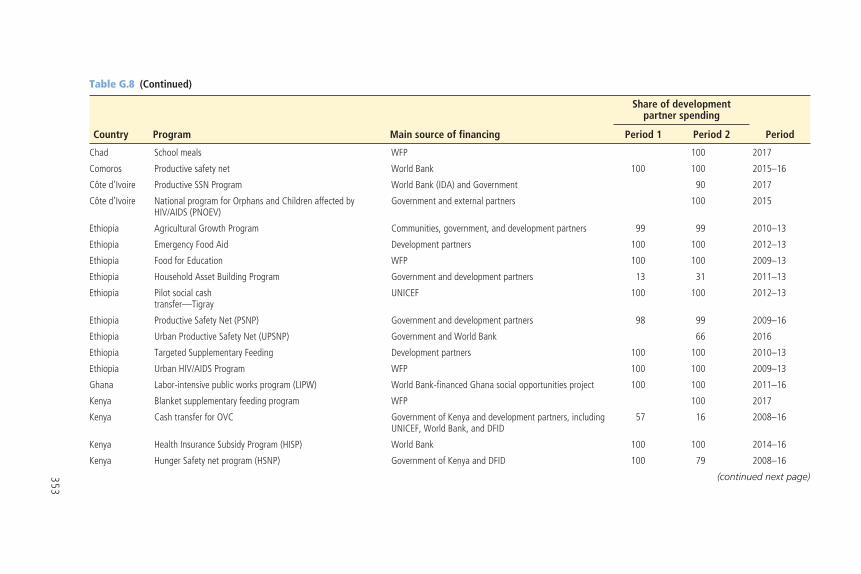
353
Table G.8 (Continued)
Country Program Main source of financing
Share of development partner spending
PeriodPeriod 1 Period 2
Chad School meals WFP 100 2017
Comoros Productive safety net World Bank 100 100 2015–16
Côte d’Ivoire Productive SSN Program World Bank (IDA) and Government 90 2017
Côte d’Ivoire National program for Orphans and Children affected by HIV/AIDS (PNOEV)
Government and external partners 100 2015
Ethiopia Agricultural Growth Program Communities, government, and development partners 99 99 2010–13
Ethiopia Emergency Food Aid Development partners 100 100 2012–13
Ethiopia Food for Education WFP 100 100 2009–13
Ethiopia Household Asset Building Program Government and development partners 13 31 2011–13
Ethiopia Pilot social cash transfer—Tigray
UNICEF 100 100 2012–13
Ethiopia Productive Safety Net (PSNP) Government and development partners 98 99 2009–16
Ethiopia Urban Productive Safety Net (UPSNP) Government and World Bank 66 2016
Ethiopia Targeted Supplementary Feeding Development partners 100 100 2010–13
Ethiopia Urban HIV/AIDS Program WFP 100 100 2009–13
Ghana Labor-intensive public works program (LIPW) World Bank-financed Ghana social opportunities project 100 100 2011–16
Kenya Blanket supplementary feeding program WFP 100 2017
Kenya Cash transfer for OVC Government of Kenya and development partners, including UNICEF, World Bank, and DFID
57 16 2008–16
Kenya Health Insurance Subsidy Program (HISP) World Bank 100 100 2014–16
Kenya Hunger Safety net program (HSNP) Government of Kenya and DFID 100 79 2008–16
(continued next page)
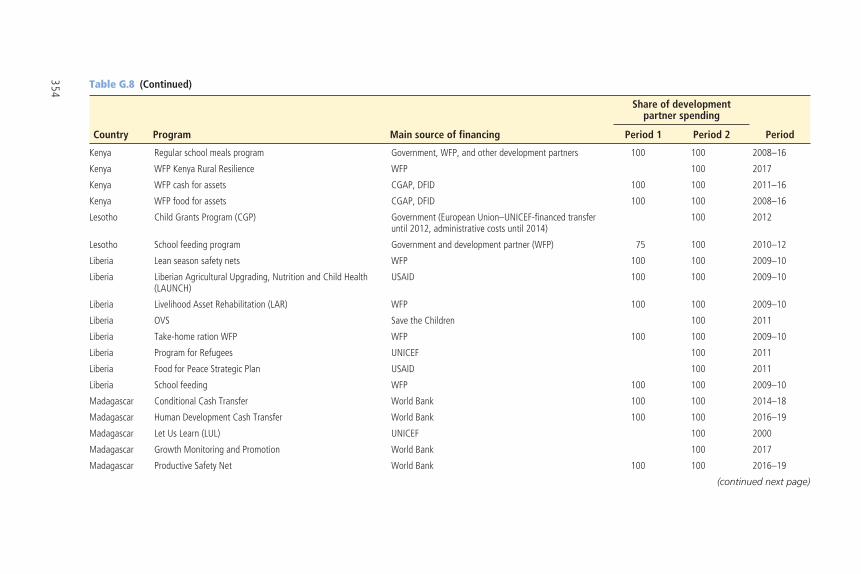
354 Table G.8 (Continued)
Country Program Main source of financing
Share of development partner spending
PeriodPeriod 1 Period 2
Kenya Regular school meals program Government, WFP, and other development partners 100 100 2008–16
Kenya WFP Kenya Rural Resilience WFP 100 2017
Kenya WFP cash for assets CGAP, DFID 100 100 2011–16
Kenya WFP food for assets CGAP, DFID 100 100 2008–16
Lesotho Child Grants Program (CGP) Government (European Union–UNICEF-financed transfer until 2012, administrative costs until 2014)
100 2012
Lesotho School feeding program Government and development partner (WFP) 75 100 2010–12
Liberia Lean season safety nets WFP 100 100 2009–10
Liberia Liberian Agricultural Upgrading, Nutrition and Child Health (LAUNCH)
USAID 100 100 2009–10
Liberia Livelihood Asset Rehabilitation (LAR) WFP 100 100 2009–10
Liberia OVS Save the Children 100 2011
Liberia Take-home ration WFP WFP 100 100 2009–10
Liberia Program for Refugees UNICEF 100 2011
Liberia Food for Peace Strategic Plan USAID 100 2011
Liberia School feeding WFP 100 100 2009–10
Madagascar Conditional Cash Transfer World Bank 100 100 2014–18
Madagascar Human Development Cash Transfer World Bank 100 100 2016–19
Madagascar Let Us Learn (LUL) UNICEF 100 2000
Madagascar Growth Monitoring and Promotion World Bank 100 2017
Madagascar Productive Safety Net World Bank 100 100 2016–19
(continued next page)
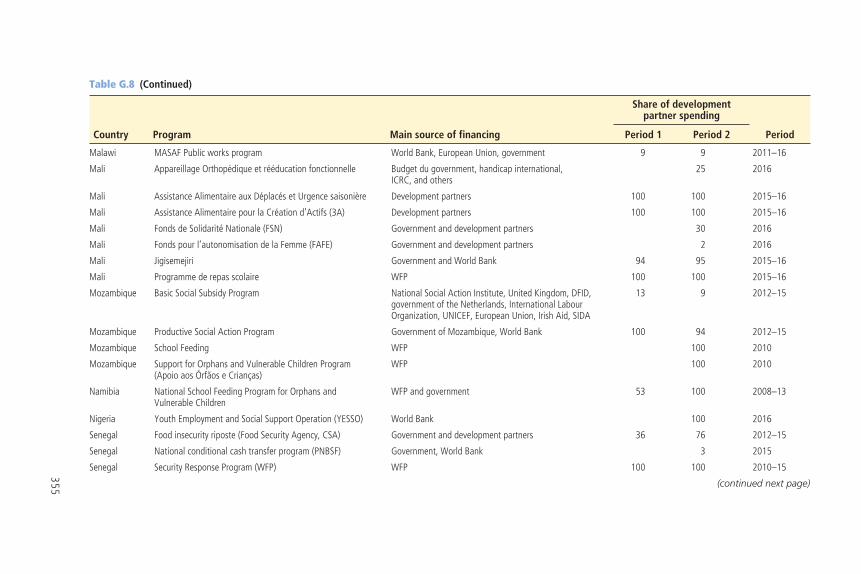
355
Table G.8 (Continued)
Country Program Main source of financing
Share of development partner spending
PeriodPeriod 1 Period 2
Malawi MASAF Public works program World Bank, European Union, government 9 9 2011–16
Mali Appareillage Orthopédique et rééducation fonctionnelle Budget du government, handicap international, ICRC, and others
25 2016
Mali Assistance Alimentaire aux Déplacés et Urgence saisonière Development partners 100 100 2015–16
Mali Assistance Alimentaire pour la Création d’Actifs (3A) Development partners 100 100 2015–16
Mali Fonds de Solidarité Nationale (FSN) Government and development partners 30 2016
Mali Fonds pour l’autonomisation de la Femme (FAFE) Government and development partners 2 2016
Mali Jigisemejiri Government and World Bank 94 95 2015–16
Mali Programme de repas scolaire WFP 100 100 2015–16
Mozambique Basic Social Subsidy Program National Social Action Institute, United Kingdom, DFID, government of the Netherlands, International Labour Organization, UNICEF, European Union, Irish Aid, SIDA
13 9 2012–15
Mozambique Productive Social Action Program Government of Mozambique, World Bank 100 94 2012–15
Mozambique School Feeding WFP 100 2010
Mozambique Support for Orphans and Vulnerable Children Program (Apoio aos Órfãos e Crianças)
WFP 100 2010
Namibia National School Feeding Program for Orphans and Vulnerable Children
WFP and government 53 100 2008–13
Nigeria Youth Employment and Social Support Operation (YESSO) World Bank 100 2016
Senegal Food insecurity riposte (Food Security Agency, CSA) Government and development partners 36 76 2012–15
Senegal National conditional cash transfer program (PNBSF) Government, World Bank 3 2015
Senegal Security Response Program (WFP) WFP 100 100 2010–15
(continued next page)
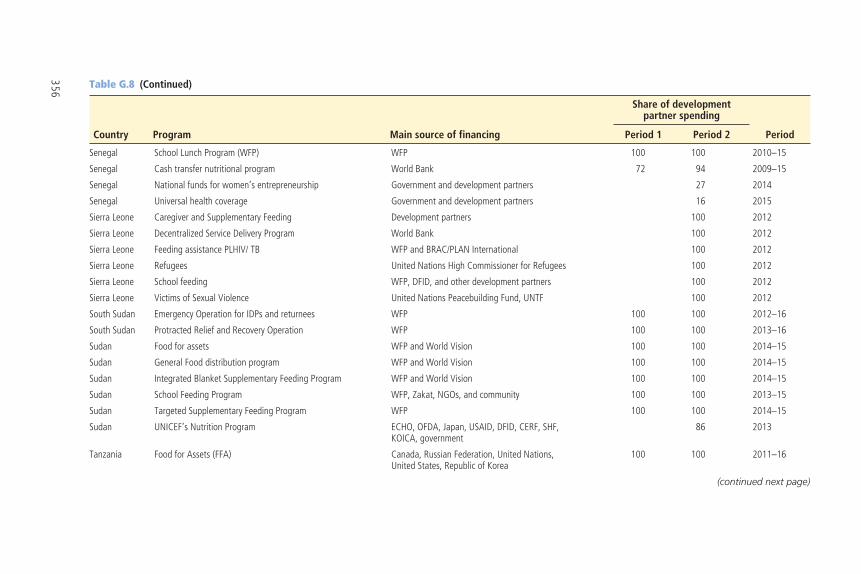
356 Table G.8 (Continued)
Country Program Main source of financing
Share of development partner spending
PeriodPeriod 1 Period 2
Senegal School Lunch Program (WFP) WFP 100 100 2010–15
Senegal Cash transfer nutritional program World Bank 72 94 2009–15
Senegal National funds for women’s entrepreneurship Government and development partners 27 2014
Senegal Universal health coverage Government and development partners 16 2015
Sierra Leone Caregiver and Supplementary Feeding Development partners 100 2012
Sierra Leone Decentralized Service Delivery Program World Bank 100 2012
Sierra Leone Feeding assistance PLHIV/ TB WFP and BRAC/PLAN International 100 2012
Sierra Leone Refugees United Nations High Commissioner for Refugees 100 2012
Sierra Leone School feeding WFP, DFID, and other development partners 100 2012
Sierra Leone Victims of Sexual Violence United Nations Peacebuilding Fund, UNTF 100 2012
South Sudan Emergency Operation for IDPs and returnees WFP 100 100 2012–16
South Sudan Protracted Relief and Recovery Operation WFP 100 100 2013–16
Sudan Food for assets WFP and World Vision 100 100 2014–15
Sudan General Food distribution program WFP and World Vision 100 100 2014–15
Sudan Integrated Blanket Supplementary Feeding Program WFP and World Vision 100 100 2014–15
Sudan School Feeding Program WFP, Zakat, NGOs, and community 100 100 2013–15
Sudan Targeted Supplementary Feeding Program WFP 100 100 2014–15
Sudan UNICEF’s Nutrition Program ECHO, OFDA, Japan, USAID, DFID, CERF, SHF, KOICA, government
86 2013
Tanzania Food for Assets (FFA) Canada, Russian Federation, United Nations, United States, Republic of Korea
100 100 2011–16
(continued next page)
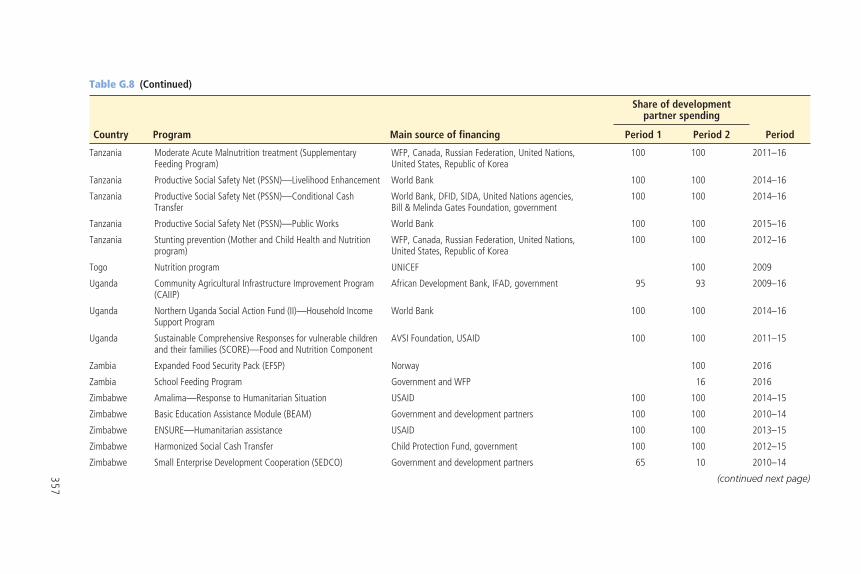
357
Table G.8 (Continued)
Country Program Main source of financing
Share of development partner spending
PeriodPeriod 1 Period 2
Tanzania Moderate Acute Malnutrition treatment (Supplementary Feeding Program)
WFP, Canada, Russian Federation, United Nations, United States, Republic of Korea
100 100 2011–16
Tanzania Productive Social Safety Net (PSSN)—Livelihood Enhancement World Bank 100 100 2014–16
Tanzania Productive Social Safety Net (PSSN)—Conditional Cash Transfer
World Bank, DFID, SIDA, United Nations agencies, Bill & Melinda Gates Foundation, government
100 100 2014–16
Tanzania Productive Social Safety Net (PSSN)—Public Works World Bank 100 100 2015–16
Tanzania Stunting prevention (Mother and Child Health and Nutrition program)
WFP, Canada, Russian Federation, United Nations, United States, Republic of Korea
100 100 2012–16
Togo Nutrition program UNICEF 100 2009
Uganda Community Agricultural Infrastructure Improvement Program (CAIIP)
African Development Bank, IFAD, government 95 93 2009–16
Uganda Northern Uganda Social Action Fund (II)—Household Income Support Program
World Bank 100 100 2014–16
Uganda Sustainable Comprehensive Responses for vulnerable children and their families (SCORE)—Food and Nutrition Component
AVSI Foundation, USAID 100 100 2011–15
Zambia Expanded Food Security Pack (EFSP) Norway 100 2016
Zambia School Feeding Program Government and WFP 16 2016
Zimbabwe Amalima—Response to Humanitarian Situation USAID 100 100 2014–15
Zimbabwe Basic Education Assistance Module (BEAM) Government and development partners 100 100 2010–14
Zimbabwe ENSURE—Humanitarian assistance USAID 100 100 2013–15
Zimbabwe Harmonized Social Cash Transfer Child Protection Fund, government 100 100 2012–15
Zimbabwe Small Enterprise Development Cooperation (SEDCO) Government and development partners 65 10 2010–14
(continued next page)
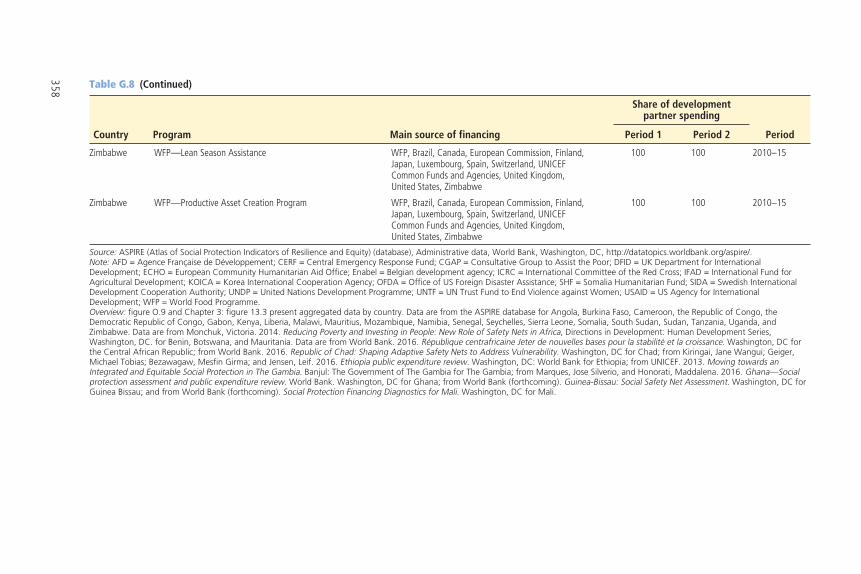
358 Table G.8 (Continued)
Country Program Main source of financing
Share of development partner spending
PeriodPeriod 1 Period 2
Zimbabwe WFP—Lean Season Assistance WFP, Brazil, Canada, European Commission, Finland, Japan, Luxembourg, Spain, Switzerland, UNICEF Common Funds and Agencies, United Kingdom, United States, Zimbabwe
100 100 2010–15
Zimbabwe WFP—Productive Asset Creation Program WFP, Brazil, Canada, European Commission, Finland, Japan, Luxembourg, Spain, Switzerland, UNICEF Common Funds and Agencies, United Kingdom, United States, Zimbabwe
100 100 2010–15
Source: ASPIRE (Atlas of Social Protection Indicators of Resilience and Equity) (database), Administrative data, World Bank, Washington, DC, http://datatopics.worldbank.org/aspire/.Note: AFD = Agence Française de Développement; CERF = Central Emergency Response Fund; CGAP = Consultative Group to Assist the Poor; DFID = UK Department for International Development; ECHO = European Community Humanitarian Aid Office; Enabel = Belgian development agency; ICRC = International Committee of the Red Cross; IFAD = International Fund for Agricultural Development; KOICA = Korea International Cooperation Agency; OFDA = Office of US Foreign Disaster Assistance; SHF = Somalia Humanitarian Fund; SIDA = Swedish International Development Cooperation Authority; UNDP = United Nations Development Programme; UNTF = UN Trust Fund to End Violence against Women; USAID = US Agency for International Development; WFP = World Food Programme.Overview: figure O.9 and Chapter 3: figure 13.3 present aggregated data by country. Data are from the ASPIRE database for Angola, Burkina Faso, Cameroon, the Republic of Congo, the Democratic Republic of Congo, Gabon, Kenya, Liberia, Malawi, Mauritius, Mozambique, Namibia, Senegal, Seychelles, Sierra Leone, Somalia, South Sudan, Sudan, Tanzania, Uganda, and Zimbabwe. Data are from Monchuk, Victoria. 2014. Reducing Poverty and Investing in People: New Role of Safety Nets in Africa, Directions in Development: Human Development Series, Washington, DC. for Benin, Botswana, and Mauritania. Data are from World Bank. 2016. République centrafricaine Jeter de nouvelles bases pour la stabilité et la croissance. Washington, DC for the Central African Republic; from World Bank. 2016. Republic of Chad: Shaping Adaptive Safety Nets to Address Vulnerability. Washington, DC for Chad; from Kiringai, Jane Wangui; Geiger, Michael Tobias; Bezawagaw, Mesfin Girma; and Jensen, Leif. 2016. Ethiopia public expenditure review. Washington, DC: World Bank for Ethiopia; from UNICEF. 2013. Moving towards an Integrated and Equitable Social Protection in The Gambia. Banjul: The Government of The Gambia for The Gambia; from Marques, Jose Silverio, and Honorati, Maddalena. 2016. Ghana—Social protection assessment and public expenditure review. World Bank. Washington, DC for Ghana; from World Bank (forthcoming). Guinea-Bissau: Social Safety Net Assessment. Washington, DC for Guinea Bissau; and from World Bank (forthcoming). Social Protection Financing Diagnostics for Mali. Washington, DC for Mali.
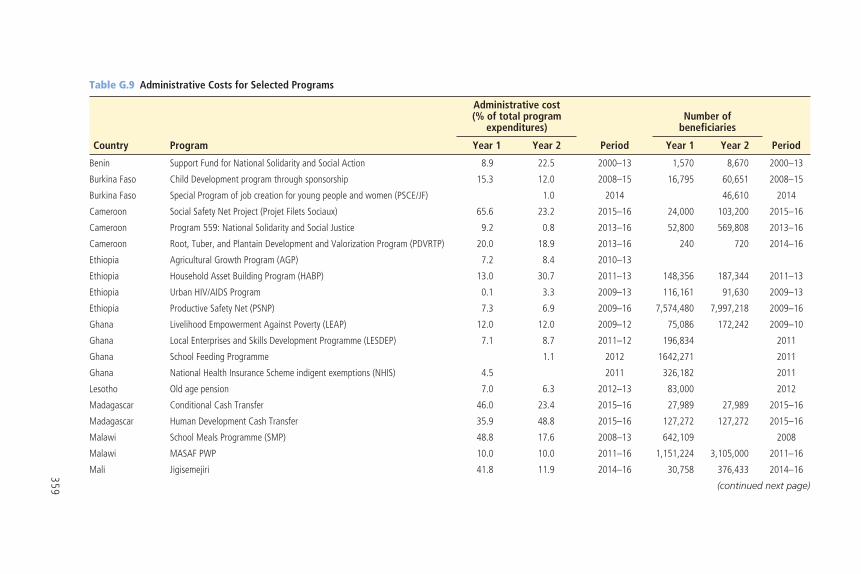
359
Table G.9 Administrative Costs for Selected Programs
Country Program
Administrative cost(% of total program
expenditures)
Period
Number of beneficiaries
PeriodYear 1 Year 2 Year 1 Year 2
Benin Support Fund for National Solidarity and Social Action 8.9 22.5 2000–13 1,570 8,670 2000–13
Burkina Faso Child Development program through sponsorship 15.3 12.0 2008–15 16,795 60,651 2008–15
Burkina Faso Special Program of job creation for young people and women (PSCE/JF) 1.0 2014 46,610 2014
Cameroon Social Safety Net Project (Projet Filets Sociaux) 65.6 23.2 2015–16 24,000 103,200 2015–16
Cameroon Program 559: National Solidarity and Social Justice 9.2 0.8 2013–16 52,800 569,808 2013–16
Cameroon Root, Tuber, and Plantain Development and Valorization Program (PDVRTP) 20.0 18.9 2013–16 240 720 2014–16
Ethiopia Agricultural Growth Program (AGP) 7.2 8.4 2010–13
Ethiopia Household Asset Building Program (HABP) 13.0 30.7 2011–13 148,356 187,344 2011–13
Ethiopia Urban HIV/AIDS Program 0.1 3.3 2009–13 116,161 91,630 2009–13
Ethiopia Productive Safety Net (PSNP) 7.3 6.9 2009–16 7,574,480 7,997,218 2009–16
Ghana Livelihood Empowerment Against Poverty (LEAP) 12.0 12.0 2009–12 75,086 172,242 2009–10
Ghana Local Enterprises and Skills Development Programme (LESDEP) 7.1 8.7 2011–12 196,834 2011
Ghana School Feeding Programme 1.1 2012 1642,271 2011
Ghana National Health Insurance Scheme indigent exemptions (NHIS) 4.5 2011 326,182 2011
Lesotho Old age pension 7.0 6.3 2012–13 83,000 2012
Madagascar Conditional Cash Transfer 46.0 23.4 2015–16 27,989 27,989 2015–16
Madagascar Human Development Cash Transfer 35.9 48.8 2015–16 127,272 127,272 2015–16
Malawi School Meals Programme (SMP) 48.8 17.6 2008–13 642,109 2008
Malawi MASAF PWP 10.0 10.0 2011–16 1,151,224 3,105,000 2011–16
Mali Jigisemejiri 41.8 11.9 2014–16 30,758 376,433 2014–16
(continued next page)
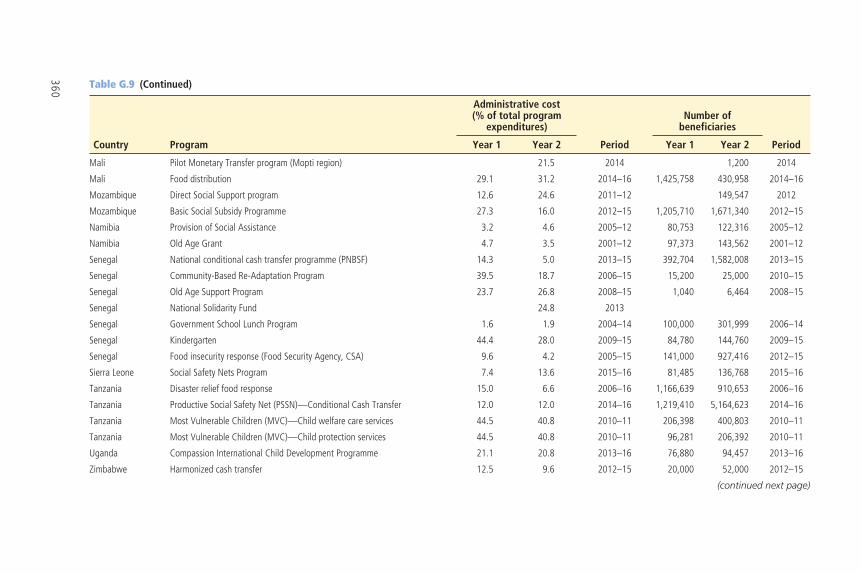
360 Table G.9 (Continued)
Country Program
Administrative cost(% of total program
expenditures)
Period
Number of beneficiaries
PeriodYear 1 Year 2 Year 1 Year 2
Mali Pilot Monetary Transfer program (Mopti region) 21.5 2014 1,200 2014
Mali Food distribution 29.1 31.2 2014–16 1,425,758 430,958 2014–16
Mozambique Direct Social Support program 12.6 24.6 2011–12 149,547 2012
Mozambique Basic Social Subsidy Programme 27.3 16.0 2012–15 1,205,710 1,671,340 2012–15
Namibia Provision of Social Assistance 3.2 4.6 2005–12 80,753 122,316 2005–12
Namibia Old Age Grant 4.7 3.5 2001–12 97,373 143,562 2001–12
Senegal National conditional cash transfer programme (PNBSF) 14.3 5.0 2013–15 392,704 1,582,008 2013–15
Senegal Community-Based Re-Adaptation Program 39.5 18.7 2006–15 15,200 25,000 2010–15
Senegal Old Age Support Program 23.7 26.8 2008–15 1,040 6,464 2008–15
Senegal National Solidarity Fund 24.8 2013
Senegal Government School Lunch Program 1.6 1.9 2004–14 100,000 301,999 2006–14
Senegal Kindergarten 44.4 28.0 2009–15 84,780 144,760 2009–15
Senegal Food insecurity response (Food Security Agency, CSA) 9.6 4.2 2005–15 141,000 927,416 2012–15
Sierra Leone Social Safety Nets Program 7.4 13.6 2015–16 81,485 136,768 2015–16
Tanzania Disaster relief food response 15.0 6.6 2006–16 1,166,639 910,653 2006–16
Tanzania Productive Social Safety Net (PSSN)—Conditional Cash Transfer 12.0 12.0 2014–16 1,219,410 5,164,623 2014–16
Tanzania Most Vulnerable Children (MVC)—Child welfare care services 44.5 40.8 2010–11 206,398 400,803 2010–11
Tanzania Most Vulnerable Children (MVC)—Child protection services 44.5 40.8 2010–11 96,281 206,392 2010–11
Uganda Compassion International Child Development Programme 21.1 20.8 2013–16 76,880 94,457 2013–16
Zimbabwe Harmonized cash transfer 12.5 9.6 2012–15 20,000 52,000 2012–15
(continued next page)
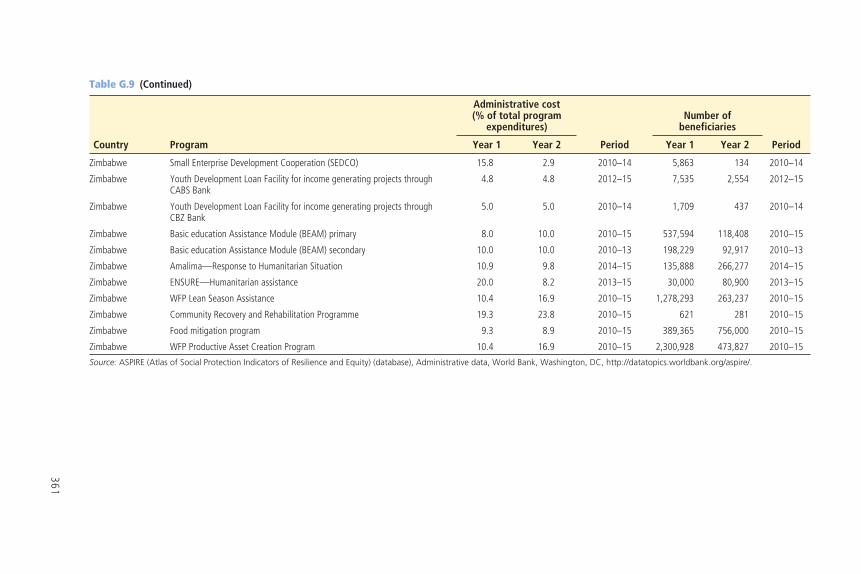
361
Table G.9 (Continued)
Country Program
Administrative cost(% of total program
expenditures)
Period
Number of beneficiaries
PeriodYear 1 Year 2 Year 1 Year 2
Zimbabwe Small Enterprise Development Cooperation (SEDCO) 15.8 2.9 2010–14 5,863 134 2010–14
Zimbabwe Youth Development Loan Facility for income generating projects through CABS Bank
4.8 4.8 2012–15 7,535 2,554 2012–15
Zimbabwe Youth Development Loan Facility for income generating projects through CBZ Bank
5.0 5.0 2010–14 1,709 437 2010–14
Zimbabwe Basic education Assistance Module (BEAM) primary 8.0 10.0 2010–15 537,594 118,408 2010–15
Zimbabwe Basic education Assistance Module (BEAM) secondary 10.0 10.0 2010–13 198,229 92,917 2010–13
Zimbabwe Amalima—Response to Humanitarian Situation 10.9 9.8 2014–15 135,888 266,277 2014–15
Zimbabwe ENSURE—Humanitarian assistance 20.0 8.2 2013–15 30,000 80,900 2013–15
Zimbabwe WFP Lean Season Assistance 10.4 16.9 2010–15 1,278,293 263,237 2010–15
Zimbabwe Community Recovery and Rehabilitation Programme 19.3 23.8 2010–15 621 281 2010–15
Zimbabwe Food mitigation program 9.3 8.9 2010–15 389,365 756,000 2010–15
Zimbabwe WFP Productive Asset Creation Program 10.4 16.9 2010–15 2,300,928 473,827 2010–15
Source: ASPIRE (Atlas of Social Protection Indicators of Resilience and Equity) (database), Administrative data, World Bank, Washington, DC, http://datatopics.worldbank.org/aspire/.

363
Appendix H
Main Social Safety Net Programs, by Program Type
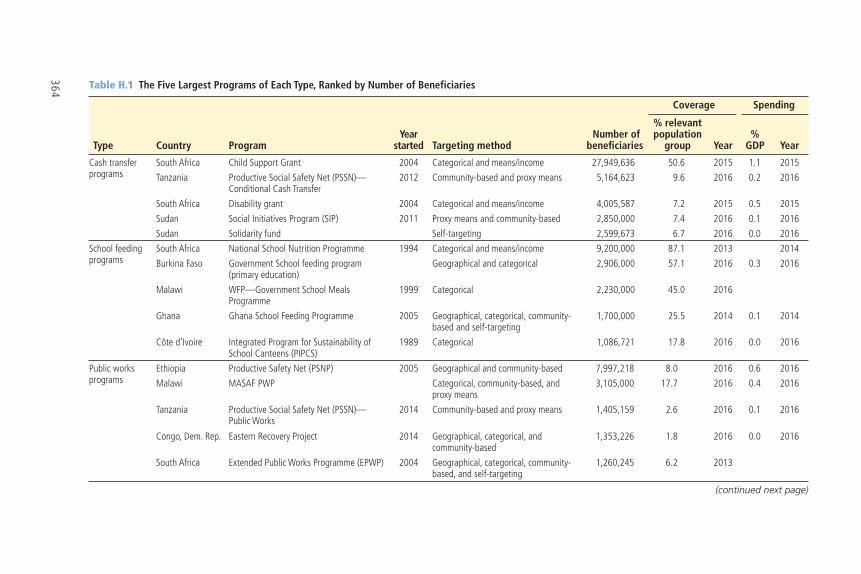
364 Table H.1 The Five Largest Programs of Each Type, Ranked by Number of Beneficiaries
Type Country ProgramYear
started Targeting method Number of
benefi ciaries
Coverage Spending
% relevant population
group Year%
GDP Year
Cash transfer programs
South Africa Child Support Grant 2004 Categorical and means/income 27,949,636 50.6 2015 1.1 2015
Tanzania Productive Social Safety Net (PSSN)—Conditional Cash Transfer
2012 Community-based and proxy means 5,164,623 9.6 2016 0.2 2016
South Africa Disability grant 2004 Categorical and means/income 4,005,587 7.2 2015 0.5 2015
Sudan Social Initiatives Program (SIP) 2011 Proxy means and community-based 2,850,000 7.4 2016 0.1 2016
Sudan Solidarity fund Self-targeting 2,599,673 6.7 2016 0.0 2016
School feeding programs
South Africa National School Nutrition Programme 1994 Categorical and means/income 9,200,000 87.1 2013 2014
Burkina Faso Government School feeding program (primary education)
Geographical and categorical 2,906,000 57.1 2016 0.3 2016
Malawi WFP—Government School Meals Programme
1999 Categorical 2,230,000 45.0 2016
Ghana Ghana School Feeding Programme 2005 Geographical, categorical, community-based and self-targeting
1,700,000 25.5 2014 0.1 2014
Côte d’Ivoire Integrated Program for Sustainability of School Canteens (PIPCS)
1989 Categorical 1,086,721 17.8 2016 0.0 2016
Public works programs
Ethiopia Productive Safety Net (PSNP) 2005 Geographical and community-based 7,997,218 8.0 2016 0.6 2016
Malawi MASAF PWP Categorical, community-based, and proxy means
3,105,000 17.7 2016 0.4 2016
Tanzania Productive Social Safety Net (PSSN)—Public Works
2014 Community-based and proxy means 1,405,159 2.6 2016 0.1 2016
Congo, Dem. Rep. Eastern Recovery Project 2014 Geographical, categorical, and community-based
1,353,226 1.8 2016 0.0 2016
South Africa Extended Public Works Programme (EPWP) 2004 Geographical, categorical, community-based, and self-targeting
1,260,245 6.2 2013
(continued next page)
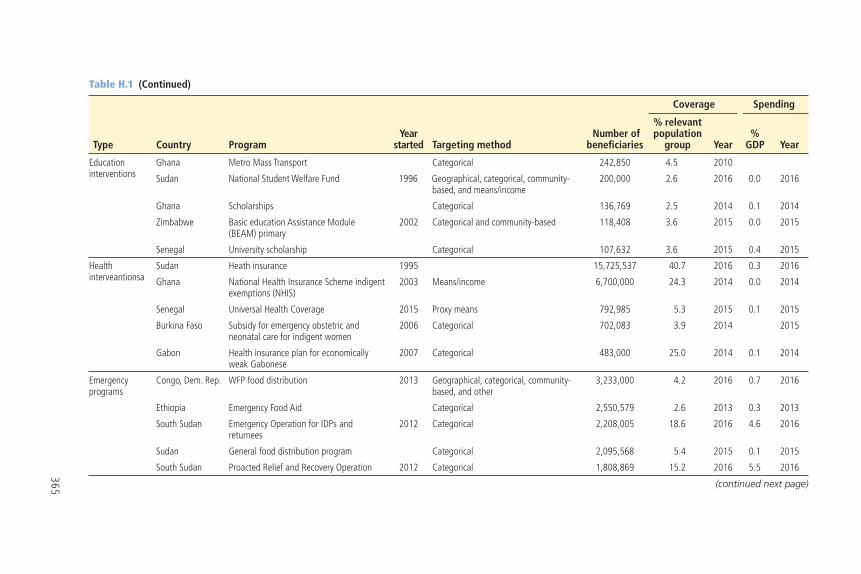
365
Table H.1 (Continued)
Type Country ProgramYear
started Targeting method Number of
benefi ciaries
Coverage Spending
% relevant population
group Year%
GDP Year
Education interventions
Ghana Metro Mass Transport Categorical 242,850 4.5 2010
Sudan National Student Welfare Fund 1996 Geographical, categorical, community-based, and means/income
200,000 2.6 2016 0.0 2016
Ghana Scholarships Categorical 136,769 2.5 2014 0.1 2014
Zimbabwe Basic education Assistance Module (BEAM) primary
2002 Categorical and community-based 118,408 3.6 2015 0.0 2015
Senegal University scholarship Categorical 107,632 3.6 2015 0.4 2015
Health interveantionsa
Sudan Heath insurance 1995 15,725,537 40.7 2016 0.3 2016
Ghana National Health Insurance Scheme indigent exemptions (NHIS)
2003 Means/income 6,700,000 24.3 2014 0.0 2014
Senegal Universal Health Coverage 2015 Proxy means 792,985 5.3 2015 0.1 2015
Burkina Faso Subsidy for emergency obstetric and neonatal care for indigent women
2006 Categorical 702,083 3.9 2014 2015
Gabon Health insurance plan for economically weak Gabonese
2007 Categorical 483,000 25.0 2014 0.1 2014
Emergency programs
Congo, Dem. Rep. WFP food distribution 2013 Geographical, categorical, community-based, and other
3,233,000 4.2 2016 0.7 2016
Ethiopia Emergency Food Aid Categorical 2,550,579 2.6 2013 0.3 2013
South Sudan Emergency Operation for IDPs and returnees
2012 Categorical 2,208,005 18.6 2016 4.6 2016
Sudan General food distribution program Categorical 2,095,568 5.4 2015 0.1 2015
South Sudan Proacted Relief and Recovery Operation 2012 Categorical 1,808,869 15.2 2016 5.5 2016
(continued next page)
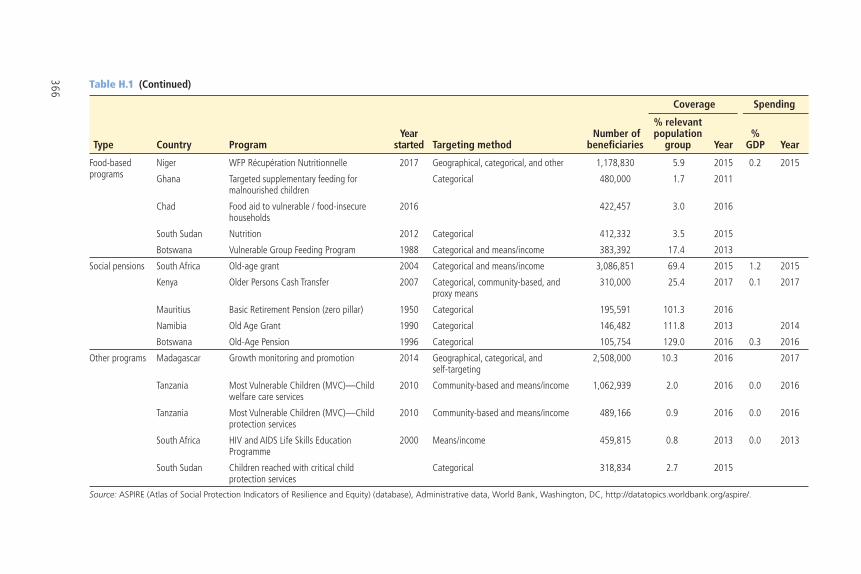
366 Table H.1 (Continued)
Type Country ProgramYear
started Targeting method Number of
benefi ciaries
Coverage Spending
% relevant population
group Year%
GDP Year
Food-based programs
Niger WFP Récupération Nutritionnelle 2017 Geographical, categorical, and other 1,178,830 5.9 2015 0.2 2015
Ghana Targeted supplementary feeding for malnourished children
Categorical 480,000 1.7 2011
Chad Food aid to vulnerable / food-insecure households
2016 422,457 3.0 2016
South Sudan Nutrition 2012 Categorical 412,332 3.5 2015
Botswana Vulnerable Group Feeding Program 1988 Categorical and means/income 383,392 17.4 2013
Social pensions South Africa Old-age grant 2004 Categorical and means/income 3,086,851 69.4 2015 1.2 2015
Kenya Older Persons Cash Transfer 2007 Categorical, community-based, and proxy means
310,000 25.4 2017 0.1 2017
Mauritius Basic Retirement Pension (zero pillar) 1950 Categorical 195,591 101.3 2016
Namibia Old Age Grant 1990 Categorical 146,482 111.8 2013 2014
Botswana Old-Age Pension 1996 Categorical 105,754 129.0 2016 0.3 2016
Other programs Madagascar Growth monitoring and promotion 2014 Geographical, categorical, and self-targeting
2,508,000 10.3 2016 2017
Tanzania Most Vulnerable Children (MVC)—Child welfare care services
2010 Community-based and means/income 1,062,939 2.0 2016 0.0 2016
Tanzania Most Vulnerable Children (MVC)—Child protection services
2010 Community-based and means/income 489,166 0.9 2016 0.0 2016
South Africa HIV and AIDS Life Skills Education Programme
2000 Means/income 459,815 0.8 2013 0.0 2013
South Sudan Children reached with critical child protection services
Categorical 318,834 2.7 2015
Source: ASPIRE (Atlas of Social Protection Indicators of Resilience and Equity) (database), Administrative data, World Bank, Washington, DC, http://datatopics.worldbank.org/aspire/.
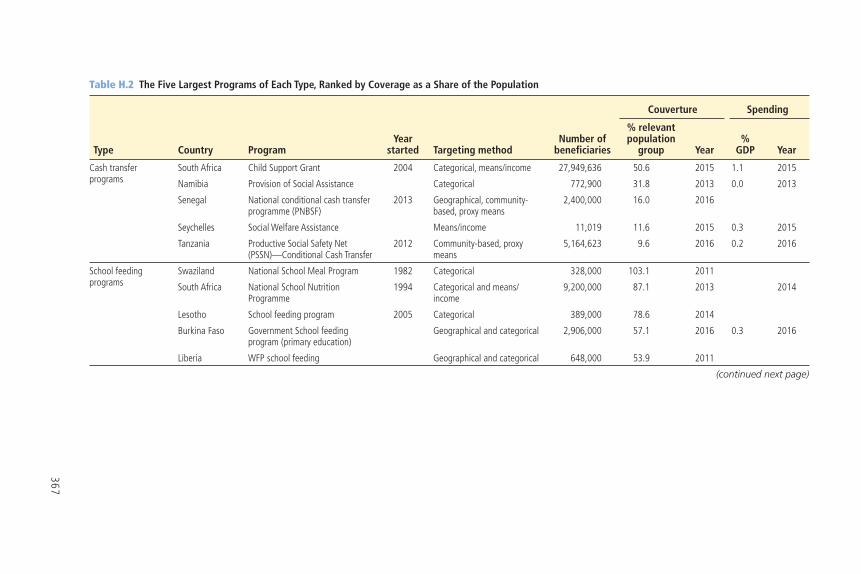
367
Table H.2 The Five Largest Programs of Each Type, Ranked by Coverage as a Share of the Population
Type Country ProgramYear
started Targeting methodNumber of
benefi ciaries
Couverture Spending
% relevant population
group Year%
GDP Year
Cash transfer programs
South Africa Child Support Grant 2004 Categorical, means/income 27,949,636 50.6 2015 1.1 2015
Namibia Provision of Social Assistance Categorical 772,900 31.8 2013 0.0 2013
Senegal National conditional cash transfer programme (PNBSF)
2013 Geographical, community-based, proxy means
2,400,000 16.0 2016
Seychelles Social Welfare Assistance Means/income 11,019 11.6 2015 0.3 2015
Tanzania Productive Social Safety Net (PSSN)—Conditional Cash Transfer
2012 Community-based, proxy means
5,164,623 9.6 2016 0.2 2016
School feeding programs
Swaziland National School Meal Program 1982 Categorical 328,000 103.1 2011
South Africa National School Nutrition Programme
1994 Categorical and means/income
9,200,000 87.1 2013 2014
Lesotho School feeding program 2005 Categorical 389,000 78.6 2014
Burkina Faso Government School feeding program (primary education)
Geographical and categorical 2,906,000 57.1 2016 0.3 2016
Liberia WFP school feeding Geographical and categorical 648,000 53.9 2011
(continued next page)
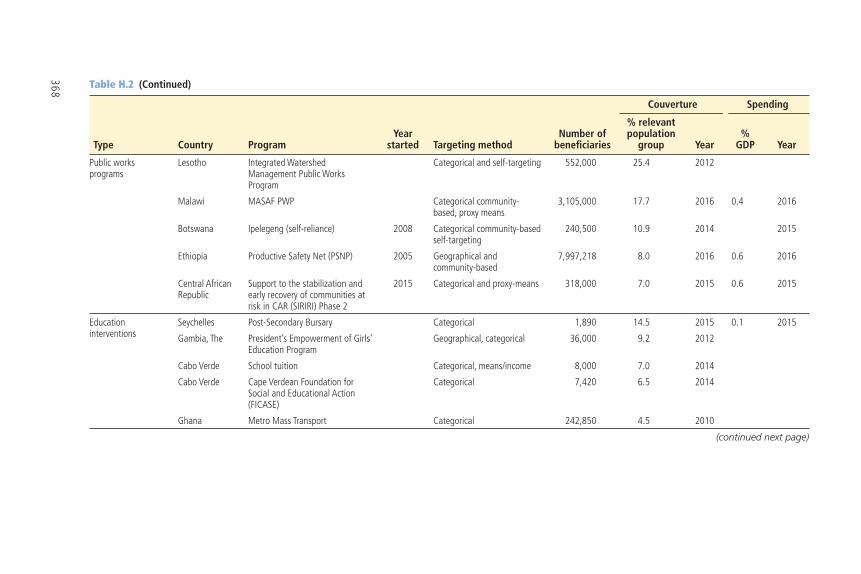
368 Table H.2 (Continued)
Type Country ProgramYear
started Targeting methodNumber of
benefi ciaries
Couverture Spending
% relevant population
group Year%
GDP Year
Public works programs
Lesotho Integrated Watershed Management Public Works Program
Categorical and self-targeting 552,000 25.4 2012
Malawi MASAF PWP Categorical community-based, proxy means
3,105,000 17.7 2016 0.4 2016
Botswana Ipelegeng (self-reliance) 2008 Categorical community-based self-targeting
240,500 10.9 2014 2015
Ethiopia Productive Safety Net (PSNP) 2005 Geographical and community-based
7,997,218 8.0 2016 0.6 2016
Central African Republic
Support to the stabilization and early recovery of communities at risk in CAR (SIRIRI) Phase 2
2015 Categorical and proxy-means 318,000 7.0 2015 0.6 2015
Education interventions
Seychelles Post-Secondary Bursary Categorical 1,890 14.5 2015 0.1 2015
Gambia, The President’s Empowerment of Girls’ Education Program
Geographical, categorical 36,000 9.2 2012
Cabo Verde School tuition Categorical, means/income 8,000 7.0 2014
Cabo Verde Cape Verdean Foundation for Social and Educational Action (FICASE)
Categorical 7,420 6.5 2014
Ghana Metro Mass Transport Categorical 242,850 4.5 2010
(continued next page)
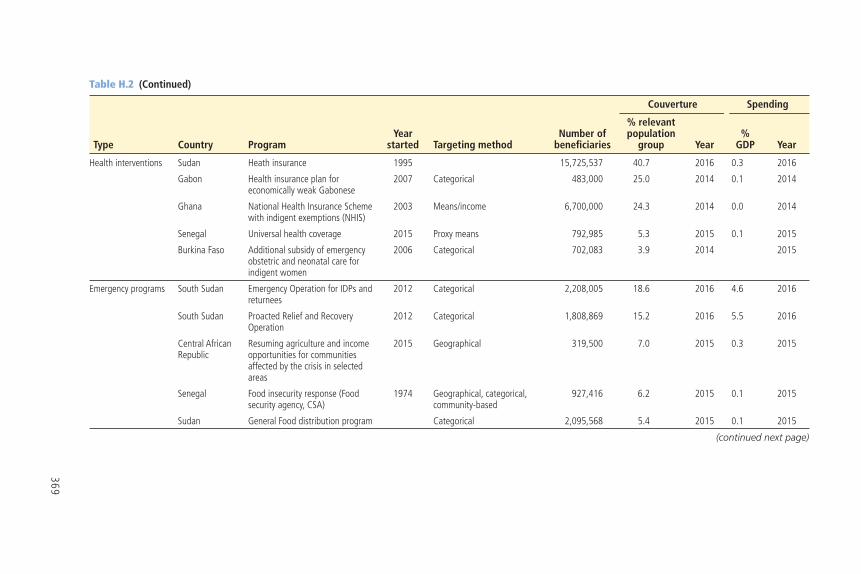
369
Table H.2 (Continued)
Type Country ProgramYear
started Targeting methodNumber of
benefi ciaries
Couverture Spending
% relevant population
group Year%
GDP Year
Health interventions Sudan Heath insurance 1995 15,725,537 40.7 2016 0.3 2016
Gabon Health insurance plan for economically weak Gabonese
2007 Categorical 483,000 25.0 2014 0.1 2014
Ghana National Health Insurance Scheme with indigent exemptions (NHIS)
2003 Means/income 6,700,000 24.3 2014 0.0 2014
Senegal Universal health coverage 2015 Proxy means 792,985 5.3 2015 0.1 2015
Burkina Faso Additional subsidy of emergency obstetric and neonatal care for indigent women
2006 Categorical 702,083 3.9 2014 2015
Emergency programs South Sudan Emergency Operation for IDPs and returnees
2012 Categorical 2,208,005 18.6 2016 4.6 2016
South Sudan Proacted Relief and Recovery Operation
2012 Categorical 1,808,869 15.2 2016 5.5 2016
Central African Republic
Resuming agriculture and income opportunities for communities affected by the crisis in selected areas
2015 Geographical 319,500 7.0 2015 0.3 2015
Senegal Food insecurity response (Food security agency, CSA)
1974 Geographical, categorical, community-based
927,416 6.2 2015 0.1 2015
Sudan General Food distribution program Categorical 2,095,568 5.4 2015 0.1 2015
(continued next page)
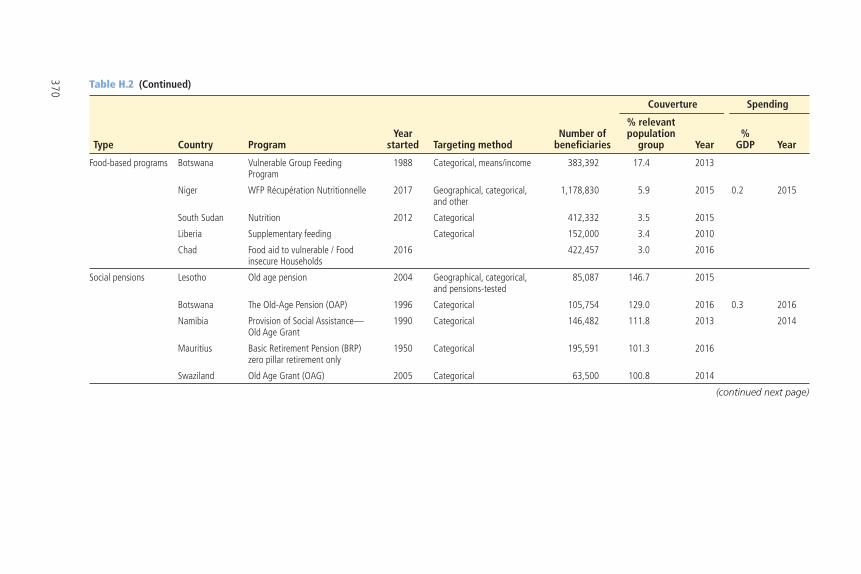
370 Table H.2 (Continued)
Type Country ProgramYear
started Targeting methodNumber of
benefi ciaries
Couverture Spending
% relevant population
group Year%
GDP Year
Food-based programs Botswana Vulnerable Group Feeding Program
1988 Categorical, means/income 383,392 17.4 2013
Niger WFP Récupération Nutritionnelle 2017 Geographical, categorical, and other
1,178,830 5.9 2015 0.2 2015
South Sudan Nutrition 2012 Categorical 412,332 3.5 2015
Liberia Supplementary feeding Categorical 152,000 3.4 2010
Chad Food aid to vulnerable / Food insecure Households
2016 422,457 3.0 2016
Social pensions Lesotho Old age pension 2004 Geographical, categorical, and pensions-tested
85,087 146.7 2015
Botswana The Old-Age Pension (OAP) 1996 Categorical 105,754 129.0 2016 0.3 2016
Namibia Provision of Social Assistance—Old Age Grant
1990 Categorical 146,482 111.8 2013 2014
Mauritius Basic Retirement Pension (BRP) zero pillar retirement only
1950 Categorical 195,591 101.3 2016
Swaziland Old Age Grant (OAG) 2005 Categorical 63,500 100.8 2014
(continued next page)
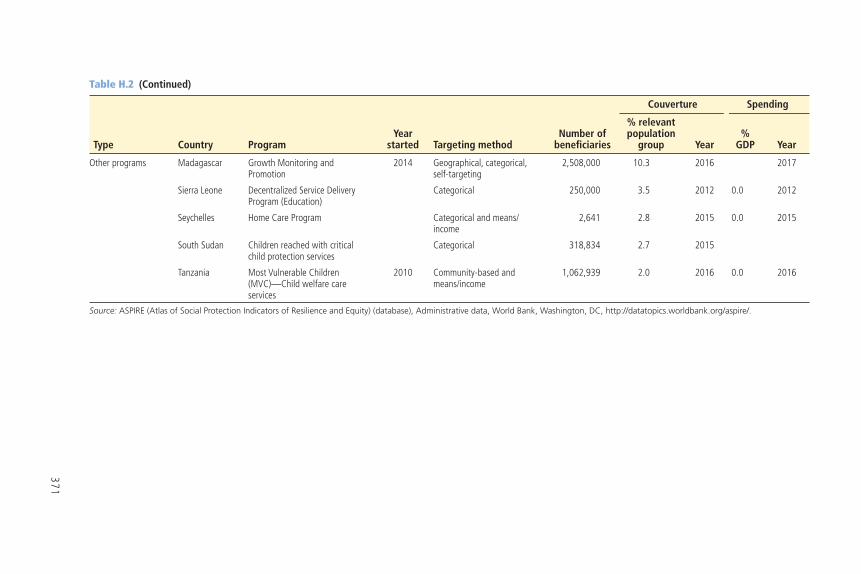
371
Table H.2 (Continued)
Type Country ProgramYear
started Targeting methodNumber of
benefi ciaries
Couverture Spending
% relevant population
group Year%
GDP Year
Other programs Madagascar Growth Monitoring and Promotion
2014 Geographical, categorical, self-targeting
2,508,000 10.3 2016 2017
Sierra Leone Decentralized Service Delivery Program (Education)
Categorical 250,000 3.5 2012 0.0 2012
Seychelles Home Care Program Categorical and means/income
2,641 2.8 2015 0.0 2015
South Sudan Children reached with critical child protection services
Categorical 318,834 2.7 2015
Tanzania Most Vulnerable Children (MVC)—Child welfare care services
2010 Community-based and means/income
1,062,939 2.0 2016 0.0 2016
Source: ASPIRE (Atlas of Social Protection Indicators of Resilience and Equity) (database), Administrative data, World Bank, Washington, DC, http://datatopics.worldbank.org/aspire/.

373
Appendix I
Generosity of Social Safety Net Programs
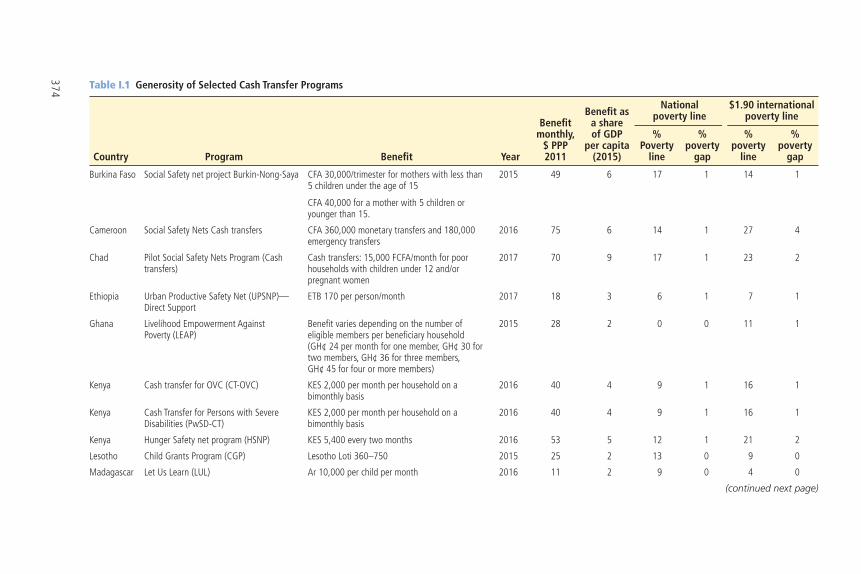
374 Table I.1 Generosity of Selected Cash Transfer Programs
Country Program Benefi t Year
Benefi t monthly,
$ PPP 2011
Benefi t as a share of GDP
per capita (2015)
National poverty line
$1.90 international poverty line
%Poverty
line
%poverty
gap
% poverty
line
% poverty
gap
Burkina Faso Social Safety net project Burkin-Nong-Saya CFA 30,000/trimester for mothers with less than 5 children under the age of 15
CFA 40,000 for a mother with 5 children or younger than 15.
2015 49 6 17 1 14 1
Cameroon Social Safety Nets Cash transfers CFA 360,000 monetary transfers and 180,000 emergency transfers
2016 75 6 14 1 27 4
Chad Pilot Social Safety Nets Program (Cash transfers)
Cash transfers: 15,000 FCFA/month for poor households with children under 12 and/or pregnant women
2017 70 9 17 1 23 2
Ethiopia Urban Productive Safety Net (UPSNP)—Direct Support
ETB 170 per person/month 2017 18 3 6 1 7 1
Ghana Livelihood Empowerment Against Poverty (LEAP)
Benefi t varies depending on the number of eligible members per benefi ciary household (GH¢ 24 per month for one member, GH¢ 30 for two members, GH¢ 36 for three members, GH¢ 45 for four or more members)
2015 28 2 0 0 11 1
Kenya Cash transfer for OVC (CT-OVC) KES 2,000 per month per household on a bimonthly basis
2016 40 4 9 1 16 1
Kenya Cash Transfer for Persons with Severe Disabilities (PwSD-CT)
KES 2,000 per month per household on a bimonthly basis
2016 40 4 9 1 16 1
Kenya Hunger Safety net program (HSNP) KES 5,400 every two months 2016 53 5 12 1 21 2
Lesotho Child Grants Program (CGP) Lesotho Loti 360–750 2015 25 2 13 0 9 0
Madagascar Let Us Learn (LUL) Ar 10,000 per child per month 2016 11 2 9 0 4 0
(continued next page)
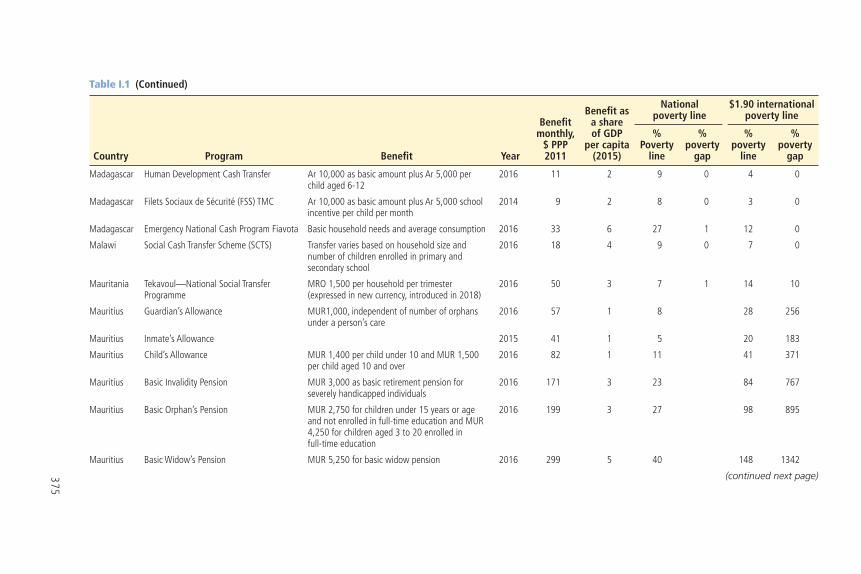
375
Table I.1 (Continued)
Country Program Benefi t Year
Benefi t monthly,
$ PPP 2011
Benefi t as a share of GDP
per capita (2015)
National poverty line
$1.90 international poverty line
%Poverty
line
%poverty
gap
% poverty
line
% poverty
gap
Madagascar Human Development Cash Transfer Ar 10,000 as basic amount plus Ar 5,000 per child aged 6-12
2016 11 2 9 0 4 0
Madagascar Filets Sociaux de Sécurité (FSS) TMC Ar 10,000 as basic amount plus Ar 5,000 school incentive per child per month
2014 9 2 8 0 3 0
Madagascar Emergency National Cash Program Fiavota Basic household needs and average consumption 2016 33 6 27 1 12 0
Malawi Social Cash Transfer Scheme (SCTS) Transfer varies based on household size and number of children enrolled in primary and secondary school
2016 18 4 9 0 7 0
Mauritania Tekavoul—National Social Transfer Programme
MRO 1,500 per household per trimester (expressed in new currency, introduced in 2018)
2016 50 3 7 1 14 10
Mauritius Guardian’s Allowance MUR1,000, independent of number of orphans under a person’s care
2016 57 1 8 28 256
Mauritius Inmate’s Allowance 2015 41 1 5 20 183
Mauritius Child’s Allowance MUR 1,400 per child under 10 and MUR 1,500 per child aged 10 and over
2016 82 1 11 41 371
Mauritius Basic Invalidity Pension MUR 3,000 as basic retirement pension for severely handicapped individuals
2016 171 3 23 84 767
Mauritius Basic Orphan’s Pension MUR 2,750 for children under 15 years or age and not enrolled in full-time education and MUR 4,250 for children aged 3 to 20 enrolled in full-time education
2016 199 3 27 98 895
Mauritius Basic Widow’s Pension MUR 5,250 for basic widow pension 2016 299 5 40 148 1342
(continued next page)
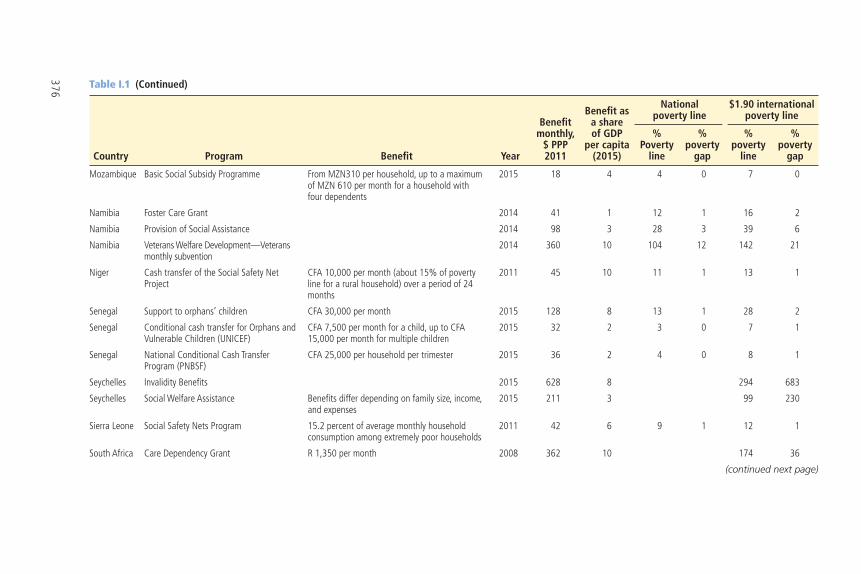
376 Table I.1 (Continued)
Country Program Benefi t Year
Benefi t monthly,
$ PPP 2011
Benefi t as a share of GDP
per capita (2015)
National poverty line
$1.90 international poverty line
%Poverty
line
%poverty
gap
% poverty
line
% poverty
gap
Mozambique Basic Social Subsidy Programme From MZN310 per household, up to a maximum of MZN 610 per month for a household with four dependents
2015 18 4 4 0 7 0
Namibia Foster Care Grant 2014 41 1 12 1 16 2
Namibia Provision of Social Assistance 2014 98 3 28 3 39 6
Namibia Veterans Welfare Development—Veterans monthly subvention
2014 360 10 104 12 142 21
Niger Cash transfer of the Social Safety Net Project
CFA 10,000 per month (about 15% of poverty line for a rural household) over a period of 24 months
2011 45 10 11 1 13 1
Senegal Support to orphans’ children CFA 30,000 per month 2015 128 8 13 1 28 2
Senegal Conditional cash transfer for Orphans and Vulnerable Children (UNICEF)
CFA 7,500 per month for a child, up to CFA 15,000 per month for multiple children
2015 32 2 3 0 7 1
Senegal National Conditional Cash Transfer Program (PNBSF)
CFA 25,000 per household per trimester 2015 36 2 4 0 8 1
Seychelles Invalidity Benefi ts 2015 628 8 294 683
Seychelles Social Welfare Assistance Benefi ts differ depending on family size, income, and expenses
2015 211 3 99 230
Sierra Leone Social Safety Nets Program 15.2 percent of average monthly household consumption among extremely poor households
2011 42 6 9 1 12 1
South Africa Care Dependency Grant R 1,350 per month 2008 362 10 174 36
(continued next page)
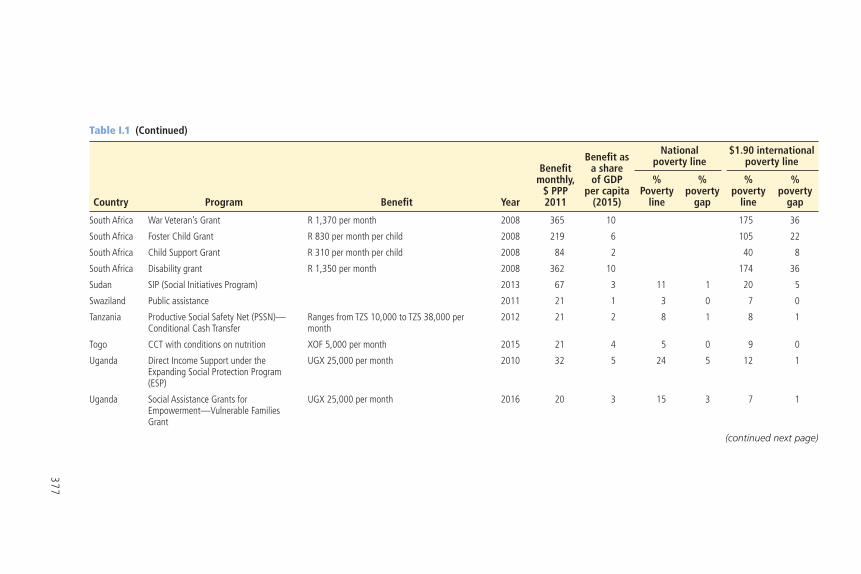
377
Table I.1 (Continued)
Country Program Benefi t Year
Benefi t monthly,
$ PPP 2011
Benefi t as a share of GDP
per capita (2015)
National poverty line
$1.90 international poverty line
%Poverty
line
%poverty
gap
% poverty
line
% poverty
gap
South Africa War Veteran’s Grant R 1,370 per month 2008 365 10 175 36
South Africa Foster Child Grant R 830 per month per child 2008 219 6 105 22
South Africa Child Support Grant R 310 per month per child 2008 84 2 40 8
South Africa Disability grant R 1,350 per month 2008 362 10 174 36
Sudan SIP (Social Initiatives Program) 2013 67 3 11 1 20 5
Swaziland Public assistance 2011 21 1 3 0 7 0
Tanzania Productive Social Safety Net (PSSN)—Conditional Cash Transfer
Ranges from TZS 10,000 to TZS 38,000 per month
2012 21 2 8 1 8 1
Togo CCT with conditions on nutrition XOF 5,000 per month 2015 21 4 5 0 9 0
Uganda Direct Income Support under the Expanding Social Protection Program (ESP)
UGX 25,000 per month 2010 32 5 24 5 12 1
Uganda Social Assistance Grants for Empowerment—Vulnerable Families Grant
UGX 25,000 per month 2016 20 3 15 3 7 1
(continued next page)
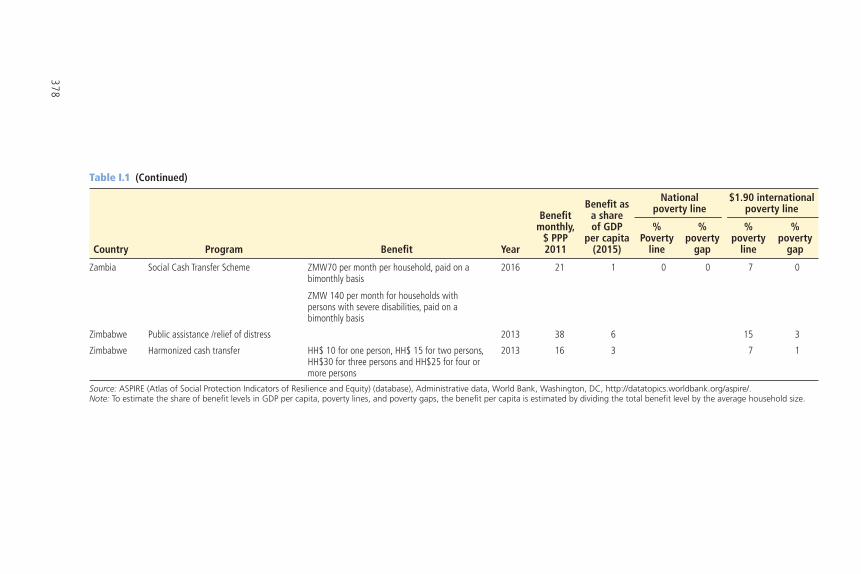
378
Table I.1 (Continued)
Country Program Benefi t Year
Benefi t monthly,
$ PPP 2011
Benefi t as a share of GDP
per capita (2015)
National poverty line
$1.90 international poverty line
%Poverty
line
%poverty
gap
% poverty
line
% poverty
gap
Zambia Social Cash Transfer Scheme ZMW70 per month per household, paid on a bimonthly basis
ZMW 140 per month for households with persons with severe disabilities, paid on a bimonthly basis
2016 21 1 0 0 7 0
Zimbabwe Public assistance /relief of distress 2013 38 6 15 3
Zimbabwe Harmonized cash transfer HH$ 10 for one person, HH$ 15 for two persons, HH$30 for three persons and HH$25 for four or more persons
2013 16 3 7 1
Source: ASPIRE (Atlas of Social Protection Indicators of Resilience and Equity) (database), Administrative data, World Bank, Washington, DC, http://datatopics.worldbank.org/aspire/. Note: To estimate the share of benefit levels in GDP per capita, poverty lines, and poverty gaps, the benefit per capita is estimated by dividing the total benefit level by the average household size.
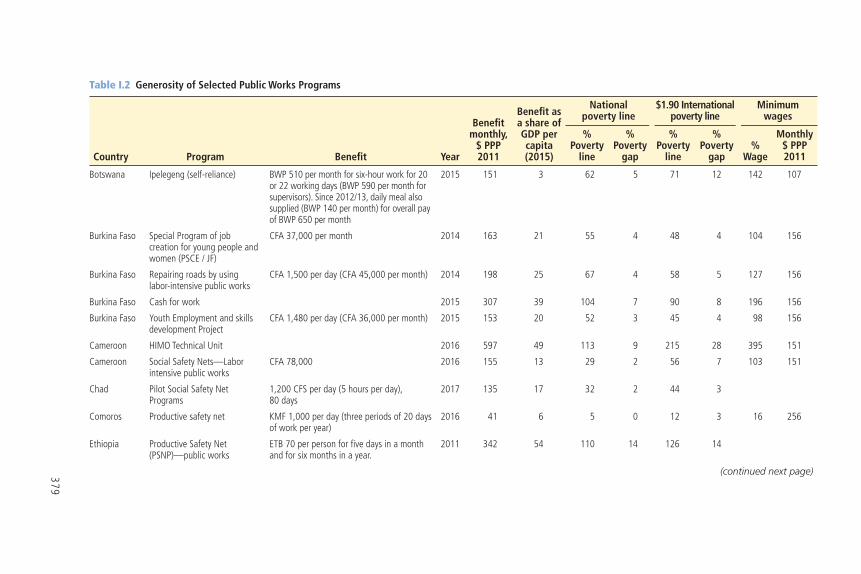
379
Table I.2 Generosity of Selected Public Works Programs
Country Program Benefi t Year
Benefi t monthly,
$ PPP 2011
Benefi t as a share of GDP per capita (2015)
National poverty line
$1.90 International poverty line
Minimum wages
% Poverty
line
% Poverty
gap
% Poverty
line
% Poverty
gap%
Wage
Monthly $ PPP 2011
Botswana Ipelegeng (self-reliance) BWP 510 per month for six-hour work for 20 or 22 working days (BWP 590 per month for supervisors). Since 2012/13, daily meal also supplied (BWP 140 per month) for overall pay of BWP 650 per month
2015 151 3 62 5 71 12 142 107
Burkina Faso Special Program of job creation for young people and women (PSCE / JF)
CFA 37,000 per month 2014 163 21 55 4 48 4 104 156
Burkina Faso Repairing roads by using labor-intensive public works
CFA 1,500 per day (CFA 45,000 per month) 2014 198 25 67 4 58 5 127 156
Burkina Faso Cash for work 2015 307 39 104 7 90 8 196 156
Burkina Faso Youth Employment and skills development Project
CFA 1,480 per day (CFA 36,000 per month) 2015 153 20 52 3 45 4 98 156
Cameroon HIMO Technical Unit 2016 597 49 113 9 215 28 395 151
Cameroon Social Safety Nets—Labor intensive public works
CFA 78,000 2016 155 13 29 2 56 7 103 151
Chad Pilot Social Safety Net Programs
1,200 CFS per day (5 hours per day), 80 days
2017 135 17 32 2 44 3
Comoros Productive safety net KMF 1,000 per day (three periods of 20 days of work per year)
2016 41 6 5 0 12 3 16 256
Ethiopia Productive Safety Net (PSNP)—public works
ETB 70 per person for fi ve days in a month and for six months in a year.
2011 342 54 110 14 126 14
(continued next page)
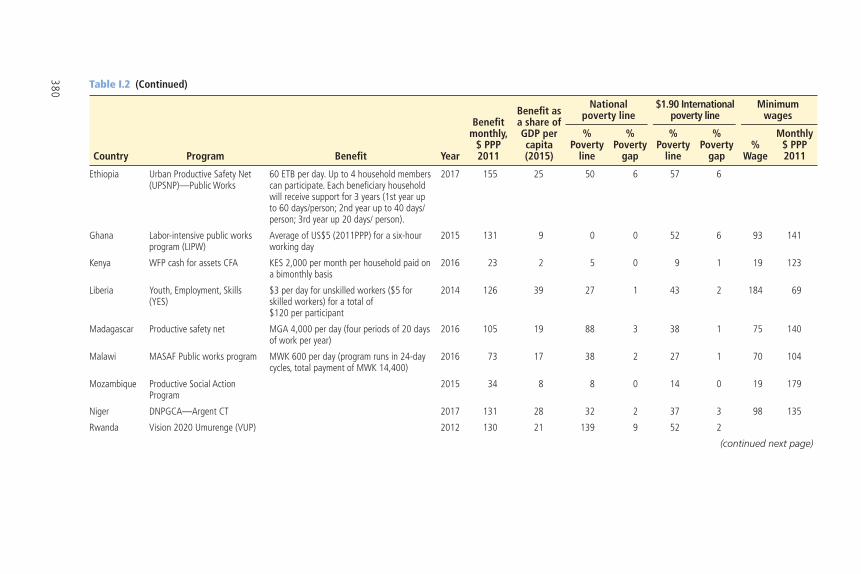
380 Table I.2 (Continued)
Country Program Benefi t Year
Benefi t monthly,
$ PPP 2011
Benefi t as a share of GDP per capita (2015)
National poverty line
$1.90 International poverty line
Minimum wages
% Poverty
line
% Poverty
gap
% Poverty
line
% Poverty
gap%
Wage
Monthly $ PPP 2011
Ethiopia Urban Productive Safety Net (UPSNP)—Public Works
60 ETB per day. Up to 4 household members can participate. Each benefi ciary household will receive support for 3 years (1st year up to 60 days/person; 2nd year up to 40 days/ person; 3rd year up 20 days/ person).
2017 155 25 50 6 57 6
Ghana Labor-intensive public works program (LIPW)
Average of US$5 (2011PPP) for a six-hour working day
2015 131 9 0 0 52 6 93 141
Kenya WFP cash for assets CFA KES 2,000 per month per household paid on a bimonthly basis
2016 23 2 5 0 9 1 19 123
Liberia Youth, Employment, Skills (YES)
$3 per day for unskilled workers ($5 for skilled workers) for a total of $120 per participant
2014 126 39 27 1 43 2 184 69
Madagascar Productive safety net MGA 4,000 per day (four periods of 20 days of work per year)
2016 105 19 88 3 38 1 75 140
Malawi MASAF Public works program MWK 600 per day (program runs in 24-day cycles, total payment of MWK 14,400)
2016 73 17 38 2 27 1 70 104
Mozambique Productive Social Action Program
2015 34 8 8 0 14 0 19 179
Niger DNPGCA—Argent CT 2017 131 28 32 2 37 3 98 135
Rwanda Vision 2020 Umurenge (VUP) 2012 130 21 139 9 52 2
(continued next page)
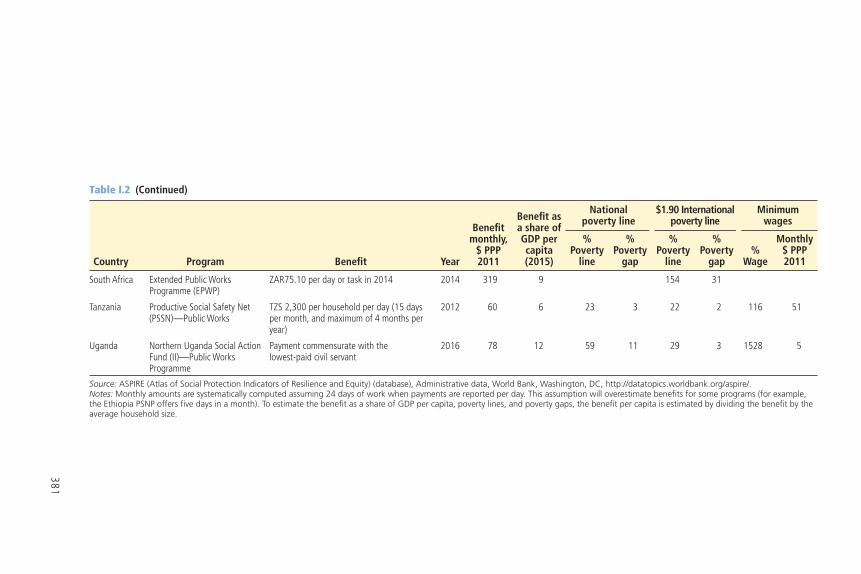
381
Table I.2 (Continued)
Country Program Benefi t Year
Benefi t monthly,
$ PPP 2011
Benefi t as a share of GDP per capita (2015)
National poverty line
$1.90 International poverty line
Minimum wages
% Poverty
line
% Poverty
gap
% Poverty
line
% Poverty
gap%
Wage
Monthly $ PPP 2011
South Africa Extended Public Works Programme (EPWP)
ZAR75.10 per day or task in 2014 2014 319 9 154 31
Tanzania Productive Social Safety Net (PSSN)—Public Works
TZS 2,300 per household per day (15 days per month, and maximum of 4 months per year)
2012 60 6 23 3 22 2 116 51
Uganda Northern Uganda Social Action Fund (II)—Public Works Programme
Payment commensurate with the lowest-paid civil servant
2016 78 12 59 11 29 3 1528 5
Source: ASPIRE (Atlas of Social Protection Indicators of Resilience and Equity) (database), Administrative data, World Bank, Washington, DC, http://datatopics.worldbank.org/aspire/. Notes: Monthly amounts are systematically computed assuming 24 days of work when payments are reported per day. This assumption will overestimate benefits for some programs (for example, the Ethiopia PSNP offers five days in a month). To estimate the benefit as a share of GDP per capita, poverty lines, and poverty gaps, the benefit per capita is estimated by dividing the benefit by the average household size.
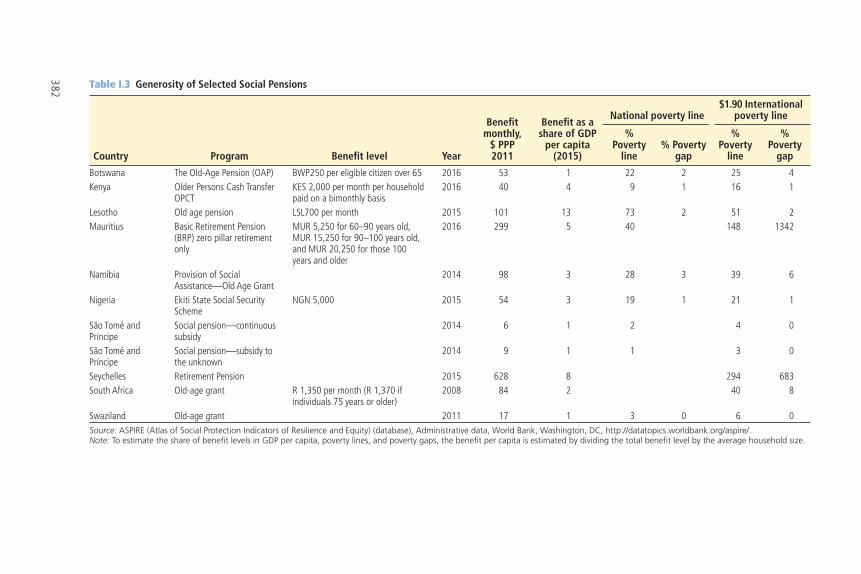
382 Table I.3 Generosity of Selected Social Pensions
Country Program Benefi t level Year
Benefi t monthly,
$ PPP 2011
Benefi t as a share of GDP
per capita (2015)
National poverty line$1.90 International
poverty line
% Poverty
line% Poverty
gap
% Poverty
line
% Poverty
gap
Botswana The Old-Age Pension (OAP) BWP250 per eligible citizen over 65 2016 53 1 22 2 25 4Kenya Older Persons Cash Transfer
OPCTKES 2,000 per month per household paid on a bimonthly basis
2016 40 4 9 1 16 1
Lesotho Old age pension LSL700 per month 2015 101 13 73 2 51 2Mauritius Basic Retirement Pension
(BRP) zero pillar retirement only
MUR 5,250 for 60–90 years old, MUR 15,250 for 90–100 years old, and MUR 20,250 for those 100 years and older
2016 299 5 40 148 1342
Namibia Provision of Social Assistance—Old Age Grant
2014 98 3 28 3 39 6
Nigeria Ekiti State Social Security Scheme
NGN 5,000 2015 54 3 19 1 21 1
São Tomé and Príncipe
Social pension—continuous subsidy
2014 6 1 2 4 0
São Tomé and Príncipe
Social pension—subsidy to the unknown
2014 9 1 1 3 0
Seychelles Retirement Pension 2015 628 8 294 683South Africa Old-age grant R 1,350 per month (R 1,370 if
individuals 75 years or older) 2008 84 2 40 8
Swaziland Old-age grant 2011 17 1 3 0 6 0Source: ASPIRE (Atlas of Social Protection Indicators of Resilience and Equity) (database), Administrative data, World Bank, Washington, DC, http://datatopics.worldbank.org/aspire/.Note: To estimate the share of benefit levels in GDP per capita, poverty lines, and poverty gaps, the benefit per capita is estimated by dividing the total benefit level by the average household size.
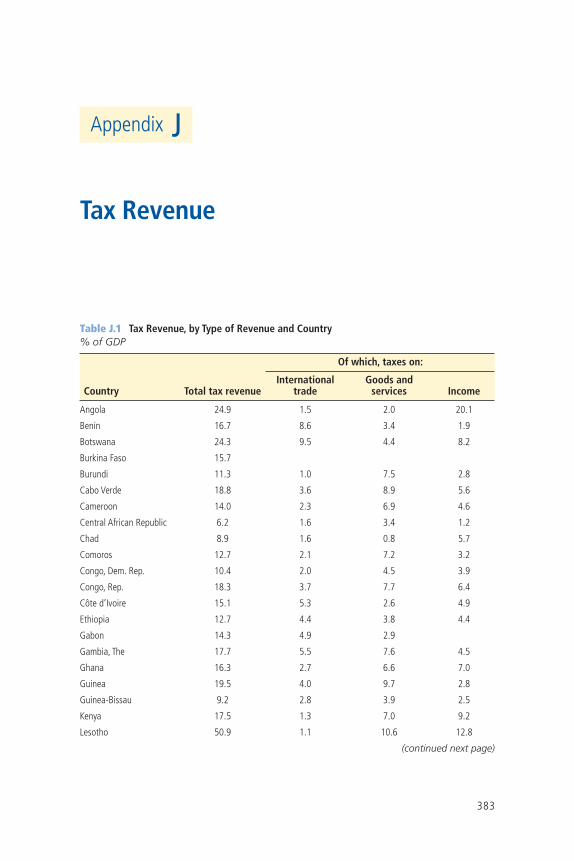
383
Appendix J
Tax Revenue
Table J.1 Tax Revenue, by Type of Revenue and Country% of GDP
Country Total tax revenue
Of which, taxes on:
International trade
Goods and services Income
Angola 24.9 1.5 2.0 20.1
Benin 16.7 8.6 3.4 1.9
Botswana 24.3 9.5 4.4 8.2
Burkina Faso 15.7
Burundi 11.3 1.0 7.5 2.8
Cabo Verde 18.8 3.6 8.9 5.6
Cameroon 14.0 2.3 6.9 4.6
Central African Republic 6.2 1.6 3.4 1.2
Chad 8.9 1.6 0.8 5.7
Comoros 12.7 2.1 7.2 3.2
Congo, Dem. Rep. 10.4 2.0 4.5 3.9
Congo, Rep. 18.3 3.7 7.7 6.4
Côte d’Ivoire 15.1 5.3 2.6 4.9
Ethiopia 12.7 4.4 3.8 4.4
Gabon 14.3 4.9 2.9
Gambia, The 17.7 5.5 7.6 4.5
Ghana 16.3 2.7 6.6 7.0
Guinea 19.5 4.0 9.7 2.8
Guinea-Bissau 9.2 2.8 3.9 2.5
Kenya 17.5 1.3 7.0 9.2
Lesotho 50.9 1.1 10.6 12.8
(continued next page)
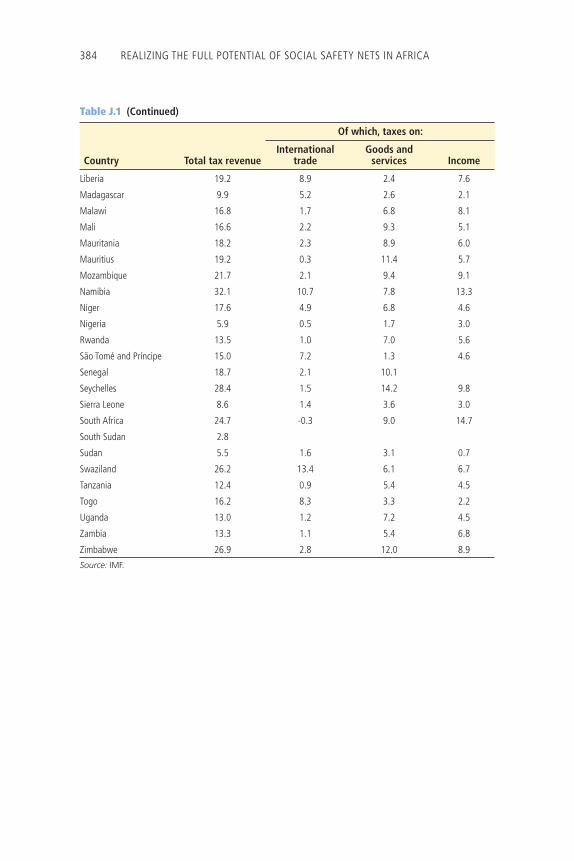
384 REALIZING THE FULL POTENTIAL OF SOCIAL SAFETY NETS IN AFRICA
Table J.1 (Continued)
Country Total tax revenue
Of which, taxes on:
International trade
Goods and services Income
Liberia 19.2 8.9 2.4 7.6
Madagascar 9.9 5.2 2.6 2.1
Malawi 16.8 1.7 6.8 8.1
Mali 16.6 2.2 9.3 5.1
Mauritania 18.2 2.3 8.9 6.0
Mauritius 19.2 0.3 11.4 5.7
Mozambique 21.7 2.1 9.4 9.1
Namibia 32.1 10.7 7.8 13.3
Niger 17.6 4.9 6.8 4.6
Nigeria 5.9 0.5 1.7 3.0
Rwanda 13.5 1.0 7.0 5.6
São Tomé and Príncipe 15.0 7.2 1.3 4.6
Senegal 18.7 2.1 10.1
Seychelles 28.4 1.5 14.2 9.8
Sierra Leone 8.6 1.4 3.6 3.0
South Africa 24.7 -0.3 9.0 14.7
South Sudan 2.8
Sudan 5.5 1.6 3.1 0.7
Swaziland 26.2 13.4 6.1 6.7
Tanzania 12.4 0.9 5.4 4.5
Togo 16.2 8.3 3.3 2.2
Uganda 13.0 1.2 7.2 4.5
Zambia 13.3 1.1 5.4 6.8
Zimbabwe 26.9 2.8 12.0 8.9
Source: IMF.
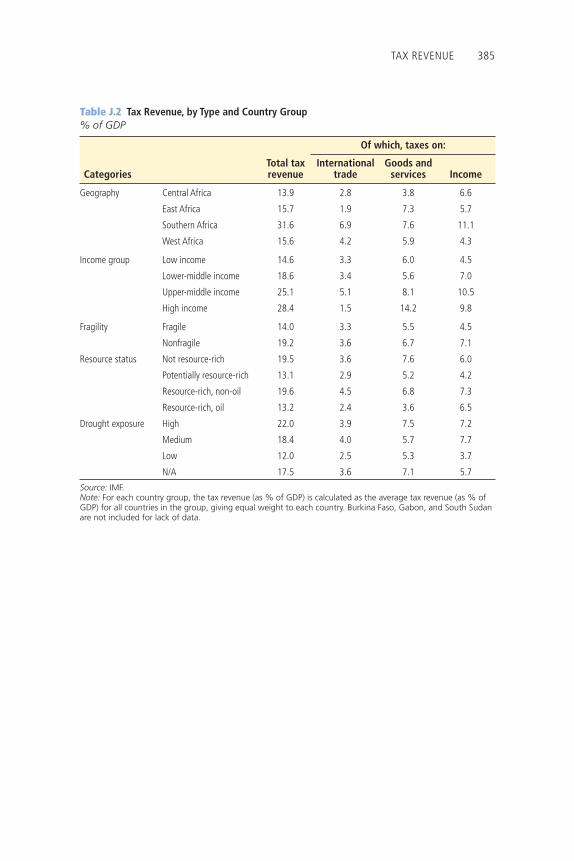
TAX REVENUE 385
Table J.2 Tax Revenue, by Type and Country Group% of GDP
CategoriesTotal tax revenue
Of which, taxes on:
International trade
Goods and services Income
Geography
Central Africa 13.9 2.8 3.8 6.6
East Africa 15.7 1.9 7.3 5.7
Southern Africa 31.6 6.9 7.6 11.1
West Africa 15.6 4.2 5.9 4.3
Income group
Low income 14.6 3.3 6.0 4.5
Lower-middle income 18.6 3.4 5.6 7.0
Upper-middle income 25.1 5.1 8.1 10.5
High income 28.4 1.5 14.2 9.8
Fragility Fragile 14.0 3.3 5.5 4.5
Nonfragile 19.2 3.6 6.7 7.1
Resource status Not resource-rich 19.5 3.6 7.6 6.0
Potentially resource-rich 13.1 2.9 5.2 4.2
Resource-rich, non-oil 19.6 4.5 6.8 7.3
Resource-rich, oil 13.2 2.4 3.6 6.5
Drought exposure High 22.0 3.9 7.5 7.2
Medium 18.4 4.0 5.7 7.7
Low 12.0 2.5 5.3 3.7
N/A 17.5 3.6 7.1 5.7
Source: IMF.Note: For each country group, the tax revenue (as % of GDP) is calculated as the average tax revenue (as % of GDP) for all countries in the group, giving equal weight to each country. Burkina Faso, Gabon, and South Sudan are not included for lack of data.
Environmental Benefits StatementTh e World Bank Group is committed to reducing its environmental footprint. In support of this commitment, we leverage electronic publishing options and print-on-demand technology, which is located in regional hubs worldwide. Together, these initiatives enable print runs to be lowered and shipping distances decreased, resulting in reduced paper consumption, chemical use, greenhouse gas emissions, and waste.
We follow the recommended standards for paper use set by the Green Press Initiative. Th e majority of our books are printed on Forest Stewardship Council (FSC)–certifi ed paper, with nearly all containing 50–100 percent recycled content. Th e recy-cled fi ber in our book paper is either unbleached or bleached using totally chlorine-free (TCF), processed chlorine–free (PCF), or enhanced elemental chlorine–free (EECF) processes.
More information about the Bank’s environmental philosophy can be found at http://www .worldbank.org/corporateresponsibility.