Embed Size (px)
Citation preview
1RtgspscdmttoNsattpwarmmeL2af1nT[(
Li et al. Vol. 27, No. 11 /November 2010 /J. Opt. Soc. Am. A 2381
Real-time terahertz scanning imaging by use of apyroelectric array camera and image denoising
Qi Li,* Sheng-Hui Ding, Rui Yao, and Qi Wang
National Key Laboratory of Tunable Laser Technology, Harbin Institute of Technology, P.O. Box 3031,No. 2 YiKuang Street, Harbin 150080, China
*Corresponding author: [email protected]
Received August 26, 2010; revised September 20, 2010; accepted September 21, 2010;posted September 21, 2010 (Doc. ID 133761); published October 11, 2010
A high-resolution large-area terahertz (THz) scanning imaging system is demonstrated based on a 124�124pyroelectric array camera and a CO2 pumped continuous-wave THz laser. By applying a scanning mechanismto the real-time imaging setup, images of large-area targets were accomplished. Self-made resolution chartswere employed to test the resolution. In order to improve the image quality, the noise in the images was stud-ied and modeled, and then the performance of several denoising methods was compared with real-time THzoriginal images. The experimental results show that, with the help of anisotropic diffusion, noise can be effec-tively suppressed, and the results are visually pleasant even when there is great attenuation. Those resultsgreatly confirm application potentials of THz imaging using pyroelectric cameras in the field of concealed ob-ject detection. © 2010 Optical Society of America
OCIS codes: 110.6795, 100.2000.
fweplwwcftdaccegT
gsMaismmspcecnwc
. INTRODUCTIONecently, the development of terahertz (THz) science and
echnology has received worldwide attention [1]. Investi-ation of THz imaging techniques is an important re-earch focus among them. THz imaging has extensive ap-lication potentials in many fields, such as biomedicalcience [2], non-destructive evaluation [3], and securityontrol [4]. Because point scanning imaging takes a lot ofata acquisition time [5–7], which cannot meet the de-and for fast imaging in most applications, real-time
wo-dimensional (2D) imaging system is always an impor-ant research goal. One year after the first demonstrationf imaging with coherent far-infrared pulses by Hu anduss [5], real-time 2D imaging based on electro-optic
ampling was demonstrated by Wu et al. [8]. Both phasend amplitude information of THz radiation can be ob-ained using the electro-optic sampling method. However,hose systems always employ bulky and expensive Ti:sap-hire femtosecond lasers, and the alignment is difficult,hich constrains their commercial applications [9]. So im-ging with a 2D THz detector array is another importantesearch focus. Those imaging systems are easier andore convenient to use and have great potential for com-ercial application. The first application of a microbolom-
ter array in real-time THz imaging was demonstrated byee and Hu in 2005 [10]. The illumination source was a.52 THz CO2 pumped gas laser with 10 mW output. Therray size was 160�120, and the video rate was 60rames/s. The peak signal-to-noise ratio (SNR) was about3 dB, and the calculated resolution was about 1.5 mm. Aumber of researches on real-time 2D THz imaging usingHz detector arrays were subsequently demonstrated
11–14]. The utilization of a high power free electron laserwith an average output power of 20 W) raised the video
1084-7529/10/112381-6/$15.00 © 2
rames to 90 Hz [11], and the spatial resolution at 130 �mas about 0.7 mm. A 320�240 microbolometer array wasmployed to image pencil letters written on the inside of aaper security envelope (�14 dB loss at 4.3 THz). The il-umination source was a 4.3 THz quantum cascade laserith an average output power of 50 mW. The video rateas 20 frames/s, and the SNR was about 340. Besides mi-
robolometer arrays, a pyroelectric array was also utilizedor real-time 2D THz imaging [15–17]. Despite the rela-ively smaller array size and lower sensitivity to THz ra-iation, pyroelectric array cameras are now commerciallyvailable with lower cost and are easier to use. Thoseharacters make pyroelectric array cameras much moreonvenient for practical use. Investigations utilizing pyro-lectric arrays are of great importance and could provideuidance for the application and development of real-timeHz imaging.Of all the reported real-time 2D THz imaging investi-
ations, the imaging results are not satisfying. The imageize was constrained by the size of the detector array.oreover, due to the limited output power of THz sources
nd low sensitivity of the detector array, the image qual-ty is greatly influenced by noise. Those constraints maketate-of-the-art THz imaging systems fail to meet the de-and of many real-time applications. To fulfill these de-ands, in this paper, a high-resolution large-area THz
canning imaging system was built based on a CO2umped gas laser and a commercial pyroelectric arrayamera (Pyrocam III from Ophir-Spiricon Inc.). Imagingxperiments were performed to test the system’s imagingapability. The image statistics were studied to help de-oising the image. Finally, several denoising methodsere applied to denoise the image, and the results were
ompared.
010 Optical Society of America
2TTp1�
dqc(nioalifltcwikttPufpil4a2brasattss
3AAspefls4ipircstla3wfnHtt
BAtemofawetctsadDapsosas
Fl
Fd
2382 J. Opt. Soc. Am. A/Vol. 27, No. 11 /November 2010 Li et al.
. EXPERIMENTAL SETUPhe illumination source is SIFIR-50 from Coherent Inc.he operating frequency is 2.52 THz, and the average out-ut power is 50 mW. The size of the detector array is2.4 mm�12.4 mm, and the number of elements is 124124. The spectral response is from 1.06 to 1000 �m. To
etect the continuous-wave (CW) power, there is a fre-uency chopper enclosed inside. In the experiment, thehopping frequency was set at 48 Hz. The sensitivityroot-mean-square noise limit) is 3.2 mW/cm2, and theoise equivalent power is about 45 nW/Hz1/2. The imag-
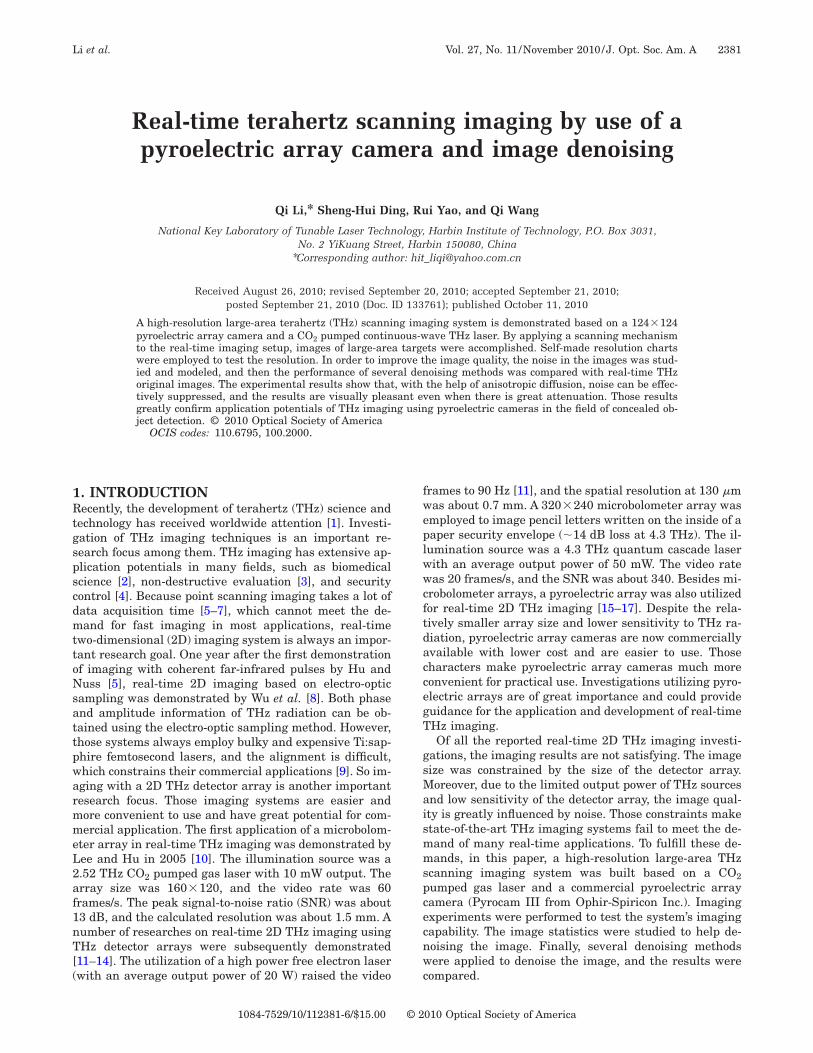
ng system is schematically depicted in Fig. 1. M1–M3 areff-axis parabolic mirrors with focal lengths of 5.08, 10.16,nd 15.24 cm, respectively. M1 is placed 18.5 cm after theaser output. Light is expanded by M1 and M2 and thenlluminates the object. The placement of the object can beexible between M2 and M3 and has little influence onhe imaging result as long as the locality of the arrayamera is adjusted accordingly. M4 is a polyethylene lensith a focal length of 12 cm. The width of the beam spot
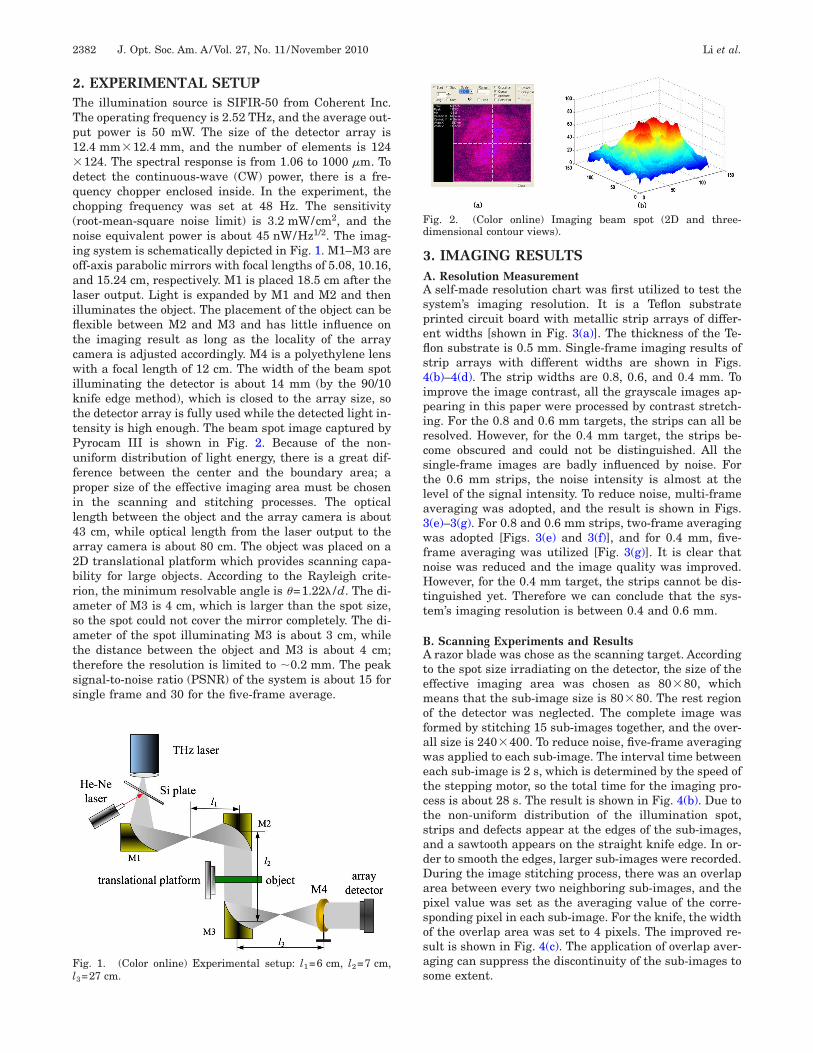
lluminating the detector is about 14 mm (by the 90/10nife edge method), which is closed to the array size, sohe detector array is fully used while the detected light in-ensity is high enough. The beam spot image captured byyrocam III is shown in Fig. 2. Because of the non-niform distribution of light energy, there is a great dif-erence between the center and the boundary area; aroper size of the effective imaging area must be chosenn the scanning and stitching processes. The opticalength between the object and the array camera is about3 cm, while optical length from the laser output to therray camera is about 80 cm. The object was placed on aD translational platform which provides scanning capa-ility for large objects. According to the Rayleigh crite-ion, the minimum resolvable angle is �=1.22� /d. The di-meter of M3 is 4 cm, which is larger than the spot size,o the spot could not cover the mirror completely. The di-meter of the spot illuminating M3 is about 3 cm, whilehe distance between the object and M3 is about 4 cm;herefore the resolution is limited to �0.2 mm. The peakignal-to-noise ratio (PSNR) of the system is about 15 foringle frame and 30 for the five-frame average.
ig. 1. (Color online) Experimental setup: l1=6 cm, l2=7 cm,=27 cm.
3. IMAGING RESULTS. Resolution Measurementself-made resolution chart was first utilized to test the
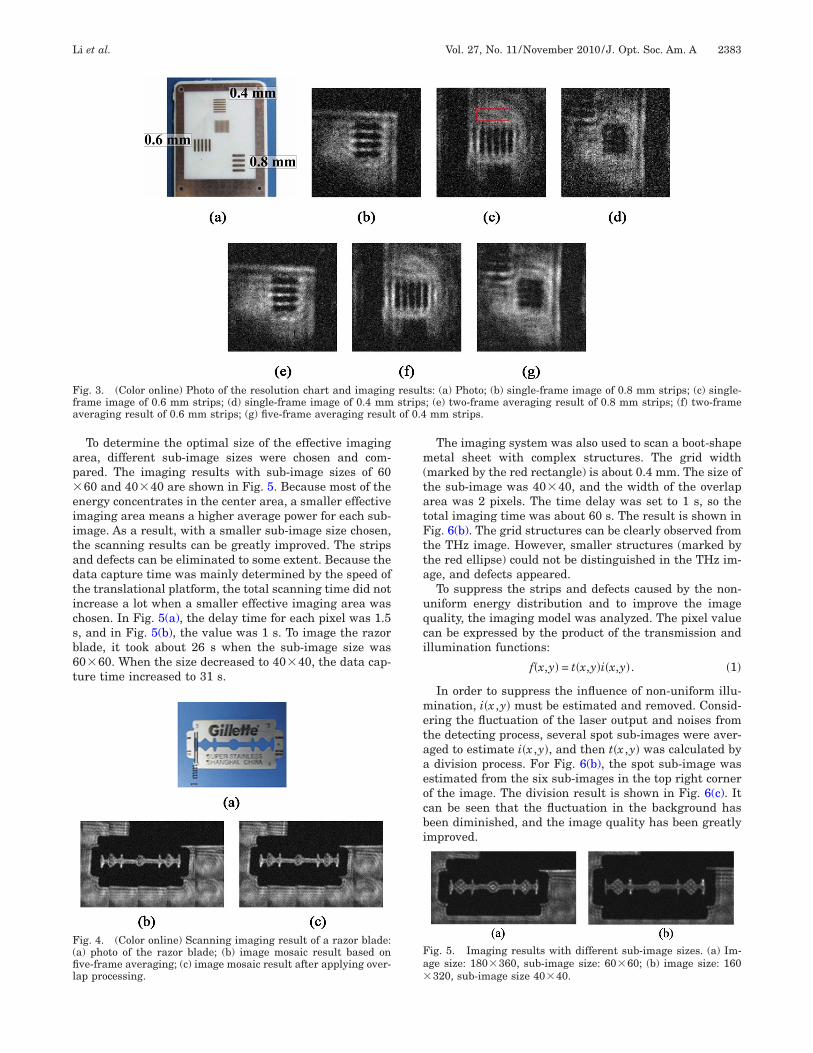
ystem’s imaging resolution. It is a Teflon substraterinted circuit board with metallic strip arrays of differ-nt widths [shown in Fig. 3(a)]. The thickness of the Te-on substrate is 0.5 mm. Single-frame imaging results oftrip arrays with different widths are shown in Figs.(b)–4(d). The strip widths are 0.8, 0.6, and 0.4 mm. Tomprove the image contrast, all the grayscale images ap-earing in this paper were processed by contrast stretch-ng. For the 0.8 and 0.6 mm targets, the strips can all beesolved. However, for the 0.4 mm target, the strips be-ome obscured and could not be distinguished. All theingle-frame images are badly influenced by noise. Forhe 0.6 mm strips, the noise intensity is almost at theevel of the signal intensity. To reduce noise, multi-frameveraging was adopted, and the result is shown in Figs.(e)–3(g). For 0.8 and 0.6 mm strips, two-frame averagingas adopted [Figs. 3(e) and 3(f)], and for 0.4 mm, five-
rame averaging was utilized [Fig. 3(g)]. It is clear thatoise was reduced and the image quality was improved.owever, for the 0.4 mm target, the strips cannot be dis-
inguished yet. Therefore we can conclude that the sys-em’s imaging resolution is between 0.4 and 0.6 mm.
. Scanning Experiments and Resultsrazor blade was chose as the scanning target. According
o the spot size irradiating on the detector, the size of theffective imaging area was chosen as 80�80, whicheans that the sub-image size is 80�80. The rest region
f the detector was neglected. The complete image wasormed by stitching 15 sub-images together, and the over-ll size is 240�400. To reduce noise, five-frame averagingas applied to each sub-image. The interval time betweenach sub-image is 2 s, which is determined by the speed ofhe stepping motor, so the total time for the imaging pro-ess is about 28 s. The result is shown in Fig. 4(b). Due tohe non-uniform distribution of the illumination spot,trips and defects appear at the edges of the sub-images,nd a sawtooth appears on the straight knife edge. In or-er to smooth the edges, larger sub-images were recorded.uring the image stitching process, there was an overlaprea between every two neighboring sub-images, and theixel value was set as the averaging value of the corre-ponding pixel in each sub-image. For the knife, the widthf the overlap area was set to 4 pixels. The improved re-ult is shown in Fig. 4(c). The application of overlap aver-ging can suppress the discontinuity of the sub-images toome extent.
ig. 2. (Color online) Imaging beam spot (2D and three-imensional contour views).
ap�eiitadticsb6t
m(tatFtta
uqci
metaaeocbi
Ffa t of 0.4
F(fil
Fa�
Li et al. Vol. 27, No. 11 /November 2010 /J. Opt. Soc. Am. A 2383
To determine the optimal size of the effective imagingrea, different sub-image sizes were chosen and com-ared. The imaging results with sub-image sizes of 6060 and 40�40 are shown in Fig. 5. Because most of the
nergy concentrates in the center area, a smaller effectivemaging area means a higher average power for each sub-mage. As a result, with a smaller sub-image size chosen,he scanning results can be greatly improved. The stripsnd defects can be eliminated to some extent. Because theata capture time was mainly determined by the speed ofhe translational platform, the total scanning time did notncrease a lot when a smaller effective imaging area washosen. In Fig. 5(a), the delay time for each pixel was 1.5, and in Fig. 5(b), the value was 1 s. To image the razorlade, it took about 26 s when the sub-image size was0�60. When the size decreased to 40�40, the data cap-ure time increased to 31 s.
ig. 3. (Color online) Photo of the resolution chart and imagingrame image of 0.6 mm strips; (d) single-frame image of 0.4 mmveraging result of 0.6 mm strips; (g) five-frame averaging resul
ig. 4. (Color online) Scanning imaging result of a razor blade:a) photo of the razor blade; (b) image mosaic result based onve-frame averaging; (c) image mosaic result after applying over-
ap processing.
The imaging system was also used to scan a boot-shapeetal sheet with complex structures. The grid width
marked by the red rectangle) is about 0.4 mm. The size ofhe sub-image was 40�40, and the width of the overlaprea was 2 pixels. The time delay was set to 1 s, so theotal imaging time was about 60 s. The result is shown inig. 6(b). The grid structures can be clearly observed fromhe THz image. However, smaller structures (marked byhe red ellipse) could not be distinguished in the THz im-ge, and defects appeared.To suppress the strips and defects caused by the non-
niform energy distribution and to improve the imageuality, the imaging model was analyzed. The pixel valuean be expressed by the product of the transmission andllumination functions:
f�x,y� = t�x,y�i�x,y�. �1�
In order to suppress the influence of non-uniform illu-ination, i�x ,y� must be estimated and removed. Consid-
ring the fluctuation of the laser output and noises fromhe detecting process, several spot sub-images were aver-ged to estimate i�x ,y�, and then t�x ,y� was calculated bydivision process. For Fig. 6(b), the spot sub-image was
stimated from the six sub-images in the top right cornerf the image. The division result is shown in Fig. 6(c). Itan be seen that the fluctuation in the background haseen diminished, and the image quality has been greatlymproved.
ts: (a) Photo; (b) single-frame image of 0.8 mm strips; (c) single-; (e) two-frame averaging result of 0.8 mm strips; (f) two-framemm strips.
ig. 5. Imaging results with different sub-image sizes. (a) Im-ge size: 180�360, sub-image size: 60�60; (b) image size: 160320, sub-image size 40�40.
resulstrips
4Dshttqn“sfhst�vfi[bvsBp
rfittsasstmtdwcdiesc
wgsew
wsovwws
iakadinP
wt
atodF
F(o
F(i
2384 J. Opt. Soc. Am. A/Vol. 27, No. 11 /November 2010 Li et al.
. IMAGE DENOISING AND RESULTSue to the limited output power of THz sources and low
ensitivity of the detector array, the obtained image oftenas a low SNR. From the above results, it can be seenhat the image quality is badly influenced, so it is essen-ial to apply image processing tools to enhance the imageuality. Before removing the noise, it should be recog-ized and modeled first. To estimate the noise model, aflat” area that is illuminated uniformly is needed. Thetrip (of 16�38 pixels) shown in Fig. 7(a) was croppedrom Fig. 3(c) (marked out by a red rectangle), and theistogram was calculated using the image data. It can beeen that the shape closely corresponds to a Gaussian dis-ribution, and the calculated variance of the gray level is2=0.0025. For convenience, the gray levels were con-erted to 0–1 from 0–255. Then the same area from theve-frame averaging result was chosen and observedshown in Fig. 7(b)]. The result is still a Gaussian distri-ution, but the variance decreases to 0.001. From obser-ation results of several images, we find (results nothown) that the noise can be modeled as Gaussian noise.y applying multi-frame averaging, the noise can be sup-ressed to some extent.
ig. 6. (Color online) Scanning imaging result of a metal sheet:a) photo of metal sheet; (b) five-frame averaging result; (c) resultf background removing.
ig. 7. (Color online) Histograms computed using small stripsshown as inserts): (a) single-frame image; (b) five-frame averag-ng result.
There are lots of sophisticated image denoising algo-ithms that can be used for THz images, such as Gaussianltering [18], median filtering [19], etc. However, tradi-ional filtering methods smooth both intraregion and in-erregion of the image, so the edges cannot be well pre-erved while the noise is suppressed. Shen et al. adoptedn anisotropic diffusion algorithm to denoise scanning re-ults of a passive THz imaging system [20]. Their imagingystem was based on a single-pixel microbolometer. Inheir work, anisotropic diffusion based on the Tukeyodel was used to denoise the images before segmenta-
ion. The result was satisfying and was almost as good asenoising result of the nonlocal (NL)-means algorithm,hile the NL-means algorithm is much more time-
onsuming. Introduced by Perona and Malik, anisotropiciffusion is a prevalent partial differential equation basedmage denoising method. The method encourages intrar-gion smoothing in preference to interregion smoothing,o region boundaries can remain sharp [21]. The modelan be expressed as
�f�x,y,t�
�t= div�g���f�x,y,t��� � f�x,y,t��,
f�x,y,t��t=0 = f�x,y,0�, �2�
here the initial f�x ,y ,0� is the noisy image. The function� � determines the diffusion coefficient, and there areeveral choices. In this paper, we chose the conduction co-fficient function proposed by Perona and Malik in [21],hich can be expressed as
g���f�� = 1/�1 + �f/k�2, �3�
here k is the gradient modulus threshold. The scale-pace generated by the function privileges wide regionsver smaller ones. The threshold k can be set as a fixedalue or be calculated at every iteration. By comparison,e found that a fixed value of k for certain attenuationould exhibit a more satisfying denoising result for the
ystem.To compare the denoising results of different methods
n terms of the output root-mean-squared error (RMSE)nd PSNR, the original images without noise should benown. Referring to [20] where the “cleaned” original im-ge was obtained by a light denoising with the anisotropiciffusion, we estimated the original image f0�x ,y� by us-ng the denoised five-frame averaging images after de-oising with the anisotropic diffusion. The RMSE andSNR are defined as
RMSE = �� � ��f�x,y� − f0�x,y��2/MN�1/2� , �4�
PSNR = 20 log10�255/RMSE�, �5�
here f�x ,y� is the denoised image, and M�N refers tohe image size.
For a real-time application purpose, only fast denoisinglgorithms were considered. In this paper, we comparehe performance of three commonly used denoising meth-ds: Gaussian filtering, median filtering, and anisotropiciffusion algorithm. The single-frame imaging result inig. 3(c) was first chosen as the denoising target. The de-
nfmTamtifm
n9Gf1wP
tGinmcfr
ccdm��sdTa1ipttcnsatob
5Ispbjc
Fded(
F(tfi�d
Faa=tt
Li et al. Vol. 27, No. 11 /November 2010 /J. Opt. Soc. Am. A 2385
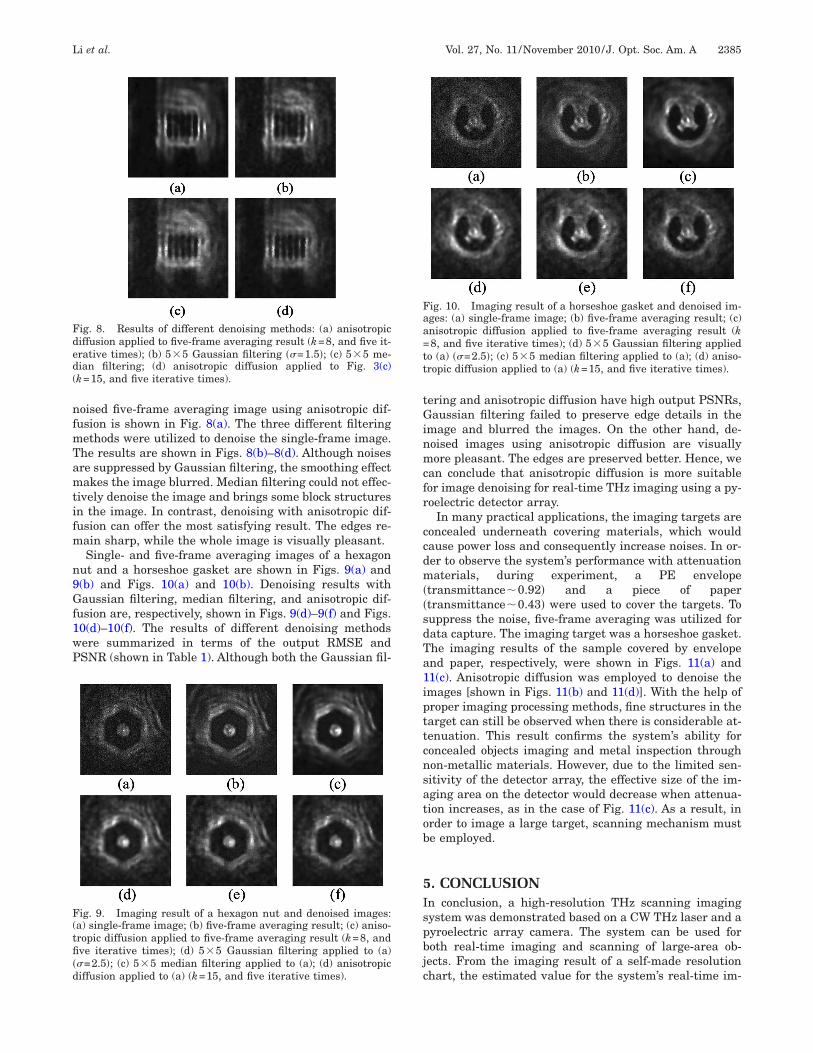
oised five-frame averaging image using anisotropic dif-usion is shown in Fig. 8(a). The three different filteringethods were utilized to denoise the single-frame image.he results are shown in Figs. 8(b)–8(d). Although noisesre suppressed by Gaussian filtering, the smoothing effectakes the image blurred. Median filtering could not effec-
ively denoise the image and brings some block structuresn the image. In contrast, denoising with anisotropic dif-usion can offer the most satisfying result. The edges re-ain sharp, while the whole image is visually pleasant.Single- and five-frame averaging images of a hexagon
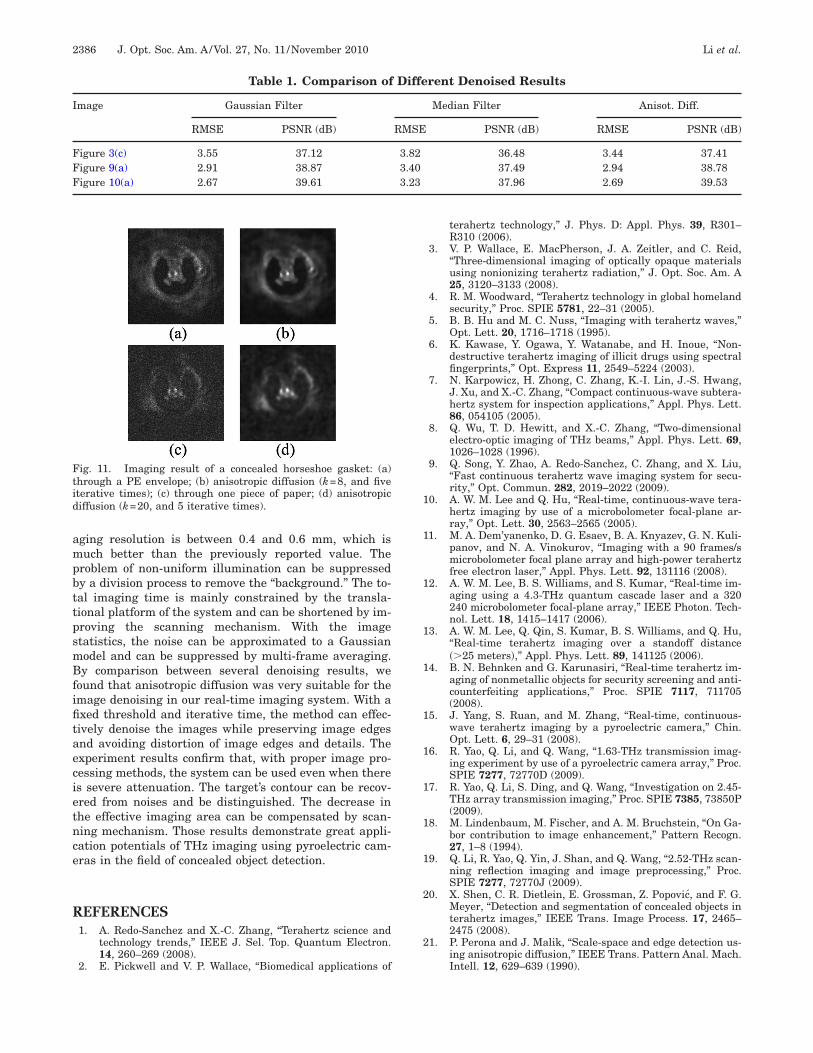
ut and a horseshoe gasket are shown in Figs. 9(a) and(b) and Figs. 10(a) and 10(b). Denoising results withaussian filtering, median filtering, and anisotropic dif-
usion are, respectively, shown in Figs. 9(d)–9(f) and Figs.0(d)–10(f). The results of different denoising methodsere summarized in terms of the output RMSE andSNR (shown in Table 1). Although both the Gaussian fil-
ig. 8. Results of different denoising methods: (a) anisotropiciffusion applied to five-frame averaging result (k=8, and five it-rative times); (b) 5�5 Gaussian filtering ��=1.5�; (c) 5�5 me-ian filtering; (d) anisotropic diffusion applied to Fig. 3(c)k=15, and five iterative times).
ig. 9. Imaging result of a hexagon nut and denoised images:a) single-frame image; (b) five-frame averaging result; (c) aniso-ropic diffusion applied to five-frame averaging result (k=8, andve iterative times); (d) 5�5 Gaussian filtering applied to (a)
�=2.5�; (c) 5�5 median filtering applied to (a); (d) anisotropiciffusion applied to (a) (k=15, and five iterative times).
ering and anisotropic diffusion have high output PSNRs,aussian filtering failed to preserve edge details in the
mage and blurred the images. On the other hand, de-oised images using anisotropic diffusion are visuallyore pleasant. The edges are preserved better. Hence, we
an conclude that anisotropic diffusion is more suitableor image denoising for real-time THz imaging using a py-oelectric detector array.
In many practical applications, the imaging targets areoncealed underneath covering materials, which wouldause power loss and consequently increase noises. In or-er to observe the system’s performance with attenuationaterials, during experiment, a PE envelope
transmittance�0.92� and a piece of papertransmittance�0.43� were used to cover the targets. Touppress the noise, five-frame averaging was utilized forata capture. The imaging target was a horseshoe gasket.he imaging results of the sample covered by envelopend paper, respectively, were shown in Figs. 11(a) and1(c). Anisotropic diffusion was employed to denoise themages [shown in Figs. 11(b) and 11(d)]. With the help ofroper imaging processing methods, fine structures in thearget can still be observed when there is considerable at-enuation. This result confirms the system’s ability foroncealed objects imaging and metal inspection throughon-metallic materials. However, due to the limited sen-itivity of the detector array, the effective size of the im-ging area on the detector would decrease when attenua-ion increases, as in the case of Fig. 11(c). As a result, inrder to image a large target, scanning mechanism muste employed.
. CONCLUSIONn conclusion, a high-resolution THz scanning imagingystem was demonstrated based on a CW THz laser and ayroelectric array camera. The system can be used foroth real-time imaging and scanning of large-area ob-ects. From the imaging result of a self-made resolutionhart, the estimated value for the system’s real-time im-
ig. 10. Imaging result of a horseshoe gasket and denoised im-ges: (a) single-frame image; (b) five-frame averaging result; (c)nisotropic diffusion applied to five-frame averaging result (k8, and five iterative times); (d) 5�5 Gaussian filtering applied
o (a) ��=2.5�; (c) 5�5 median filtering applied to (a); (d) aniso-ropic diffusion applied to (a) (k=15, and five iterative times).
ampbttpsmBfifitaecietnce
R
1
1
1
1
1
1
1
1
1
1
2
2
Ftid
I
FFF
2386 J. Opt. Soc. Am. A/Vol. 27, No. 11 /November 2010 Li et al.
ging resolution is between 0.4 and 0.6 mm, which isuch better than the previously reported value. The
roblem of non-uniform illumination can be suppressedy a division process to remove the “background.” The to-al imaging time is mainly constrained by the transla-ional platform of the system and can be shortened by im-roving the scanning mechanism. With the imagetatistics, the noise can be approximated to a Gaussianodel and can be suppressed by multi-frame averaging.y comparison between several denoising results, we
ound that anisotropic diffusion was very suitable for themage denoising in our real-time imaging system. With axed threshold and iterative time, the method can effec-ively denoise the images while preserving image edgesnd avoiding distortion of image edges and details. Thexperiment results confirm that, with proper image pro-essing methods, the system can be used even when theres severe attenuation. The target’s contour can be recov-red from noises and be distinguished. The decrease inhe effective imaging area can be compensated by scan-ing mechanism. Those results demonstrate great appli-ation potentials of THz imaging using pyroelectric cam-ras in the field of concealed object detection.
EFERENCES1. A. Redo-Sanchez and X.-C. Zhang, “Terahertz science and
technology trends,” IEEE J. Sel. Top. Quantum Electron.14, 260–269 (2008).
ig. 11. Imaging result of a concealed horseshoe gasket: (a)hrough a PE envelope; (b) anisotropic diffusion (k=8, and fiveterative times); (c) through one piece of paper; (d) anisotropiciffusion (k=20, and 5 iterative times).
Table 1. Comparison of
mage Gaussian Filter
RMSE PSNR (dB)
igure 3(c) 3.55 37.12igure 9(a) 2.91 38.87igure 10(a) 2.67 39.61
2. E. Pickwell and V. P. Wallace, “Biomedical applications of
terahertz technology,” J. Phys. D: Appl. Phys. 39, R301–R310 (2006).
3. V. P. Wallace, E. MacPherson, J. A. Zeitler, and C. Reid,“Three-dimensional imaging of optically opaque materialsusing nonionizing terahertz radiation,” J. Opt. Soc. Am. A25, 3120–3133 (2008).
4. R. M. Woodward, “Terahertz technology in global homelandsecurity,” Proc. SPIE 5781, 22–31 (2005).
5. B. B. Hu and M. C. Nuss, “Imaging with terahertz waves,”Opt. Lett. 20, 1716–1718 (1995).
6. K. Kawase, Y. Ogawa, Y. Watanabe, and H. Inoue, “Non-destructive terahertz imaging of illicit drugs using spectralfingerprints,” Opt. Express 11, 2549–5224 (2003).
7. N. Karpowicz, H. Zhong, C. Zhang, K.-I. Lin, J.-S. Hwang,J. Xu, and X.-C. Zhang, “Compact continuous-wave subtera-hertz system for inspection applications,” Appl. Phys. Lett.86, 054105 (2005).
8. Q. Wu, T. D. Hewitt, and X.-C. Zhang, “Two-dimensionalelectro-optic imaging of THz beams,” Appl. Phys. Lett. 69,1026–1028 (1996).
9. Q. Song, Y. Zhao, A. Redo-Sanchez, C. Zhang, and X. Liu,“Fast continuous terahertz wave imaging system for secu-rity,” Opt. Commun. 282, 2019–2022 (2009).
0. A. W. M. Lee and Q. Hu, “Real-time, continuous-wave tera-hertz imaging by use of a microbolometer focal-plane ar-ray,” Opt. Lett. 30, 2563–2565 (2005).
1. M. A. Dem’yanenko, D. G. Esaev, B. A. Knyazev, G. N. Kuli-panov, and N. A. Vinokurov, “Imaging with a 90 frames/smicrobolometer focal plane array and high-power terahertzfree electron laser,” Appl. Phys. Lett. 92, 131116 (2008).
2. A. W. M. Lee, B. S. Williams, and S. Kumar, “Real-time im-aging using a 4.3-THz quantum cascade laser and a 320240 microbolometer focal-plane array,” IEEE Photon. Tech-nol. Lett. 18, 1415–1417 (2006).
3. A. W. M. Lee, Q. Qin, S. Kumar, B. S. Williams, and Q. Hu,“Real-time terahertz imaging over a standoff distance��25 meters�,” Appl. Phys. Lett. 89, 141125 (2006).
4. B. N. Behnken and G. Karunasiri, “Real-time terahertz im-aging of nonmetallic objects for security screening and anti-counterfeiting applications,” Proc. SPIE 7117, 711705(2008).
5. J. Yang, S. Ruan, and M. Zhang, “Real-time, continuous-wave terahertz imaging by a pyroelectric camera,” Chin.Opt. Lett. 6, 29–31 (2008).
6. R. Yao, Q. Li, and Q. Wang, “1.63-THz transmission imag-ing experiment by use of a pyroelectric camera array,” Proc.SPIE 7277, 72770D (2009).
7. R. Yao, Q. Li, S. Ding, and Q. Wang, “Investigation on 2.45-THz array transmission imaging,” Proc. SPIE 7385, 73850P(2009).
8. M. Lindenbaum, M. Fischer, and A. M. Bruchstein, “On Ga-bor contribution to image enhancement,” Pattern Recogn.27, 1–8 (1994).
9. Q. Li, R. Yao, Q. Yin, J. Shan, and Q. Wang, “2.52-THz scan-ning reflection imaging and image preprocessing,” Proc.SPIE 7277, 72770J (2009).
0. X. Shen, C. R. Dietlein, E. Grossman, Z. Popovic, and F. G.Meyer, “Detection and segmentation of concealed objects interahertz images,” IEEE Trans. Image Process. 17, 2465–2475 (2008).
1. P. Perona and J. Malik, “Scale-space and edge detection us-ing anisotropic diffusion,” IEEE Trans. Pattern Anal. Mach.
rent Denoised Results
Median Filter Anisot. Diff.
PSNR (dB) RMSE PSNR (dB)
36.48 3.44 37.4137.49 2.94 38.7837.96 2.69 39.53
Diffe
RMSE
3.823.403.23
Intell. 12, 629–639 (1990).


![FT-infrared and pyroelectric studies on calix[8]arene ...shura.shu.ac.uk/20141/1/10697448.pdf · FT-infrared and pyroelectric studies on calix[8]arene Langmuir-Blodgett films Pyroelectric](https://img.pdfslide.us/doc/110x75/5ed0d44f92578a06cf4a87dd/ft-infrared-and-pyroelectric-studies-on-calix8arene-shurashuacuk201411.jpg)