Embed Size (px)
Citation preview
Real-time monitoring of quorum sensing in 3D-printedbacterial aggregates using scanningelectrochemical microscopyJodi L. Connella,1, Jiyeon Kimb,1, Jason B. Shearb, Allen J. Bardb,2, and Marvin Whiteleya,2
aDepartment of Molecular Biosciences, Institute of Cellular and Molecular Biology, Center for Infectious Disease and bDepartment of Chemistry, TheUniversity of Texas at Austin, Austin, TX 78712
Contributed by Allen J. Bard, November 6, 2014 (sent for review October 1, 2014)
Microbes frequently live in nature as small, densely packedaggregates containing ∼101–105 cells. These aggregates not onlydisplay distinct phenotypes, including resistance to antibiotics, butalso, serve as building blocks for larger biofilm communities.Aggregates within these larger communities display nonrandomspatial organization, and recent evidence indicates that this spatialorganization is critical for fitness. Studying single aggregates aswell as spatially organized aggregates remains challenging be-cause of the technical difficulties associated with manipulatingsmall populations. Micro-3D printing is a lithographic techniquecapable of creating aggregates in situ by printing protein-basedwalls around individual cells or small populations. This 3D-printingstrategy can organize bacteria in complex arrangements to inves-tigate how spatial and environmental parameters influence socialbehaviors. Here, we combined micro-3D printing and scanningelectrochemical microscopy (SECM) to probe quorum sensing(QS)-mediated communication in the bacterium Pseudomonas aeru-ginosa. Our results reveal that QS-dependent behaviors are observedwithin aggregates as small as 500 cells; however, aggregates largerthan 2,000 bacteria are required to stimulate QS in neighboringaggregates positioned 8 μm away. These studies provide a powerfulsystem to analyze the impact of spatial organization and aggregatesize on microbial behaviors.
Pseudomonas aeruginosa | scanning electrochemical microscopy |quorum sensing | 3D printing | pyocyanin
Bacterial populations are often found in nature as small,densely packed aggregates containing ∼101–105 cells (1–5).
These aggregates serve as building blocks for larger biofilmcommunities as well as a primary mode of transmission forpathogenic microbes (5–8). Similar to biofilm communities,aggregates develop microscale physical and chemical heteroge-neity and display clinically relevant phenotypes, including en-hanced antibiotic resistance (2, 8–16). Moreover, aggregate sizescontaining as few as 103 bacteria have been shown to engage inquorum sensing (QS)-mediated behaviors (17–21). In its simplestform, QS is a communication strategy that allows bacteria toeffectively monitor their population density through the secre-tion and sensing of extracellular signals (7, 22–24). When thepopulation reaches a specific density, activation of the QS reg-ulatory cascade results in enhanced transcription of a defined setof genes. These genes control distinct behaviors, including viru-lence, in the opportunistic pathogen Pseudomonas aeruginosa(25). In addition to displaying QS-mediated behaviors, bacterialaggregates have been shown to interact with neighboringaggregates both in vitro and in vivo (9, 26–28). Indeed, theseinteractions have a profound impact on virulence and are oftenmediated by small diffusible molecules (8–10, 22, 29–31).Despite the prevalence of aggregates in nature, understanding
the mechanisms controlling their behavior and interaction hasbeen difficult because of the inability to create spatially orga-nized aggregate communities in vitro. Droplet-based, emulsion,and microfluidic approaches have evolved as high-throughput
tools for screening interactions within small groups of isolatedbacteria (32–40). However, these confinement strategies typi-cally offer little control over the spatial arrangement of aggre-gates, and diffusion of extracellular signals between the con-finement volume and the surrounding environment is limited.We recently developed a system to control aggregate size andspatial organization using protein-based micro-3D printing (28).Micro-3D printing is a flexible technology capable of creatingarbitrary, complex spatial configurations of bacteria in threedimensions with submicrometer resolution. In this approach,bacteria are confined within micrometer-sized houses (referredto here as microtraps) constructed using a biocompatible mul-tiphoton lithography technique (41–44). The protein-based wallsand roof of the microtrap define aggregate size and shape inthree dimensions and are permeable to many small molecules.Cells confined within microtraps divide at normal rates and reachmaximum cell density (1012 cells mL−1) while maintaining cellnumbers typical of natural aggregates (14, 28, 42).Using microtraps, our group showed that as few as 2,600
P. aeruginosa cells engage in QS-mediated behaviors whenpresent at maximum density (42). This work used a cell-basedbiosensor, in which production of GFP served as a proxy forQS-mediated communication (14, 42). Although this biosensor-based approach provided exciting insights into QS in P. aeruginosa
Significance
Bacteria commonly reside in vivo as communities comprised ofsmall, densely packed aggregates. Aggregates display impor-tant phenotypes, including enhanced antibiotic resistance, andrecent evidence suggests that chemical interactions betweenaggregates are critical in human-associated microbial commu-nities. However, studying aggregates is challenging because ofthe inability to confine and spatially organize small microbialpopulations. Here, we interface two analytical technologies,micro-3D printing and scanning electrochemical microscopy, todevelop an in vitro platform with the capacity to manipulatethe size and spatial arrangement of bacterial aggregates andquantify chemical interactions between aggregates in realtime. We show that a quorum-sensing metabolite is producedby Pseudomonas aeruginosa aggregates containing as few as500 cells and determine how spatial structure impacts com-munication between neighboring aggregates.
Author contributions: J.L.C., J.K., J.B.S., A.J.B., and M.W. designed research; J.L.C. and J.K.performed research; J.L.C., J.K., A.J.B., and M.W. analyzed data; J.L.C., J.K., A.J.B., andM.W. contributed new reagents/analytic tools; and J.L.C., J.K., A.J.B., and M.W. wrotethe paper.
The authors declare no conflict of interest.1J.L.C. and J.K. contributed equally to this work.2To whom correspondence may be addressed. Email: [email protected] [email protected].
This article contains supporting information online at www.pnas.org/lookup/suppl/doi:10.1073/pnas.1421211111/-/DCSupplemental.
www.pnas.org/cgi/doi/10.1073/pnas.1421211111 PNAS | December 23, 2014 | vol. 111 | no. 51 | 18255–18260
CELL
BIOLO
GY
CHEM
ISTR
Y
Dow
nloa
ded
by g
uest
on
Dec
embe
r 30
, 201
9

aggregates, this system suffers from several limitations, in-cluding a delay in synthesis of detectable GFP on QS activa-tion because of the need to transcribe, translate, and fold theprotein; heterogeneity in GFP expression between individualcells within the community; and the need for high levels ofGFP production because of the intrinsic autofluorescence ofP. aeruginosa.Because of the limitations of GFP, it would be valuable to
develop a system that allows quantitative, real-time monitoringof bacterial behaviors in aggregate populations. Our groups re-cently used scanning electrochemical microscopy (SECM) asa sensitive, quantitative technique for studying small-moleculeproduction by bacterial biofilms (45, 46). SECM has the ability tomeasure the local concentration of redox-active small moleculeswith resolution on the micrometer scale using an ultra-microelectrode sensing tip (47). In addition, SECM can set theexact distance between the ultramicroelectrode tip and a bi-ological substrate through a feedback approach curve and sub-sequently, scan over the substrate in the x–y direction (47). Here,we coupled micro-3D printing and SECM to provide quanti-tative, real-time monitoring of bacterial behaviors in aggregatepopulations. By measuring the P. aeruginosa QS-controlled sec-ondary metabolite pyocyanin (48), we provide evidence thatQS occurs in aggregates as small as 500 P. aeruginosa cells. Byspatially localizing QS signal-producing and QS-responsivecells at defined distances using micro-3D printing, we also de-fine the number of cells required for P. aeruginosa aggregatesto communicate.
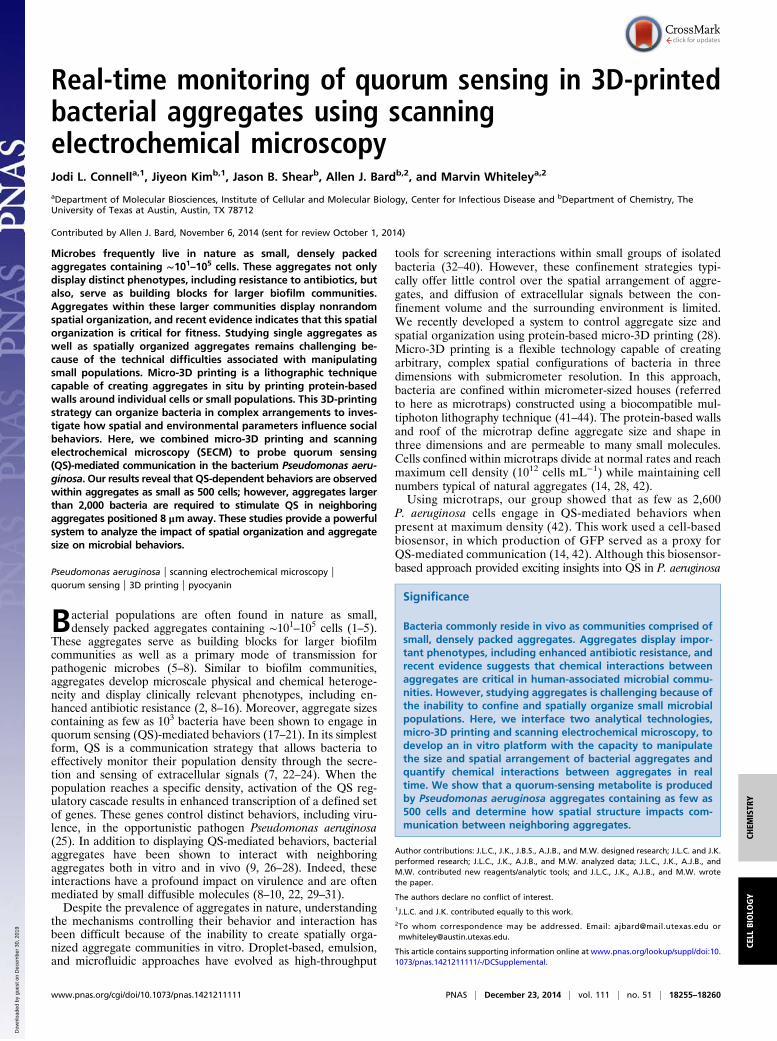
ResultsElectrochemical Characterization of 3D-Printed Bacterial Microtraps.One of the primary challenges of coupling 3D-printed microtrapswith SECM is positioning the ultramicroelectrode at a definedheight above the roof of the microtrap (49). SECM has theability to establish a fixed distance from a surface by plottingthe change in ultramicroelectrode tip current as a function of thedistance from the surface (referred to as an approach curve)(47). However, the current measurements used to generate thefeedback approach curve are dependent on not only the distancebetween the tip and the surface but also, the permeability of thesurface. Because of the high permeability of 3D-printed surfaces,it was first necessary to develop conditions that would allowprecise identification and surface mapping of microtraps (49).For these experiments, 8-pL microtraps (20 × 20 × 20-μm innerchamber) consisting of 8-μm-thick walls and a 3-μm-thick roof(Fig. 1A) were constructed on a glass coverslip and immersed ingrowth media. Initially, the photo-cross–linked protein matrix wastoo porous to differentiate the microtrap from the bulk solutionor the glass surface using SECM. To overcome this challenge, wetook advantage of the flexibility that this 3D printing methodoffers to design customized materials and tuned the fabricationparameters to increase the cross-link density within the proteinmatrix and decrease the permeability, which has been describedin detail elsewhere (49).A feedback approach curve was first generated using ferro-
cenemethanol (FcMeOH) as a redox mediator to identify theglass surface adjacent to the microtrap. The tip was then with-drawn to a known distance to recover the original steady-statecurrent response and moved laterally to position the tip over themicrotrap using light microscopy (Fig. 1B) (49). A steady-statecurrent response was recorded in the bulk solution (Fig. 1C,Purple Inset) [normalized to the tip radius (L = d/r) of L = 3] asthe tip approached the roof until the amperometric current re-sponse at the tip decreased significantly at a distance (d) of∼3 μm (L = 1.2) (Fig. 1C) and continued to decrease as a func-tion of L as the tip approached the microtrap (Fig. 1C, region ofthe curve outlined in green). The contact between the roof sur-face and the glass sheath surrounding the tip is seen as the
inflection point of the approach curve (Fig. 1C, Orange Inset)(L = 0). After contacting the roof, the tip was withdrawn again torecover the original current response, and the difference betweenthe original tip position over the roof and the displacement untilthe inflection point at the contact moment corresponds to themicrotrap height (49). The measured height of the microtrap(22.0–25.0 μm) shows the reproducibility of the micro-3Dprinting process.We have previously shown that the walls and roof of 3D-printed
microtraps are porous (28, 42); however, the transport of smallmolecules diffusing through these fully enclosed structures has notbeen quantified. Because the physically robust and smooth surfaceof the roof allows for the formation of a stable, nanometer-widegap under the ultramicroelectrode tip, the remarkably high per-meability of the microtrap could be measured reliably usingSECM (49). The permeability of the microtrap to FcMeOH [k =1.2 (± 0.1) × 10−1 cm/s] was determined by fitting an experimentalapproach curve obtained from a finite element simulation of atwo-phase SECM diffusion problem as described in detail else-where (49). FcMeOH was used in lieu of pyocyanin for determiningtrap porosity (49) for two reasons. (i) FcMeOH and pyocyanin havesimilar molecular weights (FcMeOH = 216.06; pyocyanin =210.23), the same calculated Stokes radius of 0.33 nm (50, 51), anddiffusion coefficients of ∼7.5 × 106 cm/s (which were confirmed bythe limiting current in the cyclic voltammograms collected in knownconcentrations of each molecule). (ii) A deposit formed on thesurface of the ultramicroelectrode tip during the electrochemicalreduction of oxidized pyocyanin (52, 53), and this polymer formeda film that both created a larger capacitance and blocked theelectrochemical reaction on the platinum surface, thus decreasing
Fig. 1. (A) Bright-field image of an empty 3D-printed microtrap. The traphas an 8-pL inner chamber (20 × 20 × 20 μm; length × width × height) that issurrounded by four 8-μm-thick walls and a 3-μm-thick roof. (Scale bar: 10 μm.)(B) A video microscope image of the 5-μm-diameter SECM probe positionedadjacent to a 3D-printed microtrap. (Scale bar: 100 μm.) (C) SECM feedbackapproach curve (solid line) collected over a microtrap using FcMeOH as a re-dox mediator, where L is the normalized distance between the tip and themicrotrap roof. The experimental curve (gray line) was fit to a simulatednegative feedback approach curve (black circles). Schematics with the tippositioned at (Orange Inset) L = 0 and (Purple Inset) L = 3 (∼7.5 μm above thetrap) illustrate how the current response from FcMeOH changes as a functionof L within close proximity (∼3 μm) to the trap (green region).
18256 | www.pnas.org/cgi/doi/10.1073/pnas.1421211111 Connell et al.
Dow
nloa
ded
by g
uest
on
Dec
embe
r 30
, 201
9
the current response. This polymerization did not affect our pre-vious work (45), because a large ultramicroelectrode tip was used.
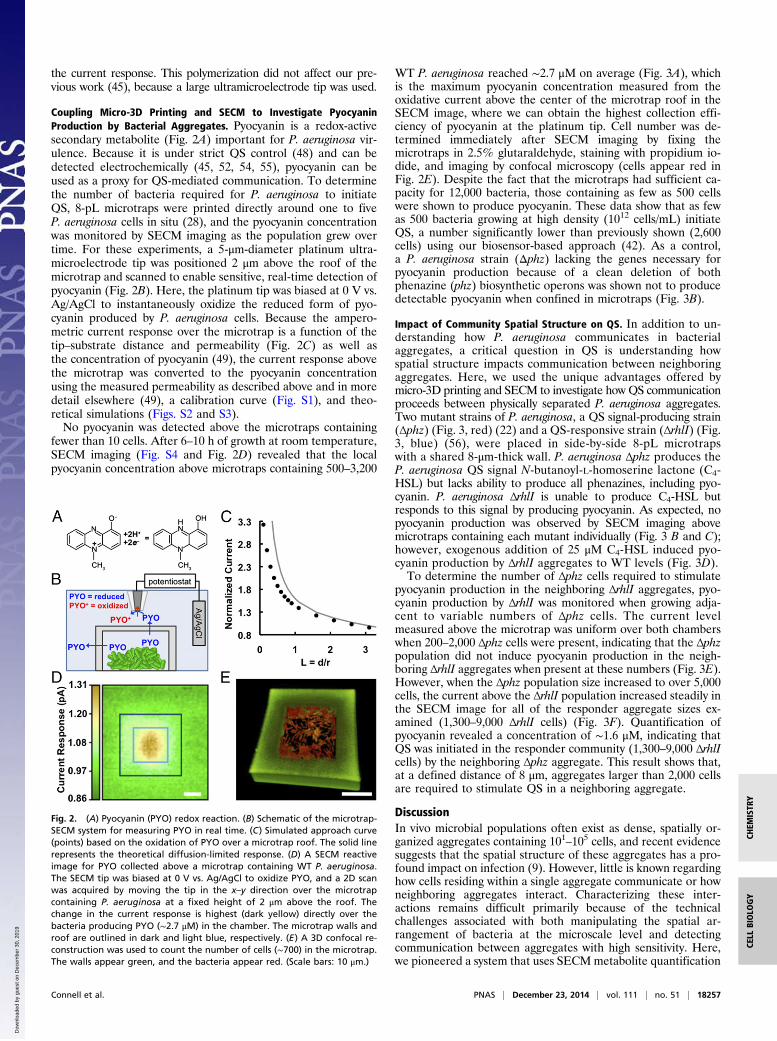
Coupling Micro-3D Printing and SECM to Investigate PyocyaninProduction by Bacterial Aggregates. Pyocyanin is a redox-activesecondary metabolite (Fig. 2A) important for P. aeruginosa vir-ulence. Because it is under strict QS control (48) and can bedetected electrochemically (45, 52, 54, 55), pyocyanin can beused as a proxy for QS-mediated communication. To determinethe number of bacteria required for P. aeruginosa to initiateQS, 8-pL microtraps were printed directly around one to fiveP. aeruginosa cells in situ (28), and the pyocyanin concentrationwas monitored by SECM imaging as the population grew overtime. For these experiments, a 5-μm-diameter platinum ultra-microelectrode tip was positioned 2 μm above the roof of themicrotrap and scanned to enable sensitive, real-time detection ofpyocyanin (Fig. 2B). Here, the platinum tip was biased at 0 V vs.Ag/AgCl to instantaneously oxidize the reduced form of pyo-cyanin produced by P. aeruginosa cells. Because the ampero-metric current response over the microtrap is a function of thetip–substrate distance and permeability (Fig. 2C) as well asthe concentration of pyocyanin (49), the current response abovethe microtrap was converted to the pyocyanin concentrationusing the measured permeability as described above and in moredetail elsewhere (49), a calibration curve (Fig. S1), and theo-retical simulations (Figs. S2 and S3).No pyocyanin was detected above the microtraps containing
fewer than 10 cells. After 6–10 h of growth at room temperature,SECM imaging (Fig. S4 and Fig. 2D) revealed that the localpyocyanin concentration above microtraps containing 500–3,200
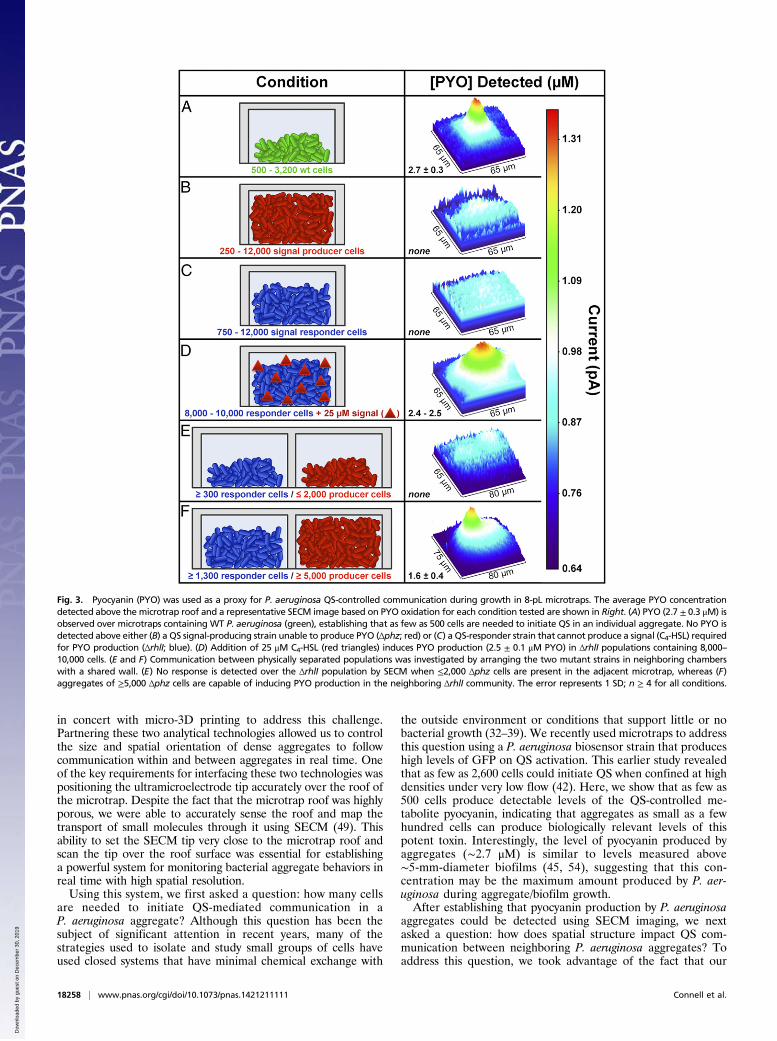
WT P. aeruginosa reached ∼2.7 μM on average (Fig. 3A), whichis the maximum pyocyanin concentration measured from theoxidative current above the center of the microtrap roof in theSECM image, where we can obtain the highest collection effi-ciency of pyocyanin at the platinum tip. Cell number was de-termined immediately after SECM imaging by fixing themicrotraps in 2.5% glutaraldehyde, staining with propidium io-dide, and imaging by confocal microscopy (cells appear red inFig. 2E). Despite the fact that the microtraps had sufficient ca-pacity for 12,000 bacteria, those containing as few as 500 cellswere shown to produce pyocyanin. These data show that as fewas 500 bacteria growing at high density (1012 cells/mL) initiateQS, a number significantly lower than previously shown (2,600cells) using our biosensor-based approach (42). As a control,a P. aeruginosa strain (Δphz) lacking the genes necessary forpyocyanin production because of a clean deletion of bothphenazine (phz) biosynthetic operons was shown not to producedetectable pyocyanin when confined in microtraps (Fig. 3B).
Impact of Community Spatial Structure on QS. In addition to un-derstanding how P. aeruginosa communicates in bacterialaggregates, a critical question in QS is understanding howspatial structure impacts communication between neighboringaggregates. Here, we used the unique advantages offered bymicro-3D printing and SECM to investigate how QS communicationproceeds between physically separated P. aeruginosa aggregates.Two mutant strains of P. aeruginosa, a QS signal-producing strain(Δphz) (Fig. 3, red) (22) and a QS-responsive strain (ΔrhlI) (Fig.3, blue) (56), were placed in side-by-side 8-pL microtrapswith a shared 8-μm-thick wall. P. aeruginosa Δphz produces theP. aeruginosa QS signal N-butanoyl-L-homoserine lactone (C4-HSL) but lacks ability to produce all phenazines, including pyo-cyanin. P. aeruginosa ΔrhlI is unable to produce C4-HSL butresponds to this signal by producing pyocyanin. As expected, nopyocyanin production was observed by SECM imaging abovemicrotraps containing each mutant individually (Fig. 3 B and C);however, exogenous addition of 25 μM C4-HSL induced pyo-cyanin production by ΔrhlI aggregates to WT levels (Fig. 3D).To determine the number of Δphz cells required to stimulate
pyocyanin production in the neighboring ΔrhlI aggregates, pyo-cyanin production by ΔrhlI was monitored when growing adja-cent to variable numbers of Δphz cells. The current levelmeasured above the microtrap was uniform over both chamberswhen 200–2,000 Δphz cells were present, indicating that the Δphzpopulation did not induce pyocyanin production in the neigh-boring ΔrhlI aggregates when present at these numbers (Fig. 3E).However, when the Δphz population size increased to over 5,000cells, the current above the ΔrhlI population increased steadily inthe SECM image for all of the responder aggregate sizes ex-amined (1,300–9,000 ΔrhlI cells) (Fig. 3F). Quantification ofpyocyanin revealed a concentration of ∼1.6 μM, indicating thatQS was initiated in the responder community (1,300–9,000 ΔrhlIcells) by the neighboring Δphz aggregate. This result shows that,at a defined distance of 8 μm, aggregates larger than 2,000 cellsare required to stimulate QS in a neighboring aggregate.
DiscussionIn vivo microbial populations often exist as dense, spatially or-ganized aggregates containing 101–105 cells, and recent evidencesuggests that the spatial structure of these aggregates has a pro-found impact on infection (9). However, little is known regardinghow cells residing within a single aggregate communicate or howneighboring aggregates interact. Characterizing these inter-actions remains difficult primarily because of the technicalchallenges associated with both manipulating the spatial ar-rangement of bacteria at the microscale level and detectingcommunication between aggregates with high sensitivity. Here,we pioneered a system that uses SECMmetabolite quantification
Fig. 2. (A) Pyocyanin (PYO) redox reaction. (B) Schematic of the microtrap-SECM system for measuring PYO in real time. (C) Simulated approach curve(points) based on the oxidation of PYO over a microtrap roof. The solid linerepresents the theoretical diffusion-limited response. (D) A SECM reactiveimage for PYO collected above a microtrap containing WT P. aeruginosa.The SECM tip was biased at 0 V vs. Ag/AgCl to oxidize PYO, and a 2D scanwas acquired by moving the tip in the x–y direction over the microtrapcontaining P. aeruginosa at a fixed height of 2 μm above the roof. Thechange in the current response is highest (dark yellow) directly over thebacteria producing PYO (∼2.7 μM) in the chamber. The microtrap walls androof are outlined in dark and light blue, respectively. (E) A 3D confocal re-construction was used to count the number of cells (∼700) in the microtrap.The walls appear green, and the bacteria appear red. (Scale bars: 10 μm.)
Connell et al. PNAS | December 23, 2014 | vol. 111 | no. 51 | 18257
CELL
BIOLO
GY
CHEM
ISTR
Y
Dow
nloa
ded
by g
uest
on
Dec
embe
r 30
, 201
9
in concert with micro-3D printing to address this challenge.Partnering these two analytical technologies allowed us to controlthe size and spatial orientation of dense aggregates to followcommunication within and between aggregates in real time. Oneof the key requirements for interfacing these two technologies waspositioning the ultramicroelectrode tip accurately over the roof ofthe microtrap. Despite the fact that the microtrap roof was highlyporous, we were able to accurately sense the roof and map thetransport of small molecules through it using SECM (49). Thisability to set the SECM tip very close to the microtrap roof andscan the tip over the roof surface was essential for establishinga powerful system for monitoring bacterial aggregate behaviors inreal time with high spatial resolution.Using this system, we first asked a question: how many cells
are needed to initiate QS-mediated communication in aP. aeruginosa aggregate? Although this question has been thesubject of significant attention in recent years, many of thestrategies used to isolate and study small groups of cells haveused closed systems that have minimal chemical exchange with
the outside environment or conditions that support little or nobacterial growth (32–39). We recently used microtraps to addressthis question using a P. aeruginosa biosensor strain that produceshigh levels of GFP on QS activation. This earlier study revealedthat as few as 2,600 cells could initiate QS when confined at highdensities under very low flow (42). Here, we show that as few as500 cells produce detectable levels of the QS-controlled me-tabolite pyocyanin, indicating that aggregates as small as a fewhundred cells can produce biologically relevant levels of thispotent toxin. Interestingly, the level of pyocyanin produced byaggregates (∼2.7 μM) is similar to levels measured above∼5-mm-diameter biofilms (45, 54), suggesting that this con-centration may be the maximum amount produced by P. aer-uginosa during aggregate/biofilm growth.After establishing that pyocyanin production by P. aeruginosa
aggregates could be detected using SECM imaging, we nextasked a question: how does spatial structure impact QS com-munication between neighboring P. aeruginosa aggregates? Toaddress this question, we took advantage of the fact that our
Fig. 3. Pyocyanin (PYO) was used as a proxy for P. aeruginosa QS-controlled communication during growth in 8-pL microtraps. The average PYO concentrationdetected above the microtrap roof and a representative SECM image based on PYO oxidation for each condition tested are shown in Right. (A) PYO (2.7 ± 0.3 μM) isobserved over microtraps containing WT P. aeruginosa (green), establishing that as few as 500 cells are needed to initiate QS in an individual aggregate. No PYO isdetected above either (B) a QS signal-producing strain unable to produce PYO (Δphz; red) or (C) a QS-responder strain that cannot produce a signal (C4-HSL) requiredfor PYO production (ΔrhlI; blue). (D) Addition of 25 μM C4-HSL (red triangles) induces PYO production (2.5 ± 0.1 μM PYO) in ΔrhlI populations containing 8,000–10,000 cells. (E and F) Communication between physically separated populations was investigated by arranging the two mutant strains in neighboring chamberswith a shared wall. (E) No response is detected over the ΔrhlI population by SECM when ≤2,000 Δphz cells are present in the adjacent microtrap, whereas (F)aggregates of ≥5,000 Δphz cells are capable of inducing PYO production in the neighboring ΔrhlI community. The error represents 1 SD; n ≥ 4 for all conditions.
18258 | www.pnas.org/cgi/doi/10.1073/pnas.1421211111 Connell et al.
Dow
nloa
ded
by g
uest
on
Dec
embe
r 30
, 201
9

micro-3D printing technology can be performed in stages, thusallowing us to construct two microtraps containing differentbacterial strains separated by a defined distance (8 μm). A finiteelement analysis (Fig. S5) revealed that the flux of the signalmolecule through the shared microtrap wall is ∼50% higher thanthrough the roof, indicating that, as expected, the 8-μm-thickwall offers the most direct and efficient signal transfer pathwaybetween the neighboring aggregates. One trap contained a QSsignal-producing P. aeruginosa strain (Δphz), and the othercontained a QS signal-responsive strain (ΔrhlI) that producedpyocyanin on QS stimulation. Our finding that greater than 2,000signal-producing cells are required to stimulate the neighboringQS-responsive population (1,300–9,000 ΔrhlI cells) when sepa-rated by 8 μm provides quantitative insight into how cell numberimpacts aggregate interactions. It is not surprising that more cellsare needed to induce QS between neighboring aggregates(>2,000) than within an individual aggregate (∼500) simply be-cause of the requirement for the effective amount of signalmolecule to diffuse to the adjacent aggregate.In summary, we present the practical application of an ana-
lytical strategy developed recently (49) that couples two powerfultechniques: micro-3D printing and SECM. Together, they pro-vide a versatile platform to study and manipulate physical andchemical interactions both between and within small, spatiallystructured populations of bacteria. Although the primary impor-tance of this study is in the development and successful applica-tion of this system to quantify chemical interactions betweenbacterial aggregates, this strategy has clear advantages over othersand provides the platform necessary to begin to probe importantquestions in microbiology focused on understanding communi-cation in spatially structured microbial communities.
Materials and MethodsMaterials. Details are provided in SI Text.
Bacterial Strains and Cell Culture. WT P. aeruginosa strain PA14, P. aerugi-nosa PA14 Δphz1/2 (22), and P. aeruginosa PA14 ΔrhlI (56) were used inthese studies. The growth medium for all experiments was a 1:15 (vol/vol)mixture of LB broth (5 g/L yeast extract, 10 g/L tryptone, 10 g/L NaCl) (57)and morpholinepropanesulfonic acid (Mops) minimal medium (50 mMMops, 43 mM NaCl, 93 mM NH4Cl, 2 mM KH2PO4, 3.5 mM FeSO4, 1 mMMgSO4) buffered to pH 7.2 (58) with 20 mM sodium succinate as the car-bon source. Planktonic cultures were grown aerobically overnight at 37 °C.Cells were diluted from overnight cultures, grown at 37 °C to mid-logarithmic phase, and then diluted into a fabrication precursor solutionfor printing as described below.
Micro-3D Printing. Photo-cross–linked gelatin microtraps were printed on theuntreated surface within a 0.8-mL well of a Lab-Tek chambered #1 coverglassusing a dynamic mask-directed multiphoton lithography process describedin detail elsewhere (28, 41, 43). In brief, a galvanometer-driven scanner(GVS002; Thor Labs) raster-scanned the output from a mode-locked titanium:sapphire laser (Tsunami; Spectra Physics) operating at 740 nm across the face ofa digital micromirror device (800 × 600 SVGA; Texas Instruments) displayingbinary mask sequences created using Adobe Photoshop. The reflected light wasaligned to the back aperture of an Olympus PlanApo 60×, 1.40 N.A. oil-immersion objective positioned on an inverted microscope (Zeiss; Axiovert). All3D microtraps in this work were printed at 2.5 s per plane in a layer-by-layerprocess by coordinating the mask presentation on the digital micromirror de-vice with 0.25-μm steps on the optical (z) axis using a motorized focus driver(H122; Prior Scientific). All fabrication parameters were optimized to achieve
a sufficient cross-linking density to produce a current response large enough toposition the platinum ultramicroelectrode accurately above the microtraps us-ing a feedback approach curve generated with 0.1 mM FcMeOH as described inFig. 1 and more detail elsewhere (49).
Midlogarithmic phase P. aeruginosa cells were diluted to an OD at 600 nmof 0.01 in a warmed (37 °C) fabrication precursor solution containing 200mg/mL gelatin (Type A; porcine), 75 mg/mL bovine serum albumin (BSA), and9 mM Rose Bengal prepared in Hepes buffer (20 mM Hepes, 0.1 M NaCl, pH7.4). After cooling to room temperature, the 8-pL microtraps were printeddirectly around one to five P. aeruginosa cells embedded in the thermally setgel using an average laser power of ∼40 mW measured at the back apertureof the objective. The 3D-printed microtraps were stored overnight in thefabrication gel at 4 °C to arrest cell growth. The next morning, the uncross-linked gelatin/BSA was washed out of the sample well using multiple vol-umes (0.5 mL per wash) of the Hepes buffer used to prepare the fabricationprecursor at 37 °C. After the precursor had been removed completely, thesample was washed in the LB/Mops growth medium with 0.1 mM FcMeOHadded as a redox mediator for positioning the ultramicroelectrode tip.Samples were placed inside a microscope incubator maintained at 37 °C for2–5 h before SECM imaging to monitor cell growth directly using phasecontrast microscopy as described previously (14, 42).
A multistep printing process using the same fabrication conditions asdescribed above was used to arrange P. aeruginosa Δphz and ΔrhlI cells inside-by-side microtraps (Fig. 3 E and F). In the first stage, a trap was printedaround one to five QS responder strain (ΔrhlI) cells embedded in a thermallyset gel at room temperature. After printing was complete, the excess pre-cursor material and any remaining untrapped cells were washed out using37 °C media. Then, a new gel containing the QS signal-producing strain(Δphz) was cast in the same sample well, and a second microtrap was printedaround Δphz cells directly next to each ΔrhlI trap, creating a two-chamberedmicrotrap with one shared wall separating the populations (Fig. 3 E and F).After the second printing step, the 3D-printed microtraps were stored in theprecursor gel overnight at 4 °C, and the samples were treated in the samemanner as described above.
Optical Imaging and Data Analysis. Details of bright-field, phase contrast, andconfocal fluorescence imaging are provided in SI Text.
Electrochemical Characterization ofMicrotraps.Details describing themicrotrapheight and permeability measurements by SECM are provided elsewhere (49).
Quantitative SECM Measurements. All electrochemical measurements wereperformed using a CHImodel 920C potentiostat (CH Instruments) with the two-electrode cell placed in the grounded stage. Ag/AgCl in a saturated KCl solutionwas used as a reference and counterelectrode. A 5-μm-diameter platinumelectrode was used as the SECM tip, and all electrochemical data were col-lected at room temperature in the LB/Mops growth medium with 0.1 mMFcMeOH added as a redox mediator for accurate tip positioning. Details aboutthe SECM tip fabrication can be found in SI Text and elsewhere (47, 49, 50).The tip was biased at 0.4 V vs. Ag/AgCl to oxidize FcMeOH or 0 V vs. Ag/AgCl tooxidize pyocyanin. The tip approach rate was 100 nm/s for all approach curves.All SECM images were obtained by scanning the tip in the x and y axes ata rate of 10 μm/s at a fixed height of 2 μm above the microtrap roof. Detailsabout generating the pyocyanin calibration curve are provided in SI Text.
Simulations. Details about simulationmodels are in SI Text and elsewhere (49).
ACKNOWLEDGMENTS. We acknowledge support from Air Force Office ofScientific Research Multidisciplinary University Research Initiative (AFOSRMURI) Grant FA9550-14-1-0003 and US Army Research Office Grant W911NF-13-1-0199. J.L.C. is a Cystic Fibrosis Foundation Ann Weinberg Memorial Post-doctoral Research Fellow. M.W. is a Burroughs Wellcome Investigator in thePathogenesis of Infectious Disease.
1. Hall-Stoodley L, Stoodley P (2005) Biofilm formation and dispersal and the trans-mission of human pathogens. Trends Microbiol 13(1):7–10.
2. Bjarnsholt T, et al. (2013) The in vivo biofilm. Trends Microbiol 21(9):466–474.3. Davies DG, et al. (1998) The involvement of cell-to-cell signals in the development of
a bacterial biofilm. Science 280(5361):295–298.4. Stoodley P, et al. (2001) Growth and detachment of cell clusters from mature mixed-
species biofilms. Appl Environ Microbiol 67(12):5608–5613.5. Schleheck D, et al. (2009) Pseudomonas aeruginosa PAO1 preferentially grows as
aggregates in liquid batch cultures and disperses upon starvation. PLoS ONE 4(5):e5513.
6. Yarwood JM, Bartels DJ, Volper EM, Greenberg EP (2004) Quorum sensing in Staph-ylococcus aureus biofilms. J Bacteriol 186(6):1838–1850.
7. Hibbing ME, Fuqua C, Parsek MR, Peterson SB (2010) Bacterial competition: Survivingand thriving in the microbial jungle. Nat Rev Microbiol 8(1):15–25.
8. Alhede M, et al. (2011) Phenotypes of non-attached Pseudomonas aeruginosa ag-gregates resemble surface attached biofilm. PLoS ONE 6(11):e27943.
9. Stacy A, et al. (2014) Bacterial fight-and-flight responses enhance virulence in a poly-microbial infection. Proc Natl Acad Sci USA 111(21):7819–7824.
10. Wang YJ, Leadbetter JR (2005) Rapid acyl-homoserine lactone quorum signal bio-degradation in diverse soils. Appl Environ Microbiol 71(3):1291–1299.
Connell et al. PNAS | December 23, 2014 | vol. 111 | no. 51 | 18259
CELL
BIOLO
GY
CHEM
ISTR
Y
Dow
nloa
ded
by g
uest
on
Dec
embe
r 30
, 201
9

11. Okegbe C, Price-Whelan A, Dietrich LE (2014) Redox-driven regulation of microbial
community morphogenesis. Curr Opin Microbiol 18:39–45.12. Stewart PS (2003) Diffusion in biofilms. J Bacteriol 185(5):1485–1491.13. Stewart PS, Franklin MJ (2008) Physiological heterogeneity in biofilms. Nat Rev Mi-
crobiol 6(3):199–210.14. Wessel AK, et al. (2014) Oxygen limitation within a bacterial aggregate. MBio 5(2):
e00992–e00914.15. Wessel AK, Hmelo L, Parsek MR, Whiteley M (2013) Going local: Technologies for
exploring bacterial microenvironments. Nat Rev Microbiol 11(5):337–348.16. Cho H, et al. (2007) Self-organization in high-density bacterial colonies: Efficient
crowd control. PLoS Biol 5(11):e302.17. Henke JM, Bassler BL (2004) Bacterial social engagements. Trends Cell Biol 14(11):
648–656.18. Connell JL, Whiteley M, Shear JB (2012) Sociomicrobiology in engineered landscapes.
Nat Chem Biol 8(1):10–13.19. Parsek MR, Greenberg EP (2005) Sociomicrobiology: The connections between quo-
rum sensing and biofilms. Trends Microbiol 13(1):27–33.20. Bassler BL, Losick R (2006) Bacterially speaking. Cell 125(2):237–246.21. Diggle SP, Griffin AS, Campbell GS, West SA (2007) Cooperation and conflict in
quorum-sensing bacterial populations. Nature 450(7168):411–414.22. Dietrich LEP, Price-Whelan A, Petersen A, Whiteley M, Newman DK (2006) The
phenazine pyocyanin is a terminal signalling factor in the quorum sensing network ofPseudomonas aeruginosa. Mol Microbiol 61(5):1308–1321.
23. Ramsey MM, Rumbaugh KP, Whiteley M (2011) Metabolite cross-feeding enhances
virulence in a model polymicrobial infection. PLoS Pathog 7(3):e1002012.24. Korgaonkar A, Trivedi U, Rumbaugh KP, Whiteley M (2013) Community surveillance
enhances Pseudomonas aeruginosa virulence during polymicrobial infection. ProcNatl Acad Sci USA 110(3):1059–1064.
25. Rutherford ST, Bassler BL (2012) Bacterial quorum sensing: Its role in virulence and
possibilities for its control. Cold Spring Harb Perspect Med 2(11):a012427.26. Flickinger ST, et al. (2011) Quorum sensing between Pseudomonas aeruginosa bio-
films accelerates cell growth. J Am Chem Soc 133(15):5966–5975.27. Kim HJ, Boedicker JQ, Choi JW, Ismagilov RF (2008) Defined spatial structure stabilizes
a synthetic multispecies bacterial community. Proc Natl Acad Sci USA 105(47):
18188–18193.28. Connell JL, Ritschdorff ET, Whiteley M, Shear JB (2013) 3D printing of microscopic
bacterial communities. Proc Natl Acad Sci USA 110(46):18380–18385.29. Alberghini S, et al. (2009) Consequences of relative cellular positioning on quorum
sensing and bacterial cell-to-cell communication. FEMS Microbiol Lett 292(2):149–161.30. Dilanji GE, Langebrake JB, De Leenheer P, Hagen SJ (2012) Quorum activation at
a distance: Spatiotemporal patterns of gene regulation from diffusion of an auto-
inducer signal. J Am Chem Soc 134(12):5618–5626.31. Price-Whelan A, Dietrich LEP, Newman DK (2007) Pyocyanin alters redox homeostasis
and carbon flux through central metabolic pathways in Pseudomonas aeruginosa
PA14. J Bacteriol 189(17):6372–6381.32. Theberge AB, et al. (2010) Microdroplets in microfluidics: An evolving platform for
discoveries in chemistry and biology. Angew Chem Int Ed Engl 49(34):5846–5868.33. Guo MT, Rotem A, Heyman JA, Weitz DA (2012) Droplet microfluidics for high-
throughput biological assays. Lab Chip 12(12):2146–2155.34. Baca HK, et al. (2011) Cell-directed-assembly: Directing the formation of nano/bio
interfaces and architectures with living cells. Biochim Biophys Acta 1810(3):259–267.35. Carnes EC, et al. (2010) Confinement-induced quorum sensing of individual Staphy-
lococcus aureus bacteria. Nat Chem Biol 6(1):41–45.
36. Boedicker JQ, Li L, Kline TR, Ismagilov RF (2008) Detecting bacteria and determiningtheir susceptibility to antibiotics by stochastic confinement in nanoliter droplets usingplug-based microfluidics. Lab Chip 8(8):1265–1272.
37. Boedicker JQ, Vincent ME, Ismagilov RF (2009) Microfluidic confinement of single cellsof bacteria in small volumes initiates high-density behavior of quorum sensing andgrowth and reveals its variability. Angew Chem Int Ed Engl 48(32):5908–5911.
38. Fidalgo LM, et al. (2008) From microdroplets to microfluidics: Selective emulsionseparation in microfluidic devices. Angew Chem Int Ed Engl 47(11):2042–2045.
39. Yaguchi T, et al. (2010) Micropatterning bacterial suspensions using aqueous twophase systems. Analyst (Lond) 135(11):2848–2852.
40. Weitz M, et al. (2014) Communication and computation by bacteria compartmen-talized within microemulsion droplets. J Am Chem Soc 136(1):72–75.
41. Kaehr B, Shear JB (2007) Mask-directed multiphoton lithography. J Am Chem Soc129(7):1904–1905.
42. Connell JL, et al. (2010) Probing prokaryotic social behaviors with bacterial “lobstertraps.” MBio 1(4):e00202–e00210.
43. Nielson R, Kaehr B, Shear JB (2009) Microreplication and design of biological archi-tectures using dynamic-mask multiphoton lithography. Small 5(1):120–125.
44. Harper JC, Brozik SM, Brinker CJ, Kaehr B (2012) Biocompatible microfabrication of3D isolation chambers for targeted confinement of individual cells and their progeny.Anal Chem 84(21):8985–8989.
45. Koley D, Ramsey MM, Bard AJ, Whiteley M (2011) Discovery of a biofilm electroclineusing real-time 3D metabolite analysis. Proc Natl Acad Sci USA 108(50):19996–20001.
46. Liu X, et al. (2011) Real-time mapping of a hydrogen peroxide concentration profileacross a polymicrobial bacterial biofilm using scanning electrochemical microscopy.Proc Natl Acad Sci USA 108(7):2668–2673.
47. Bard AJ, Mirkin MV (2001) Scanning Electrochemical Microscopy (Marcel Dekker, NewYork), p 650.
48. Price-Whelan A, Dietrich LEP, Newman DK (2006) Rethinking ‘secondary’ metabolism:Physiological roles for phenazine antibiotics. Nat Chem Biol 2(2):71–78.
49. Kim J, Connell JL, Whiteley M, Bard AJ (2014) Development of a versatile in vitroplatform for studying cellular interactions using micro-3D printing and scanningelectrochemical microscopy. Anal Chem, in press.
50. Kim J, Izadyar A, Nioradze N, Amemiya S (2013) Nanoscale mechanism of moleculartransport through the nuclear pore complex as studied by scanning electrochemicalmicroscopy. J Am Chem Soc 135(6):2321–2329.
51. Zheng G, Price WS (2012) Direct hydrodynamic radius measurement on dissolved organicmatter in natural waters using diffusion NMR. Environ Sci Technol 46(3):1675–1680.
52. Sharp D, Gladstone P, Smith RB, Forsythe S, Davis J (2010) Approaching intelligentinfection diagnostics: Carbon fibre sensor for electrochemical pyocyanin detection.Bioelectrochemistry 77(2):114–119.
53. Láng GG, Barbero CA (2012) Laser Techniques for the Study of Electrode Processes(Springer, Dordrecht, The Netherlands).
54. Bellin DL, et al. (2014) Integrated circuit-based electrochemical sensor for spatiallyresolved detection of redox-active metabolites in biofilms. Nat Commun 5:3256.
55. Webster TA, Sismaet HJ, Conte JL, Chan IPJ, Goluch ED (2014) Electrochemical de-tection of Pseudomonas aeruginosa in human fluid samples via pyocyanin. BiosensBioelectron 60:265–270.
56. Hogan DA, Vik A, Kolter R (2004) A Pseudomonas aeruginosa quorum-sensing mol-ecule influences Candida albicans morphology. Mol Microbiol 54(5):1212–1223.
57. Sambrook J, Maniatis T, Fritsch EF (1989) Molecular Cloning: A Laboratory Manual(Cold Spring Harbor Lab Press, Plainview, NY), 2nd Ed.
58. Palmer KL, Mashburn LM, Singh PK, Whiteley M (2005) Cystic fibrosis sputum supportsgrowth and cues key aspects of Pseudomonas aeruginosa physiology. J Bacteriol187(15):5267–5277.
18260 | www.pnas.org/cgi/doi/10.1073/pnas.1421211111 Connell et al.
Dow
nloa
ded
by g
uest
on
Dec
embe
r 30
, 201
9


![A MATHEMATICAL MODEL OF QUORUM SENSING IN PATCHY … · QUORUM SENSING IN BIOFILMS 269 [11, 52], a comprehensive understanding of quorum sensing systems is highly desirable. 1.3 Modelling](https://img.pdfslide.us/doc/110x75/5fad596118f3d853d1006484/a-mathematical-model-of-quorum-sensing-in-patchy-quorum-sensing-in-biofilms-269.jpg)

![Natural Anti-Quorum Sensing agents against Pseudomonas ... · 2. Quorum Sensing: a Novel Target Vfr Quorum sensing (QS) is a population-dependent event [13]. The capability to sense](https://img.pdfslide.us/doc/110x75/5edbcc02ad6a402d66663060/natural-anti-quorum-sensing-agents-against-pseudomonas-2-quorum-sensing-a.jpg)


![Research Article Broad Spectrum Anti-Quorum Sensing ...downloads.hindawi.com/journals/scientifica/2016/5823013.pdf · isms is called quorum sensing (QS) []. Quorum sensing is a process](https://img.pdfslide.us/doc/110x75/5edbc5d7ad6a402d66662749/research-article-broad-spectrum-anti-quorum-sensing-isms-is-called-quorum-sensing.jpg)