Embed Size (px)
Citation preview

1
Real Time Deformation Monitoring for Wall Construction
WSDOT Geotechnical DivisionOlympia, WA
byTony M. Allen

2
SR-101 Bogachiel Slide Repair

3
Overviewof Slide AreaSoldier
Pile Wall

4
Bogachiel Slide History• Problems began in 1985 - resulted in loss of over
1,000 ft of SR-101• SR-101 was rebuilt once the slide stopped moving• Settlement and movement continues to occur at
various points along this section of SR-101 due to slide
• The location of the soldier pile wall is one of the most active areas
• Landslide results from a combination of high groundwater charged up by rainfall, weak deeply weathered siltstone and claystone, shearing caused by tectonic activity, and erosion at the slide toe by the river

5
Cross-Section of Previous and New Slide Repairs – Original Condition (11/2004)
Hard siltstoneor sandstone
Landslidedeposits
Old groundline
Soil nailwall
Old soldierpile wall
Potential failuresurface

6
Cross-Section of Previous and New Slide Repairs – Sept. 2005
Hard siltstoneor sandstone
Landslidedeposits
Current groundline
Soil nailwall
Old soldierpile wall
Potential failuresurface

7
Cross-Section of Previous and New Slide Repairs
Hard siltstoneor sandstone
Landslidedeposits
Current groundline
Soil nailwall
Deadmananchor
Old soldierpile wall
Potential failuresurface

8
Cross-Section of Previous and New Slide Repairs
Hard siltstoneor sandstone
Landslidedeposits
Current groundline
New Wall
Soil nailwall
Deadmananchor
Old soldierpile wall
Potential failuresurface
Drainableconcrete
Temp. cranesupport piles

9
Slide Repair Overview

10
View Down to River from Wall Top

11
First Slide Repair Wall

12
Deformation in First Repair Wall

13
Deadman Installation – 2nd Repair Contract

14
Deadman Installation – 2nd Repair Contract

15
Installation of Temp. Crane Support Piles

16
Installing Soldier Piles for New Wall

17
Preparing to Install Bottom Tieback Row

18
Tieback Installation

19
Existing and Permanent Anchored Walls

20
Inclinometer Location
Old groundline
Soil nailwall
Old soldierpile wall
Potential failuresurface
Inclinometer

21
22

23

24
Post-Construction Bogachiel Wall Monitoring
• Load cells on tiebacks to monitor long-term wall loads
• Continued conventional monitoring of inclinometers

25
SR-18 Geogrid Reinforced Block Faced Wall Monitoring

26
SR-18 Project Map

27
Cross-Section at Instrumented Section for Wall C (WB 1399+00)
28
Purpose of Instrumentation Program
• Verify wall performance, since a new, less conservative, design technique was used (i.e., the K-Stiffness Method)
• Provide real time, early warning of performance problems so that design adjustments could be made, if necessary

29
Wall C Instrumentation Cross-Section

30
Wall C Reinforcement Design Summary
UXK1100UXK1100UXK1100UXK1100UXK1100UXK1400UXK1400UXK1400UXK1500UXK1500UXK1500UXK1500UXK1500UXK1500UXK1500UXK1500UXK1500
UXK1100UXK1100UXK1100UXK1400UXK1500UXK1500UXK1500UXK1500UXK1600UXK1600UXK1600UXK1600UXK1600UXK1600UXK1600UXK1600UXK1600UXK1600
Total Tal = 23,250 lbs/ft Total Tal = 35,780 lbs/ft
Sv = 2 ft for all layers
Sv = 2 ft for all layers, except 1.3 ft bottom 3 layers
Compoundstabilitycontrols Compound
stabilitycontrols
31
0
5
10
15
20
250 500 1000 1500 2000 2500 3000
Reinforcement Long-Term Tal Required (lbs/ft)
Dep
th B
elow
Wal
l Top
, Z (f
t)
K-StiffnessMethod
AASHTOSimplifiedMethod
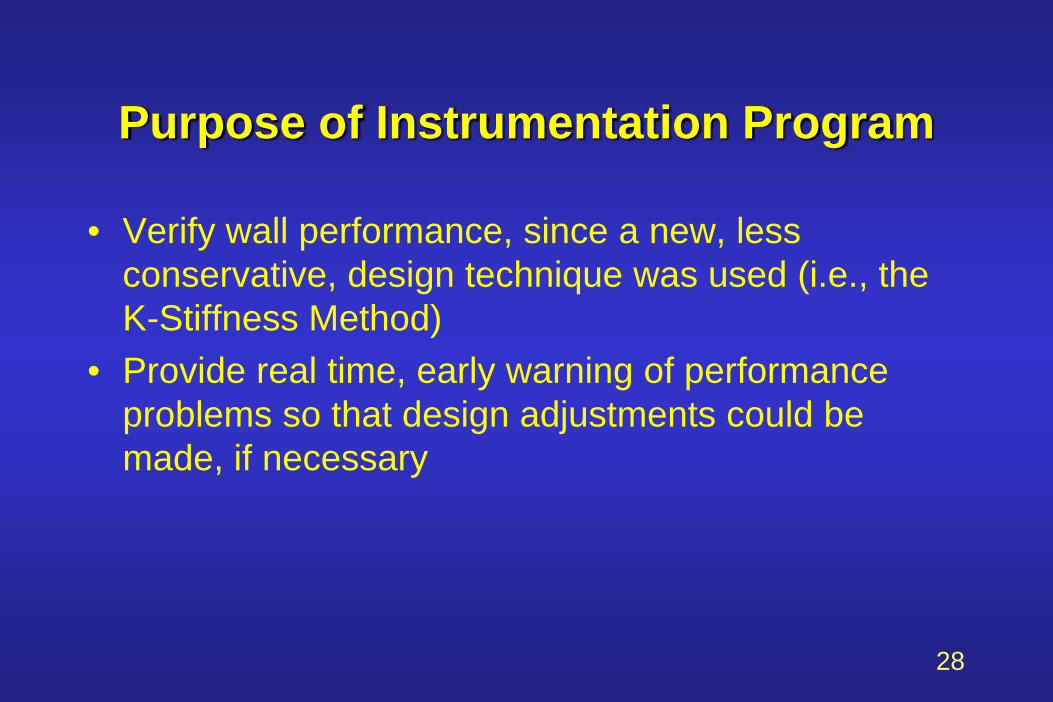
Wall D Reinforcement Design Summary
UXK1100
UXK1100
UXK1100
UXK1100
UXK1100
UXK1100
UXK1100
UXK1100
UXK1100
UXK1100
Total Tal = 5,765 lbs/ft Total Tal = 16,735 lbs/ft
Sv = 2 ft for all layers
Sv = 2 ft for all layers
Compoundstabilitycontrols
Compoundstabilitycontrols
UXK1500
UXK1100
UXK1400
UXK1400
UXK1500
UXK1500
UXK1500
UXK1600
UXK1600
UXK1600

32
Overview of Wall C during 1st Instrumented Layer Install (6/29/04)

33
Installation of First Geogrid Layer and Facing Connection – Wall C
8 in.
12 in.18 in.

34
Close-Up of facing Connection with Geogrid

35
Wall Face Connection Problems
HDPE ConnectorFiberglass alignment pin

36
Wall C Strain Gauge installation, 1st Instrumented Layer (6/29/04)
Note: Wood slats removed prior to final layer installation.

37
Installation of Extensometers in Wall C, 2nd Instrumented layer (7/12/04)

38
Wall C 2nd Instrumented Layer (7/12/04)
Strain gauges coveredwith sand

39
Automated Data Acquisition Cabinet at Wall C
Campbell CR-10Xdatalogger
AM416 Multiplexer(16 channel,4 wire input)

40
Wall C as Completed – Instrumented Section
Survey target
Data acquisition system
Instrumentationcable conduits
41
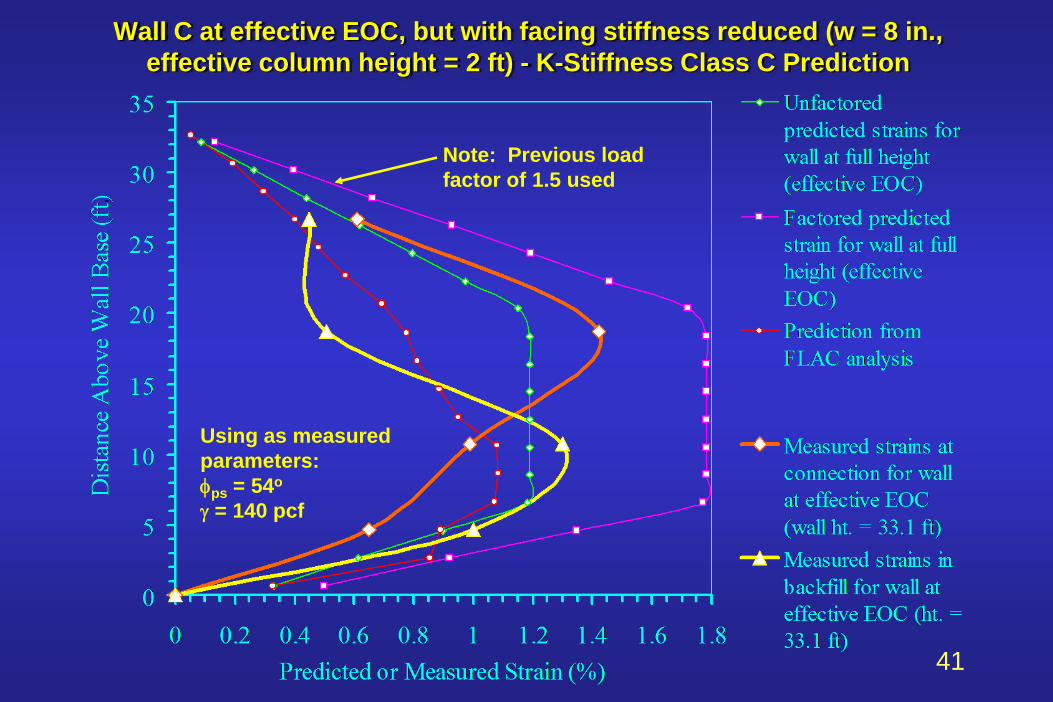
Wall C at effective EOC, but with facing stiffness reduced (w = 8 in., effective column height = 2 ft) - K-Stiffness Class C Prediction
Note: Previous load factor of 1.5 used
Using as measured parameters:φps = 54o
γ = 140 pcf

42
0
5
10
15
20
25
30
35
0 1 2 3 4 5Maximum Face Deflection (inches)
Tota
l Wal
l Hei
ght (
ft)
K-StiffnessPrediction
FLACprediction
Actual, fromsurveymeasurements
Wall C at effective EOC, but with facing stiffness reduced (w = 8 in., effective column height = 2 ft) - Class C Prediction of Maximum Facing
Deflection as a Function of Total Wall Height
Using as measured parameters:φps = 54o
γ = 140 pcf

43
Small Excavator Used to Place Facing Blocks

44
Facing Batter Adjustment TechniqueUsing Small Excavator

45
Facing Batter Adjustment TechniqueUsing Small Excavator

46
Result of Facing Batter AdjustmentTechnique
• Poor facing alignment• Damage to extensometers• Excessive geogrid strain at connection with facing
(observed only at Instrumentation layer 3)

47

48
Wall C Profile at Instrumented Section
Note: Yellow line is visual aidto assist in seeing face battervariances.

49
SR-18 Walls C and D Summary• The K-Stiffness method primarily reduces the
amount of reinforcement needed in the lower half of the wall in taller walls, but significantly reduces reinforcement needs at all levels in walls less than 20 to 25 ft in height
• For Walls C and D, the amount of reinforcement was reduced by 30 and 50%, respectively, relative to AASHTO requirements (materials cost savings of 20 and 40%, respectively, resulting in an estimated savings of $62,000)

50
SR-18 Walls C and D Summary, Cont.• Contractor wall face/connection installation
technique can have a significant effect on reinforcement stresses and strains– Poor geosynthetic tensioning can result in slack at
connection, lowering stresses, but increasing deformation and likelihood of face batter problems
– Poor compaction at face can increase downdrag loads and connection stresses
– Forced facing batter adjustments can increase loads by 20 to 30%
• Therefore, it may very important to vigorously inspect the facing/reinforcement connection construction activities

51
Lessons Learned Regarding the Benefits of Real Time Monitoring of Deformation, Load,
or other parameters• Deformation measurements combined with a written and/or
digital photographic record of construction can be used by Geotech Division staff to:– Accurately assess what is really happening as construction takes
place through data that could not be obtained through visual observations (i.e., as a construction inspection tool)
– Maximize the effective use of staff time and minimize travel time– Tie structure performance problems to construction activities and
weather conditions– Adjust the design, if necessary, should performance problems occur,
before it is too late• Real time monitoring can be especially useful when
stabilizing unstable areas (i.e., the FS is low, and construction technique and adverse weather can have a significant influence on performance)
52
Lessons Learned Regarding the Benefits of Real Time Monitoring of Deformation, Load,
or Other Parameters• Real time monitoring can also be useful to monitor landslide
and rockfall movements to provide a warning to the public regarding an emergent safety concern – if a threshold is exceeded, measurements can automatically be tied to variable message sign or beacon to warn public – data can also be transmitted remotely using modem, modem/radio or satellite link
• Disadvantages of real time monitoring:– The contractor must learn to work around instrumentation and
associated cables to prevent damage to the instrumentation– Long-term installations can be subject to vandalism or equipment can
simply wear out– Instrumentation programs can be costly – this type of approach is not
for every project – benefit should be assessed on project specific basis

53
Other Potential Real Time Monitoring Uses• To monitor vertical movements of a critical facility (e.g., I-5 in
downtown Seattle) caused by tunneling activities (e.g., Sound Transit work)
• To provide warning of debris flow or rockfall using geophones and other data if source zone is adequately above highway and there is adequate time before impact to make warning useful
• Monitor crack growth and/or water levels in rock masses using extensometers and piezometers, respectively to warn of impending failure (feasibility depends on site specific conditions)
• Rainfall and groundwater measurements can be tied to landslide movement to aid in landslide analysis (e.g., SR-101 along Hood Canal, and Bogachiel slide)