Embed Size (px)
Citation preview
Real-time Behavior Profilingfor Network Monitoring
Kuai Xu∗Arizona State UniversityE-mail: [email protected]∗Corresponding author
Feng WangArizona State UniversityE-mail: [email protected]
Supratik BhattacharyyaSnapTell IncPalo Alto, CA 94306
Zhi-Li ZhangDepartment of Computer Science and EngineeringUniversity of MinnesotaE-mail: [email protected]
Abstract: This paper presents the design and implementation of a real-time behavior profilingsystem for Internet links. The system uses flow-level information, and applies data mining andinformation-theoretic techniques to automatically discover significant events based on communi-cation patterns. We demonstrate the operational feasibility of the system by implementing it andperforming benchmarking of CPU and memory costs using packet traces from backbone links.To improve the robustness of this system against sudden traffic surges, we propose a novel fil-tering algorithm. The proposed algorithm successfully reduces the CPU and memory cost whilemaintaining high profiling accuracy. Finally, we devise and evaluate simple yet effective blockingstrategies to reduce prevalent exploit traffic, and build a simple event analysis engine to generateACL rules for filtering unwanted traffic.
Keywords: real-time traffic monitoring; behavior profiling; profiling-aware filtering algorithms.
Biographical notes: Kuai Xu is currently an assistant professor at Arizona State University. Hereceived his Ph.D. degree in computer science from the University of Minnesota in 2006, and hisB.S. and M.S. degrees from Peking University, China, in 1998 and 2001. His research interestsinclude network security and cloud computing. He is a member of ACM and IEEE.
Feng Wang received the BS degree from Wuhan University in 1996, MS degree fromBeijing University in 1999, and PhD degree from the University of Minnesota in 2005, all incomputer science. She is currently an assistant professor at ASU. Her research interests includewireless networks, and combinatorial optimization. She is a member of the IEEE.
Supratik Bhattacharyya received the M.S. and Ph.D. degrees in computer science fromthe University of Massachusetts, Amherst. He is currently with SnapTell Inc, Palo Alto, CA. Hewas a Distinguished Member of Technical Staff at Sprint Labs in Burlingame CA. His researchinterests are in mobile communication and services and in mining network traffic data.
Zhi-Li Zhang received the B.S. degree in computer science from Nanjing University,China, in 1986 and his M.S. and Ph.D. degrees in computer science from the Universityof Massachusetts in 1992 and 1997. He is currently a Professor of Computer Science andEngineering at the University of Minnesota, where he is currently a Professor. His researchinterests include computer communication and networks. He is a member of IEEE, ACM andINFORMS Telecommunication Section.
1 Introduction
Recent years have seen significant progress in real-time, contin-uous traffic monitoring and measurement systems in IP back-bone networks (Iannaccone, 2005; Iannaccone et al., 2001).However, real-time traffic summaries reported by many suchsystems focus mostly on volume-based heavy hitters or aggre-gated metrics of interest (Keys et al., 2005), which are not suf-ficient for finding interesting or anomalous behavior patterns.This paper explores the feasibility of building a real-time traf-fic behavior profiling system that analyzes vast amount of trafficdata in IP backbone networks and reports comprehensive behav-ior patterns of significant end hosts and network applications.
Towards this end, we answer a specific question in this paper:is it feasible to build a robust real-time traffic behavior profilingsystem that is capable of continuously extracting and analyzing“interesting” and “significant” traffic patterns on high-speed In-ternet links, even in the face of sudden surge in traffic. We ad-dress this question in the context of a traffic behavior profilingmethodology developed for IP backbone networks (Xu et al.,2005a). The behavior profiling methodology employs a com-bination of data-mining and information-theoretic techniquesto build comprehensive behavior profiles of Internet backbonetraffic in terms of communication patterns of end hosts and ap-plications. It consists of three key steps: significant cluster ex-traction, automatic behavior classification, and structural mod-eling for in-depth interpretive analysis. This three-step profilingmethodology extracts hosts or services that generate significanttraffic, classifies them into different behavior classes that pro-vide a general separation of various normal and abnormal trafficas well as rare and anomalous traffic behavior patterns (see Sec-tion 2 for more details). The profiling methodology has been ex-tensively validated off-line using packet traces collected from avariety of backbone links in an IP backbone network (Xu et al.,2005a,b).
To demonstrate the operational feasibility of performing on-line traffic behavior profiling on high-speed Internet backbonelinks, we build a prototype system of the aforementioned pro-filing methodology using general-purpose commodity PCs andintegrate it with an existing real-time traffic monitoring systemoperating in an Internet backbone network (Xu et al., 2007).The real-time traffic monitoring system captures packets on ahigh-speed link (from OC12 to OC192) and converts them into5-tuple flows (based on source IP, destination IP, source port,destination port, protocol fields), which are then continuouslyfed to the real-time traffic profiling system we build. The largevolume of traffic flows observed from these links creates greatchallenges for the profiling system to process them quickly oncommodity PCs with limited memory capacity. We incorporateseveral optimization features in our implementation such as ef-ficient data structures for storing and processing cluster infor-mation to address these challenges.
After designing and implementing this real-time traffic pro-filing system, we perform extensive benchmarking of CPU andmemory costs using packet-level traces from Internet backbone
∗A preliminary version of this paper appeared in the Proceedings ofIEEE/IFIP International Conference on Dependable Systems and Networks2007.
links to identify the potential challenges and resource bottle-necks. We find that CPU and memory costs linearly increasewith flow arrival rate. Nevertheless, resources on a commodityPC are sufficient to continuously process flow records and buildbehavior profiles for high-speed links in operational networks.For example, on a dual 1.5 GHz PC with 2048 MB of mem-ory, building behavior profiles once every 5 minutes for an 2.5Gbps link loaded at an average of 209 Mbps typically takes 45seconds of CPU time and 96 MB of memory.
However, resource requirements are much higher underanomalous traffic patterns such as sudden traffic surges causedby denial of service attacks, when the flow arrival rate canincrease by several orders of magnitude. We study this phe-nomenon by superposing “synthetic” packet traces containing amix of known denial of service (DoS) attacks (Hussain et al.,2003) on real backbone packet traces. To enhance the robust-ness of our profiling system under these stress conditions, wepropose and develop sampling-based flow filtering algorithmsand show that these algorithms are able to curb steep increasein CPU and memory costs while maintaining high profiling ac-curacy.
Given the prevalent exploit traffic, we further consider block-ing strategies the real-time profiling system can deploy to re-duce such unwanted traffic. Based on the characteristics of ex-ploit traffic, we devise several heuristic rules that the profilingsystem can employ to reducing unwanted traffic, and evaluatetheir cost and performance. By replaying packet traces col-lected from backbone links to the real-time profiling system,we find that simple blocking strategies could potentially reducesubstantial exploit traffic in backbone networks.
The contributions of this paper are as follows:
• We present the design and implementation of a real-timetraffic profiling system for link-level Internet traffic, anddemonstrate its operational feasibility by benchmarkingCPU and memory costs using packet traces from an op-erational backbone.
• We propose a new filtering algorithm to improve the ro-bustness of the profiling system against traffic surges andanomalous traffic patterns, and show that the proposedalgorithm successfully reduces CPU and memory costswhile maintaining high profiling accuracy.
• We devise, evaluate and deploy simple yet effective theaccess control list (ACL) rules in the real-time profilingsystem to reduce prevalent exploit behavior in backbonenetworks.
The remainder of this paper is organized as follow. Sec-tion 2 describes a behavior profiling methodology that auto-matically discovers significant behavior patterns from massivetraffic data. Section 3 introduces the real-time profiling systemand discusses its functional modules as well as the interfaceswith continuous monitoring systems and an event analysis en-gine. Section 4 is devoted to performance benchmarking andstress test of the profiling system using a variety of packet-leveltraces from OC-48 backbone links, and synthetic traces that mixvarious attacks into real backbone packet traces. In Section 5,

we propose and evaluate sampling-based filtering algorithms toenhance the robustness of the profiling system against suddentraffic surges. Section 6 devises and evaluates several simpleblocking strategies in the real-time profiling system to reduceunwanted exploit traffic. Finally, Section 7 concludes this pa-per.
2 Behavior Profiling Methodology
In light of wide spread cyber attacks and frequent emergenceof disruptive applications, we developed a general traffic profil-ing methodology that automatically discovers significant behav-iors with plausible interpretations from vast amount of trafficdata. The profiling methodology uses 5-tuple flows, i.e., sourceIP address (srcIP), destination IP address (dstIP), sourceport number (srcPrt), destination port number (dstPrt),and protocol, collected in a time interval (e.g., 5 minutes) fromInternet backbone links. We focus on the first four feature di-mensions in 5-tuples, and extract clusters along each dimension.Each cluster consists of flows with the same feature value in agiven dimension. The value and its dimension are denoted ascluster key and cluster dimension. This leads to four groups ofclusters, i.e., srcIP, dstIP, srcPrt and dstPrt clusters.The first two represent a collection of host behavior, while thelast two yield a collection of application behaviors that aggre-gate flows on the corresponding ports.
2.1 Extracting Significant Clusters
Due to massive traffic data and wide diversity of end hosts andapplications observed in backbone links, it is impractical toexamine all end hosts and applications. Thus, we attempt toextract significant clusters of interest, in which the number offlows exceeds a threshold. In extracting such clusters, we intro-duced an entropy-based algorithm that finds adaptive thresholdsalong each dimension based on traffic mix and cluster size dis-tributions.
The intuitive idea of this algorithm is i) to extract clusters ineach dimension whose cluster keys are distinct in terms of sizedistributions; ii) to repeat this process until the size distributionof the remaining clusters in the dimension is (nearly) random.To quantify the “randomness’ of cluster size distribution, weuse an information-theoretic measure, relative uncertainty (alsoknown as standardized entropy), which provides a measure ofrandomness between 0 and 1. If relative uncertainty (RU) ona given variable X is close to 1, it indicates that the observedvalues of X are closer to being uniformly distributed and thuslook less distinguishable from each other.
By applying this algorithm on a variety of backbone links,we see that the number of significant clusters extracted alongeach dimension is far less than the total number of values. Thisobservation suggests that this step is very useful and necessaryin reducing traffic data for analysis while retaining most inter-esting behaviors.
2.2 Behavior Classification
Given the extracted significant clusters, the second step of theprofiling methodology is to classify their behaviors based oncommunication patterns. The flows in each significant cluster,e.g., a srcIP cluster, share the same feature value in srcIPdimension, thus most behavior information is contained in theother “free” features including dstIP, srcPrt, dstPrt,which might take any possible values.
Traditional approaches mostly focused on volume-based in-formation, e.g., unique number of dstIP’s or dstPrt’s inexamining the patterns of such clusters. However, the trafficvolume often is unable to uncover comprehensive communi-cation patterns. For example, if two hosts communicate with100 unique dstIP’s, we cannot safely conclude that their com-munication patterns from dstIP feature are the same withoutfurther investigation. A simple example is that one host couldbe a web server talking to 100 clients, while another is an in-fected host randomly scanning 100 targets. More importantly,the number of flows associated with each dstIP is very likelyto be different. For the case of the web server, the numbers offlows between clients and the server tend to be diverse. On theother hand, the number of probing flows between the scannerand each target is often uniform, e.g., one in most cases. Thisinsight motivates us to use relative uncertainty again to mea-sure the feature distribution of free dimensions for all significantclusters.
Suppose the size of a cluster is m and a free dimension Xmay take NX discrete values. Moreover, let P (X) denote aprobability distribution, and p(xi) = mi/m, xi ∈ X , wheremi is the frequency or number of times we observe the featureX taking the value xi. Then, the RU in the feature X for thecluster is defined as
RU(X) :=H(X)
Hmax(X)=
H(X)log min{NX ,m} , (1)
where H(X) is the (empirical) entropy of X defined as
H(X) := −∑
xi∈X
p(xi) log p(xi). (2)
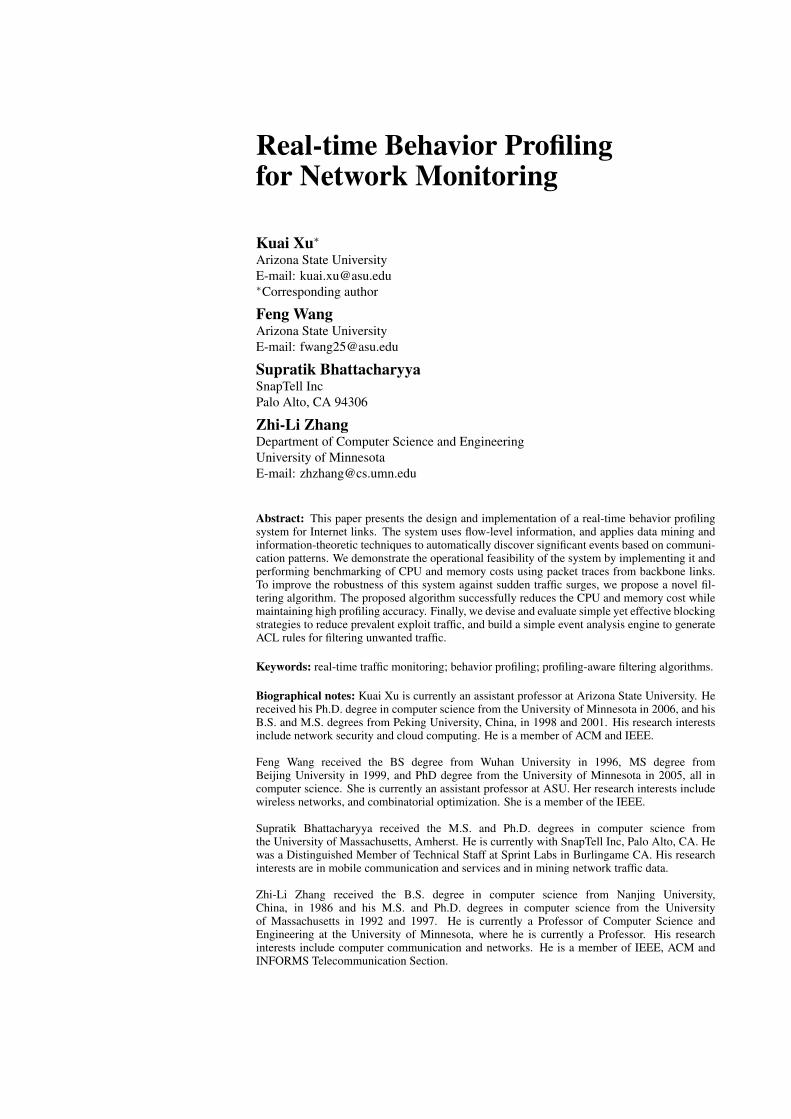
We use relative uncertainty to measure feature distributionsof three free dimensions. As a result, we obtain a relative un-certainty vector for each cluster, e.g., [RUsrcPrt, RUdstPrt andRUdstIP ] for srcIP clusters. Recall that RU is in the range of[0,1], so we could represent the RU vector of each srcIP clus-ter as a single point in a 3-dimensional space. Fig. 1 representseach srcIP cluster extracted in each 5-minute time slot overan 1-hour period from an OC-48 backbone link as a point in aunit cube. We see that the points are “clustered”, suggesting thatthere are few underlying common patterns among them. Suchobservation holds for other dimensions as well. This leads toa behavior classification scheme which classifies all srcIP’sinto behavior classes based on their similarity/dissimilarity inthe RU vector space.
By applying the behavior classification on backbone linksand analyzing their temporal properties, we find this scheme isrobust and consistent in capturing behavior similarities among
00.2
0.40.6
0.81
00.2
0.40.6
0.810
0.2
0.4
0.6
0.8
1
RU(srcPort)RU(dstPort)
RU
(dst
IP)
Figure 1: The distribution of relative uncertainty on free dimensions for srcIP’s from an OC-48 backbone link during an 1-hourperiod.
significant clusters. Such similarities are measured on the fea-ture distribution of free dimensions of these clusters, hence pro-vide useful insight in communication patterns of end hosts andapplications (Karagiannis et al., 2005; Xu et al., 2005a).
2.3 Structural Modeling
To provide a plausible interpretation for behavior patterns, weadopt dominant state analysis technique for modeling and char-acterizing the interaction of various feature dimensions in acluster. The idea of dominant state analysis comes from struc-tural modeling or reconstructability analysis in system the-ory (Krippendorff, 1986; Cavallo and Klir, 1979; Zwick, 2004)as well as more recent graphical models in statistical learningtheory (Jordan, 2004).
The intuition behind dominant state analysis is described be-low. Given a srcIP associated with significant traffic flows,all flows can be represented as a 4-tuple (ignoring the proto-col field) 〈u, xi, yi, zi〉, where the srcIP has a fixed value u,while the srcPrt (X dimension), dstPrt (Y dimension) anddstIP (Z dimension) may take any legitimate value. Henceeach flow in the cluster imposes a “constraint” on the three“free” dimensions X, Y and Z. Treating each dimension as arandom variable, the flows in the cluster constrain how the ran-dom variables X , Y and Z “interact” or “depend” on each other,via the (induced) joint probability distribution P(X, Y, Z).
The objective of dominant state analysis is to explore the in-teraction or dependence among the free dimensions by identify-ing “simpler” subsets of values or constraints (called structuralmodels in the literature (Krippendorff, 1986)) to represent theoriginal data in their probability distribution. Given the proba-bility information, we can not only approximately reproduce theoriginal flow patterns, but also explain the dominant activities ofend hosts or applications.
2.4 Properties of Behavior Profiles
We have applied the profiling methodology on traffic data col-lected from a variety of links at the core of the Internet throughoff-line analysis. We find that a large fraction of clusters fall
into three typical behavior profiles: server/service behavior pro-file, heavy hitter host behavior, and scan/exploit behavior pro-file. These behavior profiles are built based on various aspects,including behavior classes, dominant states, and additional at-tributes such as average packets and bytes per flow. These be-havior profiles are recorded in a database for further event anal-ysis, such as temporal properties of behavior classes and indi-vidual clusters, or behavior change detection based on RU vec-tors.
The profiling methodology is able to find various interestingand anomalous events. First, it automatically detects novel orunknown exploit behaviors that match typical exploit profiles,but exhibit unusual dominant states (e.g., dstPrt’s). Second,any atypical behavior is worth close examination, since theyrepresent as “outliers” or “anomaly” among behavior profiles.Third, the methodology could point out deviant behaviors ofend hosts or applications that deviate from previous patterns.
2.5 Characteristics of Exploit Traffic
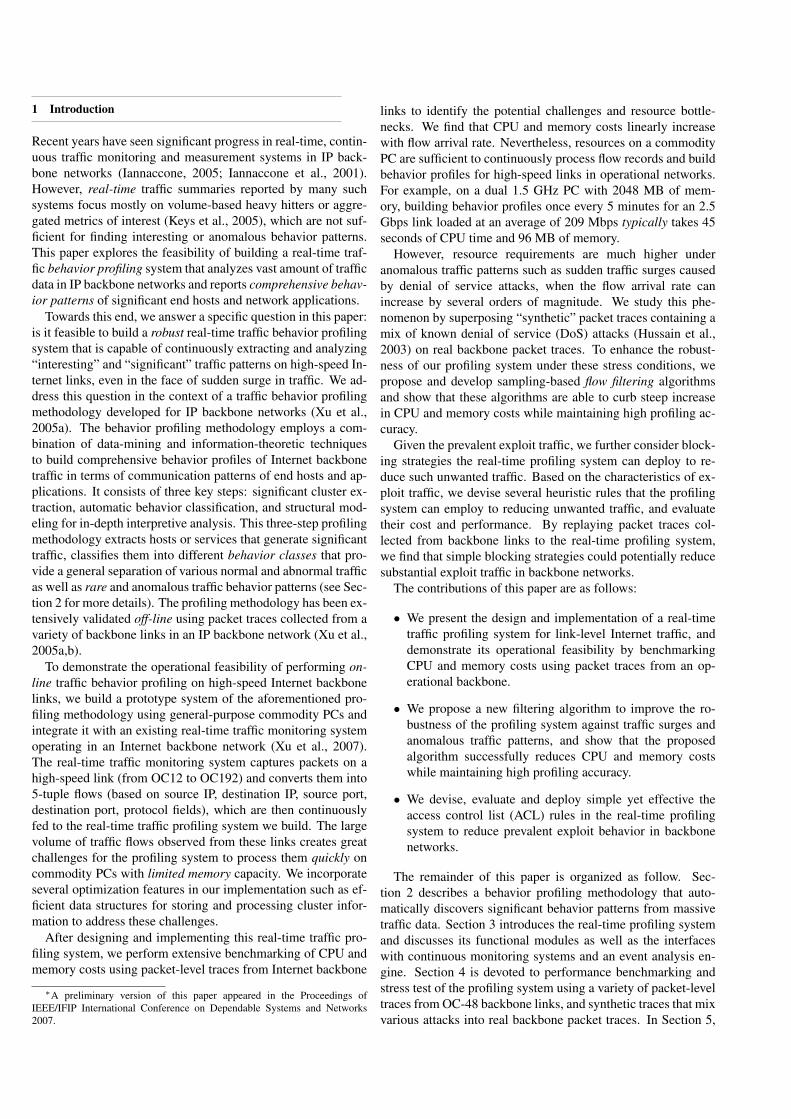
Given the prevalent exploit activities, we further introduce sev-eral metrics to study the characteristics of exploit traffic. Thefrequency, Tf , measures the number of 5-minute time periods(over the course of 24 hours) in which a source is profiled by ourmethodology as having an exploit profile. The persistence, Tp,measures (in percentage) the number of consecutive 5-minuteperiods over the total number of periods that a source sends sig-nificant amount of exploit traffic. It is only defined for sourceswith Tf ≥ 2. Hence Tp = 100(%) means that the source con-tinuously sends significant amount of exploit traffic in all thetime slots it is observed. Finally, we use the intensity, I , to re-late both the temporal and spatial aspects of exploit traffic: itmeasures the (average) number of distinct target IP addressesper minute that a source touches in each 5-minute period. Thusit is an indicator how fast or aggressive a source attempts tospread the exploit.
Figs. 2(a)(b) show the distributions of the frequency vs. per-sistence and the distribution of intensity for the exploit sourcesfrom an OC-48 backbone link during 24 hours. From Fig. 2(a)we observe that frequency follows a Zipf like distribution: only
0 1000 2000 3000 400010
0
101
102
Source of exploit
Fre
quen
cy/P
ersi
sten
ce
FrequencyPersistence
(a) Frequency (Tf ) and persistence (Tp)
100
101
102
103
104
101
102
103
104
105
Source of exploit
Inte
nsity
(b) Intensity (I)
Figure 2: Characteristics of exploit traffic for the sources with exploit profiles in the backbone link during a 24-hour period.
17.2% sources have a frequency of 5 or more, while 82.8%sources have a frequency of less than 5. In particular, over 70%of them have frequency of 1 or 2. Furthermore, those 17.2% fre-quent (Tf ≥ 5) sources account for 64.7%, 61.1% and 65.5% ofthe total flows, packets, and bytes of exploit traffic. The persis-tence varies for sources with similar frequency, but nearly 60%of the sources (Tf ≥ 2) have a persistence of 100 (%): thesesources continuously send exploit traffic over time and then dis-appear.
The exploit intensity illustrated in Fig. 2(b) also follows aZipf like distribution. The maximum intensity is 21K targetsper minute, while the minimum is 40 targets per minute. Thereare only 12.9% sources with an intensity of over 500 targets perminute, while nearly 81.1% sources have an intensity of lessthan 500 targets per minute. Those 12.9% aggressive (I ≥ 500)sources account for 50.5%, 53.3%, and 45.2% of the total flows,packets, and bytes of exploit traffic. The relatively small num-ber of sources, which frequently, persistently or aggressivelygenerate exploit traffic, are candidates for blocking actions.
In the rest of this paper, we will demonstrate the feasibilityof designing and implementing a real-time traffic profiling sys-tem that uses flow-level information generated from “always-on” packet monitors and reports significant online events basedon communication patterns of end hosts and applications evenfaced with anomalous traffic patterns, e.g., denial of service at-tacks or worm outbreaks.
3 Real-time Profiling System
In this section, we first describe the design guidelines for theprofiling system and then present the overall architecture, func-tional modules and key implementation details.
3.1 Design Guidelines
Four key considerations guide the design of our profiling sys-tem:
• scalability: The profiling system is targeted at high-speed(1 Gbps or more) backbone links and hence must scale tothe traffic load offered by such links. Specifically, if thesystem has to continuously build behavior profiles of sig-nificant clusters once every time interval T (e.g, T = 5 min-
utes), then it has to take less than time T to process all theflow records aggregated in every time interval T . And thishas to be accomplished on a commodity PC platform.
• robustness: The profiling system should be robust toanomalous traffic patterns such as those caused by de-nial of service attacks, flash crowds, worm outbreaks, etc.These traffic patterns can place a heavy demand on systemresources. At the same time, it is vital for the profilingsystem to be functioning during such events since it willgenerate data for effective response and forensic analysis.Therefore the system must adapt gracefully to these sit-uations and achieve a suitable balance between profilingaccuracy and resource utilization.
• modularity: The profiling system should be designed in amodular fashion with each module encapsulating a specificfunction or step in the profiling methodology. Informationexchange between modules should be clearly specified. Inaddition, the system should be designed to accept inputfrom any packet or flow monitoring system that exportsa continuous stream of flow records. However, the flowrecord export format has to be known to the system.
• usability: The profiling system should be easy to config-ure and customize so that a network operator can focus onspecific events of interest and obtain various levels of in-formation about these events. At the same time, it shouldexpose minimal details about the methodology to an aver-age user. Finally it should generate meaningful and easy-to-interpret event reports, instead of streams of statistics.
These design considerations form a guideline of our systemdesign and drive each stage of our system implementation. Inthe rest of the section, we will discuss the overall architectureof the real-time profiling system, its functional modules and keyimplementation details that achieve the design goals.
3.2 System Architecture
Fig. 3 depicts the architecture of the profiling system that is inte-grated with an “always-on” monitoring system, an event analy-sis engine, and a feedback channel of generating ACL entries ofrouters for blocking unwanted traffic. The flow-level informa-tion used by the profiling system is generated from continuous
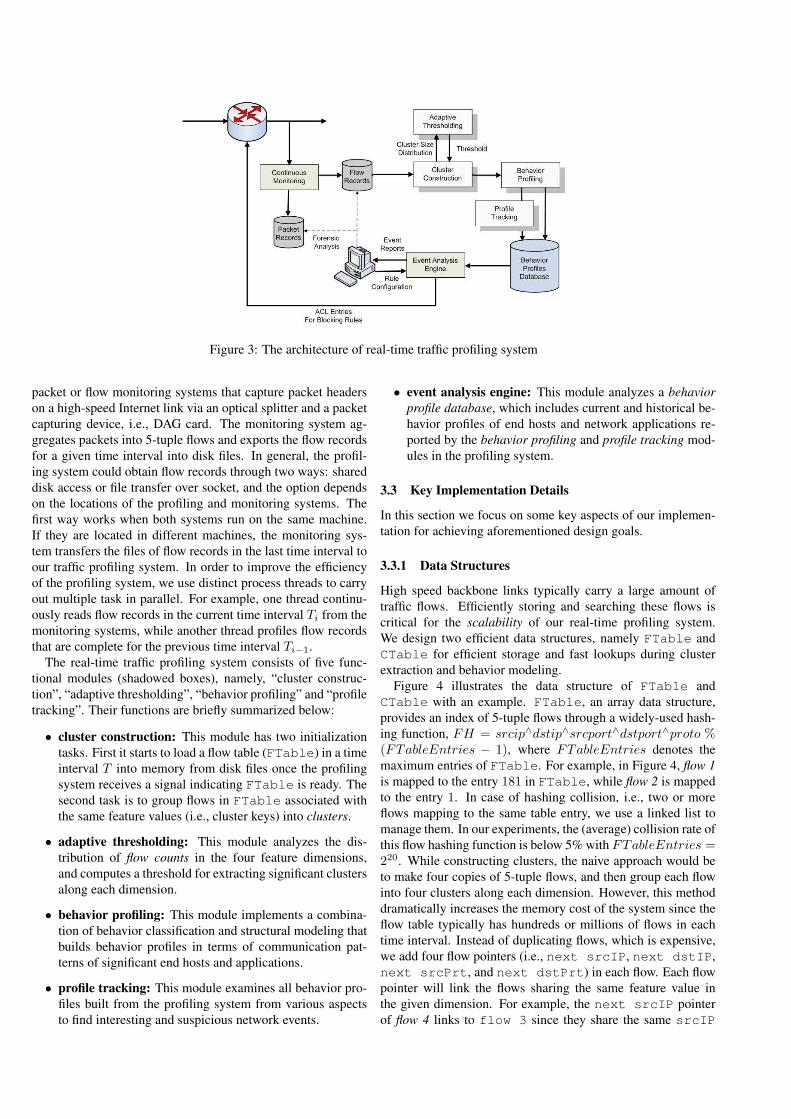
Figure 3: The architecture of real-time traffic profiling system
packet or flow monitoring systems that capture packet headerson a high-speed Internet link via an optical splitter and a packetcapturing device, i.e., DAG card. The monitoring system ag-gregates packets into 5-tuple flows and exports the flow recordsfor a given time interval into disk files. In general, the profil-ing system could obtain flow records through two ways: shareddisk access or file transfer over socket, and the option dependson the locations of the profiling and monitoring systems. Thefirst way works when both systems run on the same machine.If they are located in different machines, the monitoring sys-tem transfers the files of flow records in the last time interval toour traffic profiling system. In order to improve the efficiencyof the profiling system, we use distinct process threads to carryout multiple task in parallel. For example, one thread continu-ously reads flow records in the current time interval Ti from themonitoring systems, while another thread profiles flow recordsthat are complete for the previous time interval Ti−1.
The real-time traffic profiling system consists of five func-tional modules (shadowed boxes), namely, “cluster construc-tion”, “adaptive thresholding”, “behavior profiling” and “profiletracking”. Their functions are briefly summarized below:
• cluster construction: This module has two initializationtasks. First it starts to load a flow table (FTable) in a timeinterval T into memory from disk files once the profilingsystem receives a signal indicating FTable is ready. Thesecond task is to group flows in FTable associated withthe same feature values (i.e., cluster keys) into clusters.
• adaptive thresholding: This module analyzes the dis-tribution of flow counts in the four feature dimensions,and computes a threshold for extracting significant clustersalong each dimension.
• behavior profiling: This module implements a combina-tion of behavior classification and structural modeling thatbuilds behavior profiles in terms of communication pat-terns of significant end hosts and applications.
• profile tracking: This module examines all behavior pro-files built from the profiling system from various aspectsto find interesting and suspicious network events.
• event analysis engine: This module analyzes a behaviorprofile database, which includes current and historical be-havior profiles of end hosts and network applications re-ported by the behavior profiling and profile tracking mod-ules in the profiling system.
3.3 Key Implementation Details
In this section we focus on some key aspects of our implemen-tation for achieving aforementioned design goals.
3.3.1 Data Structures
High speed backbone links typically carry a large amount oftraffic flows. Efficiently storing and searching these flows iscritical for the scalability of our real-time profiling system.We design two efficient data structures, namely FTable andCTable for efficient storage and fast lookups during clusterextraction and behavior modeling.
Figure 4 illustrates the data structure of FTable andCTable with an example. FTable, an array data structure,provides an index of 5-tuple flows through a widely-used hash-ing function, FH = srcip∧dstip∧srcport∧dstport∧proto %(FTableEntries − 1), where FTableEntries denotes themaximum entries of FTable. For example, in Figure 4, flow 1is mapped to the entry 181 in FTable, while flow 2 is mappedto the entry 1. In case of hashing collision, i.e., two or moreflows mapping to the same table entry, we use a linked list tomanage them. In our experiments, the (average) collision rate ofthis flow hashing function is below 5% with FTableEntries =220. While constructing clusters, the naive approach would beto make four copies of 5-tuple flows, and then group each flowinto four clusters along each dimension. However, this methoddramatically increases the memory cost of the system since theflow table typically has hundreds or millions of flows in eachtime interval. Instead of duplicating flows, which is expensive,we add four flow pointers (i.e., next srcIP, next dstIP,next srcPrt, and next dstPrt) in each flow. Each flowpointer will link the flows sharing the same feature value inthe given dimension. For example, the next srcIP pointerof flow 4 links to flow 3 since they share the same srcIP
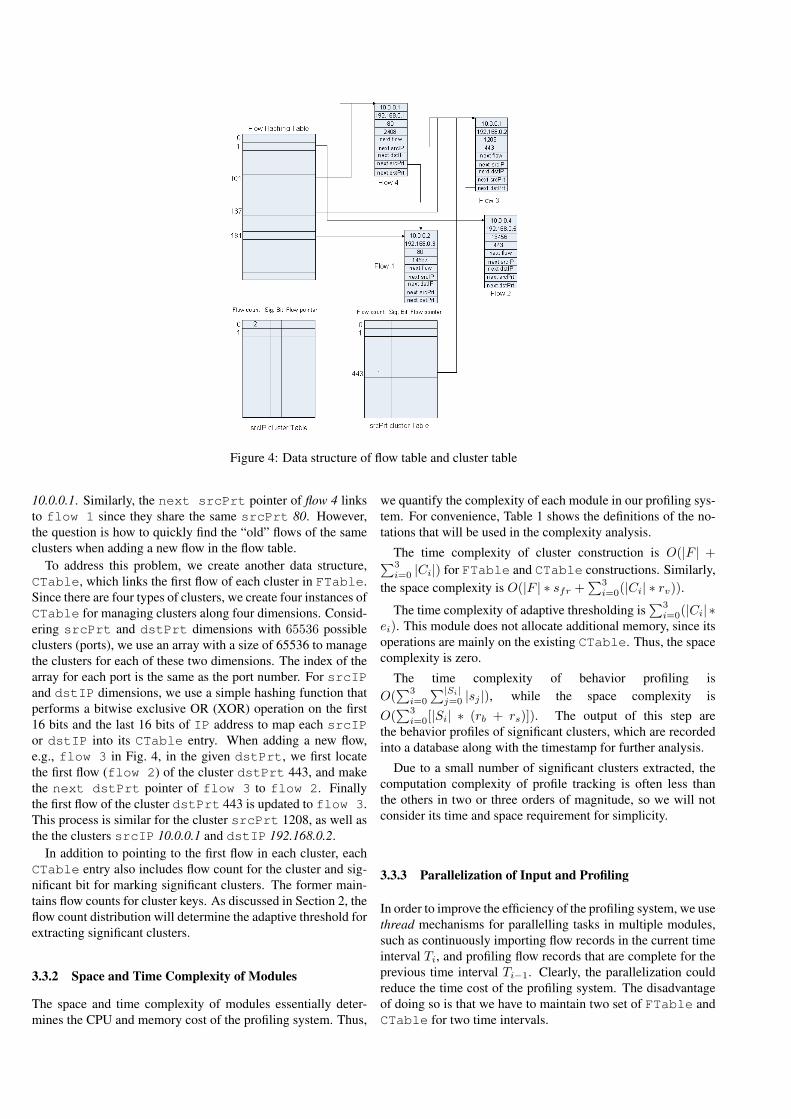
Figure 4: Data structure of flow table and cluster table
10.0.0.1. Similarly, the next srcPrt pointer of flow 4 linksto flow 1 since they share the same srcPrt 80. However,the question is how to quickly find the “old” flows of the sameclusters when adding a new flow in the flow table.
To address this problem, we create another data structure,CTable, which links the first flow of each cluster in FTable.Since there are four types of clusters, we create four instances ofCTable for managing clusters along four dimensions. Consid-ering srcPrt and dstPrt dimensions with 65536 possibleclusters (ports), we use an array with a size of 65536 to managethe clusters for each of these two dimensions. The index of thearray for each port is the same as the port number. For srcIPand dstIP dimensions, we use a simple hashing function thatperforms a bitwise exclusive OR (XOR) operation on the first16 bits and the last 16 bits of IP address to map each srcIPor dstIP into its CTable entry. When adding a new flow,e.g., flow 3 in Fig. 4, in the given dstPrt, we first locatethe first flow (flow 2) of the cluster dstPrt 443, and makethe next dstPrt pointer of flow 3 to flow 2. Finallythe first flow of the cluster dstPrt 443 is updated to flow 3.This process is similar for the cluster srcPrt 1208, as well asthe the clusters srcIP 10.0.0.1 and dstIP 192.168.0.2.
In addition to pointing to the first flow in each cluster, eachCTable entry also includes flow count for the cluster and sig-nificant bit for marking significant clusters. The former main-tains flow counts for cluster keys. As discussed in Section 2, theflow count distribution will determine the adaptive threshold forextracting significant clusters.
3.3.2 Space and Time Complexity of Modules
The space and time complexity of modules essentially deter-mines the CPU and memory cost of the profiling system. Thus,
we quantify the complexity of each module in our profiling sys-tem. For convenience, Table 1 shows the definitions of the no-tations that will be used in the complexity analysis.
The time complexity of cluster construction is O(|F | +∑3i=0 |Ci|) for FTable and CTable constructions. Similarly,
the space complexity is O(|F | ∗ sfr +∑3
i=0(|Ci| ∗ rv)).
The time complexity of adaptive thresholding is∑3
i=0(|Ci| ∗ei). This module does not allocate additional memory, since itsoperations are mainly on the existing CTable. Thus, the spacecomplexity is zero.
The time complexity of behavior profiling isO(
∑3i=0
∑|Si|j=0 |sj |), while the space complexity is
O(∑3
i=0[|Si| ∗ (rb + rs)]). The output of this step arethe behavior profiles of significant clusters, which are recordedinto a database along with the timestamp for further analysis.
Due to a small number of significant clusters extracted, thecomputation complexity of profile tracking is often less thanthe others in two or three orders of magnitude, so we will notconsider its time and space requirement for simplicity.
3.3.3 Parallelization of Input and Profiling
In order to improve the efficiency of the profiling system, we usethread mechanisms for parallelling tasks in multiple modules,such as continuously importing flow records in the current timeinterval Ti, and profiling flow records that are complete for theprevious time interval Ti−1. Clearly, the parallelization couldreduce the time cost of the profiling system. The disadvantageof doing so is that we have to maintain two set of FTable andCTable for two time intervals.
Table 1: Notations used in the paperNotation DefinitionF set of 5-tuple flows in a time intervali dimension id (0/1/2/3 = srcIP/dstIP/srcPort/dstPortCi set of clusters in dimension iSi set of significant clusters in dimension ici a cluster in dimension isi a significant cluster in dimension irf size of a flow recordrv size of the volume information of a clusterrb size of behavior information of a significant clusterrs size of dominant states of a significant cluster
3.3.4 Event Analysis Engine
To discover interesting or anomalous network events, we buildan event analysis engine with three aspects: i) temporal be-havior analysis, ii) feature dimension correlation, and iii) eventconfigurations. The objective of temporal behavior analysis isto characterize temporal properties of behavior classes as wellas individual clusters from the behavior profile database thatrecords behavior profiles built from the profiling system. Priorwork in (Lakhina et al., 2005; Xu et al., 2005a) have demon-strated that temporal properties could help distinguish and clas-sify behavior classes. Feature dimension correlation attempts tofind the correlation between clusters from various dimensionsto detect emerging exploit and worm activities (Kim and Karp,2004; Singh et al., 2004) that often trigger new clusters fromsrcIP, dstIP and dstPrt dimensions.
We develop a simple event configuration language that en-ables network operators or security analysts to extract informa-tion on events of interest from behavior profiles for networkmanagement or troubleshooting. To express the policy, we usefour distinct fields: Dimension, Event Type, Filter, and Descrip-tion. The options of these fields include:
• Dimension ∈ {srcIP, dstIP, srcPrt, dstPrt, all}• Event Type ∈ {rare, deviant, exploit, unusual service
ports, all}• Filter ∈ {high frequncy, high intensity, matching
selected ports, others}• Description ∈ {full, summary}For example, if a network operator wants to monitor rare
behavior of srcIP end hosts, she could use the rule srcIP(Dimension) - rare (Event Type) - all (Filter) - full (Descrip-tion), which expresses the policy of reporting full profiles of allsrcIP clusters with rare behavior. Similarly, we could con-struct other filter rules using the combinations of all availableoptions.
In the next section, we will demonstrate the operational fea-sibility of this system by performing extensive benchmarkingof CPU and memory costs using packet-level traces from OC-48 backbone links. To evaluate the robustness of the system,we also test the system against anomalous traffic patterns underdenial of service attacks or worm outbreaks.
4 Performance Evaluation
In this section, we first conduct performance benchmarking ofCPU and memory cost of the profiling system using a varietyof packet traces from OC-48 backbone links. Subsequently,we evaluate the performance bottlenecks of the system underanomalous traffic patterns such as those caused by denial of ser-vice attacks and worm outbreaks.
4.1 Benchmarking
We measure CPU usage of the profiling process by using a sys-tem call, namely, getrusage(), which queries actual system anduser CPU time of the process. The system call returns withthe resource utilization including ru utime and ru stime, whichrepresent the user and system time used by the process, respec-tively. The sum of these two times indicates the total CPU timethat the profiling process uses. Let T denote the total CPU time,and Tl, Ta, and Tp denote the CPU usage for the modules ofcluster construction, adaptive thresholding and behavior profil-ing, respectively. Then we have
T = Tl + Ta + Tp (3)
Similarly, we collect memory usage with another system call,mallinfo(), which collects information of the dynamic memoryallocation. Let M denote the total memory usage, and Ml, Ma,and Mp denote the memory usage in three key modules. Thenwe have
M = Ml + Ma + Mb (4)
In oder to track the CPU and memory usages of each module,we use these two system calls before and after the module. Thedifference of the output becomes the actual CPU and memoryconsumption of each module. Next, we show the CPU time andmemory cost of profiling system on three OC-48 links during acontinuous 18 hours with average link utilization of 209 Mbps,86 Mbps, and 78 Mbps. For convenience, let L1, L2, and L3
denote three links, respectively.Table 2 shows a summary of CPU time and memory cost of
the profiling system on L1 to L3 for 18 consecutive hours. Itis not surprising to see that the average CPU and memory costsfor L1 are larger than the other two links due to a higher link
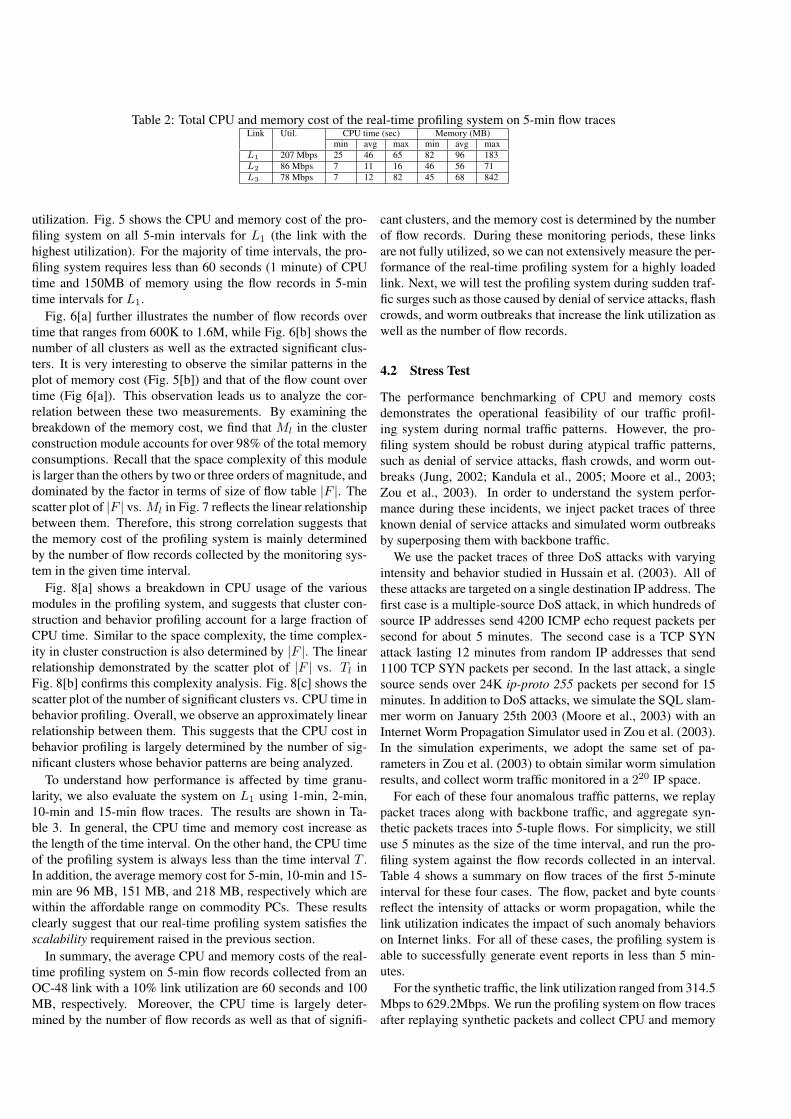
Table 2: Total CPU and memory cost of the real-time profiling system on 5-min flow tracesLink Util. CPU time (sec) Memory (MB)
min avg max min avg maxL1 207 Mbps 25 46 65 82 96 183L2 86 Mbps 7 11 16 46 56 71L3 78 Mbps 7 12 82 45 68 842
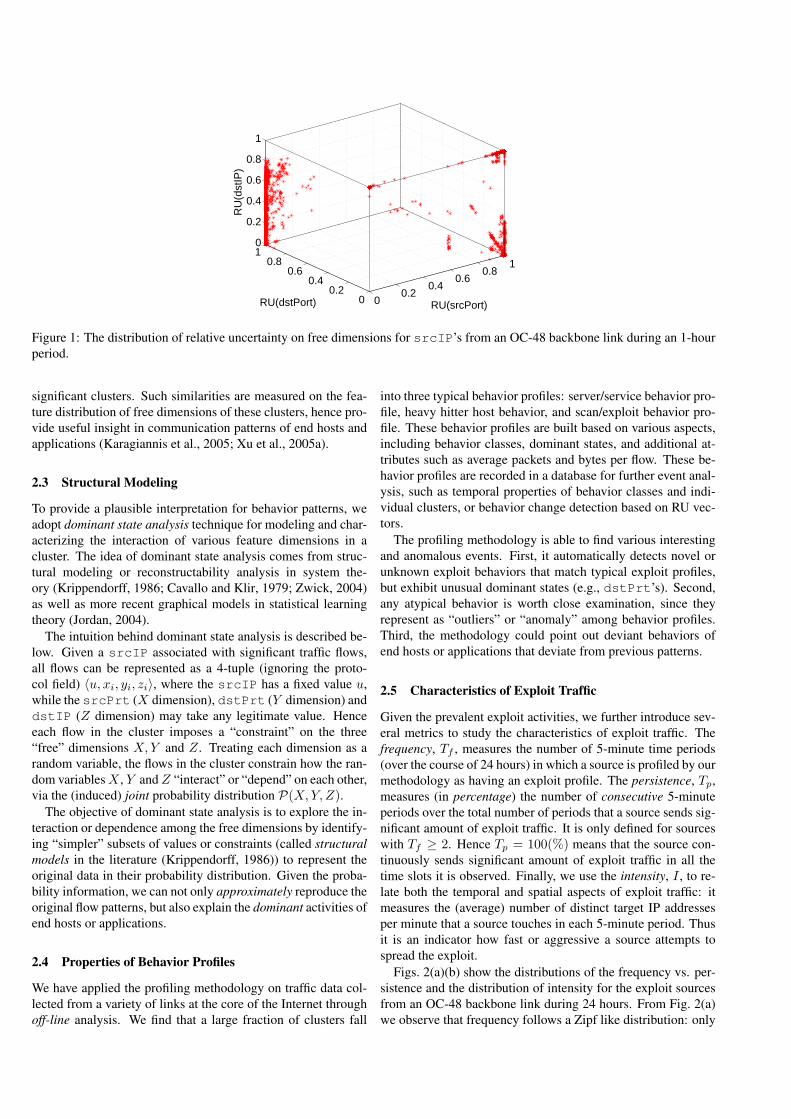
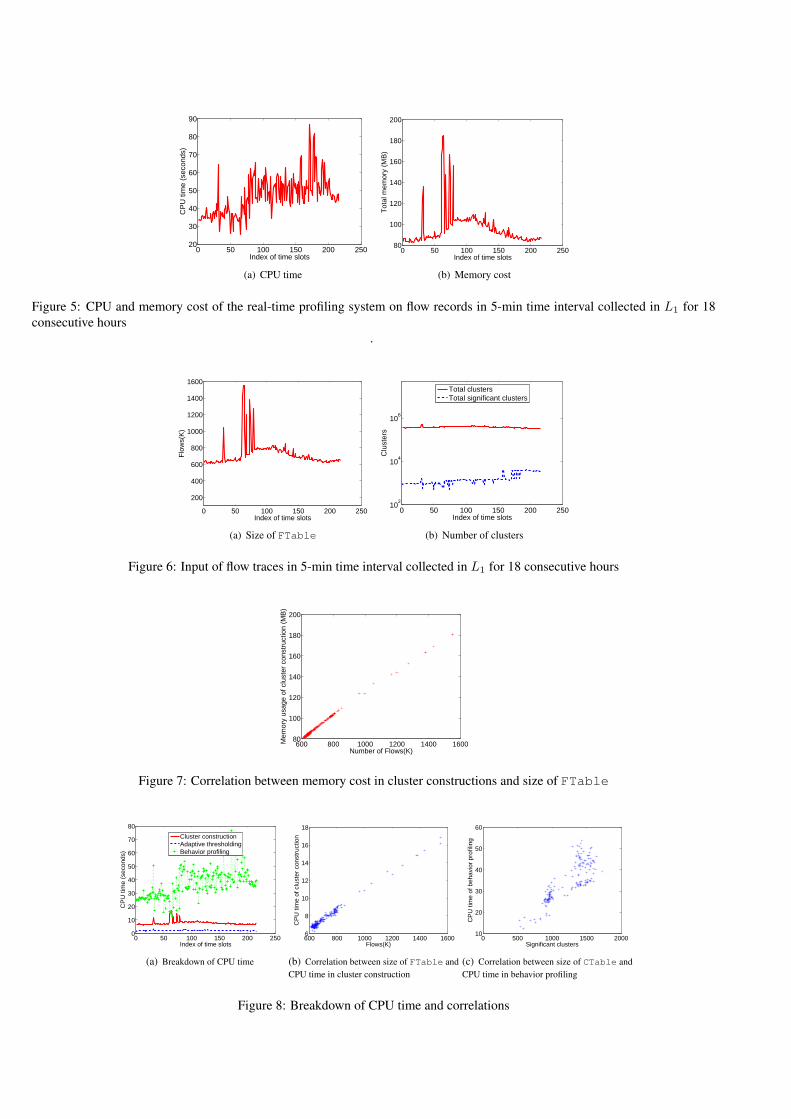
utilization. Fig. 5 shows the CPU and memory cost of the pro-filing system on all 5-min intervals for L1 (the link with thehighest utilization). For the majority of time intervals, the pro-filing system requires less than 60 seconds (1 minute) of CPUtime and 150MB of memory using the flow records in 5-mintime intervals for L1.
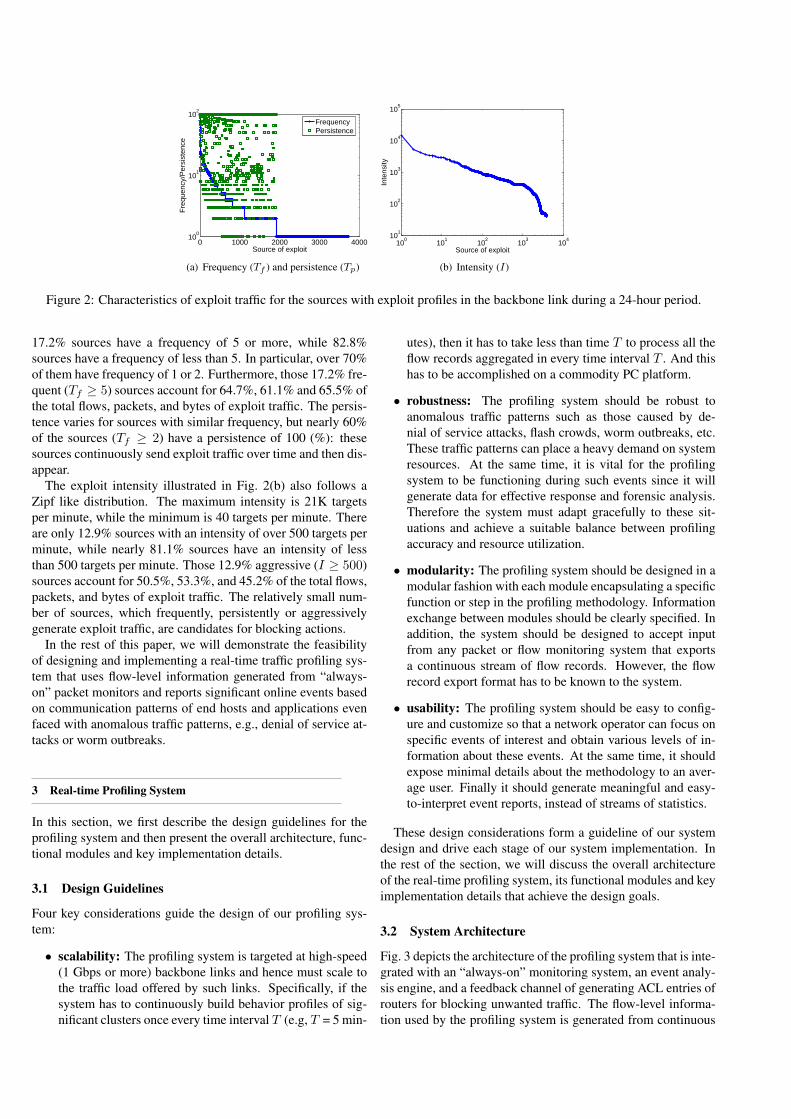
Fig. 6[a] further illustrates the number of flow records overtime that ranges from 600K to 1.6M, while Fig. 6[b] shows thenumber of all clusters as well as the extracted significant clus-ters. It is very interesting to observe the similar patterns in theplot of memory cost (Fig. 5[b]) and that of the flow count overtime (Fig 6[a]). This observation leads us to analyze the cor-relation between these two measurements. By examining thebreakdown of the memory cost, we find that Ml in the clusterconstruction module accounts for over 98% of the total memoryconsumptions. Recall that the space complexity of this moduleis larger than the others by two or three orders of magnitude, anddominated by the factor in terms of size of flow table |F |. Thescatter plot of |F | vs. Ml in Fig. 7 reflects the linear relationshipbetween them. Therefore, this strong correlation suggests thatthe memory cost of the profiling system is mainly determinedby the number of flow records collected by the monitoring sys-tem in the given time interval.
Fig. 8[a] shows a breakdown in CPU usage of the variousmodules in the profiling system, and suggests that cluster con-struction and behavior profiling account for a large fraction ofCPU time. Similar to the space complexity, the time complex-ity in cluster construction is also determined by |F |. The linearrelationship demonstrated by the scatter plot of |F | vs. Tl inFig. 8[b] confirms this complexity analysis. Fig. 8[c] shows thescatter plot of the number of significant clusters vs. CPU time inbehavior profiling. Overall, we observe an approximately linearrelationship between them. This suggests that the CPU cost inbehavior profiling is largely determined by the number of sig-nificant clusters whose behavior patterns are being analyzed.
To understand how performance is affected by time granu-larity, we also evaluate the system on L1 using 1-min, 2-min,10-min and 15-min flow traces. The results are shown in Ta-ble 3. In general, the CPU time and memory cost increase asthe length of the time interval. On the other hand, the CPU timeof the profiling system is always less than the time interval T .In addition, the average memory cost for 5-min, 10-min and 15-min are 96 MB, 151 MB, and 218 MB, respectively which arewithin the affordable range on commodity PCs. These resultsclearly suggest that our real-time profiling system satisfies thescalability requirement raised in the previous section.
In summary, the average CPU and memory costs of the real-time profiling system on 5-min flow records collected from anOC-48 link with a 10% link utilization are 60 seconds and 100MB, respectively. Moreover, the CPU time is largely deter-mined by the number of flow records as well as that of signifi-
cant clusters, and the memory cost is determined by the numberof flow records. During these monitoring periods, these linksare not fully utilized, so we can not extensively measure the per-formance of the real-time profiling system for a highly loadedlink. Next, we will test the profiling system during sudden traf-fic surges such as those caused by denial of service attacks, flashcrowds, and worm outbreaks that increase the link utilization aswell as the number of flow records.
4.2 Stress Test
The performance benchmarking of CPU and memory costsdemonstrates the operational feasibility of our traffic profil-ing system during normal traffic patterns. However, the pro-filing system should be robust during atypical traffic patterns,such as denial of service attacks, flash crowds, and worm out-breaks (Jung, 2002; Kandula et al., 2005; Moore et al., 2003;Zou et al., 2003). In order to understand the system perfor-mance during these incidents, we inject packet traces of threeknown denial of service attacks and simulated worm outbreaksby superposing them with backbone traffic.
We use the packet traces of three DoS attacks with varyingintensity and behavior studied in Hussain et al. (2003). All ofthese attacks are targeted on a single destination IP address. Thefirst case is a multiple-source DoS attack, in which hundreds ofsource IP addresses send 4200 ICMP echo request packets persecond for about 5 minutes. The second case is a TCP SYNattack lasting 12 minutes from random IP addresses that send1100 TCP SYN packets per second. In the last attack, a singlesource sends over 24K ip-proto 255 packets per second for 15minutes. In addition to DoS attacks, we simulate the SQL slam-mer worm on January 25th 2003 (Moore et al., 2003) with anInternet Worm Propagation Simulator used in Zou et al. (2003).In the simulation experiments, we adopt the same set of pa-rameters in Zou et al. (2003) to obtain similar worm simulationresults, and collect worm traffic monitored in a 220 IP space.
For each of these four anomalous traffic patterns, we replaypacket traces along with backbone traffic, and aggregate syn-thetic packets traces into 5-tuple flows. For simplicity, we stilluse 5 minutes as the size of the time interval, and run the pro-filing system against the flow records collected in an interval.Table 4 shows a summary on flow traces of the first 5-minuteinterval for these four cases. The flow, packet and byte countsreflect the intensity of attacks or worm propagation, while thelink utilization indicates the impact of such anomaly behaviorson Internet links. For all of these cases, the profiling system isable to successfully generate event reports in less than 5 min-utes.
For the synthetic traffic, the link utilization ranged from 314.5Mbps to 629.2Mbps. We run the profiling system on flow tracesafter replaying synthetic packets and collect CPU and memory
0 50 100 150 200 25020
30
40
50
60
70
80
90
Index of time slots
CP
U ti
me
(sec
onds
)
(a) CPU time
0 50 100 150 200 25080
100
120
140
160
180
200
Index of time slots
Tot
al m
emor
y (M
B)
(b) Memory cost
Figure 5: CPU and memory cost of the real-time profiling system on flow records in 5-min time interval collected in L1 for 18consecutive hours
.
0 50 100 150 200 250
200
400
600
800
1000
1200
1400
1600
Index of time slots
Flo
ws(
K)
(a) Size of FTable
0 50 100 150 200 25010
2
104
106
Index of time slots
Clu
ster
sTotal clustersTotal significant clusters
(b) Number of clusters
Figure 6: Input of flow traces in 5-min time interval collected in L1 for 18 consecutive hours
600 800 1000 1200 1400 160080
100
120
140
160
180
200
Number of Flows(K)
Mem
ory
usag
e of
clu
ster
con
stru
ctio
n (M
B)
Figure 7: Correlation between memory cost in cluster constructions and size of FTable
0 50 100 150 200 2500
10
20
30
40
50
60
70
80
Index of time slots
CP
U ti
me
(sec
onds
)
Cluster constructionAdaptive thresholdingBehavior profiling
(a) Breakdown of CPU time
600 800 1000 1200 1400 16006
8
10
12
14
16
18
Flows(K)
CP
U ti
me
of c
lust
er c
onst
ruct
ion
(b) Correlation between size of FTable andCPU time in cluster construction
0 500 1000 1500 200010
20
30
40
50
60
Significant clusters
CP
U ti
me
of b
ehav
ior
prof
iling
(c) Correlation between size of CTable andCPU time in behavior profiling
Figure 8: Breakdown of CPU time and correlations
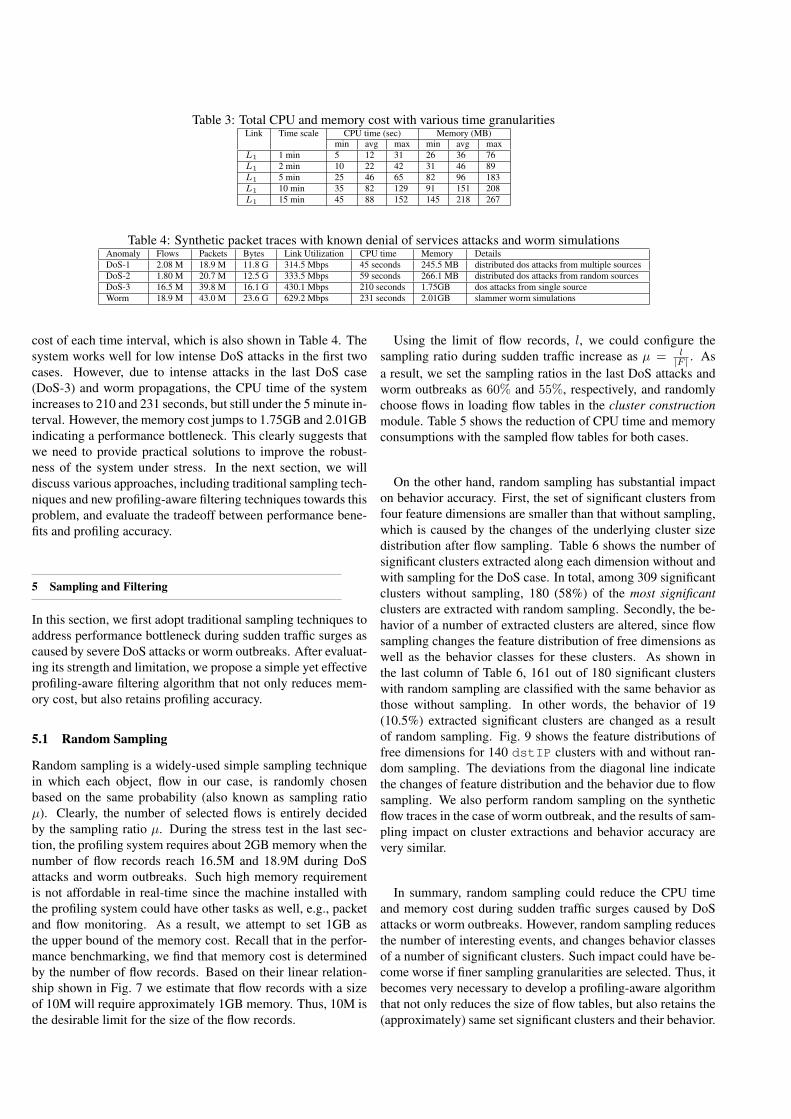
Table 3: Total CPU and memory cost with various time granularitiesLink Time scale CPU time (sec) Memory (MB)
min avg max min avg maxL1 1 min 5 12 31 26 36 76L1 2 min 10 22 42 31 46 89L1 5 min 25 46 65 82 96 183L1 10 min 35 82 129 91 151 208L1 15 min 45 88 152 145 218 267
Table 4: Synthetic packet traces with known denial of services attacks and worm simulationsAnomaly Flows Packets Bytes Link Utilization CPU time Memory DetailsDoS-1 2.08 M 18.9 M 11.8 G 314.5 Mbps 45 seconds 245.5 MB distributed dos attacks from multiple sourcesDoS-2 1.80 M 20.7 M 12.5 G 333.5 Mbps 59 seconds 266.1 MB distributed dos attacks from random sourcesDoS-3 16.5 M 39.8 M 16.1 G 430.1 Mbps 210 seconds 1.75GB dos attacks from single sourceWorm 18.9 M 43.0 M 23.6 G 629.2 Mbps 231 seconds 2.01GB slammer worm simulations
cost of each time interval, which is also shown in Table 4. Thesystem works well for low intense DoS attacks in the first twocases. However, due to intense attacks in the last DoS case(DoS-3) and worm propagations, the CPU time of the systemincreases to 210 and 231 seconds, but still under the 5 minute in-terval. However, the memory cost jumps to 1.75GB and 2.01GBindicating a performance bottleneck. This clearly suggests thatwe need to provide practical solutions to improve the robust-ness of the system under stress. In the next section, we willdiscuss various approaches, including traditional sampling tech-niques and new profiling-aware filtering techniques towards thisproblem, and evaluate the tradeoff between performance bene-fits and profiling accuracy.
5 Sampling and Filtering
In this section, we first adopt traditional sampling techniques toaddress performance bottleneck during sudden traffic surges ascaused by severe DoS attacks or worm outbreaks. After evaluat-ing its strength and limitation, we propose a simple yet effectiveprofiling-aware filtering algorithm that not only reduces mem-ory cost, but also retains profiling accuracy.
5.1 Random Sampling
Random sampling is a widely-used simple sampling techniquein which each object, flow in our case, is randomly chosenbased on the same probability (also known as sampling ratioµ). Clearly, the number of selected flows is entirely decidedby the sampling ratio µ. During the stress test in the last sec-tion, the profiling system requires about 2GB memory when thenumber of flow records reach 16.5M and 18.9M during DoSattacks and worm outbreaks. Such high memory requirementis not affordable in real-time since the machine installed withthe profiling system could have other tasks as well, e.g., packetand flow monitoring. As a result, we attempt to set 1GB asthe upper bound of the memory cost. Recall that in the perfor-mance benchmarking, we find that memory cost is determinedby the number of flow records. Based on their linear relation-ship shown in Fig. 7 we estimate that flow records with a sizeof 10M will require approximately 1GB memory. Thus, 10M isthe desirable limit for the size of the flow records.
Using the limit of flow records, l, we could configure thesampling ratio during sudden traffic increase as µ = l
|F | . Asa result, we set the sampling ratios in the last DoS attacks andworm outbreaks as 60% and 55%, respectively, and randomlychoose flows in loading flow tables in the cluster constructionmodule. Table 5 shows the reduction of CPU time and memoryconsumptions with the sampled flow tables for both cases.
On the other hand, random sampling has substantial impacton behavior accuracy. First, the set of significant clusters fromfour feature dimensions are smaller than that without sampling,which is caused by the changes of the underlying cluster sizedistribution after flow sampling. Table 6 shows the number ofsignificant clusters extracted along each dimension without andwith sampling for the DoS case. In total, among 309 significantclusters without sampling, 180 (58%) of the most significantclusters are extracted with random sampling. Secondly, the be-havior of a number of extracted clusters are altered, since flowsampling changes the feature distribution of free dimensions aswell as the behavior classes for these clusters. As shown inthe last column of Table 6, 161 out of 180 significant clusterswith random sampling are classified with the same behavior asthose without sampling. In other words, the behavior of 19(10.5%) extracted significant clusters are changed as a resultof random sampling. Fig. 9 shows the feature distributions offree dimensions for 140 dstIP clusters with and without ran-dom sampling. The deviations from the diagonal line indicatethe changes of feature distribution and the behavior due to flowsampling. We also perform random sampling on the syntheticflow traces in the case of worm outbreak, and the results of sam-pling impact on cluster extractions and behavior accuracy arevery similar.
In summary, random sampling could reduce the CPU timeand memory cost during sudden traffic surges caused by DoSattacks or worm outbreaks. However, random sampling reducesthe number of interesting events, and changes behavior classesof a number of significant clusters. Such impact could have be-come worse if finer sampling granularities are selected. Thus, itbecomes very necessary to develop a profiling-aware algorithmthat not only reduces the size of flow tables, but also retains the(approximately) same set significant clusters and their behavior.
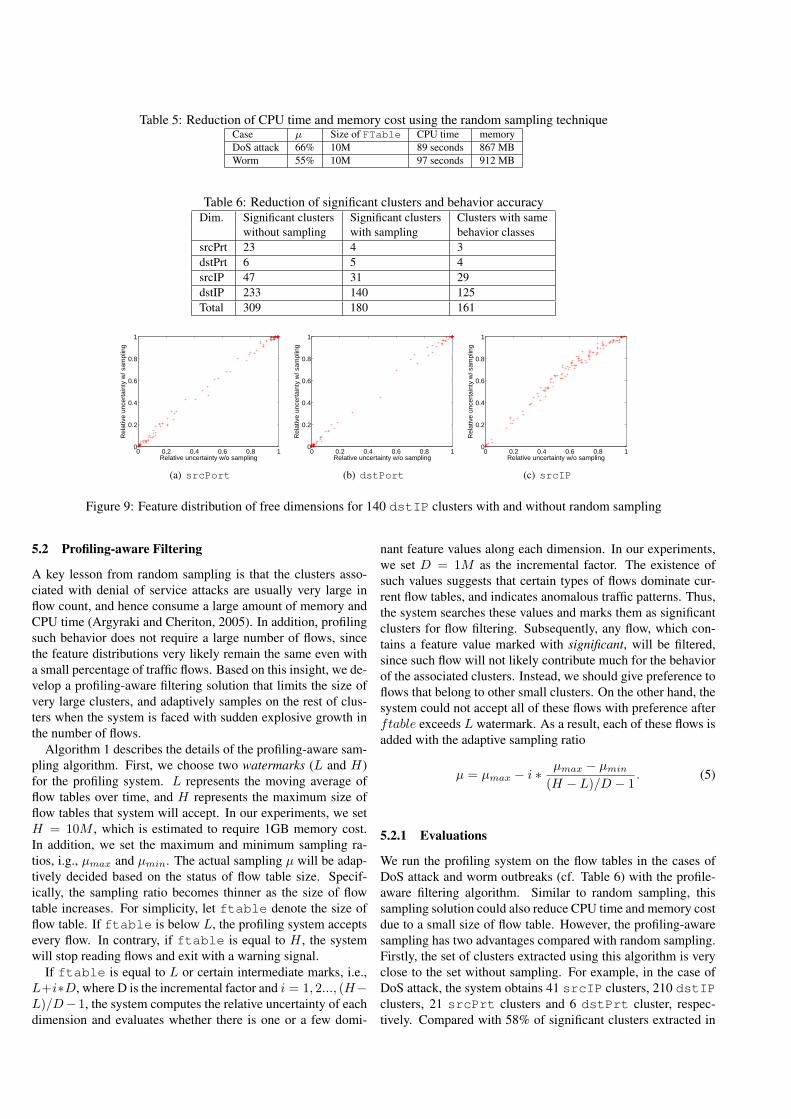
Table 5: Reduction of CPU time and memory cost using the random sampling techniqueCase µ Size of FTable CPU time memoryDoS attack 66% 10M 89 seconds 867 MBWorm 55% 10M 97 seconds 912 MB
Table 6: Reduction of significant clusters and behavior accuracyDim. Significant clusters Significant clusters Clusters with same
without sampling with sampling behavior classessrcPrt 23 4 3dstPrt 6 5 4srcIP 47 31 29dstIP 233 140 125Total 309 180 161
0 0.2 0.4 0.6 0.8 10
0.2
0.4
0.6
0.8
1
Relative uncertainty w/o sampling
Rel
ativ
e un
cert
aint
y w
/ sam
plin
g
(a) srcPort
0 0.2 0.4 0.6 0.8 10
0.2
0.4
0.6
0.8
1
Relative uncertainty w/o sampling
Rel
ativ
e un
cert
aint
y w
/ sam
plin
g
(b) dstPort
0 0.2 0.4 0.6 0.8 10
0.2
0.4
0.6
0.8
1
Relative uncertainty w/o sampling
Rel
ativ
e un
cert
aint
y w
/ sam
plin
g(c) srcIP
Figure 9: Feature distribution of free dimensions for 140 dstIP clusters with and without random sampling
5.2 Profiling-aware Filtering
A key lesson from random sampling is that the clusters asso-ciated with denial of service attacks are usually very large inflow count, and hence consume a large amount of memory andCPU time (Argyraki and Cheriton, 2005). In addition, profilingsuch behavior does not require a large number of flows, sincethe feature distributions very likely remain the same even witha small percentage of traffic flows. Based on this insight, we de-velop a profiling-aware filtering solution that limits the size ofvery large clusters, and adaptively samples on the rest of clus-ters when the system is faced with sudden explosive growth inthe number of flows.
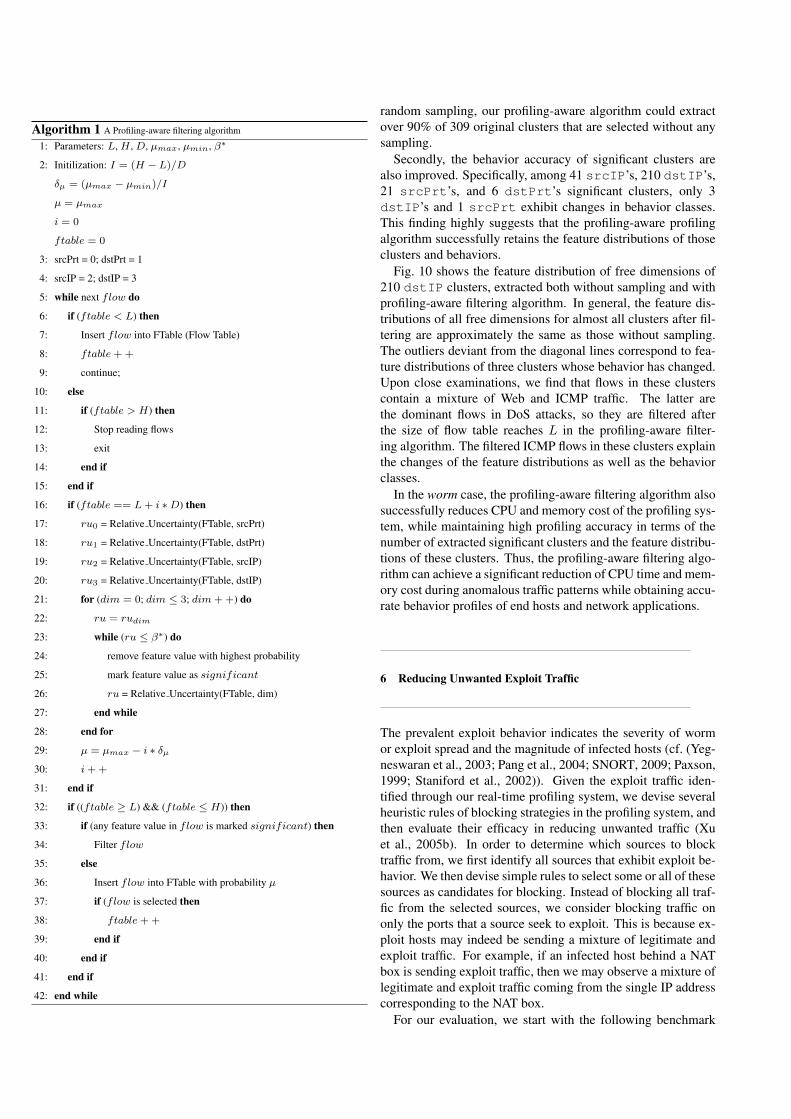
Algorithm 1 describes the details of the profiling-aware sam-pling algorithm. First, we choose two watermarks (L and H)for the profiling system. L represents the moving average offlow tables over time, and H represents the maximum size offlow tables that system will accept. In our experiments, we setH = 10M , which is estimated to require 1GB memory cost.In addition, we set the maximum and minimum sampling ra-tios, i.g., µmax and µmin. The actual sampling µ will be adap-tively decided based on the status of flow table size. Specif-ically, the sampling ratio becomes thinner as the size of flowtable increases. For simplicity, let ftable denote the size offlow table. If ftable is below L, the profiling system acceptsevery flow. In contrary, if ftable is equal to H , the systemwill stop reading flows and exit with a warning signal.
If ftable is equal to L or certain intermediate marks, i.e.,L+i∗D, where D is the incremental factor and i = 1, 2..., (H−L)/D− 1, the system computes the relative uncertainty of eachdimension and evaluates whether there is one or a few domi-
nant feature values along each dimension. In our experiments,we set D = 1M as the incremental factor. The existence ofsuch values suggests that certain types of flows dominate cur-rent flow tables, and indicates anomalous traffic patterns. Thus,the system searches these values and marks them as significantclusters for flow filtering. Subsequently, any flow, which con-tains a feature value marked with significant, will be filtered,since such flow will not likely contribute much for the behaviorof the associated clusters. Instead, we should give preference toflows that belong to other small clusters. On the other hand, thesystem could not accept all of these flows with preference afterftable exceeds L watermark. As a result, each of these flows isadded with the adaptive sampling ratio
µ = µmax − i ∗ µmax − µmin
(H − L)/D − 1. (5)
5.2.1 Evaluations
We run the profiling system on the flow tables in the cases ofDoS attack and worm outbreaks (cf. Table 6) with the profile-aware filtering algorithm. Similar to random sampling, thissampling solution could also reduce CPU time and memory costdue to a small size of flow table. However, the profiling-awaresampling has two advantages compared with random sampling.Firstly, the set of clusters extracted using this algorithm is veryclose to the set without sampling. For example, in the case ofDoS attack, the system obtains 41 srcIP clusters, 210 dstIPclusters, 21 srcPrt clusters and 6 dstPrt cluster, respec-tively. Compared with 58% of significant clusters extracted in
Algorithm 1 A Profiling-aware filtering algorithm
1: Parameters: L, H , D, µmax, µmin, β∗
2: Initilization: I = (H − L)/D
δµ = (µmax − µmin)/I
µ = µmax
i = 0
ftable = 0
3: srcPrt = 0; dstPrt = 1
4: srcIP = 2; dstIP = 3
5: while next flow do
6: if (ftable < L) then
7: Insert flow into FTable (Flow Table)
8: ftable + +
9: continue;
10: else
11: if (ftable > H) then
12: Stop reading flows
13: exit
14: end if
15: end if
16: if (ftable == L + i ∗D) then
17: ru0 = Relative Uncertainty(FTable, srcPrt)
18: ru1 = Relative Uncertainty(FTable, dstPrt)
19: ru2 = Relative Uncertainty(FTable, srcIP)
20: ru3 = Relative Uncertainty(FTable, dstIP)
21: for (dim = 0; dim ≤ 3; dim + +) do
22: ru = rudim
23: while (ru ≤ β∗) do
24: remove feature value with highest probability
25: mark feature value as significant
26: ru = Relative Uncertainty(FTable, dim)
27: end while
28: end for
29: µ = µmax − i ∗ δµ
30: i + +
31: end if
32: if ((ftable ≥ L) && (ftable ≤ H)) then
33: if (any feature value in flow is marked significant) then
34: Filter flow
35: else
36: Insert flow into FTable with probability µ
37: if (flow is selected then
38: ftable + +
39: end if
40: end if
41: end if
42: end while
random sampling, our profiling-aware algorithm could extractover 90% of 309 original clusters that are selected without anysampling.
Secondly, the behavior accuracy of significant clusters arealso improved. Specifically, among 41 srcIP’s, 210 dstIP’s,21 srcPrt’s, and 6 dstPrt’s significant clusters, only 3dstIP’s and 1 srcPrt exhibit changes in behavior classes.This finding highly suggests that the profiling-aware profilingalgorithm successfully retains the feature distributions of thoseclusters and behaviors.
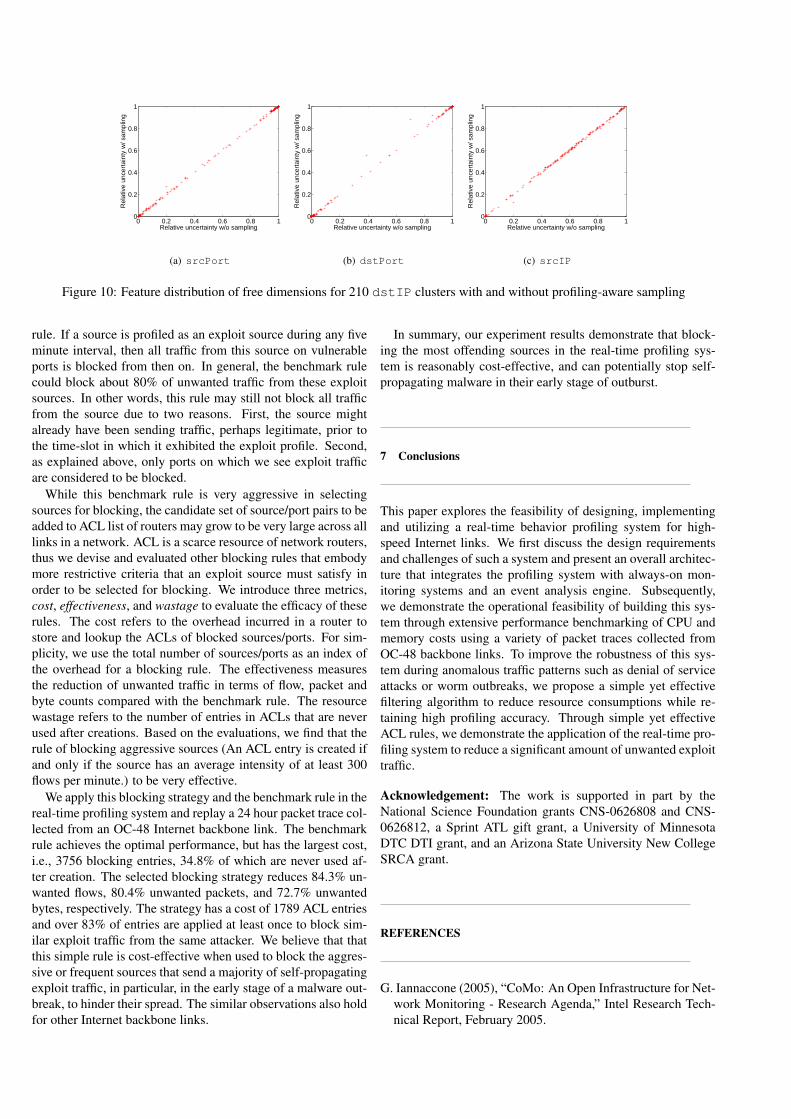
Fig. 10 shows the feature distribution of free dimensions of210 dstIP clusters, extracted both without sampling and withprofiling-aware filtering algorithm. In general, the feature dis-tributions of all free dimensions for almost all clusters after fil-tering are approximately the same as those without sampling.The outliers deviant from the diagonal lines correspond to fea-ture distributions of three clusters whose behavior has changed.Upon close examinations, we find that flows in these clusterscontain a mixture of Web and ICMP traffic. The latter arethe dominant flows in DoS attacks, so they are filtered afterthe size of flow table reaches L in the profiling-aware filter-ing algorithm. The filtered ICMP flows in these clusters explainthe changes of the feature distributions as well as the behaviorclasses.
In the worm case, the profiling-aware filtering algorithm alsosuccessfully reduces CPU and memory cost of the profiling sys-tem, while maintaining high profiling accuracy in terms of thenumber of extracted significant clusters and the feature distribu-tions of these clusters. Thus, the profiling-aware filtering algo-rithm can achieve a significant reduction of CPU time and mem-ory cost during anomalous traffic patterns while obtaining accu-rate behavior profiles of end hosts and network applications.
6 Reducing Unwanted Exploit Traffic
The prevalent exploit behavior indicates the severity of wormor exploit spread and the magnitude of infected hosts (cf. (Yeg-neswaran et al., 2003; Pang et al., 2004; SNORT, 2009; Paxson,1999; Staniford et al., 2002)). Given the exploit traffic iden-tified through our real-time profiling system, we devise severalheuristic rules of blocking strategies in the profiling system, andthen evaluate their efficacy in reducing unwanted traffic (Xuet al., 2005b). In order to determine which sources to blocktraffic from, we first identify all sources that exhibit exploit be-havior. We then devise simple rules to select some or all of thesesources as candidates for blocking. Instead of blocking all traf-fic from the selected sources, we consider blocking traffic ononly the ports that a source seek to exploit. This is because ex-ploit hosts may indeed be sending a mixture of legitimate andexploit traffic. For example, if an infected host behind a NATbox is sending exploit traffic, then we may observe a mixture oflegitimate and exploit traffic coming from the single IP addresscorresponding to the NAT box.
For our evaluation, we start with the following benchmark
0 0.2 0.4 0.6 0.8 10
0.2
0.4
0.6
0.8
1
Relative uncertainty w/o sampling
Rel
ativ
e un
cert
aint
y w
/ sam
plin
g
(a) srcPort
0 0.2 0.4 0.6 0.8 10
0.2
0.4
0.6
0.8
1
Relative uncertainty w/o sampling
Rel
ativ
e un
cert
aint
y w
/ sam
plin
g
(b) dstPort
0 0.2 0.4 0.6 0.8 10
0.2
0.4
0.6
0.8
1
Relative uncertainty w/o sampling
Rel
ativ
e un
cert
aint
y w
/ sam
plin
g
(c) srcIP
Figure 10: Feature distribution of free dimensions for 210 dstIP clusters with and without profiling-aware sampling
rule. If a source is profiled as an exploit source during any fiveminute interval, then all traffic from this source on vulnerableports is blocked from then on. In general, the benchmark rulecould block about 80% of unwanted traffic from these exploitsources. In other words, this rule may still not block all trafficfrom the source due to two reasons. First, the source mightalready have been sending traffic, perhaps legitimate, prior tothe time-slot in which it exhibited the exploit profile. Second,as explained above, only ports on which we see exploit trafficare considered to be blocked.
While this benchmark rule is very aggressive in selectingsources for blocking, the candidate set of source/port pairs to beadded to ACL list of routers may grow to be very large across alllinks in a network. ACL is a scarce resource of network routers,thus we devise and evaluated other blocking rules that embodymore restrictive criteria that an exploit source must satisfy inorder to be selected for blocking. We introduce three metrics,cost, effectiveness, and wastage to evaluate the efficacy of theserules. The cost refers to the overhead incurred in a router tostore and lookup the ACLs of blocked sources/ports. For sim-plicity, we use the total number of sources/ports as an index ofthe overhead for a blocking rule. The effectiveness measuresthe reduction of unwanted traffic in terms of flow, packet andbyte counts compared with the benchmark rule. The resourcewastage refers to the number of entries in ACLs that are neverused after creations. Based on the evaluations, we find that therule of blocking aggressive sources (An ACL entry is created ifand only if the source has an average intensity of at least 300flows per minute.) to be very effective.
We apply this blocking strategy and the benchmark rule in thereal-time profiling system and replay a 24 hour packet trace col-lected from an OC-48 Internet backbone link. The benchmarkrule achieves the optimal performance, but has the largest cost,i.e., 3756 blocking entries, 34.8% of which are never used af-ter creation. The selected blocking strategy reduces 84.3% un-wanted flows, 80.4% unwanted packets, and 72.7% unwantedbytes, respectively. The strategy has a cost of 1789 ACL entriesand over 83% of entries are applied at least once to block sim-ilar exploit traffic from the same attacker. We believe that thatthis simple rule is cost-effective when used to block the aggres-sive or frequent sources that send a majority of self-propagatingexploit traffic, in particular, in the early stage of a malware out-break, to hinder their spread. The similar observations also holdfor other Internet backbone links.
In summary, our experiment results demonstrate that block-ing the most offending sources in the real-time profiling sys-tem is reasonably cost-effective, and can potentially stop self-propagating malware in their early stage of outburst.
7 Conclusions
This paper explores the feasibility of designing, implementingand utilizing a real-time behavior profiling system for high-speed Internet links. We first discuss the design requirementsand challenges of such a system and present an overall architec-ture that integrates the profiling system with always-on mon-itoring systems and an event analysis engine. Subsequently,we demonstrate the operational feasibility of building this sys-tem through extensive performance benchmarking of CPU andmemory costs using a variety of packet traces collected fromOC-48 backbone links. To improve the robustness of this sys-tem during anomalous traffic patterns such as denial of serviceattacks or worm outbreaks, we propose a simple yet effectivefiltering algorithm to reduce resource consumptions while re-taining high profiling accuracy. Through simple yet effectiveACL rules, we demonstrate the application of the real-time pro-filing system to reduce a significant amount of unwanted exploittraffic.
Acknowledgement: The work is supported in part by theNational Science Foundation grants CNS-0626808 and CNS-0626812, a Sprint ATL gift grant, a University of MinnesotaDTC DTI grant, and an Arizona State University New CollegeSRCA grant.
REFERENCES
G. Iannaccone (2005), “CoMo: An Open Infrastructure for Net-work Monitoring - Research Agenda,” Intel Research Tech-nical Report, February 2005.

G. Iannaccone, C. Diot, I. Graham, and N. McKeown (2001),“Monitoring Very High Speed Links,” in Proceedings ofACM SIGCOMM Internet Measurement Workshop, Novem-ber 2001.
K. Keys, D. Moore, and C. Estan (2005), “A Robust Systemfor Accurate Real-Time Summaries of Internet Traffic,” inProceedings of ACM SIGMETRICS, June 2005.
K. Xu, Z.-L. Zhang, and S. Bhattacharyya (2005), “Profiling In-ternet Backbone Traffic: Behavior Models and Applications,”in Proceedings of ACM SIGCOMM, August 2005.
K. Xu, Z.-L. Zhang, and S. Bhattacharyya (2005), “ReducingUnwanted Traffic in a Backbone Network,” in Proceedings ofSteps to Reducing Unwanted Traffic on the Internet Workshop(SRUTI), July 2005.
K. Xu, F. Wang, S. Bhattacharyya and Z.-L. Zhang (2007), “AReal-time Network Traffic Profiling System,” in Proceedingsof International Conference on Dependable Systems and Net-works, June 2007.
A. Hussain, J. Heidemann, and C. Papadopoulos (2003), “AFramework for Classifying Denial of Service Attacks,” inProceedings of ACM SIGCOMM, August 2003.
T. Karagiannis, K. Papagiannaki, and M. Faloutsos (2005),“BLINC: Multilevel Traffic Classification in the Dark,” inProceedings of ACM SIGCOMM, August 2005.
K. Krippendorff (1986), Information Theory: Structural Mod-els for Qualitative Data. Sage Publications, 1986.
R. Cavallo and G. Klir (1979), “Reconstructability Analysisof Multi-dimensional Relations: A Theoretical Basis forComputer-aided Determination of Acceptable Systems Mod-els,” International Journal of General Systems, vol. 5, pp.143–171, 1979.
M. Zwick (2004), “An Overview of Reconstructability Analy-sis,” International Journal of Systems & Cybernetics, 2004.
M. Jordan (2004), “Graphical models,” Statistical Science, Spe-cial Issue on Bayesian Statistics, vol. 19, pp. 140–155, 2004.
A. Lakhina, M. Crovella, and C. Diot (2005), “Mining Anoma-lies Using Traffic Feature Distributions,” in Proceedings ofACM SIGCOMM, August 2005.
H. Kim and B. Karp (2004), “Autograph: Toward Automated,Distributed Worm Signature Detection,” in Proceedings ofUsenix Security Symposium, August 2004.
S. Singh, C. Estan, G. Varghese, and S. Savage (2004), “Auto-mated Worm Fingerprinting,” in Proceedings of Symposiumon Operating Systems Design and Implementation, Decem-ber 2004.
J. Jung, B. Krishnamurthy, and M. Rabinovich (2002), “FlashCrowds and Denial of Service Attacks: Characterization andImplications for CDNs and Web Sites,” in Proceedings of In-ternational World Wide Web Conference, 2002.
S. Kandula, D. Katabi, M. Jacob, and A. Berger (2005), “Botz-4-Sale: Surviving Organized DDoS Attacks That MimicFlash Crowds,” in Proceedings of Symposium on NSDI, May2005.
D. Moore, V. Paxson, S. Savage, C. Shannon, S. Staniford, andN. Weaver (2003), “Inside the Slammer Worm,” IEEE Secu-rity and Privacy, July 2003.
C. Zou, L. Gao, W. Gong, and D. Towsley (2003), “Monitoringand Early Warning for Internet Worms,” in Proceedings ofACM CCS, October 2003.
K. Argyraki and D. Cheriton (2005), “Active Internet Traf-fic Filtering: Real-Time Response to Denial-of-Service At-tacks,” in Proceedings of USENIX Annual Technical Confer-ence, April 2005.
V. Yegneswaran, P. Barford, and J. Ullrich (2003), “Internet In-trusions: Global Characteristics and Prevalence,” in Proceed-ings of ACM SIGMETRICS, June 2003.
R. Pang, V. Yegneswaran, P. Barford, V. Paxson, and L. Peter-son (2004), “Characteristics of Internet Background Radia-tion,” in Proceedings of ACM SIGCOMM Internet Measure-ment Conference, Octomber 2004.
“SNORT,” http://www.snort.org/.
V. Paxson (1999), “Bro: A System for Detecting NetworkIntruders in Real-Time,” Computer Networks, vol. 31, pp.2435–2463, December 1999.
S. Staniford, J. Hoagland, and J. McAlerney (2002), “Practi-cal Automated Detection of Stealthy Portscans,” Journal ofComputer Security, vol. 10, pp. 105–136, 2002.