Embed Size (px)
Citation preview
Real-time analysis and selection of methylatedDNA by fluorescence-activated single moleculesorting in a nanofluidic channelBenjamin R. Ciprianya, Patrick J. Murphyb, James A. Hagarmanc, Aline Cerfd, David Latulipped, Stephen L. Levye,Jaime J. Benítezd, Christine P. Tanf, Juraj Topolancikd, Paul D. Solowayb,c,1, and Harold G. Craigheadd,1
aDepartment of Electrical and Computer Engineering, Cornell University, Ithaca, NY 14853; bField of Genetics and Development, Cornell University, Ithaca,NY 14853; cDivision of Nutritional Science, Cornell University, Ithaca, NY 14853; dSchool of Applied and Engineering Physics, Cornell University, Ithaca,NY 14853; ePhysics Department, Binghamton University, Binghamton, NY 13902; and fDepartment of Biomedical Engineering, Cornell University,Ithaca, NY 14853
Edited by Steven Henikoff, Fred Hutchinson Cancer Research Center, Seattle, WA, and approved April 3, 2012 (received for review October 25, 2011)
Epigenetic modifications, such as DNA and histone methylation,are responsible for regulatory pathways that affect disease. Cur-rent epigenetic analyses use bisulfite conversion to identify DNAmethylation and chromatin immunoprecipitation to collect mole-cules bearing a specific histone modification. In this work, we pre-sent a proof-of-principle demonstration for a new method using ananofluidic device that combines real-time detection and auto-mated sorting of individual molecules based on their epigeneticstate. This device evaluates the fluorescence from labeled epige-netic modifications to actuate sorting. This technology has demon-strated up to 98% accuracy in molecule sorting and has achievedpostsorting sample recovery on femtogram quantities of geneticmaterial. We have applied it to sort methylated DNA moleculesusing simultaneous, multicolor fluorescence to identify methylbinding domain protein-1 (MBD1) bound to full-duplex DNA. Thefunctionality enabled by this nanofluidic platform now providesa workflow for color-multiplexed detection, sorting, and recoveryof single molecules toward subsequent DNA sequencing.
In chromatin, chemical modifications to histone proteins andDNA alter the status of the epigenome and influence gene
regulation and normal development. Their aberrant placementhas been linked to the onset of cancer (1, 2) and other diseases.Bisulfite conversion and immunoprecipitation (IP) have beenused extensively to examine these modifications on locus-specificand genome-wide scales. These approaches have limitations interms of material handling or multiplexed detection. Conven-tional chromatin immunoprecipitation (ChIP) requires an abun-dance of input material, often 103
–106 cells for genome-widestudies, to compensate for >99% material loss during processing(3, 4). This problem compounds for sequential re-ChIP reactions,limiting the study of multivalent modifications (4), which couldprovide a clear view of epigenetic coordination. Whereas DNAmethylation analysis using bisulfite conversion can operate onpicogram quantities of DNA (5–7), the conversion causes degra-dation of >90% of the input DNA. Methods that combine ChIPand bisulfite sequencing in a sequential process (8) have demon-strated progress in multiplexed epigenetic analysis. There con-tinues to be active research in reducing the input materialrequirements and in automation of the processes (9–11) for epi-genetic analysis. Furthermore, there is interest in additional cap-ability for simultaneous detection of multiple epigenetic modifi-cations in the same material.
Miniaturized fluidic devices offer a compelling toolset for mul-tiplexed detection and efficient sample handling in analytical andpreparatory systems. Microfluidics have performed complicatedworkflows that include nanoliter sample handling (12) and incor-porate electrodes (13–16) or valves (12, 17) for sophisticated pro-cessing. Nanofluidics have achieved attoliter-scale fluid volumeconfinement to isolate and quantify the attributes of individualmolecules that can be obscured during ensemble measurements.
These devices have recently been demonstrated for single mole-cule analysis on native chromatin (18); however, adaptation ofthese devices to include fluorescence-activated sorting wouldenable color-multiplexed detection in real-time and collectionof molecules with specific epigenetic modifications. Existingfluorescence-activated techniques for cell (19, 20) and droplet(21) sorting lack the volume confinement necessary for sortingindividual, single fluorophore-labeled molecules at picomolarconcentrations and above that are favorable for protein or anti-body binding and chromatin stability (22, 23).
Here we present a bifurcated nanofluidic device for real-timedetection and automated sorting of individual methylated DNAmolecules. These molecules were selected from a mixture thatincluded unmethylated DNA and were recognized using a fluor-escently labeled methyl binding domain protein-1 (MBD1) thatbinds specifically to double-stranded, methylated DNA (24). Wediscuss the technologies that enabled us to identify methylatedDNA bound with MBD1 using its fluorescence signature. We de-monstrate accurate evaluation of this fluorescence signature toactuate sorting of these molecules from the mixture. We showrecovery of sorted material and independently verify moleculeenrichment by quantitative polymerase chain reaction (qPCR) toelucidate opportunities for postsorting analysis. We report theproof-of-principle demonstration of our single molecule sorterfor color-multiplexed epigenetic analysis and sample recoveryof limited genetic material.
Results and DiscussionConstructing a Fluorescence-Activated, Single Molecule Sorter. Wedesigned our nanofluidic sorter to operate using materials pre-pared by established methods to ensure its integration withinan epigenetic analysis workflow. For this design, we implementeda process (Fig. 1) wherein fluorescently labeled probes such asantibodies or proteins are bound to epigenetic modificationslocated on histone proteins or DNA. This mixture is then loadedinto our nanofluidic device to identify these molecules and theircorresponding modifications by fluorescence color signature.
Author contributions: B.R.C., P.J.M., J.A.H., S.L.L., C.P.T., P.D.S., and H.G.C. designedresearch; B.R.C., P.J.M., and J.A.H. performed research; B.R.C., P.J.M., J.A.H., A.C., D.L.,J.J.B., C.P.T., and J.T. contributed new reagents/analytic tools; B.R.C. analyzed data; andB.R.C., P.D.S., and H.G.C. wrote the paper.
Conflict of interest statement: The authors H.G.C., P.D.S., and S.L.L. declare a financialinterest in the company (Odyssey Molecular) attempting to commercialize the technologydescribed in this manuscript.
This article is a PNAS Direct Submission.
Freely available online through the PNAS open access option.1To whom correspondence may be addressed. E-mail: [email protected] or [email protected].
This article contains supporting information online at www.pnas.org/lookup/suppl/doi:10.1073/pnas.1117549109/-/DCSupplemental.
www.pnas.org/cgi/doi/10.1073/pnas.1117549109 PNAS Early Edition ∣ 1 of 6
ENGINEE
RING
APP
LIED
BIOLO
GICAL
SCIENCE
S

Each molecule with a color signature that matches the criteria forcollection is then sorted during a brief actuation, or pulse, thatredirects flow to the sorted output. The flow direction returnsto the default output following a sort event. Sorted molecules arethen collected for subsequent qPCR analysis.
In order to develop a sorting device, we modified the nanoflui-dic device previously described (18) in several ways. First, weadded a bifurcation to create two outflow paths for molecules andthen adapted the optics to detect input molecules flowing towardsthe bifurcation and output molecules flowing away from thebifurcation in both paths; second, we developed computationalhardware to evaluate the fluorescence signal from each inputmolecule in real-time and then actuate sorting; third, we devel-oped a circuit to rapidly direct the flow of molecules to eitheroutflow path during sorting and optimized sorting accuracy bytuning the circuit parameters. These modifications are discussedin the following paragraphs.
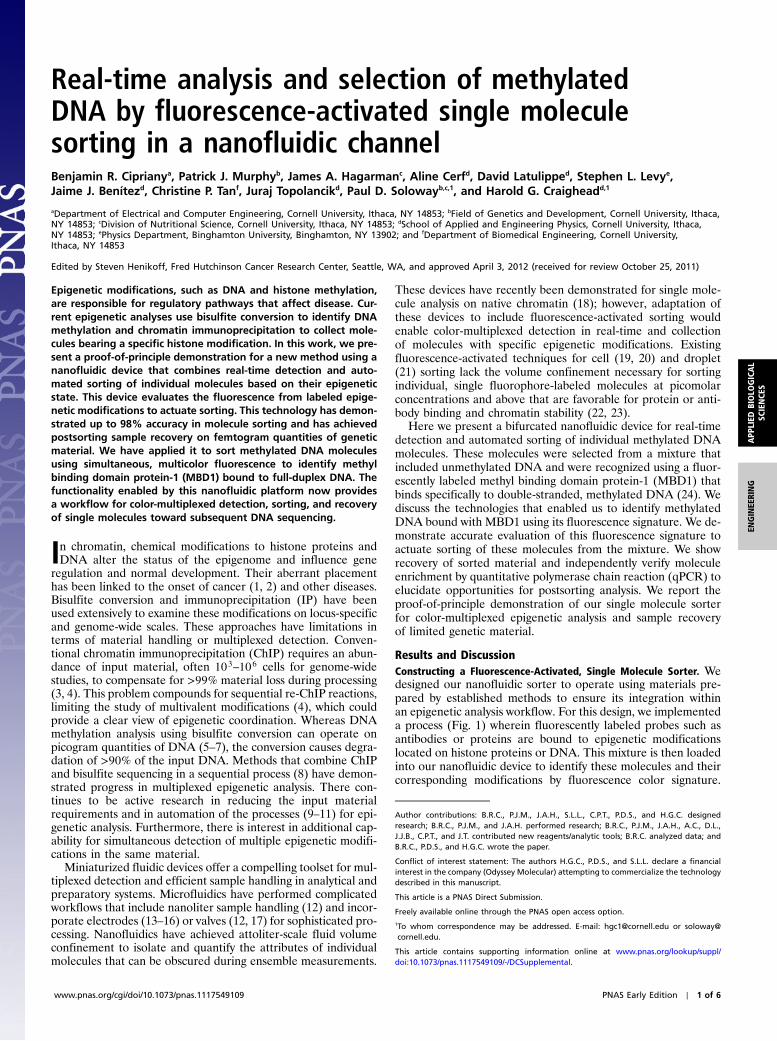
To perform in situ optimization of sorting performance, wedeveloped a method to monitor multiple nanofluidic paths simul-taneously for tracking each molecule within the device. This de-tection method uses a linear array of confocal apertures whosespacing is geometrically matched to the branches of the m-shapednanofluidic channel (Figs. 1 and 2A). As fluorescence is emittedfrom each molecule, it is imaged within the inspection volumeformed by the overlap of one confocal aperture to a region ofnanofluidic channel. The confocal apertures are formed by alinear array of optical fibers (Fig. 2B and Fig. S1), which arealigned simultaneously to all branches of the nanofluidic channel.To ensure the fluorescence from a given inspection volume doesnot affect those adjacent, we measured a low optical cross talk,−13 dB, for apertures spaced 500 μm apart (Fig. S1). We evalu-ated the parallel fluorescence detection and tracking accuracy ofthis method by monitoring the input and outputs of a bifurcatednanofluidic device during flow of a fluorescently labeled plasmid,pML4.2. To track uniquely one molecule at a time within the pathbetween input and output, detection was performed at a 50 pMsample concentration; we calculate a <2.6 × 10⁻³ probability ofmultiple molecules cooccupying this path. In this experiment,99.7% of all molecules detected at the input were tracked to theoutput. The molecules not tracked had fluctuated above or belowthe detection threshold, but were distinct from noise, suggestingslight photobleaching during transit and differences in beam illu-mination uniformity. Therefore, our design demonstrated facilealignment and simultaneous detection of single molecule fluor-escence from multiple fluidic channels to enable in situ optimiza-tion of sorting performance.
Real-time analysis is required for automated, fluorescence-activated sorting to be practical over a wide-range of moleculeflow speeds. To perform real-time analysis, we selected a fieldprogrammable gate array (FPGA) for its capabilities in digitalsignal processing (DSP) and facile integration with existing ava-lanche photodiode (APD) and time-correlated single photoncounting (TCSPC) hardware (Fig. 2B). The process of real-timedetection within the FPGA began with digital electrical signalsrepresentative of individual photons measured by the APDs.These signals were counted, low-pass filtered, and then comparedagainst a burst intensity and duration threshold to identify a sin-gle molecule (Fig. 2C). We found low-pass filtering was necessaryto smooth and reduce noise fluctuations around the intensitythreshold that otherwise caused some molecules to be multiple-counted and actuated for sorting. The low-pass filter designs weimplemented, a boxcar and a Gaussian-shaped filter, were usedduring subsequent DNA-size and methylation sorting experi-ments. Whereas DSP with these filters introduced detectiondelay, the time necessary to analyze single molecule fluorescencescaled proportionally with flow rate and often occurred in <1 ms.(Fig. 2D). To verify the accuracy of our real-time detection meth-od, we flowed fluorescently labeled pML4.2 molecules because of
Fig. 1. An epigenetic analysis workflow using fluorescence-activated, singlemolecule sorting. (Top) DNA preparation. Linearized DNA plasmids, unmethy-lated pUC19, and methylated pML4.2 were fluorescently labeled with a redstain and then mixed with green-labeled methyl binding domain protein-1(MBD1) during a bulk reaction. (Middle) Singlemolecule detection and sorting.Samples were loaded into the input of a bifurcated nanofluidic device. An ap-plied voltage flowed molecules through the device. As each fluorescently la-beled molecule passed through the input inspection volume its fluorescencesignaturewas detected and then evaluated in real time. In this panel, anMBD1bound to methylated DNA was identified by its two-color fluorescence signa-ture. This signature actuated a sorting trigger and a pair of opposing switchesto direct the molecule toward the sorted output. After a molecule was deliv-ered to the sorted output, the flowwas redirected to the default output. (Bot-tom) Further analysis. At the conclusion of a sorting experiment, material inthe sorted output was recovered by pipette and the amounts of pUC19 andpML4.2 were measured by qPCR analysis.
2 of 6 ∣ www.pnas.org/cgi/doi/10.1073/pnas.1117549109 Cipriany et al.
their high (∼200) signal to noise ratio (SNR) during detectionand then compared a time-resolved record of their fluorescenceagainst real-time, FPGA-detected events. We measured >98%agreement between real-time and postexperiment detectionmethods using the same analysis conditions. Because these detec-tion methods operated in clock-synchrony and using similar algo-rithms, we attribute differences in detection primarily to thedead-time specification of TCSPC hardware as compared to theFPGA. In summary, our FPGA-based analysis has shown highlyaccurate, real-time single molecule detection.
For sorting individual molecules into the nanofluidic outputpaths, we used electrokinetic flow because it can be actuated byrapidly switched, externally applied voltages. To exert precise flowcontrol, we began with an electric circuit model for the nanoflui-dic device that used channel geometry and buffer ion concentra-tion to describe the equivalent channel resistance and doublelayer capacitance, respectively, and then characterized the elec-trical operation of the nanofluidic device. The electrical resis-tance of the nanofluidic device filled with 1x Tris-EDTA (1x TE)buffer measured 3.5� 0.1 GΩ (Fig. S2), which indicated that re-lays with low off-state leakage current were necessary to discon-nect the device electrically during flow switching. We also foundthat external voltage balancing minimized fabrication-inducedvariations in channel geometry and further sculpted the electricfield at the bifurcation. These adjustments lead to symmetricsorter operation and a misdirection rate of approximately 10−3
molecules when operated in a fixed voltage configuration. Wethen assessed electrokinetic flow response to a voltage impulse
to mimic sorting actuation. The impulse response of the nanoflui-dic demonstrated an upper limit of 10 kHz on switching speedbased upon a transient settling time of approximately 50 μs(Fig. S3). Switching at this frequency could allow sorting at ratesup to 100;000 molecules∕min using the present device geometry.
Single Molecule Sorting for Enrichment and Recovery. A 50 pM mix-ture of DNA molecules was loaded into the nanofluidic device toevaluate molecule counting and tracking during a single-colorsorting experiment to size-separate the molecules. The mixturewas composed of linearized pUC19 (2.7 kbp) and pML4.2(15.2 kbp) DNA plasmids intercalated with TOTO-3. Theapproximate fivefold difference in molecule size was observedproportionally in fluorescence intensity (25) and allowed mole-cule identification for sorting. A threshold value of 50 photons∕50 μs distinguished the DNA molecule sizes (Fig. S4) and wasprogrammed into the FPGA to identify and actuate sorting ofthe pML4.2 molecules. A time-resolved record of this moleculesorting experiment (Fig. 3A) illustrated the bursts of fluorescencefrom pML4.2 matched to the sorting actuation trigger. This re-cord confirmed successful sorting by in situ tracking of eachabove-threshold molecule from input to sorted output. A transittime of 4.3� 0.3 ms through the bifurcated region was calculatedby fitting a time-correlated measurement of the delay betweenmolecule observations (Fig. S4). These measurements success-fully demonstrated real-time detection and in situ tracking of in-dividual DNA molecules during fluorescence-activated sortingat >500 molecules∕min.
Fig. 2. Constructing a fluorescence-activated, single molecule sorter. (A) A brightfield photomicrograph of a bifurcated nanofluidic channel with cross-section500 nm wide by 250 nm deep was designed to isolate individual molecules for sorting. Eighteen of these devices were formed on a 100-mm diameter fusedsilica wafer. The scale bar is 10 μm. (B) The nanofluidic device was mounted onto a confocal fluorescence microscope and illuminated by two overlapped lasersto excite molecule fluorescence simultaneously. Single molecule fluorescence was imaged using an optical fiber array connected to single photon countingavalanche photodiodes (APDs). A field programmable gate array (FPGA) performed real-time fluorescence analysis at the input inspection volume and trig-gered a high voltage (HV) sorting circuit to direct the electrokinetic flow of amolecule to the sorted or default output. All detection events were recorded usingtime-correlated single photon counting (TCSPC) hardware operated in synchrony with the FPGA. (C) An FPGA-based electrical circuit was used to evaluatephoton count signals, X1ðtÞ and X2ðtÞ, each reporting a different fluorescence color. Detection noise was reduced using a digital low-pass filter to improvemolecule identification and switching accuracy. Photon detection events arriving within a short interval, a photon burst, were compared against an intensitythreshold to identify signal from noise. Above-threshold bursts that also satisfied a minimum time duration were identified as single molecules that actuatedthe trigger signal Y1ðtÞ or Y2ðtÞ. Molecules bound with multiple fluorescence colors caused time-correlation of Y1ðtÞ and Y2ðtÞ evaluated by a logical AND gatethat output Y12ðtÞ. (D) An oscilloscope photomicrograph illustrates FPGA operation using a 5-pulse train and a 25-pulse train, shown as X(t), to simulate aphoton burst. Only the simulated burst in the bottom panel exceeded the 5-pulse∕50 μs threshold for more than 100 μs and, thereby, actuated the trigger for aprogrammed, 2 ms duration.
Cipriany et al. PNAS Early Edition ∣ 3 of 6
ENGINEE
RING
APP
LIED
BIOLO
GICAL
SCIENCE
S
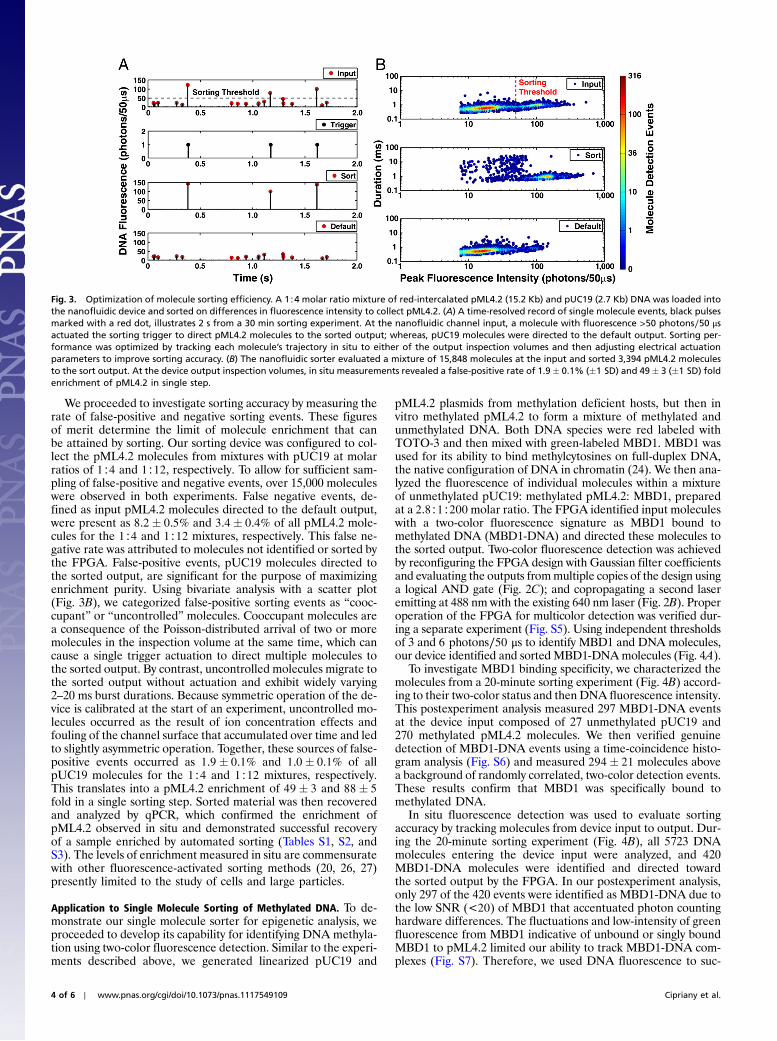
We proceeded to investigate sorting accuracy by measuring therate of false-positive and negative sorting events. These figuresof merit determine the limit of molecule enrichment that canbe attained by sorting. Our sorting device was configured to col-lect the pML4.2 molecules from mixtures with pUC19 at molarratios of 1∶4 and 1∶12, respectively. To allow for sufficient sam-pling of false-positive and negative events, over 15,000 moleculeswere observed in both experiments. False negative events, de-fined as input pML4.2 molecules directed to the default output,were present as 8.2� 0.5% and 3.4� 0.4% of all pML4.2 mole-cules for the 1∶4 and 1∶12 mixtures, respectively. This false ne-gative rate was attributed to molecules not identified or sorted bythe FPGA. False-positive events, pUC19 molecules directed tothe sorted output, are significant for the purpose of maximizingenrichment purity. Using bivariate analysis with a scatter plot(Fig. 3B), we categorized false-positive sorting events as “cooc-cupant” or “uncontrolled” molecules. Cooccupant molecules area consequence of the Poisson-distributed arrival of two or moremolecules in the inspection volume at the same time, which cancause a single trigger actuation to direct multiple molecules tothe sorted output. By contrast, uncontrolled molecules migrate tothe sorted output without actuation and exhibit widely varying2–20 ms burst durations. Because symmetric operation of the de-vice is calibrated at the start of an experiment, uncontrolled mo-lecules occurred as the result of ion concentration effects andfouling of the channel surface that accumulated over time and ledto slightly asymmetric operation. Together, these sources of false-positive events occurred as 1.9� 0.1% and 1.0� 0.1% of allpUC19 molecules for the 1∶4 and 1∶12 mixtures, respectively.This translates into a pML4.2 enrichment of 49� 3 and 88� 5fold in a single sorting step. Sorted material was then recoveredand analyzed by qPCR, which confirmed the enrichment ofpML4.2 observed in situ and demonstrated successful recoveryof a sample enriched by automated sorting (Tables S1, S2, andS3). The levels of enrichment measured in situ are commensuratewith other fluorescence-activated sorting methods (20, 26, 27)presently limited to the study of cells and large particles.
Application to Single Molecule Sorting of Methylated DNA. To de-monstrate our single molecule sorter for epigenetic analysis, weproceeded to develop its capability for identifying DNA methyla-tion using two-color fluorescence detection. Similar to the experi-ments described above, we generated linearized pUC19 and
pML4.2 plasmids from methylation deficient hosts, but then invitro methylated pML4.2 to form a mixture of methylated andunmethylated DNA. Both DNA species were red labeled withTOTO-3 and then mixed with green-labeled MBD1. MBD1 wasused for its ability to bind methylcytosines on full-duplex DNA,the native configuration of DNA in chromatin (24). We then ana-lyzed the fluorescence of individual molecules within a mixtureof unmethylated pUC19: methylated pML4.2: MBD1, preparedat a 2.8∶1∶200molar ratio. The FPGA identified input moleculeswith a two-color fluorescence signature as MBD1 bound tomethylated DNA (MBD1-DNA) and directed these molecules tothe sorted output. Two-color fluorescence detection was achievedby reconfiguring the FPGA design with Gaussian filter coefficientsand evaluating the outputs frommultiple copies of the design usinga logical AND gate (Fig. 2C); and copropagating a second laseremitting at 488 nm with the existing 640 nm laser (Fig. 2B). Properoperation of the FPGA for multicolor detection was verified dur-ing a separate experiment (Fig. S5). Using independent thresholdsof 3 and 6 photons∕50 μs to identify MBD1 and DNA molecules,our device identified and sorted MBD1-DNAmolecules (Fig. 4A).
To investigate MBD1 binding specificity, we characterized themolecules from a 20-minute sorting experiment (Fig. 4B) accord-ing to their two-color status and then DNA fluorescence intensity.This postexperiment analysis measured 297 MBD1-DNA eventsat the device input composed of 27 unmethylated pUC19 and270 methylated pML4.2 molecules. We then verified genuinedetection of MBD1-DNA events using a time-coincidence histo-gram analysis (Fig. S6) and measured 294� 21 molecules abovea background of randomly correlated, two-color detection events.These results confirm that MBD1 was specifically bound tomethylated DNA.
In situ fluorescence detection was used to evaluate sortingaccuracy by tracking molecules from device input to output. Dur-ing the 20-minute sorting experiment (Fig. 4B), all 5723 DNAmolecules entering the device input were analyzed, and 420MBD1-DNA molecules were identified and directed towardthe sorted output by the FPGA. In our postexperiment analysis,only 297 of the 420 events were identified as MBD1-DNA due tothe low SNR (<20) of MBD1 that accentuated photon countinghardware differences. The fluctuations and low-intensity of greenfluorescence from MBD1 indicative of unbound or singly boundMBD1 to pML4.2 limited our ability to track MBD1-DNA com-plexes (Fig. S7). Therefore, we used DNA fluorescence to suc-
Fig. 3. Optimization of molecule sorting efficiency. A 1∶4 molar ratio mixture of red-intercalated pML4.2 (15.2 Kb) and pUC19 (2.7 Kb) DNA was loaded intothe nanofluidic device and sorted on differences in fluorescence intensity to collect pML4.2. (A) A time-resolved record of single molecule events, black pulsesmarked with a red dot, illustrates 2 s from a 30 min sorting experiment. At the nanofluidic channel input, a molecule with fluorescence >50 photons∕50 μsactuated the sorting trigger to direct pML4.2 molecules to the sorted output; whereas, pUC19 molecules were directed to the default output. Sorting per-formance was optimized by tracking each molecule’s trajectory in situ to either of the output inspection volumes and then adjusting electrical actuationparameters to improve sorting accuracy. (B) The nanofluidic sorter evaluated a mixture of 15,848 molecules at the input and sorted 3,394 pML4.2 moleculesto the sort output. At the device output inspection volumes, in situ measurements revealed a false-positive rate of 1.9� 0.1% (�1 SD) and 49� 3 (�1 SD) foldenrichment of pML4.2 in single step.
4 of 6 ∣ www.pnas.org/cgi/doi/10.1073/pnas.1117549109 Cipriany et al.

cessfully track over 90% of all DNA molecules from input to out-put. From DNA tracking measurements, we evaluated the falsenegative and false-positive sorting rates (81� 3% and5.6� 0.4%, respectively) for this experiment. The high false ne-gative sorting rate was the result of the low concentration ofMBD1 and pML4.2 in the analyte and the highKD value for theirbinding, which resulted in a low concentration of the complex atequilibrium. Based upon experimental observations of MBD1-DNA binding at the device input, we calculate MBD1 bindingto an average of 0.15 of 737 methylcytosine sites on pML4.2; thisresult corroborates with our theoretical estimate for MBD1 bind-ing to an average of 0.95 of 737 methylcytosine sites on pML4.2,given experimental conditions and a 3 μM KD (24). These obser-vations emphasize the need for improved detection throughenhanced binding conditions. By contrast, the low false-positiverate indicates control over the molecule sorting process, yielding3.5� 0.3 fold enrichment of methylated pML4.2 with a 39%background of pUC19 at the sorted output. Our results forsorting DNA plasmids compare well with existing literature forimmunoprecipitation reactions that report typical 2–8 fold en-richment levels (3, 28), binding-limited methylation detection(28), and collection of 60–99% background DNA (29).
ConclusionWe have described the development of a nanofluidic device thatcan be used as part of an epigenetic analysis workflow. This de-vice provides nanofluidic confinement to isolate individual mole-cules for color-multiplexed detection and to sort these moleculesby voltage-actuated flow. These attributes have enabled us to per-form real-time fluorescence detection and automated sortingon individual molecules based upon their fluorescence signature.We have optimized the sorting operation using time-correlated,in situ detection to achieve up to 98% accuracy in sorting andconfirmed sample recovery of sorted material by qPCR to suggest
opportunities for postsorting sample analysis by microarray orDNA sequencing methods. We have applied this technology todetect and sort methylated DNA molecules bound with MBD1protein from within 11 fg of total genetic material.
We envision several goals for continued development of thisdevice. The first goal is to improve detection efficiency by usingdifferent methylcytosine binding probes or modified conditionsthat enhance MBD1 binding to DNA. This could be achievedusing high affinity antibody probes with nanomolar KD valuesto enhance binding to methylated ssDNA or chemical cross-link-ing at high sample concentrations to enhance MBD1 binding todsDNA (30, 31). Yet another goal is to increase sample through-put toward studying DNA or chromatin sources at a whole gen-ome scale. Throughput may be increased in several ways includ-ing: (i) disabling the in situ single molecule tracking used in thiswork to increase input sample concentration and throughput by20-fold; (ii) removing unbound fluorescent probes to preconcen-trate the collection of informative molecules; and, (iii) scaling thesystem to include a collection of devices operated in parallel andmonitored using alternative fluorescence readout methods (32).A third goal could explore workflow integration by joining thesingle molecule sorter with recent advances in cell processing(12, 27, 33, 34). The sorter operates using small quantities of in-put material, a feature that pairs well with targeted extraction ofgenetic material from specific and limited (1–100) cell popula-tions. Such integration could provide an alternative to the off-chip material preparation steps used in this work and lead tomore efficient sample workflows. The fourth goal would furtherdevelop methods for postsorting material extraction to allow li-brary preparation and downstream microarray or deep sequen-cing by adapting single cell sequencing methods (35, 36). Thesegoals for development establish abundant opportunity to explorethe application of single molecule sorting for epigenomic analysisand a variety of molecule separation workflows.
Fig. 4. Single molecule detection and sorting of methylated DNA. DNA methylation state was identified using a green-labeled methyl binding domain-1(MBD1) protein incubated in a mixture of red-labeled DNAs including unmethylated-pUC19 and methylated-pML4.2. Methylation-specific binding was con-firmed by two-color fluorescence identification, which actuated sorting collection of bound MBD1-DNA complexes from the original mixture during a 20 min-ute sorting experiment. (A) This 4 s, time-resolved record illustrates three two-color molecules identified by the FPGA trigger at the device input. After sorting,the fluorescence from two of the three MBD1molecules remained paired with DNA, while the third had fluctuated below the intensity threshold. (B) A total of5,723 DNA molecules were analyzed at the device input during this experiment and 297 MBD1-DNA events were identified in this analysis. These MBD1-DNAevents were composed of 27 MBD1-pUC19 and 270 MBD1-pML4.2, which demonstrated specific binding of MBD1 to methylated pML4.2 molecules. Unboundmolecules were plotted along fluorescence ¼ 1 photon∕50 μs to accommodate logarithmic plotting. In situ molecule tracking demonstrated a false-positiverate of 5.6� 0.4% (�1 SD) and 3.5� 0.3 (�1 SD) fold enrichment of methylated pML4.2 at the sorted output.
Cipriany et al. PNAS Early Edition ∣ 5 of 6
ENGINEE
RING
APP
LIED
BIOLO
GICAL
SCIENCE
S

Materials and MethodsNanofluidic Device Fabrication. Nanofluidic devices were constructed in a100 mm diameter fused silica substrate (Mark Optics). The device patternwas defined by photolithography and reactive ion etched 250 nm into thesubstrate. Fluid reservoirs of the device were formed using a focused jet ofalumina abrasive. The device was cleaned and then touch bonded with a170 μm-thin fused silica substrate to enclose the fluidic channels. The waferstack was annealed at 1080 °C. Additional details are described elsewhere (18).
Optical Measurement Setup. Optical measurements were performed using aninverted microscope (Olympus IX-71). Fluorescence was induced using lasersemitting at 488 nm and 637 nm (Coherent). Their collinear beams were elon-gated using a cylindrical lens (Thorlabs) and focused onto the nanofluidicdevice using a 40x water immersion objective (Olympus). Fluorescence wascollected through a polychoric mirror and emission filter pair (Chroma) thenchromatically split and passband filtered at 525∕40 nm and 685∕40 nm(Semrock). A linear array of confocal apertures, formed by multimode opticalfibers, collected and delivered the fluorescence to single photon countingAPDs (Perkin Elmer). Photon counts were assessed using a custom-pro-grammed Altera FPGA (Terasic Technologies DE0) and recorded by two TCSPCcards (FastComTec P7888).
Real-Time and Postexperiment Single Molecule Analysis. Real-time photoncounting and signal analysis was performed using an FPGA operating withan adjustable, 50 μs time base or bin. Photon events were counted duringeach bin, processed by a digital low-pass filter, and compared against an in-tensity threshold to identify fluorescence bursts. To eliminate spurious bursts,a two-bin minimum duration was enforced. Single molecule events satisfiedboth thresholds and their detection actuated the sorting trigger. Postexperi-ment single molecule analysis was performed on the photon record file fromthe TCSPC hardware using a customMatlab routine. For multicolor detection,an AND gate evaluated the time-coincidence of each color event and actu-ated the sorting trigger. This FPGA trigger was time-correlated with detec-tion events during postexperiment analysis using Matlab.
Electrical Characterization of Sorter Hardware.Operation of the FPGA and highvoltage switch were verified using an arbitrary waveform generator (TektronixAFG 3252) and oscilloscope (Tektronix DPO 3052). Nanofluidic channel resis-tance and solid-state relay (Vishay) leakage current were measured using a pi-coammeter with built-in voltage source (Keithley 6487). Impulse response of
the nanofluidic channel was measuredwithin a Faraday cage using a low-noisecurrent preamplifier (Ithaco 1201) and visualized using an oscilloscope.
DNA and MBD1 Sample Preparation. pUC19 and pML4.2 were grown in dam-/dcm- Escherichia coli (New England Biolabs—C2925) and purified using a QIA-GEN Plasmid Midi Kit. Purified DNAs from pML4.2 and pUC19 were linearizedwith AscI and EcoRI to generate molecules measuring 15,156 bp and 2,687 bp,respectively. pML4.2 was in vitro methylated using M.SssI, and the degree ofmethylation was confirmed using HhaI and DdeI (Fig. S8). DNA was stainedwith TOTO-3 (Invitrogen) at a dye to base pair ratio of 1∶5. The 1xMBD1probe was expressed in E. coli, purified and then labeled with an Alexa-488 dye (Invitrogen A20000) as described (18). Labeled MBD1 was purifiedby size exclusion chromatography using a Superdex 75 resin (GE healthcare)in phosphate-buffered saline (PBS) buffer and then confirmed for probe ac-tivity (Fig. S9). TheMBD1-DNA binding reaction was performed in 1x Tris-buf-fered saline (TBS) at pH 8.0 in 0.5% bovine-serum-albumin and 0.1% Triton X-100. DNA components in this TBS buffer were then mixed with MBD1 in a PBSbuffer with 50% glycerol. The mixture was covered and slow rotated over-night at 4 °C. All biological samples were diluted into a “flow buffer,” 10 mMTris, and 1 mM EDTA buffered to pH 8.0 (1x TE buffer) that also contained0.1% Triton X-100 and 0.3% polyvinylpyrrolidone (Sigma Alrich) to flow themthrough the nanofluidic device.
Sample Recovery and qPCR Analysis. Samples were extracted from the fluidreservoir by pipette, transferred into low-adhesion microcentrifuge tubes,and stored at −20 °C. qPCR was performed on an ABI 7500 system using Sybr-Green mastermix (Applied Biosystems) with primers specific for pUC19 (F-,R-)or pML4.2 (F-,R-). Standard curves were established using purified plasmidDNA. qPCRmeasurements were performed in triplicate using 1 μL of materialcollected from the sorter. qPCR results were compared with in situ measure-ments of the total molecules sorted to calculate molecule enrichment.
ACKNOWLEDGMENTS. The authors acknowledge Adrian Bird for the MBD1expression vector and Robert Barton and Tobias Furhman for helpful discus-sions. This work was supported by the National Institute of Health (Grant:DA025722), the Cornell Center for Vertebrate Genomics, and the NationalCancer Institute (award number: U54CA143876). Nanofabrication was per-formed at the Cornell NanoScale Facility, a member of the National Nano-technology Infrastructure Network, which is supported by the NationalScience Foundation (Grant: ECS-0335765).
1. Jones PA, Baylin SB (2002) The fundamental role of epigenetic events in cancer. NatRev Genet 3:415–428.
2. Robertson KD (2005) DNA methylation and human disease. Nat Rev Genet 6:597–610.3. Lee TI, Johnstone SE, Young RA (2006) Chromatin immunoprecipitation and microar-
ray-based analysis of protein location. Nat Protoc 1:729–748.4. Bernstein BE, et al. (2006) A bivalent chromatin structure marks key developmental
genes in embryonic stem cells. Cell 125:315–326.5. Clark SJ, Harrison J, Paul CL, Frommer M (1994) High-Sensitivity mapping of methy-
lated cytosines. Nucleic Acids Res 22:2990–2997.6. Clark SJ, Statham A, Stirzaker C, Molloy PL, Frommer M (2006) DNA methylation:
bisulphite modification and analysis. Nat Protoc 1:2353–2364.7. Xiong ZG, Laird PW (1997) COBRA: A sensitive and quantitative DNA methylation
assay. Nucleic Acids Res 25:2532–2534.8. Li Y, Tollefsbol TO (2011) Combined Chromatin Immunoprecipitation and Bisulfite
Methylation Sequencing Analysis Epigenetics Protocols Methods in Molecular Biology,(Humana Press, Clifton, NJ), Vol 791, pp 239–251.
9. Wu AR, et al. (2009) Automated microfluidic chromatin immunoprecipitation from2,000 cells. Lab Chip 9:1365–1370.
10. Flusberg BA, et al. (2010) Direct detection of DNAmethylation during single-molecule,real-time sequencing. Nat Methods 7:461–U472.
11. Laird PW (2010) Principles and challenges of genome-wide DNA methylation analysis.Nat Rev Genet 11:191–203.
12. White AK, et al. (2011) High-throughput microfluidic single-cell RT-qPCR. Proc NatlAcad Sci USA 108:13999–14004.
13. McKnight TE, Culbertson CT, Jacobson SC, Ramsey JM (2001) Electroosmoticallyinduced hydraulic pumping with integrated electrodes on microfluidic devices. AnalChem 73:4045–4049.
14. Kralj JG, Lis MTW, Schmidt MA, Jensen KF (2006) Continuous dielectrophoretic size-based particle sorting. Anal Chem 78:5019–5025.
15. Wang L, Flanagan LA, Jeon NL, Monuki E, Lee AP (2007) Dielectrophoresis switchingwith vertical sidewall electrodes for microfluidic flow cytometry. Lab Chip 7:1114–1120.
16. Studer V, Pepin A, Chen Y, Ajdari A (2004) An integrated AC electrokinetic pump in amicrofluidic loop for fast and tunable flow control. Analyst 129:944–949.
17. Thorsen T, Maerkl SJ, Quake SR (2002) Microfluidic large-scale integration. Science298:580–584.
18. Cipriany BR, et al. (2010) Single Molecule Epigenetic Analysis in a Nanofluidic Channel.Anal Chem 82:2480–2487.
19. Dittrich PS, Schwille P (2003) An integrated microfluidic system for reaction, high-sensitivity detection, and sorting of fluorescent cells and particles. Anal Chem75:5767–5774.
20. Fu AY, Spence C, Scherer A, Arnold FH, Quake SR (1999) A microfabricated fluores-cence-activated cell sorter. Nat Biotechnol 17:1109–1111.
21. Baret JC, et al. (2009) Fluorescence-activated droplet sorting (FADS): efficient micro-fluidic cell sorting based on enzymatic activity. Lab Chip 9:1850–1858.
22. Claudet C, Angelov D, Bouvet P, Dimitrov S, Bednar J (2005) Histone octamer instabilityunder single molecule experiment conditions. J Biol Chem 280:19958–19965.
23. Hagerman TA, et al. (2009) Chromatin Stability at Low Concentration Depends onHistone Octamer Saturation Levels. Biophys J 96:1944–1951.
24. Jorgensen HF, Adie K, Chaubert P, Bird AP (2006) Engineering a high-affinity methyl-CpG-binding protein. Nucleic Acids Res 34:e96.
25. Foquet M, Korlach J, Zipfel W, Webb WW, Craighead HG (2002) DNA fragment sizingby single molecule detection in submicrometer-sized closed fluidic channels. AnalChem 74:1415–1422.
26. Cho SH, et al. (2010) Review Article: Recent advancements in optofluidic flow cyt-ometer. Biomicrofluidics 4:043001.
27. Brouzes E, et al. (2009) Dropletmicrofluidic technology for single-cell high-throughputscreening. Proc Natl Acad Sci USA 106:14195–14200.
28. Keshet I, et al. (2006) Evidence for an instructive mechanism of de novo methylation incancer cells. Nat Genet 38:149–153.
29. Pepke S, Wold B, Mortazavi A (2009) Computation for ChIP-seq and RNA-seq studies.Nat Methods 6:S22–S32.
30. Schmiedeberg L, Skene P, Deaton A, Bird A (2009) A Temporal Threshold for Formal-dehyde Crosslinking and Fixation. PLoS One 4:e4636.
31. SolomonMJ, Varshavsky A (1985) Formaldehyde-Mediated Dna Protein Crosslinking—A Probe For Invivo Chromatin Structures. Proc Natl Acad Sci USA 82:6470–6474.
32. Lundquist PM, et al. (2008) Parallel confocal detection of single molecules in real time.Opt Lett 33:1026–1028.
33. Di Carlo D,Wu LY, Lee LP (2006) Dynamic single cell culture array. Lab Chip 6:1445–1449.34. Geng T, et al. (2011) Histone modification analysis by chromatin immunoprecipitation
from a low number of cells on a microfluidic platform. Lab Chip 11:2842–2848.35. Dean FB, Nelson JR, Giesler TL, Lasken RS (2001) Rapid amplification of plasmid and
phage DNA using phi29 DNA polymerase and multiply-primed rolling circle amplifica-tion. Genome Res 11:1095–1099.
36. Zhang K, et al. (2006) Sequencing genomes from single cells by polymerase cloning.Nat Biotechnol 24:680–686.
6 of 6 ∣ www.pnas.org/cgi/doi/10.1073/pnas.1117549109 Cipriany et al.


![454 SCREENING AND SELECTION OF CLONED DNA [33]454 SCREENING AND SELECTION OF CLONED DNA [33] [33] R-Looping and Structural Gene Identification of Recombinant DNA* MICHAEL ROSBASH,](https://img.pdfslide.us/doc/110x75/5e81eba1afb41f47c967e1f2/454-screening-and-selection-of-cloned-dna-33-454-screening-and-selection-of-cloned.jpg)