Embed Size (px)
Citation preview
No. 11-1
Real Output of Bank Services:
What Counts Is What Banks Do, Not What They Own
Robert Inklaar and J. Christina Wang
Abstract: The measurement of bank output, a difficult and contentious issue, has become even more important in the aftermath of the devastating financial crisis of recent years. In this paper, we argue that models of banks as processors of information and transactions imply a quantity measure of bank service output based on transaction counts instead of balances of loans and deposits. Compiling new and comparable output measures for the United States and a range of European countries, we show that our counts-based output series exhibit significantly different growth patterns from those of our balances-based output series over the years 1997 to 2009. Since the U.S. official statistics rely on counts while European statistics rely on balances, this implies a potentially considerable bias in the estimate of bank output growth in Europe vis-à-vis that in the United States.
JEL Classifications: E01, E44, O47
Robert Inklaar is an assistant professor at the University of Groningen and J. Christina Wang is a senior economist in the research department at the Federal Reserve Bank of Boston. Their e-mail addresses are [email protected] and [email protected], respectively.
We would like to thank Chris Kask of the Bureau of Labor Statistics (BLS) for providing us with the data and description of the BLS output statistics for commercial banks, and Susanto Basu, Erwin Diewert, John Fernald, Alice Nakamura, Marshall Reinsdorf, Paul Schreyer, Kevin Stiroh, Marcel Timmer, Jack Triplett, and participants at the NBER/CRIW Summer Institute 2006; the 2010 IARIW meeting; the World KLEMS meeting 2010; and seminars at the Federal Reserve Bank of San Francisco and the University of Groningen for useful comments and suggestions on previous versions. Robert Inklaar thanks the European Commission, Research Directorate General, for support as part of the 7th Framework Programme, Theme 8, "Socio-Economic Sciences and Humanities" and part of the project ’Indicators for evaluating international performance in service sectors’ (INDICSER).
This paper, which may be revised, is available on the web site of the Federal Reserve Bank of Boston at http://www.bostonfed.org/economic/wp/index.htm.
The views expressed in this paper are those of the authors and not necessarily those of the Federal Reserve System or the Federal Reserve Bank of Boston. This version: February 2011
I. Introduction
The measurement of bank output has long been a difficult and sometimes contentious
topic that has yet to see a consensus resolution.1
This paper focuses on the methodological question of how to measure the real
value of these services. We construct model-based output measures for banking services
and compare these with alternative measures commonly used by statistical agencies.
The underlying banking model is built on theories of financial intermediation and asset
pricing. Its central message is that bank output should be measured in terms of indices
of quality-adjusted
Achieving the right output measure for
bank services has become more important in the aftermath of the recent devastating
financial crisis, as the role of financial firms has come under intense scrutiny. One of the
questions attracting greater attention concerns how much banks have truly contributed
to the real economy in terms of the services they provide.
2 counts of different categories of banking transactions.3
We contrast our model-based output measures derived from activity counts with
measures based on outstanding balances of loans and deposits deflated by a general
price index; such measures are used by statistical agencies in many countries. This latter
approach in effect assumes that every (real) currency unit such as the euro or dollar
corresponds to a constant flow of services over time. However, assuming such fixed
proportionality between outstanding balances and service flows requires restrictive
This
approach amounts to assuming that each transaction within a suitably defined category,
such as a conforming mortgage loan origination or a deposit withdrawal, corresponds to
a constant flow of services over time.
1 See, for example, Triplett and Bosworth (2004) and Diewert (2010) for overviews, and Basu, Inklaar, and Wang (2011) and Fixler and Zieschang (2010) for contributions to the debate in recent years. 2 Throughout the paper, “quality-adjusted” refers to adjusting for variations in the composition as well as the quality, if feasible, of individual services constituting an aggregate output index. 3 This is generally equivalent to deflating revenue when fees for services are explicit, as with novel bank activities that typically generate no financial claims on the balance sheet. We focus on the case where banks charge implicitly via an interest margin on loans and deposits, so that it becomes necessary to measure output by directly constructing quantity indices based on quality-adjusted activity counts.
1
assumptions.4
In practice, adequate quality adjustment is difficult because of the lack of
relevant detailed data. Nevertheless, we argue that our activity-count-based measures
with imperfect quality adjustment using available data still constitute an improvement
over deflated balances because of the conceptual advantage. Moreover, we find large
empirical differences between the two types of measures. In the case of U.S. commercial
and industrial (C&I) loans, the average loan size (in both nominal and real dollars) has
decreased steadily over time, so the deflated-balances approach underestimates the true
output growth of C&I lending services. Likewise, the number of deposit transactions has
grown faster than deposit balances, and this means that deflated balances understate
true output growth of depositor services. On the other hand, house prices in the united
States and most European countries have increased faster than the overall price level,
leading to an increase in the average size of residential mortgages. As a result, the CPI-
deflated balances overestimate true output growth of mortgage lending activity.
In contrast, counting activities always yields the right output measure in
theory.
These findings also have important implications for cross-country growth
comparisons. In the United States, official statistics have so far been based on the
activity-count approach,5 while the European statistics rely almost entirely on the
deflated-balance approach.6
4 These arguments are formalized more extensively in Wang, Basu, and Fernald (2009) and Basu and Wang (2006). They delineate the restrictive assumptions needed to justify fixed proportionality between balances and services.
Following our reasoning, the official estimate of European
bank output growth is most likely biased relative to that of the United States, although
the direction and size of the overall bias is unclear given our finding of biases in both
directions. More accurate estimates have to await additional data needed to conduct a
similar comparison for the other types of loan and deposit services.
5 See, for example, Brand and Duke (1982) for the approach taken by the U.S. Bureau of Labor Statistics (BLS) and Fixler and Reinsdorf (2006) for recent research by the U.S. Bureau of Economic Analysis (BEA). 6 In the Netherlands, the number of deposit transactions is used for depositor services, but a deflated-balances approach is used for lending services.
2
Our proposal for an activity-count measure of bank output can also have
implications for productivity estimates over the past decade or so. In particular, if bank
output has been overestimated because of inflated asset valuations (and hence balances),
it would call for revisiting estimates of the U.S. productivity revival since the mid 1990s,
because the financial services industry accounts for a non-trivial fraction of the
productivity speed-up. Furthermore, growing interest has been expressed in discussions
of financial regulatory reform to separate banks’ utilities-like function from their risk-
taking function.7
The rest of the paper is organized as follows. In Section II we outline the theory
underlying our empirical estimates and compare it with the other commonly used
methods. Section III describes the methodological choices made in mapping the theory
to the available data. Section IV presents the results, and Section V concludes.
Our estimates in this study can be viewed as a first attempt to gauge
the contribution of the utilities-like functions of banking to growth that is minimally
contaminated by the risky returns earned by banks or by asset inflation.
II. Intermediation theory and its implication for bank output measurement
This section first reviews the banking model underlying our preferred measure of bank
output. The emphasis is on the theory’s methodological implication for measuring bank
output at constant prices—decomposing nominal output into its price and quantity
components.8
The theory behind our measurement is developed in Wang (2003) and Wang,
Basu, and Fernald (WBF, 2009).
We discuss why our method yields a consistent measure of bank services
regardless of whether the services are associated with financial claims on the balance
sheet, and whether they generate explicit fees.
9
7 See, for example, various speeches by the Bank of England governor Mervyn King, one of which can be found at
In these models, the core function of banks is to screen
and monitor borrowers in order to reduce information asymmetry in lending, and to
http://www.bankofengland.co.uk/publications/speeches/2009/speech406.pdf. 8 In what follows, real output is used interchangeably with output quantity and output at constant prices. 9 Wang (2003) considers the partial-equilibrium case, while WBF (2009) extend it to general equilibrium.
3
provide payment services to depositors and borrowers. Modeling banks’ raison d’être as
resolving asymmetric information problems follows the tradition of an extensive
literature on financial intermediation.10
One key implication of this theory for output definition is that, even though the
provision of banking services is often integrated with the transfer of funds between
depositors and borrowers, these funds per se are not banks’ output. Rather, the role of
these funds can be thought of as analogous to that of the goods transported and
marketed by wholesalers and retailers.
11
Consequently, the models stipulate that to measure bank output one should try
to estimate the flow of services directly, just as one estimates services of consulting and
accounting firms. And one should not use the accompanying stock of loan and deposit
balances, since there is no theoretical basis for assuming fixed proportionality between
service flow and asset balance. In fact, using an extension of the Baumol-Tobin model,
Basu and Wang (2006) demonstrate that there is no constant relationship, let alone fixed
proportionality, between the two if the technology for producing bank services changes
over time relative to the rest of the economy. Besides technological progress, many other
real-world factors, including inflation, can cause the balance-service relationship to vary
over time.
This implication is particularly relevant for
bank services that are remunerated implicitly through extra interest margins, because
they result in financial claims on the balance sheet, as is characteristic of most traditional
banking activities. In fact, the models in both WBF (2009) and Wang (2003) purposely
consider the polar case where a bank charges for all services via an interest margin.
To see the intuition of the distinction between the activity-counts and the
deflated-balances methods, consider the analogy to estimating the service output of a car
dealership. Is it more sensible to count the number of each make of cars sold in a period
10 See, for example, Campbell and Kracaw (1980), Leland and Pyle (1977), and Diamond (1984, 1991) for theoretical modeling along these lines. See Mester (1992) for an empirical analysis that takes some of these considerations into account. 11 Although helpful for intuition, this analogy should not be taken literally, because funds do not satisfy the technical definition in the current national income accounting system of purchased intermediate inputs, which must have themselves been counted as the output of some other productive units.
4
(and aggregate using sales commissions by make as weights), or to count the CPI-
deflated dollar value of the accounts receivable on the dealer’s book at period-end?
Counting the number of specific types of cars sold is no doubt imperfect, since it ignores
possible changes over time in the quality-adjusted sales services devoted to each vehicle
sold.12
In contrast, the (deflated) value of accounts receivable at a point in time would
not bear a fixed relationship to the amount of sales services except under restrictive and
often unrealistic conditions.
But this is no more than the usual empirical difficulty with quality adjustment.
13 One should at least deflate the dollar value of cars sold
during the period with a composite price index for autos, based on the mix of cars sold.
However, for this series to be a valid proxy for the amount of sales services, one would
still need to assume a constant relationship between the price of cars and the price of
sales services.14
Counting the number of loans and depositor transactions is exactly analogous to
counting the number of cars sold, while using deflated loan and deposit balances is
analogous to using the deflated dollar amount of the auto dealer’s accounts receivable.
We argue that the former is more sensible. For indices of transaction counts to accurately
measure bank output, however, each category of bank services must be defined
properly. Since, in principle, products should be identified from the perspective of
demand, bank services should be classified according to customers’ perception of the
Furthermore, this method too suffers from the same quality-adjustment
problem that afflicts the output measure based on direct number counts. So it seems that
one can do no better than to use counts directly.
12 Differences in service quality across sales of different kinds of cars (for example, selling Mercedes entails more upscale services) in principle cause no problem (for aggregation), so long as the revenue accrued to each type of sales services is measured correctly, providing the right aggregation weights. 13 The resulting series has little reason in theory to bear any stable relationship even to the number of cars sold, let alone to the amount of sales services provided. And this is true even under the stringent assumption that all dealers sell the same mix of cars at all times. 14 The problem lies in the aggregation weights implicit in this proxy: it is based on a vehicle’s entire value instead of just the sales commission part, which is the appropriate weight for aggregating across types of sales services. Under perfect competition in both car manufacturing and sales markets, the use of this proxy amounts to assuming the same rate of technological progress in the production and sale of cars.
5
distinct objectives of the tasks performed.15
In practice, data limitations largely dictate how many distinct categories of bank
services can be identified. This is the case for our empirical estimates and comparisons.
As will be described in the next two sections, we distinguish as many (potentially)
distinct types of services as possible. For instance, within C&I loans made by U.S. banks,
we further distinguish across loans of different risk ratings and with different repricing
periods. Even though our activity-based estimates of bank output are imperfect because
we are unable to make distinctions across different types of banks services as finely as
called for by theory, they can still help gauge the extent to which balance-based
measures of output may have biased the official statistics of bank output over the past
decade or so. Being approximately right is preferable to being precisely wrong. Besides,
there is no evidence that deflated balances are better able to distinguish among different
types of bank services. The correct strategy for further improvements should be to
collect count data on additional types of bank activities.
For instance, if all residential mortgage loans
are perceived to be the same product, then the origination of such loans should be
defined as a type of bank service. Likewise, the origination of business loans with
principal less than $100,000 to fund working capital may be another type of service.
With the output of each type of service measured, aggregate output growth can be
derived in the standard way, using (implicit as well as explicit) revenue shares.
III. Data and empirical methodology
This section details how we map concepts under the theory described above to the best
available data, encompassing three categories of bank services. We discuss in turn
lending services associated with C&I loans and residential real estate loans and
transaction services associated with deposit accounts. Table A.1 in the appendix lists the
data sources by type of banking service and, where available, by country.
15 Particularly in the case of bank services that do not directly generate utility for customers, such as monitoring borrowers, bank customers likely classify those according to the associated financial instruments, which are what they truly seek. For instance, residential mortgage loans are likely regarded as a different kind of product than consumer car loans or credit card loans for this reason.
6
3.1 Commercial & industrial loans
As mentioned above, traditional bank activities often generate interest margins but no
explicit fees for services. So, the difficulty with measuring their output at current prices
carries over to measuring real output. The usual method—deflating revenue using price
indices to estimate indices of real output—is seldom applicable. The alternative we
adopt is what we have termed the “activity-count” method: estimate real output indices
using direct quantity indicators. The Bureau of Labor Statistics (BLS) is one source of
such activity data. The BLS series track the number of four types of loans—residential
real estate, credit card, other consumer, and commercial & industrial (C&I) loans—and
transactions on two types of deposit accounts—demand deposits and time and savings
deposits.16
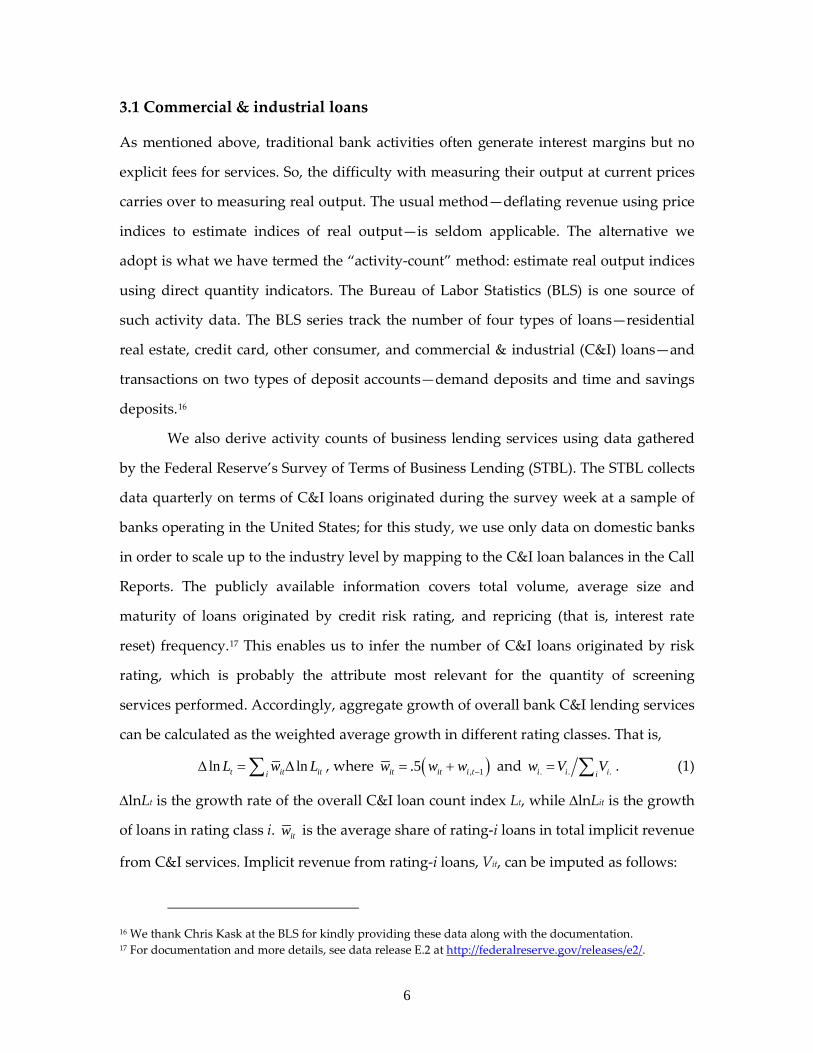
We also derive activity counts of business lending services using data gathered
by the Federal Reserve’s Survey of Terms of Business Lending (STBL). The STBL collects
data quarterly on terms of C&I loans originated during the survey week at a sample of
banks operating in the United States; for this study, we use only data on domestic banks
in order to scale up to the industry level by mapping to the C&I loan balances in the Call
Reports. The publicly available information covers total volume, average size and
maturity of loans originated by credit risk rating, and repricing (that is, interest rate
reset) frequency.
17
This enables us to infer the number of C&I loans originated by risk
rating, which is probably the attribute most relevant for the quantity of screening
services performed. Accordingly, aggregate growth of overall bank C&I lending services
can be calculated as the weighted average growth in different rating classes. That is,
ln lnt it itiL w L∆ = ∆∑ , where ( ), 1.5it it i tw w w −= + and . . .i i ii
w V V= ∑ . (1)
∆lnLt is the growth rate of the overall C&I loan count index Lt, while ∆lnLit is the growth
of loans in rating class i. itw is the average share of rating-i loans in total implicit revenue
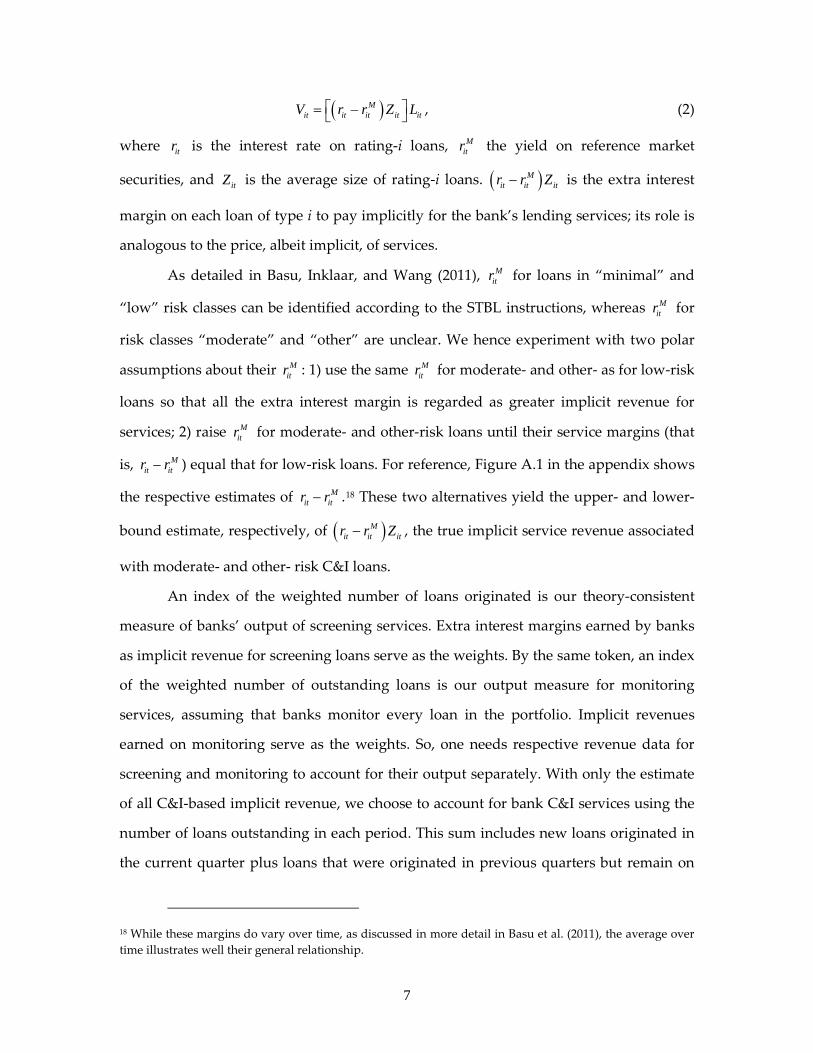
from C&I services. Implicit revenue from rating-i loans, Vit, can be imputed as follows:
16 We thank Chris Kask at the BLS for kindly providing these data along with the documentation. 17 For documentation and more details, see data release E.2 at http://federalreserve.gov/releases/e2/.
7
( )Mit it it it itV r r Z L = − , (2)
where itr is the interest rate on rating-i loans, Mitr the yield on reference market
securities, and itZ is the average size of rating-i loans. ( )Mit it itr r Z− is the extra interest
margin on each loan of type i to pay implicitly for the bank’s lending services; its role is
analogous to the price, albeit implicit, of services.
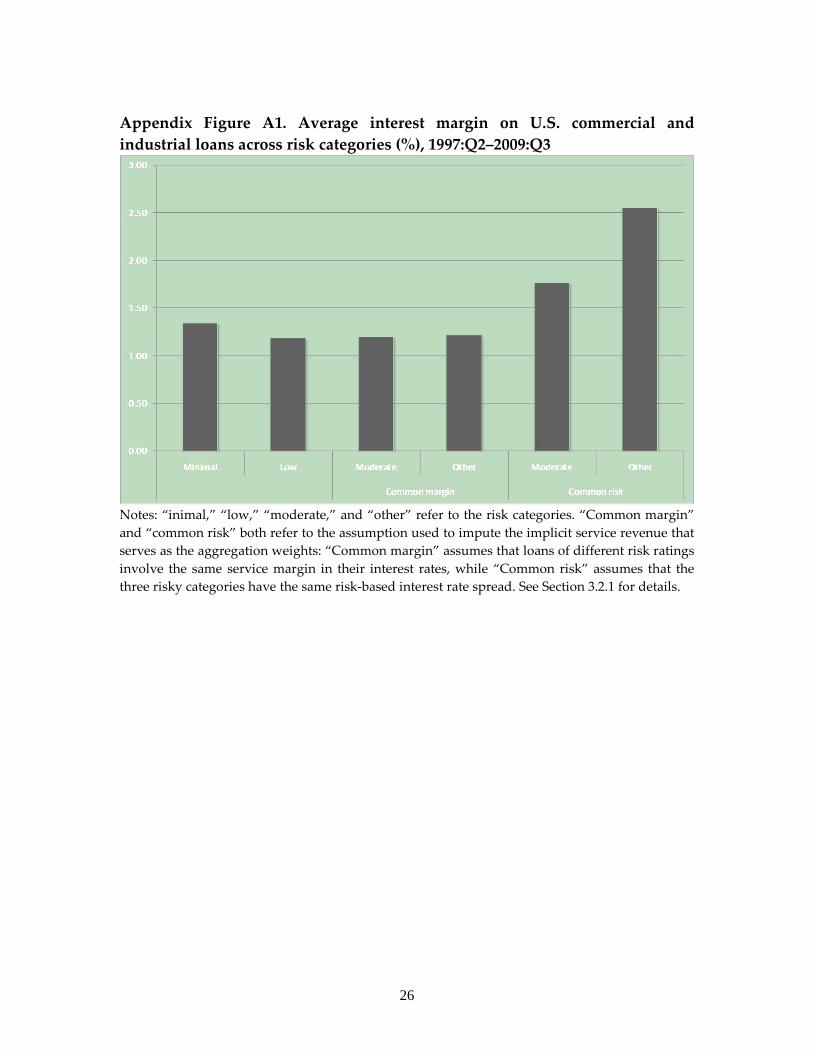
As detailed in Basu, Inklaar, and Wang (2011), Mitr for loans in “minimal” and
“low” risk classes can be identified according to the STBL instructions, whereas Mitr for
risk classes “moderate” and “other” are unclear. We hence experiment with two polar
assumptions about their Mitr : 1) use the same M
itr for moderate- and other- as for low-risk
loans so that all the extra interest margin is regarded as greater implicit revenue for
services; 2) raise Mitr for moderate- and other-risk loans until their service margins (that
is, Mit itr r− ) equal that for low-risk loans. For reference, Figure A.1 in the appendix shows
the respective estimates of Mit itr r− .18
( )Mit it itr r Z−
These two alternatives yield the upper- and lower-
bound estimate, respectively, of , the true implicit service revenue associated
with moderate- and other- risk C&I loans.
An index of the weighted number of loans originated is our theory-consistent
measure of banks’ output of screening services. Extra interest margins earned by banks
as implicit revenue for screening loans serve as the weights. By the same token, an index
of the weighted number of outstanding loans is our output measure for monitoring
services, assuming that banks monitor every loan in the portfolio. Implicit revenues
earned on monitoring serve as the weights. So, one needs respective revenue data for
screening and monitoring to account for their output separately. With only the estimate
of all C&I-based implicit revenue, we choose to account for bank C&I services using the
number of loans outstanding in each period. This sum includes new loans originated in
the current quarter plus loans that were originated in previous quarters but remain on
18 While these margins do vary over time, as discussed in more detail in Basu et al. (2011), the average over time illustrates well their general relationship.
8
bank balance sheets. So we in effect assume that screening and monitoring each C&I
loan with a given set of attributes (that is, rating and repricing frequency in this case)
involves an equal amount of services, and that newly originated loans need no
monitoring in the period of their origination.19
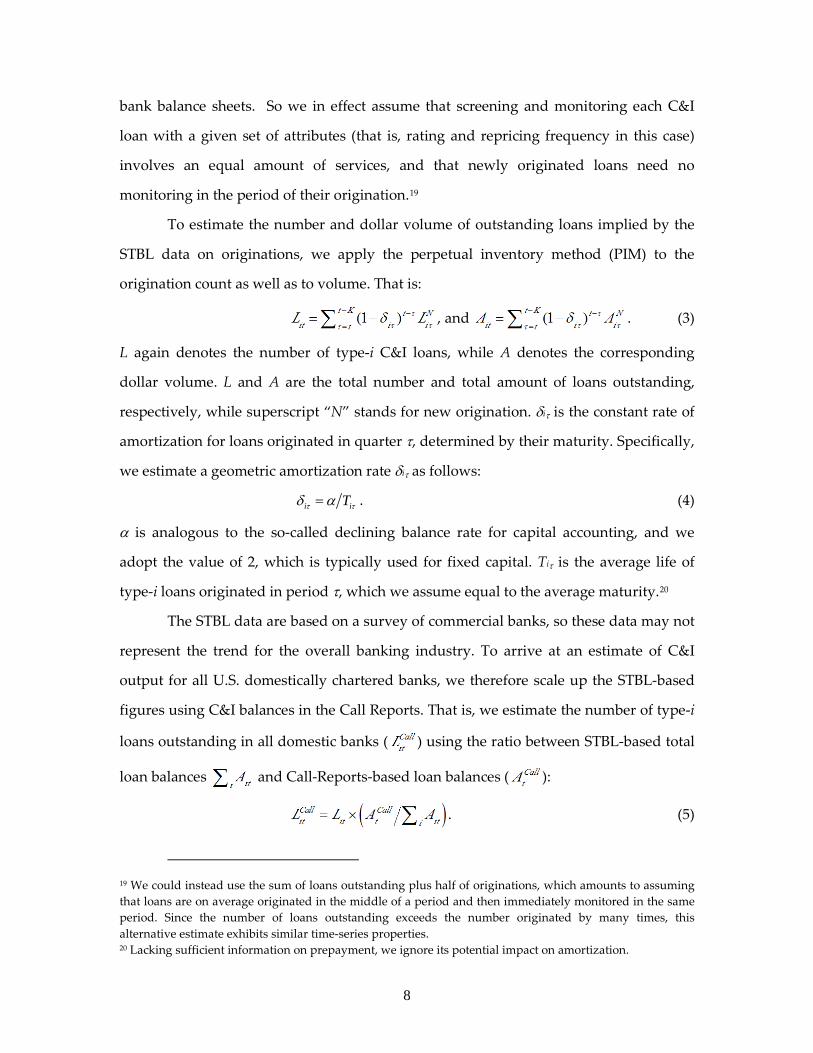
To estimate the number and dollar volume of outstanding loans implied by the
STBL data on originations, we apply the perpetual inventory method (PIM) to the
origination count as well as to volume. That is:
, and . (3)
L again denotes the number of type-i C&I loans, while A denotes the corresponding
dollar volume. L and A are the total number and total amount of loans outstanding,
respectively, while superscript “N” stands for new origination. δiτ is the constant rate of
amortization for loans originated in quarter τ, determined by their maturity. Specifically,
we estimate a geometric amortization rate δiτ as follows:
i iTτ τδ α= . (4)
α is analogous to the so-called declining balance rate for capital accounting, and we
adopt the value of 2, which is typically used for fixed capital. Tiτ is the average life of
type-i loans originated in period τ, which we assume equal to the average maturity.20
The STBL data are based on a survey of commercial banks, so these data may not
represent the trend for the overall banking industry. To arrive at an estimate of C&I
output for all U.S. domestically chartered banks, we therefore scale up the STBL-based
figures using C&I balances in the Call Reports. That is, we estimate the number of type-i
loans outstanding in all domestic banks (
) using the ratio between STBL-based total
loan balances and Call-Reports-based loan balances ( ):
. (5)
19 We could instead use the sum of loans outstanding plus half of originations, which amounts to assuming that loans are on average originated in the middle of a period and then immediately monitored in the same period. Since the number of loans outstanding exceeds the number originated by many times, this alternative estimate exhibits similar time-series properties. 20 Lacking sufficient information on prepayment, we ignore its potential impact on amortization.
9
The implicit assumption here is that the composition of C&I loans in the STBL sample is
the same as that of the aggregate C&I portfolio in the Call Reports.
3.2 Real estate loans
Among the existing data, activity counts, such as the number of C&I loan originations in
the STBL, accord best conceptually with our model-based output measure, because they
map directly to the natural units of bank services (and most non-bank financial services).
They are, of course, not perfect, since using them in effect assumes that a given loan or a
given depositor transaction represents the same quantity of a specific type of service
over time. But this is fundamentally an empirical limitation and no different from the
general difficulty with quality adjustment that troubles the measurement of all services.
Moreover, it is clearly more sensible than assuming that a given amount of purchasing
power on a bank’s book represents a constant flow of services over time, which is the
implicit assumption underlying commonly used output measures that are based on loan
or deposit balances deflated by the CPI or the like.
Nevertheless, since asset balances are often more readily observed, it is useful to
examine the conditions under which bank activity counts can be adequately
approximated using properly deflated loan balances. We hypothesize that such balance-
based proxies are most promising for categories of loans that are used to finance
purchases of assets for which accurate price indices exist.
A prime example is residential mortgage loans, and we use it to illustrate the
mapping between activity counts and loan balances. In growth rates, the relationship
between the number and the balance of mortgages can be expressed as:
t t t tn p b v+ = − . (6)
nt is the growth of the number of mortgage loans processed. Importantly, the number of
loans should equal the number of houses purchased, a condition mostly satisfied in the
United States, where almost all borrow to buy houses and most take out just one
mortgage against each house. pt is the growth in the price index of those houses whose
purchases are financed with loans and bt is the growth in the loan balance. vt is the
10
percentage change in the average ratio of mortgage loans to house prices, frequently
referred to as the loan-to-value ratio. Both sides of (6) therefore equal total value (in
terms of growth rate) of homes financed with loans. This way, the growth rate of a
bank’s real output (nt) can be inferred from the more readily available loan balance (bt)
so long as pt and vt are also available.
Note that, for (6) to hold, nt and pt can be chosen as either unweighted or house-
value-weighted indices. The two alternatives correspond to different assumptions about
the relationship between loan counts and bank service output, so the choice should be
guided by our assessment of which assumption is more plausible. Using value-weighted
loan counts amounts to assuming that the implicit-revenue share of each (type of)
mortgage equals its house-value share, while using unweighted loan counts assumes
that each loan generates about the same implicit revenue. We choose the unweighted
indices because we deem the latter assumption more plausible. Note that the correct
asset balance to use should still be a flow instead of a stock variable—the cumulative
balance of loans processed within a period, not the outstanding balance at period end. In
particular, cumulative balances account for refinancing services, whereas period-end
balances cannot. The latter may serve as a proxy if such balances are the only available
data.
Assuming the loan-to-value ratio is stable, then the relationship simplifies to
t t tn b p= − . (7)
That is, an output quantity indicator (nt) can be derived from a deflated balance. Key to
the derivation is using the proper deflator—it should be the price index for the assets
funded, and not just any general price index. In the empirical section below, we estimate
the output of residential mortgage origination based on (7).
3.3 Deposit transactions
Compared with the limited data on the number of loans, more are available on the
number of deposit transactions. In particular, the Red Book, published by the Bank of
International Settlements (BIS), includes annual figures of a variety of payment
11
transactions for a number of countries. We use the transaction data for the United States
along with all the European countries—Belgium, France, Germany, Italy, Netherlands,
Sweden and United Kingdom—covered in the Red Book. From annual publications of the
Red Book, we compile time series for every type of transaction covered: credit transfers,
direct debits, credit and debit card payments, e-money, checks, and other transactions.
For the comparison of activity counts with deflated balances, we have data on balances
of transaction accounts in the United States and overnight deposit accounts in Europe.
Table A.1 in the appendix includes further details of the data sources.
These data present a particular methodological challenge: we do not know the
bank revenue (implicit or explicit) associated with each of these types of transactions,
which would be needed to aggregate them. So we construct the aggregate index under
two different assumptions for the revenue weights and discuss the sensitivity of the
estimates. First, we weight every type of transaction equally, which amounts to
assuming that customers are willing to pay the same fee for each. This is the weighting
scheme chosen by the BLS for its index of aggregate bank output. At the other extreme,
we assume that customers’ willingness to pay for each transaction is proportional to the
amount transacted. Under this assumption, we would weight the growth of each type of
transaction by its share in total transaction value. Note that the value of a transaction is a
flow, not a stock, such as (deflated) deposit balances, which are a snapshot of the
maximal amount of funds available for transactions at a point in time.
IV. Results
In this section, we describe and compare empirical estimates of the real output of a
variety of bank services according to the different measures. Following the same order
as in the previous section, we discuss commercial & industrial loans, real estate loans,
and deposit transactions in turn.
12
4.1 Commercial & industrial loans
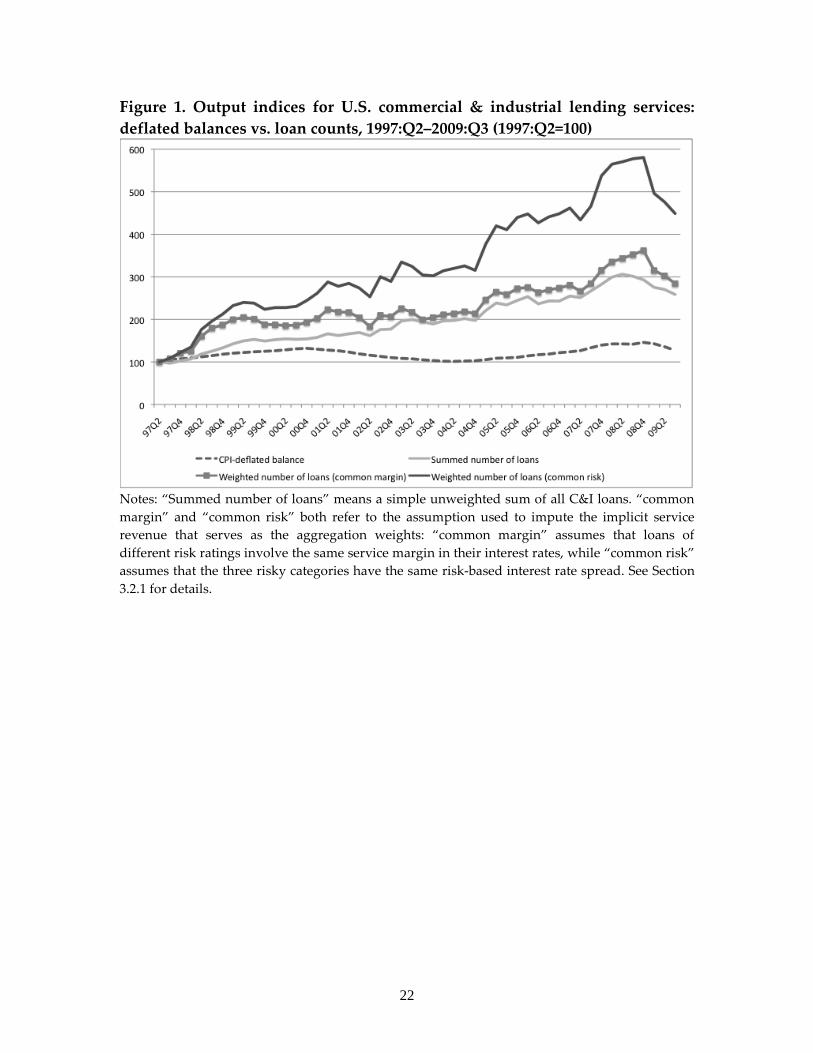
Figure 1 plots the time series of different estimates of the output index for C&I lending
services. All the series are scaled to the industry level. First, the line labeled “deflated
balance” is based on the CPI-deflated balance of C&I loans. In contrast, the other three
output series are based on the Call Reports number of outstanding C&I loans in each
rating and repricing frequency class (that is, ), as described in equation (5) in Section
3.1 above. The indices are all derived according to formula (1) in Section 3.1, only with
different aggregation weights wit’s. The “summed number” index is calculated using the
simple sum of all C&I loan counts, equivalent to setting wit = 1/N in (1), for every t and
class i =1,…,N. Both of the other series use i’s implicit-revenue share as the weight, but
they differ in the assumption regarding the market reference rate Mitr , leading to different
wit’s. The “weighted number - common risk” line assumes the same Mitr , while the
“weighted number - common margin” line assumes the same service margin (that is, M
it itr r− ), for C&I loans in all but the minimal-risk class.
One clear pattern emerging from the chart is that the CPI-deflated balance series
exhibits by far the lowest growth rate throughout the sample period, averaging a mere
0.5 percent per year. The faster growth of count- vs. balance-based indices is to be
expected, given that the average size of C&I loans has fallen steadily by over 40 percent
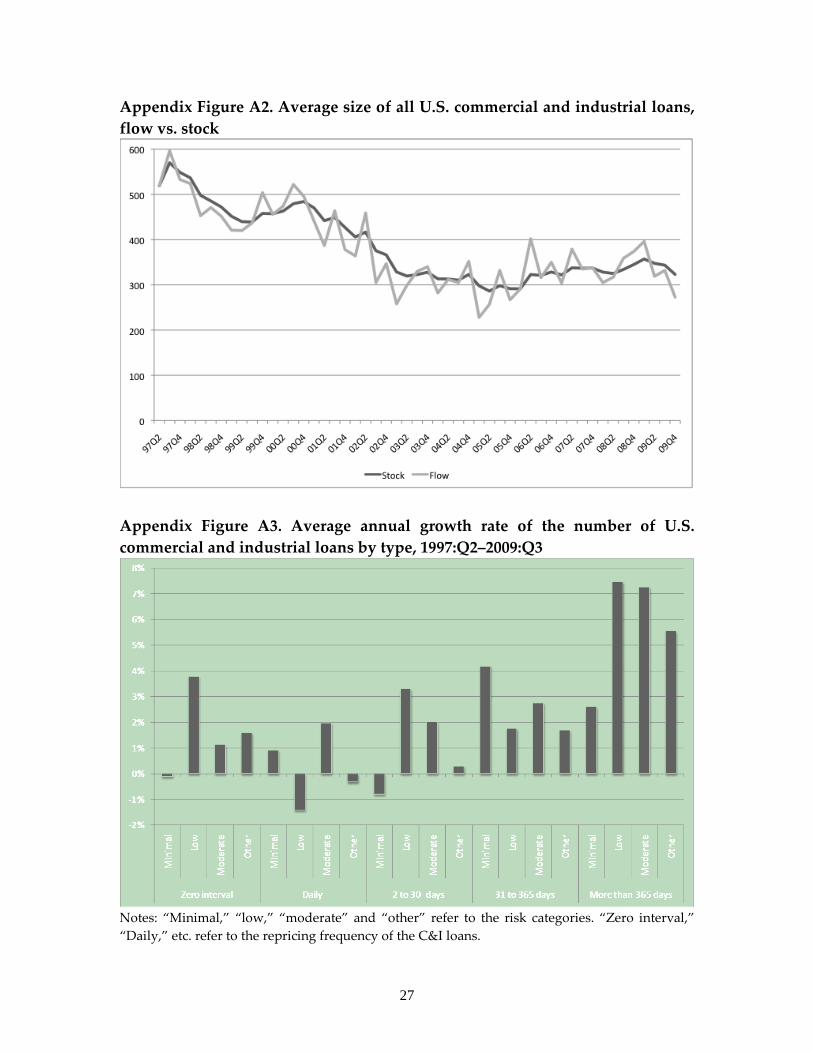
during the sample years (see Figure A.2 in the appendix). Among the loan-count-based
indices, the “summed number” and “weighted number - common margin” lines have
similar time series, with average annual growth rates of 2.0 percent and 2.2 percent,
respectively. This is not surprising, given that the latter series assumes the same
aggregation weight (that is, service margin) for over three-quarters of the loans. The
fastest growing is the “weighted number - common risk” index, averaging 3.1 percent
per year. This is the combined result of 1) much higher service margins for the two
riskier (that is, “moderate” and “other”) classes of loans (see Figure A.1), and 2) faster
growth in the number of these riskier classes of loans (see Figure A.3). The true output
index should lie between the “common risk” and the “common margin” series, given the
13
underlying polar assumptions about the service margin, but in either event, growth is
faster than when based on the deflated-balances approach.
4.2 Real estate loans
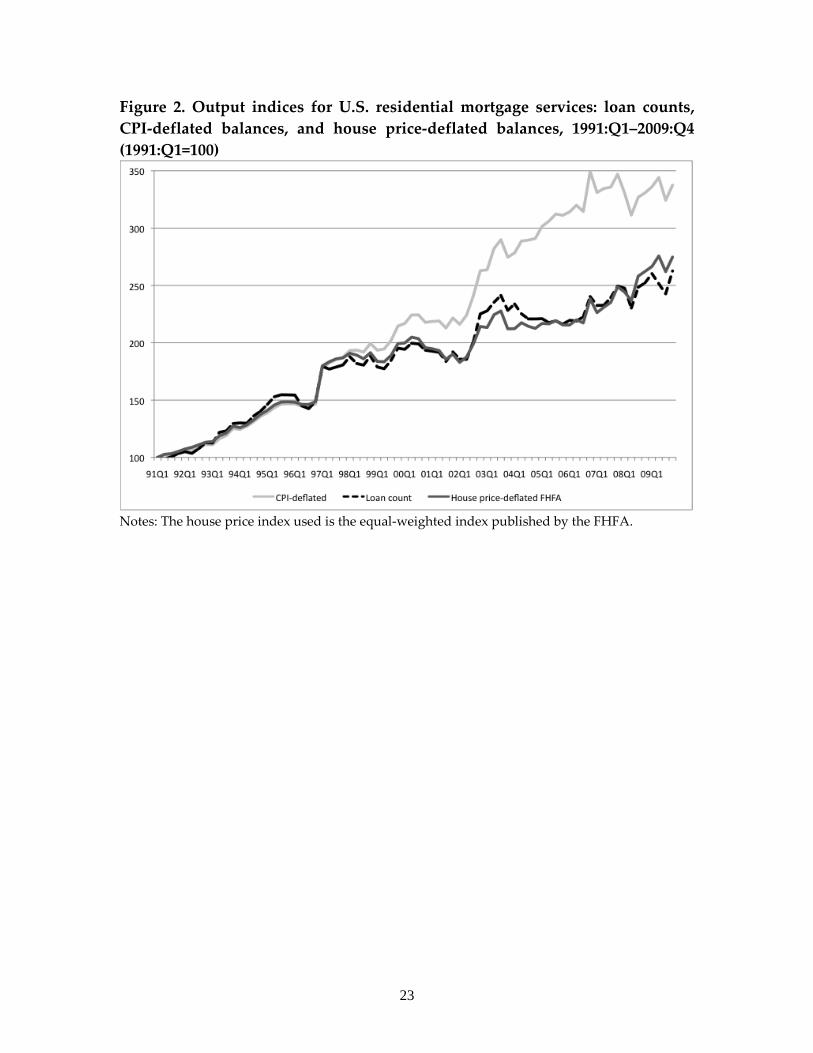
Figure 2 illustrates our effort to derive a proxy for bank service output from the
associated asset balance and the most suitable price index. Specifically, we approximate
the number of mortgage loans processed (including both existing loans serviced and
new loans originated) with a suitably deflated balance. According to the discussion
above (Section 3.2.1), we apply the equal-weighted purchase-only house price index
published by the Federal Housing Finance Agency (FHFA) to equation (6).21 The loan-to-
price data also come from the FHFA; loan-to-price ratios for all mortgages prior to
October 2002 are spliced with values specific to mortgage loans made by commercial
banks afterward. For comparison, Figure 2 also depicts the index based on the same loan
balance deflated using the CPI. Last, it plots the index based on simple counts of
mortgage loans, derived from the loan balance and average loan size. The count series
and the FHFA-index deflated balance are highly correlated, and have a similar average
growth rate of roughly 5 percent per year.22
We extend this modified deflated-balance approach to estimating the output of
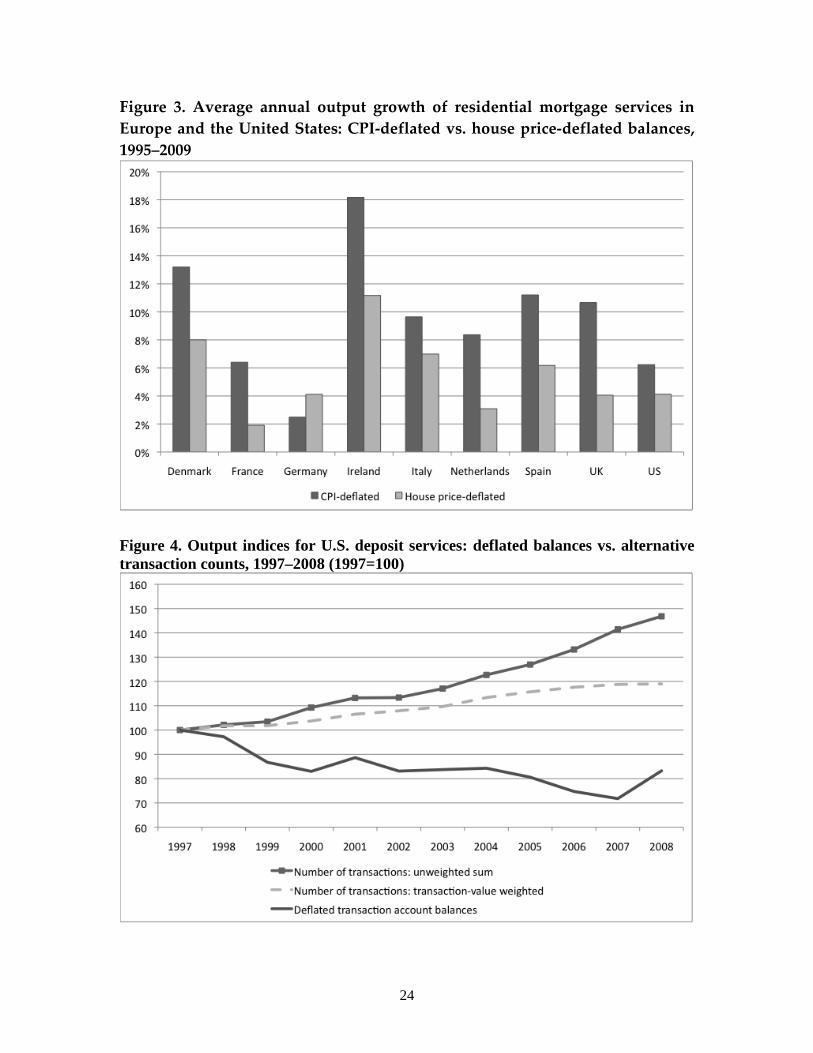
mortgage lending services to an international sample. Figure 3 shows estimates for a
panel of European countries for which we have found fairly consistent data on house
This is to be expected since the average loan-
to-price ratio has been stable over the sample period. By comparison, the CPI-deflated
balance shows faster growth throughout the sample, especially since around the turn of
the millennium. This pattern is no surprise, given that house price appreciation far
outstripped general inflation from the late 1990s through 2007. The growth correlation
between the loan-count and the CPI-deflated series is also lower.
21 Formerly known as the Office of Federal Housing Enterprise Oversight (OFHEO). Strictly speaking, the price index should be specific to the houses whose purchases are financed with bank loans. So the implicit assumption here is that there are no systematic price differences between houses financed by mortgages on banks’ balance sheets and conforming-mortgage-financed houses underlying the FHFA index. The two alternative house price indices, LoanPerformance and Case-Shiller S&P, are both value-weighted. 22 This is not to say that either quantity series is free of the usual problem with quality adjustment.

14
prices and aggregate mortgage balances; Appendix Table A1 details these data. We
again compare the house-price-deflated balance with the CPI-deflated balance. The
former is not adjusted for variations in the loan-to-price ratio over time because of the
lack of data. But this should have minimal impact on the overall time-series properties of
the output estimates provided that the loan-to-price ratio has been as stable in these
European countries as in the United States. The most prominent finding emerging from
these comparisons is that, with the exception of Germany, using house price indices to
deflate loan balances lowers the estimates of growth in residential mortgage lending
services in all the other seven countries.
This is the same pattern seen in the U.S. data, and for the same reason—house
price appreciation outpaced general inflation over the sample period in almost all these
European countries as well. In fact, six of these countries saw the relative price of houses
rise by five to seven percentage points on average per year over the 15 years of our
sample, much more rapid growth than that experienced in the United States. As we have
elaborated above, this means that one would be overstating the growth of bank services
in making mortgage loans by a considerable margin for some countries if one used CPI-
deflated loan balances. These overstatements would in turn bias productivity estimates
for the banking industry in these European countries vis-à-vis in the United States.
4.3 Depositor services
Figure 4 depicts the composite output index of bank depositor services estimated
according to the three different approaches discussed in the previous section. As the
legend indicates, one of them is based on “Deflated transaction account balances,” while
the other two are indices of the number of transactions associated with deposit accounts.
As detailed in the previous section, because of the lack of revenue data, we
consider the aggregate index of deposit services under two different assumptions for the
aggregation weight, namely ,equal weighting versus weighting by the currency value of
each type of transaction. “Number of transactions: unweighted sum” is an index derived
according to the simple sum of the total number of transactions across all types,

15
equivalent to setting the weights equal to shares in total transaction numbers. It averages
3 percent growth per year. “Number of transactions: transaction-value weighted”
weights the growth of each type of transaction by its share in total value of all
transactions. It averages 2 percent growth per year, somewhat slower than the index that
is based on the simple sum of transaction counts. On the other hand, both of these
indices show faster growth vis-à-vis the third index, which is based on deflated balances
of transaction accounts. In fact, the CPI-deflated account balances fall by an average of 2
percent per year over the sample period.
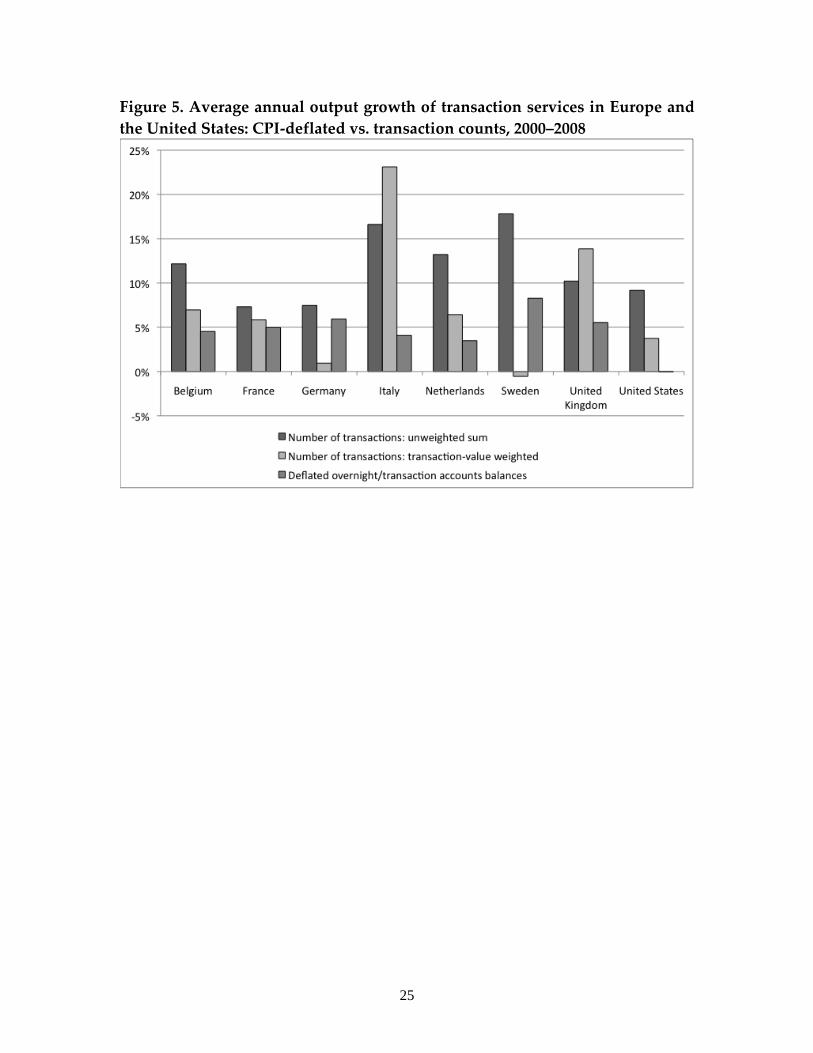
Figure 5 summarizes an international comparison of the same three indices of
depositor services. Specifically, it shows the average growth rates of the three similarly
constructed output indices in the seven European countries for which the BIS has
collected comparable data since 2000. We use overnight accounts as the European
counterpart to transaction accounts in the United States. (again, see Table A.1 for details
of the data). A similar pattern emerges from this panel of European countries: as in the
United States, the output index based on the simple sum of the number of transactions
experiences consistently higher growth rates than the index based on deflated balances
of overnight accounts. On the other hand, the relationship between the two transaction-
number-based indices (due to different weights) varies from country to country. For
instance, between the two series, growth in the value-weighted transaction index is
faster in Italy and the United Kingdom but much slower in Germany and Sweden.
Nevertheless, the transaction-count series grew faster than the deflated balances series
for a clear majority of cases.
V. Conclusions
The activities of banks have attracted greater scrutiny in the aftermath of the recent
damaging financial crisis. The difficult question of how to measure bank output has thus
taken on greater importance as well. Recent theoretical efforts (Wang 2003a, WBF 2009)
to model the operation of financial institutions, such as banks, yield a coherent
framework for measuring the output of bank services whether or not they generate
16
explicit fees. This theory implies that quantity indices, based on quality-adjusted counts
for each type of transaction, are always the right measure of bank output in principle.
They offer a special advantage in the case of bank services furnished without explicit
charges. In contrast, asset balances deflated by a general deflator are a valid proxy for
the flow of services only under restrictive conditions, such as static technology for
producing bank services. They often result in biased estimates of bank output growth.
To highlight how activity-count-based quantity indices of bank output differ
from deflated-balance-based indices empirically, this study applies the above model-
implied output measure to several categories of traditional bank services for which data
on both transaction counts and affiliated financial balances are available over the years
1997 to 2009. These include lending to businesses, lending to households for home
purchases, and deposit account transactions.
These output indices based on activity counts exhibit notably different trends
from output indices based on deflated balances. Moreover, the bias of the deflated-
balance series varies across types of bank services, countries, and over time. These
findings imply that deflated balances are unlikely to be a valid proxy for true bank
output because the conditions needed are too restrictive to be satisfied in practice.
The conceptually sound, activity-count measure, however, can be implemented
only imprecisely at present because of data limitations. Even though we believe that
even these activity-count output series are an improvement over deflated balances, we
would also advocate collecting activity data on additional categories of bank services.
Arguably, the most important among such data needs is quantity counts of a broader
array of more finely defined transactions. In addition, data on the ex post performance
of loans by detailed category should be gathered to enable better quality adjustment of
the output of lending services. Meanwhile, if approximations are used, it must be made
clear under which conditions they are appropriate. Our example of a proxy for the
output of mortgage lending based on house-price-deflated loan balances illustrates that
deflated balances are reasonable proxies for only a few types of bank activities and only
when the appropriate asset price deflators are available.

17
Finally, our results also suggest that considerable caution is needed when
comparing bank output growth across countries. The index of bank output in the U.S.
National Accounts is mostly based on activity counts, while its counterpart in official
European statistics is mostly based on deflated balances. While the direction as well as
the magnitude of the overall bias of the European bank output index is unclear, our
results indicate that this bias can be sizable and is likely to vary over time and across
countries. We therefore recommend concerted efforts to harmonize the measurement of
bank output across countries.
18
References
Basu, Susanto, Robert Inklaar and J. Christina Wang (2011). “The Value of Risk: Measuring the Services of U.S. Commercial Banks.” Economic Inquiry 49(1): 226–245.
Basu, Susanto and J. Christina Wang (2006).“Technological Progress, ‘Money’ in the Utility Function, and the ‘User Cost of Money.’ ” paper presented at the NBER/CRIW Summer Institute 2006, downloadable at http://www.nber.org/~confer/2006/si2006/prcr/wang.pdf.
Baumol, W. J. (1952). “The Transactions Demand for Cash: An Inventory Theoretic Approach.” Quarterly Journal of Economics 66: 545–556.
Benston, George J. and Clifford W. Smith (1976). “A Transactions Cost Approach to the Theory of Financial Intermediation.” Journal of Finance 31(2): 215–31.
Berger, Allen N. and David B. Humphrey (1997). “Efficiency of Financial Institutions: International Survey and Directions for Future Research.” European Journal of Operational Research 98: 175–212.
Berger, Allen N. and Loretta J. Mester (2003). “Explaining the Dramatic Changes in Performance of U.S. Banks: Technological Change, Deregulation, and Dynamic Changes in Competition.” Journal of Financial Intermediation 12: 57–95.
Black, Fischer and Myron S. Scholes (1973). “The Pricing of Options and Corporate Liabilities.” Journal of Political Economy 81(3): 637–54.
Boyd, John H. and Mark Gertler (1994). “Are Bank Dead? Or Are The Reports Greatly Exaggerated?” Federal Reserve Bank of Minneapolis Quarterly Review 18(3): 2–23.
Brand, Horst and John Duke (1982). “Productivity in Commercial Banking: Computers Spur the Advance.” Monthly Labor Review December: 19–27.
Campbell, Tim S. and William A. Kracaw (1980). “Information Production, Market Signaling, and the Theory of Financial Intermediation.” Journal of Finance 35( 4): 863–82.
Clark, Jeffrey A. and Thomas F. Siems (2002). “X-Efficiency in Banking: Looking beyond the Balance Sheet.” Journal of Money, Credit, and Banking 34(4): 987–1013.
Diamond, Douglas W. (1984). “Financial Intermediation and Delegated Monitoring.” Review of Economic Studies 51(3): 393–414.
Diamond, Douglas W. (1991). “Monitoring and Reputation: The Choice between Bank Loans and Privately Placed Debt.” Journal of Political Economy 99(4): 688–721.
Diewert, W. E. (1974). “Intertemporal Consumer Theory and the Demand for Durables.” Econometrica 42(3): 497–516.
Diewert, W. Erwin (1976). “Exact and Superlative Index Numbers.” Journal of
19
Econometrics 4(2): 115-45.
Diewert, W. Erwin (2010). “The Measurement of Banking Services in the System of National Accounts.” mimeo.
Duffie J.D. (1999). “Credit Swap Valuation.” Financial Analysts Journal 1: 73–85.
Fixler, D. J. and B. R. Moulton (2001). “Comments on the Treatment of Holding Gains and Losses in the National Accounts.” paper for the OECD Meeting of National Accounts Experts, downloadable at http://www.oecd.org/dataoecd/57/56/1909872.pdf.
Fixler, D. J. and M. Reinsdorf (2006). “Computing Real Bank Services.” paper presented at the NBER/CRIW Summer Institute 2006, downloadable at http://www.nber.org/~confer/2006/si2006/prcr/reinsdorf.pdf.
Fixler, D. J. and K. Zieschang (2010). “Deconstructing FISIM: Should Financial Risk Affect GDP?” paper presented at IARIW 2010, downloadable at http://www.iariw.org/papers/2010/4aFixler.pdf.
Greenbaum, S. I. and A. Thakor (1995). Contemporary Banking Theories. Dryden Press, Fort Worth.
Hunter, William C., Stephen G. Timme, and Won Keun Yang (1990). “An Examination of Cost Subadditivity and Multiproduct Production in Large U.S. Banks.” Journal of Money, Credit, and Banking 22 (4): 504–525.
Jagtiani, Julapa, Alli Nathan, and Gordon Sick (1995). “Scale Economies and Cost Complementarities in Commercial Banks: On-and Off-balance-sheet Activities.” Journal of Banking & Finance (19): 1175–89.
James, Christopher (1988). “The Use of Loan Sales and Standby Letters of Credit by Commercial Banks.” Journal of Monetary Economics (22): 395–422.
Leland, H. E. and D. H. Pyle (1977). “Informational Asymmetries, Financial Structure, and Financial Intermediation.” Journal of Finance 32(2): 371–87.
Merton, Robert C. (1974). “On the Pricing of Corporate Debt: The Risk Structure of Interest Rates.” Journal of Finance 29: 449–470.
Mester, Loretta J. (1992). “Traditional and Nontraditional Banking: An Information-Theoretic Approach.” Journal of Banking & Finance 16: 545–66.
Morrison, Alan, (2005). “Credit Derivatives, Disintermediation and Investment Decisions.” Journal of Business 78: 621–647.
Ors, Evren (2004). “Postmortem on the Federal Reserve’s Functional Cost Analysis Program: How Useful Was the FCA?” Review of Financial Economics 13: 121–48.
Rogers, Kevin E. (1998). “Nontraditional Activities and the Efficiency of U.S. Commercial Banks.” Journal of Banking & Finance 22: 467–82.
Sealey, Calvin W. and James T. Lindley (1977). “Inputs, Outputs, and a Theory of
20
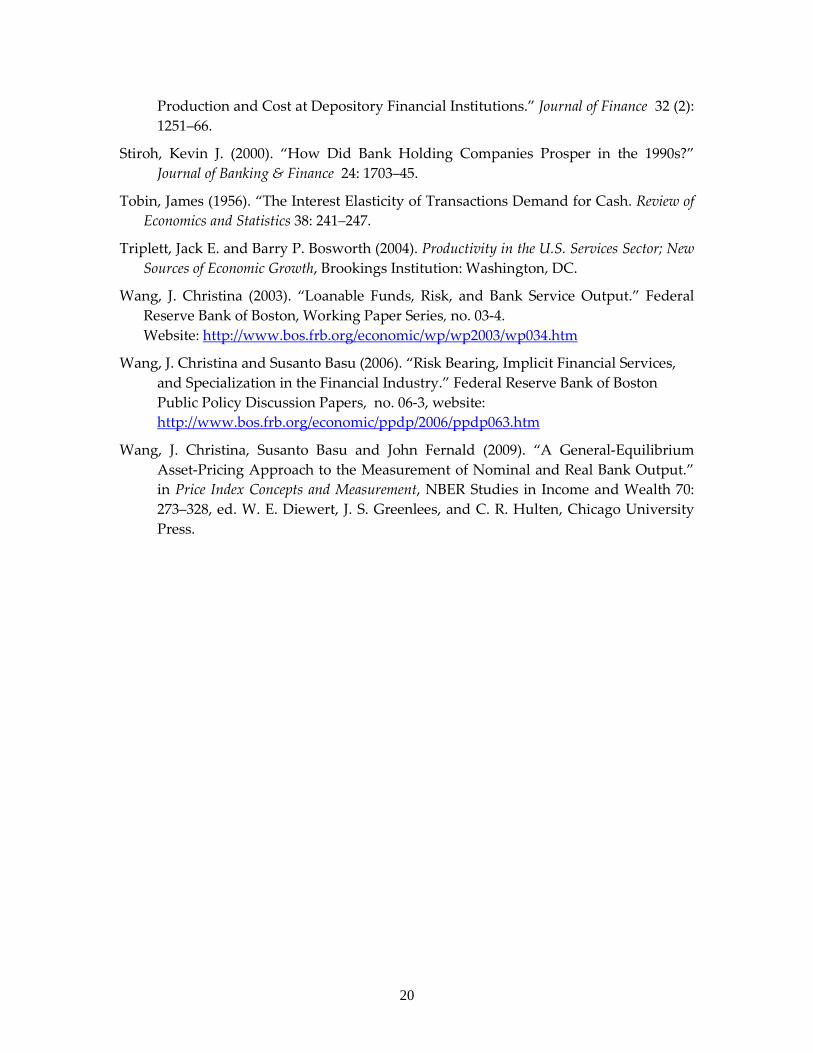
Production and Cost at Depository Financial Institutions.” Journal of Finance 32 (2): 1251–66.
Stiroh, Kevin J. (2000). “How Did Bank Holding Companies Prosper in the 1990s?” Journal of Banking & Finance 24: 1703–45.
Tobin, James (1956). “The Interest Elasticity of Transactions Demand for Cash. Review of Economics and Statistics 38: 241–247.
Triplett, Jack E. and Barry P. Bosworth (2004). Productivity in the U.S. Services Sector; New Sources of Economic Growth, Brookings Institution: Washington, DC.
Wang, J. Christina (2003). “Loanable Funds, Risk, and Bank Service Output.” Federal Reserve Bank of Boston, Working Paper Series, no. 03-4. Website: http://www.bos.frb.org/economic/wp/wp2003/wp034.htm
Wang, J. Christina and Susanto Basu (2006). “Risk Bearing, Implicit Financial Services, and Specialization in the Financial Industry.” Federal Reserve Bank of Boston Public Policy Discussion Papers, no. 06-3, website: http://www.bos.frb.org/economic/ppdp/2006/ppdp063.htm
Wang, J. Christina, Susanto Basu and John Fernald (2009). “A General-Equilibrium Asset-Pricing Approach to the Measurement of Nominal and Real Bank Output.” in Price Index Concepts and Measurement, NBER Studies in Income and Wealth 70: 273–328, ed. W. E. Diewert, J. S. Greenlees, and C. R. Hulten, Chicago University Press.
21
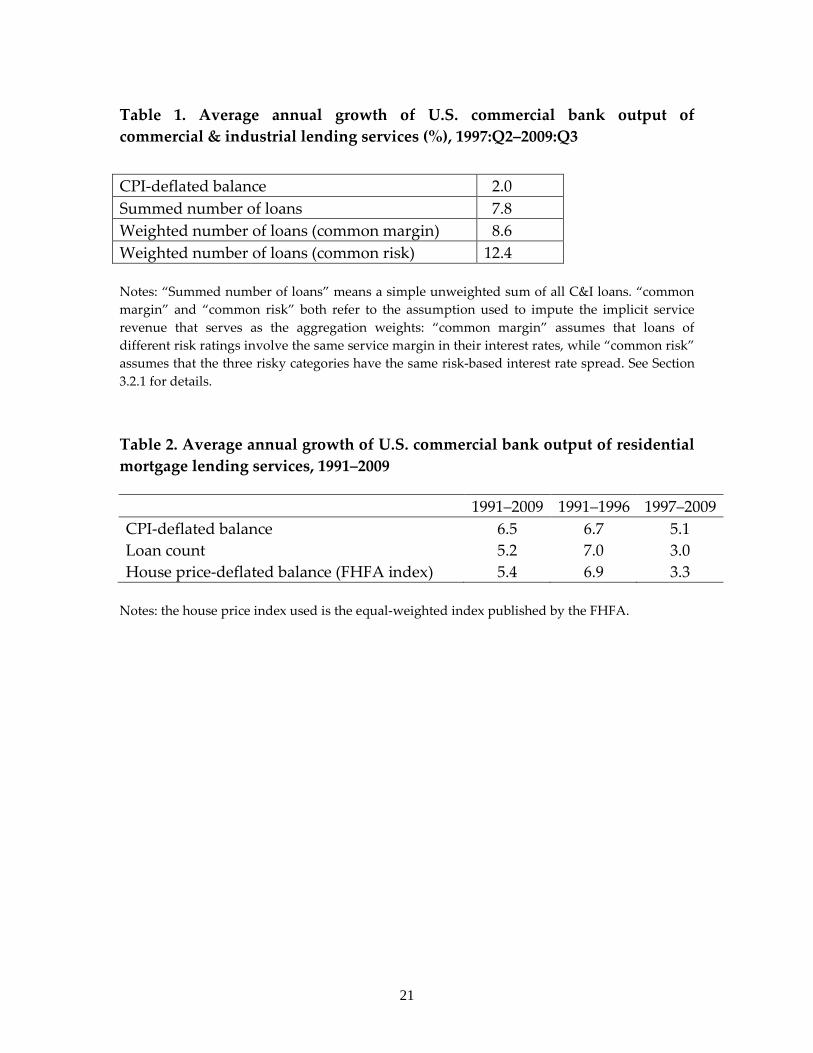
Table 1. Average annual growth of U.S. commercial bank output of commercial & industrial lending services (%), 1997:Q2–2009:Q3
CPI-deflated balance 2.0 Summed number of loans 7.8 Weighted number of loans (common margin) 8.6 Weighted number of loans (common risk) 12.4 Notes: “Summed number of loans” means a simple unweighted sum of all C&I loans. “common margin” and “common risk” both refer to the assumption used to impute the implicit service revenue that serves as the aggregation weights: “common margin” assumes that loans of different risk ratings involve the same service margin in their interest rates, while “common risk” assumes that the three risky categories have the same risk-based interest rate spread. See Section 3.2.1 for details.
Table 2. Average annual growth of U.S. commercial bank output of residential mortgage lending services, 1991–2009 1991–2009 1991–1996 1997–2009 CPI-deflated balance 6.5 6.7 5.1 Loan count 5.2 7.0 3.0 House price-deflated balance (FHFA index) 5.4 6.9 3.3
Notes: the house price index used is the equal-weighted index published by the FHFA.
22
Figure 1. Output indices for U.S. commercial & industrial lending services: deflated balances vs. loan counts, 1997:Q2–2009:Q3 (1997:Q2=100)
Notes: “Summed number of loans” means a simple unweighted sum of all C&I loans. “common margin” and “common risk” both refer to the assumption used to impute the implicit service revenue that serves as the aggregation weights: “common margin” assumes that loans of different risk ratings involve the same service margin in their interest rates, while “common risk” assumes that the three risky categories have the same risk-based interest rate spread. See Section 3.2.1 for details.
23
Figure 2. Output indices for U.S. residential mortgage services: loan counts, CPI-deflated balances, and house price-deflated balances, 1991:Q1–2009:Q4 (1991:Q1=100)
Notes: The house price index used is the equal-weighted index published by the FHFA.
24
Figure 3. Average annual output growth of residential mortgage services in Europe and the United States: CPI-deflated vs. house price-deflated balances, 1995–2009
Figure 4. Output indices for U.S. deposit services: deflated balances vs. alternative transaction counts, 1997–2008 (1997=100)
25
Figure 5. Average annual output growth of transaction services in Europe and the United States: CPI-deflated vs. transaction counts, 2000–2008
26
Appendix Figure A1. Average interest margin on U.S. commercial and industrial loans across risk categories (%), 1997:Q2–2009:Q3
Notes: “inimal,” “low,” “moderate,” and “other” refer to the risk categories. “Common margin” and “common risk” both refer to the assumption used to impute the implicit service revenue that serves as the aggregation weights: “Common margin” assumes that loans of different risk ratings involve the same service margin in their interest rates, while “Common risk” assumes that the three risky categories have the same risk-based interest rate spread. See Section 3.2.1 for details.
27
Appendix Figure A2. Average size of all U.S. commercial and industrial loans, flow vs. stock
Appendix Figure A3. Average annual growth rate of the number of U.S. commercial and industrial loans by type, 1997:Q2–2009:Q3
Notes: “Minimal,” “low,” “moderate” and “other” refer to the risk categories. “Zero interval,” “Daily,” etc. refer to the repricing frequency of the C&I loans.

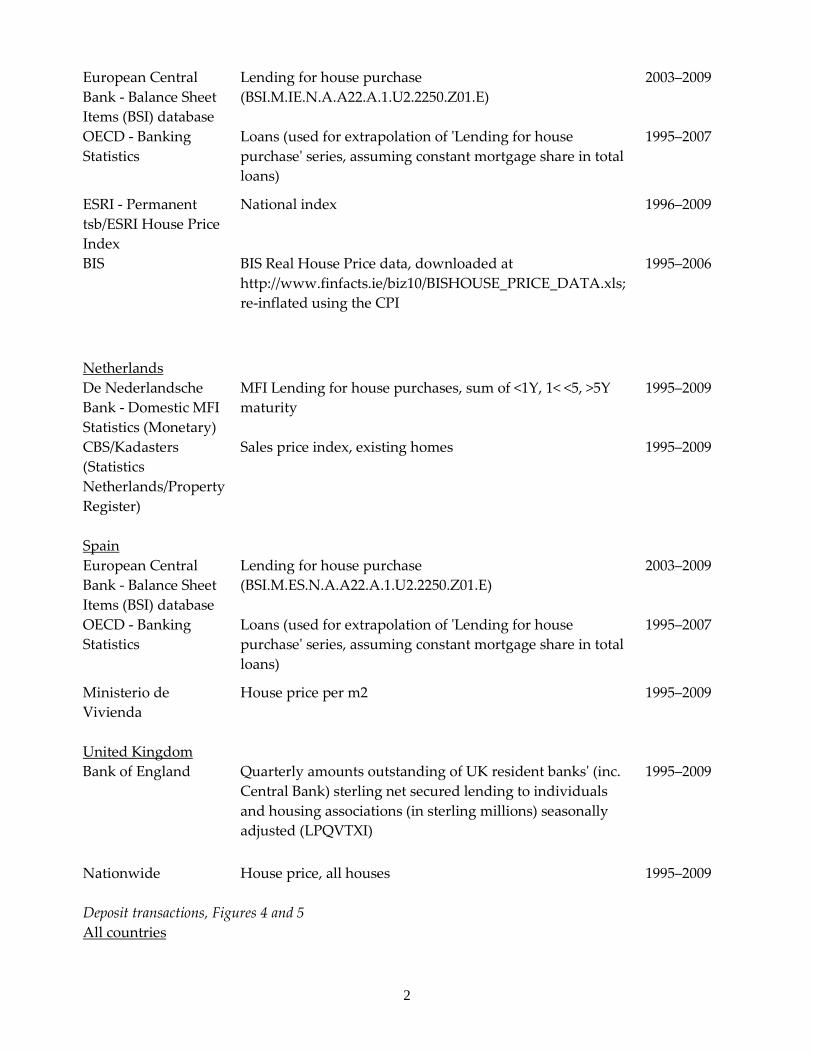
Appendix Table A1. Data sources by bank activity and country
Source Data Period Commercial & Industrial loans - U.S. only, Figure 1, Table 1 Federal Reserve - Survey of Terms of Business Lending
Average loan size, interest rate, average time to maturity; by maturity and risk category
1997:Q2–2009:Q3
Federal Reserve - Commercial Paper
Commercial paper yields 1997:Q2–2009:Q3
FDIC - Report of Condition and Income (Call reports)
Commercial & Industrial loans in domestic offices 1997:Q2–2009:Q3
Residential mortgages, Figures 2 and 3, Table 2 United States FDIC - Report of Condition and Income (Call reports)
Closed-end loans secured by first liens on 1–4 family residential properties in domestic offices
1991:Q1–2009:Q4
FHFA - Monthly Survey of Rates and Terms on Conventional Single-Family Non-farm Mortgage Loans
Historical summary tables on average mortgage size, all homes, all mortgages
1991:Q1–2009:Q4
FHFA - House Price Index
FHFA USA Indexes, seasonally-adjusted purchase-only index (1991:Q1=100)
1991:Q1–2009:Q4
Denmark Danmarks Nationalbank - Balance Sheets and Flows of the MFI Sector
Bank lending to domestic households by purpose and maturity, Households - Housing, extrapolated before July 2000 using total Household loans
1995–2009
Statistics Denmark Price index for sales of property (2006=100) by time and category of real property; transaction-weighted index of one-family houses, weekend cottages and owner-occupied flats
1995–2009
France Banque de France - Monthly Monetary Statistics
Lending by credit institutions to households (stocks) - Housing (MH.M.EC.CREDIT.3.R.1D.HF.T.M.E.B.X)
1995–2009
Insée Price index of existing houses 1996–2009

1
BIS BIS Real House Price data, downloaded at http://www.finfacts.ie/biz10/BISHOUSE_PRICE_DATA.xls; re-inflated using the CPI
1995–2006
Germany European Central Bank - Balance Sheet Items (BSI) database
Lending for house purchase (BSI.M.DE.N.A.A22.A.1.U2.2250.Z01.E)
2003–2009
Bundesbank - Statistical Supplement Banking Statistics
Mortgage loans to domestic enterprises and resident individuals / Total / All categories of banks (PQ3013) (used for extrapolation of 'Lending for house purchase' series, assuming constant individual mortgage share)
1995–2009
OECD - Banking Statistics
Loans (used to bridge time series break in 1998 due to the removal of Trauhandkredite)
1995–2007
Hypoport House price index, hedonic, composite of apartments, new homes and existing homes
1995–2009
DeStatis House price index of new homes and of existing homes (unweighted average of price change)
2000–2008
BIS BIS Real House Price data, downloaded at http://www.finfacts.ie/biz10/BISHOUSE_PRICE_DATA.xls; re-inflated using the CPI
1995–2006
Italy Banca d'Italia - Supplements to the Statistical Bulletin
Bank loans for house purchases, sum of <1Y, 1< <5, >5Y maturity
1998–2009
OECD - Banking Statistics
Loans (used for extrapolation of 'Bank loans for house purchases' series, assuming constant mortgage share in total loans)
1995–2007
Muzzicato, Sabbatini and Zollino
"Prices of residential property in Italy: Constructing a new indicator" Banca d'Italia Occasional papers, no. 17; August 2008
1995–2007
Global Property Guide
Price index from Banca d'Italia and Statistics Italy, data at http://www.globalpropertyguide.com/Europe/Italy/Price-History
2008–2009
Ireland
2
European Central Bank - Balance Sheet Items (BSI) database
Lending for house purchase (BSI.M.IE.N.A.A22.A.1.U2.2250.Z01.E)
2003–2009
OECD - Banking Statistics
Loans (used for extrapolation of 'Lending for house purchase' series, assuming constant mortgage share in total loans)
1995–2007
ESRI - Permanent tsb/ESRI House Price Index
National index 1996–2009
BIS BIS Real House Price data, downloaded at http://www.finfacts.ie/biz10/BISHOUSE_PRICE_DATA.xls; re-inflated using the CPI
1995–2006
Netherlands De Nederlandsche Bank - Domestic MFI Statistics (Monetary)
MFI Lending for house purchases, sum of <1Y, 1< <5, >5Y maturity
1995–2009
CBS/Kadasters (Statistics Netherlands/Property Register)
Sales price index, existing homes 1995–2009
Spain European Central Bank - Balance Sheet Items (BSI) database
Lending for house purchase (BSI.M.ES.N.A.A22.A.1.U2.2250.Z01.E)
2003–2009
OECD - Banking Statistics
Loans (used for extrapolation of 'Lending for house purchase' series, assuming constant mortgage share in total loans)
1995–2007
Ministerio de Vivienda
House price per m2 1995–2009
United Kingdom Bank of England Quarterly amounts outstanding of UK resident banks' (inc.
Central Bank) sterling net secured lending to individuals and housing associations (in sterling millions) seasonally adjusted (LPQVTXI)
1995–2009
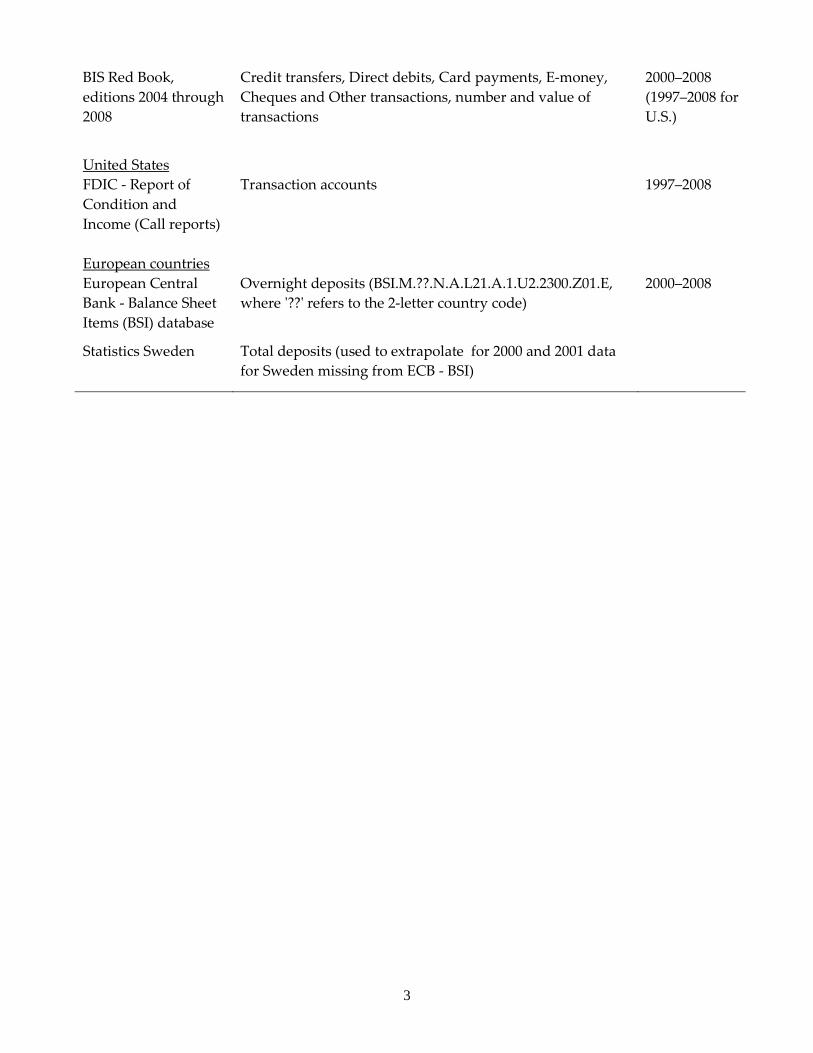
Nationwide House price, all houses 1995–2009 Deposit transactions, Figures 4 and 5 All countries
3
BIS Red Book, editions 2004 through 2008
Credit transfers, Direct debits, Card payments, E-money, Cheques and Other transactions, number and value of transactions
2000–2008 (1997–2008 for U.S.)
United States FDIC - Report of Condition and Income (Call reports)
Transaction accounts 1997–2008
European countries European Central Bank - Balance Sheet Items (BSI) database
Overnight deposits (BSI.M.??.N.A.L21.A.1.U2.2300.Z01.E, where '??' refers to the 2-letter country code)
2000–2008
Statistics Sweden Total deposits (used to extrapolate for 2000 and 2001 data for Sweden missing from ECB - BSI)