Embed Size (px)
Citation preview
Taking stock: what we growtogether countsA practical guide for family farmers and their associations todevelop a planted forest inventory
For more information, please contact:
Forestry – Natural Resources and Sustainable ProductionE-mail: [email protected] address: www.fao.org/forestry/enFood and Agriculture Organization of the United NationsViale delle Terme di Caracalla00153 Rome, Italy
23FORESTRY WORKING
PAPERFAO
21Takin
g sto
ck: wh
at we g
row
tog
ether co
un
ts - A p
ractical gu
ide fo
r family farm
ers and
their asso
ciation
s to d
evelop
a com
mercial tree in
vento
ry tree inven
tory
ISSN
266
4-10
62
CB4905EN/1/06.21
ISBN 978-92-5-134472-9I SSN 2664-1062
9 789251 344729
FOOD AND AGRICULTURE ORGANIZATION OF THE UNITED NATIONSRome, 2021
FORESTRY WORKING PAPER
Taking stock: what we grow together counts
A PRACTICAL GUIDE FOR FAMILY FARMERS AND THEIR ASSOCIATIONS TO DEVELOP A COMMERCIAL PLANTED FOREST INVENTORY
By Benjamin Caldwell, Thomas Gichuru, Marco Boscolo, Lauri Vesa, Jhony Zapata, Sophie Grouwels, Lyndall Bull and Jeffrey Campbell
The designations employed and the presentation of material in this information product do not imply the expression of any opinion whatsoever on the part of the Food and Agriculture Organization of the United Nations (FAO) concerning the legal or development status of any country, territory, city or area or of its authorities, or concerning the delimita-tion of its frontiers or boundaries. The mention of specific companies or products of manufacturers, whether or not these have been patented, does not imply that these have been endorsed or recommended by FAO in preference to others of a similar nature that are not mentioned.The views expressed in this information product are those of the author(s) and do not necessarily reflect the views or policies of FAO.
ISBN 978-92-5-134472-9ISSN 2664-1062E-ISSN 2664-1070
© FAO, 2021
Under the terms of this licence, this work may be copied, redistributed and adapted for non-commercial purposes, provided that the work is appropriately cited. In any use of this work, there should be no suggestion that FAO endorses any specific organization, products or services. The use of the FAO logo is not permitted. If the work is adapted, then it must be licensed under the same or equivalent Creative Commons licence. If a translation of this work is created, it must include the following disclaimer along with the required citation: “This translation was not created by the Food and Agriculture Organization of the United Nations (FAO). FAO is not responsible for the content or accuracy of this translation. The original [Language] edition shall be the authoritative edition.”Disputes arising under the licence that cannot be settled amicably will be resolved by mediation and arbitration as described in Article 8 of the licence except as otherwise provided herein. The applicable mediation rules will be the mediation rules of the World Intellectual Property Organization http://www.wipo.int/amc/en/mediation/rules and any arbitration will be conducted in accordance with the Arbitration Rules of the United Nations Commission on Interna-tional Trade Law (UNCITRAL).Third-party materials. Users wishing to reuse material from this work that is attributed to a third party, such as tables, figures or images, are responsible for determining whether permission is needed for that reuse and for obtaining per-mission from the copyright holder. The risk of claims resulting from infringement of any third-party-owned component in the work rests solely with the user.Sales, rights and licensing. FAO information products are available on the FAO website (www.fao.org/publications) and can be purchased through [email protected]. Requests for commercial use should be submitted via: www. fao.org/contact-us/licence-request. Queries regarding rights and licensing should be submitted to: [email protected]. This publication has been printed using selected products and processes so as to ensure minimal environmental im-pact and to promote sustainable forest management.
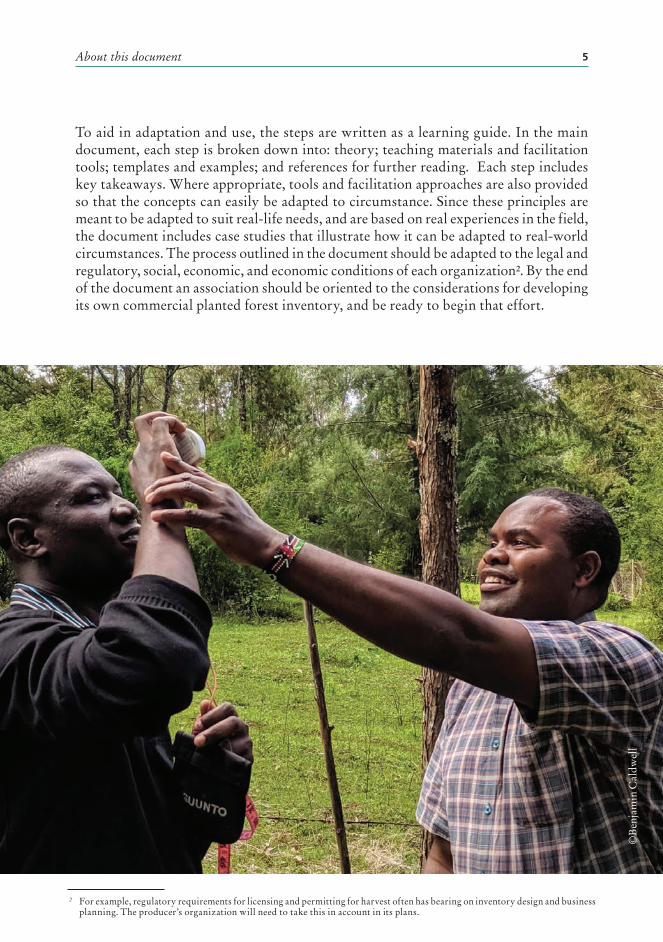
Cover photo: Farm in Nyandarua, Kenya. ©Benjamin Caldwell
Recommended citation:Caldwell, B., Gichuru, T., Boscolo, M., Vesa, L., Zapata, J., Grouwels, S., Bull, L. and Campbell J. 2021. Taking stock: what we grow together counts. A practical guide for family farmers andtheir associations to develop a planted forest inventory. Forestry Working Paper, 23. Rome, FAO.https://doi.org/10.4060/cb4905en
iii
ContentsFAO’s work on planted forests vAbout the Forest and Farm Facility vAcknowledgements vi
About this document 1
Family farming and small and medium enterprises: Their scale and transformational potential 1The purpose of this document 1Organization: what makes it work 2The main audience 3How to use this document 3
1. Producer-led monitoring and stocktaking of trees on farms 7STEP 1 - Identifying the preferred market opportunity for the association 7Introduction 7Decide on parameters for data collection based on market requirements 8STEP 2 - Organizing for data collection 10Introduction 10Teaching Materials and facilitation 14STEP 3 - Implementing a farmer-led inventory 15Introduction 15Tree and compartment measurements 23Analyse the data and turn it into useful information 30STEP 4 - Taking stock and developing your business 33Introduction 33In the long term: grow, adapt and learn 34Templates and examples 35
2. References 37
3. Annexes 39
Annex 1: Slides 39Annex 2: Example flow chart (Gantt) to plan inventory 50Annex 3: Structured plan to include farmers in the inventory;an example from East Africa 51Annex 4: Example: estimation of volume on a farm forest based ona count sample 52Annex 5: Slope correction table 53Annex 6: Example of a field protocol 53
iv
FiguresFigure 1: Each step in the Data-> Action process, and the organizational capacity
needed for each step 3Figure 2: Four steps in achieving business operation at scale, Forest and Farm
Producer Organizations; this document focuses on step 3, producer-led collection of information 4
Figure 3: Facilitation tool, guiding questions in developing a collective business idea 9
Figure 4: Facilitation tool, coming to consensus 10Figure 5: Differentiated contributions to a common goal 11Figure 6: What tools should we use for data collection? 12Figure 7: An example of farm forests next to the Tapytá plantation
(to the right) in southeast Paraguay 16Figure 8: Determining the area of a farm forest using satellite imagery – farm
areas can be determined by drawing polygons in free software be determined by drawing polygons in free software 20
Figure 9: Layout of a sample grid using a drawing or using imagery 21Figure 10: A square plot in a plantation forest 22Figure 11: OpenForis mobile and web-based applications for inventory data
collection and analysis, and satellite imagery analysis 24Figure 12: Tree height calculation in different terrain with a clinometer 27Figure 13: Tree height and stem length classification 28Figure 14: Straightness score: different combinations of log lengths showing
gradual reduction in quality 29Figure 15: The potential of information to support business development 34Figure 16: Learning from results 35
TablesTable 1: Indicative allocation of responsibilities for inventory data collection 12Table 2: Circular plot size based on stocking 22Table 3: Diameter at breast height 25
v
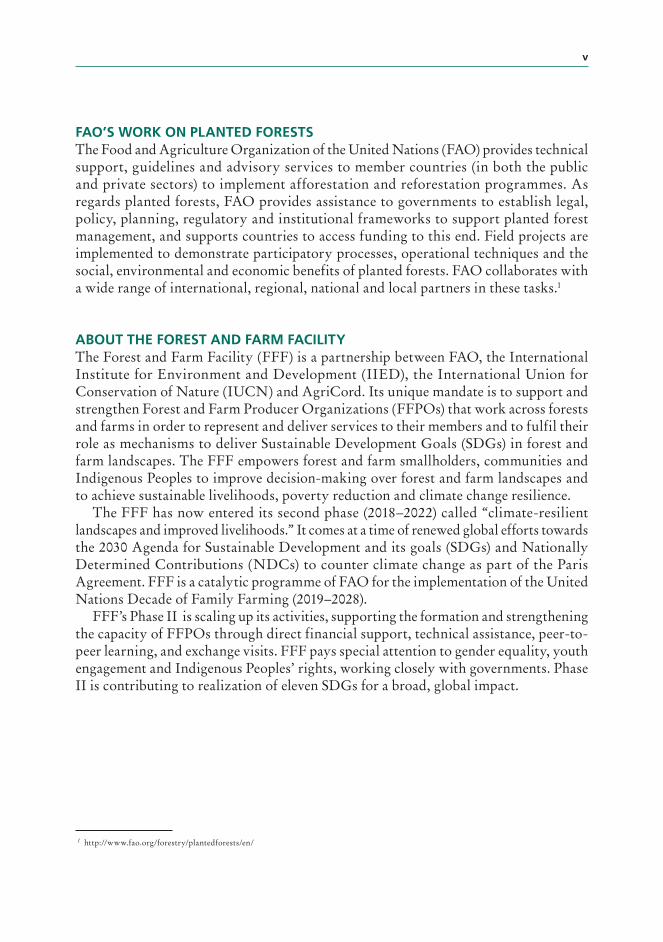
FAO’S WORK ON PLANTED FORESTSThe Food and Agriculture Organization of the United Nations (FAO) provides technical support, guidelines and advisory services to member countries (in both the public and private sectors) to implement afforestation and reforestation programmes. As regards planted forests, FAO provides assistance to governments to establish legal, policy, planning, regulatory and institutional frameworks to support planted forest management, and supports countries to access funding to this end. Field projects are implemented to demonstrate participatory processes, operational techniques and the social, environmental and economic benefits of planted forests. FAO collaborates with a wide range of international, regional, national and local partners in these tasks.1
ABOUT THE FOREST AND FARM FACILITYThe Forest and Farm Facility (FFF) is a partnership between FAO, the International Institute for Environment and Development (IIED), the International Union for Conservation of Nature (IUCN) and AgriCord. Its unique mandate is to support and strengthen Forest and Farm Producer Organizations (FFPOs) that work across forests and farms in order to represent and deliver services to their members and to fulfil their role as mechanisms to deliver Sustainable Development Goals (SDGs) in forest and farm landscapes. The FFF empowers forest and farm smallholders, communities and Indigenous Peoples to improve decision-making over forest and farm landscapes and to achieve sustainable livelihoods, poverty reduction and climate change resilience.
The FFF has now entered its second phase (2018–2022) called “climate-resilient landscapes and improved livelihoods.” It comes at a time of renewed global efforts towards the 2030 Agenda for Sustainable Development and its goals (SDGs) and Nationally Determined Contributions (NDCs) to counter climate change as part of the Paris Agreement. FFF is a catalytic programme of FAO for the implementation of the United Nations Decade of Family Farming (2019–2028).
FFF’s Phase II is scaling up its activities, supporting the formation and strengthening the capacity of FFPOs through direct financial support, technical assistance, peer-to-peer learning, and exchange visits. FFF pays special attention to gender equality, youth engagement and Indigenous Peoples’ rights, working closely with governments. Phase II is contributing to realization of eleven SDGs for a broad, global impact.
1 http://www.fao.org/forestry/plantedforests/en/
vi
©B
enja
min
Cal
dwel
l
Acknowledgements
This paper was only possible because of the contributions of many persons. The authors would like to thank the producers organizations with whom these materials were used and refined and prior work cited in the text, on which this publication built upon.
In addition to the publication's authors, Marco Perri designed the layout and James Varah edited the report. Marguerite France-Lanord coordinated the production of the publication.
Internal reviewers of the report include David Morales, Sheila Wertz-Kanounnikoff, David Kaimowitz, Tiina Vähänen and Mette Løyche Wilkie.
1
About this document
FAMILY FARMING AND SMALL AND MEDIUM ENTERPRISES: THEIR SCALE AND TRANSFORMATIONAL POTENTIAL Smallholder farmers are commonly thought of as farmers who manage two hectares of land or less (Lowder, Sánchez and Bertini, 2019). By some estimates they represent approximately a quarter of the world’s population, and manage half of the world’s arable land; they generate billions of dollars in forest and timber products; most smallholders make around a quarter of their incomes from natural forest and plantations (Verdone, 2018). Collectively, smallholders have the transformative potential to achieve sustainable development and respond to climate change at landscape scales. In order to achieve this collective action, smallholders can and do organize themselves into organizations such as associations and cooperatives, i.e. forest and farm producer organizations (FFPOs). Empowering forest and farm producer organizations will be critical to delivering on the Sustainable Development Goals (SDGs) and Nationally Determined Contributions (NDCs) for mitigating climate change as part of the Paris Agreement.
This document has three main premises: first, that smallholders’ farms are businesses, and the decisions that smallholders make about their farms are primarily based on their expected return on investments. The second premise is that the business of growing trees on farms can increase family farmers’ economic resilience and improve the net environmental impact of family farming. The third premise is that small farmers’ business of growing trees will be more economically successful if they can organize themselves to achieve scale. What follows from these premises is the purpose of this document: supporting producer organizations to collect information on their tree assets (i.e. trees grown on their farms) for commercial purposes. The next section of this document explains this in detail. In order to consider tree farming as a business and begin to think about improved management, farmers need secure land and tree tenure, access to viable production technology, reasonable security against loss, and market demand (Byron, 2001). This document presumes these four prerequisites are in place.
THE PURPOSE OF THIS DOCUMENTStrengthening forest and farm producer organizations and associations so that small farmers achieve scale requires a holistic approach (FAO, 2014). Producer organizations are typically organized around social and political as well as economic objectives. For a producer organization to begin a successful business, it needs to be well organized, have identified a set of products with a viable market, and have a plan to improve and grow its business. This document is designed to overcome a key bottleneck to sustainably
2 Taking stock: what we grow together counts
improve and grow a forest and farm based business: information on the organization’s productive assets.
To expand on this, producer organizations have the potential to demand a better price for the products their members produce, as well as ensuring more stable and predictable prices. Some of the ways they do this include: aggregation of products from many small farmers; sorting and grading; ensuring timely delivery and professionalism of orders and sales; and through value addition and upgrading of production. Producer organizations can also add value for their members by making investments that only make sense when you have a minimum scale of production, such as investments in equipment, infrastructure, strategies, targeted services and know-how. Moreover, producer organizations are effective agents for advocacy, ensuring a role for small and medium farmers in public programs (e.g. for compensation for ecosystem services). None of this potential can be realized, however, if the producer association does not have reliable information on what its members produce. Individually, farmers usually have a good sense of their products and services, as well as their farm and household economy. Without collective data, however, their producer association cannot easily bulk its produce to sell in volume, organize its production to improve quality and reliability of delivery, develop a joint marketing and collective bargaining plan or build a financeable business case for investment in value addition. Without that information, the association certainly cannot articulate the value of public goods that trees on farms provide. In short, stocktaking and monitoring of assets and production is necessary (but not sufficient) for a producer association’s success in business.
Organization: what makes it workTo scale up from single farmers or small enterprises operating autonomously, associations interested in doing business at scale must improve their organizational capacity (Rocchigiani and Herbel, 2012). Organizational capacity includes governance structures, human resources, assets and capital. Organizational capacity also includes the ability to manage resources and relationships. If an association wishes to be able to manage a business at scale, it needs to be able to collect, process and use information that informs actions taken for its business.
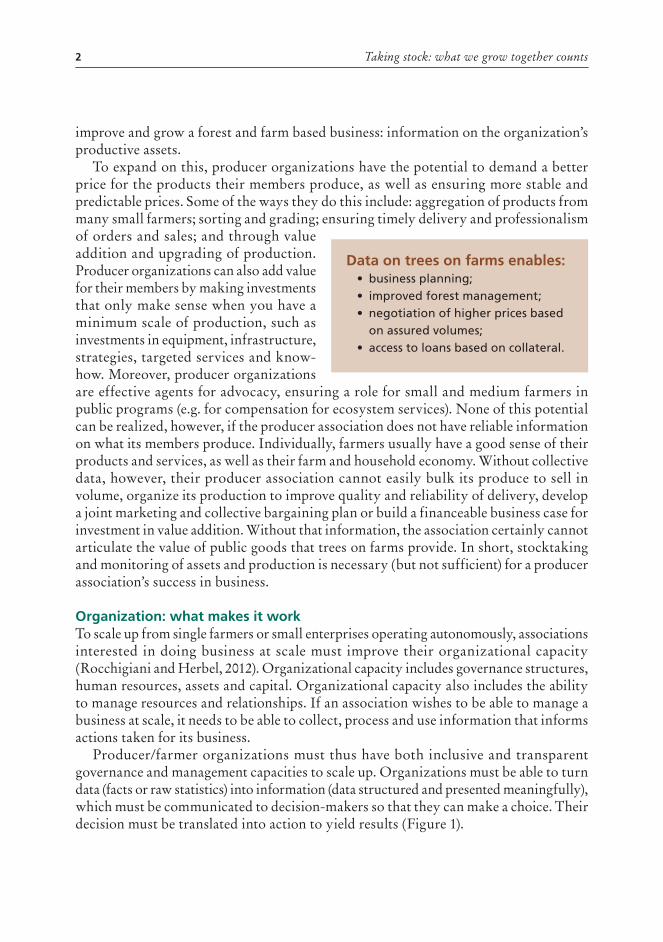
Producer/farmer organizations must thus have both inclusive and transparent governance and management capacities to scale up. Organizations must be able to turn data (facts or raw statistics) into information (data structured and presented meaningfully), which must be communicated to decision-makers so that they can make a choice. Their decision must be translated into action to yield results (Figure 1).
Data on trees on farms enables:• business planning;• improved forest management;• negotiation of higher prices based
on assured volumes;• access to loans based on collateral.
About this document 3
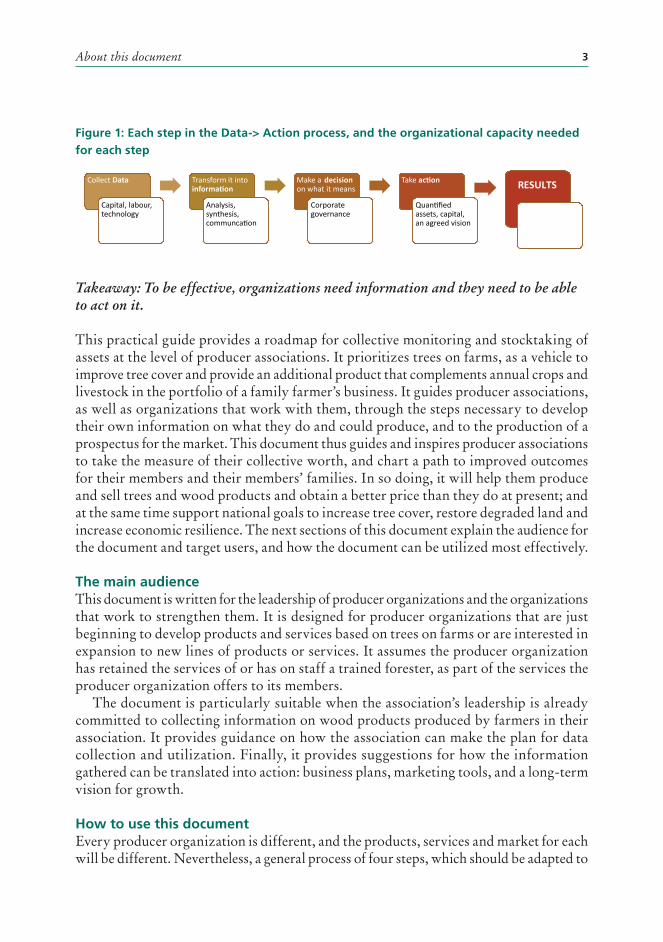
Figure 1: Each step in the Data-> Action process, and the organizational capacity needed for each step
Takeaway: To be effective, organizations need information and they need to be able to act on it.
This practical guide provides a roadmap for collective monitoring and stocktaking of assets at the level of producer associations. It prioritizes trees on farms, as a vehicle to improve tree cover and provide an additional product that complements annual crops and livestock in the portfolio of a family farmer’s business. It guides producer associations, as well as organizations that work with them, through the steps necessary to develop their own information on what they do and could produce, and to the production of a prospectus for the market. This document thus guides and inspires producer associations to take the measure of their collective worth, and chart a path to improved outcomes for their members and their members’ families. In so doing, it will help them produce and sell trees and wood products and obtain a better price than they do at present; and at the same time support national goals to increase tree cover, restore degraded land and increase economic resilience. The next sections of this document explain the audience for the document and target users, and how the document can be utilized most effectively.
The main audienceThis document is written for the leadership of producer organizations and the organizations that work to strengthen them. It is designed for producer organizations that are just beginning to develop products and services based on trees on farms or are interested in expansion to new lines of products or services. It assumes the producer organization has retained the services of or has on staff a trained forester, as part of the services the producer organization offers to its members.
The document is particularly suitable when the association’s leadership is already committed to collecting information on wood products produced by farmers in their association. It provides guidance on how the association can make the plan for data collection and utilization. Finally, it provides suggestions for how the information gathered can be translated into action: business plans, marketing tools, and a long-term vision for growth.
How to use this documentEvery producer organization is different, and the products, services and market for each will be different. Nevertheless, a general process of four steps, which should be adapted to
Collect Data
Capital, labour, technology
Transform it into information
Analysis, synthesis, communcation
Make a decisionon what it means
Corporate governance
Take action
Quantified assets, capital, an agreed vision
RESULTS
4 Taking stock: what we grow together counts
circumstance, are useful for all (Figure 2). They are that the producer association should:1. develop the association’s business idea and identify the information needed for
business planning and improvement;2. allocate responsibilities for data collection based on the association’s organization; 3. develop an association-led inventory and information base; and4. develop an evidenced business plan and set of products and services based on the
inventory information.A brief introduction to each of these steps is provided in this document to orient a
casual reader to the considerations for each. These sections are primarily intended to ensure the preconditions for use of this manual (steps 1 and 2) have been addressed, and that the inventory and data collection is designed to inform a business plan (step 4). Thus:
• in case an organization is in step one of this process, it is advised to consult ForBInc: Forest Business Incubation toolkit by and for Forest and Farm Producer Organizations (Bolin et al., 2018);
• for step two of this process, it may be useful for the organization to consult FAO’s MA&D: Market Analysis & Development toolkit (Lecup, Nicholson and Grouwels, 2011);
• after using this document, readers may wish to consult the companion guide, Turning forest restoration into a sustainable business: A guide to developing bankable business plans. (Boscolo, Lehtonen and Pra, 2021).
This document’s focus however, is on the third step, the collection of inventory and its analysis to inform business planning and development.
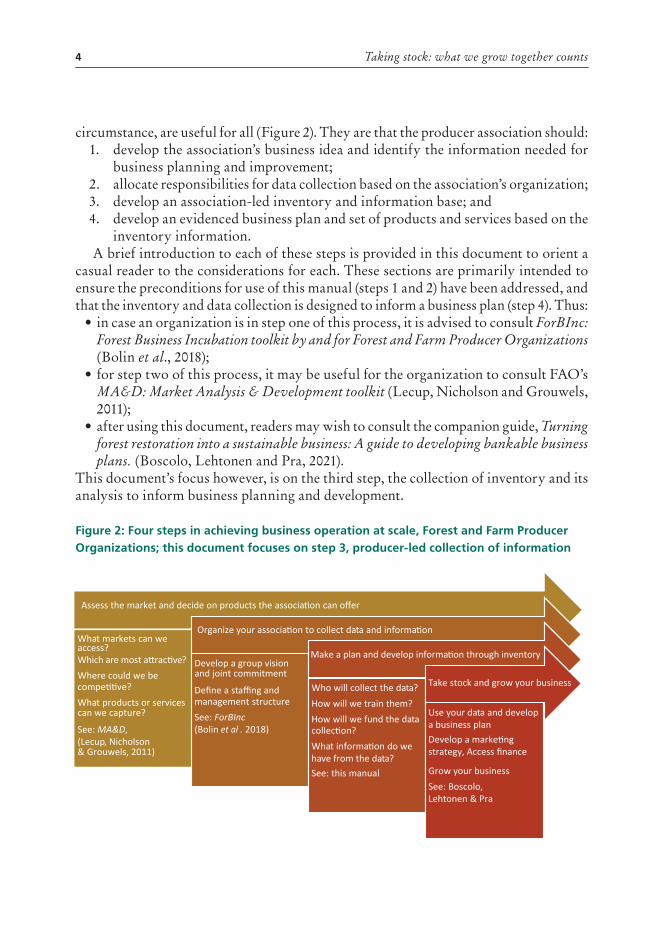
Figure 2: Four steps in achieving business operation at scale, Forest and Farm Producer Organizations; this document focuses on step 3, producer-led collection of information
Assess the market and decide on products the association can offer
What markets can weaccess?Which are most attractive?Where could we be competitive? What products or servicescan we capture?
See: MA&D, (Lecup, Nicholson & Grouwels, 2011)
Organize your association to collect data and information
Develop a group visionand joint commitment
Define a staffing and management structureSee: ForBInc(Bolin et al . 2018)
Make a plan and develop information through inventory
Who will collect the data?How will we train them?How will we fund the data collection?What information do wehave from the data? See: this manual
Take stock and grow your business
Use your data and developa business plan Develop a marketingstrategy, Access finance
Grow your businessSee: Boscolo,Lehtonen & Pra
About this document 5
To aid in adaptation and use, the steps are written as a learning guide. In the main document, each step is broken down into: theory; teaching materials and facilitation tools; templates and examples; and references for further reading. Each step includes key takeaways. Where appropriate, tools and facilitation approaches are also provided so that the concepts can easily be adapted to circumstance. Since these principles are meant to be adapted to suit real-life needs, and are based on real experiences in the field, the document includes case studies that illustrate how it can be adapted to real-world circumstances. The process outlined in the document should be adapted to the legal and regulatory, social, economic, and economic conditions of each organization2. By the end of the document an association should be oriented to the considerations for developing its own commercial planted forest inventory, and be ready to begin that effort.
©B
enja
min
Cal
dwel
l
2 For example, regulatory requirements for licensing and permitting for harvest often has bearing on inventory design and business planning. The producer’s organization will need to take this in account in its plans.

6 Taking stock: what we grow together counts
©B
enja
min
Cal
dwel
l
7
1. Producer-led monitoring and stocktaking of trees on farms
Key concepts: identification of vital data to collect based on the association’s business idea
STEP 1 - Identifying the preferred market opportunity for the associationThis document is for producer associations interested in a commercial planted forest inventory for a business based on wood products in demand by the market. Wood product markets are heterogeneous, and associations can offer many types of products to the market. In order to be efficient, before beginning an inventory, the association should identify the principal set of products it would like to offer; and it should determine the indicators of quality or quantity that determines price in the marketplace. Next, it should also identify any other key information relevant for planning its business operations. Based on this preliminary assessment, the data to be collected in an inventory can be determined. Once the inventory is collected and processed, the association can re-evaluate and improve its assessment of products it can offer to the market (see Step 4, Taking stock and developing your business).
Introduction
Goal: decide on a starting point for data collection
Since data collection for a business has the purpose of supporting actionable decisions, the focus of an early effort in a producer-led inventory should be to improve a producer organization’s value proposition:
1. for a product or service in which it has a demonstrated capacity; 2. in a market from which there is known demand; and3. in a market to which the association has access.
Likely candidate businesses are associated with products or services that farmers in the association produce individually. The experiences of the members will inform the choice of the association about what business they wish to develop collectively. For example, an association of farmers who are selling their trees individually to private buyers might aim to form an association that aggregates, grades, and resells graded timber wholesale.In planning for data collection, the major components of the plan will often be:
1. a market assessment, to determine the prices of the selected product, and the specifications that influence the price that can be demanded (see Table 1); and
8 Taking stock: what we grow together counts
2. the measurements that must be obtained to determine the current stocks and potential future supply of the selected product that producers have.
Decide on parameters for data collection based on market requirementsWhen deciding on what data to collect, a natural inclination is to collect all potentially useful information. Balance this with the consideration that data collection requires resources, and collecting additional measurements in a survey requires additional time and money. Therefore, the inventory data should be for a core set of parameters relevant in the marketplace on the products the association selects, accompanied by information on the farmer producing or owning those products. For example, the most basic inventory might include a sample of tree diameters from each farm, as well as the location and contact information of the farmer who owns the trees.
In addition to these core products and markets that are the focus of the effort, it may be cost-effective to collect a little additional information that is relevant for planning the association’s future business offerings. For example, the survey given to farmers might ask them how much additional land they would have available for planting trees if the association could offer them a higher price for their timber (if the association is interested in functioning as an aggregator or wholesaler of timber and increasing volumes). Or it might ask if the farmer has access to improved planting material (if the association is interested in opening a nursery).
Whatever the case, data collected should be relevant or potentially relevant for the association’s current or future businesses. And the volume and type of parameters should be practicable for the association to collect itself.
For example, an association interested in selling transmission poles to markets in east Africa would need to collect basic information on species type, straightness of the tree’s bole, and tree diameter. It would not need to collect detailed species information or necessarily directly measure the height of the tree. On the other hand, an association interested in selling trees for veneer would need to collect information on trees marketable for veneer, and on the branch or defect-free length of bole on marketable trees.
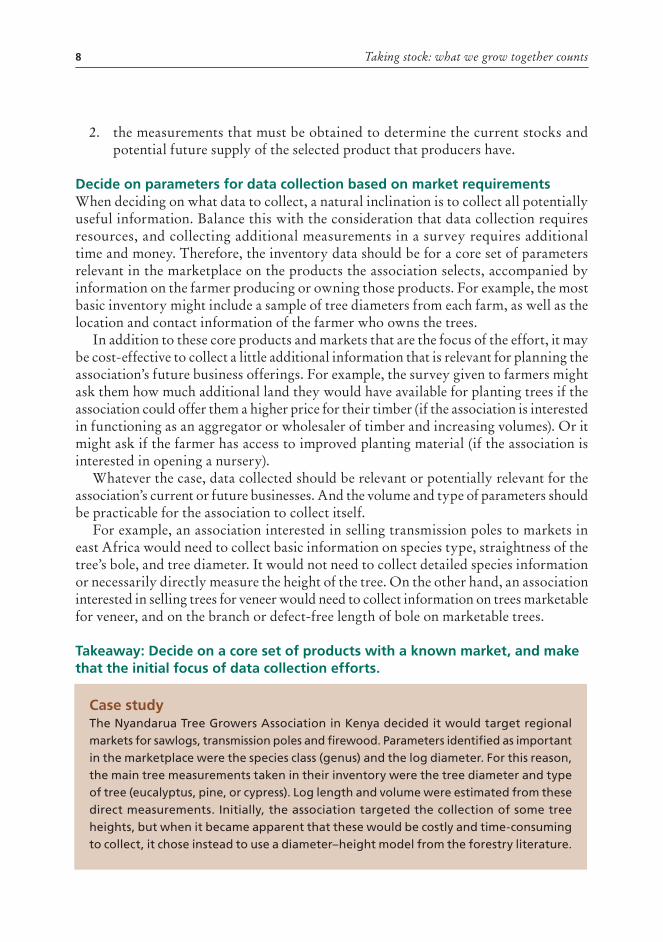
Takeaway: Decide on a core set of products with a known market, and make that the initial focus of data collection efforts.
Case studyThe Nyandarua Tree Growers Association in Kenya decided it would target regional markets for sawlogs, transmission poles and firewood. Parameters identified as important in the marketplace were the species class (genus) and the log diameter. For this reason, the main tree measurements taken in their inventory were the tree diameter and type of tree (eucalyptus, pine, or cypress). Log length and volume were estimated from these direct measurements. Initially, the association targeted the collection of some tree heights, but when it became apparent that these would be costly and time-consuming to collect, it chose instead to use a diameter–height model from the forestry literature.
Producer-led monitoring and stocktaking of trees on farms 9
Teaching materials and facilitation
Facilitating1. Before the meeting, establish the purpose of the inventory with the association.2. Introduce the approach to producer-led inventory and inventory generation, and
give an overview of the process. 3. Establish what parameters are relevant in the marketplace for the tree and wood
products that are of interest to the association.4. Establish what other information would support the association’s business planning
and development.5. Generate a list of parameters at the tree level and farm level for inclusion in the
inventory.
SlidesFor slides, see Annex 1, p. 39
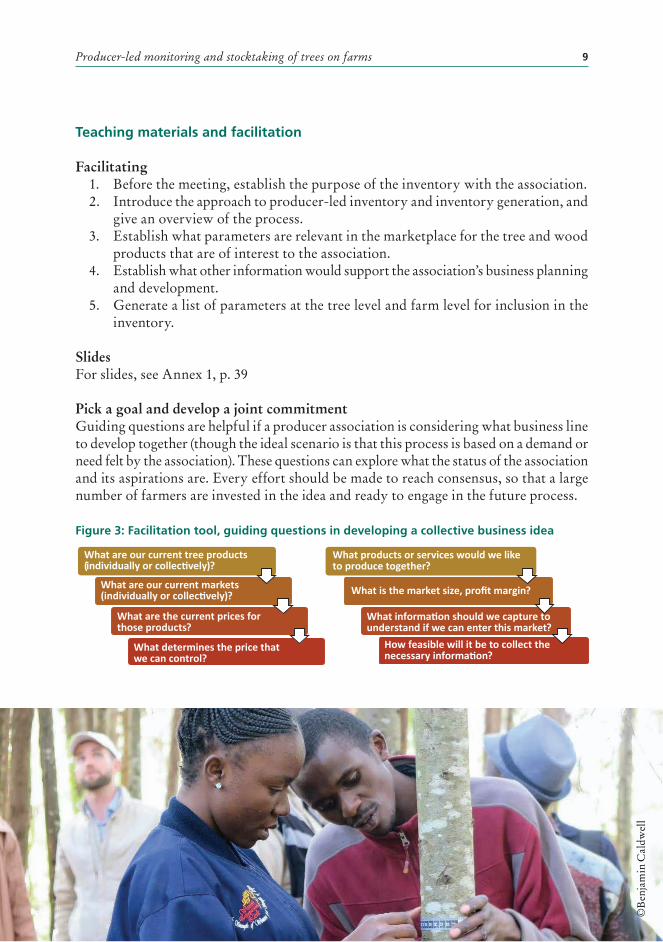
Pick a goal and develop a joint commitmentGuiding questions are helpful if a producer association is considering what business line to develop together (though the ideal scenario is that this process is based on a demand or need felt by the association). These questions can explore what the status of the association and its aspirations are. Every effort should be made to reach consensus, so that a large number of farmers are invested in the idea and ready to engage in the future process.
Figure 3: Facilitation tool, guiding questions in developing a collective business idea
What are our current tree products (individually or collectively)?
What are our current markets (individually or collectively)?
What are the current prices forthose products?
What determines the price thatwe can control?
What products or services would we like to produce together?
What is the market size, profit margin?
What information should we capture tounderstand if we can enter this market?
How feasible will it be to collect thenecessary information?
©B
enja
min
Cal
dwel
l
10 Taking stock: what we grow together counts
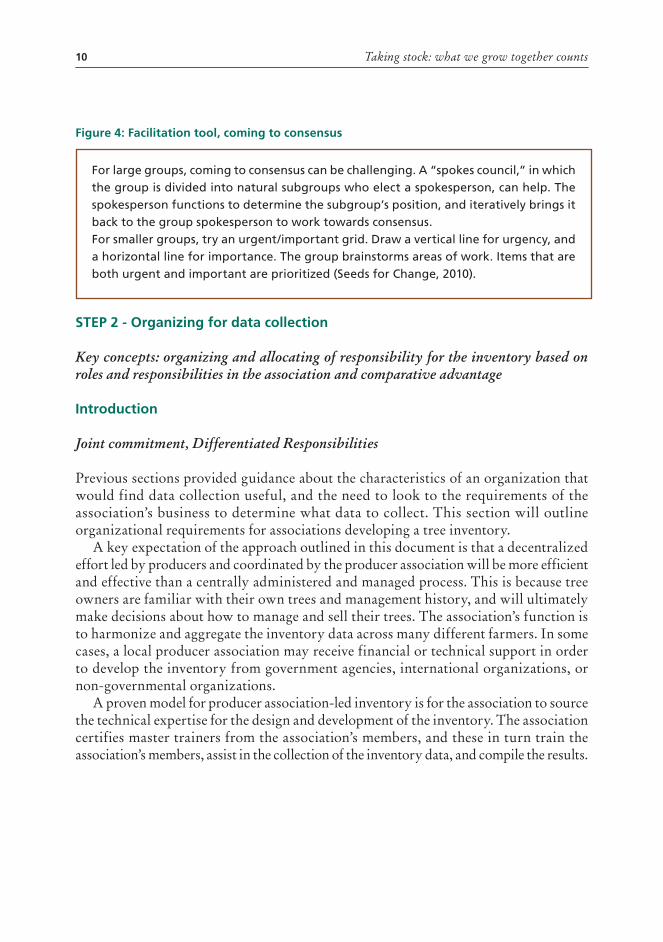
Figure 4: Facilitation tool, coming to consensus
STEP 2 - Organizing for data collection
Key concepts: organizing and allocating of responsibility for the inventory based on roles and responsibilities in the association and comparative advantage
Introduction
Joint commitment, Differentiated Responsibilities
Previous sections provided guidance about the characteristics of an organization that would find data collection useful, and the need to look to the requirements of the association’s business to determine what data to collect. This section will outline organizational requirements for associations developing a tree inventory.
A key expectation of the approach outlined in this document is that a decentralized effort led by producers and coordinated by the producer association will be more efficient and effective than a centrally administered and managed process. This is because tree owners are familiar with their own trees and management history, and will ultimately make decisions about how to manage and sell their trees. The association’s function is to harmonize and aggregate the inventory data across many different farmers. In some cases, a local producer association may receive financial or technical support in order to develop the inventory from government agencies, international organizations, or non-governmental organizations.
A proven model for producer association-led inventory is for the association to source the technical expertise for the design and development of the inventory. The association certifies master trainers from the association’s members, and these in turn train the association’s members, assist in the collection of the inventory data, and compile the results.
For large groups, coming to consensus can be challenging. A “spokes council,” in which the group is divided into natural subgroups who elect a spokesperson, can help. The spokesperson functions to determine the subgroup’s position, and iteratively brings it back to the group spokesperson to work towards consensus.For smaller groups, try an urgent/important grid. Draw a vertical line for urgency, and a horizontal line for importance. The group brainstorms areas of work. Items that are both urgent and important are prioritized (Seeds for Change, 2010).
Producer-led monitoring and stocktaking of trees on farms 11
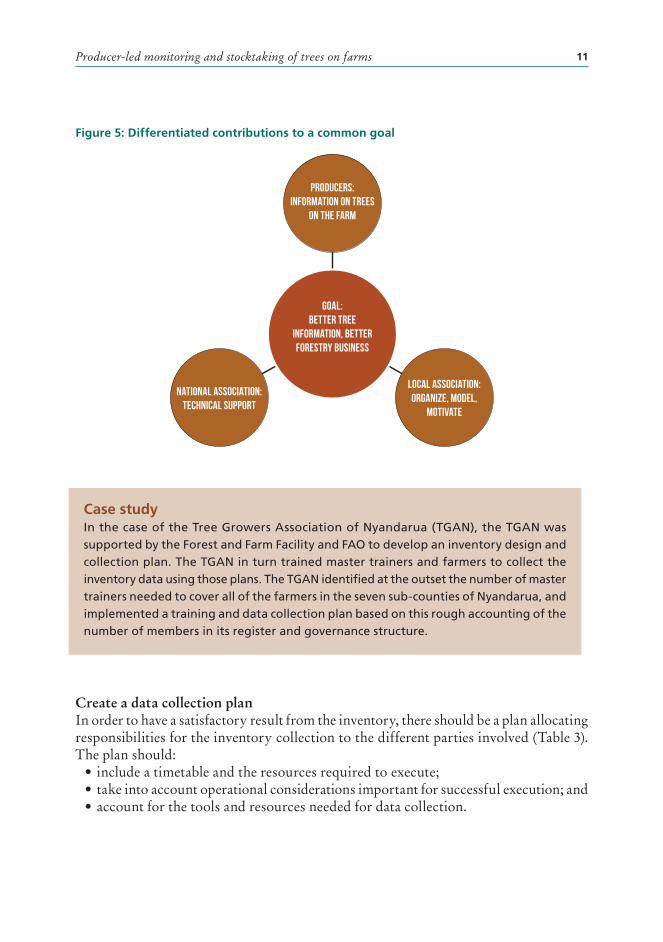
Figure 5: Differentiated contributions to a common goal
Create a data collection planIn order to have a satisfactory result from the inventory, there should be a plan allocating responsibilities for the inventory collection to the different parties involved (Table 3). The plan should:
• include a timetable and the resources required to execute; • take into account operational considerations important for successful execution; and • account for the tools and resources needed for data collection.
Producers: information on trees
on the farm
Goal:better tree
information, better forestry business
Local association: organize, model,
motivate
National association:technical support
Case studyIn the case of the Tree Growers Association of Nyandarua (TGAN), the TGAN was supported by the Forest and Farm Facility and FAO to develop an inventory design and collection plan. The TGAN in turn trained master trainers and farmers to collect the inventory data using those plans. The TGAN identified at the outset the number of master trainers needed to cover all of the farmers in the seven sub-counties of Nyandarua, and implemented a training and data collection plan based on this rough accounting of the number of members in its register and governance structure.
12 Taking stock: what we grow together counts
Table 1: Indicative allocation of responsibilities for inventory data collection
Entity Responsibility
Producers
• Participate in the selection of the business model • Participate in the design of the inventory• Participate in the training on inventory data collection• Collect inventory data and provide it to the association
Producer associations
• Develop the business model• Source technical support as needed• Source master trainers for the inventory• Lead data collection• Lead data compilation
Technical resource organizations & national organizations
• Design inventory and lead the training of master trainers• Support the data analysis and write-up• Support business plan development
Takeaway: Establish logical partners with common interest in data collection and use, and with an interest in doing business; each partner should be involved based on its comparative advantage.
The plan should be realistic, time-bound, and include built-in mechanisms for accountability and quality control.
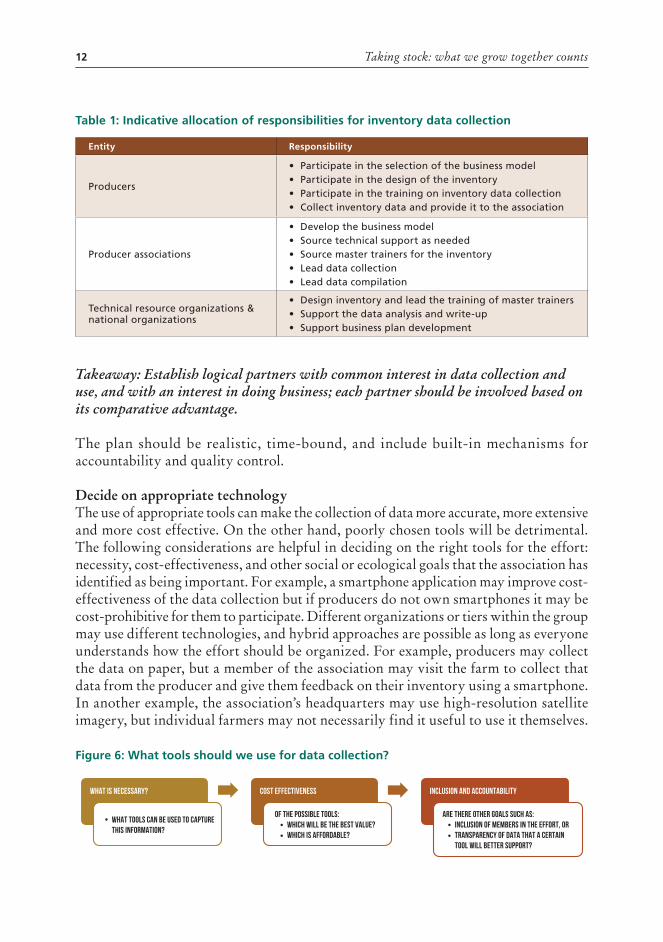
Decide on appropriate technologyThe use of appropriate tools can make the collection of data more accurate, more extensive and more cost effective. On the other hand, poorly chosen tools will be detrimental. The following considerations are helpful in deciding on the right tools for the effort: necessity, cost-effectiveness, and other social or ecological goals that the association has identified as being important. For example, a smartphone application may improve cost-effectiveness of the data collection but if producers do not own smartphones it may be cost-prohibitive for them to participate. Different organizations or tiers within the group may use different technologies, and hybrid approaches are possible as long as everyone understands how the effort should be organized. For example, producers may collect the data on paper, but a member of the association may visit the farm to collect that data from the producer and give them feedback on their inventory using a smartphone. In another example, the association’s headquarters may use high-resolution satellite imagery, but individual farmers may not necessarily find it useful to use it themselves.
Figure 6: What tools should we use for data collection?
What is necessary?
• What tools can be used to capturethis information?
Cost effectiveness
••
which will be the best value? which is affordable?
Inclusion and accountability
Of the possible tools:••
inclusion of members in the effort, ortransparency of data that a certaintool will better support?
Are there other goals such as:
Producer-led monitoring and stocktaking of trees on farms 13
Create a training plan The demands of the data collection or analysis will likely require some training of those involved in the effort. This can be, for example, by training master trainers who can then train producers. The training needs, time and resources must be identified as part of the planning effort. Trainers and trainees must also be identified.
Create a data analysis planOnce the data is collected, compilation and analysis of the data by the producer organization will be necessary to turn it into information. The required time and resources should be factored into the plan. In addition to this, an understanding of what is possible through analysis and through existing information will be of help in designing the data collection (e.g. using heights that are modeled rather than directly measured). For example, it may not be necessary to collect all measurements if they can be accurately modelled from a sample of measurements from data collection. Or, national or regional data may be publicly available that can assist in extrapolating the necessary information from sample (e. g. an initial estimate of growth and yield based on species, stocking, age, and basal area).
Create a training plan The demands of the data collection or analysis will likely require some training of those involved in the effort. This can be, for example, by training master trainers who can then train producers. The training needs, time and resources must be identified as part of the planning effort. Trainers and trainees must also be identified.
Create a data analysis planOnce the data is collected, analysis will be necessary to turn it into information. The required time and resources should be factored into the plan. In addition to this, an understanding of what is possible through analysis and through existing information will be of help in designing the data collection. For example, it may not be necessary to collect all measurements if they can be accurately modelled from a sample of measurements from data collection. Or, national or regional data may be publicly available that can assist in extrapolating the necessary information from a sample. In a final example, it may be important to take additional measurements in the field – if tree growth over time is desired, it will require collection of more data than simple tree volume.
Allocate Responsibilities The allocation of responsibilities should be based on the comparative advantage of each organization involved in the effort. There must be a mechanism for accountability of progress and outputs (such as a flow chart of the inputs and outputs of each organization’s efforts, and a mechanism to update each other on progress (see Annex 2: Example Flow chart (Gantt) to plan inventory).
14 Taking stock: what we grow together counts
Collect the inventory data based on the plan, adapting it as necessaryOnce a plan is in place, the organizations should also expect that adjustments will need to be made during implementation of the plan. There should be clear expectations, lines of communication, and mechanisms in place to allow the needed corrections to be made by consensus during the effort.
Takeaway: A realistic plan based on the right expertise, and a process for adaptive management, are critical for the success of the effort.
See Annex 2:Example Flow chart (Gantt) to plan inventory for an example of a timeline for a producer-led inventory.
See Annex 3: Structured plan to include farmers in the inventory; an example from East Africa of a plan to include farmers in the inventory.
Teaching Materials and facilitation
Facilitating1. Before beginning the session, establish an understanding of the association’s
governance structure and organization.2. Open the session with an explanation of a decentralized, farmer-led inventory.3. Provide a template of the main responsibilities for data collection and invite
brainstorming about additional considerations.4. Invite participants to outline the parties’ responsibility for data collection.5. Develop a timeline and plan for data collection (in a smaller group as necessary).
SlidesSee Annex 1, p. 39
Facilitation toolStart by calling on the group to brainstorm tasks. Write them down on cards or sticky notes. Then create a timeline. Place the cards on the timeline according to the logical sequence required. Use coloured dots on the tasks to indicate who is responsible.
Producer-led monitoring and stocktaking of trees on farms 15
STEP 3 - Implementing a farmer-led inventory
Key concepts: technical considerations in inventory design and tree measurements
IntroductionPrior sections of this document dealt primarily with the purpose and the organization necessary to implement a producer-led forest inventory. This section is more technical, and orients the reader to the design of a forest inventory3 and the collection of the selected measurements. The goal is to make the exercise of farmer-led inventory as straightforward as possible, making clear the trade-offs between the level of effort required and the quality of the results from the inventory. To be able to utilize the material in this section readers are expected to have some familiarity with tree measurements and forest inventory, as well as exposure to statistics and sampling.
A very brief introduction to considerations for farm forest inventoryThe purpose of commercial forest inventory is to estimate parameters like growing stock, basal area and species composition of a forest. These are used to estimate commercial volumes in the present and future. Since it is often not practical to measure every part of every piece of vegetation in a forest, representative measurements of certain key properties of the forest and its vegetation (the sample) are used to derive estimates for the forest we are interested in (the population). In some cases, where it is not too costly to measure all trees, a tree census may be possible. In others, it is advantageous to measure a sample. Both possibilities are covered in this step (#3).
When sampling trees in a forest or on a farm, representative means collection of the sample so that the probability that any given tree (sampling unit) in a forest will be included is known. This allows us to estimate parameters of interest in the forest with a known degree of assurance. To do this, we must define what it is we wish to make estimates about, defining our population – this can be by delineating the boundaries of that forest on a map or GIS, or by restricting the population to the forest on one person’s farm if those boundaries, and thus the size of the planted forest area, are known. Or, the population could be all of the farms owned by the association’s farmers. If we wished, we could further restrict the population – for example, to all trees above a certain diameter, or to certain species. These boundaries tell us our population and make it clear what we are estimating. Second, we must take the sample of the population in an unbiased way, and know how the sample is to be selected – this gives us the sampling frame. Unbiased means that the sample represents the whole population and not only certain parts of it. The sampling frame is how we will select individuals (sampling units) in the population for sampling, so we know the chances that any given individual will
3 For additional information on the topic of measurements for farm foresters, the reader may consult Abed and Stephens, 2003. For an introduction to classic forest measurements and estimation, see van Laar and Akça, 2007 as well as the annexes of the freely available manual by FAO for integrated field data collection (FAO, 2008), while for an introduction to open-source tools for forest data analysis readers may consult Robinson and Hamann, 2012 and the OpenForis toolset. For an overview of the principles of sampling with worked examples, see Lohr, 2010.
16 Taking stock: what we grow together counts
be selected for sampling. For example, in a planted forest we could first record the total number of trees and then systematically measure every 100th tree in the population, or set up plots within the forest with a random centre point and set radius. If we do this, we can be assured that our sample will be representative and unbiased; and with the help of a correct estimation method, we will be able to know how close to the true value of the population our sample’s estimates are.4 If the sample is correctly designed, then as the number of individuals in a given population included in the sample increases, the level of assurance about the estimate increases. In order to increase the level of assurance of the estimate without increasing the cost of sampling, if possible, populations are divided into similar subgroups (strata or management compartments) and estimates are developed for each subgroup. This is particularly recommended for areas with different species compositions, ages, management approaches, or site qualities.
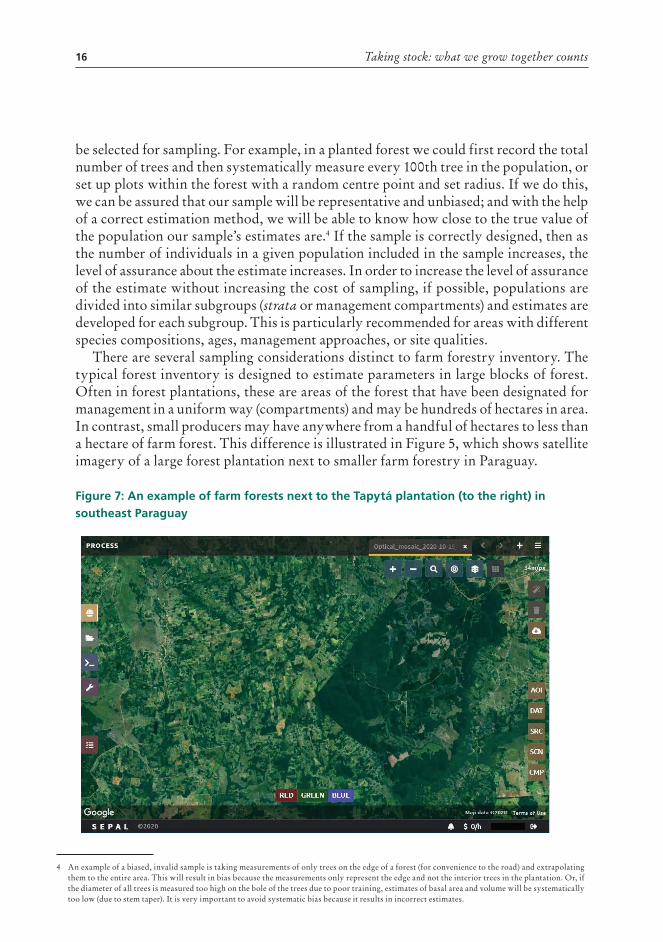
There are several sampling considerations distinct to farm forestry inventory. The typical forest inventory is designed to estimate parameters in large blocks of forest. Often in forest plantations, these are areas of the forest that have been designated for management in a uniform way (compartments) and may be hundreds of hectares in area. In contrast, small producers may have anywhere from a handful of hectares to less than a hectare of farm forest. This difference is illustrated in Figure 5, which shows satellite imagery of a large forest plantation next to smaller farm forestry in Paraguay.
Figure 7: An example of farm forests next to the Tapytá plantation (to the right) in southeast Paraguay
4 An example of a biased, invalid sample is taking measurements of only trees on the edge of a forest (for convenience to the road) and extrapolating them to the entire area. This will result in bias because the measurements only represent the edge and not the interior trees in the plantation. Or, if the diameter of all trees is measured too high on the bole of the trees due to poor training, estimates of basal area and volume will be systematically too low (due to stem taper). It is very important to avoid systematic bias because it results in incorrect estimates.
Producer-led monitoring and stocktaking of trees on farms 17
In the large forest plantation, a management compartment where harvest and re-planting have recently taken place is clearly visible, and is hundreds of hectares in aggregate. The farmers nearby have forest (natural and plantation) that ranges from less than a hectare to thirty hectares, scattered across the landscape and with irregular boundaries. The manager of the forest plantation can delineate management compartments using aerial or satellite imagery, or by assigning field crews to survey the forest using a GPS and prism. In contrast, farm forests are smaller, tend to have higher edge/volume ratios, and their managers may lack specialized forestry equipment. Therefore, in addition to the organizational considerations of a producer-led inventory covered in step 2, there are practical and technical considerations specific to farm forest inventory.
Designing the SampleIn order to extrapolate the sample taken on the farm to the whole farm, the ratio of the sample compared to the farm must be known. There are two methods to do this, explained here:
1. On small farms or management compartments, take a measurement of a subset of the trees on the farm by counting every tree and systematically selecting individual trees to measure;
2. In larger management compartments, determine the area of the farm forest and lay out plots within the forest for management (see page 19, Larger forest farms).
The selection of method depends on a professional judgement (or worked estimate) about the time required to establish plots vs. that required to count all trees. Smaller farms may be around three hectares or less, but this cut-off is only a suggestion and will vary based on circumstances.
Small farmsOn smaller farms, there are few enough trees that it is practicable to count all of them. This method offers the significant advantage that there is no need to survey the forest farm or delineate it on a GIS in order to determine the area; nor is it necessary to establish plots within the compartments. On the other hand, the farmer spends time counting each tree in the stand and walking through the farm forest. It may also be practical to use this method in larger areas with few scattered trees.
Method1. Determine the number of trees in the compartment by walking through the
stand. It is suggested to use a tally counter if it is available, with the number of trees noted at the end of each row, to avoid error when counting hundreds or thousands of trees.
2. Determine the total sample size needed in each compartment with a pilot sample. This can be done by:a. systematically selecting thirty of the trees in the compartment by dividing the
total number of trees by 30, and counting that number of trees for the pilot sample;
18 Taking stock: what we grow together counts
b. calculating the coefficient of variation (CV) of those thirty trees’ basal area, where basal area is the horizontal projected area of the trees in the stand5 and the coefficient of variation is the ratio of the standard deviation of the basal area to the mean of basal area6;
c. calculating the sample size, n as
Where
n s the sample size, E is the maximum error, and CV is the coefficient of variation7. If a 10% error is acceptable (usually the case in farm forestry), the formula is further simplified to
d. Once the sample size is determined, divide the trees in the compartment by the additional number of trees, above and beyond the pilot sample, and measure every nth tree based on the tree measurements decided (see p. 24 Tree level measurements).
If it is more time-consuming to walk through the forest farm several times and coordinate with the producers organization in order to ascertain the precise sample size than to take the tree measurements, the farmer can simply estimate the number of trees in the forest farm, divide that number by 100, and measure one hundred trees systematically when collecting the sample (e.g. if there are 1 500 trees, walking along the rows of the trees and measuring every 15th tree). In a typical plantation forest, trees are uniform enough that this will give a good estimate per compartment. If after checking the sample it is found that more data need to be collected, the farmer can go back and do so (making sure not to remeasure the same trees in the first sample).
e. Calculate the volume of the sample (see p. 31, Estimation of volume) as a first approximation
5 see equation #5 for the formula for calculation of basal area6 The mean (a.k.a average) and standard deviation of a sample of numbers are readily calculated using pre-programmed formula in any modern
spreadsheet or statistical software.7 4 is an acceptable default value for the purpose of most farm forest inventory. It is an approximation of the t-value if a 5% probability to exceed the
maximum error is specified and the pilot sample is greater than or equal to 30.
Producer-led monitoring and stocktaking of trees on farms 19
f. Calculate the volume of the compartment as
where n is the sample size (number of trees), N is the total number of trees in the compartment, v is the volume calculated in the sample, and V is the estimated volume of the compartment.
Example:A farmer determines that he has less than three hectares of trees and will therefore count trees and measure a subset of them.
1. He counts the trees in the compartment and determines that there are 1 200. 2. Therefore:
a. He measures every fortieth tree in his pilot sample (1 200/30 = 40). After communicating this data back to the inventory team in the producers organization, they were able to provide him the following information:
b. The pilot sample had a mean basal area of 305 cm2 and a standard deviation of 105 cm2. The coefficient of variation was therefore 35%.
c. The sample size is thus 48. d. The farmer consequently had 18 additional trees to measure (1070/18 = 59.4)
so the farmer measured every 59th tree.e. The basal area for the sample was 1.58 m2. The compartment’s basal area is
therefore estimated to be (1 200/48) x 1.58 = 39.5 m2.
See Annex 4: Example: Estimation of volume on a farm forest based on a count sample for this example worked in a spreadsheet.
Larger forest farmsLarger farms may have several thousand trees. In this case it may be a more effective use of the farmer’s time to survey the farm stand, determine its area, and establish plots within which trees are measured (rather than counting every tree). Because ground surveys of irregularly sized or small forest farms are prone to error, it is better if the farmer association and farmer work together to survey trees on farms of this size using a smartphone and access to satellite imagery. Moreover, since larger farms are more likely to have distinct management compartments on the same farm, these may need to be delineated and surveyed separately.
Method:1. First, delineate and determine the area of each forest management compartment
on the farm. To do this, the farmer should work with the farmer association to locate each compartment’s latitude and longitude. If she has a GPS enabled
20 Taking stock: what we grow together counts
smartphone, the farmer can walk to the centre of the compartment and take the centre point. This, communicated to the farmer association, can be used to locate the farm. The compartment is then drawn on a GIS using high-resolution imagery8.
Alternatively, the farmer can use applications for smartphones with a GPS, which give the area and a perimeter of a compartment if the farmer walks around it. At the end of this step, the farmer will know the area of each compartment in the farm forest.
Although it is possible to survey compartments using a high-end compass with inclinometer and measuring tape, modern surveyor’s equipment, or by pacing, in order to be reasonably accurate these methods require significant experience and training – and that equipment and training is often not locally available. If a forest farmer does not have access to a GPS-enabled smartphone, she should work with the farmer association to do this work or use the tree count method covered in the section on Small farms, rather than attempting to procure and use surveyor’s equipment.
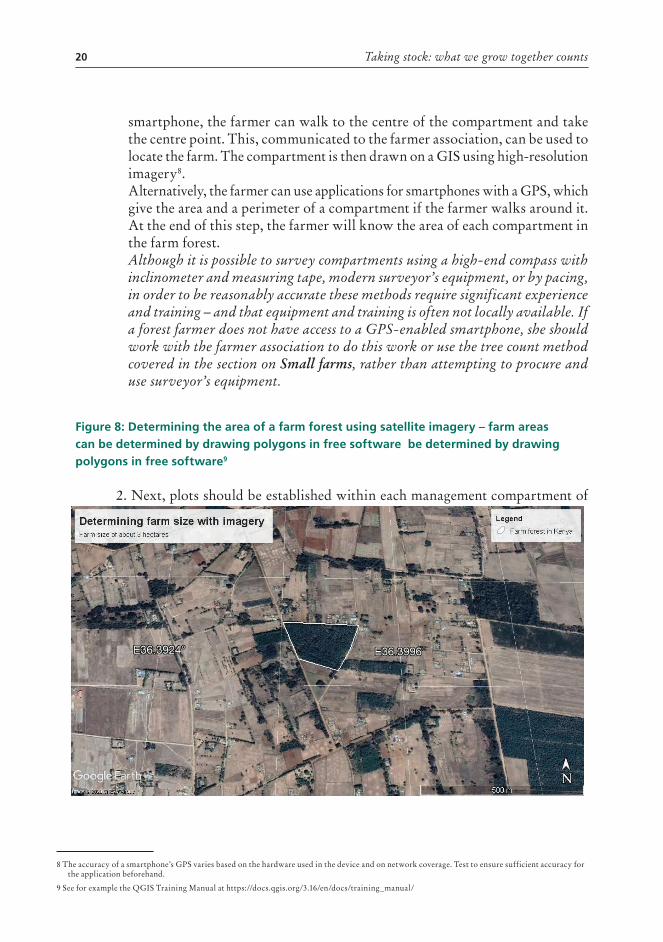
Figure 8: Determining the area of a farm forest using satellite imagery – farm areas can be determined by drawing polygons in free software be determined by drawing polygons in free software9
2. Next, plots should be established within each management compartment of
8 The accuracy of a smartphone’s GPS varies based on the hardware used in the device and on network coverage. Test to ensure sufficient accuracy for the application beforehand.
9 See for example the QGIS Training Manual at https://docs.qgis.org/3.16/en/docs/training_manual/
Producer-led monitoring and stocktaking of trees on farms 21
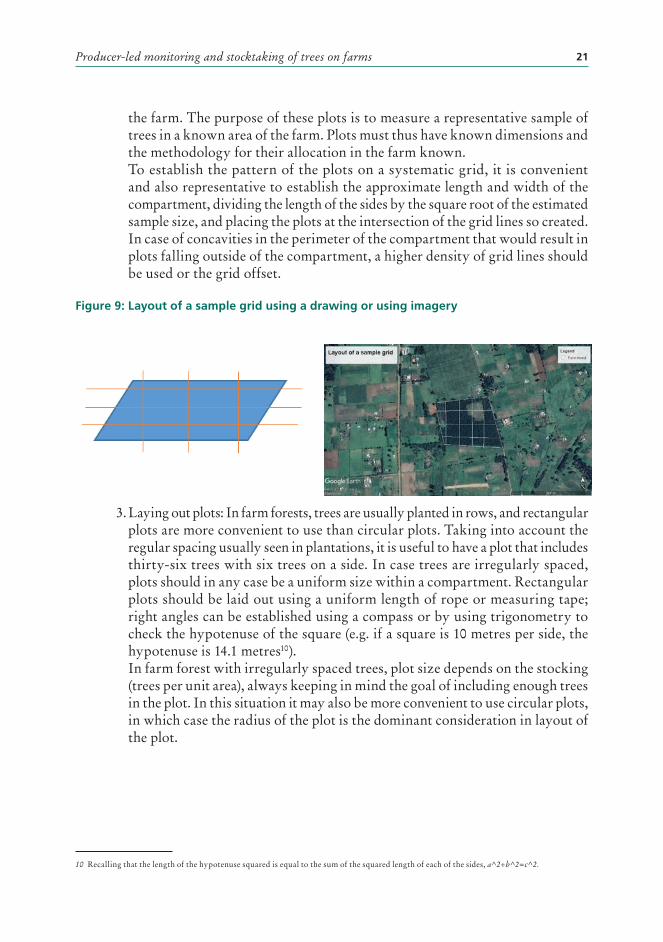
the farm. The purpose of these plots is to measure a representative sample of trees in a known area of the farm. Plots must thus have known dimensions and the methodology for their allocation in the farm known.
To establish the pattern of the plots on a systematic grid, it is convenient and also representative to establish the approximate length and width of the compartment, dividing the length of the sides by the square root of the estimated sample size, and placing the plots at the intersection of the grid lines so created. In case of concavities in the perimeter of the compartment that would result in plots falling outside of the compartment, a higher density of grid lines should be used or the grid offset.
Figure 9: Layout of a sample grid using a drawing or using imagery
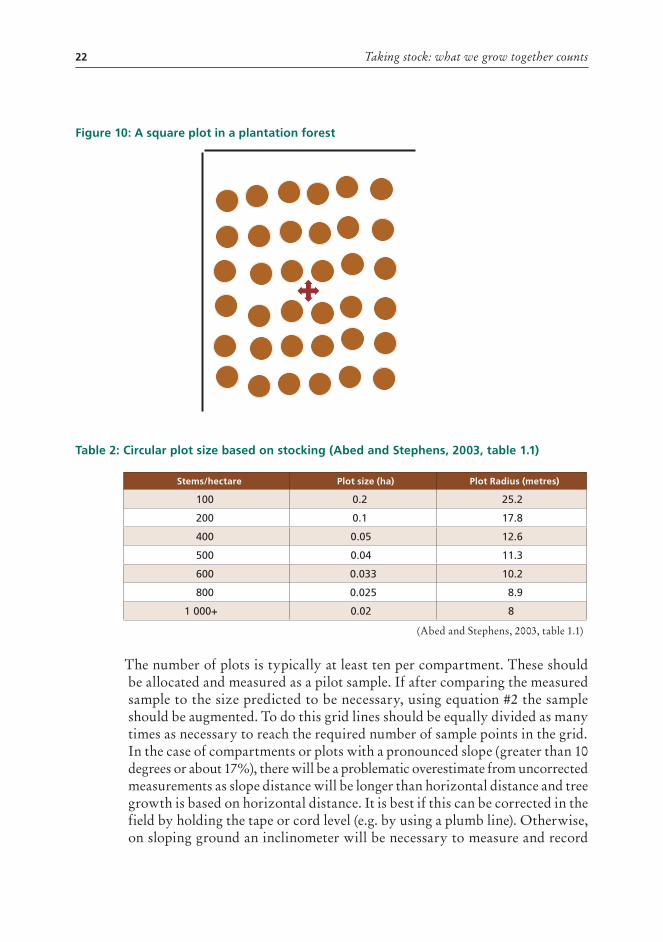
3. Laying out plots: In farm forests, trees are usually planted in rows, and rectangular plots are more convenient to use than circular plots. Taking into account the regular spacing usually seen in plantations, it is useful to have a plot that includes thirty-six trees with six trees on a side. In case trees are irregularly spaced, plots should in any case be a uniform size within a compartment. Rectangular plots should be laid out using a uniform length of rope or measuring tape; right angles can be established using a compass or by using trigonometry to check the hypotenuse of the square (e.g. if a square is 10 metres per side, the hypotenuse is 14.1 metres10).
In farm forest with irregularly spaced trees, plot size depends on the stocking (trees per unit area), always keeping in mind the goal of including enough trees in the plot. In this situation it may also be more convenient to use circular plots, in which case the radius of the plot is the dominant consideration in layout of the plot.
10 Recalling that the length of the hypotenuse squared is equal to the sum of the squared length of each of the sides, a^2+b^2=c^2.
22 Taking stock: what we grow together counts
Figure 10: A square plot in a plantation forest
Table 2: Circular plot size based on stocking (Abed and Stephens, 2003, table 1.1)
The number of plots is typically at least ten per compartment. These should
be allocated and measured as a pilot sample. If after comparing the measured sample to the size predicted to be necessary, using equation #2 the sample should be augmented. To do this grid lines should be equally divided as many times as necessary to reach the required number of sample points in the grid.
In the case of compartments or plots with a pronounced slope (greater than 10 degrees or about 17%), there will be a problematic overestimate from uncorrected measurements as slope distance will be longer than horizontal distance and tree growth is based on horizontal distance. It is best if this can be corrected in the field by holding the tape or cord level (e.g. by using a plumb line). Otherwise, on sloping ground an inclinometer will be necessary to measure and record
Stems/hectare Plot size (ha) Plot Radius (metres)
100 0.2 25.2
200 0.1 17.8
400 0.05 12.6
500 0.04 11.3
600 0.033 10.2
800 0.025 8.9
1 000+ 0.02 8
(Abed and Stephens, 2003, table 1.1)
Producer-led monitoring and stocktaking of trees on farms 23
slope for correction in the calculation of the inventory measurements (note that the inclinometer in most smartphones is not currently sensitive enough to give consistent and accurate measurements of slope in a field setting).
See Annex 5: Slope Correction Table to correct for steep slopes. 4. Once the plots have been measured, volume is calculated for each plot. Volume
for the compartment is based on the pooled volume estimate for the plot and the ratio of the total area of plots to the area of the compartment, much as in equation #4.
Example:1. A farmer with a forest farm of approximately five hectares decides to inventory
her farm using plots to assess volume before a thinning. Her whole forest has only one compartment. She uses her neighbour’s smartphone to find the centre of the farm and sends it to the farmer association, which measures the farm’s size as about 200 by 300 metres.
2. Plots are established on a grid of 40 x 50 metres to yield a grid with 12 intersections on the compartment.
3. Since the trees are on a grid with a 3 x 4-metre spacing, the plots are established as 21 x 26 metres to include six stems to a side.
4. The area of the sample is thus 6 552 m2 or 0.6552 hectares. The area of the forest farm calculated based on the aerial imagery was 4.98 hectares. The volume estimated in the sample was 58 m3, therefore the volume of the forest farm was estimated to be (4.98/0.6552) x 58 = 441 m3.
Tree and compartment measurementsConsistent and accurate measurements of trees are indispensable when taking a survey or census of trees on farms. For a census, it is important that all trees on the farm are measured and recorded. For a survey, measurements are recorded for the trees specified in the survey protocol.
Tree measurements, of course, are collected in order to estimate parameters of interest at the level of the farm forest. For a commercial tree inventory, this usually means volume of merchantable wood, as well as certain estimates of wood quality, such as tree straightness, tree species, and branch-free length of wood.
Tree volume is closely related to basal area and tree height, as well as bark thickness. Basal area is readily measured in the field, but accurate standing tree heights and bark thicknesses are more costly to obtain. For this reason, models that relate basal area to volume are commonly used. In addition to basal area, these models may include as inputs height, bark thickness, species, stand age and locality. When deciding on what tree measurements to collect, it is important to first ascertain what usable models are already available for the area. It is likely that it will be more cost-effective to take the measurements those models require. Larger associations or those working with research institutes may eventually develop their own models.
24 Taking stock: what we grow together counts
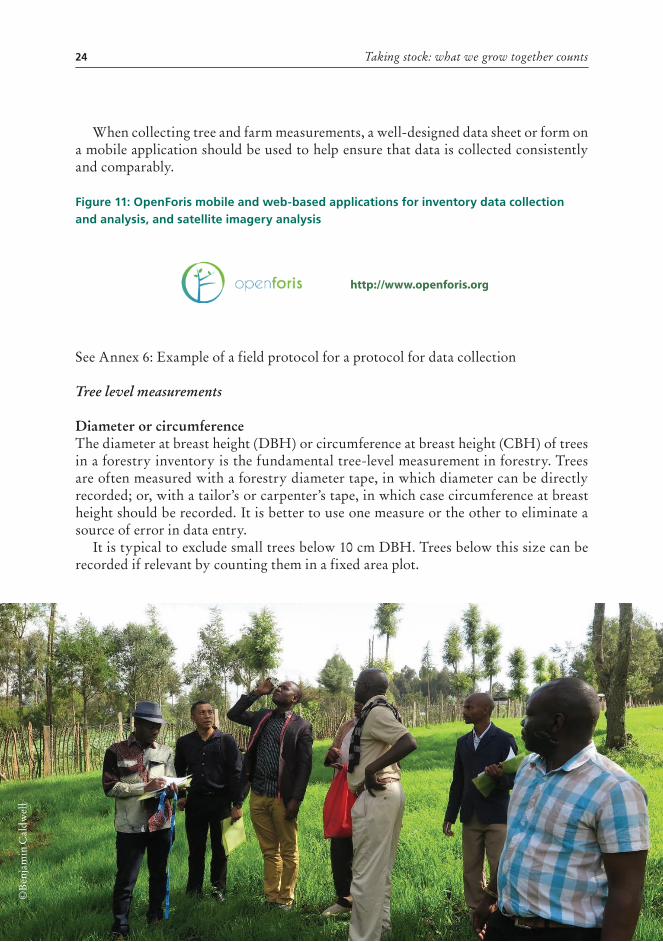
When collecting tree and farm measurements, a well-designed data sheet or form on a mobile application should be used to help ensure that data is collected consistently and comparably.
Figure 11: OpenForis mobile and web-based applications for inventory data collection and analysis, and satellite imagery analysis
See Annex 6: Example of a field protocol for a protocol for data collection
Tree level measurements
Diameter or circumferenceThe diameter at breast height (DBH) or circumference at breast height (CBH) of trees in a forestry inventory is the fundamental tree-level measurement in forestry. Trees are often measured with a forestry diameter tape, in which diameter can be directly recorded; or, with a tailor’s or carpenter’s tape, in which case circumference at breast height should be recorded. It is better to use one measure or the other to eliminate a source of error in data entry.
It is typical to exclude small trees below 10 cm DBH. Trees below this size can be recorded if relevant by counting them in a fixed area plot.
©B
enja
min
Cal
dwel
l
Producer-led monitoring and stocktaking of trees on farms 25
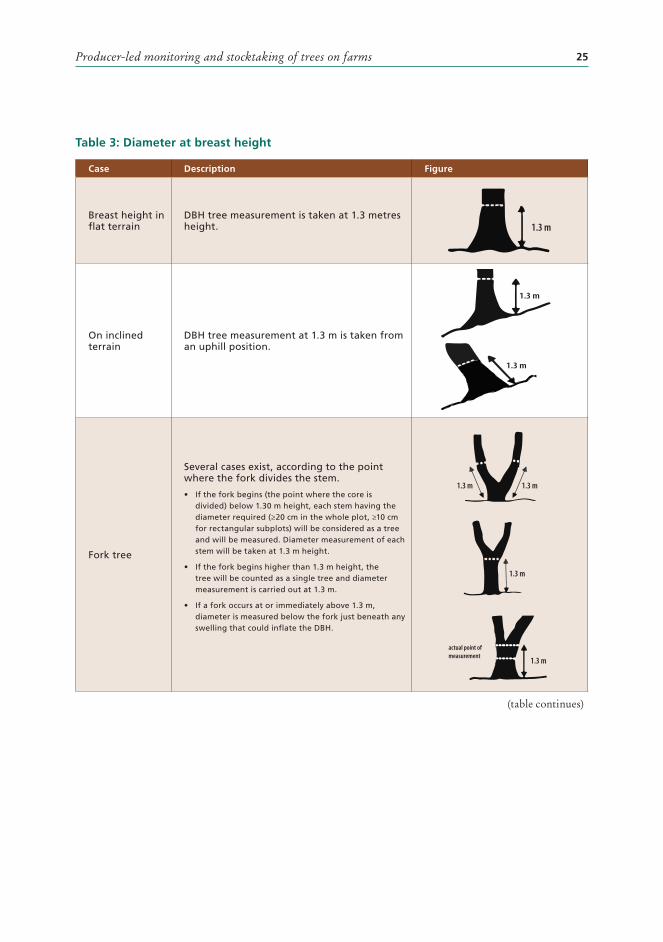
Table 3: Diameter at breast height
Case Description Figure
Breast height in flat terrain
DBH tree measurement is taken at 1.3 metres height.
On inclined terrain
DBH tree measurement at 1.3 m is taken from an uphill position.
Fork tree
Several cases exist, according to the point where the fork divides the stem.
• If the fork begins (the point where the core is divided) below 1.30 m height, each stem having the diameter required (≥20 cm in the whole plot, ≥10 cm for rectangular subplots) will be considered as a tree and will be measured. Diameter measurement of each stem will be taken at 1.3 m height.
• If the fork begins higher than 1.3 m height, the tree will be counted as a single tree and diameter measurement is carried out at 1.3 m.
• If a fork occurs at or immediately above 1.3 m, diameter is measured below the fork just beneath any swelling that could inflate the DBH.
(table continues)
26 Taking stock: what we grow together counts
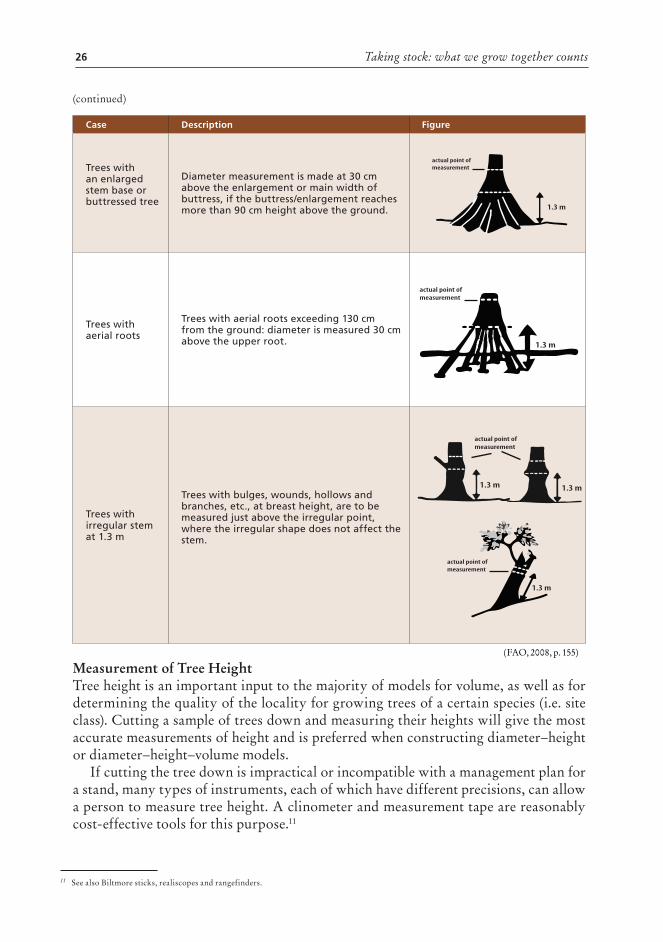
Case Description Figure
Trees with an enlarged stem base or buttressed tree
Diameter measurement is made at 30 cm above the enlargement or main width of buttress, if the buttress/enlargement reaches more than 90 cm height above the ground.
Trees with aerial roots
Trees with aerial roots exceeding 130 cm from the ground: diameter is measured 30 cm above the upper root.
Trees with irregular stem at 1.3 m
Trees with bulges, wounds, hollows and branches, etc., at breast height, are to be measured just above the irregular point, where the irregular shape does not affect the stem.
Measurement of Tree HeightTree height is an important input to the majority of models for volume, as well as for determining the quality of the locality for growing trees of a certain species (i.e. site class). Cutting a sample of trees down and measuring their heights will give the most accurate measurements of height and is preferred when constructing diameter–height or diameter–height–volume models.
If cutting the tree down is impractical or incompatible with a management plan for a stand, many types of instruments, each of which have different precisions, can allow a person to measure tree height. A clinometer and measurement tape are reasonably cost-effective tools for this purpose.11
11 See also Biltmore sticks, realiscopes and rangefinders.
(continued)
(FAO, 2008, p. 155)
Producer-led monitoring and stocktaking of trees on farms 27
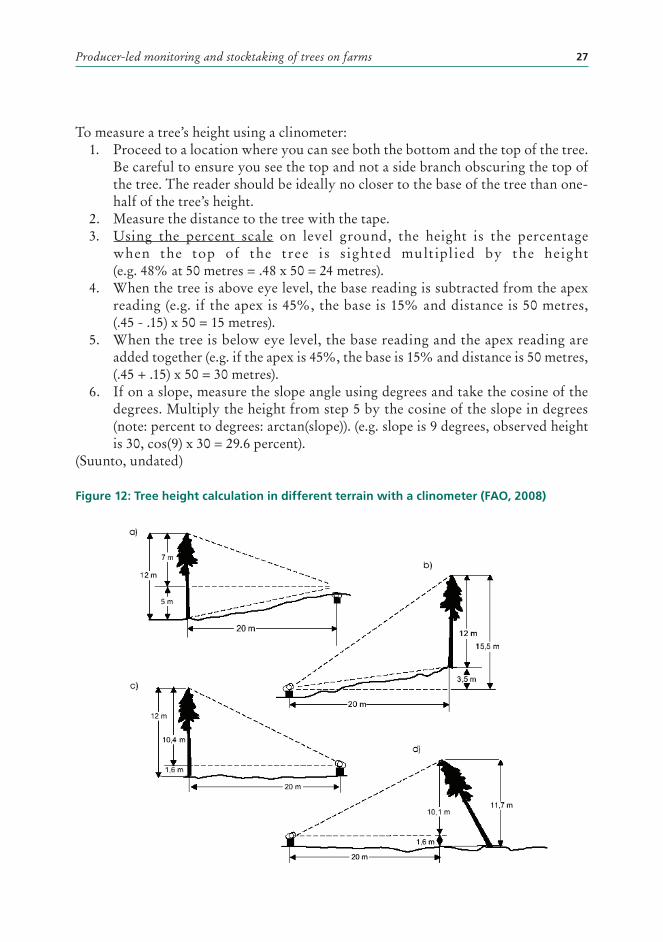
To measure a tree’s height using a clinometer:1. Proceed to a location where you can see both the bottom and the top of the tree.
Be careful to ensure you see the top and not a side branch obscuring the top of the tree. The reader should be ideally no closer to the base of the tree than one-half of the tree’s height.
2. Measure the distance to the tree with the tape. 3. Using the percent scale on level ground, the height is the percentage
when the top of the tree is sighted mult ipl ied by the height (e.g. 48% at 50 metres = .48 x 50 = 24 metres).
4. When the tree is above eye level, the base reading is subtracted from the apex reading (e.g. if the apex is 45%, the base is 15% and distance is 50 metres, (.45 - .15) x 50 = 15 metres).
5. When the tree is below eye level, the base reading and the apex reading are added together (e.g. if the apex is 45%, the base is 15% and distance is 50 metres, (.45 + .15) x 50 = 30 metres).
6. If on a slope, measure the slope angle using degrees and take the cosine of the degrees. Multiply the height from step 5 by the cosine of the slope in degrees (note: percent to degrees: arctan(slope)). (e.g. slope is 9 degrees, observed height is 30, cos(9) x 30 = 29.6 percent).
(Suunto, undated)
Figure 12: Tree height calculation in different terrain with a clinometer (FAO, 2008)
28 Taking stock: what we grow together counts
Important: Usually Clinometers incorporate two of five scales:1. degrees (scale unlabelled, +/-90°), where 0° is horizontal and 90° is vertical 2. percent (scale labelled % at both ends) where 45° = 100% 3. topographic or topo (scale labelled 1/66 at both ends) where 45° = 66 units 4. 15 metre (scale labelled 1/15 at both ends) where 45° = 15 units 5. 20 metre (scale labelled 1/20 at both ends) where 45° = 20 units
Make sure to check the clinometer you are using to ensure you are reading the correct scale (degrees and percentage) for these instructions or use appropriate corrections or the manufacturer’s instructions.
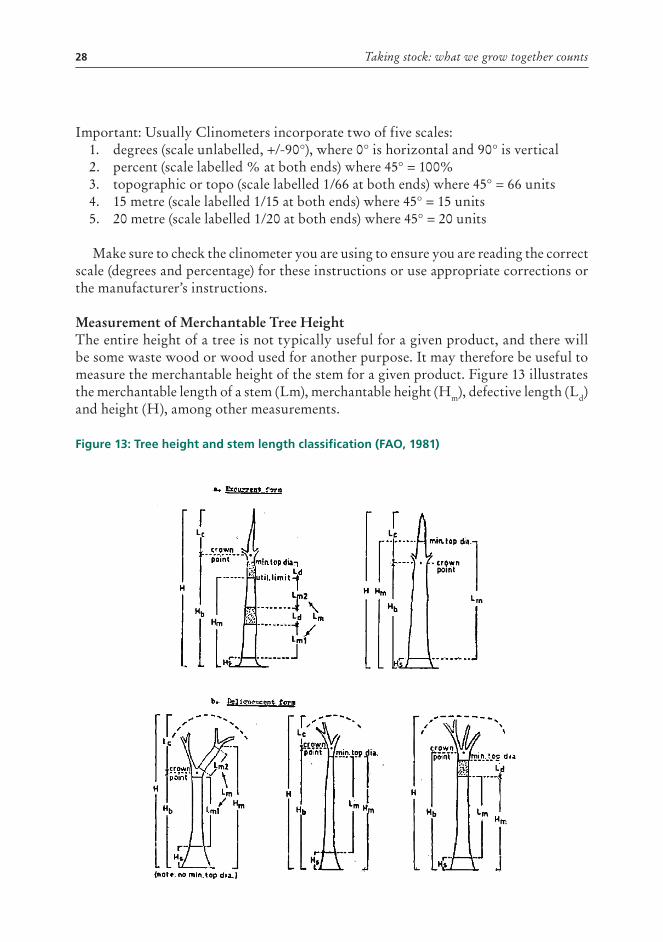
Measurement of Merchantable Tree HeightThe entire height of a tree is not typically useful for a given product, and there will be some waste wood or wood used for another purpose. It may therefore be useful to measure the merchantable height of the stem for a given product. Figure 13 illustrates the merchantable length of a stem (Lm), merchantable height (Hm), defective length (Ld) and height (H), among other measurements.
Figure 13: Tree height and stem length classification (FAO, 1981)
Producer-led monitoring and stocktaking of trees on farms 29
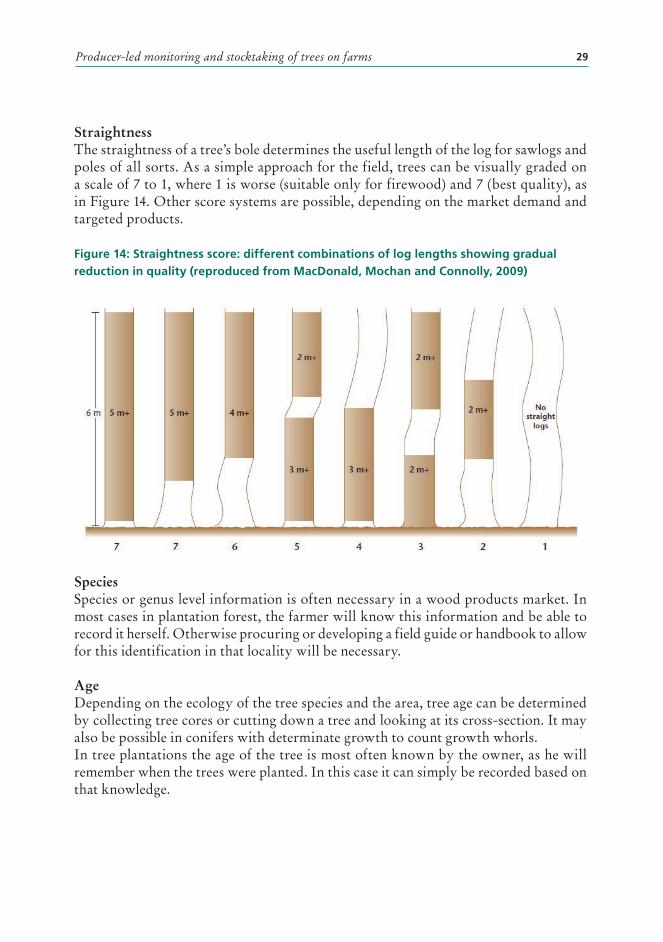
StraightnessThe straightness of a tree’s bole determines the useful length of the log for sawlogs and poles of all sorts. As a simple approach for the field, trees can be visually graded on a scale of 7 to 1, where 1 is worse (suitable only for firewood) and 7 (best quality), as in Figure 14. Other score systems are possible, depending on the market demand and targeted products.
Figure 14: Straightness score: different combinations of log lengths showing gradual reduction in quality (reproduced from MacDonald, Mochan and Connolly, 2009)
SpeciesSpecies or genus level information is often necessary in a wood products market. In most cases in plantation forest, the farmer will know this information and be able to record it herself. Otherwise procuring or developing a field guide or handbook to allow for this identification in that locality will be necessary.
AgeDepending on the ecology of the tree species and the area, tree age can be determined by collecting tree cores or cutting down a tree and looking at its cross-section. It may also be possible in conifers with determinate growth to count growth whorls. In tree plantations the age of the tree is most often known by the owner, as he will remember when the trees were planted. In this case it can simply be recorded based on that knowledge.
30 Taking stock: what we grow together counts
Compartment-Level MeasurementsAt the level of the compartment, it may be helpful to collect to some measurements in the course of the inventory. This information typically transcends the estimation of volume and provides information helpful for management planning.
Management history of treesManagement of trees can increase the quality and the quantity of production, albeit at a cost. Simple tick boxes filled in by each producer will give an indication of this practice on each farm. Key management practices are weeding (during establishment), pruning and thinning.
Collection of this information in the inventory may be helpful as the association plans whether there could be demand from its members for these services (Milligan et al., 2009).
Management objectives The management objective or impetus for planting the trees on the farm is useful for management planning, and is a simple qualitative parameter to include in the survey.
Source of planting materialThe quality of the planting material is one of the most important contributors to tree quality and production. In an initial survey, the association may collect information on the source of planting material used by its members in order to advise which vendors provide material of reliably good quality. Ultimately, the association may source high-quality planting material of reliable quality for members.
Analyse the data and turn it into useful informationThe essential steps in a farm forestry inventory analysis are:
1. data entry and cleaning;2. estimation of tree and plot volume, and for the compartment; and3. (optional) calculation of uncertainty, value and sustainable yields.
Each of these steps is possible to perform in spreadsheet packages such as MS Excel and LibreOffice. For moderately sized datasets and for more advanced analysis, it will be necessary to move to statistical packages and database management softwares (such as R and MySQL respectively).
Data Entry and cleaningWhen entering data, it is useful to have a template and written protocol for consistent data entry. If a mobile application is used for data entry, forms in the interface can impose or automate certain formats for the data. On the other hand, if data is entered
Producer-led monitoring and stocktaking of trees on farms 31
from paper data sheets into a spreadsheet by hand, using a certain format for each field (column) is helpful in processing data. For example, GPS coordinates should be entered in a consistent format using a clearly labelled coordinate system.6 Consistency is the key, as data can be readily transformed into other formats in bulk if it is consistently entered.
Attend to another important step, which is checking for outliers in the data. These may be due to measurement error or typographical errors. Since tree volumes increase rapidly with diameter, one tree with an erroneously large value can skew the whole plot. Similarly, systematically biased data from a plot within a compartment can skew the data for a farm.
Proper training and protocols help to prevent these problems. Nevertheless, they will crop up in any inventory. Graphs of the data (bar charts or histograms) are readily produced by any modern software for data analysis, and will help to quickly identify unusually large or missing data values, which should be corrected or removed from the analysis. If heights are collected on a subset of trees, height–diameter plots can also facilitate identification of unlikely height values.
Estimation of volumeAt the tree level, tree volume is well estimated from basal area (cross-sectional area of the bole) and tree height.
Basal areaBasal area for a tree is calculated as:
Whereπ = 3.1459
DBH is the tree’s diameter at breast height.
Note: DBH is commonly recorded in centimetres while basal area is in square metres. If centimetres are used
as an input to this equation, make the conversion to square metres by dividing the equation’s output by 10 000.
HeightIf not measured directly, height may be estimated using a model. All models will be imperfect; in order to obtain useful results without systematic bias, models should:
1. have been developed for comparable site qualities and species; and2. have been developed for the same diameter range found on the farm.
6 Often if using coordinates from smartphone applications, these are in WGS 1984 in decimal degrees latitude/longitude. E.g. FAO headquarters is located at 41.882920 latitude, 12.488842 longitude.
32 Taking stock: what we grow together counts
For a reasonable introduction to diameter height model fitting, see Yuancai and Parresol, 2001. For a more in-depth discussion with worked examples in R, an open-source statistical software, see Robinson and Hamann, 2012, Chapter 6. Height can also be estimated with the help of an existing height model that is fitted for each sample plot to pass through the measured median tree dimensions (DBH, H).13
Merchantable VolumeOnce height is estimated or known, merchantable volume may be calculated as:
Where BA is basal area (m2)H is merchantable tree height (m)
FF is the form factor, a multiplier used to adjust the cylindrical volume calculated from the basal area and height of the tree in question. Form factors for the commercial stem length are usually in the order of magnitude of 0.7 if no data is available.14 Alternatively, merchantable volume may be modelled using diameter, diameter and height, or some other combination of inputs. As noted in the section on tree measurements, if this is the preference then models must be identified in advance to ensure that the necessary inputs are collected in the inventory.
Volumes are extrapolated to the compartment and farm level as noted in equation #4. Alternatively, volumes may be estimated using volume tables. See e.g. Chapter IV in Rawat et al. (2003) for their use and Picard, Saint-Andre and Henry (2012) for a detailed explanation of their development.
Uncertainty of the estimateIt is useful to calculate the confidence interval of the estimated volume, in order to understand the level of confidence about the volume for the farm or compartment
estimated from the sample. For a simple random sample such as that proposed in this volume, this can be calculated as:
Wherex is the sample meant is the t statistic for a given sample size and confidence level (readily obtained from statistical and accounting softwares or references)
13 In an even-aged forest plantation we can apply a method where the first tree with height data in each plot by species represents the median tree of that species. Then we should apply a height curve which has only one predictor variable (DBH) and fixed model parameters. The curve is calibrated to pass through the median diameter–height data-point in XY-axis. The calibration works as follows: you have a tree height-DBH model H = f(DBH) and then you want to apply that in your stand. You first determine the (basal area) median tree in the plot and record its DBH and top height. Let's assume that recorded values are DBH = 20cm and H = 15m. First, you compute estimated height of that tree first with the height model, and it gives you a height of 14.1m. So your calibration factor is 14.1/15.0 = 0.94. You apply your model to all tally trees (of that species) in the plot as follows: I = 0.94 x f(DBH). In case of a species having tally trees in the data but no median tree (i.e. no height sample tree), the height is computed without calibration or with a calibrated curve of another species. Please notice that the calibration factor will vary between the plots and species.
14 http://wiki.awf.forst.uni-goettingen.de/wiki/index.php/Stem_shape
Producer-led monitoring and stocktaking of trees on farms 33
s2 is the sample variance (i.e. the sum of squared deviation from the sample mean)15
n is the sample sizeIf equation #1 is followed in allocation of the sample and the data is correctly collected, the width of the confidence interval should be acceptable.
Estimation of other parameters
IncrementIn order to forecast growth and estimate harvest levels, individual small farmers will likely either be harvesting opportunistically or when they have a financial emergency such as the need to pay medical expenses or school fees. Occasionally they may be harvesting their whole ownership and replanting at once.
If the producer organization can regularize these harvests (e.g. by offering farmers technical support and a competitive and reliable point of sale, and perhaps a savings and loan account) then the individual farmers will benefit through a more reliable and transparent pricing structure. The association will be able to ensure the sustainability of its business model.
Given that this can be put into place, estimating increment (wood growth) will facilitate estimation of the flow of wood products that can be expected across farms in the producer association. While estimates of increment can be derived from repeated measurements, they can also be derived by dividing volumes by the age of the stand. In order to estimate this data from its own forest farms, it needs reliable data on:
1. tree farm age;2. height of the tallest trees in a compartment (a proxy for the quality of the locality
for tree growing, i.e. site class);3. volume; and4. tree species.
Regression estimation or other estimators can then be used to estimate volume growth for a given species and site class. This can be for each age (current annual increment) or on average for a period of years (mean annual increment).
ExamplesPlease write to [email protected] for examples of an inventory analysis.
STEP 4 - Taking stock and developing your business
IntroductionOne important use of inventory information is to support business development. The process of its use and a producer organization’s development and evolution is non-
15 Variance is readily calculated in accounting and statistical software, typically using the VAR() function (or consult the software’s documentation)
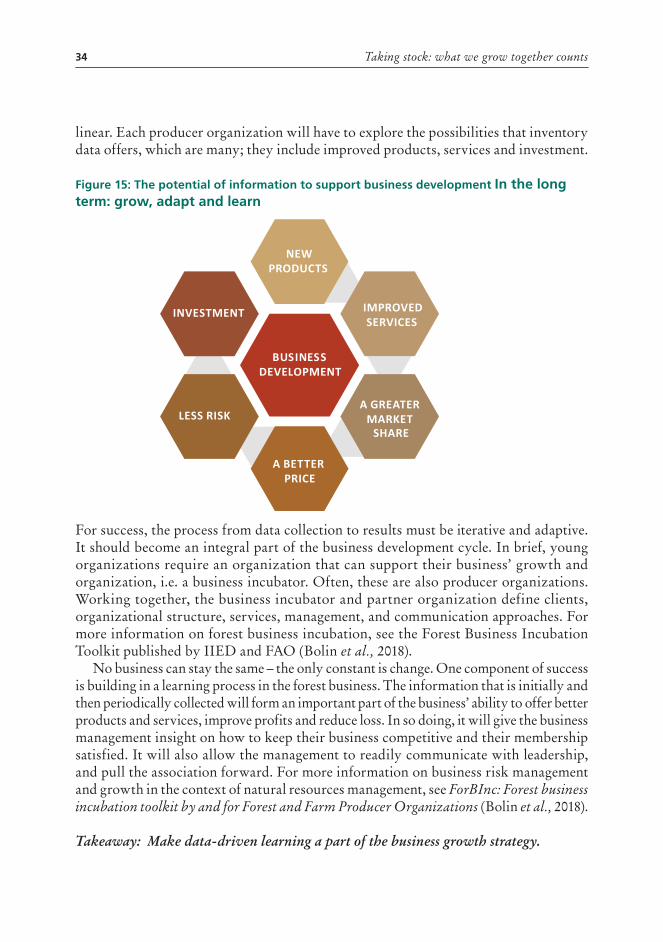
34 Taking stock: what we grow together counts
linear. Each producer organization will have to explore the possibilities that inventory data offers, which are many; they include improved products, services and investment.
Figure 15: The potential of information to support business development In the long term: grow, adapt and learn
For success, the process from data collection to results must be iterative and adaptive. It should become an integral part of the business development cycle. In brief, young organizations require an organization that can support their business’ growth and organization, i.e. a business incubator. Often, these are also producer organizations. Working together, the business incubator and partner organization define clients, organizational structure, services, management, and communication approaches. For more information on forest business incubation, see the Forest Business Incubation Toolkit published by IIED and FAO (Bolin et al., 2018).
No business can stay the same – the only constant is change. One component of success is building in a learning process in the forest business. The information that is initially and then periodically collected will form an important part of the business’ ability to offer better products and services, improve profits and reduce loss. In so doing, it will give the business management insight on how to keep their business competitive and their membership satisfied. It will also allow the management to readily communicate with leadership, and pull the association forward. For more information on business risk management and growth in the context of natural resources management, see ForBInc: Forest business incubation toolkit by and for Forest and Farm Producer Organizations (Bolin et al., 2018). Takeaway: Make data-driven learning a part of the business growth strategy.
BUSINESS DEVELOPMENT
NEW PRODUCTS
IMPROVED SERVICES
A GREATER MARKET
SHARE
A BETTER PRICE
LESS RISK
INVESTMENT
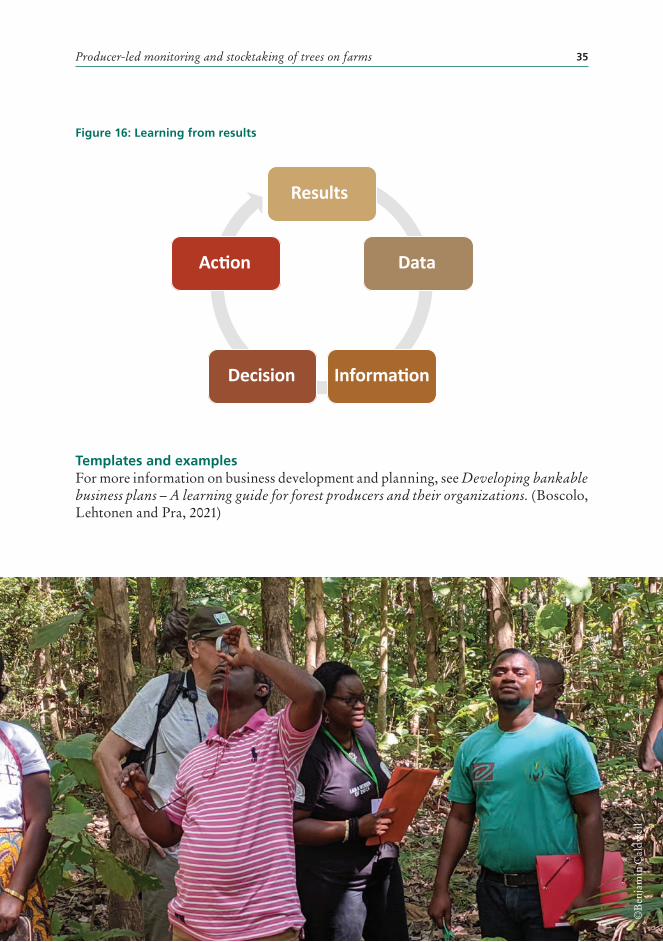
Producer-led monitoring and stocktaking of trees on farms 35
Figure 16: Learning from results
Templates and examplesFor more information on business development and planning, see Developing bankable business plans – A learning guide for forest producers and their organizations. (Boscolo, Lehtonen and Pra, 2021)
Results
Data
InformationDecision
Action
©B
enja
min
Cal
dwel
l
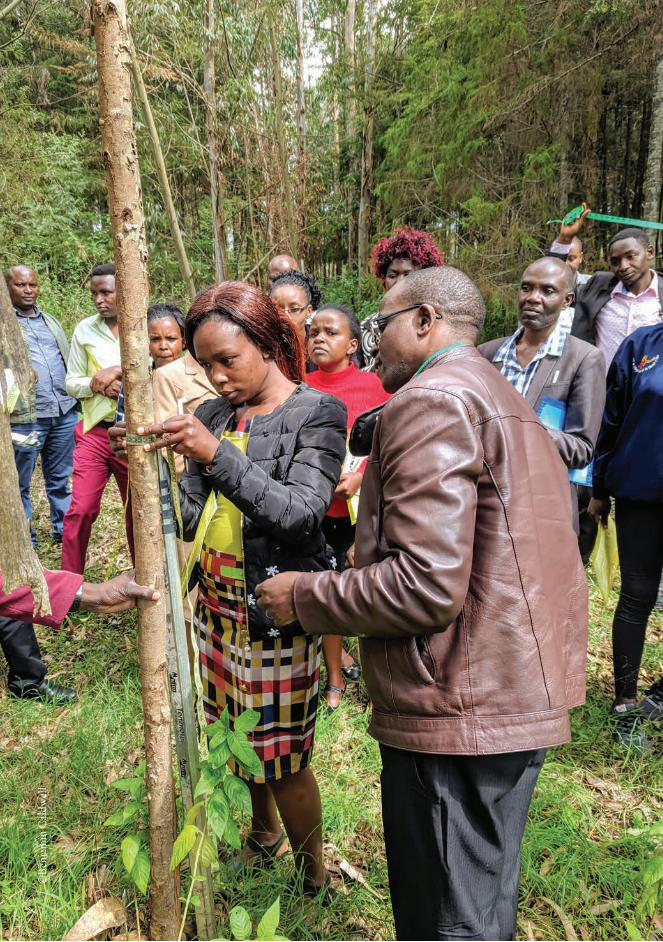
36 Taking stock: what we grow together counts ©
Ben
jam
in C
aldw
ell
37
2. References
Abed, T. & Stephens, N.C. 2003. Tree measurement manual for farm foresters. Second edition. M. Parsons, ed. Canberra, Australia, National Forest Inventory, Bureau of Rural Sciences, Canberra. 89 pp.
Bolin, A., Macqueen, D., Greijmans, M., Grouwels, S., Camara, K. & Ndethiu, L. 2018. ForBInc: Forest business incubation toolkit by and for Forest and Farm Producer Organizations. 1st edition. A. Bolin, D. Macqueen, M. Greijmans, S. Grouwels, K. Camara & L. Ndethiu, eds. London, FAO and IIED. 73 pp. (also available at http://pubs.iied.org/13596IIED).
Boscolo, M., Lehtonen, P. & Pra, A. 2021. Developing bankable business plans – A learning guide for forest producers and their organizations. Forestry Working Paper No. 24. Rome, FAO. https://doi.org/10.4060/cb4520en
Byron, N. 2001. Keys to smallholder forestry. Forests Trees and Livelihoods, 11(4): 279–294. https://doi.org/10.1080/14728028.2001.9752396
FAO. 1981. Manual of forest inventory. Rome, Italy, FAO. 210 pp. (also available at http://www.fao.org/3/ap358e/ap358e00.pdf).
FAO. 2008. National Forest Monitoring and Assessment - Manual for integrated field data collection. National Forest Monitoring and Assessment Working Paper NFMA 37/E. Rome, Italy.206 pp. (also available at http://www.fao.org/forestry/14727-072b68bcfa49334202f1586889517ce24.pdf).
FAO. 2014. Roadmap for strengthening forest and farm producer organizations. Policy Brief(I3886E/1/06.14): 21. (also available at www.fao.org/partnerships/forest-farm-facility/83759a).
Lecup, I., Nicholson, K. & Grouwels, S. 2011. Community-based tree and forest product enterprises: Market Analysis and Development. Rome, Italy. 111 pp. (also available at http://www.fao.org/forestry/enterprises/25492/en/).
Lohr, S.L. 2010. Sampling: design and analysis. 2nd edition. Boston, MA, Brooks/Cole. 592 pp.
Lowder, S.K., Sánchez, M.V. & Bertini, R. 2019. Farms, family farms, farmland distribution and farm labour: What do we know today? Rome, Italy.
38 Taking stock: what we grow together counts
MacDonald, E., Mochan, S. & Connolly, T. 2009. Validation of a stem straightness scoring system for Sitka spruce (Picea sitchensis (Bong.) Carr.). Forestry, 82(4): 419–429. https://doi.org/10.1093/forestry/cpp011
Milligan, B., Amumpe, A., Nalwadda, C., Kakungulu, Z., Odeke, C., Atuyamba, A. & Businge, T. 2009. Tree Planting Guidelines for Uganda
Picard, N., Saint-Andre, L. & Henry, M. 2012. Manual for building tree volume and biomass allometric equations. Rome, Italy, Food and Agricultural Organization of the United Nations, Rome, and Centre de Coopération Internationale en Recherche Agronomique pour le Développement, Montpellier,. 215 pp. (also available at http://www.fao.org/3/i3058e/i3058e.pdf).
Rawat, J.K., Dasgupta, S., Kumar, R., Kumar, A. & Chauhan, K.V.S. 2003. Training manual on inventory of trees outside forests (TOF). Bangkok, Thailand, FAO. 38 pp. (also available at http://www.fao.org/docrep/006/AC840E/AC840E00.HTM).
Robinson, A.P. & Hamann, J.D. 2012. Forest Analytics With R: An Introduction. R. Gentleman, K. Hornik & G. Parmigiani, eds. New York, New York, Springer. 337 pp. (also available at https://www.springer.com/gp/book/9781441977618).
Rocchigiani, M. & Herbel, D. 2012. Organization analysis and development: Learning module 4: 1–183. (also available at http://www.fao.org/docs/eims/upload/314528/FAO_CD_LM4.pdf).
Seeds for Change. 2010. Facilitation tools for meetings and workshops. London, UK. 20 pp. (also available at https://www.seedsforchange.org.uk/tools.pdf).
Suunto. undated. Suunto PM-5 / PM-5/1520 user’s guide. http://www.suunto.com/Verdone, M. 2018. The world’s largest private sector? Recognising the cumulative economic value of small-scale forest and farm producers. Gland, Switzerland. 22 pp. (also available at https://portals.iucn.org/library/node/47738).
van Laar, A. & Akça, A. 2007. Forest Mensuration. 2nd edition. Dordrecht, The Netherlands, Springer. 383 pp. (also available at https://www.springer.com/gp/book/9781402059902).
Yuancai, L. & Parresol, B.R. 2001. Remarks on Height-Diameter Modeling. Asheville, NC. 6 pp. (also available at https://www.srs.fs.usda.gov/pubs/rn/rn_srs010.pdf).
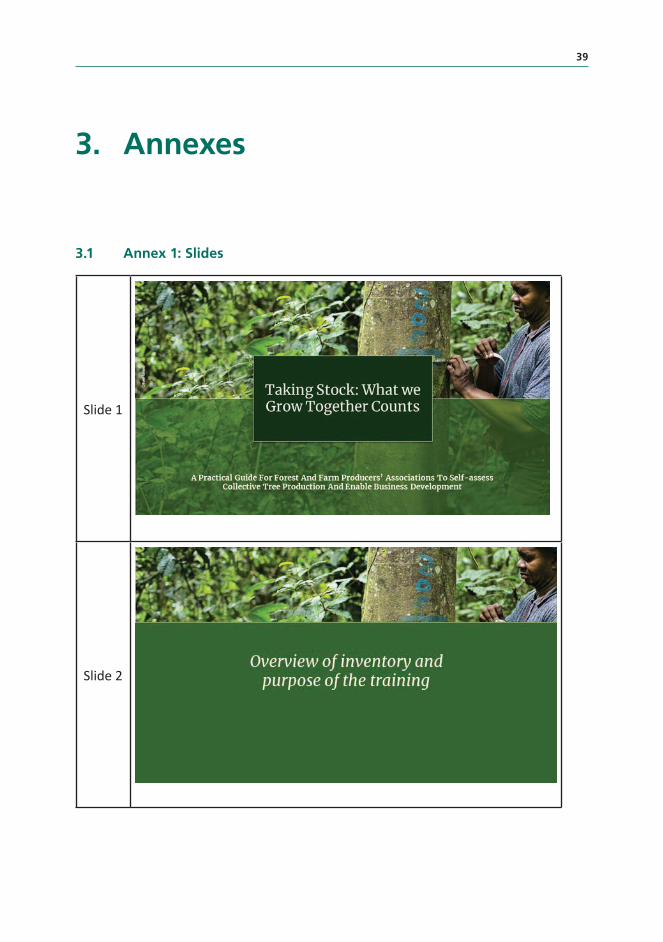
39
3. Annexes
3.1 Annex 1: Slides
Slide 1
Slide 2
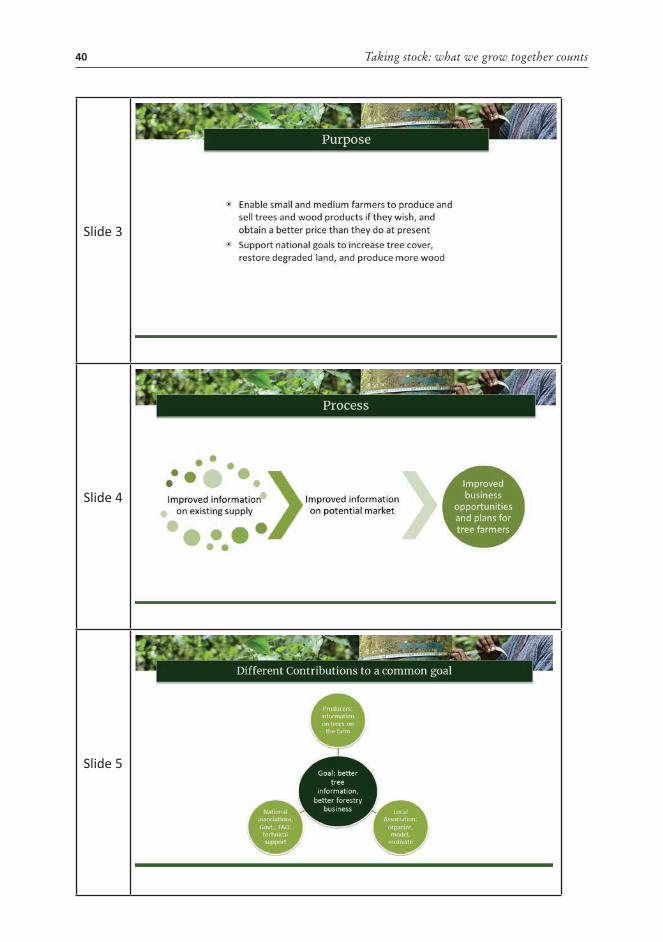
40 Taking stock: what we grow together counts
Slide 3
Slide 4
Slide 5
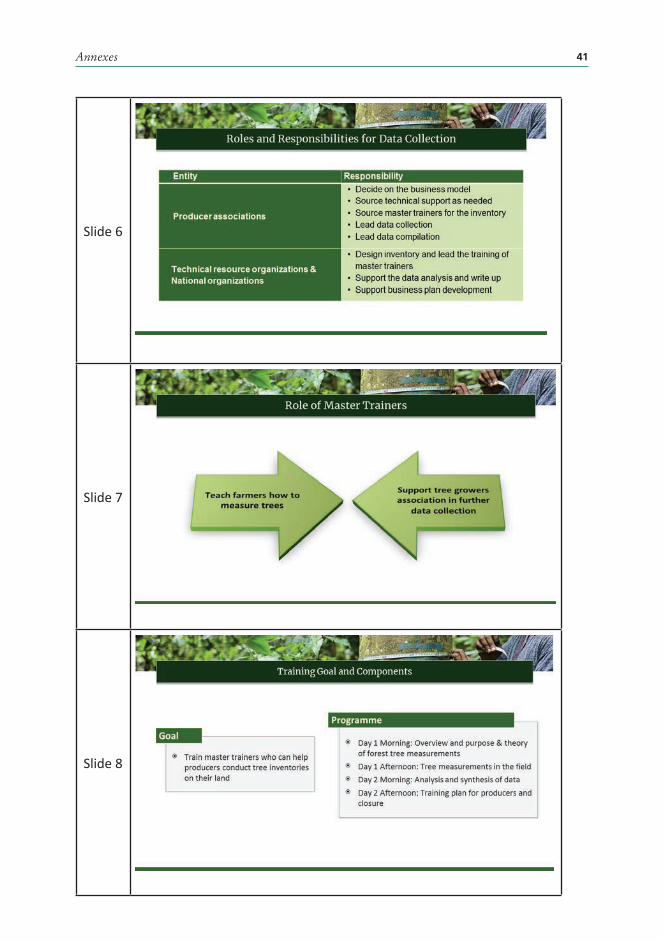
41Annexes
Slide 6
Slide 7
Slide 8
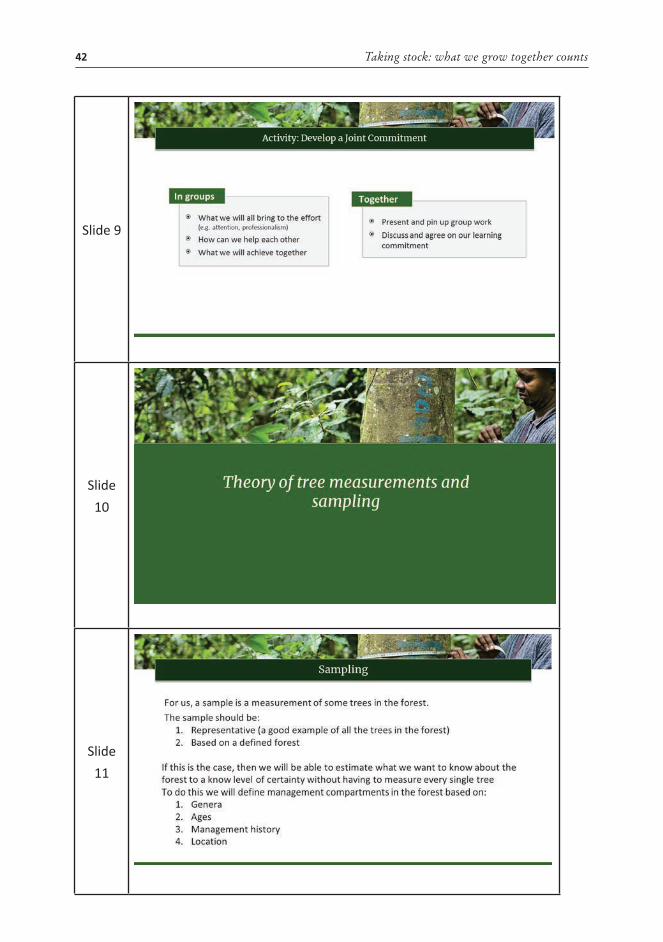
42 Taking stock: what we grow together counts
Slide 9
Slide 10
Slide 11
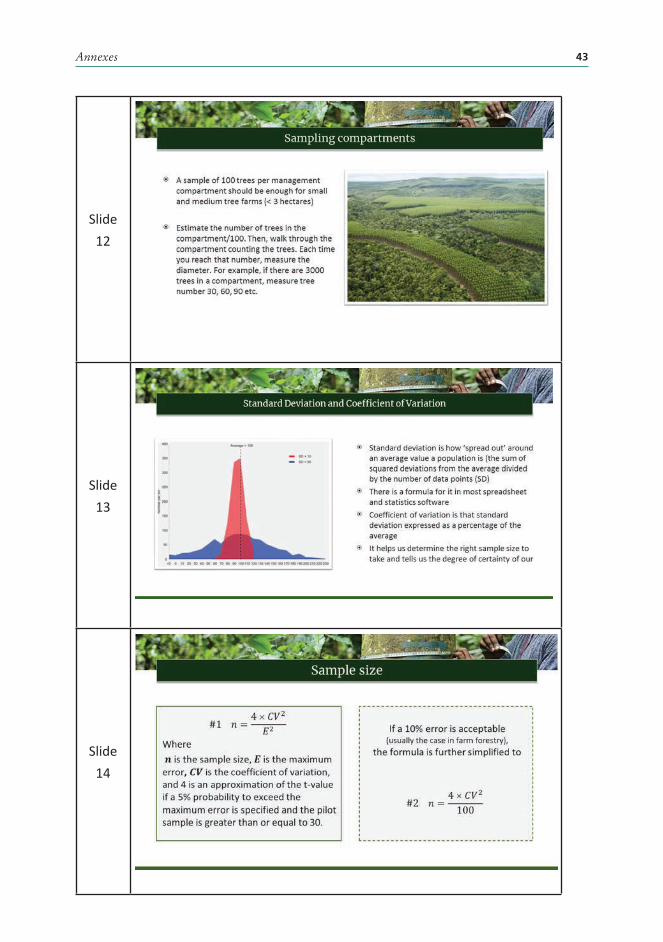
43Annexes
Slide 12
Slide 13
Slide 14
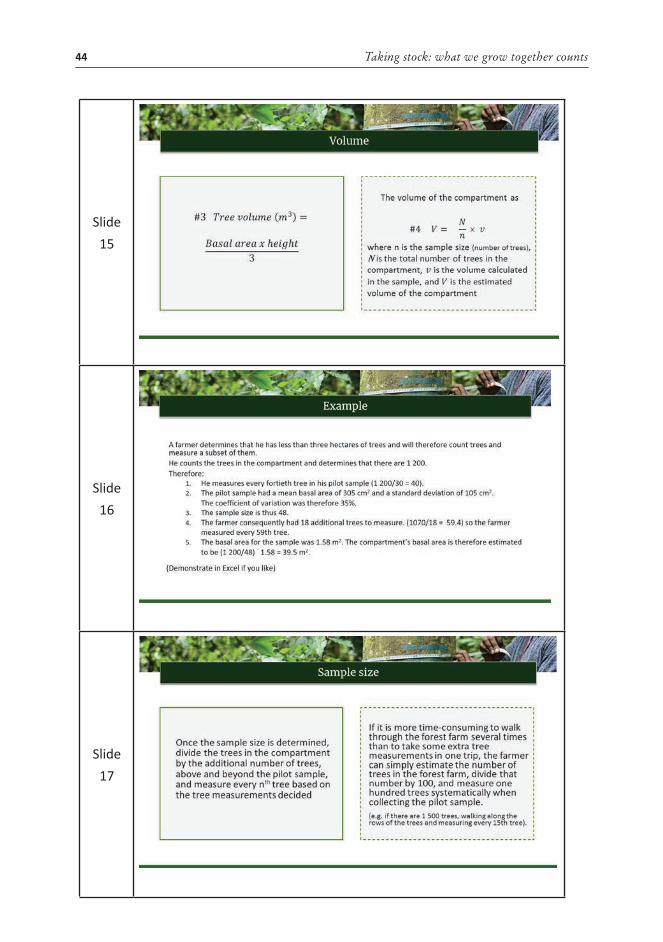
44 Taking stock: what we grow together counts
Slide 15
Slide 16
Slide 17
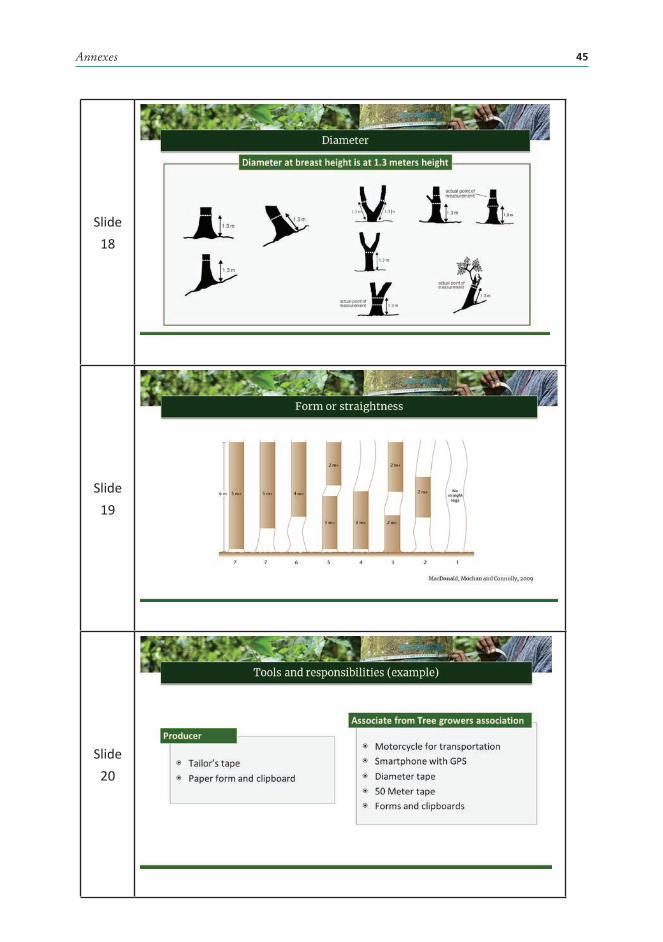
45Annexes
Slide 18
Slide 19
Slide 20
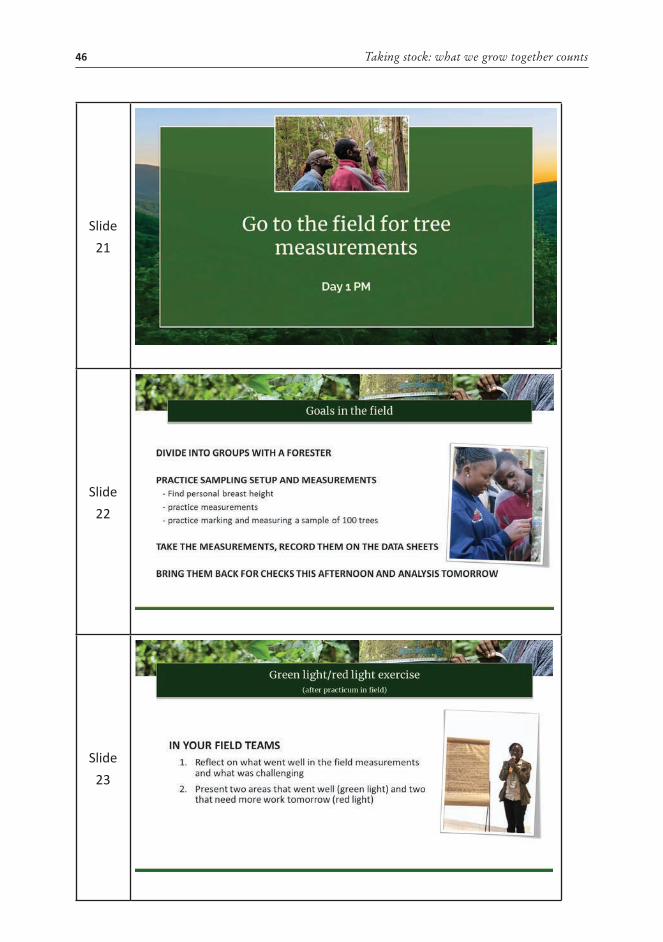
46 Taking stock: what we grow together counts
Slide 21
Slide 22
Slide 23
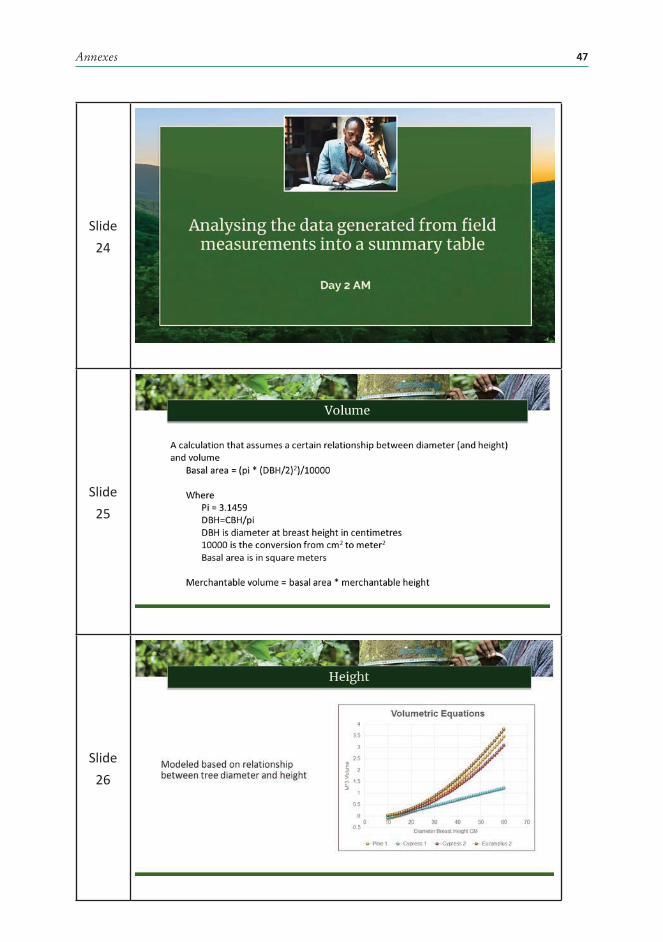
47Annexes
Slide 24
Slide 25
Slide 26
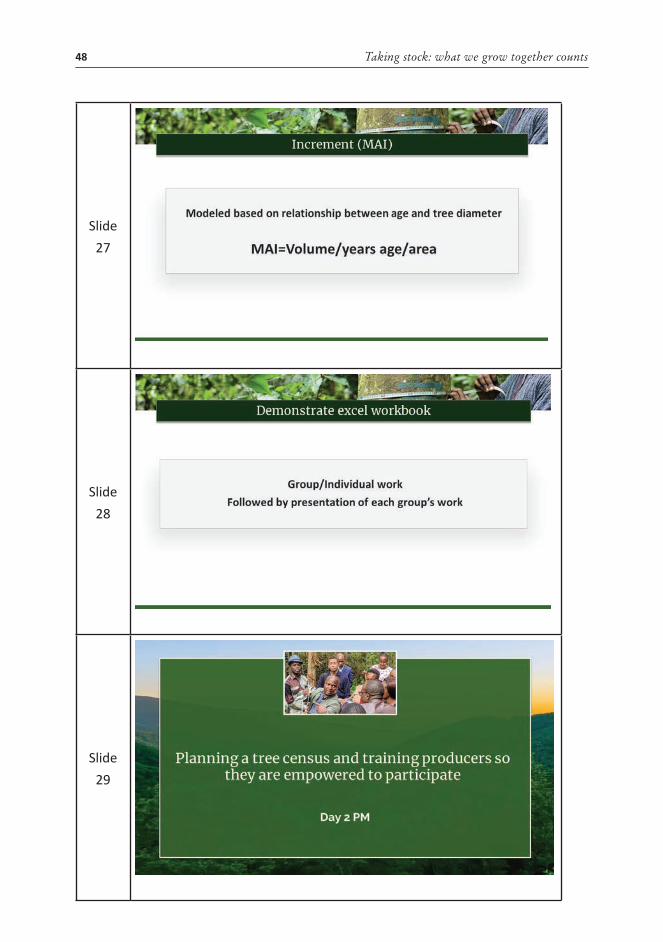
48 Taking stock: what we grow together counts
Slide 27
Slide 28
Slide 29
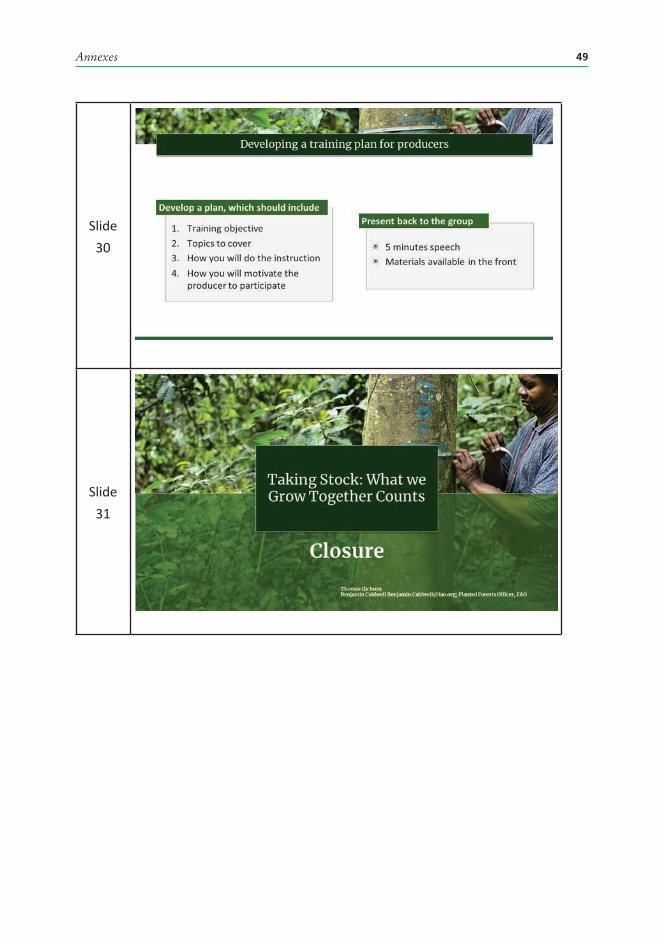
49Annexes
Slide 30
Slide 31
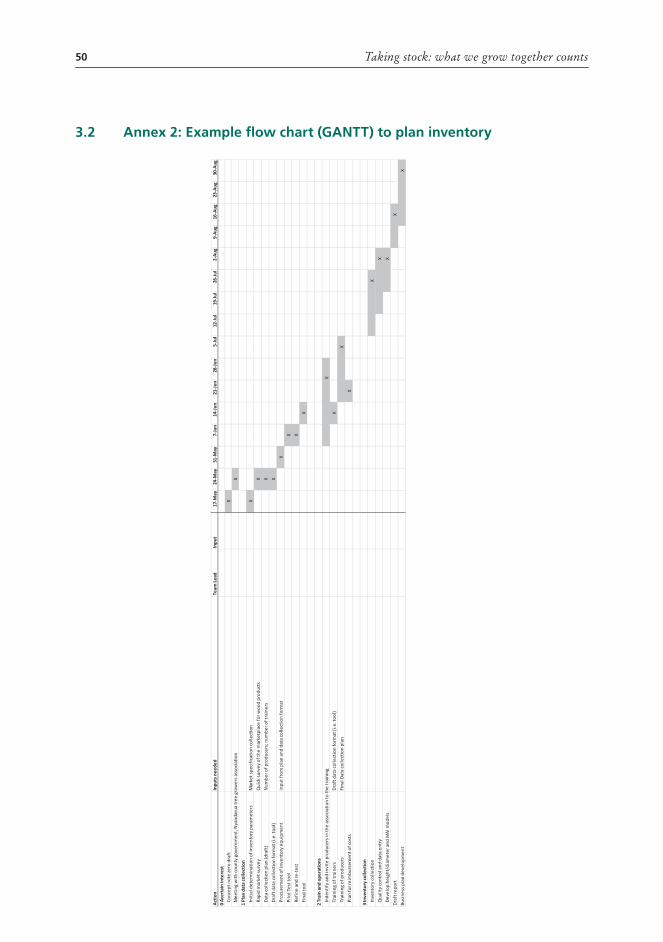
50 Taking stock: what we grow together counts
3.2 Annex 2: Example flow chart (GANTT) to plan inventory
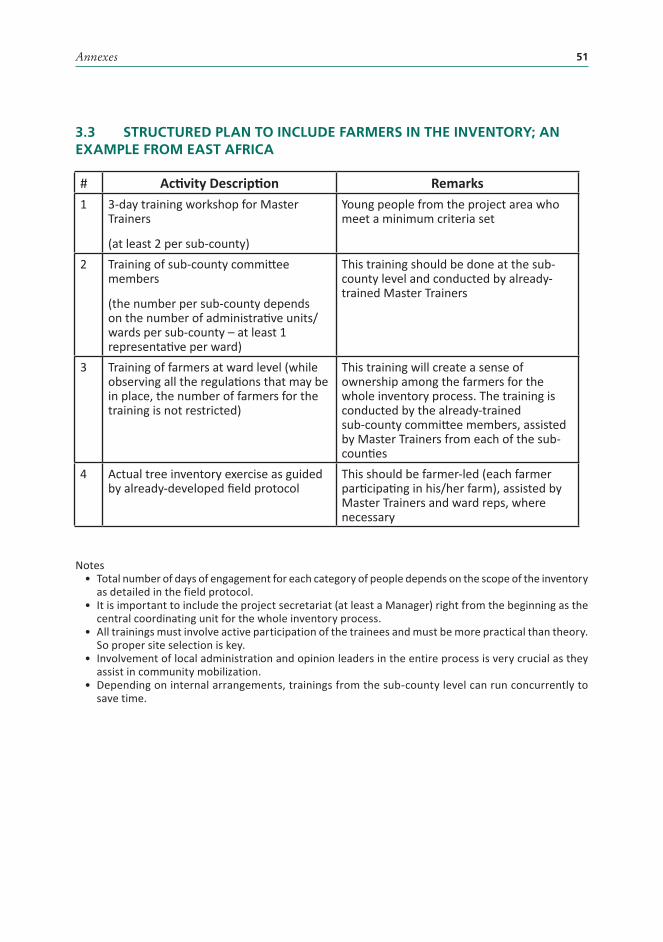
Annexes 51
3.3 STRUCTURED PLAN TO INCLUDE FARMERS IN THE INVENTORY; AN EXAMPLE FROM EAST AFRICA
Notes• Total number of days of engagement for each category of people depends on the scope of the inventory
as detailed in the field protocol.• It is important to include the project secretariat (at least a Manager) right from the beginning as the
central coordinating unit for the whole inventory process.• All trainings must involve active participation of the trainees and must be more practical than theory.
So proper site selection is key.• Involvement of local administration and opinion leaders in the entire process is very crucial as they
assist in community mobilization.• Depending on internal arrangements, trainings from the sub-county level can run concurrently to
save time.
# Activity Description Remarks1 3-day training workshop for Master
Trainers
(at least 2 per sub-county)
Young people from the project area who meet a minimum criteria set
2 Training of sub-county committee members
(the number per sub-county depends on the number of administrative units/wards per sub-county – at least 1 representative per ward)
This training should be done at the sub-county level and conducted by already-trained Master Trainers
3 Training of farmers at ward level (while observing all the regulations that may be in place, the number of farmers for the training is not restricted)
This training will create a sense of ownership among the farmers for the whole inventory process. The training is conducted by the already-trained sub-county committee members, assisted by Master Trainers from each of the sub-counties
4 Actual tree inventory exercise as guided by already-developed field protocol
This should be farmer-led (each farmer participating in his/her farm), assisted by Master Trainers and ward reps, where necessary
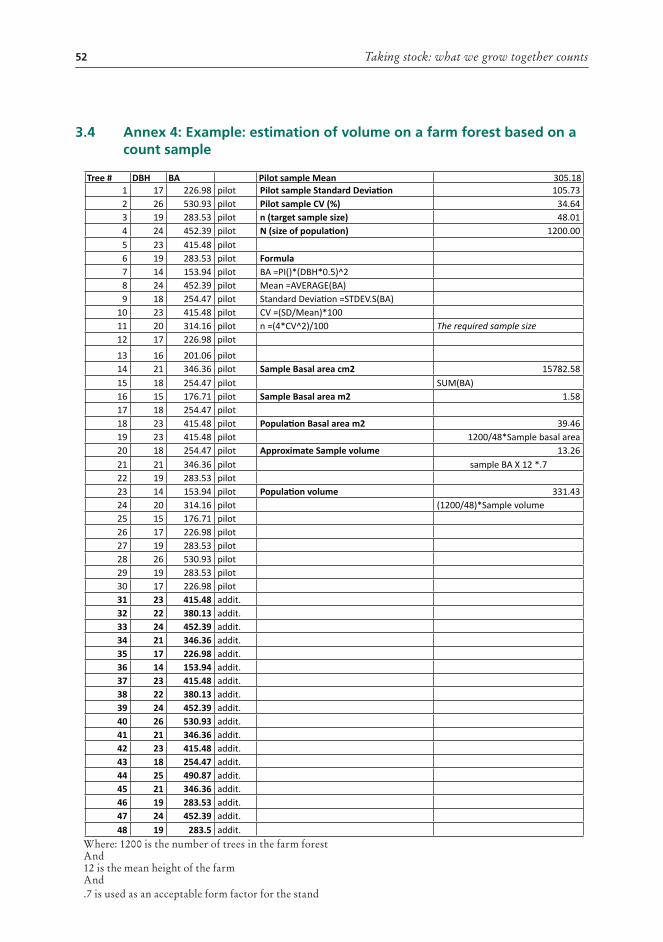
52 Taking stock: what we grow together counts
3.4 Annex 4: Example: estimation of volume on a farm forest based on a count sample
Tree # DBH BA Pilot sample Mean 305.181 17 226.98 pilot Pilot sample Standard Deviation 105.732 26 530.93 pilot Pilot sample CV (%) 34.643 19 283.53 pilot n (target sample size) 48.014 24 452.39 pilot N (size of population) 1200.005 23 415.48 pilot 6 19 283.53 pilot Formula 7 14 153.94 pilot BA =PI()*(DBH*0.5)^2 8 24 452.39 pilot Mean =AVERAGE(BA) 9 18 254.47 pilot Standard Deviation =STDEV.S(BA)
10 23 415.48 pilot CV =(SD/Mean)*100 11 20 314.16 pilot n =(4*CV^2)/100 The required sample size12 17 226.98 pilot
13 16 201.06 pilot 14 21 346.36 pilot Sample Basal area cm2 15782.5815 18 254.47 pilot SUM(BA)16 15 176.71 pilot Sample Basal area m2 1.5817 18 254.47 pilot 18 23 415.48 pilot Population Basal area m2 39.4619 23 415.48 pilot 1200/48*Sample basal area20 18 254.47 pilot Approximate Sample volume 13.2621 21 346.36 pilot sample BA X 12 *.722 19 283.53 pilot23 14 153.94 pilot Population volume 331.4324 20 314.16 pilot (1200/48)*Sample volume25 15 176.71 pilot 26 17 226.98 pilot 27 19 283.53 pilot 28 26 530.93 pilot 29 19 283.53 pilot 30 17 226.98 pilot 31 23 415.48 addit. 32 22 380.13 addit. 33 24 452.39 addit. 34 21 346.36 addit. 35 17 226.98 addit. 36 14 153.94 addit. 37 23 415.48 addit. 38 22 380.13 addit. 39 24 452.39 addit. 40 26 530.93 addit. 41 21 346.36 addit. 42 23 415.48 addit. 43 18 254.47 addit. 44 25 490.87 addit. 45 21 346.36 addit. 46 19 283.53 addit. 47 24 452.39 addit. 48 19 283.5 addit.
Where: 1200 is the number of trees in the farm forest And 12 is the mean height of the farmAnd .7 is used as an acceptable form factor for the stand
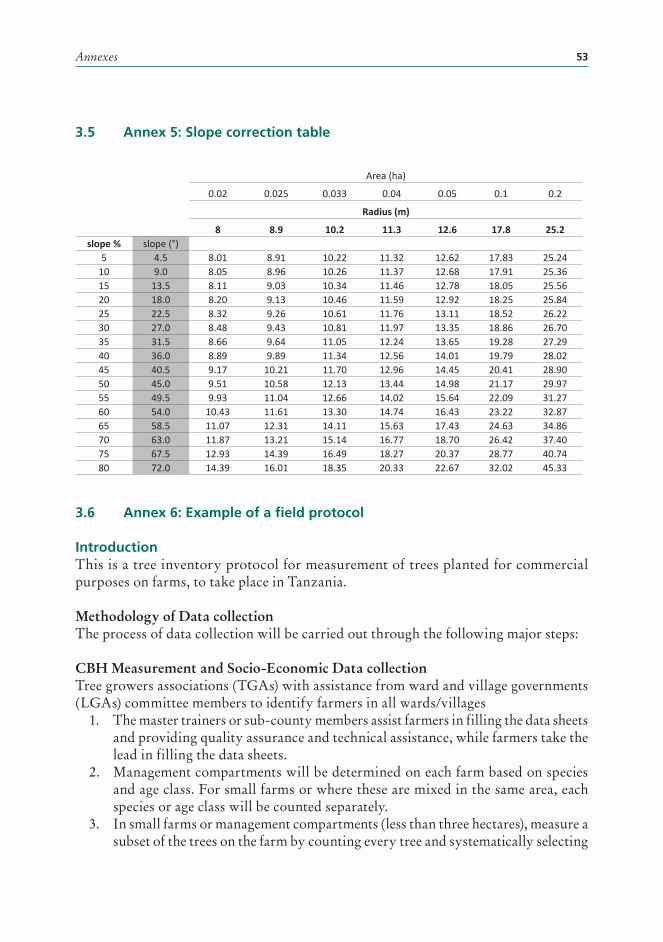
Annexes 53
3.5 Annex 5: Slope correction table
3.6 Annex 6: Example of a field protocol
IntroductionThis is a tree inventory protocol for measurement of trees planted for commercial purposes on farms, to take place in Tanzania.
Methodology of Data collectionThe process of data collection will be carried out through the following major steps:
CBH Measurement and Socio-Economic Data collection Tree growers associations (TGAs) with assistance from ward and village governments (LGAs) committee members to identify farmers in all wards/villages
1. The master trainers or sub-county members assist farmers in filling the data sheets and providing quality assurance and technical assistance, while farmers take the lead in filling the data sheets.
2. Management compartments will be determined on each farm based on species and age class. For small farms or where these are mixed in the same area, each species or age class will be counted separately.
3. In small farms or management compartments (less than three hectares), measure a subset of the trees on the farm by counting every tree and systematically selecting
Area (ha)
0.02 0.025 0.033 0.04 0.05 0.1 0.2
Radius (m)
8 8.9 10.2 11.3 12.6 17.8 25.2slope % slope (°)
5 4.5 8.01 8.91 10.22 11.32 12.62 17.83 25.2410 9.0 8.05 8.96 10.26 11.37 12.68 17.91 25.3615 13.5 8.11 9.03 10.34 11.46 12.78 18.05 25.5620 18.0 8.20 9.13 10.46 11.59 12.92 18.25 25.8425 22.5 8.32 9.26 10.61 11.76 13.11 18.52 26.2230 27.0 8.48 9.43 10.81 11.97 13.35 18.86 26.7035 31.5 8.66 9.64 11.05 12.24 13.65 19.28 27.2940 36.0 8.89 9.89 11.34 12.56 14.01 19.79 28.0245 40.5 9.17 10.21 11.70 12.96 14.45 20.41 28.9050 45.0 9.51 10.58 12.13 13.44 14.98 21.17 29.9755 49.5 9.93 11.04 12.66 14.02 15.64 22.09 31.2760 54.0 10.43 11.61 13.30 14.74 16.43 23.22 32.8765 58.5 11.07 12.31 14.11 15.63 17.43 24.63 34.8670 63.0 11.87 13.21 15.14 16.77 18.70 26.42 37.4075 67.5 12.93 14.39 16.49 18.27 20.37 28.77 40.7480 72.0 14.39 16.01 18.35 20.33 22.67 32.02 45.33
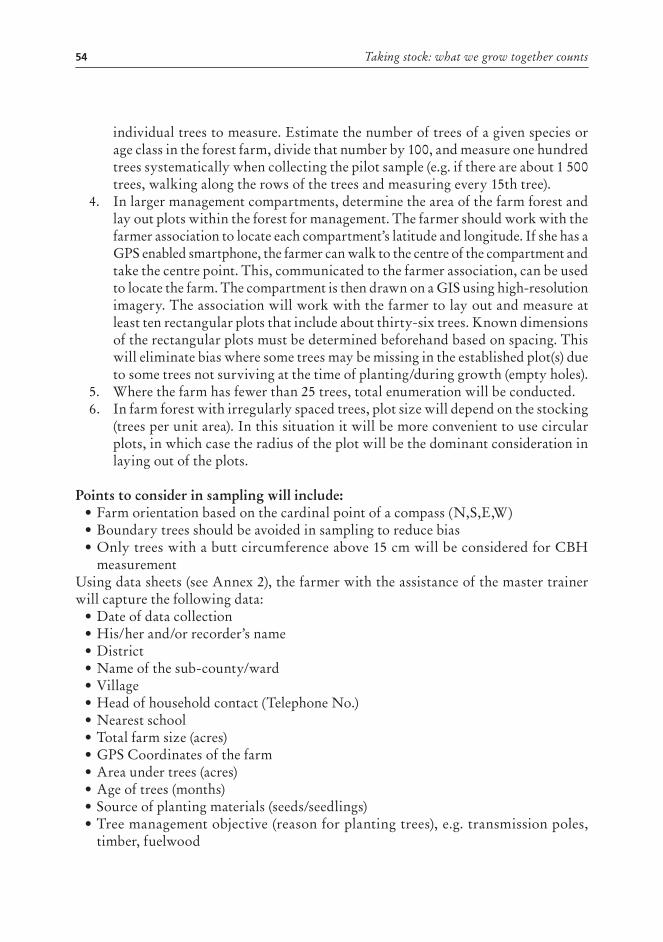
54 Taking stock: what we grow together counts
individual trees to measure. Estimate the number of trees of a given species or age class in the forest farm, divide that number by 100, and measure one hundred trees systematically when collecting the pilot sample (e.g. if there are about 1 500 trees, walking along the rows of the trees and measuring every 15th tree).
4. In larger management compartments, determine the area of the farm forest and lay out plots within the forest for management. The farmer should work with the farmer association to locate each compartment’s latitude and longitude. If she has a GPS enabled smartphone, the farmer can walk to the centre of the compartment and take the centre point. This, communicated to the farmer association, can be used to locate the farm. The compartment is then drawn on a GIS using high-resolution imagery. The association will work with the farmer to lay out and measure at least ten rectangular plots that include about thirty-six trees. Known dimensions of the rectangular plots must be determined beforehand based on spacing. This will eliminate bias where some trees may be missing in the established plot(s) due to some trees not surviving at the time of planting/during growth (empty holes).
5. Where the farm has fewer than 25 trees, total enumeration will be conducted.6. In farm forest with irregularly spaced trees, plot size will depend on the stocking
(trees per unit area). In this situation it will be more convenient to use circular plots, in which case the radius of the plot will be the dominant consideration in laying out of the plots.
Points to consider in sampling will include:• Farm orientation based on the cardinal point of a compass (N,S,E,W)• Boundary trees should be avoided in sampling to reduce bias• Only trees with a butt circumference above 15 cm will be considered for CBH
measurement Using data sheets (see Annex 2), the farmer with the assistance of the master trainer will capture the following data:
• Date of data collection • His/her and/or recorder’s name • District• Name of the sub-county/ward • Village • Head of household contact (Telephone No.)• Nearest school• Total farm size (acres)• GPS Coordinates of the farm• Area under trees (acres)• Age of trees (months) • Source of planting materials (seeds/seedlings) • Tree management objective (reason for planting trees), e.g. transmission poles,
timber, fuelwood
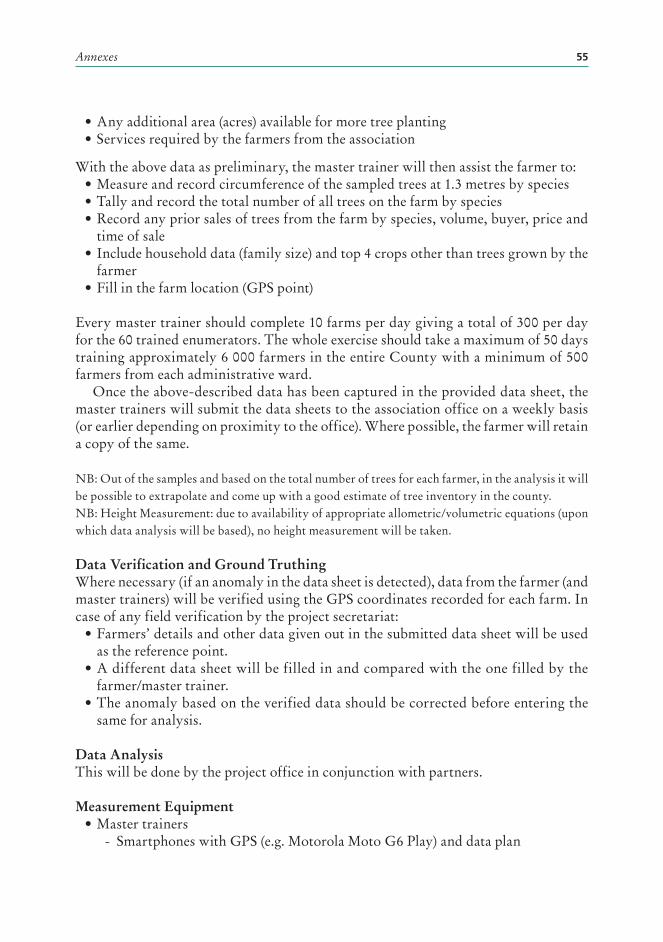
Annexes 55
• Any additional area (acres) available for more tree planting• Services required by the farmers from the association
With the above data as preliminary, the master trainer will then assist the farmer to:• Measure and record circumference of the sampled trees at 1.3 metres by species • Tally and record the total number of all trees on the farm by species• Record any prior sales of trees from the farm by species, volume, buyer, price and
time of sale• Include household data (family size) and top 4 crops other than trees grown by the
farmer• Fill in the farm location (GPS point)
Every master trainer should complete 10 farms per day giving a total of 300 per day for the 60 trained enumerators. The whole exercise should take a maximum of 50 days training approximately 6 000 farmers in the entire County with a minimum of 500 farmers from each administrative ward.
Once the above-described data has been captured in the provided data sheet, the master trainers will submit the data sheets to the association office on a weekly basis (or earlier depending on proximity to the office). Where possible, the farmer will retain a copy of the same.
NB: Out of the samples and based on the total number of trees for each farmer, in the analysis it will be possible to extrapolate and come up with a good estimate of tree inventory in the county. NB: Height Measurement: due to availability of appropriate allometric/volumetric equations (upon which data analysis will be based), no height measurement will be taken.
Data Verification and Ground TruthingWhere necessary (if an anomaly in the data sheet is detected), data from the farmer (and master trainers) will be verified using the GPS coordinates recorded for each farm. In case of any field verification by the project secretariat:
• Farmers’ details and other data given out in the submitted data sheet will be used as the reference point.
• A different data sheet will be filled in and compared with the one filled by the farmer/master trainer.
• The anomaly based on the verified data should be corrected before entering the same for analysis.
Data AnalysisThis will be done by the project office in conjunction with partners.
Measurement Equipment• Master trainers
- Smartphones with GPS (e.g. Motorola Moto G6 Play) and data plan

56 Taking stock: what we grow together counts
- Flexible tape (forestry or tailor’s tape measure, at least 90 inches or 200 cm) - 50-metre tape measure (e.g. Keson OTR10M100 Open Reel Fiberglass Tape Measure Reel with Double Hook) OR 50 metres of rope marked with measurements
- Clipboard and data sheets, pen and pencil - Personal protective equipment from the weather, mask and hand sanitizer - Transportation to farmers
• Farmers - Clipboard, folder, and data sheets, pens and pencils - Flexible tape (tailor’s tape measure, at least 90 inches or 200 cm)
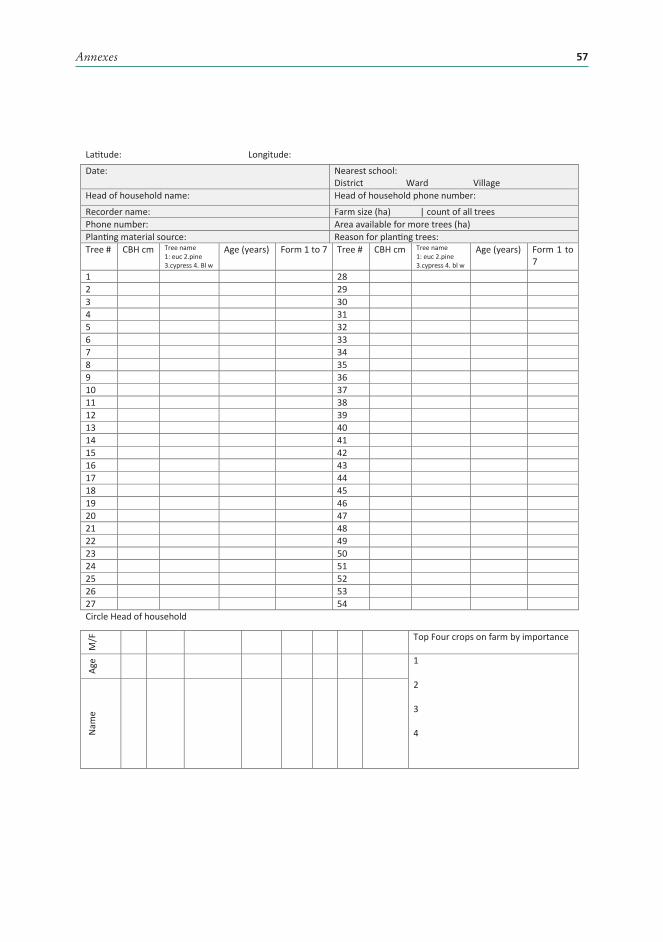
Annexes 57
Latitude: Longitude:
Date: Nearest school: District Ward Village
Head of household name: Head of household phone number:
Recorder name: Farm size (ha) | count of all trees Phone number: Area available for more trees (ha) Planting material source: Reason for planting trees: Tree # CBH cm Tree name
1: euc 2.pine 3.cypress 4. Bl w
Age (years) Form 1 to 7 Tree # CBH cm Tree name 1: euc 2.pine 3.cypress 4. bl w
Age (years) 7 Form 1 to
1 28 2 29 3 30 4 31 5 32 6 33 7 34 8 35 9 36 10 37 11 38 12 39 13 40 14 41 15 42 16 43 17 44 18 45 19 46 20 47 21 48 22 49 23 50 24 51 25 52 26 53 27 54
M/F
Circle Head of household
Top Four crops on farm by importance
Age 1
2
3
4 Nam
e
58 Taking stock: what we grow together counts
Tree # CBH cm Tree name 1: euc 2.pine 3.cypress 4. bl w
Age (years) Form 1 to 6 Tree # CBH cm Tree name 1: euc 2.pine 3.cypress 4. bl w
Age (years) 6 Form 1 to
55 82 56 83 57 84 58 85 59 86 60 87 61 88 62 89 63 90 64 91 65 92 66 93 67 94 68 95 69 96 70 97 71 98 72 99 73 100 74 101 75 102 76 103 77 104 78 105 79 106 80 107 81 108
Notes:

Annexes 59
Taking stock: what we growtogether countsA practical guide for family farmers and their associations todevelop a planted forest inventory
For more information, please contact:
Forestry – Natural Resources and Sustainable ProductionE-mail: [email protected] address: www.fao.org/forestry/enFood and Agriculture Organization of the United NationsViale delle Terme di Caracalla00153 Rome, Italy
23FORESTRYWORKING
PAPERFAO
21Takin
g sto
ck: wh
at we g
row
tog
ether co
un
ts - A p
ractical gu
ide fo
r family farm
ers and
their asso
ciation
s to d
evelop
a com
mercial tree in
vento
ry tree inven
tory
ISB
N 2
664
-106
2
CB4905EN/1/06.21
ISBN 978-92-5-134472-9I ISSN 2664-1062
9 789251 344729