Embed Size (px)
Citation preview

Portland State University Portland State University
PDXScholar PDXScholar
Dissertations and Theses Dissertations and Theses
1-1-2011
Real Options Methodology in Sportswear Retail Real Options Methodology in Sportswear Retail
Investment Valuation Investment Valuation
Hairong Karen Gui Portland State University
Follow this and additional works at: https://pdxscholar.library.pdx.edu/open_access_etds
Let us know how access to this document benefits you.
Recommended Citation Recommended Citation Gui, Hairong Karen, "Real Options Methodology in Sportswear Retail Investment Valuation" (2011). Dissertations and Theses. Paper 145. https://doi.org/10.15760/etd.145
This Dissertation is brought to you for free and open access. It has been accepted for inclusion in Dissertations and Theses by an authorized administrator of PDXScholar. Please contact us if we can make this document more accessible: [email protected].

Real Options Methodology in Sportswear Retail Investment Valuation
by
Hairong Karen Gui
A dissertation submitted in partial fulfillment of the requirements for the degree of
Doctorate of Philosophy in
Systems Science: Business Administration
Dissertation Committee: John Oh, Chair Janet Hamilton
Thomas Gillpatrick Wayne Wakeland Timothy Anderson
Phil Knight (non-voting member) Michael Wrinn (non-voting member)
Portland State University © 2011

Real Options Methodology in Sportswear Retail Investment Valuation Abstract
i
Abstract
The net present value (NPV) approach has been widely accepted by corporate
practitioners and academics as the principle tool for evaluating the feasibility of corporate
financial investment opportunities. It conceptually provides an estimate in present value
terms of a proposed investment’s incremental contribution to the firm, enabling the
company to pursue its goal of value maximization with more assurance. NPV uses a
discount rate that in theory captures market risks. In the stable growth or mature
industries, NPV works well. However, in high investment/high risk-return (HI/HRR)
industries, where the investment environment is often profiled as highly uncertain with
high returns, NPV is insufficient to reflect the multidimensional risks, hence unable to
capture the extensive investment returns that may consist of non-financial values.
This dissertation applies the real option (RO) valuation methodology,
supplementing the NPV method to evaluate the return of the sports retail industry (SRI)
flagship stores investments. This study further demonstrates that there are strategic values
captured by the RO valuation method, complementing the financial values attained by the
NPV. To test this assertion, we use case methodology to analyze four flagship investment
activities (proprietary business data are concealed). These investments represent various
investment options, including growth, expansion, staging, and delay. The cases include
projections made prior to the investment, the retrospective application of RO to estimate
strategic value, and the actual returns from these investments. Findings demonstrate
convincingly RO methodology can and should be usefully applied to supplement the
NPV method in HI/HRR industries, and SRI in particular.

Real Options Methodology in Sportswear Retail Investment Valuation Abstract
ii
Acknowledgements
I would like to gratefully and sincerely thank my Committee members for their
advice, patience, and, most importantly, their mentorship during my graduate studies.
Without the strong support and guidance of Dr. John Oh, Dr. Janet Hamilton, Dr. Tom
Gillpatrick, and Dr. Wayne Wakeland, and Mr. Phil Knight and Dr. Michael Wrinn, I
would not have been able to complete this work. I am greatly grateful to them.
In 2005, when I was searching for dissertation research topic, Dr. Beverly Fuller
introduced me to the Real Option concept. From my work at Nike, I witness leadership’s
ability to see beyond the financial data in strategic decision-making. Tim Hershey, then
General Manager of Retail, sparked my interest in the analysis and quantification of
strategic values embedded in retail investments in the sportswear industry.
While working for the company overseas, I visited many flagship stores in many
countries to personally experience and observe the “non-financial” embedded values.
These trips reinforced my belief that some of the flagship stores’ strategic merits are not
fully captured or measured by financial numbers. In seeking managerial insights as why
these investments were made, I was privileged to interview practitioners, seeking their
practical insights. These indispensable discussions provide exceedingly valuable input to
this study. I would like to thank them all for sharing their knowledge and expertise.
A special appreciation is dedicated to Mr. Phil Knight, a leader who, in essence,
shaped the sportswear industry for my generation and for future generations. Mr. Knight
inspired and continues to inspire me to challenge the “conventional wisdom.” I am very
thankful to his coaching on Nike’s heritage, an unwavering and lasting legacy.

Real Options Methodology in Sportswear Retail Investment Valuation Abstract
iii
The most important person in this research effort, and the person who made
completion of this work and my study possible, is my Committee Chairman, Dr. John Oh.
Not only did he bring this research to life and steer me through this PhD journey, but also
he cultivated, evolved and enhanced my professional, academic, and personal growth.
Through this long and sometimes lonely tunnel, I have benefited greatly from his strong
mentorship and friendship. Dr. Oh has been my guiding light in this research and
throughout this long journey. “Once teacher, lifetime mentor.” I am indebted to Dr. Oh.
A very special thank-you must be dedicated to William Bloom, my colleague,
friend, and editor. He encouraged me to become a noble educator, also an optimistic,
helpful individual with an open mind and a humble heart. I would not be here today
without the inspiration, motivation and encouragement of my Honorary “uncle Bill.”
Finally, I would like to thank my father, mother, and sister. For over eight years,
you have given me steadfast support, encouragement, patience and unconditional love.
Your tolerances of my obsession of continuous learning, your faith and confidence in me,
and your willingness to allow me to be as ambitious as I wanted to be, have been
unwavering. Because of you, I have endless drive, energy, and motivation to tackle
whatever lies ahead of me. This part of my life-long learning journey started with a
dream, a dream that someday I can become a great inspirational educator like my father.
He is my source of wisdom and strength of mind in life.
I have asked Dr. Oh and all of the people who helped and contributed in this study,
“How I can thank you?” They all simply tell me to “Pass it on.”
Thank you. I shall.

Real Options Methodology in Sportswear Retail Investment Valuation Abstract
iv
Main Contributors to this Research
Phil Knight (Chairman & Co-Founder, Nike, Inc.)
Robert Merton, Ph.D. (Massachusetts Institute of Technology/Nobel Prize Winner)
Tim Hershey (VP/GM Nike Retail North America)
Trevor Vigfusson (CFO, Nike Global Retail)
William Bloom (Advisor, JD)
Interviewees (in the order of interviews)
Keith Fitz-Gerald (Investment Director Money Map Press)
Charlie Wadsworth (CFO, Vtech Inc, Former Europe Finance Director, Nike Inc.)
David Sanderson (Europe Retail Finance Director, Nike Inc.)
Ryan K. Smith (CFO, Nike Golf)
Simon Kemmett (Sr. Director Business Planning, Former CFO, Nike Europe)
Lisa McKillips (Assistant to Phil Knight, Nike Inc)
Eunan McLaughlin (Former President Nike Affiliates Brands)
Victor Williems (LEAN Business Solutions, European Director)
Sonia de Paolis (Treasury Director, TomTom, former Sr Treasury Analyst, Nike Inc)
Maximo Alfonsi (Founder, MaxieWeb)
Olivier Pennetier (Counselor, One Plus Investment, France; Former Niketown Paris, GM)
Sean Ghouse (Head of Home Retail Alfred Dunhill, Former Niketown London GM)
Orences Christian (Jordan Brand Sales Rep, Former Niketown Chicago General Manager)
Rob Weerts (Niketown Project Manager, Nike Inc.)

Real Options Methodology in Sportswear Retail Investment Valuation Abstract
v
Jean-Philippe Sauvageot (Director of Stores Western Europe)
Nicola Chardon (Former European Retail Finance Director)
Jon McCathy (former UK Retail Development Manager, Nike Inc)
Paul Klein (West Europe Merchandizing Manager, Nike Inc)
Raymond Gregor (Window Dresser, De Bijenkorf Department Store, Amsterdam)
Dale Frakes (Senior Supply Chain Analyst, Nike Inc)
Philip Hatton (Golf Club Business Manager, Nike Inc)
Bill Mullen (LEAN Director, Nike Inc)
Ronald Tracey (Enterprise Architecture Director, Nike Inc)
Arnie Gardner (Dir Global Financial Planning, Nike Inc)
Tambert Lau (Retired Nike Senior Product Engineer)
Allan Brovo (Niketown Chicago original store design project lead)
Dan Burris (GM Action Sports, Nike Inc)
Janet Callahan (Emerging Market Retail Operation Manager, Nike, Inc)
Kelly Heiden (Process Manager, Nike Inc)
Nelson Farris (Nike Communication Director)
Richard McDaniel (Retail Concept Director)
Marshall McCauley (Nike Planning/Allocation Director)

Real Options Methodology in Sportswear Retail Investment Valuation Table of Contents
vi
Table of Contents
Abstract ................................................................................................................................ i
List of Tables ..................................................................................................................... ix
List of Figures ..................................................................................................................... x
1 Introduction ................................................................................................................ 1
1.1 Background ........................................................................................................ 1
1.2 Aim and Research Contribution ......................................................................... 4
2 Literature Review....................................................................................................... 7
2.1 Theoretical Foundation Overview ...................................................................... 7
2.1.1 Financial foundation overview. .................................................................. 7
2.1.2 Real options. ............................................................................................. 24
2.1.3 RO application in industries summary. ..................................................... 35
2.2 Real Option: Managing Strategic Investment in an Uncertain World ............. 46
2.3 Strategic Flexibility in the Financial Services Industry ................................... 50
2.4 Real Options: Still Looking for Evidence? ...................................................... 51
2.5 The Role of Real Options in Capital Budgeting: Theory and Practice ............ 54
2.6 How Kimberly-Clark Uses Real Options ......................................................... 57
2.7 Sub-Finance: New Sources of Data for Real Options Analysis ....................... 59
2.8 Real Options in Strategic Management Advances in Strategic Management .. 61
2.9 Management Corporate Finance Decision Making—Corporate Finance in Europe: Confronting Theory with Practice ...................................................... 63
2.10 Option Valuation of Architectural Flexibility: A case study of the option to convert to office space ...................................................................................... 65
2.11 Mixed Uses and the Redevelopment Option .................................................... 66
2.12 Valuing Retail Shopping Center Lease Contracts Incorporating Inter-Store Externality Effects: A Real Option Approach .................................................. 68
2.13 Making Real Options Real ............................................................................... 70
2.14 Using Real Options In Strategic Decision Making .......................................... 72
2.15 Managerial Implications of Implementing Real Options Thinking In Resource Allocation ......................................................................................................... 73
2.16 Decision Making for Technology Executives, Artech House .......................... 74
3 Sportswear Industry Development ........................................................................... 79
3.1 Improved Living Conditions Created the Sportswear Industry ........................ 79
3.2 Changes in Lifestyle Led to the Evolution of the Sportswear Industry ........... 80
3.3 Sportswear Industry Extension: Sportswear Retail Industry ............................ 80
3.4 SRI Distinguishing Industry Characteristics .................................................... 82
3.4.1 Sports celebrities and team endorsements. ............................................... 82
3.4.2 Dependency on sports events & results & celebrities ............................... 83
3.5 Sportswear Retail Industry Analysis - Increasing Volatility ............................ 85
3.5.1 Retail industry increasing volatility. ......................................................... 85
3.5.2 Sportswear retail industry increasing volatility. ....................................... 86
3.5.3 Sportswear retail industry summation. ..................................................... 87

Real Options Methodology in Sportswear Retail Investment Valuation Table of Contents
vii
3.6 Why has RO not yet been applied in the SRI? ................................................. 87
3.7 Research Questions .......................................................................................... 90
4 Research Methodology ............................................................................................ 92
4.1 Overview .......................................................................................................... 92
4.2 The RO Models to be tested ............................................................................. 94
4.3 Determining Sigma in the SRI ......................................................................... 96
4.4 Data Sources / Cases ........................................................................................ 97
4.4.1 Data sources. ............................................................................................. 97
4.5 Testing Procedure / Analyses for Investment Decisions .................................. 99
5 Case Studies ........................................................................................................... 100
5.1 Overview ........................................................................................................ 100
5.1.1 Inputs required in the application of the real options model. ................. 114
5.1.2 Regressions and correlations................................................................... 117
5.1.3 RO application in NikeTown investment. .............................................. 118
5.2 Case - NikeTown London (NTL) ................................................................... 120
5.2.1 The U.K. macro-economic & sportswear retail environment. ................ 120
5.2.2 The London macro-economic & retail demographic environment......... 121
5.2.3 Details of NTL remodeling investment. ................................................. 122
5.2.4 Application of RO to NTL. ..................................................................... 126
5.2.5 NTL concluding remarks & actual results after the remodeling. ............ 128
5.3 Case – NikeTown Paris (NTP) ....................................................................... 130
5.3.1 The French macro-economic & sportswear retail environment. ............ 130
5.3.2 The Paris retail environnent & Champs Elysees. .................................... 134
5.3.3 Details of the NTP Investment ................................................................ 136
5.3.4 Application of RO to NTP ...................................................................... 136
5.3.5 NTP concluding remarks. ....................................................................... 140
5.4 Case - NikeTown Chicago (NTC) .................................................................. 142
5.4.1 The United States macro-economic & sportswear retail environment. .. 142
5.4.2 The Chicago macro-economic & retail demographic environment. ....... 143
5.4.3 NikeTown Chicago. ................................................................................ 145
5.4.4 Details of the NTC remodeling investment. ........................................... 149
5.4.5 Application of RO to NTC. ..................................................................... 150
5.4.6 NTC concluding remarks. ....................................................................... 155
5.5 Case – NikeTown Beijing (NTB) ................................................................... 158
5.5.1 The Chinese macro-economic & sportswear retail environment. ........... 158
5.5.2 (Branded) sportswear industry in China. ................................................ 160
5.5.3 Sigma in RO Application in NTB. .......................................................... 163
5.5.4 Beijing macro-economic & retail demographic environment. ............... 167
5.5.5 Application of RO to NTB ...................................................................... 171
5.5.6 NTB 2nd stage investment. ...................................................................... 174
5.5.7 NTB concluding remarks. ....................................................................... 177
6 Discussion .............................................................................................................. 180
6.1 Overview ........................................................................................................ 180

Real Options Methodology in Sportswear Retail Investment Valuation Table of Contents
viii
6.2 Interpretation of the Results ........................................................................... 182
6.2.1 Sportswear retail industry. ...................................................................... 182
6.2.2 Case studies. ............................................................................................ 183
6.2.3 The key variable in the model: sigma .................................................... 186
6.3 Strategic Value Embedded in Strategic Investments ..................................... 187
6.4 Significance of This Research ........................................................................ 194
6.5 Potential Limitations (Threats to Validity) .................................................... 197
6.5.1 Conceptual limitations. ........................................................................... 197
6.5.2 Data limitation. ....................................................................................... 199
6.5.3 Practical considerations. ......................................................................... 200
6.6 Future Research .............................................................................................. 201
6.6.1 Complementary valuation method in corporate finance. ........................ 201
6.6.2 Exploring RO application to abandonment option. ................................ 201
6.6.3 Other potential future research. ............................................................... 202
References ....................................................................................................................... 204
Appendix A : Sportswear Industry ................................................................................. 237
A-1 Industry Analysis ............................................................................................ 237
A-1.1 Retail industry overview - Porter’s five forces analysis. ........................ 237
A-2 Retail Industry Growth – Global Retail Outlook ........................................... 239
A-2.1 Regional growth. ..................................................................................... 239
A-2.2 U.S. retail industry overview. ................................................................. 239
A-2.3 Global market overview on sportswear industry .................................... 240
A-2.4 Global market: sportswear retail industry. .............................................. 241
A-2.5 US sportswear retail market analysis. ..................................................... 243
A-2.6 Time series of the yearly change rate of total annual sales..................... 245
A-3 Sportswear Retail Characteristics Overview .................................................. 248
A-4 Sportswear Retail Industry Investment Valuation .......................................... 250
Figure B-1: Diagram Methodology Flow & Output Comparison .................................. 251
Appendix B : Nike Sport Brand Key Athletes Endorsed ................................................ 252
Appendix C : Nike Best Positioned in Footwear Product Innovation History ............... 253
Appendix D : Nike Timeline........................................................................................... 255
D-1 The 1960s-70s ................................................................................................ 255
D-2 The 1980s ....................................................................................................... 255
D-3 The 1990s ....................................................................................................... 257
D-4 The 2000s ....................................................................................................... 258
Appendix E : Correlation ................................................................................................ 261
Appendix F : Other Approach to define Sigma .............................................................. 263
F-1 UK Retail index .............................................................................................. 263
F-2 Other Sigma definition approaches ................................................................ 264
Appendix G : RO testing example - “Flushed Data.” ..................................................... 266

Real Options Methodology in Sportswear Retail Investment Valuation List of Tables
ix
List of Tables
Table 1: Effect of Increase in BSOPM Variable on Call and Put Option Prices .............. 13 Table 2: Black Scholes Option Valuation Model Example – US Treasury Bond ............ 13
Table 3: Put-Call Option Parity ........................................................................................ 16
Table 4: Real Option Evolution Building Blocks ............................................................. 28
Table 5: Chronological Real Option Development (Empirical Testing, Case Studies, and Theory Contribution) ...................................................................................... 30
Table 6: RO Application Development (Empirical Testing, Case Studies, and Contribution, sorted by Application Area) ..................................................... 36
Table 7: Real Option Development – Volatility Modification ......................................... 44
Table 8: Inputs for Option Valuation in General in the Sportswear Retail Industry ........ 96 Table 9: Summary of U.S. Nike Retail Stores as Summer 2010 .................................... 112
Table 10: Summary of Non-U.S. Nike Retail Stores as of Summer 2010...................... 112
Table 11: NPV Calculation for NTL (USD Millions) .................................................... 125
Table 12: Inputs for Option Valuation Variables in NTL Calculation – Std. Dev. of Nike Stock ............................................................................................................. 126
Table 13: Inputs for Option Valuation Variables in NTL Calculation – Std. Dev. NTL Sales .............................................................................................................. 127
Table 14: City Analysis – France.................................................................................... 132
Table 15: NPV Calculation for NTP (USD Millions) .................................................... 136
Table 16: Inputs for Option Valuation Variables in NTP Calculation – Std. Dev. Nike Stock ............................................................................................................. 138
Table 17: NPV Calculation for NTC (USD Millions) .................................................... 151
Table 18: Inputs for Option Valuation Variables in NTC Calculation – No Delay ....... 152
Table 19: Inputs for Option Valuation Variables in NTP Calculation – With Delay ..... 153
Table 20: Correlation Matrix .......................................................................................... 165
Table 21: Beijing Major Retail District Demographic Comparison ............................... 170
Table 22: NPV Calculation for NTB .............................................................................. 171
Table 23: Inputs for Option Valuation Variables in NTB Calculation – 5 Year ............ 172
Table 24: NTB Second Stage Investment NPV Calculation .......................................... 176
Table 25: Inputs for Option Valuation Variables in NTB Calculation – Second Stage Investment ..................................................................................................... 176
Table 26: NikeTown Case Study Results Summary ....................................................... 181

Real Options Methodology in Sportswear Retail Investment Valuation List of Figures
x
List of Figures
Figure 1: Retail Industry Monthly Trending Sales 1992 vs. 2010 .................................... 86
Figure 2: China Sportswear Industry Key Players .......................................................... 163

Real Options Methodology in Sportswear Retail Investment Valuation Introduction
1
1 Introduction
1.1 Background
To remain competitive, any successful company must select from among
competing investment alternatives. How can corporate management and investors decide
which of the competing projects should receive funding priority? Normally the primary
task of corporate investment analysts is to evaluate the net return by comparing the costs
and benefits of the proposed investment. This is complex because the costs that incurred
today are certain while the benefits to be reaped in the future are uncertain. In order to
accurately evaluate the net return, investors and managers use a range of methodologies.
The conventional valuation models are Net Present Value (NPV), Internal Rate of Return
(IRR), Payback methods (PB), and Economic Value Added (EVA). These valuation
methodologies have worked very well for decades and are widely used in investment
valuation. In this study, the primary focus will be on NPV methodology, as this is the
most widely used.
NPV methods1 have long been used to value prospective investments by
computing the risk-adjusted present value of the projected revenue streams. It has been
widely accepted by corporate practitioners and is considered a part of the required
fundamental knowledge in finance in all business schools. The NPV model makes a
1 The NPV approach has been widely accepted by corporate practitioners, and considered as part of the required fundamental knowledge in all business schools. The concept is well known, taught, and extensively covered in all business finance and financial management textbooks. See, for example, Richard Brealey, Stewart Myers and Franklin Allen, Principles of Corporate Finance, Ninth Edition, (N.Y. McGraw-Hill, 2008).

Real Options Methodology in Sportswear Retail Investment Valuation Introduction
2
series of assumptions regarding the internal and external economic environments that
enable the future income stream (cash flows) from an investment to be discounted to its
present value. The value of the required investment is then subtracted from the present
value of future cash flows to calculate the NPV. If the NPV is positive, the investment is
expected to yield an economic profit that will add that amount of value, the NPV, to the
total value of the firm. Likewise, if the NPV is negative the investment is expected to
subtract that amount of value from the value of the firm. Further, by comparing the
NPV’s of competing investment possibilities, if the underlying assumptions are correct
the investment opportunities may be ranked in their order of likely profitability. Thus,
NPV conceptually provides an estimate to the firm of the incremental dollar contribution
of a proposed investment in present value terms that meets the company’s goal of value
maximization; for the most part, it has been a very useful investment valuation tool,
widely used by investors and company management.
However, in the case of companies within industries with a high investment/high
risk-return (HI/HRR) profile, investment returns may well go beyond immediate financial
profits, including such benefits as first-mover advantages2, market share expansion, brand
exposure, the strengthening of consumer relationships, and similar strategic gains that are
not necessarily reflected in direct financial returns of the investment. NPV, with its
inherent cash flow estimation restrictions (using only financial accounting numbers to
reflect the investment returns) and difficulties in capturing market risks may not
2 Porter M. (1986), Competitive Advantage, New York: Free Press.

Real Options Methodology in Sportswear Retail Investment Valuation Introduction
3
accurately reflect the overall value contribution of investment projects in such industries.
To address this NPV limitation, starting from the early 1980’s, academics and
practitioners began looking into alternative valuation methodologies.
In 1984, Dr. Stewart Myers demonstrated that the rationale behind the valuation
of financial options could also be applied in situations where an investor could elect to
make or decline to make an investment in a non-financial option. He constructed the
“Real Options” (RO) concept upon the foundation of the Black-Scholes Option Pricing
Model (BSOPM) by extending it beyond the valuation of financial options to the
valuation of real asset investment opportunities or projects.
In Dr. Robert Merton’s 1998 Nobel Laureate speech, he succinctly outlined the
development of option pricing strategy, particularly following the breakthrough
introduction of the BSOPM in 1973. Dr. Merton highlighted the many improvements
made to option pricing theory and practice by a series of gifted and determined scholars
during the decades following its introduction.
As RO generated a noticeable amount of research interest in the academic field, it
also caught the attention of practitioners. In particular, practitioners in HI/HRR industries
have turned to RO methodology to supplement NPV in the evaluation of real asset
investment opportunities. In these industries, the RO method has demonstrated its value-
added contribution to strategic and financial decision-making processes.
In this research, we explore an innovative application of RO within a newly
evolved industry, namely, the sportswear retail industry (SRI). As will be shown, with its
own specific industry characteristics the SRI can be viewed as a high risk-return (HRR)

Real Options Methodology in Sportswear Retail Investment Valuation Introduction
4
industry3 because large investments are often needed. This industry has been and
presently is dominated by several key global players, namely, Nike (US), Adidas &
Reebok (Germany), Puma (Germany), Asics (Japan), and Lining (China). The
consolidation of this industry has generated strong integration across the manufacturing,
supply chain, marketing, and in particular, the sales functions at its retail front. The SRI
has developed into an established retail sector that is different from the general retail
industry. As a result of its HRR characteristics, using NPV alone has become less and
less satisfactory in the valuation of large investment opportunities in the SRI.
1.2 Aim and Research Contribution
This dissertation aims to demonstrate that the RO methodology can and should be
usefully applied in the high risk and high reward investment valuation, supplementing the
NPV method to capture …
Similar to financial option’s definition, a Real Option can be considered as a right
but not the obligation to acquire the present value of the expected cash flows by making
an investment when the opportunity is available. Unlike financial options, Real Options
rarely have defined lives and are generally not tradable. This has been and still is the
main limitation of RO application in practice. In 1977, Dr. Steward Myers4 extended the
financial option valuation concept to the valuation of real assets investment projects. He
3 Not all SRI investments require upfront investments as heavy as HI/HRR industries, depends on the location, size of the store, and or store presentation. 4 Myers, Stewart C. (1977) “Determinants of Corporate Borrowing”, Journal of Financial Economics 5, 147-175.

Real Options Methodology in Sportswear Retail Investment Valuation Introduction
5
demonstrated that real asset investment analysts could treat explicit options in real asset
investments as if they were financial options (using BSOPM as one of the tools). He
advocates that, even when a specific investment option is not traded, the RO
methodology can still be employed, in conjunction with NPV, to improve investment
decision-making process when there are embedded option values5.
In today’s business, successful multinational companies must have strong brand
recognition to sustain and gain global market shares. The SRI industry’s dependency
upon the sports business (sports events, game results, and the performance of celebrities)
makes brand equity an essential part of the business success. One of the most effective
venues for the promotion of brand recognition of products is flagship stores6. These
stores require a high level of expenses and may or may not generate financial profits.
However, they are strategically important to the company and can broaden the brand
exposure, deepen and expand the consumer relationships, and generate market excitement
for the brand, and more. These store investments may comprise millions of dollars while,
as previously described, returns oftentimes take many forms in addition to the financial
outcomes. These external value effects or economic externalities from major investment
decisions of the company may constitute unique applications of real options
complementing the NPV analyses. This study, presents case-by-case analysis of
5 These option values are: (a) the option to delay “wait-and-see”; (b) the option to expand or grow; and (c) the option to abandon the project. 6 Flagship store: a shop with a large floor area dedicated to a single brand and stocking a very wide range of the brand’s products. The flagship is the principle showcase of the brand and a key tool in its promotion. It symbolized its mission, image and values and is a tangible demonstration of brand awareness. Source: Ledicodumarketing.fr. Nike “flagship store” definition varies as the company expands and evolves its marketing strategy.

Real Options Methodology in Sportswear Retail Investment Valuation Introduction
6
investments in major flagship stores located in different countries and on different
continents7. These mega-stores present various RO applications8: expansion, growth,
delay, and staging options. Sensitive proprietary business information, data, and store
names may be concealed or disguised for competitive reasons9. All other business related
data discussed in this dissertation are from public sources.
This research explores the various indicators, or measures, of volatility in order to
determine which would be the most applicable. As a newly evolved industry, measures of
SRI volatility indicators have not yet been established. Therefore, the present study
considered several candidate measures, and used an extensive proprietary database to
select the best measure and demonstrate its efficacy.
The primary significance of this research is its contribution toward improved
accuracy in SRI investment valuation through the use of RO methodology as a
supplement to traditional NPV methods. This study uses the Black-Scholes financial
option pricing model and applies the RO conceptual framework to SRI investment
valuation situations. It is anticipated that future research will demonstrate that the method
can also be applied beyond SRI that is to the retail industry in general.
7 Data may be proportionally adjusted and the individual store names and locations will be concealed for business confidentiality. During this research, we interviewed business practitioners within and outside the company. The full list is in the Acknowledgement section. 8 Detailed reference see footnote in Literature Review and Case Studies. 9 Actual investment details may not be disclosed for reasons of business confidentiality. Details disclosed here are only for the purpose of this study. The final presentation of this paper may only provide partial disclosure.

Real Options Methodology in Sportswear Retail Investment Valuation Literature Review
7
2 Literature Review
2.1 Theoretical Foundation Overview
2.1.1 Financial foundation overview.
In 1973, Fischer Black and Myron Scholes devised a formula to value financial
options10, known as the Black Scholes Option Pricing Model. The original formula
calculates the theoretical option value - the present value of the expected option payoff –
under the assumption that no dividends, taxes, or transaction costs were paid. This model
was based on the proposition that options are not correctly priced in the market. If they
could be more accurately priced through use of a financial model, it would become
possible to capture riskless profits by creating portfolios of long and short positions in
options and stocks.11
Later modified by Robert Merton, the formula incorporates dividends. This
dividend variable reduces the value of the share to the option holder by the present value
of the forgone dividend and reduces the cost of holding a share by the dividend stream
that would be received12. Since then, the Black Scholes Option Pricing Model with
Merton’s modification has been widely used to value options in the financial investment
10 Financial options: for the payment of a specific price, a financial option provide the right (but not the obligation) to buy or sell a specific amount of a stock or other financial asset during a specified time window, for a specified price (the “strike” price). Financial options are generally freely tradable. The underlying financial asset might be common stock, bonds or other financial instruments. 11 Black, F. and Scholes, M. (1973) “The Pricing of Options and Corporate Liabilities”, Journal of Political Economy, (May-June), 637-659. 12 Merton, R.C. (1973) “Theory of Rational Option Pricing”, Bell Journal of Economics and Management Science vol. 4 (Spring).

Real Options Methodology in Sportswear Retail Investment Valuation Literature Review
8
sector because the theory proved to be quite accurate. In 1997, Myron Scholes and Robert
Merton were awarded the Nobel Prize in Economics.
In 1984, Stewart Myers extended the option pricing analysis of financial options
to the valuation of real asset13 investments in the corporate finance sector. This review
will provide an overall summary of the literature and will then concentrate on the most
significant research addressing the application of the BSOPM to real asset valuation in
corporate financial planning.
In their 1973 article, “The Pricing of Options and Corporate Liabilities”, Black
and Scholes started with a general introduction to options and demonstrated the
relationship between option price and stock price. In general, the higher the stock price,
the higher will be its call option price; in a simple call option scenario, a given percentage
change in stock price (given the maturity constant) will result in a larger percentage
change in the corresponding option value. “The relative volatility of the option is not
constant, however: it depends on both the stock price and maturity.”14 Before proceeding
to use the relationship to derive the BSOPM, they analyzed the previous work on the
valuation of options15.
In 1969, Merton, together with Scholes, recognized that “discounting the expected
value of the distribution of possible values of the warrant when it is exercised is not an
13 Real assets: Actual, tangible asset (such as valuable antique or art, buildings, coins, commodity, machinery and equipment, stamp collection) as opposed to financial assets (such as bonds, debentures, shares). 14 Black, F. and Scholes, M. (1973) “The Pricing of Options and Corporate Liabilities”, Journal of Political Economy, (May-June). 15 Starting from Sprenkle’s 1961 formula for valuing warrants. In this expression, however, Black & Scholes commented that Sprenkle was not able to identify two variables: k and k*.

Real Options Methodology in Sportswear Retail Investment Valuation Literature Review
9
appropriate procedure. … But they do not make use of the fact that investors must hold
other assets as well, so that the risk of an option or stock that affects its discount rate is
only that part of the risk that cannot be diversified away.”16
The last developed concept is expressed by Thorp and Kassouf (1967), who
“obtain[ed] an empirical valuation formula for warrants by fitting a curve to actual
warrant prices. … What they fail to pursue is the fact that in equilibrium, the expected
return on such a hedged position must be equal to the return on a riskless asset.”17
Quite interestingly, in his 1973 paper, Merton argues BSOPM is “to express the
expected return on the option in terms of the option price function and its partial
derivatives.”18 Merton’s bold statement is based on the distributional assumptions of
BSOPM and on the proposition that the option price is a function of the common stock
price.
Black and Scholes went through their model’s rationale in a step-by-step fashion,
beginning with the assumed “Ideal Conditions” in the stock and options market:
1) The short-term interest rate is known and constant;
2) The stock price follows a random walk in continuous time with a variance rate
proportional to the square of the stock price.
16 Ibid. Direct source: Samuelson, Paul A., and Merton, Robert C. “A Complete Model of Warrant Pricing that Maximizes Utility.”, Indus. Management Rev. 10, (Winter 1969): 17-46. 17 Black, F. and Scholes, M. (1973) “The Pricing of Options and Corporate Liabilities”, Journal of Political Economy, (May-June). 18 Merton, R.C. (1973) “Theory of Rational Option pricing”, Bell Journal of Economics and Management Science vol. 4 (Spring).

Real Options Methodology in Sportswear Retail Investment Valuation Literature Review
10
3) The stock pays no dividends during the option's life.19
4) Inflexible European option exercise terms exist, i.e., the option can only be
exercised on its expiration date.20
5) No commissions are charged
Black and Scholes proposed that under those assumptions, “it is possible to create
a fully hedged position, consisting of a long position in the stock and a short position in
the option, whose value will not depend on the price of the stock, but will depend only on
time and the values of known constants.”21
The authors observed that, “The ratio of the change in the option value to the
change in the stock price, when the change in the stock price is small, is w1(x,t) … Thus,
the change in the value of a long position in the stock will be approximately offset by the
change in value of a short position in 1/w1 options.”22
They further noted that, “The ratio of the decline in the equity value to the
magnitude of the change in the stock price becomes smaller as the magnitude of the
change in the stock price becomes smaller.”23 A third discovery was that “the stock price
19 This limitation was later eliminated by Merton (1973). 20 American exercise terms allow the option to be exercised at any time during the life of the option, making American options more valuable due to their greater flexibility. European options only permit the option to be exercised at the expiration date. By way of illustration, in the case of an American-style call option for common stock, the fixed amount might be 100 shares, offered for a fixed price (the exercise price), payable on or before a fixed date (the expiration date). 21 Black, F. and Scholes, M. (1973) “The Pricing of Options and Corporate Liabilities”, Journal of Political Economy, (May-June). 22 Ibid. 23 Ibid.

Real Options Methodology in Sportswear Retail Investment Valuation Literature Review
11
follows a continuous random walk24 and that the return has a constant variance rate, the
covariance between the return on the equity and the return on the stock will be zero. If the
stock price and the value of the ‘market portfolio’ follow a joint continuous random walk
with constant covariance rate it means that the covariance between the return on the
equity and the return on the market will be zero.” They conclude, “the risk in the hedged
position is zero.”25
This brilliant consequential deterministic thinking gave birth to the major
contribution in the history of option valuation: a valuation model with a built-in
capability to replicate a non-arbitrage portfolio (risk-neutral)26. The option value model is
a function of the stock price (which is obtainable in the trading market) and is
independent of the expected return on the stock.
The introduction of the BSOPM as a valid and reliable option pricing mechanism
led to the increasing popularity of financial options and to the subsequent introduction
and widespread trading of financial options, including currency and stock options, on
organized exchanges. Thanks to the BSOPM, the valuation of such investments is well
understood by investors and financial analysts.
24 There are non-linear practitioners who do not believe in the continuous random walk. Keith Fitz-Gerald, licensed CTA, Investment Director Money Map Press, says, “stock prices and options prices can and do sometimes move outside model pricing parameters or into contagion which again actually introduces an element of risk that, according to the BSOPM, is not theoretically possible.” 25 Black, F. and Scholes, M. (1973) “The Pricing of Options and Corporate Liabilities”, Journal of Political Economy, (May-June). 26 In real trading, practitioners could urge caution on a “truly risk free portfolio”: “there is no such thing as a truly riskless position except under extremely specialized circumstances usually associated with mispricing that occurs at the money when puts and calls may be disproportionately priced.”, Keith Fitz-Gerald, licensed CTA, Investment Director Money Map Press.

Real Options Methodology in Sportswear Retail Investment Valuation Literature Review
12
The Original BSOPM formula is as follows:
BSOPM = �������� �� ���������
Equation (1)
(S): Present value of underlying stock (X): the option strike price (σ): Sigma uncertainty (t): the period for which the investment opportunity is valid (r): the yield of a risk-less security with the same maturity as the duration of the
option. N(d) = cumulative normal probability
(d1) = ��� ���� � �� � ��
� � �� �√�
(d2) = �� �√�
S{ N(d1)} is the present value of the expected terminal stock price based on the
assumption that the call option27 will be profitable (in the money) at expiration multiplied
by the probability that the call will be in the money at expiration. Xe-rt{N(d2)} is the
present value of the cost of exercising the option at expiration multiplied by the
probability that the call will be in the money at expiration. The difference of these two
expressions is equal to the market value of the option.
Table 1 shows the effect of increase in equation (1) variables on the call and put
option prices as the respective variables changes. Overall, all five of the variables in the
original BSOPM are increasing the options values.
27 A call option is a contract giving its owner the right to buy, and a put option is a contract giving its owner the right to sell, a fixed amount of a specified underlying asset at a fixed price (known as the “strike price” or “exercise price”) at any time prior to the expiration date (American Option) or on a fixed date (European Option).

Real Options Methodology in Sportswear Retail Investment Valuation Literature Review
13
Table 1: Effect of Increase in BSOPM Variable on Call and Put Option Prices
Increase in: Call Price Put Price 1. Current Stock Price Increase Decrease 2. Exercise Price Decrease Increase 3. Volatility Increase Increase 4. Interest Rates Increase Decrease 5. Time to Expiration Increase Increase
Using US Treasury bonds as an illustration, consider an option to buy a US
Treasury bond (with a coupon rate of 8%, and with maturity in 30 years) at a price of $87.
This American option28 can be exercised at any time between the date of its purchase and
its expiration date. Assume that the expiration date is September 30th. For the purpose of
demonstration, let’s assume the cost of the call (that is, the option premium) is $1.50.
Based on these assumptions, the next table can be readily derived:
Table 2: Black Scholes Option Valuation Model Example – US Treasury Bond
T-bond Price on Sept. 30 Gross Payoff Net Payoff $86 0 -1.5 $87 0 -1.5 $88 1 -0.5 $89 2 0.5 $90 3 1.5 $91 4 2.5 $100 13 12.5 $110 23 22.5
28 American Option is a financial option that can be exercised at any time prior to the expiration date.

Real Options Methodology in Sportswear Retail Investment Valuation Literature Review
14
From the table, it can be seen that only when the T-Bond price exceeds $88.5 ($87
+$1.50) will an investor be making money (in the money). If the T-Bond price is lower
than $87, then the investor will lost only the option premium of $1.5. This seems rather
obvious; however, in reality, we don’t know if the price of the T-Bond on September 30th
(when the option expires) will be higher or lower than $87, nor do we know if the option
premium is reasonably priced. This is why a valuation model or formula was needed to
evaluate the price of the option when financial options emerged as investment derivatives.
2.1.1.1 Black-Scholes Model Assumptions.29
1) It is possible to borrow and lend cash at a known constant risk-free interest rate.
2) There is no arbitrage opportunity.
3) The underlying security does not pay a dividend - although later revised by
Merton. Most companies pay dividends to their shareholders. A common way of
adjusting the model for this situation is to subtract the discounted value of a future
dividend from the stock price.
4) The stock price follows a geometric Brownian motion with constant drift and
volatility.
5) All securities are infinitely divisible (i.e., it is possible to buy any fraction of a
share).
29 Black, F. and Scholes, M. (1973) “The Pricing of Options and Corporate Liabilities”, Journal of Political Economy, (May-June).

Real Options Methodology in Sportswear Retail Investment Valuation Literature Review
15
6) There are no restrictions on short selling not transaction costs, taxes or bid-ask
spread.
2.1.1.2 Theory building blocks - Black & Scholes & Merton.
In Merton’s 1973 article30, he introduced continuous changes in the option prices
as the underlying asset value changes. In so doing, he extended the BSOPM to apply to
the American Options. Furthermore, he incorporated the dividend element into the
BSOPM. Because option holders are not receiving the stock prices, they would be
reduced by the dividend yield. Merton’s Variation Model-with dividend δ is as follows:
Call Option – BSOPM Merton’s Revision
! " �� #�������� �� �����$���
Equation (2)
Put Option - BSOPM Merton’s Revision
% " �� ���1 ������ �� #��1 ������
Equation (3)
The Put option is derived from put-call parity: that is, selling a call and buying a
put.
! % " � �� ��
30 Merton, R.C. (1973) “Theory of Rational Option pricing”, Bell Journal of Economics and Management Science vol. 4 (Spring).

Real Options Methodology in Sportswear Retail Investment Valuation Literature Review
16
C = Call Value P = Put Value S = Price of underlying Asset X = Strike Price in Call Option or Salvage Value if abandonment
d1 = ��� ���� � �� ' � ��
� � �� �√�
d2 = �� �√�
Table 3: Put-Call Option Parity
Pay off when S > X Pay off at t when S < X
Sell Call (�� #� �) 0
Buy Put 0 � – �� #�
Buying Stock outright �� #� �� #�
Total � �
Put call parity yields X with certainty , cost of creating parity with certainly is PV
of X at riskless rate, �� ��.
� � % – ! " �� ��
! – % " � " � ��
Substitute into BSOPM:
Value of
% " �� ���1 ������ �� #��1 ������
Essentially, same type of the information required for the Call Option model
calculation. S, X, T may be different from the ones used to estimate call value, but it is
probably the same.
Dividends payout (δ): the value that drains away over the duration of the option.
In this revised version, the dividend value changes the d1 value and the first expression

Real Options Methodology in Sportswear Retail Investment Valuation Literature Review
17
value (�� #��������). Another way to explain this modified model is: 1) discount both S
and X to PV; 2) adjust X by the interest yield an investor can get by depositing the money
instead of buying the underlying stock outright 3) reduce the S by the dividend yield that
one wouldn’t receive as a call option holder (δt) here is the continuously compounded
dividend yield. The d1 and d2 are formulas in which variables are used to look up the N
values in the probability distribution table.
A simple example31 will demonstrate the workings of this model. Suppose a stock
is trading at $57 on October 16, 2008, and after passage of one year, on October 16th,
2009, it will trade for either $75 or $55. The stock will pay a dividend of $1.15 if the
stock price is $75. If the strike price is $63, what is an appropriate option price? The
option value can be found by directly plugging all the variables into the BSOPM formula,
as follows:
(S) Stock price: $57 (as of October 16, 2008) (X) The option strike price: $63 (σ) Sigma: 37% (the firm’s 1-year historic volatility) (t) 1 Year (r) 10% (assuming risk-free rate)
Utilizing these values, the BSOPM formula yields an option value of $7.72. This
means that a buyer, using the formula, would spend $7.72 to buy the right to buy the
stock at $63 at the end of the year (or, possibly, before the end of the year if the buyer
31 This example is extracted from MorningStar Option Trading Platform on a real-time market priced existing option as of October 16, 2008, adjusted using 1-year expiry time period for the sake of simplicity. This option pays a dividend and therefore the calculation is based on BSOPM (Merton’s 1973 adjusted version), Merton, R.C. (1973) “Theory of Rational Option pricing”, Bell Journal of Economics and Management Science vol. 4 (Spring), 160.

Real Options Methodology in Sportswear Retail Investment Valuation Literature Review
18
decides to exercise the option prior to its expiration date). This option price will be fully
covered if the stock price reaches above “Strike Price + Option Premium + Dividend
Loss as an option holder” – that is, $71.87 ($63+$7.72+$1.15) or if the stock is below
$70 when the option terminates. To calculate the option value, it is first necessary to
construct the value of a portfolio of this stock with exactly the same payoffs as the
option. Secondly, the number of shares of stock in the portfolio must be found by
generating a portfolio by holding the stock and selling the option. According to the logic
of Black and Scholes, the portfolio is of the non-arbitrage variety and, hence, should be
independent of the change in the stock price32.
This manually calculated result of $7.32 is very close to the result of $7.8 from
spreadsheet calculation. Black and Scholes used the same logic: the value of the option
can be tracked by holding a combination of the stock and risk-free securities, which
creates a leveraged position in the stock. If the portfolio is continuously being updated
with the number of shares to hold, whenever the value of the stock changes, (in financial
jargon, “rebalancing the portfolio”) the portfolio will change with both the stock price
32 The calculation is as follows: $75∆ - $1.15= $55 - $0 ∆ = 0.75 Therefore, the portfolio will consist of holding 0.75 shares of stock and selling the option. Next, the value of the portfolio in one year must be calculated. The portfolio consists of holding 0.75 shares of stock and the option. There are 0.75 shares in the portfolio, the value of the portfolio is $75*0.75, from which we must delete the value of the dividend paid at the end of the year: $75*0.75 – 1.15 = $55 This value must then be discounted back to present (using a 10% discount rate as an example): $55-($55*10%) = $50 The portfolio value consists of holding long stock and selling the option, and so the value of the option will be the difference between the portfolio value ($50) and the value of the long stock position ($57 * 0.75 shares) = $42.6 $50- $42.6=$7.32

Real Options Methodology in Sportswear Retail Investment Valuation Literature Review
19
and time.33 Merton, in his own research, described the B-S hedging portfolio as such: “A
hedged portfolio containing the common stock, the option, and short-term, riskless
security, is constructed where the portfolio weights are chosen to eliminate all ‘market
risk.’” 34
Merton’s first contribution to option pricing modeling consisted of his recognition
that “discounting the expected value of the distribution of possible values of the warrant
when it is exercised is not an appropriate procedure.35” More importantly, he pointed out
to Black & Scholes while they were developing the model that, “if the hedged portfolio is
maintained continuously, the approximations become exact, and the return on the hedged
position is completely independent of the change in the value of the stock.”36
“To derive the formula, they assume that the option price is a function of the stock
price and time to expiration, and note that, over “short” time intervals, the stochastic part
of the change in the option price will be perfectly correlated with changes in the stock
price.”37
Merton in his own research has shown that “the value of the option is always
greater than the value it would have if it were exercised immediately.”38 He demonstrated
that “the value of an American put option will be greater than the value of a European put
33 Black, F. and Scholes, M. (1973) “The Pricing of Options and Corporate Liabilities”, Journal of Political Economy, (May-June). 34 Merton, R.C. (1973) “Theory of Rational Option pricing”, Bell Journal of Economics and Management Science vol. 4 (Spring), 160. 35 Ibid. 36 Ibid. 37 Merton, R.C. (1973) “Theory of Rational Option pricing”, Bell Journal of Economics and Management Science vol. 4 (Spring), 160. 38 Ibid.

Real Options Methodology in Sportswear Retail Investment Valuation Literature Review
20
option…[Merton] was the first to point out that the current adjustment for dividends is
not adequate.”39
Merton’s earlier work on valuing financial options built upon the pioneering work
of Fischer Black and Myron Scholes.40 Later, he advanced BSOPM further by
incorporating dividends into the model41. He demonstrated that financial options could be
valued by constructing portfolios that perfectly replicate all of the potential payoffs of
options and that the value of this replicated portfolio could be the fair market price of the
option; and the BSOPM could be used to yield this result. Any difference between the
market price of this option and the BSOPM result would, at least in theory, constitute an
opportunity to earn a riskless profit.
In his 1998 paper, “Application of Option-Pricing Theory: Twenty-Five Years
Later” , Merton reviewed the history of financial innovations over the preceding twenty-
five years. He then covered the application of option pricing methods; and concluded
with a forecast of the future direction of options research.
As Merton pointed out, “As we shall see, the underlying conceptual framework
originally used to derive the option-pricing formula can be used to price and evaluate the
risk in a wide array of application, both financial and non-financial.” He further stated
39 Black,F. and Scholes, M. (1973) “The Pricing of Options and Corporate Liabilities”, Journal of Political Economy, (May-June) (3). 40 Ibid. 41 Merton, R.C. (1973) “Theory of Rational Option pricing”, Bell Journal of Economics and Management Science vol. 4 (Spring).
Real Options Methodology in Sportswear Retail Investment Valuation Literature Review
21
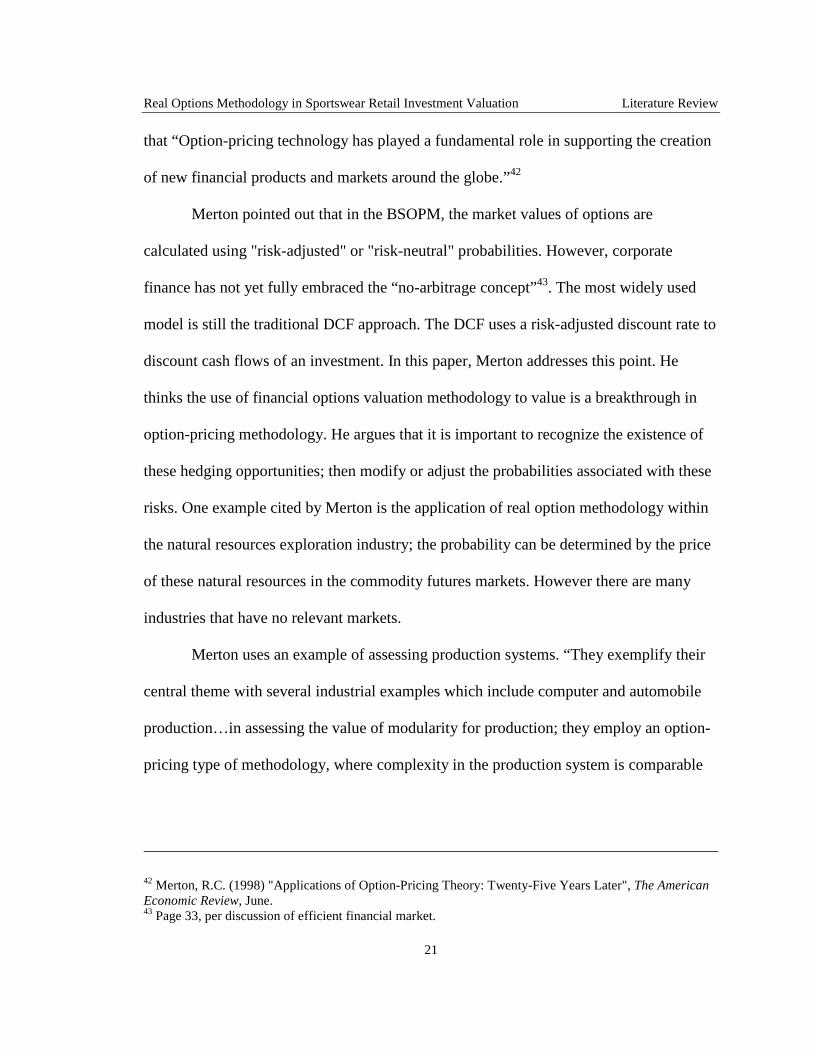
that “Option-pricing technology has played a fundamental role in supporting the creation
of new financial products and markets around the globe.”42
Merton pointed out that in the BSOPM, the market values of options are
calculated using "risk-adjusted" or "risk-neutral" probabilities. However, corporate
finance has not yet fully embraced the “no-arbitrage concept”43. The most widely used
model is still the traditional DCF approach. The DCF uses a risk-adjusted discount rate to
discount cash flows of an investment. In this paper, Merton addresses this point. He
thinks the use of financial options valuation methodology to value is a breakthrough in
option-pricing methodology. He argues that it is important to recognize the existence of
these hedging opportunities; then modify or adjust the probabilities associated with these
risks. One example cited by Merton is the application of real option methodology within
the natural resources exploration industry; the probability can be determined by the price
of these natural resources in the commodity futures markets. However there are many
industries that have no relevant markets.
Merton uses an example of assessing production systems. “They exemplify their
central theme with several industrial examples which include computer and automobile
production…in assessing the value of modularity for production; they employ an option-
pricing type of methodology, where complexity in the production system is comparable
42 Merton, R.C. (1998) "Applications of Option-Pricing Theory: Twenty-Five Years Later", The American Economic Review, June. 43 Page 33, per discussion of efficient financial market.

Real Options Methodology in Sportswear Retail Investment Valuation Literature Review
22
to uncertainty in the financial one.”44 He gives credits to the recent development, “much
financial research and broad-based practitioner experience developed over that period
have led to vast improvements in our understanding of how to apply the new financial
technologies to manage risk.”45 Moreover, he stated, “we have seen how wide ranging are
the applications of our technology for pricing and measuring the risk of derivatives.” But
he also recognizes that, “there still remains an intense uneasiness among managers,
regulators, politicians, the press, and the public over these new derivative security
activities and their perceived risks to financial institutions.”46
Pointing out “further research,” Merton suggests that there are two essentially
different frames of reference for analyzing and understanding changes in the financial
systems. “One perspective takes as given the existing institutional structure of financial
service providers, whether governmental or private-sector, and examines what can be
done to make those institutions perform their particular financial services more efficiently
and profitably. On the other hand, “An alternative to this traditional institutional
perspective is the functional perspective, which takes as given the economic functions
served by the financial system and examines what is the best institutional structure to
perform those functions.”47
44 Merton, R.C. (1998) "Applications of Option-Pricing Theory: Twenty-Five Years Later", The American Economic Review, June. 45 Ibid. Part III. 46 Ibid. Part III. 47 Ibid. Part III, also for elaboration on the functional perspective, see Merton (1993, 1995).

Real Options Methodology in Sportswear Retail Investment Valuation Literature Review
23
Merton observes that in the past, “applications of mathematical models had only
limited and side-stream effects on finance practice.” But, he notes, over the twenty-five
years preceding his 1998 article, mathematical modeling has become mainstream – and
the BSOPM has played a significant role in accelerating the acceptance of such models in
financial institutions around the world. His conclusion is that, “It is safe to say that
mathematical models will play an indispensable role in the functioning of the global
financial systems.”48
This influential article provides an insightful reflection on financial theory
(particularly in regard to the option-pricing model) over the last quarter of the 20th
Century. Merton also points out the future direction of the global financial systems; in
particular, he warned that, “At times, we can lose sight of the ultimate purpose of the
models when their mathematics become too interesting. The mathematics of financial
models can be applied precisely, but the models are not at all precise in their application
to the complex real world. Their accuracy as a useful approximation to that world varies
significantly across time and place. The models should be applied in practice only
tentatively, with careful assessment of their limitations in each application.49” Merton’s
vision strategically offered illumination for both academic research (which generates
practical applications) and corporate practitioners.
48 Ibid, Pg. 349. 49 Ibid, Pg. 349.

Real Options Methodology in Sportswear Retail Investment Valuation Literature Review
24
2.1.2 Real options.
Similar to financial option’s definition, a Real Option can be considered as a right
but not the obligation to acquire the present value of the expected cash flows by making
an investment when the opportunity is available. Unlike financial options, Real Options
rarely have defined lives and are generally not tradable. This has been and still is the
main limitation of RO application in practice. Myers50 constructed the “Real Option”
concept for the valuation of financial options but extended the use of the concept beyond
to the valuation of opportunities embedded in long-term investment projects.
Dr. Stewart C. Myers in his research (1977) 51, he predicts “corporate borrowing
is inversely related to the proportion of market value accounted for by real options.” He
starts with a discussion of a “gap in modern finance theory”, that is, “on the issue of
corporate debt policy.”52 Myers suggested that, “The firm financed with risky debt will,
in some states of nature, pass up valuable investment opportunities – opportunities which
could make a positive net contribution to the market value of the firm.”53
He then uses an example to demonstrate how the existence of corporate debt can
reduce the present market value of the firm by weakening the corporation’s incentive to
undertake good future investments. He gears the discussion towards the essential
characteristics of the “growth opportunities,” stating that “[growth opportunities] flow
50 Myers, Stewart C. (1977) “Determinants of Corporate Borrowing”, Journal of Financial Economics 5, 147-175. 51 Ibid. 52 Ibid. 53 Ibid.

Real Options Methodology in Sportswear Retail Investment Valuation Literature Review
25
from the fact that they can be regarded as a call option on a real asset.”54 He then makes a
pioneering statement, “The option’s exercise price is the future investment needed to
acquire the asset. Whether the option has any value when it expires depends on the
asset’s future value, and also on whether the firm chooses to exercise. The decision to
exercise is not trivial and automatic, as it is for options written on securities, because it
depends on the magnitude of promised payments to bondholders.”55 This important
conclusion is derived from his observation that, “The market value of almost all real
assets can be partly attributed to associated call options…the ultimate payoff of almost all
assets depends on future discretionary investment by the firm.”
Later, in his 1984 research paper56, Myers coined the term “Real Option” and
stated for the first time that real options theory has the potential to close the wide gap
between strategic planning and finance. “Strategic planning needs finance. Present value
calculations are needed as a check on strategic analysis and vice versa…. Corporate
finance theory requires extension to deal with real options.”57
2.1.2.1 Real options theory development building blocks – other contributors.
Dr. Stewart Myers in his 198458 paper indicated that traditional Discounted Cash
Flow (DCF) methods have both merits and limitations in the valuation of investments. He
54 Myers, Stewart C. (1973) “Determinants of Corporate Borrowing”, Journal of Financial Economics 5, 1977, 155. 55 Ibid. 56 Myers, S.C. (1984), "Financial theory and financial strategy", Interfaces, Vol. 14 No.1, pp.126-37. 57 Ibid. 58 Myers, S.C. (1984), "Financial theory and financial strategy", Interfaces, Vol. 14 No.1, pp.126-37.

Real Options Methodology in Sportswear Retail Investment Valuation Literature Review
26
described various misapplications of the DCF method in corporate finance, and proposed
that the use of the BSOPM, previously used in the valuation of financial options, would
avoid or compensate for such DCF misapplications in the valuation of real assets. He
argued that option pricing holds the most promise in the valuation of such investments.
Myers went on to “close the wide gap between strategic planning and finance.”59 This
was recognized by some critics, among them, Hayes and Abernathy, who stated: “The
traditional investments evaluation methods are not enough to catch the value associated
with the real options.” 60 Hodder and Riggs pointed out that the problem is not the DCF
method itself, but the corporate finance practices that have misused the DCF techniques.
Trigeorgis, one of the key contributors to real option methodology development,
has been a primary leader in real option modeling and research efforts over the last
decade. He has advanced the treatment of real options (in a way similar to the treatment
of financial options)61; and he has also made positive contributions to the ongoing debate
over the risk-neutral rate62. Further, in one of his most significant publications63,
59 See earlier section per Myers’ article review. 60 Hayes, R.H., Abernathy, William, (1980), “Managing Our Way to Economic Decline”, Harvard Business Review, July-August, Pg 67-77. This article intends to demonstrate that the flexibility effect in the investment decision. Hayes and Abernathy argue the traditional investments evaluation methods are not enough to catch the value associated with the real options and they appeal to the options valuation theory and in analogy with that catch the true value of investments with real options. 61 “Real options in principle may be valued similar to financial options, even though real options may not be traded, since in capital budgeting we are interested in determining what the projected cash flows would be worth if they were traded in the market” (Trigeorgis, L. (1996), “Real Options: Managerial Flexibility and Strategy in Resource Allocation, MIT Press, Cambridge, MA, 1996). 62 “For traded assets in equilibrium or for real assets with no systematic risk (e.g., R&D and exploration or drilling for certain precious metals or natural resources), the certainty-equivalent or risk-neutral growth rate just equals the risk-free interest rate (minus ‘dividends’)” (Trigeorgis, 1996).

Real Options Methodology in Sportswear Retail Investment Valuation Literature Review
27
Trigeorgis synergizes a “scattered knowledge and research” on the RO concept and
applications and provided excellent illustrations of ways and opportunities to apply the
real option model to investment valuation; these illustrations included options to defer, to
expand and to contract. Trigeorgis’s ‘growth options’ research laid the foundation for
subsequent conceptual discussion of the strategic and competitive aspects of growth
opportunities64. The general real options frameworks presented by Merton65 drew upon
this decision.
The studies of Amram & Kulatilaka and Copeland & Keenan have also advanced
RO research, making the RO concept applicable to more industries. As a result of this
research advancement, the energy sector, for example, has reported that a number of
strong performers66 within the industry view their investment opportunities intuitively or
instinctively as Real Options, positioning themselves to tap possible future cash flows
without making a final decision to invest until the potential is confirmed.
To sum up, since Myers’ 1984 RO introduction, Mason and Merton (1985), Dixit
& Pindyck (1994), Trigeorgis (1995), Amram & Kulatilak (1999), Leslie & Michaels
(2000), Gordon Sick (2001), Moel & Tufano (2002), Cassimon (2004), Lemley &
63 Trigeorgis, L. (1996), “Real Options: Managerial Flexibility and Strategy in Resource Allocation”, MIT Press, Cambridge, MA, 1996). 64 Mason, Pindyck, Kasanen, and Sick, have also contributed to the RO research through their analysis. 65 Merton, R.C. (1998) "Applications of Option-Pricing Theory: Twenty-Five Years Later", The American Economic Review, June. 66 Industry Survey: The De Jong & Koedjik, the Netherlands conducted a survey on “corporate management in the financial decision making.” This process sample consists of a cross-section of 6,500 companies, represents the second largest survey sample in financial literature. The main purpose is to provide a general guidance for the main methodology currently being used by corporate management in the financial decision making process. While the Real Option comes not on the top, the result shows a positive trend of acceptance. (More details are in the Literature Review last sub-section).

Real Options Methodology in Sportswear Retail Investment Valuation Literature Review
28
Shapiro (2005), McDonald (2006), Moon & Yao & et al. (2007), surveyed the role of real
options in the investment strategies of various industries67.
The development of the RO concept and its application to industry is summarized
by the chronological milestones the table below.
Table 4: Real Option Evolution Building Blocks
YEAR Papers Contribution Key Theory 1973 Black, Scholes,
Merton Pricing model BS Option Pricing Model
BS Option Pricing Model – Dividend modified
1973 Cox, Ross, Rubinstein
Binomial Options can be replicated from an equivalent portfolio
1976 Rubinstein Furthered studies of Cox and Ross
Risk aversion
1979 Geske Compound option 1984 Myers Introducing RO to capital
budgeting 1985 Brennan, Schwarts Futures prices of
contracts with different maturities
1985 Mason & Merton Real options may be valued similar to financial options
1984 McDonald & Siegel Dividend-like adjustment
1985 McDonald & Siegel Market-equilibrium model
Address the return shortfall
1986 McDonald & Siegel Defer investment option
1987 Trigeorgis & Mason Staged investment / growth option
1988 Kulatilaka Switch option
67 Detailed Literature review is in the 2nd section.

Real Options Methodology in Sportswear Retail Investment Valuation Literature Review
29
YEAR Papers Contribution Key Theory 1994 Trigeorgis &
Kulatilaka Switch use (input and output)
Synergizing
1996 Trigeorgis Option based capital budgeting and strategic decisions
Resource allocation or project appraisal under uncertainty
1996 Myers RO applied in capital budgeting
1996 Faulkner R&D investments valuation using RO in the capital budgeting
1998 Copeland & Keenan Compound options 1998 Merton Option Pricing
Application from 1973-1998
1998 Luehrman NPV intrinsic value in the defer-investment option
1999 Amram & Kulatilak Applicability of RO to various industries
RO methodology milestone
1999 Benaroch & Kauffman
Point-of-scale transaction
2000 Copeland & Antikarov
Real options practitioners’ guide: how to do
Risk –neutral growth rate equals the risk-free interest rate
2000 Copeland & Antikarov
R&D Investment compound option
2002 Herath & Park R&D investment Compound option 2001 Schwaratz R&D investment Compound option 2001 Sick PUD – Preserved land
Some research indicates that the real option valuation methodology is the most
useful in the investment-intensive industries. These are industries such as oil or mineral
extraction68, pharmaceutical product development69, high technology start-ups, and R&D
68 Actual Application Case— British Petroleum Corporation. UK-based British Petroleum Corporation is known to have been benefiting through its use of the RO approach in its investment valuation since 1990. The company exercises options to extend the life of its existing infrastructure to defer new investment and to save the cost of removing redundant facilities; it uses options to continue committing incremental

Real Options Methodology in Sportswear Retail Investment Valuation Literature Review
30
investment, and any other High-investment / High Risk-Return (HI/HRR) industries. A
detailed literature review, by year and by application industry, is summarized in the
following table.
Table 5: Chronological Real Option Development (Empirical Testing, Case Studies, and Theory Contribution)
YEAR Papers Application (Empirical studies)
Synergized Theory Contribution
1979 Tourinho Natural resources 1984 Myers Introducing RO to capital
budgeting 1985 Brennan, Schwarts Copper 1985 Brenna, Schwarts Natural resources 1985 Titman Land 1986 McDonald & Siegel Project management 1991 Trigeorgis Impact of competition
on the optimal timing of project initiation using option methodology
RO types
1993 Quigg Real Estate 1993 Kemna Oil 1993 Pindyck Uncertain completion
costs to capture a “leaning effect”
1994 Dixit & Pindyck Synergizing the empirical applications in various industries
investments while insuring that plants maximize potential profits. Unleashing the power of learning: An interview with British Petroleum’s John Browne," Harvard Business Review, September–October 1997, for BP’s own account of its value-creating strategy since 1992. 69 New product development in pharmaceutical companies has also begun using RO. This industry requires huge R&D investments and sometimes involves investing in stages, depending on whether the new drug is progressing in the right direction and/or whether the Federal Drug Association (FDA) approves the continuation of the drug research. The R&D effort cannot produce a positive net cash flow until the new drug is successfully developed and approved by FDA, but may yield a very high return if successfully launched in the market. However, this application is still in debate as the industry’s volatility is difficult to determine.

Real Options Methodology in Sportswear Retail Investment Valuation Literature Review
31
YEAR Papers Application (Empirical studies)
Synergized Theory Contribution
1996 Trigeorgis RO types 1996 Trigeorgis Risk –neutral growth rate
equals the risk-free interest rate
1998 Simth & McCardle Oil 1996 Myers RO applied in capital
budgeting 1996 Faulkner R&D investments
valuation using RO in the capital budgeting
1998 Copeland & Keenan Compound options 1998 Luehrman NPV intrinsic value in defer
option 1998 McAllister &
O’Rarty Break clauses in real estate
1998 Cortazar & Casassus
Copper
1998 Davis Precious metal 1999 Chils & Triantis R&D investment
policies and RO valuation with multiple interaction
1999 Amram & Kulatilak Various industries application
RO methodology milestone
1999 Benaroch & Kauffman
Point-of-scale transaction
2000 Schwarts & Moon Includes project revenues uncertainty and catastrophic events
2000 Copeland & Antikarov
R&D investment compound option
2002 Herath & Park R&D investment Compound option 2000 Schartz & Moon High-growth firms 2001 Schwaratz R&D investment 2001 Sick PUD – Preserved
Underdeveloped land
2002 Moel & Turfano Gold 2002 McMillan &
McGroath R&D Project Mgt
2003 Smit Flight Demand

Real Options Methodology in Sportswear Retail Investment Valuation Literature Review
32
YEAR Papers Application (Empirical studies)
Synergized Theory Contribution
2004 Armstrong Oil exploration 2004 Cassimon Pharmaceutical
industry
2005 Tanguturi & Harmantzis
IT – 2nd Wireless transition to 3rd Wireless
2006 Laate New biotechnology development and commercialization
2006 Rubio, Lamoth Empirical Evidence European Biotech firms
2006 Power & Reid OR logic by entrepreneurs
Firm performance improvement related to RO counts
2006 Chen, Longm, & Wang
Firms’ default risk in different competition markets
Default risk similar; empirical evidence supports hypothesis
2006 Cho retail-shopping center retail lease contract 2007 Hoe & Diltz Optimal investment
policies in R&D projects
2007 Dikos & Thomakos Tanker Markets 2008 Leung Real Estate valuation model for
acquisition of a property
During the years 2000 to 2008, RO application has drawn noticeable attention
from both academic researchers and corporate practitioners. In the academic arena,
numerous dissertations on RO applications have been published recently. The following
is a brief summary from those dissertations.
2001: Haylett demonstrated how the real option value of a petroleum exploration
mineral rights lease could be calculated (using Monte Carlo simulation), while Vladimir
applied real options methodology to sales of power plants by U.S. electric utilities.

Real Options Methodology in Sportswear Retail Investment Valuation Literature Review
33
2002: Lee presented the Real options theory: Implications on entrepreneurship
development and options value under uncertainty. Maya proposed a Creative
Destruction-Real Options Approach (CD-ROA) to value start-ups in the midst of
technological uncertainty.
2006: Pagaza & Gabriela (2006) advanced the “Partnership model” introduced by
Kulatilaka and Patel (2002), supporting the results of Grenadier and Wang (2005), that
argued that incentives may induce a manager to raise firm value by exercising the
appropriate real options.
2006: Cho provided a general formulation for valuing a retail-shopping center
under conditions of uncertainty. Cho’s study integrated two lines of research, one of
which consisted of the valuation of embedded options in a retail lease contract. He
examined whether the use of capital budgeting methods can reduce decision makers'
tendency to escalate commitment to a failing course of action
2007: RO research during this year expanded to address a broader arena of issues.
Scucci developed a continuous time general equilibrium model involving embedded
options in the physical health environment, identifying stochastic intertemporal dynamics
of the underlying health process and the disruptions in the underlying process resulting
from illness.
Wang compared NPV, decision trees, and real option methods in valuating
technology innovation and adoption projects. In her dissertation, she studied the
feasibility, advantages, and discrepancies of each method in technology investment
valuation at various phases of innovation.
Real Options Methodology in Sportswear Retail Investment Valuation Literature Review
34
Bryan introduced a flexible system using real options as a method of managing
uncertainty, which is composed of interconnected technological, organizational, and
process components, creating a “Life-Cycle Flexibility (LCF) Framework.” This study
uses two cases: (1) a large body aircraft in a commercial aircraft manufacturing enterprise,
and (2) Intelligent Transportation System (ITS) capabilities in an urban region with
multiple public and private stakeholders. This research found that without the proposed
LCF framework, existing processes for evaluating real options were not adequate to
account for the interacting technical, organizational, and process components of
"complex" real options.
Also in 2007, Qin suggested that RO should be chosen as the approach most
suitable for exploiting Knowledge Workforce Agility (KWA), because RO can capture
the essence of KWA embedded options in manipulating knowledge capacity, a human
asset, or a self-cultivated organizational capability for pursuing interests associated with
change. He suggested that the real options valuation process provides a methodology to
measure the inherent value of flexibility, and can therefore assist decision makers in
making the optimal investment decision.
Alimov developed and tested a hypotheses about the impact of growth options,
embedded in innovative investments, on the risk and the expected return of a firm's
equity, based on recently developed real options models, such as described in Berk,
Green and Naik (1999, 2004),
Leung focused on a niche field: a valuation model for acquisition of a property
with excessive land that can potentially be converted into a new development. He

Real Options Methodology in Sportswear Retail Investment Valuation Literature Review
35
proposed the Real Estate with Real Options (RERO) model as a framework; the model
combines DCF, ROA, and DTA analyses to specifically value real estate acquisition with
excessive infill land.
Dissertation research continued in 2008. Miao discussed when a firm, whose
investment cost depends on economic situations, faces a future real investment
opportunity. Investment timing can be treated as a perpetual American option when the
strike price switches between two possible values depending on the economic situations.
Also in 2008, Zhang argued that the application of RO enables manufacturing
systems to capture the strategic value of management and operational flexibility for
capital investments in the automotive industry. The research findings of this study are
built on four criteria: coping with uncertainty, adaptability, information cost, and overall
utility. These are developed to measure the application values of the methods. Zhang
concludes that Real Options and Decision Trees are superior to NPV in coping with
uncertainties. The advantages of RO and DT are better reflected in sequential technology
investments and product portfolio.
2.1.3 RO application in industries summary.
In the original BSOPM, the only unknown variable that needs to be identified is
sigma, representing volatility. In using BSOPM to value real assets, the quality of the
option valuation depends on the ability to track the underlying asset volatility. Merton’s
1977 & 1998 articles on option pricing strategy established a framework that identified
what “private risk” is; he demonstrated that it can be objectively defined and measured

Real Options Methodology in Sportswear Retail Investment Valuation Literature Review
36
using the data available in the market place, and that it can be made easier to quantify as
more underlying assets are securitized.
Since RO’s application in various industries, the question has been whether RO
can be supported with sufficient empirical evidence, testing, and verification. In Henri’s
research70, he argues that a case study is a more feasible process for providing such
evidence, testing and verification than is empirical evidence. One of the primary reasons
for his belief is the lack of a broad, consistent, and generally accessible database, which
may allow researcher subjectivity to contaminate research efforts.71 RO’s growing
acceptance in a variety of industries can be seen in the following table.
Table 6: RO Application Development (Empirical Testing, Case Studies, and Contribution, sorted by Application Area)
Authors / Researchers
Application (Empirical / Case studies)
Key Focus / Contribution YEAR
Rubio, Lamoth Biotech Empirical Evidence European Biotech firms
2006
Laate Biotech New biotechnology development and commercialization
2006
Brennan, Schwarts
Natural resources
Copper 1985
Cortazar & Casassus
Natural resources
Copper 1998
Moel & Turfano Natural resources
Gold 2002
70 See Literature Review 2.9. 71 This proposal suggests that volatility is the primary limiting factor in the use of RO for real asset valuation.

Real Options Methodology in Sportswear Retail Investment Valuation Literature Review
37
Authors / Researchers
Application (Empirical / Case studies)
Key Focus / Contribution YEAR
Kemna Natural resources
Oil 1993
Simth & McCardle
Natural resources
Oil 1998
Armstrong Natural resources
Oil 2004
Cassimon Pharmaceutical industry
Drug R&D 2004
Trigeorgis Project Management
Impact of competition on the optimal timing of project initiation using option methodology
1991
Schwarts & Moon Project Management
Project revenues uncertainty and catastrophic events
2000
McDonald & Siegel
Project Management
Various projects application 1986
Childs & Triantis R&D Investment policies and RO valuation with multiple interaction
1999
Faulkner R&D Investments valuation using RO in the capital budgeting
1996
Copeland & Antikarov
R&D investment
Compound option 2000
Herath & Park R&D investment
Compound option 2002
Quigg Real Estate Real estate market prices 1993
Leung Real Estate valuation model for acquisition of a property
2008
McAllister & O’Rarty
Real estate Break clauses 1998
Titman Real Estate Land 1985 Sick Real Estate PUD – Preserved Underdeveloped land 2001
Cho retail-shopping center
Retail lease contract 2006

Real Options Methodology in Sportswear Retail Investment Valuation Literature Review
38
Authors / Researchers
Application (Empirical / Case studies)
Key Focus / Contribution YEAR
Tanguturi & Harmantzis
Startup IT – 2nd Wireless transition to 3rd Wireless
2005
Power & Reid Starup - entrepreneurs
Firm performance improvement related to RO counts
2006
Pindyck Various industries application
Uncertain completion costs to capture a “leaning effect”
1993
Amram & Kulatilak
Various industries application
RO methodology milestone 1999
Dixit & Pindyck Synergizing the empirical applications in various industries
1994
Trigeorgis Risk –neutral growth rate equals the risk-free interest rate
1996
Myers RO applied in capital budgeting 1996
Copeland & Keenan
Compound options 1998
From the table, we see that RO applications reflected in the literature to date are
primarily concentrated in the areas of 1) natural resources; 2) R&D; 3) real estate; 4)
start-up or technology venture capital); and 5) project valuation. These industries / sectors,
which have adapted and successfully used RO to value investment, have heavy
investment and high risk/reward (HI/HRR) profiles. A key reason for RO application in
these industries is that sigma can either be determined or supported by actual historic
volatility data. The price of commodities tradable in liquid and well-functioning

Real Options Methodology in Sportswear Retail Investment Valuation Literature Review
39
international markets72 can be readily ascertained and tracked. For instance, one of the
earliest applications of real options was in the petroleum leasing sector73, in which
Paddock, Siegel and Smith used data based on historical oil prices as the standard
deviation of the rate of change of the value of the reserves74.
2.1.3.1 Applicable valuation situations
In summary, the RO methodology is particularly applicable in the following
situations75:
a) when there is a high degree of uncertainty involved in the course of the
investment;
b) when the investment environment (macro-, local-, and/or political environment) is
highly volatile;
c) when there is a strategic value attached with the investment;
d) when there is critical information that can affect the investment return but only
will be known at a later point in time.
72 Such prices and markets include spot, futures, and spark spread (the price of electricity minus the price of natural gas adjusted for burner efficiency) in the futures or commodities financial markets or derivative instruments financial markets. 73 Paddock, Siegel, and Smith, “Option Valuation of Claims on Real Assets: The Case of Offshore Petroleum Leases,” Quarterly Journal of Economics, 1988. 74For more detail see 2.4, Henri Philippe, “Real Options: Still Looking for Evidence”, Real Options Conference Paper, 2005. 75 Not all industry valuation can use BSOPM due to its limitations & assumptions outlined.

Real Options Methodology in Sportswear Retail Investment Valuation Literature Review
40
2.1.3.2 RO Types
There are several ways to view RO types, commonly Grow, Wait-and-See, and
Abandonment. Trigeorgis proposed detailed alternative investment and divestment
decision making choices in 1998: 1) deferment; 2) building; 3) abandonment; 4)
switching; 5) growth.
Deferment is the ability of the company to wait until the market conditions
improve to a favorable stage (e.g. the commodity price reaches an economically
acceptable level). For example, if the price of oil was very low (as opposed to the current
reality), some oil fields could not be exploited; but they would have a value if it were
anticipated that the market price of the commodity may later exceed the extraction cost.
The option to build takes into account the fact that most complex investments
generate sequential decisions and cash outlays. If, during the construction, the
environment moves favorably or unfavorably, it is possible to abandon the project and/or
design new objectives.
The option to alter operating scale is the ability to expand or contract capacity,
following the evolution of the market. This is of crucial importance when the reaction of
the market is quite uncertain, e.g. when the product changes the consumers’ habits
dramatically or when the competition has the possibility to react promptly and introduce
rival products. This category also includes the option to shut down current plant and/or
restart operations in another venue—operational strategic practice commonly seen in the
mining industry.

Real Options Methodology in Sportswear Retail Investment Valuation Literature Review
41
Another way to classified RO is: simple, compounded, expansion, abandonment,
etc. A simple option is the ability to buy or sell the option at a defined price on one
occasion at or before the expiration of the option. Compound options are options that,
when exercised, generate another option. They are commonly used for staggered
investment involving multiple decisions through the lifecycle of a project. Expansion
options are the right, but not the obligation, to expand the investment of a project.
Abandonment options are the right to stop or postpone the project if the expected cash
flows are below the salvage value.
RO Advantage
When comparing RO to NPV in these situations which RO are applicable76:
a) when there is a high degree of uncertainty involved in the course of the
investment
~ NPV is static decision making approach;
b) when the investment environment (macro-, local-, and/or political environment) is
highly volatile
~ NPV’s discount rate theoretically reflects the underlying asset (investment)’s
market risk, but in HI/HRR industry, this discount rate is not sufficient to capture
the risks.
c) when there is a strategic value attached with the investment;
~ NPV reflects only tangible financial benefits;
76 Not all industry valuation can use BSOPM due to its limitations & assumptions outlined.

Real Options Methodology in Sportswear Retail Investment Valuation Literature Review
42
d) when there is critical information that affects the investment return but not
available at the time of making decision.
~ NPV will use scenario analysis but the decision is still “accept” or “reject.”
RO Limitation
Primary limitations: its un-tradability and difficulty to identify volatility. More discussion
is in Section 2.1.3.3.
2.1.3.3 RO application modification overview - industries volatility
As discussed, the volatility (sigma) is the only unknown variable that must be
identified in the B-S model. How to determine sigma in RO application in various
industries has been the major challenge. Various empirical research works (more
precisely, case studies) have been conducted in searching, modeling, and testing volatility.
Methods discussed here are the primary approached proposed and testing by
various studies. They can be categorized as the following per specific industry
characteristics.
• Historical volatility of the underlying asset: When the price of a natural
resource determines the future cash flow of the investment, the historical volatility
of commodity price can be utilized as sigma. In addition to the oil lease example
in which Paddock et al. used historical oil prices as sigma, Moel & Turfano used

Real Options Methodology in Sportswear Retail Investment Valuation Literature Review
43
return on gold price as the estimate of volatility in gold mine closures77, while
Quigg used land price fluctuations as sigma to analyze land development.78
• Historical volatility of the company’s stock price: This estimation of sigma can
be utilized only when the project volatility correlates with the stock price
movement of the company. Herath and Park (1999) demonstrated that the stock
price of a typical R&D company is perfectly correlated to the company’s R&D
project.
• Historical volatility of the industry index: The historical volatility of the
industrial group index of equity prices has also been used to estimate the volatility
of the project value. For example, R&D of pharmaceutical companies, using the
pharmaceutical industry’s standard deviation of equity, can serve as sigma.
• Historical sales growth rate volatility of the local market or SRI Retail
Store79: to be further investigated and tested in this research.
Table 7 summarizes recent applications of RO by volatility80. In this table, the
following symbols are utilized to demonstrate the volatility estimation methods and
correspond to the categories specified81:
77 Ibid. 78 Ibid. 79 SRI Retail Store Types include (owned) mono-brand, factory outlet stores (discount), and mega-stores (flagship stores). 80 * indicates the original source is from Han, “Estimating Project Volatility and Developing Decision Support System n Real Options Analysis”, Dissertation 2007 81 Other methods include Monte Carlo simulation and Bayesian Revision Process.

Real Options Methodology in Sportswear Retail Investment Valuation Literature Review
44
a) V-UA: Volatility of price of underlying asset;
b) V-SP: Volatility of historic stock price;
c) V-Index: Volatility of underlying industry index
Table 7: Real Option Development – Volatility Modification
Authors / Researchers
Application (Empirical studies)
Modification / Synergized Contribution
Modification: Volatility Estimation
YEAR
Tourinho* Natural resources V-UA 1979
Brenna, Schwarts
Natural resources V-UA 1985
Davis* Natural resources Precious metal V-UA 1998
Brennan, Schwarts
Natural resources Copper V-UA 1985
Cortazar & Casassus*
Natural resources Copper V-UA 1998
Moel & Turfano Natural resources Gold V-UA 2002 Kemna* Natural resources Oil V-UA 1993
Simth & McCardle
Natural resources Oil V-UA 1998
Armstrong* Natural resources Oil V-UA 2004
Cassimon* Pharmaceutical industry
Application V-SP 2004
Trigeorgis Project - Impact of competition on the optimal timing of project initiation using option methodology
RO types V-Various 1991
Chils & Triantis R&D investment policies and RO valuation with multiple interaction
V-Index 1999

Real Options Methodology in Sportswear Retail Investment Valuation Literature Review
45
Authors / Researchers
Application (Empirical studies)
Modification / Synergized Contribution
Modification: Volatility Estimation
YEAR
Faulkner* R&D investments valuation using RO in the capital budgeting
V-Index 1996
McMillan & McGroath*
R&D Project Mgt 2002
Hoe & Diltz R&D - Optimal investment policies in R&D projects
Optimal investment policies in R&D projects
V-Index 2007
Copeland & Antikarov
R&D investment Compound option
V-Index 2000
Herath & Park R&D investment Compound option
V-Index 2002
Schwaratz R&D investment V-Index 2001
Quigg Real Estate Application V-UA 1993 Leung Real Estate valuation model
for acquisition of a property
V-UA 2008
McAllister & O’Rarty
Real estate Break clauses V-UA 1998
Titman Real Estate Land V-UA 1985
Sick Real Estate PUD – Preserved Underdeveloped land
V-UA 2001
2.1.3.4 Limitation in RO application.
One of the primary limitations of RO is its un-tradability. In addition, the analysis
requires sufficient data input and variables. The lack of data to support is application in

Real Options Methodology in Sportswear Retail Investment Valuation Literature Review
46
industries limits its generability. As earlier discussed,82 most of the empirical studies
primarily covered the natural resources sector due to its “tradability.” Other limitation in
RO applications are:
1) The difficulty in obtaining a tractable dataset;
2) Lack of sufficient databases;
3) The subjectivity of the data validation83.
In addition, RO’s complexity and a lack of understanding of its applications also
cause its limitation.. The Real Options model approach requires more time to obtain all
the elements needed for its calculation and this makes it less appealing. As a result of this,
it takes much longer to complete the analysis when using the RO methodology.
In the following section, books, research papers and articles that synergize and
broaden the application of RO application are presented and reviewed in detail. They
respond to the business challenges today84. These works challenged the conventional
wisdom, and successfully moved the RO concept forward, laying the foundation for
further study and, primarily, for practical application.
2.2 Real Option: Managing Strategic Investment in an Uncertain World
Martha Amram & Nalin Kulatilaka, 1999
82 Literature Review 2.4, Henri Philippe, “RO: Still Looking for Evidence? 83 See Section 4 for a more thorough discussion of this literature's influence on this proposal. 84 Businesses today are challenged by with consumers who are savvier in their expectations and purchasing behaviors and challenged by competitors who are more aggressive in the marketplace and more sophisticated in their execution. In addition, more types of investment possibilities are provided and offered in the financial markets, which in turn challenging better returns on the investments on real assets.

Real Options Methodology in Sportswear Retail Investment Valuation Literature Review
47
In their first book, Amram and Kulatilaka propose: “The current set of valuation
and decision-making tools aren't sufficient for the new business realities.”85 This was
bold statement back in 1999. They go on to state: “Real options are an important way of
thinking about valuation and strategic decision-making, and the power of this approach is
starting to change the economic ‘equation’ of many industries.” They challenged
companies to adapt to changes in the evolving marketplace in order to maximize
investment return while managing risk, particularly with regard to strategic investments
that require huge capital requirements and involves a lot of uncertainty.
In this book, Amram and Kulatilaka differentiated "real options" from financial
options. They argued that the traditional discounted cash flow methods (NPV and IRR)
do not accurately value investments with contingencies and options, whereas a real
options approach to capital budgeting does incorporate these alternatives. Further, they
proposed that Real Option methodology reflects actual managerial flexibility by
providing for the analysis of the application of real options to phases in investment --
expansion, extension, and abandonment.
In each of these RO types, Amram and Kulatilaka propose that in the RO
application (specifically using BSOPM), the risk is captured in the value of the traded
security. For example, in natural resources exploration, the price of the resources is
captured in “futures contracts” in the financial market. In the situation where there is no
traded security, the authors suggest that this private risk is “naturally diversified away at
85 Amram, M. and N. Kulatilaka, Real Options: Managing Strategic Investment in an Uncertain World, Harvard Business School Press, Boston, 1999.

Real Options Methodology in Sportswear Retail Investment Valuation Literature Review
48
the portfolio level”, as in pharmaceutical companies where individual drug development
risks would be diversified throughout the whole portfolio of products. In the scenario of a
particular project, the authors argue that the private risk of each project should be
investigated and used, and that “there is an enormous amount of private risk that affects
decisions in all stages of development.”86
• If an initial investment is successful, then the management can exercise the option
to expand its commitment to the strategy. By way of example, a company
entering a new geographic market may consider building a distribution center if
the market demand reaches a certain level. While waiting for the demand to
materialize, the company may outsource its distribution function to a local
warehouse instead of committing to own an in-house warehouse.87 This approach
retains managerial and investment flexibility if the market demand gets weaker or
unstable and a new warehouse proves to be unnecessary.
• An initial investment can serve as a platform to extend a company's scope into
related market opportunities. As an example, a substantial investment to develop a
sportswear company’s customer base, brand name, and regional distribution
infrastructure for its core footwear business might lead to the development of a
portfolio of sports-related business, such as sports & fitness accessories.
86 Amram, M. and N. Kulatilaka, Real Options: Managing Strategic Investment in an Uncertain World, Harvard Business School Press, Boston, 1999. 87 In emerging markets, local third party warehouse carriers (also called “satellite distribution centers) are oftentimes contracted to handle the goods.

Real Options Methodology in Sportswear Retail Investment Valuation Literature Review
49
• Management may begin with a relatively small trial investment, retaining or
creating an option to abandon the project if results are unsatisfactory. Research
and development spending decisions provide a good example. A company's future
investment in product development often depends on specific performance targets
achieved in the lab. Whether it is Nike’s Shoe Kitchen in the US or Adidas’
Apparel Laboratory in Germany, the option to abandon a prototype is valuable
because the company can retain the option or flexibility to make investments in
stages rather than all up-front.
Each of these options – expansion, extension and abandonment -- offers
additional flexibility to management, in comparison to the simple GO/NO-GO decision
based on a positive or negative NPV. Amram and Kulatilaka argue that flexibility adds
value in at least two ways: first, deferral of an investment preserves the time value of
money, and, second, it allows management to take action based on a change in the value
of the project before the option expires. If the value of the project increases, the
investment is good; on the other hand, if the value decreases only the costs of the option
itself are incurred, as the company will decline to invest in the project further. Amram
and Kulatilaka summarize the management position reflected by Real Options as: "If
things go well, then we'll add some capital."
To sum up, in today’s ever-changing and rapidly developing world, businesses
recognize how risky and uncertain costly investment opportunities are, and how quickly
they must divest themselves of unprofitable projects to free up cash for other valuable
investment opportunities. To best capitalize on future uncertainties, Amram and

Real Options Methodology in Sportswear Retail Investment Valuation Literature Review
50
Kulatilaka argue that Real Options methodology should be used in strategic investment
decision-making as a supplement to the traditional conventional methods, such as NPV.
2.3 Strategic Flexibility in the Financial Services Industry
Michael E. Raynor, Deloitte Research, 2001
In this research paper, Raynor, together with his Research Consulting team at
Deloitte, developed a “four-phase framework: Anticipate, Operate, Formulate,
Accumulate. The goal is to reflect a “Strategic Flexibility” mindset in corporate planning.
Raynor regards NPV as one of the well-understood and widely-used tools for comparing
investment opportunities. This method “requires predicting the cash flows associated
with a given project and then discounting the associated cash flows into present day
currency using an appropriate risk-adjusted rate.” For example, opening a new retail store
might have negative cashflows in early years because of the opening-fixture investment;
later on a potential high cash flows coming in as the store starts generating sales and
profits (all costs and expenses are stabilizing as the store assumes normal operation after
the investment.
NPV norm is that if the discounted cash flows have a value that is more than zero,
the Store investment is regarded as a “profitable investment.” However when a market
changes rapidly, many factors could and would change the profit prospective of this
store. In order to deal with these situations, companies normally use numerous scenario
analyses, one of which is expected NPV (eNPV). This more complex NPV reflects a
simple triangle probability: high, medium, and low investment-return possibility to a

Real Options Methodology in Sportswear Retail Investment Valuation Literature Review
51
store. And the eNPV is actually the weighted average of the three NPV calculations with
respective probabilities assigned.
However, Raynor suggests that, “highly uncertain investment environments reveal
the many weaknesses of this approach.” He uses an example of NPV’s common practice:
“increasing the discount rate applied to highly uncertain cash flows, thereby reducing
their value.” In the financial market, however, uncertainty raises both upside sales’
possibility and downside risk. As a result, just as Raynor comments, “arbitrarily
increasing the discount rate serves only to penalize uncertainty when in fact, as with
financial options, higher levels of uncertainty surrounding an investment’s outcome
might actually make that investment more attractive.”
If the project or investment can occur in stages, or can be made to have stages
(full investment can be divided in phases) the company is in the position operationally to
invest money to “learn something about how best to pursue an opportunity.” In such
instances, Raynor thinks “even NPV approaches are inadequate, because they penalize
potentially valuable flexibility in implementation.”
2.4 Real Options: Still Looking for Evidence?
Henri Philippe, Real Options Conference, 2005
In this working paper, Philippe argues that despite a large body of literature on the
RO application, empirical tests of real options models remain limited, primarily due to
the lack of the empirical data. In addition, there are other intrinsic reasons. The author

Real Options Methodology in Sportswear Retail Investment Valuation Literature Review
52
analyzes four traditionally cited as the “empirical studies” to build his argument that case
studies are still more feasible to the solution to RO application.
• Paddock et al. (1998) empirically tested a RO model to value undeveloped oil
reserves. The model was tested on a limited number of contracts for offshore oil
leases in the US, using data provided by an anonymous company. The authors
conclude that a strategy based on option value could be more cost effective than
one based on NPV.
• Quigg (1993) tested the empirical prediction of a real option-pricing model using
large samples of market prices in the real estate sector. The test was based on
market data for local transactions in Seattle over 1976-1979.
• Berger (1996) examined the empirical implication of a RO model to price an
abandonment option. The test data was based on market data for companies (sales
over $20million), totaling over seven thousand observations. The strong
relationship, which was between market values and estimated exit prices.
• Moel and Tufano (2002) studied the decision pattern of closing and reopening
gold mines in North America. The test was based on data, extracted by the authors
from various database and public information that covered 285 gold mines. The
study confirmed that the decisions outcome made were consistent with real option
model predictions.
Philippe observes that the above-described empirical studies primarily covered
the natural resources sector, noting that, “Natural resources are usually traded

Real Options Methodology in Sportswear Retail Investment Valuation Literature Review
53
commodities and hence have an obvious advantage for researchers: this context is
appropriate for arbitrage reasoning”88. He also comments on the objectives of these
studies. He argues that in some cases, actual prices for the assets are not directly
observable in markets (except in the Quigg study of undeveloped land, which was based
on the building value). He also points out the difficulty in obtaining a tractable model.
Paddock’s empirical test, for example, used a rough assumption on oil price data as a
proxy to estimate the standard deviation of the rate of change of the value of the
underdeveloped reserves.
Philippe concludes that it is difficult for researchers empirically testing RO
models to find samples of data large enough to draw valid conclusions. And since the
data is limited, the empirical studies “show empirical evidence of their existence and of
the relations presented in the theory, but not of their value”; moreover, he thinks the “real
options are useful for many reasons and not just for valuing.” The focus of empirical tests
should not necessarily be on testing value but more on understanding investors’ behavior.
He further classifies the options in the literature:
• Investment options (Wait and See, decrease / increase the scope of the
investment);
• Operating options (abandon options as such);
• Strategic option (growth options)
88 Real Options: Still Looking for Evidence? Henri Philippe, PhD research paper, Real Options Conference, 2005.

Real Options Methodology in Sportswear Retail Investment Valuation Literature Review
54
He regards the Investment and Operating options as the easiest to assess and to
test empirically as they are exposed to a simple asset only. Because the growth options
consist of more complex options, they are more difficult to design and to value. He
finally concludes that real options are more than just a valuation tool. RO also serves as a
tool that can build bridges for management and cross-functional teams89.
His conclusion in regard to RO empirical testing is that these studies help to
confirm the existence of real options. However due to the lack of large databases and due
to the subjectivity of the data validation, real options should be treated more as a strategic
tool or a way of thinking, rather than as a valuation tool. He concludes that case studies
are more feasible than empirical studies in the application of RO90.
2.5 The Role of Real Options in Capital Budgeting: Theory and Practice
McDonald, Robert L. Journal of Applied Corporate Finance, 2006
In this influential 2006 article,91 McDonald argues that some recent discussions of
capital budgeting are misleading. He states that they tend to focus on large differences
between discounted cash flow (DCF) and Real Options (RO), concluding that: 1) the two
different methodologies should be applied in different circumstances; 2) DCF is easy and
ROV is hard or unfamiliar; and 3) most corporate finance managers use DCF and rarely
89 Applications of real options in strategic planning, management are discussed in the literature review section, 2.13, infra. 90 See Section 4 for a more thorough discussion of this literature's influence on this proposal. 91 McDonald, Robert L., “The Role of Real Options in Capital Budgeting: Theory and Practice. Journal of Applied Corporate Finance, Vol. 18, No. 2, pp. 28-39, Spring 2006.

Real Options Methodology in Sportswear Retail Investment Valuation Literature Review
55
use ROV. These conclusions are not entirely without merit. They are supported by a
widely known industry survey conducted by Graham and Harvey (2001) showing that
DCF is used very widely in corporate capital budgeting in conjunction with other
valuation models, such as Internal Rate of Return, payback, and P/E ratio (detailed survey
result is in the later section 2.1492). Similar results are also demonstrated in the 2002
survey by Patricia Ryan and Glenn Ryan.93 Although these survey results indicate that
most managers do not use RO valuation when making capital budgeting decisions,
McDonald argues that DCF and RO valuation are both essential in budgeting planning,
and more particularly, in corporate finance managerial thinking.
A key contribution of this study is the differentiation which McDonald makes
within DCF methodology. He uses the term “static DCF” to describe the traditional DCF
approach, and “dynamic DCF” to describe an adjustable approach that takes into account
the possibility that risk changes over time. According to McDonald, when using the static
DCF technique, “a constant discount rate is a correct discounting method only under the
special assumption that risk resolves at a constant rate over time.” In today’s business
world, risk develops and evolves dynamically across many dimensions at the same time,
with only mature and stable industries growing at a constant rate. RO valuation addresses
and enables the capture of the dynamic risks faced by most modern companies. In
92 De Jong, Abe, Brounen, Dirk and Koedijk, Kees C.G.,Corporate Finance in Europe Confronting Theory with Practice. 93 Ryan, P.A., and G.P. Ryan, 2002, “Capital Budgeting practices of the Fortune 1000: How have things changed?” Journal of Business and Management, 8(4), 355-364.

Real Options Methodology in Sportswear Retail Investment Valuation Literature Review
56
McDonald’ words: “RO valuation addresses the problem of discounting cash flows even
when risk premiums change dynamically94.”
In his article, he uses a Project-valuation as an example. In this example, a
forward price -- the expected cash flow computed using the “risk–neutral probability”95is
calculated. The forward price is the future value of the present price. When compared to
the present value of expected future value, the difference is the risk premium. This
implies that the DCF valuation is a necessary input into the risk-neutral calculation that is
required to conduct the RO valuation. As a result, McDonald notes, “Even if we perform
real options valuation, a DCF valuation is necessary unless there is forward price or
present value that we can observe in the market.96”
McDonald also argues that the “difference between the DCF and real options
valuation approaches are not as great as practitioners seem to believe”97. He compares
RO and DCF valuations and shows that, when used correctly, both methods provide the
same answers, because both calculate the same thing: the present values of risky future
cash flows. Nevertheless, the difference between the two methodologies is in the discount
rates used. DCF uses a discount rate that reflects expected future cash flows at the
expected rate of return on an asset98, while RO uses risk-neutral valuation (based on risk
94 McDonald, Robert L., “The Role of Real Options in Capital Budgeting: Theory and Practice. Journal of Applied Corporate Finance, Vol. 18, No. 2, pp. 28-39, Spring 2006. 95 Different from True Probability, McDonald, Robert L., “The Role of Real Options in Capital Budgeting: Theory and Practice. Journal of Applied Corporate Finance, Vol. 18, No. 2, pp. 28-39, Spring 2006, Pg 31. 96 McDonald, Robert L., “The Role of Real Options in Capital Budgeting: Theory and Practice. Journal of Applied Corporate Finance, Vol. 18, No. 2, pp. 28-39, Spring 2006. 97 Ibid. 98 See detailed discussion on NPV discount rates in the NPV Background section.

Real Options Methodology in Sportswear Retail Investment Valuation Literature Review
57
neutral probabilities). RO’s strength becomes more apparent when the discount rates are
expected to change over time, due to changes in the project, industry, or macro-economy
environments.
McDonald’s closing comment is that using RO to support NPV may “encourage
managers to think more broadly about the flexibility that is (or can be) built into future
business decisions, and thus to choose from a different set of possible investments.”99 His
point of view is also shared by some strategists100 who think that the implementation of
real options methodology can broaden the strategic direction of the company.
2.6 How Kimberly-Clark Uses Real Options
Amram, Li, and Perkins, Journal of Applied Corporate Finance, 2006
Kimberly-Clark (K-C), a leading consumer products manufacturer, has enjoyed
accelerated organic growth over the past eight years, thanks to its stringent allocation of
additional capital to key strategic innovations. In 2004, K-C introduced its Enterprise
Growth Incubator (ECI), which is comprised of projects, corporate venture capital, and
technology licensing deals characterized by great uncertainty. In their 2006 article,
Amram et al. described K-C’s evolution toward RO methodology as follows: “Careful
attention to implementation of this strategic imperative led to concern about how to value
99 Amram , Martha , Li, Fanfu and Perkins, Cheryl A., How Kimberly-Clark Uses Real Options. Journal of Applied Corporate Finance, Vol. 18, No. 2, pp. 40-47, Spring 2006. 100 Tong, Reuer, 2007, “Real Options in Strategic Management – Advances in Strategic Management”, vol, 24, Real Options in Strategic Management.

Real Options Methodology in Sportswear Retail Investment Valuation Literature Review
58
risky projects, which led in turn to real options.”101 Therefore, “As a new way of thinking,
as a change in both how project analyses are framed and the order in which risks are
investigated and resolved”102, RO valuation methodology was implemented by K-C. This
article discusses how K-C adopted and uses the real options approach to project valuation.
In this article, Amram, Li, and Perkins use the example of RO valuation in one of
K-C’s potential Joint Development Agreements, pursuant to which K-C agreed to
develop new products with a start-up company (ABC) by combining ABC’s unique
technology with K-C’s manufacturing and distribution. It would be very difficult to
project the future cash flows to be generated from this arrangement due to the uncertainty
inherent in both ABC (due to its startup status) in particular and the marketplace in
general. K-C decided to use RO analysis.
Based on RO analysis, the deal was structured as follows: the first payment of
$1million would be paid only if and when a 50% technology success rate were attained
(otherwise the project would be abandoned); the second payment would be paid only if
and when a 75% rate were attained (otherwise the project would be abandoned); and the
product launch would commence only when an 80% success rate were achieved and
delivered. This structure led to a “secured” benefit of minimized downside risk while
simultaneously preserving the opportunity to reap the upside by “waiting for the future.”
Although the project’s upside potential was highly uncertain, by using RO valuation K-C
101 Amram , Martha , Li, Fanfu and Perkins, Cheryl A., How Kimberly-Clark Uses Real Options. Journal of Applied Corporate Finance, Vol. 18, No. 2, pp. 40-47, Spring 2006. 102Ibid.

Real Options Methodology in Sportswear Retail Investment Valuation Literature Review
59
was able to structure the deal in a way that enabled it to retain flexibility by delaying
spending until sufficient information became available.
Amram, Li, and Perkins conclude that “K-C is uniquely positioned to support and
benefit from innovations with large upside potential.”103 K-C’s successful RO analysis
relied on a number of factors that have more to do with corporate process than with
quantitative models. In spite of this, the authors argue that this case study on real options
implementation should lead to a greater acceptance of RO as an important valuation
method.
2.7 Sub-Finance: New Sources of Data for Real Options Analysis104
Nelson, Housel, and Mun, 2005
In this article, Nelson, Housel, and Mun address the “interlocking” issue by
presenting an analytic theory and related methodology, Knowledge Valuation Analysis
(KVA). This “interlocking” was raised by Dr. Steward Myers in his keynote speech at the
8th Annual Real Options Conference held in Montreal, Canada, in June 2004. Dr Myers
described four interlocking issues to be addressed in RO practice: 1) problems related to
developing fundamental inputs for the models; 2) a low level of computational
transparency; 3) no standardized method; and 4) the need to more effectively
“commercialize” the practice of RO analysis.
103 Ibid. 104 Nelson, Housel, and Mun, “Sub-Finance: New Sources of Data for Real Options Analysis”, Real Options Conference working paper 2005.
Real Options Methodology in Sportswear Retail Investment Valuation Literature Review
60
They propose that the KVA will provide a new source of raw data for use in real
options analysis. Their analysis began by identifying a number of problems related to
developing RO model input, including the following:
a) inconsistent financial languages, thought processes, and evaluation output in
corporate finance;
b) accurate financial valuation constrained by “quality of data”;
c) difficulty in valuation of the underlying asset due to:
i) lack of ability to replicate the underlying asset for real options by using a
market portfolio;
ii) difficulty in estimating the net present value of cash flows of the underlying
assets (this could be due to the uncertainty around the underlying assets /
projects);
iii) difficulty in isolating the interdependencies and synergies; and/or
iv) difficulty in developing a sensible discount rate which can capture/reflect all
risks the underlying real asset / project is exposed to;
d) the extreme difficulty in capturing the volatility of projects; and
e) difficulty in modifying traditional theoretical assumptions to fit RO settings.
The study cites an example utilized by Booz Allen Hamilton on the Mission
Support Center (MSC) used by the U.S. Special Operation Forces (SOF) to demonstrate
how KVA and RO can be used effectively together. The purpose of KVA analysis is “to
assist strategic planners in understanding the levels of value contributed to the MSC by
people, processes, and information technology.” The analysis first uses the KVA

Real Options Methodology in Sportswear Retail Investment Valuation Literature Review
61
approach to model the results from three possible scenarios: 1) build IT in-house; 2) buy
IT from external sources; or 3) outsource software development and staff. These
scenarios are then developed into a set of discounted cash flows, resulting in expected net
present values. Thereafter, decision support software is used to generate probabilities for
use in the RO analysis. Based on this example, the authors conclude that “KVA can be
used to identify and measure the outputs of people, IT, and a core process.”
In their study, the authors also address some limitations of the KVA + RO method,
including the “need to capture non-directly-observable meta processes and the
contribution of management” and “the need to fully standardize the data-gathering
methods.” As the article indicates, these needs are required to properly conduct the KVA
+ RO approach; in reality, however, both are difficult to meet. Another limitation might
be that, due to the particular dynamics and features of the organization described, the
study’s results might not be readily generalizable.
2.8 Real Options in Strategic Management Advances in Strategic Management
Tong and Reuer, 2007
In their paper105, Tong and Reuer emphasize the key role of uncertainty,
particularly in financial and strategic planning. They review the strategy literature
focusing on RO, with the objective of providing a forum for researchers to tackle key
questions. They also map out the future research agenda for RO in strategic management.
105 Tong, Reuer, “Real Options in Strategic Management,” Advances in Strategic Management, Vol 24 (2007), University of Toronto.

Real Options Methodology in Sportswear Retail Investment Valuation Literature Review
62
Tong and Reuer regard RO is a unique theory that can fit in strategic management,
at least in regard to three of its properties: 1) its uncertainty; 2) its unique structure for
protecting the downside risk via payment of the premium as “insurance”; and 3) its
ability to provide follow-on opportunities to firms, such as stage investment and
expansion investment.
The authors contend that the financial field is known for its discipline while
strategic planning is known for its qualitative attributes. They contend that by “bringing
the discipline of financial markets into qualitative strategic planning,”106 RO has a great
prospect of “integrating strategic and financial analyses for corporate strategy.”107
All of these analyses build a framework that overlays three critical topics of
research in international strategy (multinational, market entry mode, and market entry
timing) with three major approaches used in existing RO research in the field (RO
modeling / reasoning, and empirical testing). The study also discusses the potential
contributions that RO theory can make that may enhance managerial and organizational
capabilities to implement companies’ strategic decisions. In the area of empirical studies,
they conceptualize patents as technology options and examine the option value of a
firm’s patent portfolios. They conclude that RO theory parameterizes sources of
uncertainty; adding value to the investment choices and hence improving and directing
the firm’s strategic decisions. Therefore, RO can significantly contribute to strategic
management research.
106 Ibid. 107 Ibid.

Real Options Methodology in Sportswear Retail Investment Valuation Literature Review
63
2.9 Management Corporate Finance Decision Making—Corporate Finance in
Europe: Confronting Theory with Practice
Brounen, de Jong, & Koedijk, 2001
In 2001, Brounen, de Jong, and Koedijk cite Graham and Harvey in a widely
covered survey on the corporate application of a variety of capital budgeting techniques,
the discounted cash flow techniques included the following:
1) the IRR, 2) the NPV, 3) the adjusted present value, 4) the discounted
payback period, 5) the profitability index, 6) hurdle rates, 7) book rates of return, 8)
more advanced methods like sensitivity analysis, 9) Real Options, and 10) value at risk.
The authors of this study described the purpose of said study as follows: “To
investigate the effect of the corporate governance system on individual firms and include
this important issue in our overall analysis of corporate finance practices. The analysis
covers a wide range of corporate finance issues, ranging from capital budgeting
techniques to capital structure, and corporate governance.” From the responses, the
authors conclude there are differences between management corporate finance decision
making in the US and in Europe (primarily in UK, Netherlands, Germany, and France).
The survey sample consists of a cross-section of 6,500 companies from the U.K.,
the Netherlands, France, and Germany, from which De Jong & Koedjik collected 313
responses. In this case, the sample is large and offers cross-sectional variations and the
statistical power to analyze these variations. The main purpose is to provide a general
guidance for the main methodology currently being used by corporate management in the

Real Options Methodology in Sportswear Retail Investment Valuation Literature Review
64
financial decision making process. Selected survey questions and their answers included
the following:
Survey question: "How frequently does your firm use the following techniques
when deciding which projects or acquisitions to pursue?"
Results: European respondents selected payback period as their most frequently
used capital budgeting technique. The percentage of finance executives selecting this
measure was: In the U.K. 69.2%, the Netherlands 64.7%, Germany 50.0%, and France
50.9%. In Europe, the preference for payback period is followed immediately by net
present value and internal rate of return methods. In the U.K., the Netherlands, Germany
and France 53.1%, 56.0 %, 42.2% and 44.1% of all CFOs use the internal rate of return
method respectively, while using the NPV method is comparably 47.0%, 70.0% 47.6%
and 35.1%. Of U.S. firms, 56.7% declared themselves as utilizing the payback tool, but in
the U.S. it was only the third most popular tool after internal rate of return and net present
value.
The relative popularity of the payback period in Europe is surprising, because
financial textbooks have discussed the shortcomings of the payback criterion for many
decades. As is well known, the payback method ignores the time value of money and
cash flows beyond the cut-off date. It is sometimes argued that the payback approach is
rational for severely capital constrained firms: if an investment project does not yield
positive cash flows early on, the firms will cease operation and therefore can not receive
positive cash flows that occur in the distant future.

Real Options Methodology in Sportswear Retail Investment Valuation Literature Review
65
When taking firm characteristics into account, one of the interesting pieces of
feedback, according to the survey, was that the use of the payback criterion is more
popular among smaller firms (except for the U.K.) and among firms with management
belonging to the highest age cluster. NPV is used significantly more often by large firms
(except in the U.K.). Real options however, is still new to most of the CFOs, but has
emerged as a widely accepted and valuable supplemental valuation methodology to NPV.
2.10 Option Valuation of Architectural Flexibility: A case study of the option to
convert to office space
Lara Greden, PhD Candidate, Leon Glicksman, 2004
In their 2004 Real Option conference paper, Greden and Glicksman address the
“potential value in flexible spaces,” proposing that, “In moving towards a strategic view
of space as a flexible asset, real options methodologies are promising candidates for
informing decisions in the design process.” They identified the goal of their paper to be
helping corporate facility managers and real estate developers to recognize architectural
flexibility. The research addresses the assumptions needed to apply financial-type real
options models to physical design questions. “The model provides results that help
decision-makers justify increased investment in designs that will cost less to renovate (i.e.,
are more flexible) in the future.” In an example, “a case study for a corporate campus, a
model is developed to determine the option value to convert a space to office space,

Real Options Methodology in Sportswear Retail Investment Valuation Literature Review
66
concluding that “the governing uncertainty must be a market-based factor such as the
price of rent.” 108
2.11 Mixed Uses and the Redevelopment Option
Paul D. Childs, Timothy Riddiough, and Alexander Triantis
In this research, Childs, Riddiough, and Triantis explore the potential impact of
mixed uses and redevelopment on property value. They suggest that, “operating
flexibility of this type is found to significantly increase property value when the
correlation between payouts from different property types is low or when redevelopment
costs are low.”109 The authors suggest that the “choice between mixed-use versus single-
use real estate development is neglected”110 and that, “Given flexible zoning controls, a
strong case can be made for mixed-use development as a hedging strategy—it allows for
diversification between different uses that can decrease risk to the investor.”111 Not just
the mixed uses of land, Childs et al. further point out that, “the flexibility to redevelop a
property into different combinations of uses may yield additional economic value.”112
This study investigates whether it is feasible to derive optimal proportions of
alternative uses and, if so, it attempts to derive those proportions. They find that, “in the
108 Ibid. 109 Childs, Riddiough, and Triantis , “Mixed Uses and the Redevelopment Option”, Real Estate Economics, V24, 1996, pp 317-339. 110 This statement is from the cited article written in 1996 by Childs, Riddiough, and Triantis , “Mixed Uses and the Redevelopment Option”, Real Estate Economics, v24, 1996. 111 Childs,, Riddiough, and Triantis , “Mixed Uses and the Redevelopment Option”, Real Estate Economics, v24, 1996. 112 Ibid.

Real Options Methodology in Sportswear Retail Investment Valuation Literature Review
67
presence of relatively low costs to conversion, flexibility with respect to mixing uses and
redevelopment will contribute significantly to the overall value of the built property or
undeveloped land.” The article develops a theory for valuing both developed and
undeveloped land given the option for mixed uses (and possible redevelopment if
conditions dictate). It then presents solutions that demonstrate correlations in operating
cash flows, costs, and rental revenues that scale in direct proportion to the property value.
They find that, “when revenue and cost functions are linear in quantity…[and
when the objective of value maximization is present] mixed-use projects will not exist.”
They argue that this result is consistent with the intuition of real estate development in
that, “since marginal revenues are constant in scale, diversification within use is sub-
optimal since doing so will never increase (and typically decreases) combined current
revenues.”113 They also find that mixing uses may be optimal even in the linear revenue
case. Therefore, they conclude, “The mixed-use outcomes are characterized as happening
in real estate markets that are ‘supply sensitive.’” 114
The authors propose that future research can be extended in several dimensions,
including the determination of optimal density and RO application. At least one
researcher has followed this direction.115
113 Ibid. 114 Ibid. 115 Åke Gunnelin, “ The option to change the use of a property when future property values and construction costs are uncertain”, Section of Building and Real Estate Economics, Vol 22, Issue 7, pp 345-354, Royal Institute of Technology, Stockholm, Sweden.

Real Options Methodology in Sportswear Retail Investment Valuation Literature Review
68
2.12 Valuing Retail Shopping Center Lease Contracts Incorporating Inter-Store
Externality Effects: A Real Option Approach
Cho, Hoon, 2007
In this dissertation, Cho provides a general formulation for valuing a retail-
shopping center under conditions of uncertainty. The study integrates two lines of
research: one line consists of the valuation of options embedded in a retail lease contract,
while the other addresses the valuation of retail leases in consideration of inter-store
externalities.116 Cho regards his dissertation as the “first step in the quantification of 1)
sales-demand shock parameters and 2) all shopping-center tenants’ space-demand
functions.” Cho’s study was motivated primarily by the decrease in the number of viable
department stores due to industry re-organization and/or consolidation, as well as by the
flattening of department store returns on investments due to the growth and expansion of
discount stores and the resulting intensified competition. These developments highlight
the need for developers to “maximize returns while controlling for the risk of the
variability of receiving the rents.”117
The principal goal of Cho’s dissertation is to explain how to theoretically value a
sales-percentage lease, using the RO approach, by establishing a simple RO model of
retail shopping-center leases -- “a model whose features are necessary to efforts to value
116 Cho, Hoon. (2007) Valuing retail shopping center lease contracts incorporating inter-store externality effects: A real option approach. Ph.D. dissertation, The University of Wisconsin, Madison, Wisconsin. 117 Ibid.
Real Options Methodology in Sportswear Retail Investment Valuation Literature Review
69
a standard percentage retail-lease contract under uncertainty.”118 Cho argues that neither
deterministic frameworks nor stochastic process models were able to estimate the risk /
value: “these models systemically underestimate risk and overestimate value when
default is an important element in the analysis.”119
Cho asserts that “the present study integrates these two lines of research by the
proposed model that “developed here treats (1) the stochastic component of stores sales
in a manner similar to that of Hendershott and Ward (2000, 2002) and (2) shared and
generative business within the shopping center in a manner similar to that of Brueckner
(1993).”120
The source that Cho uses to parameterize his model is Simon Property Group Inc.,
which he describes as the largest publicly traded real estate investment trust (REIT) in
North America and the country’s largest owner, developer, and manager of high quality
retail real estate. Although Cho described his model as “relatively simple”, it nonetheless
“helps to explain a variety of phenomena: why an increase in sales volatility may reduce
shopping-center value, rather than increase it as others have suggested, etc.” 121
Businesses today are challenged by a marketplace that is changing at a rapid and
unprecedented rate. Corporations compete to win both consumers and investors. Investors
demand better returns on their real and financial asset investments. As one of the
financial derivatives, financial options can be used normally as leverage. This allows the
118 Ibid. 119 Ibid. 120 Ibid. 121 Ibid.

Real Options Methodology in Sportswear Retail Investment Valuation Literature Review
70
holder to participate in equity investments without actually buying the underlying asset
outright. Financial options can also be used as a protection. This allows the option
holders to guard against price fluctuations in the short term because the holders can
acquire the underlying stock at a fixed price for a limited time. Real asset investment
valuations have recently begun to investigate the possible benefits of utilizing BSOPM in
real asset valuation, to complement the traditional valuation tools, such as NPV.
2.13 Making Real Options Real122
Copeland, T. and P. Keenan, 1998, The McKinsey Quarterly
Copeland and Keenan continued to expand upon their initial research. In 1998,
they pointed out that Real Options are especially valuable for projects that involve both a
high level of uncertainty and opportunities to dispel that uncertainty as new information
becomes available. To bring practicality and detail to thinking about real options,
Copeland and Keenan worked through a series of cases that capture the business
problems and realities they involve. In their 1998 article, Copeland and Keenan focus on
three different types of real options: compound options, learning options, and staged
investments.
1) Compound options can help management understand whether and when to
proceed with the later phases of projects that have already been initiated. This
122 Copeland, Thomas E. and Philip T. Keenan (1998) "Making Real Options Real", McKinsey Quarterly, no. 3, 128-141.

Real Options Methodology in Sportswear Retail Investment Valuation Literature Review
71
application is particularly useful when the NPV is close to breakeven because
breakeven results tend to result in overly subjective decision-making. In general,
compound options involve sequenced or staged investments. Making the first
investment gives a company the right but not the obligation to make a second
investment, which in turn confers the right to make a third, and so on. This differs
from simple options, which gives their holders the right to buy or sell an item at a
particular price on only one occasion, at or before a particular expiration date.
2) Learning options are those where the holder pays to learn about an uncertain
quantity or technology. An oil company may own the rights to a plot of land
without knowing exactly how much oil it contains. Rather than trying to
predetermine a particular level of production capacity, the company might find it
worthwhile to spend money discovering the actual extent of the reserves. This
might involve drilling to learn more about the quantity of natural resources
located under the surface. This would allow development of the field without
wasting resources building facilities designed to process more oil than is actually
there. Conversely, it would avoid delayed profits from constraining production
rates for fear of depleting wells that in reality contain more oil than was believed
to be there. Similarly, companies with R&D programs invest to reduce
technological or knowledge-based uncertainty.
3) Staged investments give managers the option to abandon or scale up projects well
into their lifetimes. These compound options can be highly valuable. Similar
factors apply in any manufacturing industry when a new factory or a large capital

Real Options Methodology in Sportswear Retail Investment Valuation Literature Review
72
investment is under consideration. Decisions about expanding into new
geographic areas and investing in research and development also involve staged
investments of this kind. A sequence of acquisitions constitutes a staged series of
investments. At each stage, it is not clear that an acquisition will provide the
anticipated growth platform. If it does, the company that makes the acquisition
can proceed with the next one. If it does not, the acquirer has the option of selling
the latest acquisition, though not necessarily recouping its full cost. Real Option
valuation can be used to value all possible contingencies.
2.14 Using Real Options In Strategic Decision Making
Chris Walters and Tim Giles, 2000, Amos Tuck School of Business at Dartmouth
The tools most commonly used to value investments are: payback rules, rates of
return, net present values (NPV) and Real Options. In this study, Walters and Giles
suggest that the application of Real Option methodology contributes not only to financial
valuation, but also to strategic vision by providing a useful planning framework to
address growth and timing of, and exit from, investment opportunities.
• Growth: Real Options place a value on the ability to invest now and make follow-
up investments later if the original project is successful. Examples are: high
investment experimental R&D, such as new product development in
pharmaceutical or high technology industries.

Real Options Methodology in Sportswear Retail Investment Valuation Literature Review
73
• Exit: Real Options can also enable valuation of the ability to abandon a project if
it is unsuccessful. Examples include mining or oil exploration investment.
• Timing: Real Options can value the ability to wait and learn, resolving
uncertainty, before investing.
Walters and Giles also compare Real Options with Decision Tree analytical
methodology. They state, “Decision-tree analysis tends to consider great detail in the cash
flow models and many uncertainties, but relatively little in the way of dynamic decision
making” and that “this dynamic complexity is generally more important than detail
complexity"123. Real Options analysis, on the other hand, can help the business focus on a
few key dynamic processes while decision-tree analysis would overflow the largest
boardroom whiteboard. They suggest/conclude that using NPV does not take account of
managerial options and the Real Options approach can help by valuing these managerial
intangibles and preventing mistakes.
2.15 Managerial Implications of Implementing Real Options Thinking In
Resource Allocation
Jacquet, 2000
In his paper, Jacquet raises the following two points:
123 Using Real Options in Strategic Decision Making, Chris Walters and Tim Giles, London Economics, Tuck Paradigm, Amos Tuck School of Business at Dartmouth, Spring 2000.

Real Options Methodology in Sportswear Retail Investment Valuation Literature Review
74
1. Why organizations have restrained themselves in the introduction of Real Option
thinking in capital budgeting and
2. How companies fully integrate Real Options into their business models.
He regards the traditional approach – utilization of the cost of capital and its
application in the valuation of assets (Discounted Cash Flows, Net Present Value) -- as
less than optimal in the long run, and he argues that Real Option thinking should be
embedded in the resource allocation processes for the short- and medium-run.
In this respect, the RO approach would be a way to understand:
• The manner in which management reacts, to future evolutionary changes, and
how management can be assisted to understand which actions to take to react to
such changes, adds value.
• How alternative options should be taken into account when the initial investment
is made.
Jacquet argues there is an important organizational consequence of that behavioral
issue. Introducing an “option-mentality” in a company will probably increase the
percentage of risky projects accepted. If the company wants to encourage its employees
to take "good" risks, it has to protect them against an adverse evolution.
2.16 Decision Making for Technology Executives, Artech House
Linstone, 1999
In his book, “Decision Making for Technology Executives, ” Linstone proposes
that three distinct perspectives are inherent in any system and that all three must be

Real Options Methodology in Sportswear Retail Investment Valuation Literature Review
75
understood to fully understand the system. These three views are identified as the
Technical (T), Organizational (O), and Personal (P) perspectives. Each perspective yields
insights about the system not obtainable via the others, and for a full comprehension of
the system all three perspectives must be integrated; the implication is that the integrated
view enables the whole system to be greater than the sum of its parts. The author
emphasizes that it is necessary to balance attention across all three perspectives.
Balancing the perspectives help to avoid problems such as technologists attempting to
perceive all problems through the technological lens that comes naturally to them, with
the result those technological solutions are applied to problems that may not be
technological in nature. It is often said that to a worker with only a hammer, every
problem looks like a nail. Workers with an understanding of the organizational and
personal perspectives may seek other tools to solve problems.
Linstone describes the three perspectives thusly:
• The Technical perspective refers to the world as seen in quantitative ways, such as
curves or computer models. Problems and proposed solutions are described in
terms of alternatives, trade-offs, optimization, data and models.
• The Organizational perspective perceives the world through the viewpoint of
affected and affecting organizations. Organizations, from this perspective, may
be formal or informal, hierarchical or egalitarian, or permanent or ad hoc.
Linstone asserts that the O perspective also reflects the culture and myths that
have helped to mold and bind the organization, group, or society as a distinct

Real Options Methodology in Sportswear Retail Investment Valuation Literature Review
76
entity in the eyes of its members. He notes that, normally, outstanding companies
have strong cultures that reflect their values.
• The Personal perspective is the most subtle and elusive, and the most difficult to
define, because it is stems from the individual personality. According to Linstone,
self-interest motivates most individuals, although that motive may often be hidden
or disguised. Disguised self-interest may manifest itself in the pursuit of prestige,
profit, power, or pleasure.
The purpose of understanding the three perspectives is to help a person with one
of those perspectives to recognize that his or her point of view is not the only significant
way of looking at the situation. An understanding of the three perspectives should also
reveal to the person why he or she holds his or her own position.
Linstone points out, for example, that people associated with the Technical
perspective tend to want to reduce issues to questions of fact, to undertake some kind of
research, or gather data, or do tests, all to clarify situations from a scientific or technical
point of view so they can move on to a solution. The reality is that in complex situations
there are relatively few situations that lend themselves to purely technical solutions.
Rather, in most complex situations there are some technical problems, but the most
important concerns usually involve assumptions and goals that may not be technical in
nature. In these issues, technical solutions are rarely to be found. More likely to be found
is a point of resolution, a point which satisfies everyone to some extent, but no one
completely.

Real Options Methodology in Sportswear Retail Investment Valuation Literature Review
77
From the Organizational perspective, the primary priority is the well-being of the
organization. When organizations are faced with crises, their priority is not to seek
technical solutions or solutions that satisfy every individual. Rather, they seek to
minimize damage to organizational well-being, even at the cost of personal hardships to
organizational members and even if technical solutions may be available to help
ameliorate the crisis. If the solution does not help the organization as a whole, it does not
satisfy those who embody the Organizational perspective.
The Personal perspective is the most broad and diversified, since it has to do with
how any person who has a connection with the socio-technical system at issue thinks,
feels, believes, or may act. Those personal factors are often the most difficult to
comprehend fully because they are often extremely divergent. They come from people
with varying levels of concern, interest and commitment to the system. Ultimately, it is
essential to understand those personal perspectives to achieve a workable resolution to a
problem.
Based on the foregoing, it can be seen that T perspective looks to the logic of
problem solving and optimizing involving trade-offs; the O perspective is action-focused
on the group and oriented towards incremental organizational change; and the P
perspective relates to the individual, accepting his/her power and influence and limited
cognitive ability to handle more than a few alternatives. Thus T relies on logic,
observation and analysis, O emphasizes justice and bargaining, while P has morality as a
core value leading to intuition and learning. A key attribute of TOP theory is that because
it emphasizes that all three perspectives must be integrated, none of the individual

Real Options Methodology in Sportswear Retail Investment Valuation Literature Review
78
perspectives can be allowed to dominate the rest, so that all three contribute to pursuit of
a more nuanced and balanced solution than would be obtainable without applying all
three perspectives.
In this study, the investment decisions involved clearly benefit from incorporation
and integration of all three perspectives. When the NPV is negative (T perspective),
management may nonetheless decide to invest (P perspective) based on their business
instinct that the investment aligns with the company’s long term strategic goal (O
perspective).
Because management’s instinctive “P” view is subjective, it is not easy to
determine whether it is correct or not, unlike the “T” analysis that is provided by NPV.
Hence a supplementary T perspective tool, RO analysis, is very helpful and useful in
testing the alignment between the P and O perspectives.
Real Options Methodology in Sportswear Retail Investment Valuation Sportswear Industry Development
79
3 Sportswear Industry Development
SRI is a relatively new industry that evolved over the past few decades,
particularly after the major global sportswear players emerged, consolidated, and
integrated. The SRI evolved when the sportswear industry separated from the general
apparel industry and developed specialized retail capabilities within the sportswear
industry. Improved living conditions over the last half century led to lifestyle changes in
developed societies that contributed significantly to the development of the SRI as a
separate industry category.
3.1 Improved Living Conditions Created the Sportswear Industry
The concept of “sportswear” appeared only recently. In the past, life for common
people was hard and contained enough physical activities that our ancestors did not have
the time or the need to engage in extra fitness activities. Over the years, as human society
developed and technology leapt forward, people’s living conditions improved due to
many factors, including the following:
• industrial machinery freed people from doing many kinds of heavy physical labor;
• agricultural advances provided society with better and more dietary choices;
• technology and transportation developments combined to produce more leisure
time.
The improved living conditions also had the effect of lengthening life spans.
Along with this positive development new problems emerged, such as new physical
Real Options Methodology in Sportswear Retail Investment Valuation Sportswear Industry Development
80
ailments, many of which (such as heart disease) were related to physical inactivity.
Modern society is concerned with poverty in underdeveloped countries and obesity in
developed countries at the same time. The need for people in developed economies to
exercise in order to combat the ill effects of sedentary lifestyles emerged. Gradually, the
need for a more active lifestyle created the need for “Sportswear” to be a separate sector
within the general apparel industry. The sportswear industry came into being and a global
sportswear market began to grow and draw attention.
3.2 Changes in Lifestyle Led to the Evolution of the Sportswear Industry
Since its emergence, the sportswear industry has been evolving rapidly. Improved
living conditions and reduced physical labor made it possible and desirable for people to
participate in sports activities. More leisure time not only allowed people to participate in
sports events but to watch them, and modern communication tools encouraged the
development of highly engaged sports fans. Sportswear has moved from the “nice-to-
have” to the “should have” and eventually to the “must have” categories on many
consumers’ shopping lists.
3.3 Sportswear Industry Extension: Sportswear Retail Industry
As more and more people started paying attention to their overall wellbeing, the
sportswear market continued to grow. The market size almost doubled from 2003 to

Real Options Methodology in Sportswear Retail Investment Valuation Sportswear Industry Development
81
2009124. This demonstrates the rapid development and expansion of the consumer base,
product offerings, and distribution channels. Consequently, the SRI has also developed
into an industry, and due to its inherent industry characteristics that are distinct from
those of the general sportswear industry, it has developed an investment profile that is
difficult to predict with certainty. The following factors contribute to that profile:
1) Business models: The companies compete across numerous dimensions, including
product quality and value, logistics, customer service, and others. SRI competitors
can rarely succeed if they excel in only one area.
2) Competition: The competitive rivalry among the major competitors is fierce and
ruthless across all dimensions, featuring bidding wars for celebrity athlete and
team endorsements, competition for prime sales locations, incursions into
competitor’s home markets, and other battles on a continual basis. Competition
was intensified by a number of factors. First, retailers expanded horizontally, as
retailers that previously sold only general apparel began to also carry athletic
apparel or active apparel. Second, some competitors, particularly the global
companies, began opening high-profile signature retail stores, such as Adidas’
Flagship stores in Tokyo and Shanghai and Nike’s own stores in London and
Paris. By expanding to the retail front, competitors can enhance their brand
presence and can also directly engage with consumers drawn to such glamorous
or extravagant outlets. In addition, some retailers integrated backward, developing
124 Worldwide market size (global sales of sports equipment, apparel and footwear) has grown from $143 billion in 2003 to $282 billion in 2009 (data source: NPD, Inc).

Real Options Methodology in Sportswear Retail Investment Valuation Sportswear Industry Development
82
their own private brands and selling them at cheaper prices. Third, consolidation
intensified the competition. Retail industry has been trending toward
consolidation. Major retailers emerged, developing stronger buying power to
drive down prices and squeezing out smaller local retailers.
3) Educated consumers: Consumers have become much more informed over time.
They can search for the best value / price combination easily through the Internet.
They can order the products even if the seller is in another country, or can order
online directly from the factory. They can find information about better value
bargains on a broader and larger scale and can identify the latest new inventions
much more quickly. Consumers were being “led” before; now they are “leading.”
4) Shortened industry cycles. As consumers become better educated, their
purchasing behavior is changing quickly. As a result, the product “shelf-life”
cycles are getting shorter. The shortness of these cycles is relatively new and the
industry is in the process of adapting to this change, resulting in retailers forming
different types of stores to attract consumers, to create premium consumer
experiences, and to take the advantage over competitors.
3.4 SRI Distinguishing Industry Characteristics
3.4.1 Sports celebrities and team endorsements.
Historically, the sportswear industry was part of the general apparel & footwear
retail industry, which in the past could be counted on for steady growth. Compared to the
general apparel & footwear retail industry, however, the sportswear industry has a strong

Real Options Methodology in Sportswear Retail Investment Valuation Sportswear Industry Development
83
distinguishing characteristic: major dependence on the often unpredictable outcomes of
major sporting events and upon the continued success and good behavior of admired
sports teams and celebrities.
Sportswear to some consumers is a declaration of their support for their team and
its actual or potential achievements. This characteristic is a direct reflection of
consumers’ purchasing-intention. A sports celebrity or team’s victory or defeat, or glory
or shame, often has a direct and significant impact on the profitability of both the
sportswear company and of their retailers. To many other sportswear consumers,
sportswear can also be the preferred means of their individual expression.
Loyalty to the team transfers to loyalty to its sportswear sponsor. For instance,
Adidas is the official sponsor for the German national (soccer) football team, while Nike
sponsors the French team, Umbro (a British football sportswear company) sponsors the
English team and Lining (a Chinese sportswear company) has the Chinese team. German
football fans will not buy Nike football sportswear, as a way of demonstrating their
loyalty to their team.
3.4.2 Dependency on sports events & results & celebrities
A very distinguishing characteristic of the SRI: dependency on the major sporting
events anticipated and/or sports celebrities admired. Wins or losses from a sports
celebrity and/or sports team can have a direct impact on both the sportswear company
and the retailers’ profitability. Wins or losses by these teams can directly impact the
sportswear companies’ profits or losses.
Real Options Methodology in Sportswear Retail Investment Valuation Sportswear Industry Development
84
As sales fluctuate ever more dramatically in reaction to such external events in the
sports world, the industry is perceived as having become far more volatile than in the past.
For example, England’s unexpected early ouster from the 2008 Euro Cup for soccer had a
multimillion dollar impact on sales of Umbro brand sportswear featuring that event and
that team. Two weeks after the game that cost the English team its opportunity to
advance, Umbro issued a profit warning to the investor community. Subsequently, major
UK retailers, JJB, Sports World, and Sports Direct all followed suit. Conversely, the
unexpected success of the Spanish team in winning the 2008 Euro Cup generated a boom
in sales of Adidas brand sportswear associated with that team.
Similarly, the success or failure, glory or disgrace, of individual sports stars who
endorse one sportswear brand or another can make a difference in sales of associated
apparel in the millions of dollars. In the U.S., NFL quarterback Michael Vick’s criminal
convictions for dog fighting not only destroyed the value of his sponsoring sportswear
company’s investment in him, it may even have harmed the value of the company’s
entire brand. Nike suspended the release of the Vick V Shoes while Reebok took the
unprecedented step of stopping sales of his No. 7 jersey.
To summarize some of the notable factors of this evolution are:
1) Major national and global retailers are emerging, cannibalizing the smaller or
local retailers;
2) Heavy reliance on the major sporting events and sports celebrities;
3) Glamour flagship stores are becoming one of the important venues to build brand
equity, requiring a much heavier upfront investment than before;

Real Options Methodology in Sportswear Retail Investment Valuation Sportswear Industry Development
85
4) Consumer spending around major sporting events is difficult to predict.
3.5 Sportswear Retail Industry Analysis - Increasing Volatility
3.5.1 Retail industry increasing volatility.
Recent retail industry changes have led to a noticeable increase in the volatility in
sales, earning, and cash flow, which translates into an associated rise in standard
deviation. As the standard deviations increase, real options become more valuable in the
retail investment valuation. As a result, in addition to the conventional valuation
methodology, such as NPV, Internal Rate of Return (IRR), and/or Payback, retailers and
investors have begun to consider whether real options methodology may be useful in the
valuation of such store projects.
The figure below demonstrates the evolving volatility of retail industry sales. This
figure demonstrates that 2010 Retail sales fluctuate much more widely than did 1992
sales, particularly during the holiday season125 when retail sales would normally be
expected to peak. During the 2010 holiday season, consumers were facing a severe
economic and credit crunch. Holiday consumer spending was reserved, demonstrating
how closely retail sales are related to the macro-economic environment.
125 National Retail Federation defines “holiday retail sales” as retail industry sales which occur in the months of November and December. Retail industry sales include most traditional retail categories including discounters, department stores, grocery stores, and specialty stores, and exclude sales at automotive dealers, gas stations, and restaurants.

Real Options Methodology in Sportswear Retail Investment Valuation Sportswear Industry Development
86
Figure 1: Retail Industry Monthly Trending Sales 1992 vs. 2010
3.5.2 Sportswear retail industry increasing volatility.
There is not yet any sportswear retail sales survey defined or conducted in the US
census. The sportswear industry is seen as part of the apparel, footwear, and sporting
goods (equipment). In order to demonstrate the increasing volatility in sportswear retail,
this study gathers yearly sales data for the US major sporting goods retailers126 and
126 Note: The US Major Sporting Goods Retailers included in this study represent over 70% of the total Sportswear Retail Industry in the United States, see Appendix. The retailers’ entities names are concealed for reasons of business confidentiality.
-1.50%
-1.00%
-0.50%
0.00%
0.50%
1.00%
1.50%
2.00%
2.50%
Feb Mar. Apr. May Jun. Jul. Aug. Sep. Oct. Nov. Dec.
Pe
rce
nta
ge
Month
US Retail Sales Monthly Trend Changes 1992 vs. 2010Source: US Census, estimates are based on the Monthly Retail Trade Survey.
Adjusted US Retail sales Exc Food 2010 Adjusted US Retail sales Exc Food 1992

Real Options Methodology in Sportswear Retail Investment Valuation Sportswear Industry Development
87
compares them with the figures for general apparel sales and with US total retail sales
figures.
3.5.3 Sportswear retail industry summation.
The sportswear retail industry is a relatively new industry, evolving from the
general apparel and footwear retail industries, and emerging as a new sector in the
general retail industry.127 Compared to the traditional apparel and footwear retail sectors,
the SRI has developed very distinguishing characteristics, in that brand equity is a
cornerstone for success, plus heavy reliance on the sports business. The difficulties
inherent in forecasting the outcomes of such dependencies have led to revenue streams
that are much riskier and more volatile than those in the traditional apparel industries.
Furthermore, the investment return may lie not just in financial profits, but in non-
financial forms.
3.6 Why has RO not yet been applied in the SRI?
As discussed above, the SRI has emerged as an industry with a high risk/reward
profile. Why then has RO not been used in SRI investment valuation? There are two
primary reasons why the RO concept has not yet been adopted in the SRI:
127 This study collects retail industry sales monthly data from the US Census was collected and reviewed. These data included: Retail industry overall monthly time-series 1992-2010; Sporting Goods sector retail industry overall monthly time-series 1992-2010.

Real Options Methodology in Sportswear Retail Investment Valuation Sportswear Industry Development
88
1) The unique characteristics of the SRI do not precisely parallel those of industries
which have used RO analysis.
The particular characteristics of the SRI (dependence on major sports
event outcomes and on the fame or shame of sports celebrities) are unique and are
not precisely paralleled by characteristics of industries that have used RO
financial analysis to date. The SRI is in many ways a new industry or, at least, an
industry with new characteristics; hence industry members have not yet included
the RO methodology to improve investment valuation.
2) BSOPM variables applied in other HRR industries are not directly transferable to
the SRI in most cases:
a) Strike Price (X): One of the variables utilized in the BSOPM is the Option
Strike price. In financial options, the strike price is the specified value of the
underlying asset. In the oil exploration industry, a traditional HI/HRR industry
that has adopted RO analysis, the strike price would be the present value of
the exploration development cost. This development cost is normally millions
of dollars. In the SRI, the total investments of the store needs to be fully
included, such as the initial build-out capital investment and sub sequential
investments for the refit or store upgrade
b) Dividend Payout (δ): SRI investment does not possess the characteristics of
payouts that are seen in some of the HRR industries, such as the oil extraction
industry. In such industries, it is not unusual for parties to development
agreements to have the right to withdraw from the agreement prior to the

Real Options Methodology in Sportswear Retail Investment Valuation Sportswear Industry Development
89
expiration of the development term. In addition, SRI leases are generally for a
fixed term and, once signed; neither party may withdraw from it prior to its
expiration date without suffering severe penalties. Thus, oil industry
development agreements (like real options in many other HRR industries) are
similar to American options, whereas real options in the SRI are more likely
characterized as European options. However, when considering a “growth
option” or “wait-and-see” option scenarios, the cost of delay of an SRI
investment could be characterized as the potential “opportunity cost.” Each
year of delay translates into one less year of value-creating cash flows from
the life of the project. Hence, it is possible to derive an applicable equivalent
to the dividend payout ratio by using 1/n as the proxy. In this paper, the
application will be using the original BSOPM with Merton’s revision when
applicable.
c) Sigma (σ): Sigma is a measure of the uncertainty associated with a long term
investment return. It can be defined in different ways, depending on industry
structures as discussed in the previous section128. Sigma varies according to
the characteristics of the product, industry, or firm. It would not be accurately
transferable among industries. Indeed, the return on an SRI investment by the
same entity could be different among regions (as will be demonstrated in the
case studies).
128 See Literature Review, RO Application in Industries with Volatility.

Real Options Methodology in Sportswear Retail Investment Valuation Sportswear Industry Development
90
3) The irreversibility of the investment. When the RO result supports an investment
decision in a negative-NPV scenario, if management decides to invest, the
investment normally cannot be reversed or otherwise without penalty after the
lease has been signed.
4) Institutional resistance: Traditional practices have become deeply entrenched in
corporate finance departments, and new paradigms can be expected to be met
with resistance by incumbent practitioners. The complexity of the RO
methodology itself makes it even more difficult to overcome this institutional
inertia.
3.7 Research Questions
The research questions of this study are as follows:
1) Can the SRI be fairly characterized as an HRR industry129 such that RO can
usefully supplement the NPV methodology in investment valuation?
2) If so, how should the RO variables be determined in the SRI?
3) What types of strategic values (investment options) beyond the tangible financial
returns measured by NPV can RO methodology capture to complement NPV in
the SRI?
129 The main characteristics of HRR industries investments such as oil, gas and metals exploration and pharmaceuticals typically require massive up-front investments, often measured in the hundreds of millions, even billions, of dollars. Whether a given investment is likely to yield a particular result is very hard to predict accurately, and while a successful investment may yield very high returns an unsuccessful one may have serious financial consequences for the company.

Real Options Methodology in Sportswear Retail Investment Valuation Sportswear Industry Development
91
4) What are the key findings from the applications of RO methodology to “real
world” SRI cases?

Real Options Methodology in Sportswear Retail Investment Valuation Research Methodology
92
4 Research Methodology
4.1 Overview
This dissertation aims to demonstrate that the use of RO methodology in SRI
investment valuation to supplement NPV methods will improve SRI investment valuation
quality and assist managerial decision-making in investment decisions that have
embedded option value, including the following: (a) expand (changing operating scale,
expand or contract capacity); (b) grow (enter new markets or open new stores); (c) defer /
delay option (the investments are delayed due to internal resource limitations and/or
(un)favorable market conditions the option to delay investment - “wait-and-see” till the
uncertainties are removed); and (d) stage investment (the investments are spread out into
stages).
This study examines the evolution of the SRI. The industry demonstrates
characteristics similar to those of the HI/HRR industries. The SRI thus presents
opportunities for RO analysis, particularly when 1) the investment has a embedded
strategic value that is not captured by the traditional NPV; and 2) the anticipated return
depends largely on market information that does not yet exist. No competitors in the SRI,
or in any other retail industry, have yet used the BSOPM to analyze such real options. RO
methodology has not yet been used by firms in the SRI, although there is no theoretical
reason why it could not be used. This study is the first to examine and propose the use of
RO methodology in the SRI.
Furthermore, this study aims to demonstrate a rationale for applying RO
methodology to supplement the NPV method in SRI investment valuation. This is an
Real Options Methodology in Sportswear Retail Investment Valuation Research Methodology
93
innovative and much-needed extension of RO application. This paper illustrates that the
RO analysis can successfully capture some if not all of the non-financial values
embedded within investments in SRI flagship stores investments130.
This extension of the RO approach to SRI investments is new. While future
research may broaden and generalize this application to other industries, the dynamics of
the SRI cannot be assumed to be exactly the same as those of the traditional HI/HRR
industries. In this study, therefore, the application of RO methodology is appropriately
examined on a case by case basis.
Due to the shortcomings in the NPV financial valuation model in such HI/HRR
industries, financial analysts in these industries began searching for alternative or
supplemental methods of valuing investments. The RO concept proved successful in
overcoming the weaknesses of the NPV model and has proven to be a useful alternative
and supplement to that model when applied to such industries. NPV still has its merits
when it is used in the right way. However, using the NPV method alone has become less
useful in valuing investment opportunities in HRR industries, and RO methodology has
therefore come to be employed in capital budgeting in these industries as a supplement to
NPV.
130 This dissertation focuses on the investments RO application in capturing the embedded non-financial values in SRI investments. It is our view that it is possible the reverse of the RO application may also add values to the divestment decision making, such as abandoning an investment opportunity when there is little or none long-term strategic value. In this “abandonment” divestment scenario, the Put BSOPM will be used.

Real Options Methodology in Sportswear Retail Investment Valuation Research Methodology
94
The discussion that follows begins by describing the model to be tested in this
study: the BSOPM as applied to real options. The discussion then elaborates how to
estimate each of the components in the BSOPM equations in the real asset valuation
process. The discussion discusses data sources, using a case study as a demonstration,
and proceeds to a description of testing procedures, integrated with the testing analyses.
The discussion briefly discusses potential limitations to the generalizability of this
application and finishes with a concluding remark.
4.2 The RO Models to be tested
As discussed in the previous chapter, the SRI has evolved from a relatively steady
and low risk phenomenon requiring only modest investments to a highly competitive and
volatile multinational phenomenon characterized by high risks. The traditional valuation
tools used in industry generally – principally the NPV model – are inadequate for SRI
investment valuation decision-making. NPV can no longer adequately capture the
embedded strategic value or market risks presented in the highly volatile phase of the
industry that exists today. This study proposes that by using RO methodology, the store’s
investment return value can be more accurately captured.
The BSOPM Equations are reproduced here for reference.
! " �� #�������� �� �����$���
Equation (2)

Real Options Methodology in Sportswear Retail Investment Valuation Research Methodology
95
% " �� ���1 ������ �� #��1 ������
Equation (3)
d1 = ��� ���� � �� ' � ��
� �� �√�
d2 = �� �√� C: Call Option Value P: Put Option Value (S): Present value of underlying asset - the present value of cash flows expected
from the investment opportunity. (X): the option strike price- The present value of total committed investment (σ): Sigma - the standard deviation of the sales growth rate (t): the period for which the investment opportunity is valid (r): risk-free rate (δ): Dividend payouts -when applicable cost of delay – Annual cost of delay 1/n N(d) = cumulative normal probability
The application of this model determines the “option value” of an investment or
divestment. In the investment valuation, C is added to the NPV value when valuing
existing investments (option value is embedded), and either reduces the negative NPV or
increases the already-positive NPV. The final RO-adjusted NPV value represents the
asset’s investment value. When NPV is positive, but the cash flows are accompanied by
great uncertainty, utilizing RO in addition to NPV allows the analyst to place a “value”
associated with that risk. In the divestment valuation, P is compared to the Net Liquation
Value to determine if the investment should be terminated or remain in operation.
To utilize the BSOPM (Merton Revised) formula, sources for various components
in the formula must be identified and estimated. Table 8 summarizes how this study
proposes to implement / estimate the BSOPM variables in the valuation of call options in
the SRI. (Note: The “dividend” variable in the table only applies when the scenario might

Real Options Methodology in Sportswear Retail Investment Valuation Research Methodology
96
involve a delay of the investment, where some fraction of true value-creating cash flows
during the life of the investment might be “lost.”
Table 8: Inputs for Option Valuation in General in the Sportswear Retail Industry
Components Description Estimators in SRI
S Value of the Underlying Asset Present Value of Expected Cash Inflows (discounted by the company-wide cost of capital rate)
σ Std_Dev of rate of the return of Underlying Asset (sigma)
Std_Dev of company’s stock price Std_Dev of the store’s sales (store specific) Std_Dev of the major local competitor stock prices (store specific)
X Exercise / Strike Price on Option Present Value of the cost of making the full investment on the project: upfront construction costs, fit-out costs, etc. (discounted by the risk-free rate if cost is known with certainty. If uncertain, discount rate is company-wide cost of capital).
t Expiration of the Option Life of the store investment duration
δ Dividend Yield - which is forgone as an option holder - (if appropriate)
Proxy: Annual cost of delay = 1/n (Each year of delay translates into one less year of value-creating cash flows from the life of the projects)
4.3 Determining Sigma in the SRI
Sigma (σ) in BSOPM is an important variable to determine in the RO application.
In the Literature Review Section of this paper, the three main applications of sigma were
discussed. As SRI has its own distinguished characteristics, sigma for SRI needs to be
determined to reflect its industry characteristics. Historically, the following sigma
application has been used in the industries that applied RO.

Real Options Methodology in Sportswear Retail Investment Valuation Research Methodology
97
1) Historical volatility of the underlying asset: When the price of a natural resource
determines the future cash flow of the investment, the historical volatility of that
resource can be utilized as sigma.
2) Historical volatility of the company’s stock price: This estimation of sigma can be
utilized when project volatility correlates with the stock price movement of the
company.
3) Historical volatility of the industry index: The historical volatility of the industrial
group index has also been used to estimate the volatility of the project value.
In searching and testing the appropriate sigma for SRI, we have examined each of the
above. The detailed analysis is in Chapter 5, Case Studies Overview.
4.4 Data Sources / Cases
4.4.1 Data sources.
This research is based on case-by-case studies of investments in major stores
located in different countries and on different continents. Data used in calculating NPV
and RO are the same sets of historic data at the time when the stores were under
consideration of investments. We would not have any indication of how these stores were
to perform against the original projections and/or expectation. Certain criterion to
conduct the blind-folded selection are such as geographic diversity, size of the stores,
investments required, and strategic influence. Although the data may be proportionally
adjusted and the individual store names and locations will be concealed for business

Real Options Methodology in Sportswear Retail Investment Valuation Research Methodology
98
confidentiality, this proprietary database131 is a significant contribution toward
development of the RO methodology proposed in this study, since it enables verification
of the model by allowing “back-testing” to compare the results of RO-augmented
valuation versus NPV- only valuation, particularly in capturing the “non-financial”
strategic substance.
The present study focuses on four flagship132 retail stores with the following
general considerations:
1) Stores are selected based on magnitude in their store size, sales, investments
involved.
2) Data may need to be “flushed” of identifiers relating to place, store name, and
investors.
3) The original sets of data used for the initial NPV analysis will be extracted for
each store and will be inserted into the RO formula where appropriate.
4) All additional data required for the RO will be extracted from the same database.
131 This firm is a global leader in the SRI and its operations should provide a reasonably good foundation for this research. Data may be proportionally adjusted and the individual store names and locations will be concealed for business confidentiality. 132 Flagship stores: mega-stores featuring enhanced product presentation, normally located in key cities around the world.

Real Options Methodology in Sportswear Retail Investment Valuation Research Methodology
99
4.5 Testing Procedure / Analyses for Investment Decisions
Before stores were built, NPV analyses were performed to support the store-
opening decisions. When NPV was negative, no store was built (unless other strategic
reasons mandated building the store). When NPV was positive, normally the decision
was made to build the store. Most of the original NPV calculations remain accessible for
examination in connection with this study.
First, we identify the variables in BSOPM in SRI and their appropriate
applications; second, we use the same data that were available at the time the original
NPV calculation to calculate the RO. Third, we compare the NPV and RO results and
rationalize the embedded “non-financial” values. Finally, the NPV and RO results will
together be examined to determine whether and how supplementing NPV with RO would
have added value to real investment valuation.

Real Options Methodology in Sportswear Retail Investment Valuation Case Studies
100
5 Case Studies
5.1 Overview
We have stated in previous sections that the traditional valuation tools used in
industry, principally the NPV methodology and variations thereof, are insufficient and
incomplete for major investment valuation decisions in the Sports Retail Industry (SRI).
NPV uses a “discount” rate that in theory is capable of capturing the market risk. This
approach may be suited for stable growth companies in mature industries; however, in
highly volatile high growth industries with multidimensional variables contributing to
uncertainty, and therefore, to market risk, the NPV method must be supplemented by
other tools to adequately value investment feasibility. This study proposes to use the real
option pricing methodology (BSOPM equation) to supplement the NPV method.
While research questions raised in finance are normally resolved empirically, the
current literature on real options is lacking in robust econometrically modeled research.
The primary reason for this is that unlike financial options, real options as well as the
assets underlying these real options are not traded, and thus, cannot be directly tested
against the theoretical attributes. With this in mind, we will use the case study method to
examine some of the theoretical attributes of real options based on data taken from actual
investment decisions within a large multinational company. Undoubtedly, the case study
approach will be unsettling to financial economists who are accustomed to conducting
quantitative empirical studies. Nevertheless, it is instructive to follow the arguments of
Jensen (1983), particularly Section VII on Methodology and subsection C on the “Nature

Real Options Methodology in Sportswear Retail Investment Valuation Case Studies
101
of Evidence”133. Jensen’s discussion is based on his development of a Positive Theory of
Organizations via his proposed General Theory of Contracts where he refers to the
organization as a nexus for a complex set of contracts. We adopt in this study his
arguments regarding the deductive approach to hypothesis testing. Our study proposes to
apply the deductive approach, testing the predictions of real options theory as described
in the literature review section against the actual data of a firm’s investment projects. If
the results from our application of the real options model to the data are substantially
inconsistent with the predictions--the hypothesis that real options have value not captured
by commonly investment evaluation tool, NPV--then according to Jensen the “positive
theory” should be modified or replaced with an alternative. Otherwise, the theory is not
invalidated by our application to the case examples and serves as evidence in the
continuing test of the theory134.
We have discussed earlier the evolution of the SRI from a relatively steady to a
highly competitive industry sector and from a low risk phenomenon requiring only
modest investments to a volatile multinational phenomenon characterized by high growth
and high risk. It is our view that this evolution has primarily been driven by the nature
and dimensions of the impact that sport has on the lives of people today, making the
sports retail industry one that can be fairly characterized as dynamic, highly competitive,
133 Jensen, M. Organization Theory and Methodology, Accounting Review, April 1983, v. LVIII, No. 2, pp. 319-339). 134 Unlike financial options, almost no real options can be detached from the underlying real assets--options to real estate may be argued to be an exception. We cannot predict future innovations that detach part or all of the “real” option value arising from a real asset investment, and thus, present observable market prices for quantitative studies.

Real Options Methodology in Sportswear Retail Investment Valuation Case Studies
102
and uncertain. In today’s SRI, successful multinational companies must have strong
brand recognition to sustain and gain global market shares. To build and maintain that
brand image, multinational sports retail companies have focused intensely on inducing
major sports “icons” to use their products, and in doing so, they have vaulted these sports
“superstars” to celebrity status. This strategy was pioneered in the global sports industry
by the company that we examine in this study, Nike Inc..
One of the most effective venues for the promotion of brand recognition of
products is the flagship stores135. Flagship stores define the “Brand statement” or “Brand
Instrument” in marketing genre, and generate “Brand-Heat”136. They are primarily
located in major international cities or population metropolises, where real estate is costly
and investments often have negative NPV137. Their presence creates a “halo-effect”138
that ripples vertically139 and horizontally140. These external value effects or economic
externalities from major investment decisions of the company provide unique
applications of real options complementing the NPV analyses, and in our view, are more
135 Flagship stores: a shop with a large floor area dedicated to a single brand and stocking a very wide range of the brand’s products. The flagship is the chief outlet of the brand and a key tool in its promotion. It symbolized its mission, image and values and is a tangible demonstration of brand awareness. Source: Ledicodumarketing.fr. Nike “flagship store” definition varies as the company expands and evolves its marketing strategy. Also see footnote in Chapter 1. 136 “Brand Heat” is a term of art in marketing terminology and refers to popularity. 137 Tim Hershey, VP/North America Retail, Nike Inc. in speaking of the key criterion rely on to make investment decision, other than financial data, such as NPV – “Fact based decision making is critical in our investment decisions. However, our metrics extend well beyond the proforma. We also consider many other key performance indicators such as traffic conversion, average basket, demographic profile and future projections.” 138 In brand marketing, a “halo effect” is one where the perceived positive features of a particular item extend to a broader brand. 139 Vertically: “halo-effect” that benefits the local business. 140 Horizontally: “halo-effect” that positively promotes global business through the international visitors and tourists who visit the store.

Real Options Methodology in Sportswear Retail Investment Valuation Case Studies
103
illustrative regarding the attributes of real options than similar analyses of investments to
build smaller stores located in medium-sized cities141.
In the following sections, we focus on case-by-case studies of investments in
major flagship stores located in different countries and on different continents142. We first
introduce Nike, Inc.143 in order to understand the strategic rationale for investing in
flagship stores. In our description of the company, we will use terminology and jargon
that are germane to the industry.
From the Olympics Games to neighborhood tournaments, from professional
athletes to sports amateurs, the Nike “Swoosh” is almost omnipresent. As one of the most
recognized company logos, the Swoosh embodies a “Just do it” mantra that inspires
millions of people to pursue their passions and dreams in sports and in life. This motto
has in turn driven Nike, the company behind this logo, to grow from a $500 local
141 In contrast to widely fluctuating buying patterns by consumers - both local residents and travelers - in flagship stores in mega cities, normal size stores located in medium size cities experience less volatility in consumer demand, and traditional NPV methodology works well for valuation purposes. Although RO can also be used to valuate store investment in mid-size stores, it is less necessary than it is in flagship stores. 142 Data may be proportionally adjusted and the individual store names and locations will be concealed for business confidentiality. During this research, we interviewed business practitioners within and outside the company. The full list is on the Acknowledgement section. In this section interviews conducted with: Tim Hershey (VP/GM Nike Retail North America); Trevor Vigfusson (CFO, Nike Global Retail); Eunan McLaughlin (President Nike Affiliates); Olivier Pennetier (NT Paris Former General Manager); Sean Ghouse (NTL General Manager); Orences Christian (former NT Chicago GM). 143 NIKE, Inc. based near Beaverton, Oregon, is the world's leading designer, marketer and distributor of authentic athletic footwear, apparel, equipment and accessories for a wide variety of sports and fitness activities. Wholly-owned Nike subsidiaries include Cole Haan, which designs, markets and distributes luxury shoes, handbags, accessories and coats; Converse Inc., which designs, markets and distributes athletic footwear, apparel and accessories; Hurley International LLC, which designs, markets and distributes action sports and youth lifestyle footwear, apparel and accessories; and Umbro Ltd., a leading United Kingdom-based global football (soccer) brand.

Real Options Methodology in Sportswear Retail Investment Valuation Case Studies
104
business into a market capitalization of $37.77 billion144 transnational company in less
than half a century. Today Nike is the world’s sportswear industry leader in the design,
technological development and worldwide marketing of footwear, apparel, sports
equipment and accessory products. Despite its current formidable size, Nike is still
considered to be a “growth company”145 by the investor community, largely due to its
unique business model, that is, balanced diversification, solid brand equity, its ability to
learn, and its ability to apply that learning.
Diversification and balance146 are also ingrained in the company’s sales force
structure and distribution channels147. The diversification allows Nike to leverage and
maximize its relationship with suppliers and customers. Nike does not rely heavily on an
single account, manufacturer, supplier, and/or trading company. The resulting balance
makes it possible for Nike to leverage economics of scale efficiency while proactively
144 As of December 9, 2010, Nike’s market capitalization value: common floating shares outstanding 397,462,000 at a price of $87.47. 145 “Growth company” by definition, is an investment term that is used to define a company that has not yet matured, and that still has the markets to continue growing. From Nike’s leadership point of view: “our power is quantifiable and our potential continues to grow.” And, “Our performance has prompted one question that I hear more often than any other these days and that is simply, "How is NIKE, Inc. going to continue to grow?"… The short answer -- we're going to continue to build, fuel, and accelerate the NIKE Inc. portfolio.” Mark Parker, Nike Analyst Meeting on May 5th, 2010, New York. 146 Commonly noted by Wall Street Investor Community Analysts - Nike has a diverse and balanced portfolio of products, geographic markets, consumer groups, and operation platforms. 147 Nike has 18 sales offices in the United States, utilizing 4 independent sales representatives to sell specialty products for golf, and 2 for skating and outdoor products. Nike’s United States distribution centers for footwear are located in Wilsonville, Oregon, and Memphis, Tennessee. Apparel and equipment products are shipped from Memphis, Tennessee, Tigard, Oregon, and Foothill Ranch, California distribution centers. Cole Haan products are distributed primarily from Greenland, New Hampshire. Converse products are shipped from Ontario, California, and Hurley products are distributed from Irvine, California.

Real Options Methodology in Sportswear Retail Investment Valuation Case Studies
105
building local market responsiveness through its transnational strategy148. This diverse-
and-balanced business model, together with its unmatchable R&D “family recipe” (that is,
its innovation expertise149), has secured Nike’s position as the foremost competitor in the
industry.
Nike has built up and has been relentlessly strengthening its solid brand-equity150.
The company has never ceased refreshing its brand-image151, defining and refining its
brand-message, and evolving its brand-personality152. Nike’s “celebrity-athlete
endorsement”153 strategy and “grass-roots” approach154 has build solid brand-loyalty155. Its
world-class athletes156 are unparalleled and constitute a powerful element of its
competitive advantage157.
Nike’s most distinguishing features are its ability to learn and its agility to change
and implement quickly. These features have enabled Nike to proactively adapt to rapid
148 The term “transnational Strategy” refers to a company that develops different capabilities and contributions from different countries, and shares them in integrated worldwide operations. 149 Mark Parker, speaks at the Nike Analyst Meeting on May 5th, 2010, New York. “…innovative product. This will always be our top priority. There's a reason that we have the most advanced sports R&D lab in the world. There's a reason we have over 600 designers immersed in key sports cultures around the world.” 150 Brand Equity. The value from brand recognition. For consumers, brand equity is based on consumer attitudes towards positive brand attributes, awareness, and favorable consequences of brand use. 151 Brand Image - The consumer's perception of a brand; what people think about, feel about or expect from a brand. 152 Brand Personality. The image or psychological profile the manufacturer intends to convey to the public as opposed to the "brand image," which refers to the consumer's perception and the image the consumer has of a brand. 153 Details of Nike’s Celebrity-athlete-Endorsement timeline are in the Appendix section. 154 Nike has impacted virtually every college and university athletics department in the country by investing more than $1 billion in colleges and universities through sports marketing, brand marketing, advertising and licensing royalties. 155 Brand Loyalty. Two types, ( 1) The inclination of a consumer to buy the same brand of product or service repeatedly over time rather than buying from multiple manufacturers within a product category, and (2) The degree to which a consumer consistently purchases the same brand within a product class. 156 Nike endorses athletes worldwide. 157 Porter, Michael E. The Competitive Advantage of Nations (Macmillan, Free Press, London, 1990).
Real Options Methodology in Sportswear Retail Investment Valuation Case Studies
106
changes and evolvement158 in the consumer and competitive marketplace, and to create
new marketplace strategies before and during market changes. A good recent example of
this was restructuring its operations to execute a new niche marketing strategy, a focus159,
primarily in Running, Basketball, Sportswear, Men’s & Women’s Training, Soccer, and
team sports. This breaks down the conventional Footwear-Apparel-Accessories silo view
of looking and doing business.
A unique business strategy and superior product innovation build Nike’s strong
financial and brand equity. The experienced leadership and the widely respected co-
founder & Chairman160 keep motivating the employees and fostering a lively corporate
culture. All these elements make Nike successful and contribute to its ability to sustain its
success.
158 Eunan McLaughlin, former President/Nike Affiliates, Nike, Inc., Analyst Meeting, May 5, 2010, in speaking of Affiliates Brands role in Nike “family of brands” When speaking of Basketball, “It drifts into other areas across the sports culture continuum, into music, into rock and roll, into a great heritage story through the '70s and '80s of what basketball meant and the people who have worn it. 159 Philip H. Knight, Nike's chairman, ''Our philosophy is that we compete in a lot of different businesses, and one of them is the footwear business.'' In addition, “We are competing segment by segment, with specific products and advertising all aimed at a segment, and we think that makes us stronger as a company.'' Source: Harvard Business School case study. Source: New York Times, July 11, 1989,”Nike is Bounding Past Reebok.” 160 Philip H. Knight, Nike's co-founder & Chairman, is widely respected within and outside the company for his ingeniousness and generosity. Mr. Knight created “Future” wholesale selling 6-9 months in advance to Nike’s retailer accounts; this is one of the examples of Knight’s visionary ability. He started the shoe business representing Japan’s Tiger shoes; foresaw the South East Asia’s development, and stepped into the China market as early as the 1970’s. Knight gave back to the two main inspirations that led to his tremendous success: intercollegiate athletics and postgraduate education. Knight and his wife Penny have given approximately $230 million to the University of Oregon, much of which has gone toward athletics development; an additional $100 million to the Oregon Athletics Legacy Fund.; $105 million to the Stanford Graduate School of Business; and $100 million to the Oregon Health & Science University Cancer Institute. Knight was inducted into the Oregon Sports Hall of Fame, and the university named its cancer institute the OHSU Knight Cancer Institute.

Real Options Methodology in Sportswear Retail Investment Valuation Case Studies
107
Nike makes changes in its corporate strategy as the company grows. One such
change, which is most closely related to this study, concerns Nike’s retail strategy. It is
the strategic expansion from “Wholesale” to “Direct-to-Consumer”161. The company
plans to invest between $500 million and $600 million in stores and in infrastructure from
2010-2015, to support both company-owned and external wholesale/retail productivity
and performance 162. “Direct to Consumer” investments are reflective of and consistent
with its broad array of ongoing strategic investments.
The understanding of Nike’s retail strategy is fundamental to our study of
investment valuation in mega-city flagship stores. The “retail strategy” actually started
even before Nike came to existence163. As the business expanded, Nike started recruiting
in-house sales forces and targeting mass department stores, specialty stores, and general
stores, while other businesses were busy developing catalogs or mail-order distribution
sales channels. “Nike always changes the way and leads the way. We don’t settle for the
conventional”164. To further the competitive game and elevate its competitive advantage,
161 As of May 2010, “Direct-to-Consumer” scope is, “7 brands, 236 inline doors (Nike’s owned retail stores, vs. Department Stores which sell Nike’s products) serving 52 million customers, and those stores guide the 8,000 partner doors, 472 factory stores serving 225 million customers and 5 digital stores serving 150 million customers.” And, “Direct-to-Consumer’s role is in realizing the next phase of Nike brand growth through building capacity in the marketplace.” Jeanne Jackson, President, Direct-to-Consumer, Nike, Inc., Nike Analyst Meeting, May 5, 2010. 162 Nike announced at Nike Analyst Meeting, May 5, 2010. 163 Nelson Farris, Communication Director, Nike, Inc, in speaking of Nike’s early days, “At the very beginning when Nike was first established, it actually was the most ‘direct’ retailer: shoes were sold from Phil Knight's car trunk directly to the track runners.” This changed as the business expanded. Nike started selling its product to consumers through retail intermediaries (sales representatives, distributors, retail partners, etc). Then in early ’90, the company opened its first NikeTown in Portland Oregon. 164 Nelson Farris, Communication Director, Nike, Inc.

Real Options Methodology in Sportswear Retail Investment Valuation Case Studies
108
Nike started selling products 6-9 month in advance165. A “futures” business model was
created. This very ingenious move allowed the company to better plan manufacturing and
distribution in advance. Not only could Nike guarantee its products to and with suppliers,
it could also negotiate favorable contract terms with its retailers accounts, such as
inventory holdings.
Initially Nike had only a few stores of its own. Later, Nike’s retail strategy was
aimed at creating brand awareness by opening its own retail outlets and designing them to
exemplify the brand. This strategy took place in the 1990’s when athletic footwear and
apparel was a fragmented retail market, in which the top ten sporting goods retailers
represented 14% of total U.S. sales (Appendix Exhibit 1). While Nike sold products
through these retailers, Nike owned retail stores have more control of the products’ flow,
in-store presentation, and sales promotion166. NikeTowns167 were more a marketing and
brand-building effort than a true sales channel. By owning the Niketown stores, Nike
created a high-end shopping experience different from traditional outlet stores168. At
NikeTown, Nike's objective is not to improve its NikeTown store revenue from the
165 The foundation of this idea that created “futures sales in Nike” is the futures market in commodities. It is acknowledged that Phil Knight created the business model. 166 Marshall McCauley, Nike North America Retail Planning Director, in speaking of inventory in retail, “Risk in Retail is inventory. If and when our retailers buy too much, they will markdown (put on sales) to keep down the inventory. This, in a long run, devalues the Brand. In our owned retail stores, we can plan & control the markdown, or transfer to our factory outlets when needed.” 167 Niketown, according to the company’s definition, is a Nike-owned retail store (vs. retail stores that sell Nike products) that normally features spacious store size (ranges from 35,000 square feet to 60,000 square feet), advanced store design, pinnacle products, and premium retail locations. 168 Olivier Pennetier (NT Paris Former General Manager), Sean Ghouse (NTL General Manager), Orences Christian (former NT Chicago GM) all acknowledged - “people walk in flagship store have already set up the expectation,: more ‘personalized’ customer service, VIP-type of in-store experience, and yes, they might not buy on the spot, but may very well make a subsequent purchase elsewhere.

Real Options Methodology in Sportswear Retail Investment Valuation Case Studies
109
product sales per se. Rather, NikeTowns represent a venue for Nike to present the full
scope of the company’s sports and fitness lines to customers and educate them on the
value, quality, and benefits of Nike products169. While some customers might not make a
purchase when visiting the NikeTowns, they would have “experienced” the brand and
have seen the totality of its products. That experience may induce them to buy Nike
products in the future, either in their home country, online or from retailers carrying Nike
products. Although NikeTowns have long been recognized as “brand showrooms”, they
have also contributed to sales revenues as the company makes sensible investment
decision to drive strategic values and commercial profitability at the same time” 170.
Retail spokesperson Claudine Leith once pointed out, "Nike has gone through a lot of
changes as the brand evolves... Our NikeTowns were originally meant to showcase the
brand, but we recognized they were selling merchandise.”171 This approach is again
reiterated in 2010, by Jeanne Jackson, President Direct-to-Consumer, that, “The opening
of the NikeTowns provided a stage where we could for the first time showcase apparel
and footwear collections together, setting an example for the marketplace.”172
The first NikeTown, the Portland NikeTown in Portland, Oregon, quickly earned
numerous retail design and business awards after its opening. Following NikeTown
169 From Company website Nike.com. 170 Tim Hershey, VP/North America Retail, Nike Inc. in speaking of the key criterion rely on to make investment decision, other than financial data, such as NPV – “Fact based decision making is critical in our investment decisions. However, our metrics extend well beyond the proforma. We also consider many other key performance indicators such as traffic conversion average basket, demographic profile and future projections.” 171 Nike spokeswoman Claudine Leith, spoke about Niketown investment for Outdoor Retail, September 2001. 172 Jeanne Jackson, President Direct-to-Consumer, Nike, Inc., Nike Analyst Meeting, May 5, 2010.

Real Options Methodology in Sportswear Retail Investment Valuation Case Studies
110
Portland, Nike opened its second NikeTown, a 70,000-square-foot showcase, NikeTown
Chicago. This store became a major tourist attraction for the city and is widely
recognized as a unique “place”, one of its kind. “This Store is a place to experience, to
play, and to remember, not just to buy.”173 Back in its peak time, 7,500 visitors a day174
came to see the two-story mural of Michael Jordan and try Nike shoes out on the store’s
miniature basketball court.
The NikeTowns enabled Nike to display the newest as well as the most innovative
product lines, and simultaneously provide Nike the opportunity to strengthen ties with
consumers – “whether it's gaining their insights or to inform new product innovation,
assuring them access to our products in markets where we're going to expand our reach or
take ownership or perhaps, most importantly, sharing with them our passion for
sports.”175. In addition, “Pinnacle Products,” are specialty items not available from
typical retailers, can be found in Nike Towns. For example, the Michael Jordan Air
Jordan retro-relaunch, was exclusively launched and sold in the Chicago store. Likewise,
the customized Paris-Tee is only sold at NikeTown Paris.
Naturally, other retailers of Nike products worried that they would lose sales to
NikeTown stores, but they eventually realized that the NikeTowns actually helped to
173 Allan Brabo, Nike Design Operations Director, the original design team lead, in speaking of the NTCH original designing theme., “NTCH’s design guiding principle was as a ‘Discovery Path’ – various pavilions focus on different type of sports. The store had a ‘soul’.” In November 2009 during the four-day store visit, we interviewed over fifty in-store customers and long time staff - all remembered vividly the “old days” with great enthusiasm. 174 Peak period when the Chicago Bulls won NBA Championships in the 1990’s, traffic has reduced to 3000-4000. 175 Jeanne Jackson, President Direct-to-Consumer, Nike, Inc., Nike Analyst Meeting, May 5, 2010.

Real Options Methodology in Sportswear Retail Investment Valuation Case Studies
111
boost their sales – a halo effect or economic externality. A good example of this is
NikeTown London on Oxford Street, London, U.K.. Retailers moved away when
NikeTown London opened in Oxford Street but gradually moved back to the area when
they began to realize the benefits of the “halo effect” as NikeTowns London drew traffic
and improved conversion rates176. This is one of the many facets of “intangible values”
that are not reflected in the conventional NPV methods. “There are ‘intrinsic values’ that
retail stores bring to the company, for examples, growing the marketplace, ‘eye-ball’
impact boosting the demand for our products, enhancing our brand image.”177
Over the next 10 years, Nike opened 14 more NikeTowns stores across the United
States of America and United Kingdom of Britain. In 1996, Nike opened NikeTown New
York, its signature 'flagship' store located in midtown Manhattan. As of May 31 2010
(Fiscal year 2010), the company operates the following retail outlets178:
176 The conversion rate is a measure of the percentage of in-store visitors who actually make purchases while in the store, commonly used by the internet marketing and online retailers. 177 Trevor Vigfusson, CFO, Nike Global Retail, when speaking of the retail stores adding value to the marketplace in speaking of Niketown advertisement effect, “Eyeball”, is a marketing approach, aiming to reach as many people as possible (or in digital commerce, to reach as many touches as possible), often used to generate demands. 178 Source: Nikebiz company information, 2010 Annual Report. Company’s Investor Relation website. Affiliates Brands retail stores worldwide grows as the company plans to buy back Converse license in China & U.K.

Real Options Methodology in Sportswear Retail Investment Valuation Case Studies
112
Table 9: Summary of U.S. Nike Retail Stores as Summer 2010
U.S. Retail Stores Number NIKE Factory Stores 145 NIKE stores (including one NIKE Women store) 12 NikeTowns (designed to showcase NIKE products) 11 NIKE employee-only stores 3 Cole Haan stores (including factory and employee stores) 106 Converse stores (including factory and employee stores) 51 Hurley stores 18 Total 346
Table 10: Summary of Non-U.S. Nike Retail Stores as of Summer 2010
Non-U.S. Retail Stores Number NIKE factory stores 205 NIKE stores 55 NikeTowns 7 NIKE employee-only stores 12 Cole Haan stores 68 Hurley stores 1 Total 343
NikeTowns establish a dominant presence for the company in mega-cities179
worldwide. These stores communicate the essence of Nike’s spirit and energy: the “Just
do it” attitude and its “If you have a body, you are an athlete” philosophy. Despite high
rent in some of the key cities, the company continues opening new stores, for instance,
Tokyo Flagship store opened in November 2009180. Further, the NikeTowns global
179 A megacity is usually defined as a large city which is thickly populated region centering in a metropolis or embracing several metropolises and metropolitan areas. Source: Merriam-Webster dictionary. 180 Tim Hershey, VP/GM North America Retail, “Tokyo is a strategic city for Nike. Its influence is certainly important on the Japan market yet extends well beyond. Additionally, to compete in Tokyo, we need to be visible, relevant and innovative. What we’re bringing delivers on these expectations because of the product, the presentation, store design and overall consumer experience; like only Nike can bring.”
Real Options Methodology in Sportswear Retail Investment Valuation Case Studies
113
presence constitute a key channel enabling full utilization of the company’s “celebrity
assets” in conjunction with large-scale product launches and global advertising and
marketing campaigns.
Most of these flagship stores are located in the premium retail “high street181” of
the major cities. The stores have state-of-the-art store design and construction, well-
trained and sufficient staff support, and offer pinnacle products. All these make for a
superior “consumer experience182.” NikeTown creates a self-expressive sense of
belonging in consumers. Some of the self-expression examples in the store include
improved personalization capabilities via NIKEiD and expanded consumer visibility to
find and purchase product through Product Finder183.
Investments in NikeTowns provide a great opportunity to apply the concept of
real options. As in all investment analysis, when evaluating long-term investment
projects, the NPV analysis is used as the base for investment feasibility analysis and
discussion. Yet, as explained earlier, although NPV may be adequate for the valuation of
relatively standard retail operations with modest variability and fluctuations in
181 “High Street”, a terminology in retail industry to distinguish from “Main Street.” Jean-Philippe (Nike Director of Stores Europe), in speaking of the differences between these two: “The difference mainly resides in what composes the retailers’ sales: values or volumes. sales are from luxury goods or density of traffic, accessibility or popularity.. Tokyo Ginza is an example of density of traffic drives the retail sales.” 182 A term in the retail industry denoting the experience a customer has of a product and the total service in a store or online (in digital commerce). 183 Product Finder: one of Nike’s sales tools and channels by means of which in-store customers can locate products that are not on the shelves in that Nike store. Nike stores equipped with this search tool can quickly identify whether the products are in stock and where the stock is located within Nike’s stores and warehouses. Customers can place orders for the merchandise with the stores for later pick-up.

Real Options Methodology in Sportswear Retail Investment Valuation Case Studies
114
performance, it is much less useful in highly volatile operations184. We shall capitalize on
the NikeTowns investments experience to apply the concept of real options in retail
valuations.
To test the hypothesis that there are values not captured by the traditional NPV
approach, we analyzed four NikeTown investments on three continents, representing
various investment options185: expansion, delay, growth, and staging. Sensitive
proprietary business information, data, and store names will be concealed in the final
document186. All other business related data discussed in this dissertation is from public
sources.
5.1.1 Inputs required in the application of the real options model.
As discussed in the previous sections, the RO approach utilizes the Black Scholes
Option Pricing Model. The Black Scholes Options Pricing Model (BSOPM)187 is a
valuation model with a built-in capability to replicate a non-arbitrage (risk-neutral)
portfolio.
184 Trevor Vigfusson, CFO, Nike Global Retail, on new retail stores “risk assessment”: establishing store risk analogies and analyzing store attributes can improve risk predictability.” 185 Detailed reference see footnote in Literature Review. Here is a brief description for reference. The build option refers to most complex investments generate sequential decisions and cash outlays. The defer / delay option refers to the investments are delayed due to the internal resources limitation and/or the market (un)favorable conditions. The expansion option refers to changing operating scale, expand or contract capacity, following the evolution of the market. The option to abandon is the possibility to completely withdraw from the market and sell the facilities at their salvage value in an economically favorable environment. Divestment is considered as the Put Real Options. This application is for further research. 186 Actual investment details may not disclose for business confidentiality. Details disclosed here is only for the purpose of this study. The final presentation of this paper may only provide partial disclosure. 187 Black Scholes, op. cit. Black and Scholes (1973) stated, “it is possible to create a fully hedged position, consisting of a long position in the stock and a short position in the option, whose value will not depend on the price of the stock, but will depend only on time and the values of known constants.”

Real Options Methodology in Sportswear Retail Investment Valuation Case Studies
115
Equation 2 indicates that the value of the call option in real assets depends on six
variables. S is the present value of the underlying asset which is determined from
discounting and summing the expected cash flows from the investment. In our case
studies, it is the management’s estimations of net cash inflows discounted by the
corporate Weighted Average Cost of Capital (WACC). X is the option strike price. It is
the cost in present value terms of the investment calculated by discounting and summing
the estimated cash outflows using the risk free rate. Note that S minus X is the NPV.
The third variable is sigma (σ), which measures the volatility of the underlying
asset value. We note here the counterintuitive implication of volatility and call value
when compared to NPV. For example, if there is significant uncertainty or variance in the
value of the underlying asset, sigma will have a higher value and from the BSOPM, the
call option value will increase. This is counterintuitive because in the NPV approach,
increased uncertainty is compensated by increasing the discount rate to account for the
increased risk which should then lower the sum of the present value of the cash inflows,
reducing NPV. In short, higher volatility increases the real option value of the investment,
but higher volatility decreases computed NPV. Reliance on NPV alone becomes
problematic if real options, as hypothesized, are shown to have value. As stated before,
the remodeling project or any real assets is not traded, thus, the value of sigma cannot be
observed from the market and must be estimated.
The fourth variable is “t”, the time period for which the investment opportunity is
valid. The fifth variable is “r”, risk-free rate, assuming that the investment outlay in
present value terms is known with certainty. The final variable is delta, δ. In the financial

Real Options Methodology in Sportswear Retail Investment Valuation Case Studies
116
option application of the Black Scholes model, δ is the dividend yield that is foregone as
an option holder and it is in the model to take into consideration that the payment of
dividend reduces the underlying stock price. For the real option application, we will use a
proxy to reflect the annual cost of delay, 1/n, if applicable. The reason being, each year of
delay translates into one less year of value creating cash inflows from the life of the
projects—equivalent to the foregone dividend yield.
Of the six input variables, sigma requires further explanation since the estimated
value of the variance of the underlying asset has a significant influence on the value of
the option. In the literature review section, we have identified extensively, and
summarized in Table 7, what prior studies have used to estimate the variance of the return
of underlying asset.
Earlier in the methodology section we had proposed that the variance of the rate
of change of sales be used as the basis for estimating sigma. Regression analysis
documents the relationship of 64 quarters of Nike sales and Nike stock prices188. Other
financial variables, indicating cash flows and return on invested capital, were also tested
against Nike stock price. However, results of the regression of sales and Nike stock price
are the most robust. This provides us with confidence to propose the variance of the
return on historical Nike stock price be used as the primary estimate for sigma.
188 When businesses are "publicly traded," their equity can be purchased and sold by investors in stock markets available to the general public. Stock prices are recognized and perceived by investors as one of the key valuation indicators when assessing the return of an investment. They also reflect market volatility and the industry’s specific risks and opportunities. The stock price has therefore been widely considered as one of the key performance indicators representing the company’s value. It is a perceptible manifestation of the company’s value, comprised of both current operational performance and future growth potential. It, the stock price, is considered as the primary proxy for a (public-traded) company’s valuation.

Real Options Methodology in Sportswear Retail Investment Valuation Case Studies
117
5.1.2 Regressions and correlations.
When a company uses the word growth, it invariably means the growth of sales.
Companies with a history of high growth, the so called high growth companies, will find
investment analysts and all current and potential investors in the company’s stock closely
track sales levels over time. Investors will buy or sell the stock depending on whether
they believe the company is meeting the sales growth expectations. Nike Inc. has been
known in the investment community as a growth company. In our view, growth
companies like Nike will find its stock prices driven to a significant degree by its sales
level. This is not uncommon in industry-leading companies. These companies have
established economies of scale in sourcing, manufacturing, supply chains, and
distribution. These competitive advantages enable these companies to retain a greater
proportion of its top line sales revenue, enhancing its EBIT 189 efficiently and effectively
in comparison to smaller companies190. Nike is known for investing in marketing
189 Bodie, Z., Kane, A. and Marcus, A. J. Essentials of Investments, McGraw Hill Irwin, 2004, p. 452. Defined as an accounting and finance, earnings before interest and taxes (EBIT) or operating income is a measure of a firm's profitability that excludes interest and income tax expenses. 190 In addition to the foregoing, the changes in accounting methods and treatments also make sales performance a more direct valuation measure of return on investment than some of the traditional accounting measurements, such as ROIC (Return On Invested Capital). Different methods (including depreciation choices, inventory valuation methods, write-offs, asset-mix definitions, goodwill valuations, and/or tax treatments) will generate differences in earnings and cash flow. Although all these methods are consistent with and comply with GAAP (the US standard General Accepted Accounting Principles), these differences introduce factors other than the business performance itself. For these reasons, investors and financial analysts consider sales performance and the ability to generate future sales as the key indictors representing return on investments, rather than alternative accounting or financial measures.

Real Options Methodology in Sportswear Retail Investment Valuation Case Studies
118
campaigns191 and sports celebrity endorsement192. Nevertheless, it also has the reputation
for effectively managing operating expenses by saving expenses in other areas193.
To test the relationship of sales and stock price, we ran a regression where stock
price (P) is the dependent variable, and Sales (S) is the independent variable. The 64
quarters of data from 1995 to 2008 is taken from publicly available sources. We further
note that the stock price data are adjusted for stock splits. Regression results are as
follows where the figures in parenthesis are the t-values.
Stock Price (P) = -4.67 + 1.31(S) R2 = 0.83
(-1.88) (17.34)
The regression fit is robust and the coefficients are significant at the 5% level.
The correlation of sales and stock prices is 0.91. Given these results, we are more
confident in using the variance of stock price as the proxy for the variance of the
underlying investment made in the flagship stores.
5.1.3 RO application in NikeTown investment.
Investments in NikeTowns provide a great opportunity to apply the concept of
real options. As in all investment analysis, when evaluating long-term investment
191 For instance, June 24th, 2010, Nike Fiscal Year and 4th Quarter Earnings Release, “Demand creation expenses were higher last year due to expenses incurred to support the Olympic Games in Beijing and the European Championships.” 192 Some examples are: Nike signed Michael Jordan first 5-year contract for $2.5 million in 1984; Nike signed Tiger Woods a five-year contract for $40 million in 1996; signed LeBron James a seven-year endorsement contract worth more than $90 million in 2003 and resigned in 2010. 193 For instance, June 24th, 2010, Nike Fiscal Year and 4th Quarter Earnings Release, “The effective tax rate for the first quarter was 24.7 percent compared to 28.5 percent for the same period last year. The first quarter tax rate benefitted from our lower on-going tax rate on operations outside the United States.”

Real Options Methodology in Sportswear Retail Investment Valuation Case Studies
119
projects, the NPV analysis normally is used as the base for investment feasibility. Yet, as
explained earlier, although NPV is adequate for the valuation of relatively standard retail
operations with modest variability and fluctuations in performance, it is much less useful
in highly volatile operations. In highly volatile industries where investment return is
closely related to both the internal and external environments at the multidimensional
levels, the investment uncertainty warrants the use of a higher discount rate analysis. Yet,
the uncertainty increased the investment real option value requiring a complementary
adjustment to the NPV. NikeTowns investment therefore provides an excellent
opportunity which allows us to apply the concept of real options in retail valuations.
The four cases in the following section represent four types of RO applications:
NikeTown London (abbreviated as NTL) – Expansion Option
NikeTown Paris (abbreviated as NTP) – Growth Option
NikeTown Chicago (abbreviated as NTC) – Delay Option
NikeTown Beijing (abbreviated as NTB) – Staging investment options (in which
investments generate sequential decisions)
We begin with the expansion option namely, the investment decision to remodel
and showcase NikeTowns.

Real Options Methodology in Sportswear Retail Investment Valuation Case Studies
120
5.2 Case - NikeTown London (NTL)
We will start with the biggest NikeTowns in the world: NTL. This is a
“Expansion” RO application. We begin with a brief introduction of the U.K.
macroeconomic and retail environment.
5.2.1 The U.K. macro-economic & sportswear retail environment194.
In 2009, U.K. retail sales rose 4.2% on a like-for-like basis from December 2008,
when sales had dropped 3.3% due to turmoil in financial markets that dampened
consumer confidence. Retailing in the U.K. is both mature and competitive. The U.K.
shoppers comprise both domestic and Continental Europeans, as well as international
visitors from all parts of the world. There is more land dedicated to retail use in the U.K.
than in any other European country. The total volume of annual retail sales has been
increasing over many years, and despite recent declines in the rate of increase, retailers
and consumers remain broadly optimistic about retailing activity in the country.
U.K. retail environments are a mix of city centre, high streets, and shopping malls.
The most popular shopping regions and cities are London, Manchester, Birmingham, and
Newcastle. Retail rents have seen marked growth in recent years, matched by similar
growth in consumer spending. Many international brands have been keen to explore the
U.K. as a new retail opportunity and have been aggressively opening stores.
194 For the purpose of this study – NTL remodeling is during 2008-2009, we use the 2008-2009 data for U.K. economy and retail macro economy analysis.

Real Options Methodology in Sportswear Retail Investment Valuation Case Studies
121
5.2.2 The London macro-economic & retail demographic environment195.
London, the capital of the U.K., is the one of the most famous cities in the
world. London currently has over 40,085 retail units. It is the largest city in Europe, with
a population of 7,465,100 people. Retail sales in London were estimated at around £52
billion in 2008, which was 19% of total U.K. retail sales. Over £4.5 billion is spent in the
West End196 alone, making it the U.K.'s top retail centre. London's overall Gross Value
Added totaled £205 billion in 2007, 17% of the U.K.'s GVA. Seven percent of London's
GVA came from retail, amounting to an estimated £13 billion in 2006. Retail and
wholesale (including motor trades) was the third largest contributor to the London
economy after real estate, renting and business activities, and financial intermediation.
Retail alone (excluding wholesales) is the sixth largest contributor to the London
economy.
As one of the top premium shopping destinations, London is almost a
mandatory location for global companies. As a leading fashion city and luxury
destination, it attracts international brands such as Gucci, Cartier, Louis Vuitton,
Prada, MaxMara, and Donna Karan, among others. Niketown London (herafter
“NTL”) thus is, and should be, the premier stage for presentation of the Nike brand.
How the store represents the Nike brand is of critical importance, especially as the
London 2012 Olympics is approaching.
195 For the purpose of this study – NTL remodeling is during 2008-2009, we use the 2008-2009 data for London’s economy and retail macro economy analysis. 196 The West End is regarded as the “high street” retail shopping area in London and the United Kingdom.

Real Options Methodology in Sportswear Retail Investment Valuation Case Studies
122
NTL is located in Oxford Circus, one of the premium retail “high streets” in the
world. It has approximately 200 million annual visitors, half of whom are single-sided
walkers, while an additional 25% are cross walkers197. NTL is located in this premium
location with great potential to grow financially and strategically198.
5.2.3 Details of NTL remodeling investment.
Since its opening in 1998, NTL has been the premier Nike retail frontier
representing the Nike brand not only to local residents and retailers but even more so to
international visitors and tourists. To many, it has become Nike’s showroom. After
several years of operation, however, the store began to show signs of ageing and needed
renovation. Moreover, in 2005 London won the right to host the largest sports event in
the world – the 2012 Summer Olympics. This created a valuable opportunity for the
company to remodel NTL at the constructional level199 and to then re-launch the store as
the pre-eminent retail space in London, the U.K., Europe and, indeed the world. The
space would highlight core categories, utilizing the existing space better and facilitating
premium service to consumers. Nike’s willingness to invest substantial resources in the
remodeling reflects the Company’s long-term vision, which is to deliver solid value to
customers and to build brand loyalty through inspirational values that go beyond products’
197 Single-sided walkers & cross-sides walkers are variables used in the calculation or estimation of retail stores’ potential walk-in traffic. 198 Stores of Nike’s retailer partners and major competitors’ competitors are also located on Oxford Street. 199 The “constructional level” of renovation is a term used to describe the scope of renovation. “Floor level”, or “partition level” renovation is intended to reset the floor only and could be completed in as little as a week, or even overnight, without closing the store. “Constructional level” renovation, on the other hand, would require closing the store partially or completely during portions of the construction.

Real Options Methodology in Sportswear Retail Investment Valuation Case Studies
123
functionality. Nike intends that the enhancement of the store will give the brand
significant exposure during the Olympics, while also generating an increase in sales.
The remodeling and refitting project was divided into working first on the ground
floor and first floor, and then on the second floor and third floors. While the construction
activities were being undertaken, NTL continued with its day to day business. Work on
the ground floor and first floors was completed in 2008.
The reconstruction of the lowest two floors was focused on building an atrium in
the center of the store from the ground floor up to the second floor. The atrium is where
the NIKEiD Studio is located. This is a luxury appointment space, hosted by a Studio
Concierge and situated on both the 1st and 2nd floors of a glass and steel cube suspended
in the center of the store. Within this space there are four Apple Mac Stations staffed by a
team of creative individuals. Consumers can set up an appointment to go in and design
shoes of their liking with the assistance of Nike staff. This unique customization program
enables an individual footwear statement that will stand out from the crowd. Since its
opening on November 8, 2007, NIKEiD Studio has been very popular in London among
both local residents and visitors from around the world.
Another major part of the renovated store is the BootRoom, which is dedicated to
football (also known as soccer) gear. Since its opening on July 6, 2008, the BootRoom
has generated a strong buzz in London. In its first month of operation, the BootRoom
achieved 120% of its actual sales budget200 (£X X actual sales vs £XX budgeted sales),
200 The Company’s internal sales target undisclosed.

Real Options Methodology in Sportswear Retail Investment Valuation Case Studies
124
which was a tremendous achievement given the “soft launch”201 of the department. The
BootRoom has two types of services that are unconventional -- indeed, unparalleled --
within the industry: iD service and Team Customization202. When the services were
promoted effectively within the football community, sales of football related products
increased – and so did sales throughout the entire store. This sales improvement is
primarily from the additional in-store traffic drawn by the BootRoom and an improved
conversion rate203, which equates to success in both “brand experience” and financial
return.
At the time when the NTL case was being considered as a demonstration of the
real options model for this dissertation, the ground floor and first floor renovations had
already been completed. We then focused on the investment to build up the second and
third floors. The investment required for the modern restoration and installation of state
of the art store fixtures in a mega city center like London is very high204. We examined
information taken from proprietary internal working documents regarding completion of
the second and third floors of the NTL remodeling project. Based upon projected cash
flows over a ten year horizon, discounted by a weighted average cost of capital (WACC)
201Unlike a “Full Launch”, which occurs during the reopening of a store to the public after closure for renovations, soft launch involves unveiling a new product or service while construction work is still ongoing within a store. 202 Team Customization: customers can have their favorite team names sewn on the replica tees purchased. 203 Retail terminology, see footnotes in Section III. (Retail Store) Traffic – the shoppers that arrive in the stores every day. The conversion rate is derived from internet marketing and online retailers, and is a measure of the percentage of in-store visitors who actually make purchases while in the store. 204 The investments here refer to the investment in renovating.

Real Options Methodology in Sportswear Retail Investment Valuation Case Studies
125
of 12%205, we determined that the projected NPV for that part of the project was negative
$4.47 million206. As shown in Table 11, the construction cost is estimated to be $** in
present value terms where cash outflows are discounted by a risk free rate of 5% as these
outflows are contracted and certain, and the uncertain projected cash flows is $**.
Table 11: NPV Calculation for NTL (USD Millions)
Total Investment (Construction & Fit-up Cost) $ (**)
PV of Projected Cash Flows $ **
NPV $ (4.47)207
Intuitively, senior management believed that there are additional strategic values
associated with completing the build out or renovation that are not reflected in the NPV
result, and based upon that intuitive belief it decided to go ahead with the project. Ex post
facto, we believe that the decision to complete the renovation presents an opportunity
apply the real options approach to ascertain whether that approach may capture some of
the intuitive values sensed by senior management but not reflected in the NPV
calculation.
205 This WACC rate is commonly used for similar investments by the company. 206 We note that the computation does not consider adjustments in the WACC for local area investment risk including currency. We further note that there is also no adjustments for high growth as recommended by Antonio Bernardo and Bhagwan Chowdhry, “Growth Options, Beta, and the Cost of Capital”, Financial Management, Summer 2007, Pg 5-17. They propose adjustment to the cost of capital for growth industries by 2-3%. However, their recommended adjustment may not cover all aspects of the external effects of an investment project. 207 As the lease term is longer than the cash flow projection, we include the last year’s cash flow as a growth annuity.

Real Options Methodology in Sportswear Retail Investment Valuation Case Studies
126
5.2.4 Application of RO to NTL.
The table below shows the values of the six variables required to calculate the call
option value of the investment in NTL. The value of the primary sigma is the standard
deviation of the change in the end of quarter Nike stock closing price. On an annualized
basis, the standard deviation of sigma is 33.8%. Applying these values to Equation (2),
we arrive at the call option value of $6.07 million.
Table 12: Inputs for Option Valuation Variables in NTL Calculation – Std. Dev. of Nike Stock
(S): Present value of underlying asset - the present value of cash flows expected from the investment opportunity.
$** USD Millions
(X): the option strike price – The present value of total committed investment
$** USD Millions
(r): risk-free rate 5%
(t): the period for which the investment opportunity is valid
** Lease Term
(σ): Sigma – the standard deviation of the company stock price rate of change, annualized.
33.8% Annualized Std Dev of Nike Stock Price quarterly rate of change, 1995-2010
(δ): Dividend payouts – when applicable cost of delay – Annual cost of delay 1/n
0.00% No delay in this re-launch model
C: Call Option Value RO1 $6.07 USD Millions
We further include a secondary estimate of sigma by taking into consideration the
quarterly sales of NTL in Table 13. The correlation between quarterly changes in NTL
sales and Nike quarterly stock price changes for the period 2003-2008 is 0.61. With only
20 quarters of NTL sales data since its inception, and the comparatively small NTL sales
compared to total Nike sales, we are cautious about making inferences about the results.

Real Options Methodology in Sportswear Retail Investment Valuation Case Studies
127
We present this only as a secondary calculation in an attempt to use data at the source of
real investment activity, and also to demonstrate the power of the variable sigma in the
computation of the value of the real option. The annualized standard deviation is 43.4%.
Table 13: Inputs for Option Valuation Variables in NTL Calculation – Std. Dev. NTL Sales
(S): Present value of underlying asset – the present value of cash flows expected from the investment opportunity.
$** USD Millions
(X): the option strike price – The present value of total committed investment
$** USD Millions
(r): risk-free rate 5%
(t): the period for which the investment opportunity is valid
** Lease Term
(σ): Sigma – a secondary calculation using the changes in quarterly sales of NikeTown London, annualized.
43.3% Annualized Std_Dev NTL Qty Sales changes, 2003-2008
(δ): Dividend payouts – when applicable cost of delay – Annual cost of delay 1/n
0.00% No delay in this re-launch model
C: Call Option Value RO2 $7.22 USD Millions
The above results highlight the limitation of commonly used method of evaluating
investment decisions. The conventional NPV is negative $4.47 million. However, that
computation ignores the possibility that the investment has an embedded option, and
according to our calculation, the real option value is either $6.07 million as in RO1208 or
$7.22 million as in RO2. In any case, the real option value is significant and positive.
208 Sigma defined as the standard deviation of the Nike stock price.
Real Options Methodology in Sportswear Retail Investment Valuation Case Studies
128
5.2.5 NTL concluding remarks & actual results after the remodeling.
We have elaborated the rationale behind the RO application in NTL. The results
demonstrate that the real options value increases with increased flexibility and with
increased risk associated with the underlying real asset investment. The NPV
methodology’s stringent application of a single discount rate to capture all the dynamics
and risk in the markets209 constricts decision makers within a limited framework. This
limited lens has been demonstrated as insufficient in the HI/HRR industries and might
cause the firm to misallocate resources if the NPV is relied upon as the sole indicator of
investment valuation. It is especially true when companies use one standard cost of
capital for all investment projects in order to compare investment returns despite the
differences in investment risk.210
Following completion of the renovation, NTL reopened on November 8,
2010. The store has been expanded from three to four floors with services and
ground-breaking shopping experiences that distinguish NTL from other retail stores.
The following are some examples: 1. two-floor NIKEiD studio (and football boot-
specific iD studio) enabling consumers to go online to design and customize their own
footwear, clothing and equipment, assisted by Nike design consultants at NTL. 2. Boot
fitting: allowing players the chance to steam mould boots to their feet. 3. Boot
embroidery service, allowing names, flags and numbers to be stitched onto football boots.
209 Markets here refer to both business commodity markets and investment capital markets. 210 Bernardo, et. al. Op. cit.

Real Options Methodology in Sportswear Retail Investment Valuation Case Studies
129
4. An online kit-builder tool for football teams to customize their own kits, along with a
shirt printing and numbering service. 5. Video gait analysis and trained staff to help
runners to work out exactly what type of shoe suits their running style.
Its re-launch was well received and reported by the media211: “Niketown
London, located in Oxford Circus, has acquired iconic status with Londoners and
visitors alike since it opened as one of the first brand retail experiences in 1999.
Niketown London now covers approximately 42,000 square feet over four floors.
Its reopening forms part of a series of planned new store openings across the U.K.
designed to provide a premium experience across the company & across key sports
categories.”
211 Wall Street Journey, November 8,2010, Niketown London Unveiled as the World’s largest Nike Store Following Striking New Redesign.

Real Options Methodology in Sportswear Retail Investment Valuation Case Studies
130
5.3 Case – NikeTown Paris (NTP)
We continue the case with NikeTown Paris (NTP). This is a “Growth” RO
application. We begin with a brief introduction of the France macroeconomic and retail
environment.
5.3.1 The French macro-economic & sportswear retail environment.
France is universally known as a leader and predominant presence in the fashion
industry. The country, with its well-known culture, history, heritage212 and landscape, is
one of the great tourist213 destinations in the world. It is also one of the most popular
global shopping destinations, with approximately 12 million square meters of retail space,
nearly 212 square meters for every person in the country214. Further, France is a key
economic center in Europe215.
France has been an attractive market for sportswear retailers due to its leading
position in the fashion world, its strong consumer spending profile, and its great
popularity among domestic and international tourists. The French and many international
visitors to France live active life styles, and the resulting demand for sportswear is well
212 France was one of the earliest countries to progress from feudalism to the nation-state. France was the dominant power in Europe. Source: US Department of State. 213 2010 total tourist arrival: 67,310,000. Source: United Nations World Statistics Pocketbook and Statistical Yearbook. 214 France total country area: 551,670 sq. km. (220,668 sq. mi.); largest west European country 215 GDP (2009): $2.66 trillion. Avg. annual growth rate (2009): -2.5%, compared with 0.1% in 2008. Per capita GDP at PPP (2009): $33,678
Real Options Methodology in Sportswear Retail Investment Valuation Case Studies
131
reflected by the size of its sportswear market216. Nike has been one of the most dominant
sportswear Brands in France; however, starting in 2003, the company’s sales growth in
the French market has been under significant pressure from aggressive competitors. The
company identified several areas in which it had been underperforming, which included
relatively low brand exposure compared to competitors’ brands; limited owned
distribution in shopping malls; and low distribution through chain stores.
The company’s market and internal analyses led it to the decision to increase the
number of its owned retail stores in order to gain market share in both its traditional
footwear segment and in the rapidly growing apparel segment. It also concluded that a
fully-integrated and controlled retail flagship store in France could boost brand exposure
dramatically. Such a store would, in turn, boost additional sales in company-owned retail
outlets while simultaneously stimulating additional demand for the company’s products
in chain stores.
In order to identify the best store location, the company studied the segmentation
of the French sportswear market. From various internal and public analysis, the main
finding is that French sportswear market is concentrated primarily in high income large
cities. The company conducted an in-depth analysis of over thirty cities in France to
determine the ideal location for its French flagship store. Some of its findings are
summarized in the following table.
216 NPD 2008 data: The French sportswear market size is ranked third in Europe, after the U.K. and Germany.

Real Options Methodology in Sportswear Retail Investment Valuation Case Studies
132
Table 14: City Analysis – France
City Size, Region
Size, City
Income, City
Income, Region
Characteristics
Paris 1 2 1 1 Top European city
Paris outer 1 1 2 1 Top European city
Marseille 3 3 22 24 Large city, but lower income.
Lyon 5 4 4 3 Large city.
Toulouse 9 5 15 8 Large city, but lower income.
Nice 7 6 13 9 Large city
Nantes 11 7 6 7 Medium size city, high income
Strasbourg 13 8 9 12 Medium size city, high income
Montpellier 20 9 29 26 Medium size city
Bordeaux
10 10 8 13 Attractive income, population
Rennes 21 12 10 6 Attractive income, population
Lille 6 11 27 20 Large region, attractive population
Saint-Etienne
19 15 25 29 Working-class town
Grenoble 14 17 16 4 Outdoor city
Dijon 25 19 7 11 Attractive population
Brest 28 20 24 17 Marine city
Ferrand 23 22 23 15 Regional capital
Aix-En-Provence
3 23 3 24 University town
Tours 18 24 17 14 Traditional town
Metz 17 25 18 27 Commercially attractive

Real Options Methodology in Sportswear Retail Investment Valuation Case Studies
133
City Size, Region
Size, City
Income, City
Income, Region
Characteristics
Orleans 22 26 12 5 Regional capital
Rouen 15 27 21 21 Attractive population
Nancy 16 28 11 16 Attractive population
Cannes/ Frejus
7 29 5 9 Small city, but Tourist center
Angers 26 18 20 19 Small region
Le Havre 24 13 28 28 Small region, unattractive
Le Mans 29 21 14 18 Small region
Reims 27 14 19 23 Small region
Toulon 12 16 26 22 Unattractive income, age, employ
Source: Deloitte Consulting, September 2008.
Considering both income and influence of the cities, Paris and its outer Paris
clearly stand out as the Number 1 ranking in terms of city and regional size and income.
However the retail rent is significantly higher than any other cities. This factor makes
other top three cities are also potential sites for store location. In order to identify the best
store location, the company studied the segmentation of the French sportswear market. It
found that five cities account for 22% of the Euro 1.2 billion potential Footwear &
Apparel market opportunity in France’s total Footwear & Apparel market. Greater Paris
alone already accounts for 14.2% of the total market. Another detailed demographic
analysis is conducted to look into the spending power and retail selling price point.

Real Options Methodology in Sportswear Retail Investment Valuation Case Studies
134
According to a Deloitte Consulting demographic analysis217, consumers at retail
stores in downtown Paris spend significantly more for purchases than in any other city in
France and presents a much higher selling price point218. Naturally, this is a real positive
factor for retailers. In addition, Paris is the transportation hub of all France and is an
international hot spot for fashion and a trendsetter for consumer spending around the
world. For these reasons, the company chose Paris as the site for its flagship store.
5.3.2 The Paris retail environnent & Champs Elysees.
Paris is one of the world’s foremost retailing cities. Its shopping streets,
arrondissements (districts) and shopping centers all contribute to an overall retailing
mind-set. There are a number of prime retailing locations in Paris that command premium
rents much higher than are charged in less prestigious areas. One of the most prestigious
avenues in Paris – indeed, in the entire world -- is the Avenue des Champs Elysees.
The Champs Elysees consumer mix is a 50-50 split between tourists and locals (who
comprise a mix of business men/women, families, urban and metro consumers) who
expect to pay higher prices than anywhere else in France. Increasing numbers of sports
participants shopping on the Champs Elysees, combined with high exposure in Paris to
217 Internal source: Deloitte Consulting, September 2008. 218 Internal source: Deloitte Consulting, September 2008Paris downtown area average Euro 55 per selling price point vs Paris Suburb Euro 43.6. Lyon ranks the second at Euro 48.9.

Real Options Methodology in Sportswear Retail Investment Valuation Case Studies
135
women consumers, has led to an increased number of sports retailers opening flagship or
retail stores on the Champs Elysees 219.
The Avenue des Champs Elysees is located in Paris’s 8th arrondissement. The
avenue is 1.25 miles long and connects the Place de la Concorde with the Place Charles
de Gaulle (site of the Arc de Triomphe). Since 1860 it has been considered as one of the
pre-eminent streets in the world for upscale shopping. It has become a veritable mass
market for flagship stores220. Global and luxury brands, such as Adidas, Benetton, the
Disney Store, Zara, Cartier, Louis Vuitton, Gap, Sephora, et al., occupy major spaces;
Abercrombie & Fitch has received permission to open a flagship store on the avenue in
2011, and other premium brands will surely follow.
Of approximately 2 million people per week walk along the Champs Elysees,
one third walk on the left side of the street. Even with a conservative capture rate
projection, a store on the left side would capture 30,000-40,000 in-store visitors.
Assuming an average conversion rate of 13-16% and an average basket of $80-85,
then we will reach an annual sales projection between $11-15 million. Demand for
retail space is very high, while the supply is relatively limited. Rents continue to increase
for the prime shopping streets such as the Champs-Elysees. Demand is such that it is a
219PARIS SAINT-GERMAIN FC, French elite football club, abbreviates as PSG. PSG Boutique Shop is 200m down the avenue on the same side, Lacoste, Marlboro Classics, Tara Jarmon, Ladurée/ approx. 1500 m² on 3 floors: 1100m² selling area , 400m² back office. 220 Jean-Philippe (Nike Director of Stores Europe): “The reputation of Champs Elysees is maintained well to the degree that CE Committee selects the new entrances, only limited to the premium brand and retails. In comparison to Oxford Street in London, the latter is becoming more accessible to the majority of the mass consumers.”
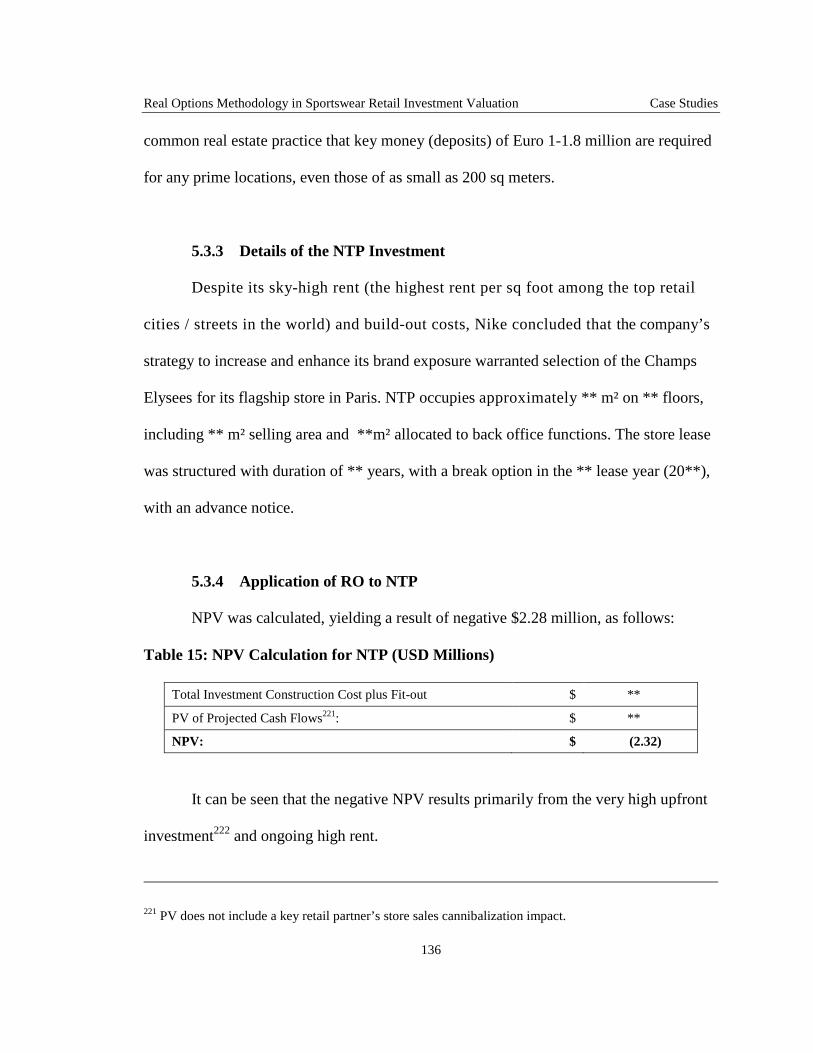
Real Options Methodology in Sportswear Retail Investment Valuation Case Studies
136
common real estate practice that key money (deposits) of Euro 1-1.8 million are required
for any prime locations, even those of as small as 200 sq meters.
5.3.3 Details of the NTP Investment
Despite its sky-high rent (the highest rent per sq foot among the top retail
cities / streets in the world) and build-out costs, Nike concluded that the company’s
strategy to increase and enhance its brand exposure warranted selection of the Champs
Elysees for its flagship store in Paris. NTP occupies approximately ** m² on ** floors,
including ** m² selling area and **m² allocated to back office functions. The store lease
was structured with duration of ** years, with a break option in the ** lease year (20**),
with an advance notice.
5.3.4 Application of RO to NTP
NPV was calculated, yielding a result of negative $2.28 million, as follows:
Table 15: NPV Calculation for NTP (USD Millions)
Total Investment Construction Cost plus Fit-out $ **
PV of Projected Cash Flows221: $ **
NPV: $ (2.32)
It can be seen that the negative NPV results primarily from the very high upfront
investment222 and ongoing high rent.
221 PV does not include a key retail partner’s store sales cannibalization impact.

Real Options Methodology in Sportswear Retail Investment Valuation Case Studies
137
According to conventional capital budgeting theory and practice, therefore, the
decision suggested by NPV analysis would be to decline to make the investment. Despite
the outcome of this traditional capital budgeting analytical process, as was the case in
London Nike management believed the investment held strategic value not revealed by
NPV analysis. Consequently, management decided to “roll the dice” and bet that the
hidden strategic value was in fact present and that the investment would pay off
notwithstanding the negative NPV result.
Would RO analysis have provided useful insights to decision makers about the
presence or absence of the hidden strategic value that is not recognized by NPV analysis?
The RO calculation, using the BSOPM, follows223:
! " �� #�������� �� �����$���
Equation (2)
d1 = ��� ���� � �� ' � ��
� �� �√�
d2 = �� �√�
222 In French Real Estate, “Key Money” is commonly paid by the new to the previous tenant at the start of a new contract. After ending the contract the new tenant will also receive key money from the subsequent tenant. Key money is generally considered being an asset, indicating the value of the contract at a certain time. IFRS has no strict rule for key money but generally it is depreciated over the lease period because of the lack of an ‘active’ (trading) market. But for economic analysis, key money is generally not depreciated. 223 It must be emphasized that the actual decision to proceed with NTP was made on gut instinct alone, despite the project’s projected negative NPV. The actual decision makers did not have access to RO analysis, which for purposes of this paper is conducted after the fact.
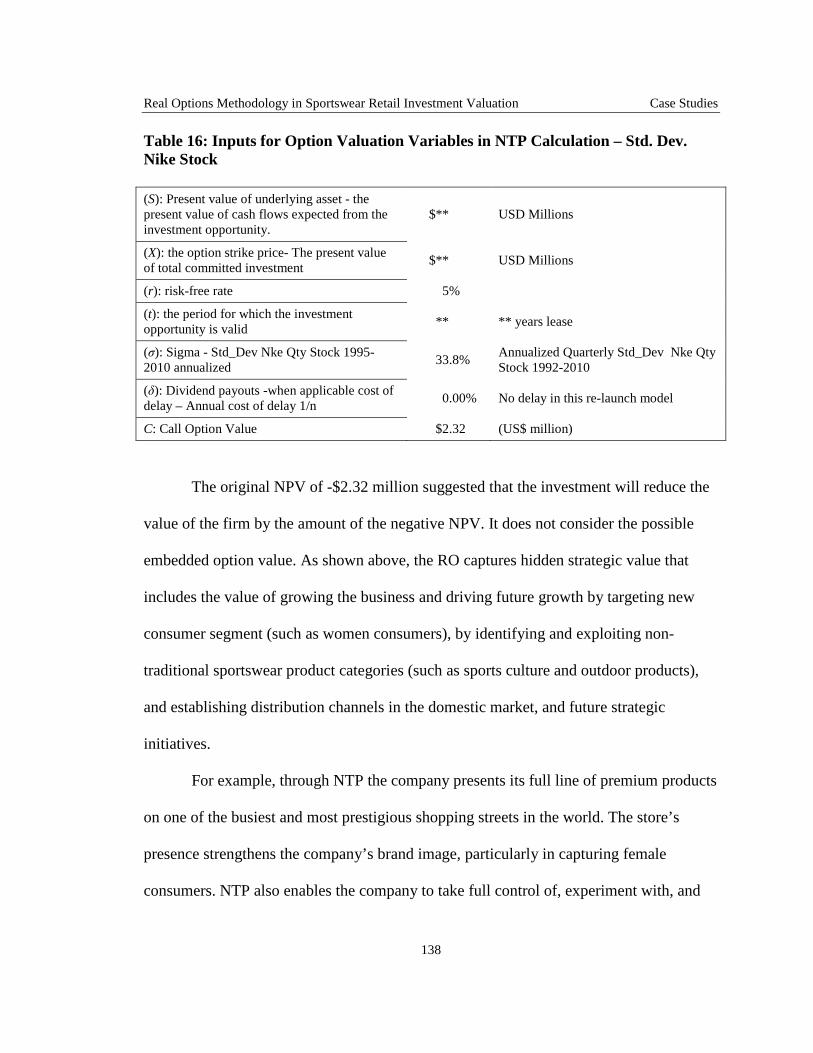
Real Options Methodology in Sportswear Retail Investment Valuation Case Studies
138
Table 16: Inputs for Option Valuation Variables in NTP Calculation – Std. Dev. Nike Stock
(S): Present value of underlying asset - the present value of cash flows expected from the investment opportunity.
$** USD Millions
(X): the option strike price- The present value of total committed investment
$** USD Millions
(r): risk-free rate 5%
(t): the period for which the investment opportunity is valid
** ** years lease
(σ): Sigma - Std_Dev Nke Qty Stock 1995-2010 annualized
33.8% Annualized Quarterly Std_Dev Nke Qty Stock 1992-2010
(δ): Dividend payouts -when applicable cost of delay – Annual cost of delay 1/n
0.00% No delay in this re-launch model
C: Call Option Value $2.32 (US$ million)
The original NPV of -$2.32 million suggested that the investment will reduce the
value of the firm by the amount of the negative NPV. It does not consider the possible
embedded option value. As shown above, the RO captures hidden strategic value that
includes the value of growing the business and driving future growth by targeting new
consumer segment (such as women consumers), by identifying and exploiting non-
traditional sportswear product categories (such as sports culture and outdoor products),
and establishing distribution channels in the domestic market, and future strategic
initiatives.
For example, through NTP the company presents its full line of premium products
on one of the busiest and most prestigious shopping streets in the world. The store’s
presence strengthens the company’s brand image, particularly in capturing female
consumers. NTP also enables the company to take full control of, experiment with, and
Real Options Methodology in Sportswear Retail Investment Valuation Case Studies
139
gain new knowledge and capabilities in the product assortment, setting up a high
benchmark for Nike product presentation in the marketplace.
Other examples of strategic values include the effective expansion of the business
to the apparel and sports accessories business segments. Additionally, the company is
able to learn new effective techniques and local practices to differentiate its product mix
with attractive styles and colors. All in all, NTP enabled the company to learn to more
effectively present products in a consistent way to targeted consumer groups and to gain
brand market acceptance. NTP additionally provides the company with a strong position
to exploit opportunities presented by the 2010 World Cup and, later, for its 2011 French
Football Association sponsorship launch. Last but not least, the opening of NTP allowed
Nike to address and combat strong competition generated by the presence of an Adidas
flagship store on the Champs Elysees. The rival companies’ head-to-head competition
requires a “platform” and both flagship stores are the “stage” for the performance.
NTP achieved the original and primary goal set for it by top management: to
become the pinnacle expression of the Nike brand in France, offering a premium
shopping experience to consumers that is innovative and exclusive, anchored by Football
and Running, while answering strategic threats posed by aggressive competitors224.
224 In 2008-2009, the global economic crisis impacted consumer behavior and spending power globally. However, Nike management firmly believes in the strategic importance and value in NTP and, in light of its 2011 French Football Association sponsorship, the company decided to invest in the NTP re-fitting in 2010. The scope of the NTP store is much smaller than NTL, primarily focusing on the ground floor to create an “initiative zone” at entrance of the store, thereby improving the consumer journey and experience.

Real Options Methodology in Sportswear Retail Investment Valuation Case Studies
140
5.3.5 NTP concluding remarks.
NTP provides, as does NTL, an example of successful strategic management by
gut feeling. In NTP, NPV – the primary tool of capital budgeting – strongly indicated
that the investment in the Paris flagship store should not be made, but management’s
belief that NTP embodied hidden strategic values not recognized by NPV led managers
to “roll the dice” despite the forecast of negative NPV. Management’s gut instinct has
been shown to have been visionary, as NTP has recorded strong year-on-year growth.
Although NTP generated a negative NPV, we can see that RO analysis – had it
been available to management – would have demonstrated that the hidden strategic
values management believed were presented by the investment opportunity were in fact
present and that the investment should be made. While neither financial tool can precisely
quantify the strategic values attached to an investment, in the case of NTP, RO would
have provided decision makers with more support for the decision that was made based
on gut instinct.
By 2010, five years after the store opened, sales exceeded the original projections
upon which the NPV analysis was based. Had NPV been calculated with more accurate
sales projections225, it still would have generated a negative – or, at best, break-even –
value. Performing the RO calculation with actual sales numbers, however, will result in a
more positive outcome than when the sales projections were used, offering further
validation for the utility of the RO tool in comparison with NPV.
225 The forecasts used at the time of the NPV calculation were based on the evidence then available.

Real Options Methodology in Sportswear Retail Investment Valuation Case Studies
141
This offers further support for the proposition that NTP, even when first proposed
with a negative NPV, did have strategic values embedded, as shown in the RO result.
These values have actualized over the years and now being reinforced by continuous
investment.

Real Options Methodology in Sportswear Retail Investment Valuation Case Studies
142
5.4 Case - NikeTown Chicago (NTC)
We then study one of the oldest NikeTown and the second biggest in the U.S.:
NikeTown Chicago (NTC).
5.4.1 The United States macro-economic & sportswear retail environment.
The United States of America, the recognized leader of the global economy, has
the highest level of output in the world, with GDP valued at US$14.1 trillion in 2009.
The U.S. economy is highly developed, with the provision of services the primary
industry, employing 75-85% of the labor in the country. Activities associated with this
sector include retail and wholesale sales, transportation, entertainment, etc. Retail counts
for more than 15% of the total trade volume of all U.S.-based businesses. The U.S. is
home to many global leading brands, for example, Wal-Mart226, Apple, The Gap, and
many more. Although in recent years serious economic imbalances triggered a financial
crisis that led to a deep recession in 2008-2009, the U.S. is still one of the strongest
economies in the world. The downturn reduced consumer spending to sluggish levels
over the past two to three years; however, retail trade alone still accounts for 7.2% of the
total GDP value-added industry and 5.2% of the U.S. gross output by industry (in current
dollars)227.
226 Wal-Mart alone employs more than 1 million people in the US and nearly 450,000 more across the globe. 227 The United States of America, Bureau of Economic Analysis. GDPbyInd_VA_NAICS: Value Added by Industry, Gross Output by Industry. GDPbyInd_GO_NAICS: Gross Output by Industry in Current Dollars, Quantity Indexes by Industry, Price Indexes by Industry.

Real Options Methodology in Sportswear Retail Investment Valuation Case Studies
143
The United States of America is a central hub for sports activities and sportswear.
In previous sections, we have described the lifestyle and cultural changes that led to the
separation of sportswear from the rest of the general apparel and footwear industry.
Sports have been a growing part of the life of the American people, both for participants
and spectators. Currently there are four major sportswear retailers in the country: Sports
Authority, Dick’s, Finish Line, and Foot Locker. All four retailers sell Nike products, as
well as the products of Nike’s competitors.
5.4.2 The Chicago macro-economic & retail demographic environment.
Chicago, one of the largest cities in the U.S., is the economic and cultural capital
of the Midwestern United States. It is a global city offering world-class tourist attractions
and cultural events. An international destination, Chicago is one of the most vibrant and
successful commercial, residential, cultural and tourist areas in the United States. It
features distinctive restaurants, famous museums, luxurious hotels, landmark architecture,
and prestigious educational and medical facilities. To many people around the globe,
Chicago is best known as the home of the Chicago Bulls, a National Basketball
Association franchise made world-famous by its iconic player, Michael Jordan.
Stable economic growth and a resilient consumer base continue to provide an
attractive backdrop for retailers in Chicago, which has become a “must” location for all
national and global brands. This has helped fuel demand for retail space throughout the
local real estate market. In general, leasing activity in the area has been fairly strong and
steady, with an average 2008 gross asking lease rate of $22.56 per sq. ft. Downtown

Real Options Methodology in Sportswear Retail Investment Valuation Case Studies
144
Chicago, however, is more expensive because the area is vibrant as Chicago continues its
movement toward a true 24-hour city. A surge in the convention business, continued
growth of the various college campuses in the Loop (Chicago’s central shopping and
business core), and the attractiveness of Chicago as a premier leisure destination among
both domestic and international travelers have combined to fuel the desire of retailers to
move downtown.
The local economy, augmented by a large number of tourists and business visitors,
has continued to expand its retail market space. Redevelopment of several inner city
neighborhoods has enabled an explosion of new retail development. The Chicago
metropolitan market has roughly 30 regional shopping malls, encompassing more than 30
million sq ft. The top four submarkets in the Metro area are Schaumburg (Woodfield
Mall), State Street, Oak Brook Center, and Michigan Avenue. Each of these top markets
is anchored by at least high performing regional mall.
Woodfield Mall, the largest mall in the state of Illinois, is located near Chicago’s
convention center and suburban business district. It has over 300 stores and restaurants
and draws more than two million visitors annually. State Street is another major shopping
destination, featuring dining and entertainment. It has Macy’s and Sears as anchor tenants
for two separate malls in the area. Oak Brook Center is a top shopping destination for
local shoppers, with six major department stores and 160 upscale shops and restaurants.
The “Magnificent Mile” – the northern part of Michigan Avenue between the
Chicago River and Lake Shore Drive -- is the biggest tourist attraction in the State of
Illinois. It is an unparalleled mixed-use district located in the heart of Chicago and is

Real Options Methodology in Sportswear Retail Investment Valuation Case Studies
145
Chicago's version of the Champs-Elysées: a grand wide boulevard with exclusive shops,
museums, restaurants and ritzy hotels. This prestigious area features more than 460 stores
in eight blocks, mostly upscale boutiques and larger national tenants such as Apple,
Ralph Lauren, Nordstrom, and Saks, among others.
An estimated 50,000-60,000 people walk along the Magnificent Mile each day.
These passers-by include domestic tourists and shoppers (business traffic on Michigan
Avenues and Midwestern regional travelers) and those traveling internationally (tourists
and international travelers passing through O’Hare Airport, one of the busiest airports in
the world, and laying over in Chicago).
5.4.3 NikeTown Chicago.
NTC, comprising ** sq ft of retail space, opened in 1991 to great fanfare. At its
peak in the 1990’s, this store was a major tourist attraction in Chicago, with over 7,500
visitors daily. This peak coincided with the peak of Chicago’s winning NBA basketball
team whose most flamboyant and talented player was Michael Jordan, a Nike-sponsored
celebrity. The store generated huge enthusiasm among loyal Nike fans whenever new
products were launched. On several occasions, such launches were greeted by long
waiting lines outside the store in the early morning or even overnight before the launch
date.
However, during the first decade of the 21st Century, NTC found its daily traffic
gradually diminishing from its former peak. Part of this decrease can be attributed to
aggressive action on the part of the company’s competitors, who opened newer state-of-

Real Options Methodology in Sportswear Retail Investment Valuation Case Studies
146
the-art flagship and concept stores on the Avenue. Meanwhile, NTC received no more
than modest upgrades following its opening. Leadership at Nike Inc. began to ask if it
would be worthwhile to conduct a major remodel of NTC in order to improve the store’s
commercial profitability and strategic presence. Would the results be likely to justify the
substantial investment required to completely upgrade and remodel the store?
To understand why a thorough remodel has strategic implications, it is necessary
to understand the drivers of retail sales at a flagship – or, for that matter, at any – retail
store. There are three store-specific factors that influence sales in a given store. The first
is the capture rate. It is the percentage of passers-by that decide to enter the store. The
second is the conversion rate, which is the percent of persons entering the store who
actually make a purchase. The third is the average dollars per transaction.
Clearly, an exciting, modern and intriguing store exterior design will impact the
capture rate. Potential shoppers are more likely to be drawn into an exciting retail
establishment than to one that is unremarkable or uninviting. The company’s competitors
have flashy, exciting designs that draw potential customers from NTC to the competitors’
stores. A dramatic remodel can reverse that trend.
The conversion rate228 and average dollars per transaction are strongly influenced
both by overall store design and by merchandizing. These two factors interact. The store
design limits or enhances what can be merchandised. For example, if significant prime
228 It has been estimated that a one percent improvement in the conversion rate will generate approximately $1.2 million annual net sales. (Proprietary data only for academic research, approval to release the data pending.)

Real Options Methodology in Sportswear Retail Investment Valuation Case Studies
147
space is dedicated to the display of historical sports artifacts instead of the latest
merchandise it is likely that both the conversion rate and the average dollars per
transaction will be reduced.
It is obvious, based on the foregoing, that a major redesign and remodel intended
to increase the capture rate and to boost the conversion rate and average dollars per
transaction should have a positive effect on sales. These effects can be predicted with
some accuracy. The increased sales and associated cash flows can be evaluated using
traditional NPV analysis to determine whether or not the investment will add value to the
company.
But what about the hidden strategic value involved in the decision? If the
company’s NPV analysis were to generate a positive result, then additional strategic
values often would not need to be examined closely. But if the company’s NPV analysis
were to generate a negative result, then strategic values must be addressed. If the
company were to decline to remodel the store, not only would it lose possible sales but it
could also lose brand heat if potential customers were to pass by NTC to shop at
competitors’ flagship and concept stores. A company historically on the cutting edge of
design and merchandising cannot afford to let itself be seen as a “has-been” or wallflower.
Once that perception takes hold in the mind of the consumer, it is hard to reverse.
NTC merchandises first-launch or hard-to-find products. Some specialty items are
exclusively offered at NTC, such as Michael Jordan Air Jordan retro style or other
paraphernalia not available from typical retailers. Despite such new product launches and
the specialty product offerings, it was observed that the NTC floor plans permit less

Real Options Methodology in Sportswear Retail Investment Valuation Case Studies
148
efficient and effective merchandizing configurations than other NikeTowns, or even
stores of industry peers.
The existing store configuration does not maximize effective merchandising
efficiency229. This is because the store’s original (and still) existing configuration was
aligned with the original NikeTown concept, which was that the flagship stores would
provide a showcase to present Nike’s newest or most innovative product lines to
consumers. NikeTowns were not originally intended to be independently profitable, or
even to be major selling channels. Rather, the concept was thought of as an opportunity
to strengthen ties with consumers, enabling otherwise hard-to-obtain consumer feedback
about the Nike brand and products, and to provide an extraordinary brand advertising
opportunity230. The conclusion is that NTC underperforms its commercial potential231 and
its strategic importance.
In order to improve the store performance both in terms of representing the brand
and regaining its attractiveness to “Magnificent Mile” shoppers, the NTC remodeling
project was proposed. The main goal is to deliver the pinnacle category retail experience
in all floors of NTC by investing in an interior remodel with a focus on creating a
229 The percentage of selling sq ft / total store sq ft is usually used as one of the measurement for store space efficiency. The store’s actual selling space is relatively low. This is our view drawn from the actual store visit and survey conversation with the in-store customers. NTC’s percentage is low. Detail merchandizing percentage is proprietary information, available only for academic commit of this paper. Not disclosed here. 230 Source: Harvard Business Review, “Conflict of Interest”, EC-9B. 231 Internal analysis. The underperformance is measured in both conversion rate and average dollars per transaction.

Real Options Methodology in Sportswear Retail Investment Valuation Case Studies
149
premium consumer and brand experience for the consumers from the city, the Midwest
region, and the world.
5.4.4 Details of the NTC remodeling investment232.
The investment is planned as follows: the remodeling will be over **-month
project and the total investment will amount to up to $** million over ** years,
consisting of an upfront investment of $** million followed by a $** million investment
to complete the remodel. During the remodel NTC will remain open for business, with
closure only of the floor being remodeled. It is estimated that the store will sustain a **%
loss of sales due to the partial closure during the first year. It is anticipated that the store
will resume normal sales figures during the second year. Upon completion of the
remodeling, the store is expected to achieve up to 40% growth, compared to sales prior to
the remodeling. The increased sales will be generated primarily from incremental
increased selling space and effective improvements to the shopping experience that will
result in improvement in the conversion rate).
The remodeling aims to create more selling space and to rearrange the current
configuration to enhance the consumer experience and ignite Nike brand energy. The
objective is the optimization of store space usage by allowing the store to hold a greater
depth and breadth of inventory in the front of the store while at the same time enhancing
back room processing. These benefits if achieved as projected will deliver a significant
232 Actual investment details concealed for business confidentiality. Details disclosed here is only for the purpose of this study. The final presentation of this paper may only provide partial disclosure.

Real Options Methodology in Sportswear Retail Investment Valuation Case Studies
150
lift to NTC’s sales and enable it to regain its popularity by, for example, attracting more
passers-by to enter the store and to make purchases once inside the store. However, the
investments are significant, as are the depreciation & rent expenses that will follow.
These are constraints that could hold back this remodeling project at a time when the
resources are limited and other investment opportunities are competing for priority within
the company. It is difficult but necessary for the company to go beyond the traditional
financial context to evaluate the project in a much deeper and broader magnitude.
The NTC remodel investment represents another opportunity to examine the
application of traditional NPV analysis complemented by the RO methodology. The RO
methodology in this case examines the delay option.
5.4.5 Application of RO to NTC.
The calculated NPV (including termination value) shown in Table 17, is a
positive $7.4 million. The buoyant cash flow projections are based on the increasing
selling space, improved conversion rate and capture rate.
In sum, the optimization of the store configuration generates improved
efficiencies in recapturing more selling space (remodeling the current store configuration
will add more selling space that will generate incremental sales), enabling broader
assortments of merchandise on the floor and improving store operations. This will
improve product presentation and availability, service levels, and the overall in-store
shopping experience. And hence improve conversion rate. The table below shows the
values of the NPV of the investment in NTC.

Real Options Methodology in Sportswear Retail Investment Valuation Case Studies
151
Table 17: NPV Calculation for NTC (USD Millions)
Total Investment Construction Cost plus Fit-out $ (**)
PV of Projected Cash Flows: $ **
NPV (Lease Term: ** year with renewal option) 233 $ 7.4
Table 18 and Table 19 incorporate the values of the six variables required to
calculate the call option value of the investment in NTC. The variables, S, X, r, t, and δ
are as explained in the last column of the tables. The value of the primary sigma is the
standard deviation of the change in the end of quarter Nike stock price closing price from
1992-2010. On an annualized basis, the standard deviation of sigma is 33.8%. Applying
these values to Equation 2, the call option value is $19.49 million, assuming no delay in
investment).
233 The NPV calculation assumes on the last year all “working capital” will be fully liquidated.

Real Options Methodology in Sportswear Retail Investment Valuation Case Studies
152
Table 18: Inputs for Option Valuation Variables in NTC Calculation – No Delay
(S): Present value of underlying asset - the present value of cash flows expected from the investment opportunity.
$** PV of cash flows after the remodeling is completed. (US$ million)
(X): the option strike price- The present value of total committed investment
$**
(r): risk-free rate 5%
(t): the period for which the investment opportunity is valid
** Lease Term
(σ): Sigma - Std_Dev Nke Qty Stock 1995-2010 annualized
33.8% Annualized Quarterly Std_Dev Nke Qty Stock 1992-2010
(δ): Dividend payouts -when applicable cost of delay – Annual cost of delay 1/n
0.00% Delay translates into opportunity cost
C: Call Option Value $19.49
The decision to invest, however, was delayed by management for a variety of
reasons. The increased rent expense would significantly outpace revenue growth at NTC.;
limited resource availability, particularly during the U.S. recession, may also have
contributed to the decision to delay the investment. This delay provides us with an
opportunity to apply RO in a formulation that uses the variable δ, which is the dividend
payment in the financial optional application, to capture the loss attributable to the delay.
The holder of the financial option foregoes the dividend payment of the underlying stock,
which reduces in value after the payment. Likewise in the real option application, the
holder of the real option also experiences a loss in the value of the underlying asset, or
opportunity cost, through the delaying of the investment. We assume that the opportunity
cost is equivalent to 1/n where n is the term of the lease. The numerator identifies the

Real Options Methodology in Sportswear Retail Investment Valuation Case Studies
153
number of periods of delay. Table 19 applies the concept of delay in the real asset
investment.
Table 19: Inputs for Option Valuation Variables in NTP Calculation – With Delay
(S): Present value of underlying asset - the present value of cash flows expected from the investment opportunity.
$** PV of cash flows after the remodeling is completed.
(X): the option strike price- The present value of total committed investment
$**
(r): risk-free rate 5%
(t): the period for which the investment opportunity is valid
** Lease Term
(σ): Sigma - Std_Dev Nke Qty Stock 1995-2010 annualized
33.8% Annualized Quarterly Std_Dev Nke Qty Stock 1995-2010
(δ): Dividend payouts -when applicable cost of delay – Annual cost of delay 1/n
10.00% Delay translates into opportunity cost
C: Call Option Value $3.87 If no delay would be $19.5 million
$(15.62) Opportunity cost due to delay
The real option value without any delay of the investment is $19.49 million as in
RO1234 or with the delay is $3.87 million as in RO2. The difference between the two RO
results is considerable: $15.62 million. This figure reflects how much values could have
been generated had the investment been made when originally proposed. It is worthwhile
noting that the difference in two RO results is significant, when considering the total
store sales per year235. The RO results indicate the “opportunity cost” is more than just
the financial sales loss. The financial loss from the delay is only reflected in sales lost due
234 Assuming the project had no delay. 235 Average sales per square footage in Michigan Avenues is estimated between $250-$500. NTC is 69,000 Sq. Ft.
Real Options Methodology in Sportswear Retail Investment Valuation Case Studies
154
to the delay (the remodeled NTC has more selling space and hence contributes
incremental sales, by estimate will achieve approximately $** million by adding a selling
floor). The opportunity cost can also be measured using KPI (Key Performance
Indicators), such as conversion rate (assuming a better store presentation will promote a
higher percentage of buying when consumers are in the store), in-store traffic (assuming a
better store presentation will attract more passers-by to enter the store); and Average
Dollars Per Basket (assuming a better product presentation assortment will encourage
consumers to spend more per visit).
The RO results, in both delay and no delay cases, the real option values are
positive, and provide solid support to the investment decision (particularly in the no-
delay scenario). The results further strengthen our hypothesis that the traditional NPV
method is insufficient to capture all investment return values. NTC’s investment delays
leads to two RO results while NPV remains the same (using same sets of cash flows
projections). This demonstrate that the real option value increases (or decreases) with
increased flexibility (or inflexibility) and with increased risk (decreased risk, such as
delay investment) associated with the underlying real asset investment. As mentioned in
the NTL case, NPV’s stringent application of a single discount rate to capture all the
dynamics and risk in the markets236 constricts the decision makers to a limited framework.
This limitation is particularly apparent in a few high-risk high-return industries and has
been demonstrated in the NTL and NTP cases. In the NTC case, this limitation is
236 Markets here refer to both business commodity markets and investment capital markets.

Real Options Methodology in Sportswear Retail Investment Valuation Case Studies
155
exemplified by NPV’s inability to capture the “opportunity loss” associated with the
delay. Using the same sets of cash flow projection, we derive two significantly different
RO results, but the same NPV (all other factors assumed to be the same).237
In addition to the tangible financial benefits (from adding more selling space,
improving the capture rate, the conversion rate, and average basket size, for instance),
RO demonstrates there are more unaccounted values, tangible and intangible, associated
with this investment. There are both offensive and defensive intangible strategic values
associated with a remodeled NTC. Offensive strategic values are associated with the
revitalized projection of the Nike brand in a state-of-the-art store featuring unique and
dramatic brand-specific in-store consumer experience; this creates brand heat and
stimulates consumer loyalty and increased sales not only at NTC but throughout the
region. In addition, staff morale and productivity can be expected to improve, further
enhancing both sales and brand heat. Defensive strategic values include neutralizing and
regaining the competitive advantage ceded to the company’s rivals who had installed
more modern and eye-catching flagship stores on the Magnificent Mile.
5.4.6 NTC concluding remarks.
NTC demonstrates how RO captures strategic values, including the value (in this
case, a decreased value) resulting from the delay in the investment. The NTC remodeling
investment was proposed twice. If we use the same set of cash flow projections, merely
237 WACC remains the same at **%, reinvestment rate stays at **%; same sets of cash flows projection. Same depreciation methodology.

Real Options Methodology in Sportswear Retail Investment Valuation Case Studies
156
delaying their onset for a year or two, we would have derived the same NPV. However,
using the very same set of projections, we derive two different RO values, the difference
between them signifying the NTC embedded hidden strategic values not recognized by
NPV.
When we examine NTC’s values through a broader lens, there is a greater
significance beyond the computed value contributing to NTC and to the Nike brand, for
instance, growing the sportswear market overall. As one of the anchor Nike Towns in the
U.S., its radiance ripples throughout the Midwest region, particularly in the Chicago area.
NTC is deeply connected to sports, reflecting the region’s long and rich sports legacy238.
NTC maintains a highly visible Nike presence in the Midwest region of the US market. It
presents products that are locally relevant to the City and the region; examples include
the Jordan basketball product collection. NTC’s location is a retail hot spot in Chicago,
competing directly with key competitors’ flagship stores239.
RO results indicate the “opportunity cost” is more than these losses. It also
reflects the embedded strategic and synergistic values. One of the examples, as
mentioned in previous section, is the billboard advertisement impact. The exposure of the
Nike brand creates a wide-ranging commercial advertisement impact in generating
demand for Nike products. Approximately 15 million people walk by the NTC block
annually, and assuming a capture rate of **% ** million of these people will walk into
238 For example, Michael Jordan (Chicago Bulls), Sammy Sosa (Chicago Cubs), Charles Comiskey (Chicago White Sox). 239 Adidas Originals / Heritage Store, Puma Concept Store, Crate & Barrel, and North Face Concept / Flagship Store.

Real Options Methodology in Sportswear Retail Investment Valuation Case Studies
157
the store240. NTC enables Nike to reach out to this broad population as a live billboard,
reaching key consumer demographics and delivering premium products, consumer
experiences and brand impressions241. They might or might not make any purchases, but
the strong and positive impression of the Nike brand stays with the consumer.
240 These people are local residents, domestic visitors, and international tourists. 241 While the local shoppers are more time sensitive and have a high expectation on the products (product-seekers), the tourists and visitors are more into store experience and less prices sensitive. For most European visitors, the products are cheaper compared to home country.

Real Options Methodology in Sportswear Retail Investment Valuation Case Studies
158
5.5 Case – NikeTown Beijing (NTB)
We now turn to the final application of the real option model for this study. We
will examine the investment of NikeTown Beijing, which will be a “staged” investment.
While the Nike-Town Beijing investment is still an “Expansion” application, it differs in
that the first stage of the investment allows the corporation to hold an option to commit
further investments, and more importantly, the early option allows the company to be
able to select highly sought after location in a city that has just shown the world the
excitement of the city through the opening ceremony of the Olympics. We begin with a
brief introduction of China’s macroeconomic and retail environment.
5.5.1 The Chinese macro-economic & sportswear retail environment.
The Chinese economy has experienced phenomenal growth over the past few
decades, making solid strides in economic development on almost all fronts. One of the
key economic measurements, year-over-year change in Gross Domestic Product (GDP
YoY), has been in the high single digits over the past decades. From 1989 through 2010,
China's average annual GDP growth was 9.30 percent, ranging from a record low of 3.80
percent in December of 1990 to a historical high of 14.20 percent in December of 1992.
According to the World Bank, China’s 2010 Gross Domestic Product is approximately
$4,909 billion, or 7.92% of the world economy, and China is focused on catching up with
the West. If growth continues at its current pace, China will eventually emerge as a
leading player in all major industries. By 2024 China’s nominal GDP will have overtaken
the US, becoming the largest economy in the world.

Real Options Methodology in Sportswear Retail Investment Valuation Case Studies
159
China has the largest population and is the second largest geographic area in the
world. It is one of the most active global retail markets. In 2004, China opened the
country’s retail sector to foreign investments. By the end of 2005, the total retail and
wholesale sector reached $28.5 billion (year-on-year growth of 22.3%). China has
emerged not just as a manufacturing base but as a massive consumer market to many
foreign companies.
Nike is among the early foreign entrants to China. In 1980, Phil Knight made his
first trip to China. The following year, Nike opened its first factory in China and
sponsored the Chinese national basketball team. Nike’s shoes were first sold in China in
1982 at the state-owned Beijing Friendship Store, where they were enthusiastically
received. In 1994-1995, Nike helped establish China’s first professional sports leagues
for soccer and basketball.
In 1998, Nike discovered a 17-year-old basketball player, Yao Ming, who became
a world-class NBA star. Then in 2002, Nike signed hurdler Liu Xiang, who won a gold
medal in the 2004 Athens Olympics. In 1994, Nike China was an $8 million enterprise;
by 2002, sales had reached $100 million. Nike’s strategy for building that market was and
remains focused on the Chinese consumers of the future; to serve them the company
opened hundreds of new retail outlets within the country. In 2008, Nike hit the
benchmark of $1 billion in revenues from China, and it is clearly established as the
leading global sportswear company in China.
China’s development is unique. The country transformed from a “centrally
planned economy” in early 1980’s to a more market oriented and entrepreneurial

Real Options Methodology in Sportswear Retail Investment Valuation Case Studies
160
economy while retaining a strong centrally controlled politically socialist organization. It
has been growing at a phenomenal pace. China has been one of the main contract
manufacturer for many global apparel and footwear companies as well as a contract
manufacturer for many other products for multinational companies. As Chinese
companies learn modern manufacturing and other business skills, they began to
manufacture and market their own products domestically and compete internationally in
addition to being contract manufacturers to multinationals. Furthermore, domestic
development raises standards of living, and therefore, raises domestic demand for
products. Today China has become one of the most attractive consumer markets for many
companies in the world. Our application of the real option model for Nike Town Beijing
must integrate the dynamism, risk, and the pace of growth of the Chinese economy.
5.5.2 (Branded) sportswear industry in China.
Sportswear is a newly established industry in China. It is well observed that the
increasing wealth in the general public and enhanced quality of life are changing the
people’s lifestyle. Sports are no longer just the speculators’ TV time, but more so
becoming participants’ pastime. China’s winning the bid to hold the 2008 Olympic
Games is a defining moment for Chinese sportswear industry and greatly accelerated
industry acceptance and popularity among Chinese consumers.
There are limited industry statistics available. Based on internal and external
industry analysis, sales of branded sporting goods were mainly channeled through
shopping centers in first-tier cities, and through specialized retail stores in second-tier and

Real Options Methodology in Sportswear Retail Investment Valuation Case Studies
161
third-tier cities. Consumers in first-tier cities and high-end consumers tend to focus on
product functionality and performance because of their more mature consumption
behavior, greater participation in sports, and greater propensity to spend. As a result,
product diversification offers significant opportunities in these markets.
The sportswear industry in China is highly competitive. In addition to foreign
competitors like Adidas, leading domestic brands have emerged and grown at a rapid
pace. There are many local and international sports brands competing in the China market.
The principal competitors are Nike, Adidas, LiNing, Anta, Doublestar and Kangwei.
Generally international brands perform better in 1st-tier cities and some coastal cities
where consumer spending is higher on a per capita basis. Domestic brands are more
competitive in 2nd-tier and 3rd-tier cities. LiNing has competitive advantages given its
strong heritage as the “national” hero brand. Its early entry has secured a long-term
relationship with the Chinese sports community. Furthermore, LiNing’s sponsorship of
major sports teams, sporting events and key athletes have created public confidence and
passion and have achieved significant advertising and promotional impact. In addition, it
has an extensive sales network, well-defined market positioning and comprehensive
product offerings.
Li Ning Company Limited 242 is a well developed company which has established
an extensive supply chain management system, distribution channels, and retail network
242 Li Ning Company Limited is one of the leading sports brand enterprises in the PRC, possessing brand marketing, research and development, design, manufacturing, distribution and retail capabilities. The

Real Options Methodology in Sportswear Retail Investment Valuation Case Studies
162
in the PRC, primarily through outsourcing of manufacturing operations and distribution
via franchised agents. The company has been growing at a rapid pace since its public
offering on June 4, 2004. As of 31 May, 2004, Li Ning had already over 200 distributors
operating over 2,200 franchised retail outlets for the LI-NING and KAPPA brands in
China. It also operated 110 retail stores and 199 concessions for the LI-NING and
KAPPA brands. The company keeps expanding its retail section. As of 2009, it has
already owned more than 7,200 branded retail stores in the country, just in 2008-2009
alone, it opened additional 1,000 more stores, focusing on smaller markets priced at
affordability for the majority of Chinese who might not be inclined to spend over US
$100 on a pair of sneakers. The company has been taking marketshare from the global
brands, such as Adidas and Nike, which are dominant in the Tier one cities.
As of 2008, Nike had the highest market share (12.7%) among sportswear brands
in China based on fiscal year 2008 sales data243, Adidas was in second place (11.0%), and
LiNing was the largest domestic sportswear brand (9.5%).
The following exhibit demonstrates the sportswear brands’ market shares in China,
for the fiscal year of 2008.
Group's products mainly include footwear, apparel, accessories and equipment for sport and leisure uses under its own LI-NING brand. 243 Source: Euromonitor, Flyke International, complied by Daiwa, in July 10 2010 Analysis report.

Real Options Methodology in Sportswear Retail Investment Valuation
Figure 2: China Sportswear Industry Key Players
5.5.3 Sigma in RO Application in
In the real options applications of
Chicago, we have used the stock price return of Nike Corporation (Nike B stock) as the
underlying asset for our anal
we assumed that stock markets in United States and Europe are closely correlated in
movements and, more importantly, in the timely and generally accurate disclosure of
financial information. Would Nike stock price return still be the appropriate underlying
asset for the real option analysis of Nike Town Beijing in China, an emerging economy
that has maintained surging real rates of growth? If the securities market in China are
“not in sync” with securities markets in the U.S. and Europe, we may need to find a
comparable company in China, sometimes called a “pure play” local company, whose
Real Options Methodology in Sportswear Retail Investment Valuation
163
tswear Industry Key Players
Sigma in RO Application in NTB.
In the real options applications of NikeTown investments in London, Paris, and
Chicago, we have used the stock price return of Nike Corporation (Nike B stock) as the
underlying asset for our analyses. We are comfortable with using Nike’s
we assumed that stock markets in United States and Europe are closely correlated in
movements and, more importantly, in the timely and generally accurate disclosure of
Would Nike stock price return still be the appropriate underlying
asset for the real option analysis of Nike Town Beijing in China, an emerging economy
that has maintained surging real rates of growth? If the securities market in China are
ith securities markets in the U.S. and Europe, we may need to find a
comparable company in China, sometimes called a “pure play” local company, whose
Nike
13% Adidas
11%
LiNing
10%
ANTA
7%
Kappa
5%
Erke
4%
Xtep
4%
360
3%
PEAK
2%
Others
41%
Case Studies
investments in London, Paris, and
Chicago, we have used the stock price return of Nike Corporation (Nike B stock) as the
stock return as
we assumed that stock markets in United States and Europe are closely correlated in
movements and, more importantly, in the timely and generally accurate disclosure of
Would Nike stock price return still be the appropriate underlying
asset for the real option analysis of Nike Town Beijing in China, an emerging economy
that has maintained surging real rates of growth? If the securities market in China are
ith securities markets in the U.S. and Europe, we may need to find a
comparable company in China, sometimes called a “pure play” local company, whose

Real Options Methodology in Sportswear Retail Investment Valuation Case Studies
164
stock price return variance, and risk-return profile reflect more closely approximate the
(real) investments in its dynamic high growth economy.
We will first examine the correlations of securities markets of the U.S. with two
European securities market indices and two stock market indices in China. These are the
Standard and Poor 500 Index (S&P)which is a capitalization weighted index of 500 of the
largest companies in the U.S.; the FTSE 100 (Financial Times-London Stock Exchange)
which is an index of 100 most highly capitalized stocks in the London Stock Exchange
and a benchmark index of the stock market in England; the CAC (Contation Assistee
Continu), a benchmark French Stock Market Index which is a capitalization weighted
measure of 40 of the most significant values among the 100 highest market capitalization
companies in the Paris Bourse (now Euronext Paris); the Hang Seng Index (HSI), a
benchmark stock market index in Hong Kong which is a market capitalization weighted
measure of 40 of the largest companies that trade in Hong Kong; and the Shanghai Stock
Exchange (SSE), a composite stock market index that is capitalization weighted
consisting of all A and B shares listed on the Shanghai Stock Exchange. The correlation
matrix is based on the monthly index values between January 1, 2005 and December 31,
2010.

Real Options Methodology in Sportswear Retail Investment Valuation Case Studies
165
Table 20: Correlation Matrix
S&P HSI CAC FTSE SSE
S&P 1.0 0.52 0.954 0.956 0.411
HSI 1.0 0.391 0.611 0.890
CAC 1.0 0.92 0.353
FTSE 1.0 0.475
SSE 1.0
From the correlations shown above, it is clear that the S&P 500 Index of the U.S.
is very closely correlated with the European stock market indices and not very closely
correlated with the Hong Kong or Shanghai stock market indices. The London index is
slightly more correlated with the Hong Kong index. On the other hand, the Shanghai and
Hong Kong Indexes are closely correlated. With these correlations, we are comfortable
that we have appropriately used the Nike stock price return as the underlying asset for
analyzing Nike Town London, Paris, and Chicago. For Nike Town Beijing, we are
hesitant to use the Nike stock price return due to the lack of correlation with the local
securities markets. Instead, we will use a pure play company in China, the Li Ning
Company Limited, whose stock is traded in the Hong Kong Stock Exchange. Our
rationale is that Li Ning is operating mainly in the China markets and its stock price
return should more properly reflect the risk-return characteristics of investors’
expectations in that region.
Along the lines of the Capital Asset Price Model to capture the systematic risk
(beta from the regression) and return of the stock, we ran regressions of monthly Li Ning

Real Options Methodology in Sportswear Retail Investment Valuation Case Studies
166
stock returns against the monthly Hang Sheng Index returns from January 2005 through
December 2010. As a comparison, we ran similar regressions of monthly returns of Nike
stock against the monthly returns of the S&P over the same period. Regression results are
as follows:
RLi Ning = 0.019 + 1.30 RHSI R2 = 0.44
(0.012) (0.18)
RNike = 0.012 + 0.90 RS&P R2 = 0.41
(0.006) (0.13)
The variable R represents the rate of return of the stock and respective market
return index. The first term is the intercept, and the coefficient of the market index is the
beta (β) of the stock. The values in parenthesis are the standard error of the estimates. The
β coefficients for both Li Ning and Nike have reasonably small standard errors (t-
statistics are 7.31 and 6.94 for Li Ning and Nike respectively) and significant at the 95%
level. These beta estimates and their range of estimates within the 95% significance level,
indicate that to investors Li Ning operating in the Chinese market has much higher
systematic risk than Nike operating in the U.S. market. We expect a company operating
in the fast growing China would experience higher variances in operating cash flows than
a company operating in the U.S. Likewise, a younger company operating in a high
growth region would experience higher variances in operating cash flows than a more
mature company operating in a more stable growth region. With these considerations, we

Real Options Methodology in Sportswear Retail Investment Valuation Case Studies
167
believe that it is more appropriate to use Li Ning stock returns as the underlying asset for
our application of real options to NikeTown Beijing.
5.5.4 Beijing macro-economic & retail demographic environment.
On July 13, 2001, Beijing won the bid to host the 2008 Summer Olympics. It was
a day of triumph for China. It also represented a tremendous opportunity for Nike, which
has a track record of delivering stunning investment return performance during the
Olympics years. Before 2007, however, Nike had no premium owned retail space on the
high street in China. Rather, it relied on a network of distributors (department stores and
partner stores) to distribute its products in the country. The company felt that this retail
network would simply be insufficient to maximize the brand-building opportunity
presented by the Beijing Olympics. Not only would the company be unable to rely on
these distributors to provide ample space for Nike products, but Nike lacked control of
the brand presentation in third party stores. The company concluded that the Beijing
Olympics warranted the creation of a new flagship store in China, not only to maximize
sales through the store itself (and, via the brand heat created, through its distribution
partners) but, also, through increased brand visibility to deepen the brand’s relationship
with the younger generation. A further advantage is that the new store would steal the
thunder of its competitors’ stores and cool their own brand heat.
From among the top tier cities in China, the company selected Beijing to build the
new store. Not only would Beijing be the host city for China’s first Olympic Games, it is
also the capital of China and has a long and well-established history and culture. It is the

Real Options Methodology in Sportswear Retail Investment Valuation Case Studies
168
leading city in the country. Its nominal GDP has experienced tremendous growth over the
years. In 2007, a year before the Olympics, Beijing GDP was USD$138 billion (935
RMB billion) – a remarkable 229% increase from USD$42 billion (285 RMB billion) in
2001. Further, it is anticipated that Beijing will continue to experience accelerated
urbanization and globalization.
The primary focus of opening a flagship store in BJ is to secure solid brand
presentation at the premier location in China, ahead of the Olympic Games. This flagship
store was planned to be the best of Nike in China and to be the archetype for the other
retailers that sell Nike products. It is therefore much more than a store; it is a venue
intended to elevate the Nike brand image in this fast growing market. “It’s extremely
exciting to open a flagship Nike retail presence in one of the world’s great cities. China is
one of Nike’s biggest growth opportunities, and one of the most dynamic retail markets
in the world. Our Beijing flagship store creates a strong brand statement with a
compelling world-class shopping experience. “244
The strategic move to build a flagship store in Beijing was shared and followed by
competitors. A year after the opening of NTB, Adidas opened its flagship store, the
“Adidas brand center”, in Sanlitun, the capital's main entertainment district245. Their
34,100 square foot store is about 1½ times the size of Adidas's previous largest outlet on
244 Charlie Denson, Brand President, Nike, Inc, at Beijing store opening, August 7, 2007. Source: Company site. 245 The fact that Adidas opened its megastore in Beijing’s entertainment district may signify the company’s intention to present its flagship store experience as a form of entertainment rather than as a pure retailing experience.

Real Options Methodology in Sportswear Retail Investment Valuation Case Studies
169
the Champs-Elysées in Paris. The company invested heavily in China in the near term to
promote Adidas's role as the official sportswear provider for the Beijing Games. In the
longer term, Adidas is planning to grow its business in China significantly246.
In order to find the best location for NTB, Nike conducted an in-depth analysis
that compared different prominent retail districts - Wanfujing Aveneue, Xidan,
Jingoumen, Donzhimen, and ChaoYang - within the Chinese capital. The districts were
categorized by the demographic characteristics deemed significant by Nike for store
location (membership in the 16-24 age group, student or non-student population, and
amount of tourist and local foot traffic)247. A matrix, Table 21, was created in 20** that
matched the demographics of each district, weighted by expected revenue248, that the
company estimated would be generate sales. The results show that Wangfujing Avenue
ranked the highest in student and tourist populations and was in a virtual tie with Xidan
for youth as a percentage of the population. Wanfujing Avenue had the highest estimated
retail revenue potential among the five districts and, in addition, it was the most popular
of the districts among the local population.
246 Christophe Bezu, GM Adidas Asia, “China is already Adidas’s second-largest market by the end of this year, overtaking Japan and coming after the U.S. China is already Adidas's most profitable market, having passed Japan and some other European markets at the end of 2007.” Chief Executive Herbert Hainer has said that Adidas's China sales will surpass $1.58 billion by 2010. 247 Data derived from census and from several governmental agencies. Details are available only for academic study. 248 Dollar amount of estimated revenue data is confidential, and therefore only percentage breakdowns may be used in this study.
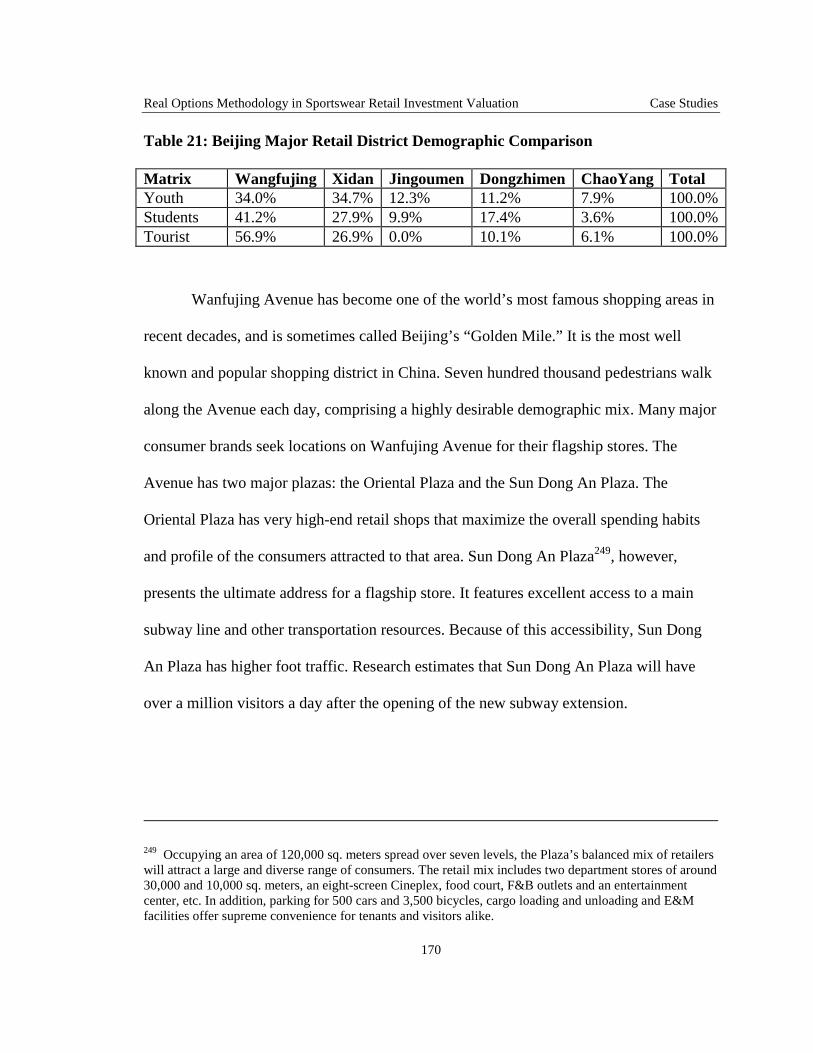
Real Options Methodology in Sportswear Retail Investment Valuation Case Studies
170
Table 21: Beijing Major Retail District Demographic Comparison
Matrix Wangfujing Xidan Jingoumen Dongzhimen ChaoYang Total Youth 34.0% 34.7% 12.3% 11.2% 7.9% 100.0% Students 41.2% 27.9% 9.9% 17.4% 3.6% 100.0% Tourist 56.9% 26.9% 0.0% 10.1% 6.1% 100.0%
Wanfujing Avenue has become one of the world’s most famous shopping areas in
recent decades, and is sometimes called Beijing’s “Golden Mile.” It is the most well
known and popular shopping district in China. Seven hundred thousand pedestrians walk
along the Avenue each day, comprising a highly desirable demographic mix. Many major
consumer brands seek locations on Wanfujing Avenue for their flagship stores. The
Avenue has two major plazas: the Oriental Plaza and the Sun Dong An Plaza. The
Oriental Plaza has very high-end retail shops that maximize the overall spending habits
and profile of the consumers attracted to that area. Sun Dong An Plaza249, however,
presents the ultimate address for a flagship store. It features excellent access to a main
subway line and other transportation resources. Because of this accessibility, Sun Dong
An Plaza has higher foot traffic. Research estimates that Sun Dong An Plaza will have
over a million visitors a day after the opening of the new subway extension.
249 Occupying an area of 120,000 sq. meters spread over seven levels, the Plaza’s balanced mix of retailers will attract a large and diverse range of consumers. The retail mix includes two department stores of around 30,000 and 10,000 sq. meters, an eight-screen Cineplex, food court, F&B outlets and an entertainment center, etc. In addition, parking for 500 cars and 3,500 bicycles, cargo loading and unloading and E&M facilities offer supreme convenience for tenants and visitors alike.

Real Options Methodology in Sportswear Retail Investment Valuation Case Studies
171
5.5.5 Application of RO to NTB
On August 3, 2007, Nike opened its first flagship store in Beijing. The calculated
NPV250, as shown in the table below, was $1.6 million. The total present value of
the cash flow projection was $** million over a period of ** years, with $**
million upfront investment. This investment is only for the construction and fixture
costs to set the store251.
Table 22: NPV Calculation for NTB
Total Investment Construction Cost plus Fit-out $ **
PV of Projected Cash Flows252 $ **
Lease Term: * year with renew option
NPV253 $ 1.61
Viewed from the standpoint of financial return, this investment would be
considered acceptable as project acceptance would provide an expected present
value of $1.61 million. The measurement of return nevertheless does not consider
the value associated with externalities, or the embedded option value in the
investment.
In the RO methodology we use the same data for the present value of the
underlying asset (S) and the present value of the committed investment (X) which is also
250 The NPV here calculated is based on a five-year lease term, using the liquidation of the inventory at the end of the lease term to represent (partially) the termination values. 251 Much of the other R&D investments are already occurred as “sunk costs.” 252 The NPV is calculated to include the final year’s working capital liquidation. 253 NPV is calculated including the last year cash flow as “growth annuity.”

Real Options Methodology in Sportswear Retail Investment Valuation Case Studies
172
the strike price as in the NPV calculation. The tables below show the values of the six
variables required to calculate the call option value of the investment in NTB.
As in previous NikeTown investment cases, the Nike Town Beijing is expected
not only to generate commercial profits, but also to generate external benefits. These
benefits may include the synergistic effects NTB will have on general sales in the region
and the strategic values arising from Nike’s major presence in the regional and national
retail segment of China. We have further proposed that using the standard deviation of
the monthly rate of change of LiNing closing stock price from 2004-2011 is more
appropriate for the analysis than using Nike’s stock price return. On an annualized basis,
the standard deviation of sigma is 45.1% , compared to sigma of 33.8% used in previous
three cases.
Table 23: Inputs for Option Valuation Variables in NTB Calculation – 5 Year
(S): Present value of underlying asset - the present value of cash flows expected from the investment opportunity.
$**
(X): the option strike price- The present value of total committed investment
$**
(r): risk-free rate 5%
(t): the period for which the investment opportunity is valid
** Lease term
(σ): Sigma - Std_Dev Nke Qty Stock 1995-2010 annulized
45.1% Annualized LiNing Monthly Std_Dev LiNing Mthly Stock 2004-2011
(δ): Dividend payouts -when applicable cost of delay – Annual cost of delay 1/n
0.00% Annual cost of delay = 1/n
C: Call Option Value $2.06

Real Options Methodology in Sportswear Retail Investment Valuation Case Studies
173
Table 23 above lists the values of the six variables in the call option equation and
the resulting call option value of $2.06 million. The positive value indicates that there is
some additional embedded option value in the investment project, which reinforces the
result from the NPV analysis. The primary contribution of the use of RO in the NTB
case is to be found in the evaluation of the staging opportunity, as described next.
As an aside, we note that some analysts may argue that investment in the rapidly
growing economy of China may introduce considerably more risk and uncertainty than
are typically present in developed countries. Thus, they might want to adjust upward the
hurdle rate to accommodate the higher risk and uncertainty. These risks could also
include currency and political risks in addition to the risk associated with higher growth
of an emerging economy. On the other hand, one might also argue that the low
correlation of China’s securities markets with the more developed securities markets of
the Western industrialized economies may be indicative of diversification possibilities
that can decrease systematic risk as well as provide better diversification of unsystematic
risk. This latter argument could result in a lower the cost of capital of the multinational
firm254.
In normal practice, a retail store of such size and scale would expect to remain in
operation between 10-30 years. This is particularly the case in China, where the market is
seen as a strategically important market for the company in the long term. It is very likely
254 See for example, Rene M. Stulz, “Globalization of Capital Markets and the Cost of Capital: the case of Nestle”, Journal of Applied Corporate Finance, Fall 1995, pp 30-38, and Ali Fatemi, “Shareholder Benefits from Corporate International Diversification, Journal of Finance, Dec. 1984, pp. 1325-1344.
Real Options Methodology in Sportswear Retail Investment Valuation Case Studies
174
that the company will exercise its option to extend the lease for an addition ** years at
the termination of the initial ** year lease term. The reasons why the company only
entered a **-year lease have not been publicly disclosed. Although it is possible that the
**-year lease term could simply be due to local real estate regulations or have been
unilaterally imposed by the landlord, we believe one of the key reasons could be the
unique market risk posed by China at the beginning of the 21st Century.
As 2012 is a year of major political leadership change for China255, the decision
by the company to sign a **-year lease with an option to renew for an additional ** year
term appears to be a very shrewd way to hedge its bet in China. The short-term renewable
lease provides an example of a “staging investment” experiment conducive to the
application and understanding of embedded option value. In other words, by holding the
short-term renewable lease, the lessee has the option to plan a second stage of investment
based upon uncertain events unfolding. That option has value and is embedded in the
initial renewable lease.
5.5.6 NTB 2nd stage investment.
In the previous discussion, we assumed the company would exercise the
option to renew the lease upon the expiration of the initial lease term. We observed
that the company may have used the short initial lease term as a way of testing the
NTB investment while minimizing its exposure to risks presented by political
255 Year 2012 is the Chinese “Central Political Committee” election year.

Real Options Methodology in Sportswear Retail Investment Valuation Case Studies
175
uncertainty. Both propositions still hold true. However, the company did not wait
the entire testing period before deciding to make a subsequent investment, a
reaction consistent with the real option concept that there is embedded call option
value in the initial stage investment.
Since NTB opened in August 2007, the store has attracted many visitors and
has become a “must-visit” landmark on Wangfujing Street. The amount of
consumer inflow and market demand ahead of the Olympics was unprecedented.
The initial store square footage became inadequate to stock and to display the
company’s pinnacle products. One of the options available to the company was to
increase the store size with the anticipation that the increased space would attract
more customers, and generate significant associated incremental revenue. The
company estimated both costs and resulting incremental revenues in making its
decision.
Including these calculations in our NPV and RO analyses enable us to derive
another set of NPV and RO values. The NPV of the Stage II is smaller than the NPV of
the Stage I investment as expected. The smaller Stage II investment is primarily to extend
the lease area by adding an additional floor, and the present value of the cash flows
relates only to the revenues generated by and from that additional floor space. The NPV
as shown in Table 24 is $1.25 million.
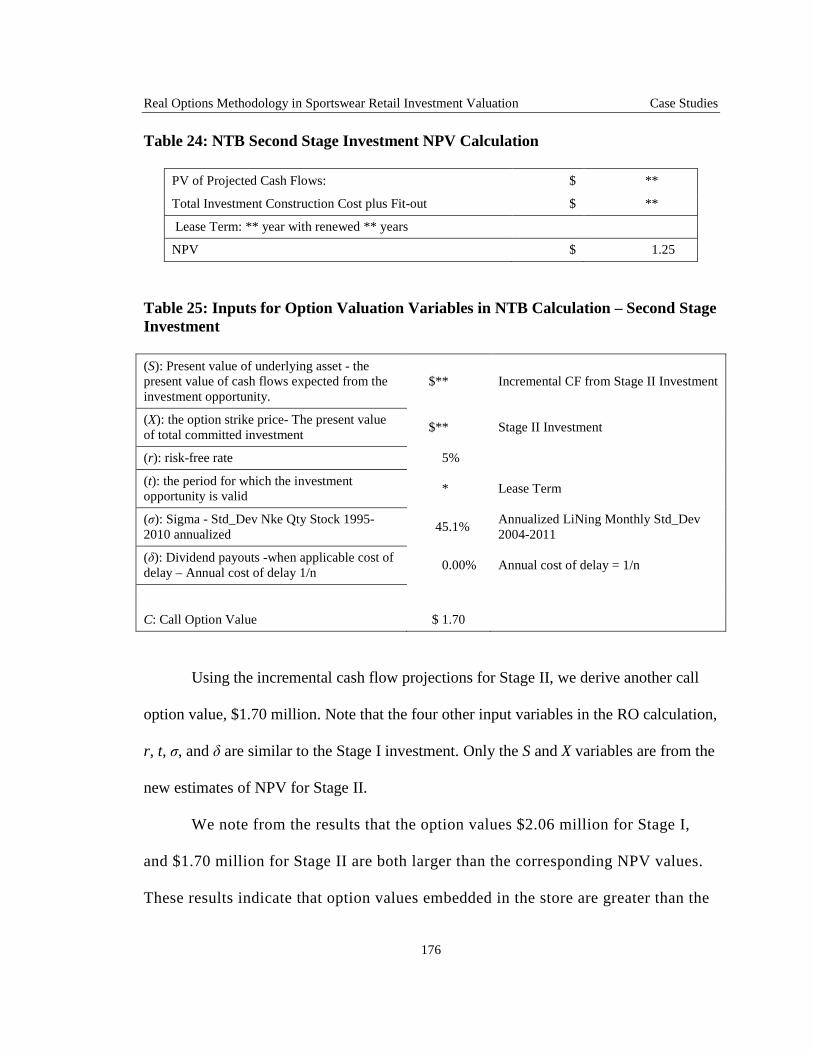
Real Options Methodology in Sportswear Retail Investment Valuation Case Studies
176
Table 24: NTB Second Stage Investment NPV Calculation
PV of Projected Cash Flows: $ **
Total Investment Construction Cost plus Fit-out $ **
Lease Term: ** year with renewed ** years
NPV $ 1.25
Table 25: Inputs for Option Valuation Variables in NTB Calculation – Second Stage Investment
(S): Present value of underlying asset - the present value of cash flows expected from the investment opportunity.
$** Incremental CF from Stage II Investment
(X): the option strike price- The present value of total committed investment
$** Stage II Investment
(r): risk-free rate 5%
(t): the period for which the investment opportunity is valid
* Lease Term
(σ): Sigma - Std_Dev Nke Qty Stock 1995-2010 annualized
45.1% Annualized LiNing Monthly Std_Dev 2004-2011
(δ): Dividend payouts -when applicable cost of delay – Annual cost of delay 1/n
0.00% Annual cost of delay = 1/n
C: Call Option Value $ 1.70
Using the incremental cash flow projections for Stage II, we derive another call
option value, $1.70 million. Note that the four other input variables in the RO calculation,
r, t, σ, and δ are similar to the Stage I investment. Only the S and X variables are from the
new estimates of NPV for Stage II.
We note from the results that the option values $2.06 million for Stage I,
and $1.70 million for Stage II are both larger than the corresponding NPV values.
These results indicate that option values embedded in the store are greater than the

Real Options Methodology in Sportswear Retail Investment Valuation Case Studies
177
financial values reflected in their NPVs. Had this analysis had been done before
the investment decisions were made, management might well have resolved to
increase the size of the investment in each stage.
5.5.7 NTB concluding remarks.
As previously stated, the primary goal behind the opening of NTB is not merely
to deliver financial profits from store operations. It is part of a long-term strategic
objective to create and amplify the brand heat, driving the entire business of Nike China
before, during, and after the Olympic Games. The close and direct connection between
NTB and the company’s business goal in China was clearly articulated by Charlie
Denson, Brand President, Nike, Inc, at the Beijing store opening on August 7, 2007. Mr.
Denson said, “As we head toward the Olympics, we’re extending our brand leadership,
deepening our consumer relationships and building what we expect soon to be a
$1 billion256 business and Nike’s second-largest market in the world” 257. The leadership
strategically envisioned and specifically connected the business goal in China to the NTB.
Given that China in 2007 was an emerging market, the company initially invested
cautiously, with initial store size and investment that was smaller than that of other
NikeTowns. The lease term was only five years, reflecting the intention to “test” the
256 Nike China has grown at a phenomenal face: in 1994 Nike China was an $8 million enterprise; by 2002 sales had reached $100 million. In 2008, achieved $1 billion revenues in 2008. Source: the company’s website. 257 Charlie Denson, Brand President, Nike, Inc, at Beijing store opening, August 7, 2007. Source: Company site.

Real Options Methodology in Sportswear Retail Investment Valuation Case Studies
178
market. We assumed that at the end of the “testing” period, the option to renew would be
exercised and another **-year lease term. However, Nike actually took action to increase
its Stage I investment prior to the expiration of the initial lease term. Rather than wait for
the end of the “testing period”, the company invested in Stage II by committing
additional investment to increase the store size within the year after the NTB opened.
The decision to invest in Stage II prior to the expiration of the first lease term can
be explained from the NPV (and RO) analysis. Unlike the other Nike Town investments
examined in this study, the initial NPV analysis of Nike Town Beijing was positive,
indicating that the investment will add value to the company as a “stand alone” entity.
After Stage I was implemented, the result was better than expected by the initial cash
flow projections, leading to the early Stage II investment commitment with more
confidence of success. Our RO application, if applied to the initial internal NPV
estimates would have enhanced the confidence of making the Stage I and Stage II
investment as it would have accounted for more than the “stand alone” value added from
the NPV analyses.
The Beijing case also demonstrates the implementation of an alternative sigma
from a local comparative company. In the previous three cases, we use the standard
deviation of Nike stock to as sigma in the three markets (UK, France, and US) that have
similar market characteristics and high market correlation. China, at the moment is a
distinctive market compared to the other Western markets. Its ample labor resources have
invited many foreigner investments and its gigantic market demand has attracted global
brands. As analyzed in the previous section, a company operating in the fast growing

Real Options Methodology in Sportswear Retail Investment Valuation Case Studies
179
China would experience higher variances in operating cash flows than a company
operating in the U.S. In our judgment, it is more appropriate to use an alternative sigma
for our application of real options to NikeTown Beijing. We selected Li Ning stock
returns as the underlying asset. Li Ning stock returns reflect the Chinese sportswear
industry more than the global brands (Nike and/or Addidas) operating in China. The
company’s aggressive growth and expansion are reflective of its life cycle that also
coincides with the growth spurt of the Chinese economy. We are fairly confident that the
result embedded option values generally mirrors the external benefits of the Nike Town
investment.
Since its opening on August 3, 2007, NTB has been performing well, better than
the initial estimates.258 The store has been well received259 and has been utilized in many
ways other than selling Nike products such as hosting running events and world famous
sports celebrities’ visits. Nike Town Beijing signals that Nike is committed long term to
not only producing in China, but distributing through retail channels that are typical of
the companies present operations in the U.S. and European countries.
* WACC **% used in this study is for all investment projects, regardless of country risk,
currency risk, variations of general retail sales, and sports retail sales in particular,
different economic cycles compared to home country. This figure may have to be re-
examined since it is project risk that dominates the risk measurement in the investment
evaluation rather than home country financing cost.
258 For business confidentiality, the actual results cannot be disclosed in this paper. 259 Source: from industry general observation and media response.

Real Options Methodology in Sportswear Retail Investment Valuation Discussion
180
6 Discussion
6.1 Overview
To test the proposition that the Real Options concept complements the
traditional NPV analysis, this study examined four Nike flagship stores located in
dispersed geographic markets. The application of Real Options methodology to
investment decision-making enables detection of value-adding aspects of a
company’s real investments that the NPV approach does not normally capture.
Real Options are not traded and thus assertions of value creation in excess
of those identified by the NPV analysis cannot be directly tested. Following Jensen,
we adopted a deductive approach to hypothesis testing to account for the difficulty
in directly testing Real Options. Using the company’s internal, proprietary, and
historical investment analysis data to illustrate Real Options applications, we find
that the results of our study of the four cases of Nike’s investments in NikeTowns
London, Paris, Chicago, and Beijing are not inconsistent with the predictions of the
Real Options concept and, therefore, do not invalidate our stated hypothesis. These
case studies serve as evidence in the continuing test of the Real Options concept.
This is summarized in Table 26.

Real Options Methodology in Sportswear Retail Investment Valuation Discussion
181
Table 26: NikeTown Case Study Results Summary
Store Open Date
RO Type NPV RO Scenario I
RO Scenario II
NPV 2 RO 2 Value
London 07/17/1999 Expansion -$4,468 $6,072 2nd Sigma N/A $7,220
Paris 11/25/2005 Growth -$2.320 $2,129 N/A N/A N/A
Chicago 07/02/1992 Delay $2,531 $3,871 No Delay $7,349 $19,493
Beijing 08/01/2007 Stage $1,612 $2,062 2nd Stage $1,254 $1,702
Investments in NikeTowns are well-suited for RO testing because
NikeTowns were not envisioned as separate profit centers by the company. Rather,
the flagship stores were meant to creatively showcase the best of the company’s
innovative products and to generate excitement and emotional ties between the
brand and store visitors and area consumers. NikeTowns promote the brand and the
company’s array of products in dramatic and distinctive ways. In contrast to the
company’s other retail shops, which are envisioned as standalone profit centers that
are properly evaluated in terms of sales of products on the premises, the value that
a flagship store creates for the company is more widespread. As has been
previously discussed, the halo effect and other strategic values generated by a
flagship store are not included in the cash flow directly generated by the particular
NikeTown being evaluated. From this perspective, the traditional incremental
investment analysis of NPV is limiting, and NPV is likely an inadequate tool by
itself to evaluate NikeTown investments. The tool does not fully fit the purpose of
the investment. If used, it must be supplemented to account for the positive side
effects that are not easily measured. The Real Options method can provide, at least

Real Options Methodology in Sportswear Retail Investment Valuation Discussion
182
partially, one measurement of the value created by a flagship store above and
beyond the revenues generated directly from the store premises. This is
demonstrated in the SRI by the results of the four case studies. Two of the four
cases examined had negative NPV’s, and one had a small positive NPV. However,
these cases all have positive RO values. When these values are considered in the
decision making, the investments became more attractive. In NTC’s case, had the
difference in RO due to the delay being evaluated, the impact of delay is not only
from the financial aspect, but also from the strategic value such as contingent
business opportunity loss.
These results suggest that management might find benefit to including real
options analysis in future investment evaluations where it is intuitively obvious that
the beneficial effects extend beyond the marginal investment in question, as is the
case with the NikeTown flagship stores.
6.2 Interpretation of the Results
6.2.1 Sportswear retail industry.
We first take a step back to evaluate why RO may be applied effectively in SRI
investment. We conclude that the SRI has characteristics similar to those commonly seen
in HI/HRR industries, namely high risk on investments with volatility influenced by
multiple sources. These sources include rapid changes in consumer consumption
preferences, employment situations, and disposable income levels.

Real Options Methodology in Sportswear Retail Investment Valuation Discussion
183
The sports industry is a multidimensional mega-business, one segment of which is
sportswear. The extreme loyalty of sports fans to their teams transfers to the teams’
sportswear providers, which in turn transforms into loyalty to the brand. Similarly, the
success or failure, or glory or disgrace, of individual sports stars, who endorse one
sportswear brand or another, can make a difference of millions of dollars in sales of
associated apparel. To sports fans, sportswear has become a declaration of support for
their team and its actual or potential achievements. Further, sportswear has also become
casual wear and a preferred means of consumers’ individual expression.
The sportswear retail industry is a relatively new industry that first separated from
general apparel and footwear and emerged as a new sector in the general retail industry.
This industry in fact evolved as Nike grew: the company literally created a new industry
and this industry, in turn, shaped Nike. Since its emergence, the sportswear retail industry
has been evolving rapidly. Its distinguishing characteristics include a close linkage to
sports phenomena, both sporting events and sports celebrities. This strong connection
introduces a much more volatile profitability pattern than that which is characteristic of
the general apparel or footwear industry. The return fluctuates dramatically upward and
downward in reaction to external events in the sports world.
6.2.2 Case studies.
In a sophisticated business marketplace, particularly in HI/HRR industries such as
the SRI, the inter-complexity & intra-complexity in the marketplace constitute a multi-
dimensional risk-reward relationship. The real return of strategic investments in such

Real Options Methodology in Sportswear Retail Investment Valuation Discussion
184
industries is comprised of multidimensional kinds of values, some of which are non-
financial. Such strategic benefits may be very hard to quantify. For instance, brand
equity is a key strategic value, but one that is very difficult to quantify by precise
financial numbers or to detect through standard capital budgeting methods. In the SRI,
one of the key channels for generating and expanding brand equity is the flagship store –
a primary venue and focal point for building and nurturing strong relationships with
consumers. Most flagship retail stores are located in mega-cities, where store profitability
is closely affected by and correlated to fluctuations in the macroeconomic environment.
In this study, we have examined four flagship stores located in widely dispersed
geographic markets where each is influenced by different global and local macro- and
micro-economic conditions such as consumer preferences and local currency and capital
market risks.
The case studies have common characteristics: all flagship stores are located in
pre-eminent international cities and all are strategically valuable to the company’s long
term value appreciation: they build brand equity, enhance brand value, and deepen
consumer relationships. While it is understood that these flagship stores have significant
strategic value to the company and the management has felt it right to make the
investments, there has not been any way to measure the accuracy of management’s
feeling about the rightness of the decisions or to quantify different types of strategic
values. This research suggests that RO can be used to capture some, if not all, of these
values.

Real Options Methodology in Sportswear Retail Investment Valuation Discussion
185
These four case studies represent four types of RO application: expansion, growth,
delays, and staging. The flagship stores in our study have negative or modest NPVs.
Using the same financial data and lease term, we derive positive RO values in all four
cases260. This suggests that RO captures certain embedded values not reflected by the
NPV method. In each case, we compared and analyzed the NPV and RO results. We
further demonstrated that these embedded values may be intangible in financial terms,
but the benefits are discernible strategically. After years of operations, these flagship
stores continue to deliver “strategic values” such as increasing brand awareness during
the Beijing Olympics, enhancing the Nike retail presentation in France and Europe, and
taking the lead in creating and developing methods for deepening consumer relationships
(NikeiD Studio261). These intangible contributions do increase the value of the firm, over
and above the financial returns specific to each store, in improved strategic return to the
firm as a whole.
These cases indicate that flagship store investments have embedded strategic
values, and that the intuition of the management of Nike regarding these investments is
correct.
260 Except in NTC where the investment is delayed. Although both RO with and without delay are positive, we note the difference of these two scenarios RO’s indicates the “opportunistic loss” to the company. 261 NikeiD, the web-based athletic shoe customization platform, greatly strengthens Nike’s leading position in the personalization market.

Real Options Methodology in Sportswear Retail Investment Valuation Discussion
186
6.2.3 The key variable in the model: sigma
Sigma is a measure of volatility that helps to capture or represent strategic value.
This study evaluated the use of RO analysis to supplement NPV in evaluating sportswear
retail store investments’ total benefits in terms of both financial returns and strategic
values. To determine the RO equation variable sigma, we explored three major
alternative proxies: the company’s stock price performance, the retail industry index
performance, and store sales performances.
We ran regressions to document the relationship between 64 quarters of Nike
sales and Nike stock prices. We ran regressions of other financial variables such as cash
flows and return on invested capital against the Nike stock price. The regression and
correlation analysis conducted using multiple observations in different time periods
generates a strong correlation. The results of the Nike stock price regression are the most
robust of the variables tested, providing us with confidence in our proposal that the
variance of the return on historical Nike stock price is an appropriate estimate for sigma.
Nike’s recent emphasis on “Direct to Consumer” investments262is reflective of, and
consistent with, its broad array of ongoing strategic investments. The company’s major
capital investment projects, such as opening new or renovating existing NikeTowns,
should correlate to the company’s overall stock performance.
262 According to Jeanne Jackson, President of Direct-to-Consumers, Nike, Inc., the “Direct-to-Consumer” program proposes to achieve the next phase of Nike brand growth through building capacity in the retail marketplace. The company plans to invest between $500 million and $600 million in the next few years until 2015, in stores and in infrastructure to support both company-owned and external wholesale/retail productivity and performance.

Real Options Methodology in Sportswear Retail Investment Valuation Discussion
187
6.3 Strategic Value Embedded in Strategic Investments
Values in addition to internal management projections have been detected by the
application of the RO method. Can these values be explained? In addition to the
contingent option to expand business or enter new business & markets, we propose to
explain incremental RO values in terms of synergistic and strategic values beneficial to
the company.
1) Synergistic benefits are mostly related to the brand, the company’s overall global
markets, and the mobility of global consumers. It is brand enhancement value.
Some consumers walk into NikeTowns and experience the “culture”, almost like
visiting a Nike museum. Whether they purchase anything during such visits or
not, the experience reinforces their brand awareness and the memory remains,
which may well trigger subsequent purchases as well as conversations with other
potential customers (word of mouth advertising). A visitor to Nike Town London
may not purchase in NTL, but may purchase when at home in Frankfurt,
Germany. One excellent example of the brand enhancement value attributed to
these flagship stores is their impact as three-dimensional dynamic advertisements.
The daily interaction of consumers in the stores with modern store features, latest
products, and services generates an incredible impact, creating brand impression
Real Options Methodology in Sportswear Retail Investment Valuation Discussion
188
known in retail marketing terms as “lease line.”263 This is equivalent to Nike’s
engagement in, and with, a live commercial advertisement, one in which the
consumer willingly and gladly participates.
2) Externality effects. These are generally associated with the upward and
downward spikes or impact from the market environment or specific events.
In the SRI, this could be triggered by the results from sports events, games,
or individual performances, or even the personal dramas of sports celebrities
(for example, Tiger Woods’ fall from grace). When sports events are
occurring and/or sports celebrities are performing well, these values are
positive and indeed generate a “halo effect”, which creates brand excitement
and builds brand equity. They are typically not included in the traditional
financial valuation (NPV) because it is almost impossible to quantify their
values, even though these values are widely acknowledged by management
as having a significant impact on both the brand and the company as a whole.
The NikeTowns’ “halo effect” also has a positive impact on Nike’s
distributors. NikeTowns attract shopping traffic in and to the area and elevate the
sportswear shopper conversion rate264. Initially, some local retailers of Nike
products feared that they would lose sales to NikeTowns and moved away from
263 “Lease line” is a retail marketing concept that indicates the presence of intangible values in certain investments. 264 A retailing term describing the percentage of walk-in customers that actually make purchases.
Real Options Methodology in Sportswear Retail Investment Valuation Discussion
189
the vicinity of NikeTowns, but when they recognized the benefits of NTL’s “halo
effect” they moved back to the area. “Halo effects” create synergistic values.
While managers agree that there is value beyond what is directly
attributed to the project as measured by NPV, it has been difficult to
measure the “halo effect” generated by NikeTowns. Consider the illustration
mentioned above. NikeTown visitors who are tourists might be hesitant to
make any purchase because of luggage space limitations. But the experience
in the NikeTown would likely to trigger a purchase later, when they return
home and/or venture online. If these consumers had seen only an
advertisement on TV or an Oxford street billboard instead of the in-store
experience at a NikeTown, would these have the same impact as the flagship
store experience? Measurement of the effect of the in-store experience on
subsequent purchases elsewhere is difficult to impossible to quantify
precisely.
When company-sponsored sports teams and company-sponsored
sports celebrities are performing poorly during major sports events, the
values generated are negative. This is considered a “hollow effect” and it
generates a negative brand image and devalues the brand. The risks
associated with teams’ and/or sports celebrities’ performance are
unavoidable and unpredictable. In any given day, sports event results are
difficult to precisely predict and, further, the conduct of individual sports
celebrities is even harder to foresee.

Real Options Methodology in Sportswear Retail Investment Valuation Discussion
190
Two recent examples impacting sales, from disappointing game
results or team performances are the University of Oregon’s 2009 Rose
Bowl loss to the University of Texas and its 2010 loss, in the final game of
the season, to the University of Arizona. As a consequence, the “Ducks
Celebration Collection” launch was cancelled and Rose Bowl related styles
were immediately put on sale. As for sports celebrities, the widely-
publicized disastrous events in the personal life of Tiger Woods, followed
by his subsequent disappointing performance in golf tournaments,
significantly devalued the Tiger Woods Golf apparel collection and greatly
damaged the brand image.
Another example of volatility and its impact on real option values
can be seen in the strategic values embedded in emerging markets. In the
case of NikeTown Beijing, the sports retail market is in a different life cycle
than the sports retail market in megacities of developed countries.
Strategically it behooves every multinational firm to have a presence in
China because of the market potential there. For sports retail multinationals
like Nike, it is a highly desirable to be an early entrant in that market and to
showcase on the retail “high street” of China’s capital city. The sports retail
market in China is characterized as high-growth and high volatility. This
volatility directly affects real option values. In our analysis of Nike Town
Beijing, we adjusted sigma to reflect the local market conditions to capture
these strategic and synergistic values.

Real Options Methodology in Sportswear Retail Investment Valuation Discussion
191
3) Contingent option values: Remodeling NTL provided an opportunity to
create and establish connections with customers in new ways. NikeiD, long
available on the Web, enables consumers to custom-design their own
athletic shoe. NikeiD strengthened Nike’s leading position in the
personalization market265 and enabled the company to engage directly with
customers over the Internet. Re-modeling NTL made it possible for Nike to
(re)introduce NikeiD on a face-to-face basis and generate brand heat and
loyalty with large numbers of global consumers, particularly during the
Olympic Games. In the NPV calculation, this strategic benefit is not
reflected in the incremental revenues generated from the NikeiD studio.
Three hundred meters down the road from the NTL location on
Oxford Street is the flagship store of one of Nike’s major competitors. With
three floors packed with products, it resembles a “normal” store more than a
unique destination. NTL, as a cultural destination, stands out among its
competitors on Oxford Street.
Contingent options create “preferential access”, meaning increased
ease and variability of execution for the company in a market or area. The
authentic store presentation and the premium consumer experience are
difficult for competitors to replicate. Preferential access changes the rules of
265 As of 2010, NikeiD sales approached $**. Jeanne Jackson, President Director-to-Consumer, Nike, Inc., Nike Analyst Meeting, May 5, 2010 stated, “in 1999 as consumers became enamored with e-commerce we were one of the first to recognize their desire for something personal and we launched.”

Real Options Methodology in Sportswear Retail Investment Valuation Discussion
192
the game and raises the bar for retailers. It also helps and prompts other
retailers to sell Nike products. These incremental sales, driven by NTL,
belong to the other retailers. Although those retail partner sales generate
value for Nike, that value is not captured or reflected by NPV methodology.
4) Impact on Resource Allocation Decisions: Every company’s leadership team
is constantly presented with investment choices, and Nike is no exception.
Resources are finite, and management must select from among competing
investment alternatives. NPV is often helpful in making such resource
allocation decisions, particularly for decisions about investments with little
or no strategic value. For investment alternatives with perceived strategic
value, NPV remains a useful tool for evaluating financial returns from the
investment. There are, however, some occasions in which NPV is of limited
utility. For example, competing alternatives may have similar NPV’s, or an
investment opportunity may have a negative NPV. Without RO,
management must rely on its “gut feeling” to make its decision. In both
cases, however, RO can offer management a tool that offers guidance that
NPV cannot: it can provide a quantification of the strategic values
associated with the competing investments, supplementing the financial
returns quantified by NPV.
5) Shareholder value return. Guidance regarding how much value investments
such as this can bring to the shareholders is extremely valuable to
management. As we have seen, the significant investment in NTL

Real Options Methodology in Sportswear Retail Investment Valuation Discussion
193
renovation may generate a negative NPV; however, the strategic value of
having a world-class flagship store in an Olympic Games venue goes beyond
the investment-specific financial returns measured by NPV. Mark Parker
pointed out the company’s growth strategy, saying “The third fuel for our
portfolio is the amazing experiences that we create whether it's for
consumers, for media, for athletes and hopefully investors. We did it in the
Forbidden City when we launched our Beijing Olympics product…and with
our World Cup innovation summit just recently in London.”
6) Learning – Examination of historical experience of Niketown investments:
The knowledge and expertise gained in remodeling NikeTowns can be
leveraged in similar investments (such as remodeling NT Paris and/or
opening a new NT in Brasilia for the 2016 Olympics).

Real Options Methodology in Sportswear Retail Investment Valuation Discussion
194
6.4 Significance of This Research
The primary significance of this research is to provide additional “field study”
evidence that the use of real option methodology to complement traditional NPV
improves investment valuation in High Investment/High Risk-Reward (HI/HRR)
industries, in this case the Sportswear Retail Industry. This study first reviewed the RO
literature presented by academics and practitioners. Next, the dissertation highlighted
industry studies that have applied the RO methodology, described the newly-evolved
Sportswear Retail Industry (SRI), and concluded that the SRI has characteristics which
are suitable for the application of RO methodology. The research continued by presenting
four in-depth actual case studies of investments in Nike Towns and concluded that RO
should be used together with NPV in the valuation of HI/HRR industry investments.
Further, it recommends that RO methodology should become part of the standard capital
budgeting analysis in corporate finance, at least in HI/HRR industries.
Although RO has not yet been widely accepted by the majority of finance
academicians and practitioners, the results of the present study cases suggest that the RO
methodology, to avoid possible misallocation of resources, should and will become more
acceptable and necessary. In part, this is due to the increasing pace of technological
advancement, globalization, and competition that contributes to increased growth and
volatility. The resistance to, or at least the current failure to embrace, the use of RO in
general corporate finance is understandable, and is similar to the resistance to NPV
methodology, the current gold standard in corporate financial valuation, when it was
initially introduced as a capital investment valuation method. The pioneering work of
Real Options Methodology in Sportswear Retail Investment Valuation Discussion
195
Professor Ezra Solomon, introducing concepts of modern financial management
(including the controversial topics of market based cost of capital and net present worth)
in the late 1950s and early 1960s, was also met with initial skepticism266. The integration
of RO methodology to supplement NPV can be expected to have a similar gestation
period. Meanwhile, more evidence of successful implementation and other direct or
indirect empirical evidence is needed to allay the concerns of skeptics.
The real investments of the sports apparel industry’s leading multinational
corporation, Nike, Inc., in its flagship stores, upholds our hypothesis that there are real
option values not captured by the application of the NPV methodology. We are pleased to
make a modest contribution by demonstrating how RO complements NPV. By applying
the RO methodology to the four Nike Town investment cases, we also learned about the
corporate vision of its co-founder, studied a segment of the company’s investment history
regarding Nike Towns, and helped to demystify the growth of a dynamic company that
founded the sports retail industry.
The fact that the co-founder and leader of Nike, Mr. Philip Knight served as an
external advisor to this study demonstrates that leadership continually seeks new ways to
evaluate investments in order to improve resource allocation. Mr. Knight’s interest in the
266 Although acceptance of the NPV method was initially hesitant, by 1978 a survey of 424 firms with plant assets greater than $200 million revealed that 86% of the firms sampled used some form of discounted cash flow method, demonstrating the methodology achieved widespread acceptance despite the early skepticism. Lawrence D. Schall, Gary L. Sundem and William R. Geijsbeek, “Survey and Analysis of Capital Budgeting Methods”, Journal of Finance, March 1978.

Real Options Methodology in Sportswear Retail Investment Valuation Discussion
196
study suggests that the RO approach may eventually be integrated as a supplementary
analytical tool by Nike and other corporations.
Perhaps the most important contribution of this study is to reinforce with case
study illustrations the counterintuitive inverse relationship between the discount rate used
and the real option value. It is axiomatic that risk and reward are positively correlated in
the business world. A high-return investment normally comes with correspondingly high
risks. NPV values, however, are inversely related to the degree of risk posed by a
potential investment because the risk is represented in the form of a higher discount rate,
the weighted cost of capital (WACC), or alternatively using a form of risk-adjusted cash
flow projections. In the Real Option methodology, on the other hand, the degree of
investment risk and the RO values move in the same direction. The higher the risk,
measured by the variance of the appropriately selected underlying asset’s rate of return,
the greater the value of the real option, and if this real option value is taken into account,
it somewhat mitigates the risk adjustments that tend to reduce NPV.
Managers take calculated risks by undertaking investments and increased
operating costs because they believe that the future rewards are worthwhile. These can be
brand equity building investments and/or actions taken to strengthen relationships with
consumers. In some cases, these activities lead to short term profitability that is directly
attributable to the investment. In other cases, these activities generate value in ways that
are less directly traceable to these investments such as synergistic and strategic returns
that add to the immediate and directly traceable financial returns. As demonstrated in this
study, NPV alone cannot be expected to capture all these values.

Real Options Methodology in Sportswear Retail Investment Valuation Discussion
197
6.5 Potential Limitations (Threats to Validity)
6.5.1 Conceptual limitations.
Skeptics of the real options approach may argue that the embedded call option
value is a way to justify poor investments. Reasons given by these skeptics would be
based on (a) the conceptual application of financial option pricing theory to real asset
investment, and, (b) the potential limitations of obtaining and accurately measuring the
input variables. Thus, even if one skirts the conceptual limitation, it may be suggested
that the real option approach can be easily manipulated to support the desired outcomes
or conclusions of the real investment decision-maker involved. Grounding all
calculations firmly in the data, and ensuring that rigorous quantitative methods of
regression and correlation are followed by financial analysts is the best insurance against
such manipulation.
BSOPM was originally created to derive a theoretical value for financial options.
Traders armed with the theoretical option value could exercise arbitrage in the market,
purchasing options that the market undervalues and selling options that the market
overvalues. However, when we apply this model to real assets, the underlying asset is
not tradable, unlike listed common stock, and the option is also not tradable unlike listed
financial options.267 Arbitrage is therefore not possible. It could be argued that tradable
267 Damodaran, Aswath, Damodaran on Valuation: Security Analysis for Investment and Corporate Finance, 2nd Edition (NY, Wiley, 2006), especially Chapter 12. Also see, Ronald Fink, “Reality Check for Real Options”, CFO Magazine, September 13, 2001.

Real Options Methodology in Sportswear Retail Investment Valuation Discussion
198
assets cannot be appropriately used as proxies for the non-tradable real asset investment
in real option applications. However, the widespread acceptance of the RO method in a
number of HI/HRR industries, and the publication of numerous studies exploring and
expanding RO methodology, indicates that the method has validity and utility.
Further limitations may be associated with the six input variables. The S and X
variables are the present value estimates of cash inflows and outflows from the real
investment project, respectively. If there are estimation errors for S and X, these errors
will also appear in the associated NPV calculation, so the estimation errors are not unique
or endemic to real options only. There is not as much of a concern regarding the variables
r, the risk free rate, and t, the time period of the investment. The dividend payout
variable delta, which we have made equivalent to the cost of delay, 1/n, in the real
options application, also seems plausible. The variable sigma, however, is the variable of
greatest concern and interest. Sigma in the financial option application is the standard
deviation of the rate of return of the underlying financial asset. In our application, we
used the standard deviation of rate of return of Nike stock price as the proxy for the non-
traded asset investment in Nike Towns for three of the four cases, and the standard
deviation of the rate of return of the stock price of the local Chinese competitor, Li Ning,
as the proxy. The resulting call option values are very sensitive to the size of sigma. One
can rationalize the use of specific proxies to justify larger or smaller embedded real
option values in investment projects. This introduces subjectivity. In this study, we
addressed this subjectivity by running sets of regression and correlation to test the
company’s stock price and the local investment markets. The risk exposure and

Real Options Methodology in Sportswear Retail Investment Valuation Discussion
199
opportunity potential are different in mature markets such as Chicago, London and Paris
than in expanding markets such as Beijing. Our regression and correlation testing
supports our use of two different sigmas, one in London, Paris and Chicago and one in
Beijing. This minimizes the bias introduced by the use of a sigma value appropriate to
mature markets that is less suitable for developing markets.
6.5.2 Data limitation.
Data from the case studies are proprietary and from only one company. We
cannot generalize from our study that flagship stores of competitors in the SRI industry
would have similar (or any) embedded value. However, since Nike is the SRI leader, and
the industry evolved as Nike grew, it seems plausible that if RO analysis is applied to
flagship stores of other companies in the SRI similar results will be obtained. We also
anticipate that RO analysis could also be usefully applied to flagship store investment
analysis of other industries, for example, branded clothing stores and computer stores,
there will be embedded real option values present. This is because such investments
typically are not intended to generate only financial returns, but are intended to increase
overall brand equity through embedded strategic options.
This study addressed the foregoing data limitations by examining four different
flagship stores in four major geographical markets with four different sets of strategic
conditions and four different option types. The variation in conditions and situations
provided by this study offers more insight and confidence than a study limited to only
one store could offer.

Real Options Methodology in Sportswear Retail Investment Valuation Discussion
200
6.5.3 Practical considerations.
Given the above conceptual limitations and the risk of possible misuse of the RO
concept, management might consider implementing a process requiring investment
proposals to satisfy several essential parameters or tests when using real options in
addition to the traditional NPV. In our view, any well-reasoned attempt to quantitatively
estimate the value of embedded options is preferable to having no estimates. Qualitative
judgments, though a necessary part of the analytical process, are insufficient on their own.
For instance, to add internal discipline to the investment review process, when strategic
and/or synergistic values are given as rationale to invest in a project that has a negative
NPV, the proposal could be required to demonstrate that there is embedded option value
in the project. Requiring quantitative justification in addition to qualitative reasoning
would mean that internal analysts would have to personally learn the real option concept
and be able to provide reasons for selecting appropriate proxies for the variables to
determine the real option value. As previously mentioned, institutional resistance to any
new methodology can be expected, and management must be diligent advocates to ensure
that RO is ultimately accepted by financial analysts.
Management may further require qualitative and quantitative information to
determine if the strategic advantages advocated are temporary competitive advantages or
sustaining competitive advantages. An attempt to secure a first-mover advantage in a
retail market for a limited time would be likely to generate only a temporary competitive
advantage and a modest RO value, whereas an initiative aimed at not only securing first-

Real Options Methodology in Sportswear Retail Investment Valuation Discussion
201
mover advantage but also leveraging that advantage into sustained market share
leadership would generate a much larger RO.
6.6 Future Research
6.6.1 Complementary valuation method in corporate finance.
When academia initially introduced NPV, it was met with great resistance,
because traditional analyses used accounting investment return like ROI (return on
investment) or ROIC (return on invested capital). Today, the NPV method is the most
common tool used by firms. As more supporting RO evidence appears in the academic
and practitioner literature, RO will be gradually make its way into investment analysis to
complement the NPV method.
The most challenging research, however, is to develop ways to empirically
validate the real option value, as financial option prices are validated. We expect the
evidence from case studies and empirical studies to eventually overcome resistance to the
viability of the NPV + RO approach.
6.6.2 Exploring RO application to abandonment option.
The rationale behind the abandonment option is that a firm could scale back or
curtail an existing project if that project is not earning a sufficient return. Ronald Fink
(2001) argues that companies may not have the built-in internal discipline to discard,
abandon, or close down a project in a timely fashion when the initial investment that
generated the real option values have not been realized. In terms of the options concept,

Real Options Methodology in Sportswear Retail Investment Valuation Discussion
202
there is no expiration date, and the project’s potential downside risk is not zero. An
interesting further study would be to test the application of RO to evaluate potential
abandonment cases such as closing existing non-profitable investments. It is anticipated
that the RO “put” formula would prove to be useful in such analyses.
6.6.3 Other potential future research.
It is anticipated that future research will demonstrate that the method can also be
applied to the retail industry in general, not only to sportswear. Real Options can be
expected to generate additional research in a number of other areas, including the
determination of whether RO can be applied in situations where investments are expected
to have short-term profitability but no or even negative long-term strategic benefits to the
firm's value. Another potential research avenue is the determination of whether RO value
can be broken down into strategic value propositions such as brand development,
consumer experience elevation, and/or customer segmentation enhancement.
Further potential areas of RO application include the practice of paying premiums
above market price -- and sometimes exceedingly high premiums -- to acquire controlling
interests in companies. Investors, hedge funds, and raiders may use calculated real option
values to calculate over-market bids. For example, at the time of this dissertation the
hostile bid for Mentor Graphics Inc. by investor/raider Carl Icahn suggests the research
question about the valuation perspective of such investors and whether or not a real
options perspective would be useful. Another area for further research involves leases
Real Options Methodology in Sportswear Retail Investment Valuation Discussion
203
with options to buy real assets: the pricing of the lease that includes an option to buy
may be an area to investigate and apply real option pricing.
The challenge in real asset investment valuation is to assess both financial and
strategic returns. NPV’s primary purpose is to capture the financial returns. The RO
approach takes historical volatility measures and generates a value that investors should
consider as reflecting at least part of the embedded intangible values embedded that have
some probability of generating financial and/or strategic values in the future.
Our conclusion is that the Real Options method effectively supplements NPV in
valuing investments with embedded strategic values associate with externality effects,
contingent option values, and / or synergistic benefits.

Real Options Methodology in Sportswear Retail Investment Valuation References
204
References
Abel, A. B., A. Dixit, et al. (1995). "Options, the Value of Capital, and Investment."
NBER Working Paper.
Alimov, A. (2007). Innovations, Real Options, Risk and Return: Evidence from the
Pharmaceutical and Biotechnology Industries, University of Oregon.
Amram, M. and N. Kulatilaka (1999). Real options, Harvard Business School Press.
Amram, M. and N. Kulatilaka (1999). "Disciplined Decisions: Aligning Strategy with the
Financial Markets." Harvard Business Review 77: 95-104.
Amram, M. and N. Kulatilaka (1999). Real Options: Managing Strategic Investment in an
Uncertain World, Harvard Business School Press.
Amram, M. and N. Kulatilaka (1999). "Uncertainty: The New Rules for Strategy."
Journal of Business Strategy 20(3): 25–32.
Amram, M. and N. Kulatilaka (2001). "Real Options: Managing Strategic Investment in
an Uncertain World”, Harvard Business School Press. Also published by Oxford
University Press.

Real Options Methodology in Sportswear Retail Investment Valuation References
205
Amram, M., F. Li, et al. (2006). "How Kimberly-Clark Uses Real Options." Journal of
Applied Corporate Finance 18(2): 40-47.
Angelis, D. (2000). "Capturing the Option Value of RD." Research-Technology
Management 43(4): 31-34.
Armstrong, M., A. Galli, et al. (2004). "Incorporating technical uncertainty in real option
valuation of oil projects." Journal of Petroleum Science and Engineering 44(1-2): 67-82.
Baeyens, K. (2006). "Essays on the Determinants and Long-term Effects of
Entrepreneurial Financing Choices." Ghent Unversity, Belgium.
Baghai, M., S. Coley, et al. (1996). "Staircases to growth." The McKinsey Quarterly 4:
54-61.
Balasubramanian, P., N. Kulatilaka, et al. (2000). "Managing information technology
investments using a real-options approach." Journal of Strategic Information Systems
9(1): 39-62.
Basu, S. (2007). Corporate Venture Capital: Towards Understanding Who Does It, Why
and How, University of Washington.

Real Options Methodology in Sportswear Retail Investment Valuation References
206
Benaroch, M. and R. J. Kauffman (1999). "A Case for Using Real Options Pricing
Analysis to Evaluate Information Technology Project Investments." Information Systems
Research 10: 70-86.
Benninga, S. and E. Tolkowsky (2002). "Real Options—An Introduction and an
Application to R&D Valuation." The Engineering Economist 47(2): 151-168.
Black, F. and M. Scholes (1973). "The Pricing of Options and Corporate Liabilities."
Journal of Political Economy 81(3): 637.
Blake, G. (1999). "Ten ‘biggest’ Problems Technology Leaders Face." Research
Technology Management 42(6): 13–14.
Boer, F. (2000). "Valuation of Technology Using" Real Options.”" Research-Technology
Management 43(4): 26-30.
Boer, F. (2002). The Real Options Solution: Finding Total Value in a High-Risk World,
Wiley.
Boer, F. (2002). "Real Options: The IT Investment Risk-Buster." Optimize Magazine,
July 1.

Real Options Methodology in Sportswear Retail Investment Valuation References
207
Boquist, J., T. Milbourn, et al. (1998). "How do you win the capital allocation game."
Sloan Management Review 39(2): 59-71.
Bouteiller, C. (2000). The evaluation of intangibles: advocating for an option based
approach.
Boyle, P. (1977). "Options: A Monte Carlo Approach." Journal of Financial Economics
4(3): 323-338.
Brabazon, T. (1999). "Real Options-Valuing flexibility in capital investment decisions:
Do you feel uncomfortable when you are asked to appraise an investment in IT, in
research and development, or in brand development?" Accountancy Ireland 31: 16-18.
Brennan, M. and E. Schwartz (1985). "Evaluating Natural Resource Investments."
Journal of Business 58(2): 135.
Brennan, M. and L. Trigeorgis (2000). Project Flexibility, Agency, and Competition:
New Developments in the Theory and Application of Real Options, Oxford University
Press.

Real Options Methodology in Sportswear Retail Investment Valuation References
208
Brennan, M. J. and E. S. Schwartz (1976). "The pricing of equity-linked life insurance
policies with an asset value guarantee." Journal of Financial Economics 3(3): 195–214.
Brennan, M. J. and E. S. Schwartz (1977). "The valuation of American put options."
Journal of Finance 32(2): 449-462.
Brennan, M. J. and E. S. Schwartz (1978). "Finite Difference Methods and Jump
Processes Arising in the Pricing of Contingent Claims: A Synthesis." Journal of Financial
and Quantitative Analysis 13(3): 461-474.
Brennan, M. J. and E. S. Schwartz (1979). "A Continuous Time Approach to the Pricing
of Bonds." Journal of Banking and Finance 3(2): 133-155.
Brennan, M. J. and E. S. Schwartz (1982). "An equilibrium model of bond pricing and a
test of market efficiency." Journal of Financial and Quantitative Analysis 17(3): 301-329.
Brennan, M. J. and E. S. Schwartz (1985). "Evaluating Natural Resource Investments."
Journal of Business 58(2): 135.
Brennan, M. J. and E. S. Schwartz, et al. (1991). "Analyzing Convertible Bonds."
Proceedings Issue 15(4).

Real Options Methodology in Sportswear Retail Investment Valuation References
209
Brennan, M. J., E. S. Schwartz, et al. (1997). "Strategic asset allocation." Journal of
Economic Dynamics and Control 21(8-9): 1377-1403.
Brennan, M. J. and L. Trigeorgis (2000). "Real Options: Development and New
Contributions." Project Flexibility, Agency, and Competition 11.
Brennan M, and Trigeorgis (1998), Infrastructure and Strategic Options, Oxford
University Press, New York.
Brennan M, and Trigeorgis L (1999), Project Flexibility, Agency, and Competition: New
Developments in the Theory and Applications of Real Options. Oxford University Press,
New York.
Brounen, de Jong & Koedjik (2001), “Management Corporate Finance Decision
Making—Corporate Finance in Europe: Confronting Theory with Practice”, Financial
Management Winter 2001.
Bulan, L. T., C. J. Mayer, et al. (2008). "Irreversible Investment, Real Options, and
Competition: Evidence from Real Estate Development." Journal of Urban Economics.
Real Options Methodology in Sportswear Retail Investment Valuation References
210
Campbell, J. A. (2001). "Identifying an optimal start-up date for information technology
projects: a real options approach." Management of Engineering and Technology, 2001.
PICMET ’01, Vol. 1: 37.
Carr, P., R. Jarrow, et al. (1992). "Alternative Characterizations of American Put Options”
Mathematical Finance 2(2): 87-106.
Carter, J., M. Dijk, et al. (1996). "Capital Investment: How Not to Build the Titanic." The
McKinsey Quarterly(4): 147-148.
Casassus, J. and P. Collin-Dufresne (2003), Maximal affine model of convenience yields
implied from interest rates and commodity futures, Tech. report, Carnegie Mellon
University, Preprint.
Casassus, J. and P. Collin-Dufresne (2005). "Stochastic Convenience Yield Implied from
Commodity Futures and Interest Rates." The Journal of Finance 60(5): 2283-2331.
Cassimon, D. and P. J. Engelen (2001). "A Real Option Approach to Valuing
Pharmaceutical Investment and Firms." Value in Health 4(6): 428.

Real Options Methodology in Sportswear Retail Investment Valuation References
211
Cassimon, D., P. J. Engelen, et al. (2004). "The valuation of a NDA using a 6-fold
compound option." Research Policy 33(1): 41-51.
Chan, S., J. Martin, et al. (1990). "Corporate Research and Development Expenditures
and Share Value." Journal of Financial Economics 26(2): 255-276.
Childs, P. D., T. J. Riddiough, et al. (1996). "Mixed Uses and the Redevelopment
Option." Real Estate Economics 24(3): 317-339.
Childs, P. D. and A. J. Triantis (1999). "Dynamic R&D Investment Policies."
Management Science 45(10): 1359-1377.
Cho, H. (2007). Valuing Retail Shopping Center Lease Contracts Incorporating Inter-
store Externality Effects: A Real Option Approach, University of Wisconsin--Madison.
Cobb, B. and J. Charnes (2004). "Real Options Volatility Estimation with Correlated
Inputs." The Engineering Economist 49(2): 119-137.
Copeland, T. and V. Antikarov (2001). "Real Options-A Practitioner's Guide”, Texere
LLC, New York.

Real Options Methodology in Sportswear Retail Investment Valuation References
212
Copeland, T. and P. Keenan (1998). "How Much is Flexibility Worth?" The McKinsey
Quarterly 2(1998): 38-49.
Copeland, T. and P. Keenan (1998). "Making Real Options Real." The McKinsey
Quarterly no. 3: 128–41.
Copeland, T. and P. Tufano (2004). "A Real-World Way to Manage Real Options."
Harvard Business Review 82(3).
Copeland, T. E. (2002). "What Do Practitioners Want?" Journal of Applied Finance 12(1):
5-12.
Cortazar, G. and J. Casassus (1998). "Optimal Timing of a Mine Expansion:
Implementing a Real Options Model." Quarterly Review of Economics and Finance 38:
755-769.
Cortazar, G. and E. Schwartz (1993). "A Compound Option Model of Production and
Intermediate Inventories." Journal of Business 66(4): 517.

Real Options Methodology in Sportswear Retail Investment Valuation References
213
Cortazar, G., E. S. Schwartz, et al. (2001). "Optimal exploration investments under price
and geological-technical uncertainty: a real options model." R&D Management 31(2):
181-189.
Cortazar, G., E. S. Schwartz, et al. (1998). "Evaluating environmental investments: A real
options approach." Management science 44(8): 1059-1070.
Damodaran, Aswath (2000). "The Promise of Real Options" Journal of Applied
Corporate Finance 13(2): 29-44.
Damodaran, Aswath (2005), “The Promise and Peril of Real Options.” NYU Working
Paper No. S-DRP-05-02.
Davis, G. (1998). "Estimating Volatility and Dividend Yield When Valuing Real Options
to Invest or Abandon." Quarterly Review of Economics and Finance 38: 725-754.
Davis, G. (2002). "The Impact of Volatility on Firms Holding Growth Options." The
Engineering Economist 47(2): 213-231.
Davis, G. A. (1998). "Estimating Volatility and Dividend Yield When Valuing Real
Options to Invest or Abandon." Quarterly Review of Economics and Finance38: 725-754.

Real Options Methodology in Sportswear Retail Investment Valuation References
214
Dubofsky, David A., and Thomas W. Miller, Jr. (2002). Derivatives: Valuation and Risk
Management, Oxford University Press, New York, NY.
Dillon, R. and J. Owers (1997). "EVA as a Financial Metric: Attributes, Utilization, and
Relationship to NPV." Financial Practice and Education 7(1): 32–40.
Dixit, A. and R. Pindyck (1995). "The Options Approach to Capital Investment,.”
Harvard Business Review 73(3): 105-116.
Dixit, A. K. and R. S. Pindyck (1994). Investment under uncertainty, Princeton
University Press Princeton, NJ.
Dixit, A. K. and R. S. Pindyck (1997). Expandability, Reversibility, and Optimal capacity
choice. Academic paper.
Doukas, J. and L. Switzer (1992). "The stock market’s valuation of R&D spending and
market concentration." Journal of Economics and Business 44(2): 95-114.
Eisenhardt, K. M., A. Etzioni, et al. (1985). "Strategy as Strategic Decision Making."
Theory and Decision 18(2).
Real Options Methodology in Sportswear Retail Investment Valuation References
215
Engelen, P. J. and D. Cassimon (1999). "The valuation and financing of high-risk startup
ventures: an option perspective matching real and financial options." Business &
economics for the 21st century”, Business & Economics Society International, Worcester:
345-355.
Fama, E. F. (1996). "Discounting Under Uncertainty." Journal of Business 69(4): 415.
Faulkner, T. W. and R. (1996). "Applying 'Options Thinking' To R&D Valuation: Used
properly, options pricing can identify important sources of value that are missed by the
traditional DCF approach." Research Technology Management 39: 50-56.
Faulkner, T. W. (1996). "Options pricing theory and strategic thinking: Literature review
and discussion." report (version 3.3), Eastman Kodak Company.
Figlewski, S. (1989). "Options Arbitrage in Imperfect Markets." Journal of Finance 44(5):
1289–1311.
Foster, R., L. Linden, et al. (1985). "Improving the return on R&D." Research
Management 28(1): 12-17.

Real Options Methodology in Sportswear Retail Investment Valuation References
216
Glasserman, P. and J. Staum (2001). "Conditioning on One-Step Survival for Barrier
Option Simulations." Operations Research 49(6): 923-937.
Godinho, P. (2006). "Monte Carlo Estimation of Project Volatility for Real Options
Analysis." Journal of Applied Finance 16(1): 15-30.
Greden and Glicksman (2004), Options Valuation of Architectural Flexibility: A Case
Study of the Option to Convert to Office Space, conference paper.
Grinyer, J. and M. Walker (1990). "Deprival Value Accounting Rates of Return."
Economic Journal 100(3): 918–22.
Harmantzis, F. and T. V. Praveen (2004). Real Options Analysis for GPRS Network with
Wi-Fi Integration, 31 st Annual Conference of the Northeast Business & Economics
Association, New York , NY.
Harmantzis, F. and V. P. Tanguturi (2004). Delay in the Expansion from 2.5 G to 3G
Wireless Networks: A Real Options Approach, International Telecommunications
Society 15th Biennial Conference , Berlin , Germany.

Real Options Methodology in Sportswear Retail Investment Valuation References
217
Harmantzis, F. C. and V. P. Tanguturi (2007). "Investment decisions in the wireless
industry applying real options." Telecommunications Policy 31(2): 107-123.
Hartmann, M. and A. Hassan (2006). "Application of real options analysis for
pharmaceutical R&D project valuation—Empirical results from a survey." Research
Policy 35(3): 343-354.
Hayes, R. and W. Abernathy (2007). "Managing Our Way to Economic Decline."
Harvard Business Review 85(7/8): 138.
Hayes, R. and D. Garvin (1982). "Managing as if tomorrow mattered." Harvard Business
Review 60(3): 71-79.
Haylett, J. (2001). Calculating the Real Option Value of an Exploration Mineral Rights
Lease Using Monte Carlo Simulation, Texas A & M University.
Herath, H. and C. Park (1999). "Economic Analysis of R&D Projects: An Options
Approach." The Engineering Economist 44(1): 1-35.
Herath, H. and C. Park (2002). "Multi-State Capital Investment Opportunities as
Compound Real Options." The Engineering Economist 47(1): 1-27.

Real Options Methodology in Sportswear Retail Investment Valuation References
218
Herath, H. S. B. and C. S. Park (2001). "Real Options Valuation and its Relationship to
Bayesian Decision-Making Methods." The Engineering Economist 46(1): 1-32.
Hoe, S. (2006). Strategic Exercise of Options on Non-traded Assets and Stochastic
Volatility in an Incomplete Market: Indifference Pricing and Entropy Methods,
University of Texas, Arlington, Texas
Hull, J. (2005). Fundamentals of Futures and Options Markets. Upper Saddle River, NJ,
Pearson Prentice Hall.
Iversen, E. and A. Kaloudis (2006). "IP Valuation as a Tool to Sustain Innovation." The
Management of Intellectual Property. Edward Elgar: Aldershot.(forthcoming).
Jagannathan, R. (1984). "Call Options and the Risk of Underlying Securities." Journal of
Financial Economics 13(3): 425-434.
Jacquet, D. (2000). Managerial Implications of Implementing Real Options Thinking in
Resource Allocation. Working Paper 00 25, University of Ottawa.
Linstone, H.A., (1999). Decision Making for Technology Executives. Artech House,
Boston.

Real Options Methodology in Sportswear Retail Investment Valuation References
219
Kaplan, R. and D. Norton (1996). "Using the Balanced Scorecard as a Strategic
Management System." Harvard Business Review 74: 75-87.
Kaplan, R. and D. Norton (2001). The Strategy-Focused Organization: How Balanced
Scorecard Companies Thrive in the New Business Environment, Harvard Business
School Press.
Kaplan, R. and D. Norton (2001). "Transforming the Balanced Scorecard from
Performance Measurement to Strategic Management: Part I." Accounting Horizons 15(1):
87-104.
Kaplan, R. and D. Norton (2001). "Transforming the Balanced Scorecard from
Performance Measurement to Strategic Management: Part II." Accounting Horizons
15(2): 147-160.
Kaplan, R. and D. Norton (2005). "The Balanced Scorecard: Measures that Drive
Performance." Harvard Business Review 83(7): 172.
Kellogg, D. and J. Charnes (2000). "Real-Options Valuation for a Biotechnology
Company." Financial Analysts Journal 56(3): 76-84.

Real Options Methodology in Sportswear Retail Investment Valuation References
220
Kemna, A. G. Z. (1993). "Case Studies on Real Options." FinancialI Management 22:
259-259.
Kerssens-van Drongelen, I. and J. Bilderbeek (1999). "R&D performance measurement:
more than choosing a set of metrics." R&D Management 29(1): 35-46.
Kerssens-van Drongelen, I., B. Nixon, et al. (2000). "Performance measurement in
industrial R&D." International Journal of Management Reviews 2(2): 111-143.
Kogut, B. and N. Kulatilaka (2001). "Capabilities as Real Options." Organization Science
12(6): 744-758.
Kogut, B. and N. Kulatilaka (2004). "Real Options Pricing and Organizations: The
Contingent Risks of Extended Theoretical Domains." Academy of Management Review
29(1): 102-110.
Kulatilaka, N. (1993). "The Value of Flexibility: The Case of a Dual-Fuel Industrial
Steam Boiler." Financial Management 22(3): 271-280.

Real Options Methodology in Sportswear Retail Investment Valuation References
221
Kulatilaka, N. (1995). "The Value of Flexibility: A General Model of Real Options."
Real Options in Capital Investment: Models, Strategies, and Applications: 89–107,
Westport, CT, US.
Kulatilaka, N., P. Balasubramanian, et al. (1996). Managing Information Technology
Investments: A Capability-based Real Options Approach, Boston University, School of
Management, Boston, MA, US.
Kulatilaka, N. and E. Perotti (1998). "Strategic Growth Options." Management Science
44: 1021-1031.
Kuske, R. and J. Keller (1998). "Optimal exercise boundary for an American put option."
Applied Mathematical Finance 5(2): 107-116.
Laate, E. A., E. Dept. of Rural, et al. (2006). Valuing Agricultural Biotechnology
Investments a Real Options Approach, Library and Archives Canada= Bibliothèque et
Archives Canada.
Lander, D. and G. Pinches (1998). "Challenges to the Practical Implementation of
Modeling and Valuing Real Options." Quarterly Review of Economics and Finance 38:
537-568.

Real Options Methodology in Sportswear Retail Investment Valuation References
222
Lander, D., P. Shenoy, et al. (1999). "Modeling and Valuing Real Options Using
Influence Diagrams." University of Kansas, Kansas.
Lee, S.-H. (2002). Real Options Theory: Implications on Entrepreneurship Development
and Options Value Under Uncertainty. Ohio State University, Ohio
Leslie Keith, J. and P. Michaels Max (1997). "The Real Power of Real Options." The
McKinsey Quarterly, New York 3: 97-108.
Leung, Nga-Na (2007) Real Options Framework for Acquisition of Real Estate Properties
with Excessive Land. University of Florida, Florida.
Li, Y. and G. Sick "Equilibrium Investment Decisions in A Real-Options Sequential
Bargaining Game with Network Effects.", 2006 FMA Annual Meeting Preliminary
Academic Program, Conference working paper.
Luehrman, T., E. Schwartz, et al. (2004). "Strategy as a Portfolio of Real Options." Real
Options And Investment Under Uncertainty: Classical Readings and Recent
Contributions.

Real Options Methodology in Sportswear Retail Investment Valuation References
223
Luehrman, T. A. (1998). "Strategy Portfolio of Real Options." Harvard Business Review:
89-99.
Luehrman, T. A., A. K. Dixit, et al. (1997). "A General Manager’s Guide to Valuation."
Harvard Business Review 75(3): 133-154.
Luehrman, T. A., E. S. Schwartz, et al. (2004). "Strategy as a Portfolio of Real Options."
Real Options And Investment Under Uncertainty: Classical Readings and Recent
Contributions.
Martín, G. R. and P. L. Fernández (2006). "Real Option in Biotechnological Firms
Valuation. An Empirical Analysis of European Firms." Journal of Technology
Management & Innovation 1(2): 27.
Martzoukos, S. and L. Trigeorgis (2002). "Real (investment) options with multiple
sources of rare events." European Journal of Operational Research 136(3): 696-706.
Maya, C. (2004). In Search of the True Value of Start-up Firms: Creative Destruction and
Real Options Approach, Brandeis University, Waltham, MA.

Real Options Methodology in Sportswear Retail Investment Valuation References
224
McAllister, P., B. O’Roarty, et al. (1999). Pricing break clauses: a fundamental approach,
RICS Cutting Edge Conference, Cambridge.
McCahery, J. and L. Renneboog (2003). Venture Capital Contracting and the Valuation
of High-technology Firms, Oxford University Press, USA.
McConnell, J. (2007). A Life-Cycle Flexibility Framework For Designing, Evaluating
and Managing Complex Real Options: Case Studies In Urban Transportation and Aircraft
Systems. MIT Engineering Systems Division, Cambridg, MA
McDonald, R. (2006). "The Role of Real Options in Capital Budgeting: Theory and
Practice 1." Journal of Applied Corporate Finance 18(2): 28-39.
McDonald, R. and D. Siegel (1984). "Option Pricing When the Underlying Asset Earns a
Below-Equilibrium Rate of Return: A Note." Journal of Finance 39(1): 261-265.
McDonald, R. and D. Siegel (1985). "Investment and the valuation of firms when there is
an option to shut down." International Economic Review 26(2): 331-349.
McGrath, R. G. (1997). "A Real Options Logic for Initiating Technology Positioning
Investments." Academy of Management Review 22: 974-996.

Real Options Methodology in Sportswear Retail Investment Valuation References
225
Merchant, K. (1998). Modern Management Control Systems: Text and Cases, Prentice
Hall.
Merton, R. (1973). "Theory of Rational Option Pricing" Bell Journal of Economics and
Management Science 4(1): 141-183.
Merton, R. (1974). "On the Pricing of Corporate Debt: The Risk Structure of Interest
Rates." Journal of Finance 29(2): 449-70.
Merton, R. (1998). "Applications of Option-Pricing Theory: Twenty-Five Years Later
(Digest Summary)." American Economic Review 88(3): 323-349.
Miltersen, K. (2000). "Valuation of Natural Resource Investments with Stochastic
Convenience Yields and Interest Rates. Project Flexibility, Agency, and Competition."
New York. Oxford University Press 183: 205.
Miltersen, K. and E. Schwartz (1998). "Pricing of Options on Commodity Futures with
Stochastic Term Structures of Convenience Yields and Interest Rates." Journal of
Financial and Quantitative Analysis 33: 33-60.

Real Options Methodology in Sportswear Retail Investment Valuation References
226
Moser, M. (1985). "Measuring performance in R&D settings." Research Management
28(5): 31-33.
Myers, S. (1977). "Determinants of Corporate Borrowing" Journal of Financial
Economics 5(2): 147-175.
Myers, S. (1984). "Finance Theory and Financial Strategy." Interfaces 14(1): 126.
Nelson, Housel, and Mun (2005), “Sub-Finance: New Sources of Data for Real Options
Analysis”, Real Options 2005Conference working paper.
Olmsted Teisberg, E. (1994). "An option valuation analysis of investment choices by a
regulated firm." Management Science 40(4): 535-548.
Paddock, J. L., D. R. Siegel, et al. (1988). "Option Valuation of Claims on Real Assets:
The Case of Offshore Petroleum Leases." Quarterly Journal of Economics 103(3): 479-
508.
Pengfei, H. and H. Yimin (2000). Real Option Valuation in High-Tech Firm. Göteborg
University. School of Business, Economics and Law, Sweden.

Real Options Methodology in Sportswear Retail Investment Valuation References
227
Philippe, Henri (2005), “Real Options: Still Looking for Evidence?” Real Options
Conference, 2005.
Pindyck, R. "Irreversibility, uncertainty, and investment, 1991." Journal of Economic
Literature 29: 1110–1152.
Pindyck, R. S. (1986). "Irreversible Investment, Capacity Choice, and the Value of the
Firm." NBER Working Paper.
Pindyck, R. S. (1998). "The long-run evolution of energy prices." Sloan School of
Management, Massachusetts Institute of Technology, Issue December.
Pindyck, R. S. and A. K. Dixit (1994). Investment under uncertainty, Princeton
University Press.
Pindyck, R. S. and B. World (1990). Irreversibility, uncertainty, and investment, World
Bank.
Pitts, C. and J. Busby (1997). "Real options in practice: an exploratory survey of how
decision makers in industry think about flexibility." Management Accounting Research 8:
169-186.

Real Options Methodology in Sportswear Retail Investment Valuation References
228
Porter M. (1980), Competitive Strategy, New York: Free Press.
Porter M. (1986), Competitive Advantage, New York: Free Press.
Power, B., G. C. Reid, et al. (2005). "A Test of Real Options Logic." Discussion Paper
Series 9, University of Standrews Center for Research into Industry Enterprise Finance,
University College Cork, Cork, Ireland.
Prokesch, S. (1997). "Unleashing the Power of Learning. An Interview with British
Petroleum." Harvard Business Review 75(5): 146-68.
Qin, R. (2007). Attaining Knowledge Workforce Agility in a Product Life Cycle
Environment Using Real Options, Pennsylvania State University.
Quigg, L. (1995). "Optimal Land Development." Real Options in Capital Investment:
Models, Strategies, and Applications: 265–280.
Quigg, L. and U.-C. University of Illinois at (1993). "Empirical Testing of Real Option-
Pricing Models." Journal of Finance-New York 48: 621-621.

Real Options Methodology in Sportswear Retail Investment Valuation References
229
Reifer, D. (2004). Use of Real Options Theory to Value Software Trade Secrets,
University of Southern California, California.
Ross, M. and M. Rubinstein (1979). "Option pricing: A simplified approach." Journal of
Financial Economics 7: 229-263.
Ryan, P. and G. Ryan (2002). "Capital budgeting practices of the Fortune 1000: How
have things changed." Journal of Business and Management 8(4): 355-364.
Samis, M., G. A. Davis, et al. (2005). "Valuing uncertain asset cash flows when there are
no options: A real options approach." Resources Policy 30(4): 285-298.
Sarkar, S. (2000). "On the investment–uncertainty relationship in a real options model."
Journal of Economic Dynamics and Control 24(2): 219-225.
Schwartz, E. and J. E. Smith (2000). "Short-Term Variations and Long-Term Dynamics
in Commodity Prices." Management Science 46(7): 893-911.
Schwartz, E. S. (1997). "The Stochastic Behavior of Commodity Prices: Implications for
Valuation and Hedging." Journal of Finance – New York- 52: 923-974.

Real Options Methodology in Sportswear Retail Investment Valuation References
230
Schwartz, E. S. (2004). "Patents and R&D as Real Options." Economic Notes 33(1): 23-
54.
Schwartz, E. S. and M. Moon (2000). "Evaluating Research and Development
Investments." Project Flexibility, Agency, and Competition–New Developments in the
Theory and Application of Real Options, New York and Oxford.
Schwartz, E. S. and M. Moon (2000). “Evaluating Research and Development
Investments - Project Flexibility, Agency, and Competition--New Developments in the
Theory and Application of Real Options”, New York und Oxford Press.
Schwartz, E. S. and M. Moon (2000). "Rational Pricing of Internet Companies."
Financial Analysts Journal 56(3): 62-75.
Schwartz, E. S. and M. Moon (2001). "Rational Pricing of Internet Companies
Revisited." Financial Review 36(4): 7-26.
Schwartz, E. S. and L. Trigeorgis (2004). Real Options And Investment Under
Uncertainty: Classical Readings and Recent Contributions, MIT Press.

Real Options Methodology in Sportswear Retail Investment Valuation References
231
Schwartz, E. S. and C. Zozaya-Gorostiza (2003). "Investment Under Uncertainty in
Information Technology: Acquisition and Development Projects." Management Science
49(1): 57.
Senge, P. and B. Audio (1990). The fifth discipline, Doubleday New York, NY.
Sharp, D. (1991). "Uncovering the hidden value in high-risk investments." Sloan
Management Review 32(2): 69-74.
Sick, Gordon (1994). Real Options. Working paper series F, working paper # 45, Yale
School of Management, New Haven, Conn.
Smit, H. and L. Ankum (1993). "A Real Options and Game-Theoretic Approach to
Corporate Investment Strategy Under Competition." Financial Management 22: 241-241.
Smit, H. and L. Trigeorgis (1999). "Flexibility, Strategic Options and Dynamic
Competition in Technology Investments." Strategic Management Journal (under revision).
Smit, H. A. N. (2003). "Infrastructure Investment as a Real Options Game: The Case of
European Airport Expansion." Financial Management 32(4).

Real Options Methodology in Sportswear Retail Investment Valuation References
232
Smit, H. T. J. (2003). "Airport Expansion." Financial Management: 27-57.
Smit, H. T. J. and L. A. Ankum (1993). "A Real Options and Game-Theoretic Approach
to Corporate Investment Strategy Under Competition." Financial Management 22: 241-
241.
Smit, H. T. J. and L. Trigeorgis (2001). R&D Option Strategies.
Smit, H. T. J. and L. Trigeorgis (2004). "Real Options: Examples and Principles of
Valuation and Strategy", Erasmus University Rotterdam and NIAS, The Netherlands
Smit, H. T. J. and L. Trigeorgis (2004). Strategic Investment: Real Options and Games,
Princeton University Press.
Smit, H. T. J. and L. Trigeorgis (2006). "Real options and games: Competition, alliances
and other applications of valuation and strategy." Review of Financial Economics 15(2):
95-112.
Smit, H. T. J., L. Trigeorgis, et al. (1995). Flexibility and Commitment in Strategic
Investment, Tinbergen Institute.

Real Options Methodology in Sportswear Retail Investment Valuation References
233
Stark, A. (2000). "Real Options,(Dis) Investment Decision-Making and Accounting
Measures of Performance." Journal of Business Finance & Accounting 27(3-4): 313-331.
Starkov, V. (2001). Essays on the Restructuring of the Electricity Industry in the United
States, West Virginia University.
Sterman, J. (2000). Business Dynamics: Systems Thinking and Modeling for a Complex
World, Irwin McGraw-Hill.
Tanguturi, V. P. (2005). Real Options for Migration to 3G Wireless Broadband Internet:
The Case of an Operator in India, Stevens Institute of Technology.
Titman, S. (1985). "Urban Land Prices." American Economic Review 75: 505-514.
Titman, S., C. Los Angeles University of, et al. (1984). Urban Land Prices Under
Uncertainty, University of California, Los Angeles, Graduate School of Management.
Tourinho, O. (1979). The valuation of reserves of natural resources: an option pricing
approach, University of California, Berkeley.

Real Options Methodology in Sportswear Retail Investment Valuation References
234
Tong, Reuer (2007), “Real Options in Strategic Management – Advances in strategic
Management”, 24, Real Options in Strategic Management.
Trigeorgis, L. (1993). "Real Options and Interactions with Financial Flexibility."
Financial Management 22: 202-202.
Trigeorgis, L. (1995). Real Options in Capital Investment: Models, Strategies, and
Applications, Praeger/Greenwood Press.
Trigeorgis, L. (1996). Real options, MIT Press Cambridge, Mass.
Trigeorgis, L. (1996). Real Options: Managerial Flexibility and Strategy in Resource
Allocation, MIT Press.
Trigeorgis, L. (2001). "A Log-Transformed Binomial Numerical Analysis Method for
Valuing Complex Multi-Option Investments." Real Options and Investment under
Uncertainty: Classical Readings and Recent Contributions. Cambridge: 539-558.
Trigeorgis, L. (2004). "A Conceptual Options Framework for Capital Budgeting." Real
Options And Investment Under Uncertainty: Classical Readings and Recent
Contributions.

Real Options Methodology in Sportswear Retail Investment Valuation References
235
Trigeorgis, L. (2004). "The Nature of Option Interactions and the Valuation of
Investments with Mutiple Real Options." Real Options And Investment Under
Uncertainty: Classical Readings and Recent Contributions.
Van Putten, B. Alexander and C. MacMillan (2004), “Making Real Options Really Work,”
Harvard Business Review, 82, (12), pp. 134-141.
Wang, T., G. W. University, et al. (2007). Comparison of Methods for Valuating
Technology Innovation and Adoption Projects, George Washington University.
Walters, Chris and Giles, Tim, (2000). Using Real Options In Strategic Decision Making.
Tuck Paradigm, Spring 2000. Retrieved from http://mba.tuck.dartmouth.edu/paradigm/
spring2000/articles/walters-decision_making.html
Wilkinson, Christine Alicia (2006). Capital Budgeting, Real Options and Escalation of
Commitment: A Behavioral Analysis of Capital Investment Decisions, Iowa State
University, Iowa.
Wu, M. C. and C. Y. Tseng (2006). "Valuation of patent–a real options perspective."
Applied Economics Letters 13(5): 313-318.
Real Options Methodology in Sportswear Retail Investment Valuation References
236
Wang, Tiehong (Ann) (2007) Comparison of methods for valuating technology
innovation and adoption projects. (Ph.D. dissertation, The George Washington University,
United States).
Y. AmKt-Sahalia, Y., Y. Wang, et al. (2001). "Do Option Markets Correctly Price the
Probabilities of Movement of the Underlying Asset?" Journal of Econometrics 102(67):
110.
Zhang, Duoxing (2008) Real options evaluation of financial investment in flexible
manufacturing systems in the automotive industry, Auburn University, Alabama.

Real Options Methodology in Sportswear Retail Investment Valuation Appendix A
237
Appendix A: Sportswear Industry
A-1 Industry Analysis
A-1.1 Retail industry overview - Porter’s five forces analysis.
1) Threat of New Entrants - One trend that started over a decade ago has been a
decrease in the number of independent retailers. While the barriers to starting up a
store are not impossible to overcome, the ability to establish favorable supply
contracts, leases, and compete is becoming virtually impossible. Their vertical
structure and centralized buying gives chain stores a competitive advantage over
independent retailers.
2) Power of Suppliers – Historically, retailers have tried to exploit relationships
with suppliers. A great example was in the 1970's when Sears sought to dominate
the household appliance market. Sears set very high standards for quality, and the
suppliers who did not meet their standards were dropped from the Sears line. A
contract with a large retailer such as Sears can make or break a small supplier.
Generally speaking, suppliers in the retail industry have very little power,
although this is changing.
However, this is a little different in the sportswear retail industry. The
dominant suppliers, such as Nike and Adidas, do command great power. As the
suppliers continue to integrate forward by opening their own retail stores, their
power (in relation to that of their retail customers) increases as their dependency
on the independent retailers decreases.

Real Options Methodology in Sportswear Retail Investment Valuation Appendix A
238
3) Power of Buyers - Individually, customers have very little bargaining power with
retail stores. However, as a whole, the consumer groups have been empowered
with a much stronger bargaining power. As consumers become more educated,
they demand more: quality products, better services, and better values; in
addition, as the competition intensifies amongst retailers, the power of buyers has
been increasing significantly over the past decade.
4) Availability of Substitutes -The tendency in retail is not to specialize in one
good or service, but to deal in a wide range of products and services. This means
that what is on offer in one store can more than likely be found at another store.
Retailers offering products that are unique and cannot be found elsewhere have a
distinct or absolute advantage over their competitors. In sportswear retailers, this
trend has been influencing and shaping the main retailers, particularly in supplier-
owned retail stores.
For instance, in Adidas’s Shanghai glamour Brand-Flagship (mega-store)
stores, consumers are welcomed with celebrities’ endorsement advertisements; in
Niketown London, consumers can use the NikeID studio to design their own
personalized shoes. These “Premium consumer experiences” cannot be replicated
elsewhere, such as in the shoe sections of department stores.
5) Competitive Rivalry – Retailers always face stiff competition. The slow market
growth for the retail market means that firms must fight each other for market
share. More recently, they have tried to reduce the cut-throat pricing competition
by offering Frequent Flyer points, memberships, and other special services to try

Real Options Methodology in Sportswear Retail Investment Valuation Appendix A
239
to gain the customers’ loyalty. Rivalry is fierce, and there are a number of
standard reasons why it is – relatively small number of competitors and so on.
A-2 Retail Industry Growth – Global Retail Outlook
A-2.1 Regional growth.
Asia: The Asian market is prevalent in the rankings partly due to demographics,
because Asian countries tend to have a higher number of younger people than developed
markets.
Europe: Europe has slipped down the rankings generally with established markets
such as France, the Netherlands and Sweden showing restrained growth. Russia and the
UK are the leaders and Turkey is climbing (up from 16th to 12th).
North America: The North American market is characterized by saturation and
intense competition, but it still remains a very attractive market for international retailers.
Latin America: The Latin American market is developing slowly; while Argentina
and Brazil are improving their rankings slightly, they are very much at the bottom end of
the table.
A-2.2 U.S. retail industry overview.
The U.S. shows the biggest forecast volume growth for clothing and footwear
from 2006 to 2011: clothing and footwear sales are projected to increase by $74bn from
$345bn in 2006 to $419bn in 2011, up 3.9%. The US has slipped down to second due to

Real Options Methodology in Sportswear Retail Investment Valuation Appendix A
240
saturation and intense competition, but still remains a very attractive market for
international retailers.
The U.S. retail industry generates $3.9 trillion in retail sales annually ($4.2 trillion
if food service sales are included). One of the biggest contributions that retail industry
brings to a country is employment. In the US, the retail industry accounts for about 11.6
percent of U.S. employment. Annual retail employment averaged 15.3 million people in
2005. Ten year employment projections expect retail sales to increase 11.0 percent,
versus 14.8 percent overall.
Table A-1: Total Retail Sales (excluding Food Services, Adjusted, US Census)
US Retail Industry Amount Year Source
Total Retail Sales in 2009 US$3.924bil 2010 Census
Total Retail Sales in 2008 US$3.669bil 2009 Census
Total Retail Sales in 2007 US$3.951bil 2008 Census
Total Retail Sales in 2006 US4.077bil 2007 Census
Source: US Census. Estimates of Monthly Retail and Food Services Sales by Kind of
Business: 2010 (Estimates are shown US dollars and are based on data from the Monthly
Retail Trade Survey, Annual Retail Trade Survey, and administrative records).
A-2.3 Global market overview on sportswear industry
A-2.3.1 History & trending.
The first complete survey conducted by WSGI (World Sporting Goods Industry
Association, 2002 survey) estimated that consumer spending on sportswear will grow by

Real Options Methodology in Sportswear Retail Investment Valuation Appendix A
241
a modest 18% to reach US$105bn in 2003. This estimate is proved to be conservative in
the very next year: the world market for total active sportswear and athletic footwear in
2003 amounted to US$145bn, and grew to US$235bn in 2005.
A-2.4 Global market: sportswear retail industry.
Sportswear benefits from the substantial retailing sector that developed in the
1990s, now consolidated into several major multiple operators: JJB Sports, Blacks
Leisure and JD Sports are the largest. The early 2000s have generally been a period of
consolidation for the sportswear industry. Into the 21st century, the Retailing of
sportswear is more fragmented than ever, through sports shops, general stores and e-
commerce, with multiple grocers making inroads.
A-2.4.1 Product demand.
Demand is cyclical for various sports products and `looks', such as the classic
white trainer or running shoe, or hooded top originally used for warming up. Such
products will come and go in a mature market emphasized by the popular “retro” styles
but the recent publicity surrounding the need for physical activity to tackle obesity and
poor health should stimulate demand for “performance sportswear.”
The active sportswear and athletic footwear product group is one of the most
heavily branded areas of apparel, consisting of the international brands, competing with a
multitude of second division players. This is an area of clothing where the purchasing

Real Options Methodology in Sportswear Retail Investment Valuation Appendix A
242
choice is frequently determined by the sports figure person admired, and the brand that
person chooses to wear.
The active sportswear and athletic footwear product group is one of the most
heavily-branded areas of apparel. There are only two truly global players: Nike and
Adidas-Reebok. They compete with each other not only just product innovation, but also
retailing their own products. They also compete with a multitude of smaller and regional
sports brands, and also with the sports ranges of casual wear brands.
With growth in these apparel sectors being very much marketing-driven, major
sporting events and/or world champion events for the active sportswear and athletic
footwear industry. From the European Football Championship to Olympic, and other
world's major sporting events, all create unique selling-opportunities for this industry.
Beijing Olympic 2008 is one of the examples that the sportswear industry is expanding its
influence to the young consumers in the new markets, from developed market moving
into emerging developing countries.
A-2.4.2 Key global players
Sportswear is a global industry, largely revolving around three dominant brands:
Nike, Adidas & Reebok, and Puma. These brands are leaders in both active sportswear
and fashionable leisurewear. There are many other, more specialized brands as well,
usually oriented toward a particular sport. The UK's leading companies include Umbro
(football kit based in UK, acquired by Nike in 2007), Hi-Tec (trainers and outdoor
footwear) and Pentland Group (through subsidiaries such as Speedo, Berghaus and

Real Options Methodology in Sportswear Retail Investment Valuation Appendix A
243
Ellesse). Generally, the sportswear industry concentrates its production centers in the Far
East, particularly in China.
A-2.5 US sportswear retail market analysis268.
The retail sporting goods industry in the US includes about 20,000 companies
with combined annual revenue of $25 billion (all sports related, including bicycles related,
fitness equipments, etc). Large chain operators include Sports Authority, REI, and
Hibbett Sporting Goods. The industry is highly fragmented: the 50 largest companies
hold less than 50 percent of the market. Only about 150 companies have more than five
stores. A typical store has $5 million of annual sales.
A-2.5.1 Competitive landscape.
Dick's is one of the largest specialty retailers in the U.S. Dick's competes in
fragmented industry, with the top six sporting goods retailers holding only 19% of the
estimated $52 billion market. Other companies that Dick's compete with in the sporting
goods retail market include the following firms:
• Academy Sports & Outdoors: Academy is a private company operating
throughout the South and Southwest regions of the U.S. Academy's product
offerings focus on apparel and equipment for outdoor activities such as camping,
hunting, fishing and boating.
268 Sources: D&B Research Group; First Research Inc.; Hoover’s Inc, other strategic planning sources.

Real Options Methodology in Sportswear Retail Investment Valuation Appendix A
244
• Recreational Equipment, Inc.: REI operates about 90 stores heavily concentrated
in the Western half of the US. REI sells mostly apparel and equipment used for
hiking, climbing, kayaking and other similar outdoor activities.
• Big 5 Sporting Goods: This small-store neighborhood style retailer leads the
sporting goods market in Western states such as Washington, California and
Arizona. It operates over 300 stores throughout the Western region.
• Hibbett Sports: Hibbett boasts over 600 small-format stores based primarily in the
Southeast region of the US. These stores are traditionally located in indoor and
strip malls and sell a variety of sporting equipment and apparel.
In addition, there are footwear retailers: Foot Locker and Finish Line.
Department store chains: Wal-Mart, Target, and Amazon who sell a selection of sporting
equipment and apparel in their stores as well.
Demand is driven by population demographics and consumer income. The
profitability of individual companies depends on me
Merchandising and marketing skills. Large chains have an advantage in stocking a
wide variety of goods. Small companies can compete successfully by carrying a deeper
product line in specialized sports, or by serving a local market.

Real Options Methodology in Sportswear Retail Investment Valuation Appendix A
245
A-2.6 Time series of the yearly change rate of total annual sales
Figure A-1: US Retail Total Annual Sales vs. General Apparel vs. US Major Sporting Goods Retailers Y-on-Y Sales Changes Rate
A-2.6.1 Products, operations & technology.
Major products are outdoor clothing and shoes, firearms, golf equipment, and
bicycles. Clothing and shoes together account for about 25 percent of industry revenue,
firearms 10 percent, bicycles and golf equipment 8 percent each. Other products include
US Retail Total Annual Sales vs. General Apparel vs. US Major Sporting Goods Retailers Y-on-Y Growth Rate
Souce: US Census & Internal Retailers financial Statements
0.0%
5.0%
10.0%
15.0%
20.0%
25.0%
2002 2003 2004 2005 2006 2007Year
Y-o
n-Y
Gro
wth
Rat
e P
erce
nta
ge
General Apparel / Accessaries Sales US Retail totalUS Major Sports Retailers

Real Options Methodology in Sportswear Retail Investment Valuation Appendix A
246
exercise, camping, and ski equipment; fishing tackle; and team sports equipment. In this
study, main focus is on the footwear, apparel, and fitness accessories.
Format and merchandise vary. Most chains operate stores of a single type. Large-
format stores are from 20,000 to 100,000 square feet, stock a large number of items, and
are typically found as anchor stores in strip malls or in stand-alone locations.
Traditional sporting goods retail stores vary in size from 5,000 to 20,000 square
feet, carry a more limited number of items, and are normally found in strip or enclosed
malls. Specialty stores have a wide selection of items for just one or two sports, such as
golf, tennis, skiing, camping, etc.; are typically 1,000 to 10,000 square feet; and located
in enclosed and strip malls. Large-format stores typically have more than $5 million in
annual revenue and more than 50 employees. Specialty stores have less than $1 million in
annual revenue and fewer than ten employees.
Although large chains can sell a broad range of merchandise at lower prices, small
local stores can successfully compete by offering better service or specializing in a
particular sport. Because the equipment for many sports is very technical, knowledgeable
salespeople are a strong competitive factor. The operations of sporting goods stores are
fairly straightforward: companies acquire merchandise, determine store layout, train
employees, advertise goods, provide services, sell goods, and manage inventory.
Product is acquired from manufacturers and about 1,000 wholesale distributors.
Manufacturers regularly introduce new models, which often have only minor changes
from older models. Trade shows are an important way of finding out about new products.
The type of merchandise purchased varies according to the season and regional and local

Real Options Methodology in Sportswear Retail Investment Valuation Appendix A
247
preferences. Large-format stores may carry up to 100,000 separate items (stock keeping
units - SKUs). Sports Authority stores usually carry 40,000 SKUs, with a range of brands
in about 30 different sports categories. Sports Authority buys from 750 vendors.
Specialty stores carry significantly fewer items. In addition to equipment, most retailers
sell sports apparel and shoes. Nike, mainly a manufacturer of shoes and sports clothing, is
one of the biggest vendor to Sports Authority, accounting for more than 10 percent of its
merchandise.
Store layouts and merchandise presentation are often changed, especially in large-
format stores that try to maintain the atmosphere of a collection of specialty departments.
Layout and presentation may be designed with the help of special software from
companies like Marketmax. Because much sports equipment is highly specialized,
employees must be trained to understand and explain differences. Companies typically
try to recruit employees who are avid sports participants. Many companies rely on part-
time employees for 50 percent or more of their workforce.
Inventory management is a major concern for all sporting goods retailers because
of the large numbers of items they sell and the short selling season for many sports.
Chains usually supply their stores from a central distribution facility, with weekly re-
supply based on sales. Hibbett Sports supplies 280 stores from a single 200,000 square
foot distribution facility. Many companies use highly sophisticated computerized
inventory management systems that include point-of-sale (POS) terminals, scanners, and
handheld radio frequency terminals to record merchandise receipts, print pricing labels,

Real Options Methodology in Sportswear Retail Investment Valuation Appendix A
248
monitor inventory levels, facilitate automatic inventory replenishment, and identify
popular items.
A-3 Sportswear Retail Characteristics Overview
The overall economic environment has a great impact on the retailing industry,
and an even greater impact on the sportswear retailing. Retailer profits have a close
correlation with the overall performance of the economy. The trends for GDP growth,
inflation, consumer confidence, personal income, and interest rates are extremely
important when thinking about investing in the retail industry.
The sportswear retail industry has been changing towards high-investment and
high-risk industry. The logistical advances enable the sportswear suppliers to expand
towards the retail front and retailers to integrate backwards along the supply chain to
produce own brands. The industry is therefore consolidating itself towards main big
players. They compete to attract consumers. At the same time, the technology advances
information flow (there have been technological advances made in the flow of
information). As consumers are becoming much more informed than ever before, they
can find information about better value bargains on a broader and larger scale and can
identify the latest new inventions much more quickly. They demand quality products,
premium services, and most importantly, the combination of these two along with a better
value. The once “led” consumers are now “leading” the industry trend.
All these developments are starting to shorten industry cycles (overall sales values
and volume). Consumers’ purchasing behavior is changing more quickly than ever

Real Options Methodology in Sportswear Retail Investment Valuation Appendix A
249
before. As a result, the product “shelf-life” cycles are getting much shorter. The shortness
of these cycles is relatively new and the industry is in the process of adapting to this
change, resulting in retailers forming different types of stores to attract consumers, to
create premium consumer experiences, and to take the advantage over competitors.
Some of the main “competitive advantages” are: faster logistic management, an
improvement in store presentation, and better store fixtures. Creating these advantages
requires heavier investment, and more flexible investment formats appear. Some of the
new investment vehicles are: expansion in stage, lease contract with breach option term,
and /or with optional renovation, and/or contract with distributors.
As the competition in the business environment intensified, the investment risk
also increases. Not only do investors need to have an instinctive and rational
understanding of the selected store values, they also need to know the potential
opportunities and risk that come along with the investment. They are willing to pay a
premium to secure the opportunity to avoid the risk. They do this by buying an option,
thus securing the investment opportunity while not having to commit the full investment.
A simple example would be: buying an option to acquire a company in 4-months’ time
instead of buying right now. As it is still unknown whether the result of a major sporting
event is favorable to the acquisition.
In conclusion, the evolution in the Sportswear Retail Industry (consolidating
trends and rapid changes in the marketplace) has led to a more unstable investment
environment. This in turn creates complexity in investment valuation.

Real Options Methodology in Sportswear Retail Investment Valuation Appendix A
250
A-4 Sportswear Retail Industry Investment Valuation
The traditional planning model, NPV or IRR captures market risk via a “discount
rate,” which does indeed enable the management in the decision-making process; but in
an ever-changing retail business environment companies and management need to be
able to respond proactively to the market changes in a more timely and accurate manner.
When the NPV is close to zero, it is difficult for the management to evaluate the
financial benefit and investment trade off. And when new information related to the new
store is still pending, managers need to (be able to) fully explore options that are other
than just Go or No-Go. Of equal importance is the strategic long-term benefit gained
from freeing up committed investment to pursue other investment opportunities in
divesting in certain projects. Abandoning or deferring an investment can free up the cash
that might have to be tied up and therefore strengthen the business’ ability to be reactive
or even to be pre-active to the changes in the marketplace.
Retail investors and management are challenged to explore all investments
alternatives including option value investment. Particularly when the NPV is close to
zero. However as discussed in the RO methodology section, there is a lack of attention to
Real Option analysis in the sportswear retail environment due to:
5) The irreversibility of the investment option premium—that is, the premium paid is
non re-fundable in normal practice;
6) The complexity of the new methodology and the effort needed to educate
management about it:
7) The data required to complete RO takes effort and more time.

Real Options Methodology in Sportswear Retail Investment Valuation Appendix A
251
Diag
ram
: Met
hodo
logy
Flo
w &
Out
put C
ompa
rison
Bas
ic In
put
Proj
ecte
d C
ash
Flow
s cal
cula
ted
base
d on
Pro
ject
ed:
~ N
et In
com
e~
Cha
nge
in N
et w
orki
ng ca
pita
l~
Cap
ital E
xpen
ditu
res
~ D
isco
unt R
ate
Unk
now
n In
put
(σ):
Sigm
a--M
arke
t Unc
erta
inty
, vo
latil
ity (o
r the
sta
ndar
d de
viat
ion)
of
futu
re m
arke
t val
ue re
late
d to
the
inve
stm
ent v
alue
.~
Stra
tegi
c Va
lues
em
bedd
ed~
New
Mar
ket g
rwot
h ~
Syne
rgis
tic V
alue
s
Opt
ion
Mod
el M
etho
dBS
Val
ue) =
Se
*{N(d
1)} -
Xe-rt
*{N(d
2)}
d1 =
{ln(
S/X)
+ (σ
2/2)
t}/σ
*√t
d2 =
d1
-σ*√
t
Proc
ess
and
Step
s to
Pro
ve H
ypot
hesi
s: R
O m
etho
dolog
y ca
n be
use
d in
SRI in
vestm
ent v
aluat
ion, i
n co
njunc
tion
to th
e NP
V m
etho
ds, t
o im
prov
e SR
I inve
stmen
t valu
ation
accu
racy
and
assis
t man
ager
ial d
ecisi
on-m
aking
, par
ticula
rly: a
) whe
n a
new
inves
tmen
t has
a N
PV th
at is
ac
com
pani
ed by
grea
t unc
erta
inty
; b) w
hen
a ne
w inv
estm
ent h
as a
neg
ativ
e N
PV th
at h
as tr
ateg
ic va
lue
embe
dded
; .
Trad
ition
al M
etho
dD
isco
unte
d Ca
sh F
low-
-D
CF
Bas
ic O
utpu
tNe
t Pre
sent
Val
ue o
f cas
h flo
ws
Posi
tive
Nega
tive
Inve
stin
g -->
Go
Not i
nves
ting
--NO
Cal
cula
ted
Inpu
t (S
): Pr
esen
t val
ue o
f cas
h flo
ws
expe
cted
from
the
inve
stm
ent
(X):
The
pres
ent v
alue
of t
he
unfro
nt in
vest
men
t(t)
: tim
e(r)
: int
eres
t rat
e
Supp
lem
enta
ry O
ptio
n O
utpu
tSt
ore
Tota
l Val
ue th
at in
clud
es:
1. F
or N
ew S
tore
with
neg
ativ
e NP
V -G
rowt
h St
rate
gic
Valu
e em
bede
d.
2. F
or N
ew S
tore
with
pos
itive
NPV
but
gre
at
unce
rtain
ty -
Inve
st o
r Wai
-and
-See
till
the
unce
rtain
ty is
rem
oved
.
3. F
or e
xist
ing
Stor
es R
e-in
vest
men
t -Ad
ditio
nal
stra
tegi
c or
syn
ergi
stic
val
ues
Sign
al to
man
agem
ent
of th
e in
vest
men
t co
uld
have
little
re
turn
val
ue.
Incr
ease
Ne
gativ
e NP
V
How
to D
eter
min
e Vo
latil
ityTo
exa
m th
e vo
latil
ityPe
rform
ed
Reg
ress
ion
Anal
ysis
aim
ing
to b
uild
re
latio
n be
twee
n:irm
's st
ock
pric
e or
sp
orts
wea
r ret
ail
stor
es s
ales
gro
wth
ra
te
Redu
cing
Ne
gativ
e NP
V Neut
ral
Valu
es E
mbe
dded
-->G
o
Dia
gram
Key
s Des
crip
tion
Reta
ngle
-->P
roce
ss: s
hows
a tr
ansf
orm
atio
n or
man
ipul
atio
n of
dat
a flo
ws w
ithin
the
syst
em.
Arro
ws --
> D
ata
Flow
inpu
t des
crip
tion:
the
info
rmat
ion
requ
ired
to c
ompl
ete
the
step
.
outp
ut d
escr
iptio
n: th
e in
form
atio
n an
d da
ta b
y th
e st
ep a
nd p
rovi
ded
as in
put t
o do
wnst
ream
ste
ps.
Dia
mon
d: D
eciio
n
Bas
e D
ecis
ion
Supp
lem
enta
ry
Sign
ma
Wat
i-and
-see
Fig
ure
B-1
: Dia
gram
Met
hodo
logy
Flo
w &
Out
put C
ompa
rison

Real Options Methodology in Sportswear Retail Investment Valuation Appendix B
252
Appendix B: Nike Sport Brand Key Athletes Endorsed269
Basketball: Michael Jordan, Kobe Byrant, LeBron James, Kevin Durant, Jordan Chris
Paul, Carmello Anthony, Ray Allen, Dwayne Wade
Football: Tom Brady, Adrian Peterson, LaDanian Tomlinson, Jordan Terrell Owens,
Jason Taylor
Baseball: Jordan Derek Jeter, Andruw Jones, CC Sabathia
Golf: Tiger Woods, Anthony Kim, Trevor Immelman, Michelle Wie
Soccer: Ronhaldhino, Cristiano Ronaldo, Wayne Rooney
Tennis: Roger Federer, Rafael Nadal, Serena Williams
Running: Asafa Powell, Walter Dix, Paula Radcliffe
Cycling: Livestrong Lance Armstrong
269 Source: Company data.

Real Options Methodology in Sportswear Retail Investment Valuation Appendix C
253
Appendix C: Nike Best Positioned in Footwear Product Innovation History270
1974 The "Waffle trainer" is introduced.
1978 The first Air-Sole units are created, resulting in Nike Air cushioning.
1979 Nike introduces the Tailwind, the first running shoe with Nike Air.
1982 Air Force 1, the first Nike basketball shoe to incorporate Nike Air cushioning, is
introduced.
1986 Nike debuts two apparel collections, one featuring John McEnroe and the other
Michael Jordan.
1987 The Air Trainer High Shoe and the Air Max shoe are introduced.
2000 The Nike Air Presto, and its revolutionary approach to fit, is launched.
2000 Nike unveils its Shox technology.
2000 At the Olympics in Sydney, Nike reveals the lightest track spike ever made, the
aerodynamic and thermo-regulatory Swift Suit, and the recyclable Marathon
Singlet.
2002 Nike introduces its first golf clubs with forged blade irons, forged wedges, and
forged Titanium drivers.
2005 Nike Free, footwear that emulates the leg-strengthening benefits of barefoot
running, is launched.
2006 Nike launches Air Max 360, which uses a new method of creating Air-Sole units.
2006 Nike+ is launched.
270 Source: Company data.

Real Options Methodology in Sportswear Retail Investment Valuation Appendix C
254
2008 Flywire technology is launched.
2009 Pro Combat performance apparel is launched.

Real Options Methodology in Sportswear Retail Investment Valuation Appendix D
255
Appendix D: Nike Timeline
D-1 The 1960s-70s
1964 Nike's predecessor, Blue Ribbon Sports, is incorporated in Oregon.[1]
1971 The Swoosh first appears on Nike shoes
The first line of Nike footwear is introduced, including the so-called
"Moon Shoe" that features a waffle sole, which is distributed to athletes
competing in the US Olympic Track & Field Trials in Eugene, Oregon
Romanian tennis star Ilie Nastase becomes the first athlete to sign an
endorsement contract with Blue Ribbon Sports to wear its Nike tennis shoes.
1972 American record-holder Steve Prefontaine becomes the first major track athlete to
wear Nike shoes.
1975 The Waffle Trainer is introduced, quickly becoming the best-selling training shoe
in the U.S.
Nike print ad with the tag "There is no finish line" is introduced.
1978 Tennis "bad boy" John McEnroe is signed by Nike to an endorsement contract.
1979 Nike's Air technology patented by inventor M. Frank Rudy is introduced in the
Tailwind running shoe. Gas-filled plastic membranes are inserted into the sole of
running shoes to provide cushioning.
D-2 The 1980s
1980 Nike completes an initial public offering of 2,377,000 shares of Class B common
stock on December 2.

Real Options Methodology in Sportswear Retail Investment Valuation Appendix D
256
Nike hires the first industrial designers into the footwear industry to work
out of their Exeter, NH R&D facility.
1981 BRS, Inc. merges into Nike, Inc. on December 31, and the company officially
becomes known as Nike, Inc.
1982 Dan Wieden and Dave Kennedy start their own advertising agency,
Wieden+Kennedy, taking with them the Nike account on April 1. In October,
Nike airs its first national television ad during the New York Marathon.
1982 The Air Force 1 basketball shoe becomes the first Nike court shoe to make use of
the Air technology.
1984 Nike signs Michael Jordan to an endorsement contract. The first model of his
signature shoe, the Air Jordan, originally is banned by the NBA, drawing a
tremendous amount of publicity.
1986 Corporate revenues surpass $1 billion for the first time.
1987 The Nike Air Max shoe is introduced, which for the first time makes visible the
Nike air bag. A television ad featuring the Beatles' song "Revolution" is the first
time that a song performed by the Beatles is used in a TV ad.
1988 The famous tagline, "Just do it", is introduced at the suggestion of 4th grader
Tiffeny Speir from Urban Park Elementary School in Dallas, TX.
1989 Nike enters the European football market, signing a kit deal with Paris Saint-
Germain
Bo Jackson appears in Nike's Bo Knows ad campaign to support the
launch of its cross-training shoe.

Real Options Methodology in Sportswear Retail Investment Valuation Appendix D
257
D-3 The 1990s
1990 The first Niketown store opens in downtown Portland.
Nike opens its world headquarters in unincorporated Washington County,
just west of Portland, on 74 acres (0.3 km²) of land.
1993 Nike introduces Reuse-A-Shoe, which collects athletic shoes, separates and grinds
them up into Nike Grind, used in the making of athletic courts, tracks and fields.
1994 Nike wins Advertiser of the Year at the Cannes Advertising Festival.
Nike enters the ice hockey market after acquiring Canstar, the parent
company of hockey equipment manufacturer Bauer Hockey. Previously, Nike had
only made hockey jerseys, specifically those of the Edmonton Oilers at the height
of Wayne Gretzky-mania, but now began to make all equipment.
1995 Nike signs long-term partnerships with the Brazilian and United States soccer
teams, and moves into English football, signing a kit (uniform/apparel) deal with
Arsenal.
1996 Nike signs Tiger Woods soon after he gives up his amateur golf status.
Nike causes controversy with its advertising campaign during the Summer
Olympics in Atlanta which features the slogan, "You Don't Win Silver — You
Lose Gold." Nike's use of this slogan draws harsh criticism from many sources,
including - not surprisingly - several former Olympic silver and bronze medalists.
Niketown Los Angeles opens in Beverly Hills.

Real Options Methodology in Sportswear Retail Investment Valuation Appendix D
258
1997 Nike signs several hockey stars, including Sergei Fedorov and Jeremy Roenick, to
endorsement deals to wear their new line of skates, which are quickly lambasted
for the fact that they are mostly white, traditionally the color of women's figure
skates. This sartorial quirk, coupled with problems with the soles of the skates,
leads Nike to relent and allow Fedorov to wear Graf-brand skates with a Nike
swoosh applied to them. In the future, Nike's hockey skates become simply
restyled Bauer products until the two brands are combined in 2005.
1998 Phil Knight commits Nike to standards for its affiliated manufacturing facilities,
including: minimum age; air quality; education programs; expansion of microloan
program; factory monitoring; and enhanced transparency of Nike's corporate
social responsibility practices.
1999 Bill Bowerman, co-founder of Nike, dies on Dec. 24 at age 88.
D-4 The 2000s
2000 Nike Shox cushioning/support system is introduced, initially worn by Vince
Carter and others on the US Olympic basketball team.
2002 Nike purchases Hurley International, an action sports clothing company, for an
undisclosed amount.
NikeGO launches, a grassroots initiative to increase physical activity
among youths aged 9-15.
Nike become the apparel sponsor of Manchester United until 2010.
Nike SB, Nike's Skateboarding line, debuts.

Real Options Methodology in Sportswear Retail Investment Valuation Appendix D
259
2003 Nike acquires once-bankrupt rival Converse for $305 million on July 9.
For the first time in the company's history, international sales exceed USA
sales.
Nike is again (also in 1994) named "Advertiser of the Year" by the Cannes
Advertising Festival.
Nike signs NBA player LeBron James with an unprecedented $87 million
endorsement contract.
2004 Phil Knight steps down as CEO and President of Nike, but continues as chairman.
Knight is replaced by William D. Perez as CEO of Nike, effective Dec. 28.
Nike creates the Exeter Brands Group, a wholly owned subsidiary for
athletic footwear and apparel brands for lower price points. Brands include Starter,
Team Starter, Asphalt, Shaq, and Dunkman.
Annual revenues exceed $ 12.25 billion.
2005 Nike reports annual revenue for fiscal year 2005 (ending May 31) of $13.74
billion, a 12% increase over the previous fiscal year.
Nike Signs Tennis Pro Rafael Nadal.
2006 Nike enters the cricket market with a 5-year sponsorship of the Indian cricket
team for US$43m.
CEO William Perez leaves Nike on January 23, 2006. Perez said in the
statement that he and Knight "weren't entirely aligned on some aspects of how to
best lead the company's long-term growth. It became obvious to me that the long-
term interests of the company would be best served by my resignation."

Real Options Methodology in Sportswear Retail Investment Valuation Appendix D
260
Mark Parker replaces Perez as CEO. Parker previously was brand co-
president of the company, and joined Nike in 1979.
Nike and Apple release the Nike+iPod sports kit, enabling runners to log
and monitor their runs via iTunes and the Nike+ website.
Nike reports annual revenue for fiscal year 2006 (ending May 31) of $15
billion.
2007 Nike introduces the Second Coming, a group of NBA basketball players who best
represent the Nike Basketball.
Nike introduces AF25, after 25 years of Air Force shoe line.
Nike become the kit sponsor of Aston Villa.
2008 Nike sells its Nike Bauer hockey equipment division.
Nike introduces shoes featuring new Flywire and Lunarlite Foam
materials. Flywire is a new technology made up of thin wires of vectran fibers,
which are 5 times stronger than steel and never lose strength. Lunar Foam is a
material developed by NASA that gives the shoe excellent shock absorption and a
great feel with minimal weight.
Nike reports annual revenue for fiscal year 2008 (ending May 31) of $18.6
billion, a 14% increase over the previous fiscal year
2009 Nike laid off 4% of its labor worldwide; restructured its geography structure and
management.

Real Options Methodology in Sportswear Retail Investment Valuation Appendix E
261
Appendix E: Correlation
The correlations of between rates of return of the “underlying asset” calculation is
shown below. Correlation relationship on the year on year growth change percentage
among NTL Sales, Nike Sales, Nike Stock Price, and ROIC271.
Table E-1: Supplement Correlation – NTL & Nike Yearly Growth % & Ni ke Sales &. Nike Stock Price & ROIC
Data Period - Year NTL Growth% Sales NIKE Nike Stock Price Change ROIC
2007 8.00% 9.17% 28.70% 25.80%
2006 -8.50% 8.84% 12.90% 26.70%
2005 -4.30% 12.13% 4.40% 24.10%
2004 9.00% 14.55% 25.70% 20.50%
2003 0.00% 8.13% 32.90% 17.00%
2002 -7.00% 4.26% -8.00% 15.20%
2001 1.30% 5.49% 10.80% 13.90%
2000 3.20% 2.49% 4.30% 14.30%
Correlation
NTL Sales vs Nike Stock 61.1%
Nike Sales vs. Stock 50.4%
Reference:
NTL Sales vs. Nike Sales 26.5%
NTL Sales vs. ROIC -6.5%
Nike Sales vs. ROIC 65.4%
Nike Stock vs. ROIC 32.1%
271 ROIC: Return on Invested Capital, an accounting measurement of return on investment. to assess a company's efficiency at allocating the capital under its control to profitable investments. ROIC = (Net Operating Profit After Taxes--NOPAT) / (Invested Capital--IC) NOPAT = (Operating Profit) x (1 - Tax Rate) IC = (Total Assets) - (Excess Cash) - (Non-Interest-Bearing Current Liabilities)

Real Options Methodology in Sportswear Retail Investment Valuation Appendix E
262
As can be seen from the table, the correlation between Nike sales and the Nike
stock price and between NTL sales to the Nike stock price demonstrate strong correlation
relation.

Real Options Methodology in Sportswear Retail Investment Valuation Appendix F
263
Appendix F: Other Approach to define Sigma
F-1 UK Retail index
In this study, the United Kingdom Retail Sales Index (RSI) is the industrial group
index. In past studies, an industry index has been used to estimate the volatility of a
project’s value. However, as we discussed in the previous section: the distinguishing
characteristics of the sportswear retail industry (SRI) differentiate itself from the general
apparel and footwear retail industry. We will further elaborate SRI characteristics in the
following discussion, leading to the conclusion the RSI would not be an appropriate
definition of sigma in this study.
The Retail Sales Index is a measure of the consumer spending and retail output in
the United Kingdom. It is derived from a monthly survey, conducted by the Office for
National Statistics, of 5,000 businesses in Great Britain, including all large retailers and a
representative sample of smaller businesses. This is a key indicator272 of the state and
direction of the economy. It is also used to help estimate consumer spending on retail
goods and the output of the retail sector, both of which feed into the compilation of the
272 The value of retail sales reported via the monthly survey is converted to a chained volume basis using weighted contributions of price indices for various categories of retail goods. These commodity price indices are consistent with the consumer price indices published by the ONS every month. For each four-or-five-week period, respondents report their total value of retail sales for all their outlets and by mail order (including via the internet). The statistics include VAT. The reference year has been set at 2005=100. Installment credit sales are valued at the credit price of the goods, that is including deposits and, where credit is provided by the shop, credit charges. Figures of credit sales relate only to the period during which the transactions took place; cash received from credit sales in previous periods is not included. Sales by chemists and opticians exclude receipts under the National Health Service. Sales of automotive fuel are also included.

Real Options Methodology in Sportswear Retail Investment Valuation Appendix F
264
National Accounts. Accordingly, the Retail Sales Index initially appears promising as a
proxy for NTL investment rate of return.
However, unlike the regular large retailers and smaller retailing businesses whose
retail data are encapsulated by the Retail Sales Index, the Sportswear Retail Industry
(particularly flagship stores such as NTL) has its own distinguishing characteristics that
render the Retail Sales Index an inappropriate proxy.
F-2 Other Sigma definition approaches
Various RO Calculation results based on different was to define sigmas.
Examples are as the following. However these variables establish less significant
correction / regression with the underlying assets; hence, being excluded.
Applying the BSOPM, when sigma is defined as –
1) Std_Dev of VFTSE273: the real investment value of the refitting investment is $**
million; standard capital budgeting analysis yields a net present value of negative
$4.4 million.
2) Std_Dev of 10-Year Nike Company Cash Flow rate of change: the real
investment value of the refitting investment is $** million; standard capital
budgeting analysis yields a net present value of negative $4.4 million.
273 VFTSE reflects the general beliefs and risk-preferences of investors that underlie their investment equity index returns in UK. It is a “market forecast”273. However it is because of its “generalization”, it imposes the limitation of using this index as the proxy to represent the rate of return of the NTL. While VFTSE can be considered as one of the ways to define sigma, we realize the limitation of using this index as the proxy to represent the rate of return of the underlying asset.

Real Options Methodology in Sportswear Retail Investment Valuation Appendix F
265
3) Std_Dev of 1-Year Nike Net Income: the real investment value of the refitting
investment is $** million; standard capital budgeting analysis yields a net present
value of negative $4.4 million.
Table F-1: NPV & RO NTL Calculation Result–Std Dev VFTSE
Total Investment Construction Cost (USD Thousand) $ (**)
PV of Projected Cash Flows: (USD Thousand) $ **
NPV (USD Thousand) $ (4,467)
RO (USD Thousand) $ 2,770
Table F-2: NPV & RO NTL Calculation Result –Std Dev Cash Flow
Total Investment Construction Cost plus Fit-out $ (**)
PV of Projected Cash Flows: $ **
Lease Term: 35 year with 10 years breach option $
NPV $ (4,468)
RO $ 5,587
Table F-3: NPV & RO NTL Calculation Result–Std Dev Net Income
Total Investment Construction Cost plus Fit-out $ (**)
PV of Projected Cash Flows: $ **
Lease Term: 35 year with 10 years breach option
NPV $ (4,468)
RO $ 6,220
Real Options Methodology in Sportswear Retail Investment Valuation Appendix G
266
Appendix G: RO testing example - “Flushed Data.”
Assume that a proposal to build a stadium in one year’s time is pending before the
city council of a major metropolitan area, and sportswear retailer X must decide whether
to construct a new store in the city. If the stadium is constructed, a store’s sales are is
expected to generate an NPV of $10M; if the city council decides to build the stadium a
year later, then the new store is expected to have an NPV of $9M; if the City decides not
to build the stadium, however, the new store is expected to have an NPV of -$14M. If the
likelihood of construction approval is 50%, defer building stadium is 5%, and remaining
45% is not to build stadium. An “Expected NPV Analysis” is demonstrated in Figure 1274.
If sportswear retailer Y has a greater appetite for risk and decides to build a store,
though, and the city council does approve the stadium, the competitor may be able to
exploit its first mover advantage to gain market share that may be hard to retake.
Nonetheless, sportswear retailer A’s decision not to build was the “right” one given the
information available at the time it was made.
On the other hand, if competitor X had an option to delay its ultimate decision
whether to build or not until after the city council made its decision, it could substantially
eliminate its uncertainty. It might be able to do this, for example, by spending a
nonrefundable $1.5M to purchase an option to lease the most desirable retail premises
and to obtain commitments by architects and construction firms to build the store if
approval is granted by the city council. This “wait-and-see” approach determines the
274 This format is originated from Strategic Flexibility in Financial Industry, Deloitte.

Real Options Methodology in Sportswear Retail Investment Valuation Appendix G
267
NPV of the store if the stadium is approved and subtracts the nonrefundable up-front
costs, and then repeats the process under the condition that the city council decides not to
build the stadium, as follows: in essence, this is a Real Option concept: it incorporates
data regarding expected cash flows and variation or volatility in those cash flows to
produce a reliable estimate of fair value. Real Options analysis addresses the uncertainty
of projects through payment of a premium to secure the right to invest until the
uncertainty is removed or solved.
Figure G-1: Example of a Sportswear Retail Industry Investment Valuation Using RO
Example Chart
Option Price($1.5)
Uncertain Result5%
Store Investment($5.9)
$10M10%
$9M80%
($14M)10%
eNPV(t1) = $7.0
Favorable 50%
Store Investment($5.9)
$10M85%
$9.0M10%
($14M)5%
eNPV(t1)
= (0.85)($10)+ (0.1)($9.0)+ (0.05)(-$14)= $9.0
Negative Result45%
Store Investment($5.9)
$10M5%
$9M10%
$085%
eNPV(t1) = -$10.2
Expected Value(t1) = (0.50)($9.08)+ (00.5)($7.0)+ (0.45)(-$10.2)= $0.25mil
Option Value(t1)
eNOV(t0)
= (0.50)($9.0)+ (00.5)($7.0)+ (0%)(-$10.2)= $4.8mil
= $4.8 - $1.5= $3.3mil
t1
versus
E N P V in G ray-A rea: just
above zero N PV
N O V
F irstly: A lternative valuation
net off option prem ium :
$3 .3m il;
Secondly: by spend ing $1 .5m il
on "insurance", the firm avoids
the risk of loss ($14m il).