Embed Size (px)
Citation preview

August 2018
REAL ESTATE MARKET INSIGHTS
Executive Summary
• Philippine office supply is forecasted to grow by 46% in the next 6 years adding 5.28 millionto the current supply of 11.58 million.
• 688,474 square meters of the 2018 office supply are already either leased or pre-committed. This makes our forecasted FY 2018 take-up of 937,000 square metersachievable.
• The IT-BPM industry, which includes shared services, took up 46% of FY 2017 demand,while Offshore/Online Gaming took up 30%. The IT-BPM industry is expected to reboundwhile the Offshore/Online Gaming is expected to grow this 2018.
• Rents and land values remain at all-time high across most districts.
• China has become a significant investor in economies all over the world.
• AI will benefit diverse industries primarily healthcare/medical sciences, agriculture,environment, banking and finance.
• Tourism has the potential to be one of the biggest drivers of the Philippine economy.
• Developers, investors, and stakeholders must all partake in credible, sensible, andsustainable Masterplanning.
2

METRO MANILAOFFICE MARKET

Quezon City
Ortigas/Pasig
Makati
BGC / Taguig
Bay/Pasay
Alabang
Parañaque
Las Pinas
Manila
Manda-luyong
San Juan
Metro Manila Cityscapes
3 MAJOR CBDs
46 BUSINESS PARKS
QUEZON CITY. UP TECHNOHUB. EASTWOOD CITY. ETON CENTRIS.
ARANETA, CYBERPARK. ROBINSONS BRIDGETOWNE IT PARK. VERTIS NORTH. UP TOWN
CENTER. FAIRVIEW TERRACES. ALI CLOVERLEAF BALINTAWAK. NUVO. MANDALUYONG. GREENFIELD DISTRICT. ROBINSONS CYBERGATE. ROCKWELL SHERIDAN. SAN JUAN. SANTOLAN TOWN PLAZA. MUNTINLUPA. FILINVEST CORPORATE CITY. LA FUERZA.
NORTHGATE CYBERZONE. MADRIGAL BUSINESS PARK. ALABANG WEST. TAGUIG. ARCA
SOUTH. LAS PINAS. PORTOFINO. EVIA. PASAY. NEWPORT CITY. SM MALL OF ASIA
COMPLEX. METROPOLITAN BUSINESS PARK. DOUBLE DRAGON CYBERCAMPUS. FILINVEST
CYBERZONE PASAY. PARANAQUE. ASIAWORLD CITY. ASEANA BUSINESS PARK. AYALA
ASEANA. MANILA. CITYPLACE. SAN LAZARO.
• Most of these districts will be fully developed by 2018.• There will be little land left for development.• The most important districts moving forward will be
Bonifacio Global City, Bay Area, Filinvest City, Evia and Arca South.
ORTIGAS CBD. ROCKWELL BUSINESS CENTER. ARCOVIA CITY. SILVER CITY. CAPITOL COMMONS.
MAKATI MAKATI CBD. CENTURY CITY. ROCKWELL CENTER. CIRCUIT MAKATI.
ORTIGAS
BGC BONIFACIO GLOBAL CITY. MCKINLEY WEST. MCKINLEY HILL.UPTOWN. VERITOWN.
4
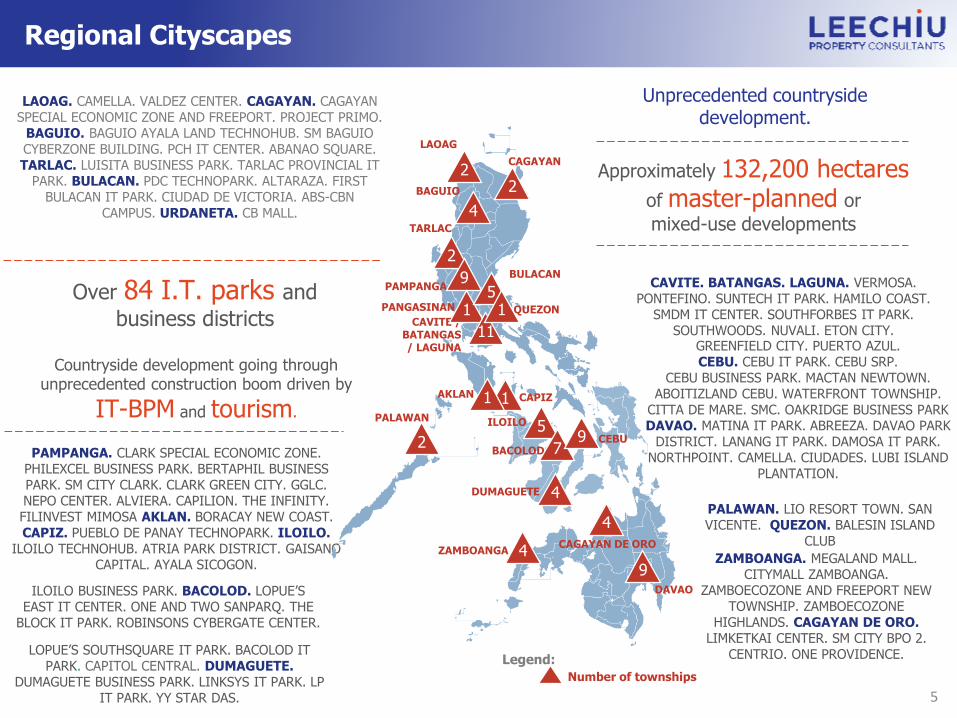
Regional Cityscapes
LAOAG. CAMELLA. VALDEZ CENTER. CAGAYAN. CAGAYAN SPECIAL ECONOMIC ZONE AND FREEPORT. PROJECT PRIMO.
BAGUIO. BAGUIO AYALA LAND TECHNOHUB. SM BAGUIO CYBERZONE BUILDING. PCH IT CENTER. ABANAO SQUARE. TARLAC. LUISITA BUSINESS PARK. TARLAC PROVINCIAL IT
PARK. BULACAN. PDC TECHNOPARK. ALTARAZA. FIRST BULACAN IT PARK. CIUDAD DE VICTORIA. ABS-CBN
CAMPUS. URDANETA. CB MALL.
Over 84 I.T. parks and
business districts
Countryside development going throughunprecedented construction boom driven by
IT-BPM and tourism.
PAMPANGA. CLARK SPECIAL ECONOMIC ZONE. PHILEXCEL BUSINESS PARK. BERTAPHIL BUSINESS PARK. SM CITY CLARK. CLARK GREEN CITY. GGLC. NEPO CENTER. ALVIERA. CAPILION. THE INFINITY. FILINVEST MIMOSA AKLAN. BORACAY NEW COAST.CAPIZ. PUEBLO DE PANAY TECHNOPARK. ILOILO.
ILOILO TECHNOHUB. ATRIA PARK DISTRICT. GAISANO CAPITAL. AYALA SICOGON.
ILOILO BUSINESS PARK. BACOLOD. LOPUE’S EAST IT CENTER. ONE AND TWO SANPARQ. THE
BLOCK IT PARK. ROBINSONS CYBERGATE CENTER.
LOPUE’S SOUTHSQUARE IT PARK. BACOLOD IT PARK. CAPITOL CENTRAL. DUMAGUETE.
DUMAGUETE BUSINESS PARK. LINKSYS IT PARK. LP IT PARK. YY STAR DAS.
CAVITE. BATANGAS. LAGUNA. VERMOSA.PONTEFINO. SUNTECH IT PARK. HAMILO COAST.
SMDM IT CENTER. SOUTHFORBES IT PARK. SOUTHWOODS. NUVALI. ETON CITY.
GREENFIELD CITY. PUERTO AZUL. CEBU. CEBU IT PARK. CEBU SRP.
CEBU BUSINESS PARK. MACTAN NEWTOWN. ABOITIZLAND CEBU. WATERFRONT TOWNSHIP.
CITTA DE MARE. SMC. OAKRIDGE BUSINESS PARKDAVAO. MATINA IT PARK. ABREEZA. DAVAO PARK
DISTRICT. LANANG IT PARK. DAMOSA IT PARK. NORTHPOINT. CAMELLA. CIUDADES. LUBI ISLAND
PLANTATION.
Approximately 132,200 hectares of master-planned or
mixed-use developments
PALAWAN. LIO RESORT TOWN. SAN VICENTE. QUEZON. BALESIN ISLAND
CLUB
ZAMBOANGA. MEGALAND MALL. CITYMALL ZAMBOANGA.
ZAMBOECOZONE AND FREEPORT NEW TOWNSHIP. ZAMBOECOZONE
HIGHLANDS. CAGAYAN DE ORO.LIMKETKAI CENTER. SM CITY BPO 2.
CENTRIO. ONE PROVIDENCE.
LAOAG
CAGAYAN
BAGUIO
TARLAC
PAMPANGABULACAN
QUEZONCAVITE /
BATANGAS / LAGUNA
CAPIZ
PALAWAN ILOILO
BACOLOD
DUMAGUETE
DAVAO
ZAMBOANGACAGAYAN DE ORO
PANGASINAN
22
4
2
9
1
11
1
25
79 CEBU
4
4
4
9
Number of townships
Legend:
51
Unprecedented countrysidedevelopment.
1AKLAN
5
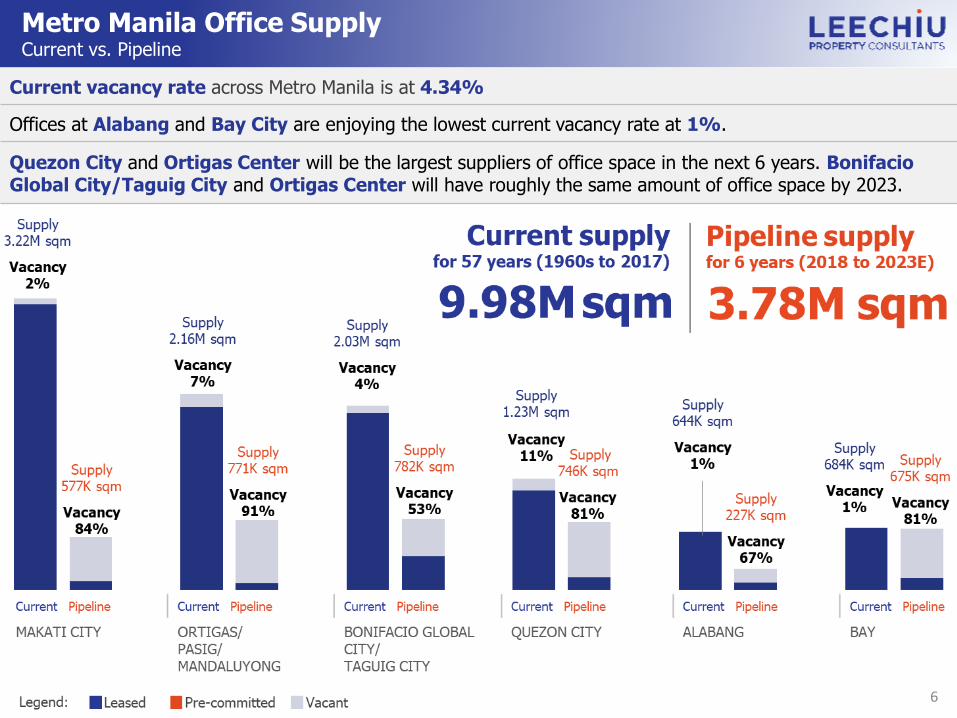
Metro Manila Office SupplyCurrent vs. Pipeline
Current vacancy rate across Metro Manila is at 4.34%
Offices at Alabang and Bay City are enjoying the lowest current vacancy rate at 1%.
Quezon City and Ortigas Center will be the largest suppliers of office space in the next 6 years. Bonifacio Global City/Taguig City and Ortigas Center will have roughly the same amount of office space by 2023.
6
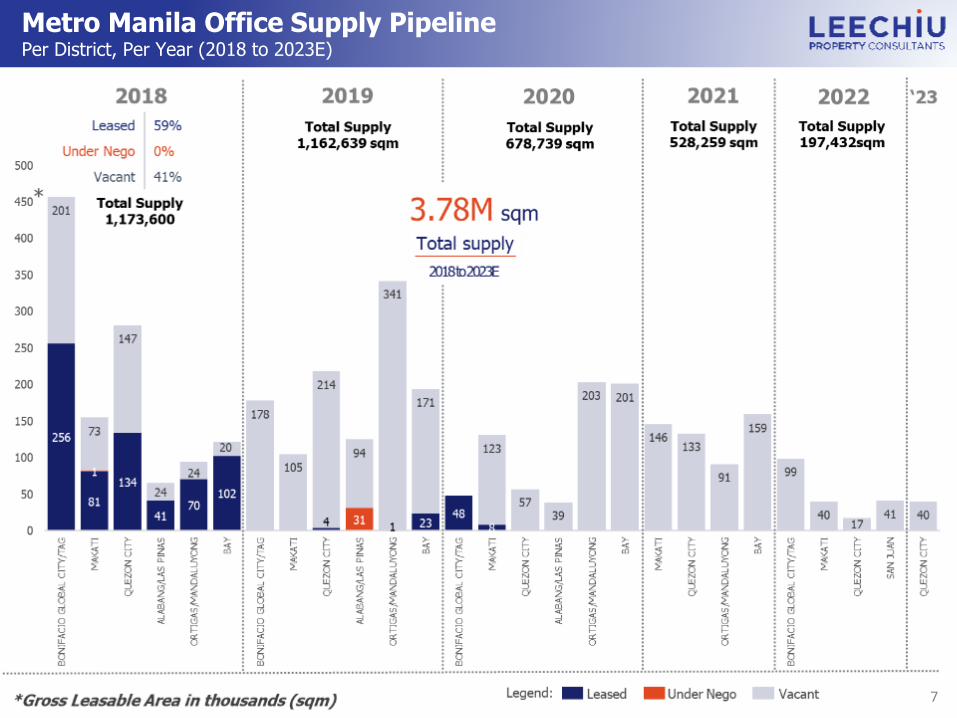
Metro Manila Office Supply Pipeline Per District, Per Year (2018 to 2023E)
7
8
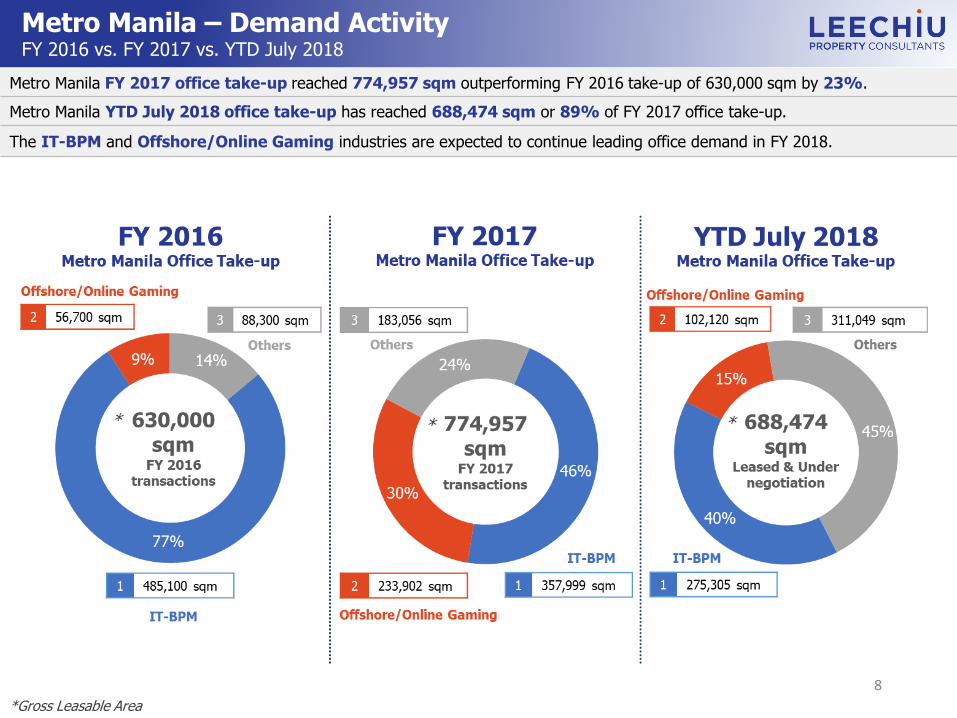
Metro Manila FY 2017 office take-up reached 774,957 sqm outperforming FY 2016 take-up of 630,000 sqm by 23%.
Metro Manila YTD July 2018 office take-up has reached 688,474 sqm or 89% of FY 2017 office take-up.
The IT-BPM and Offshore/Online Gaming industries are expected to continue leading office demand in FY 2018.
Metro Manila – Demand ActivityFY 2016 vs. FY 2017 vs. YTD July 2018
*Gross Leasable Area
LPC | OFFICE OVERVIEW 9
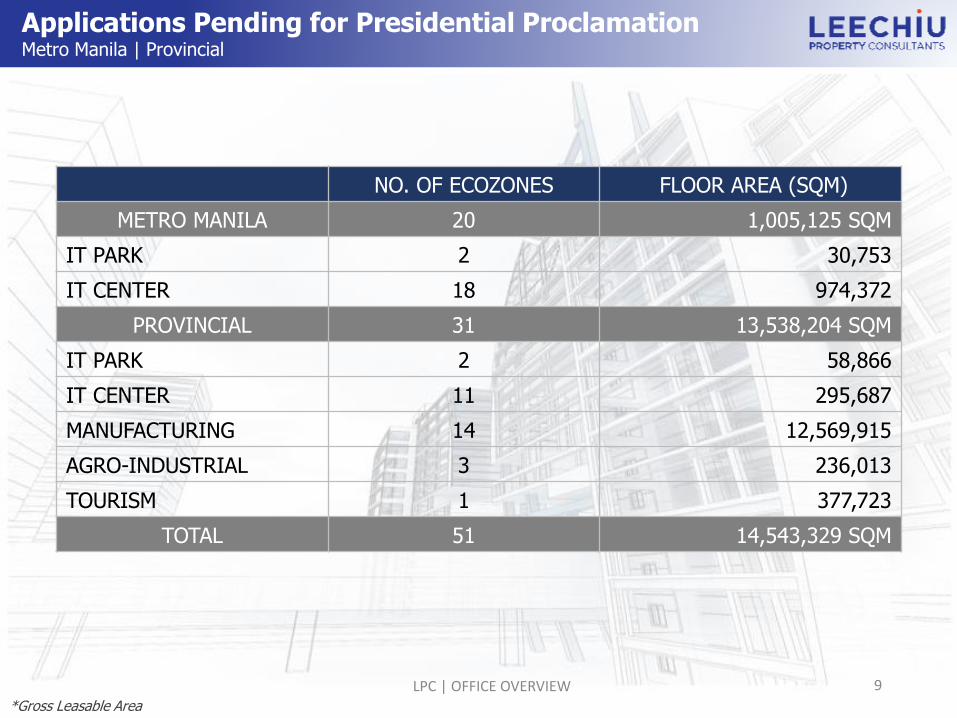
Applications Pending for Presidential ProclamationMetro Manila | Provincial
*Gross Leasable Area
NO. OF ECOZONES FLOOR AREA (SQM)
METRO MANILA 20 1,005,125 SQM
IT PARK 2 30,753
IT CENTER 18 974,372
PROVINCIAL 31 13,538,204 SQM
IT PARK 2 58,866
IT CENTER 11 295,687
MANUFACTURING 14 12,569,915
AGRO-INDUSTRIAL 3 236,013
TOURISM 1 377,723
TOTAL 51 14,543,329 SQM
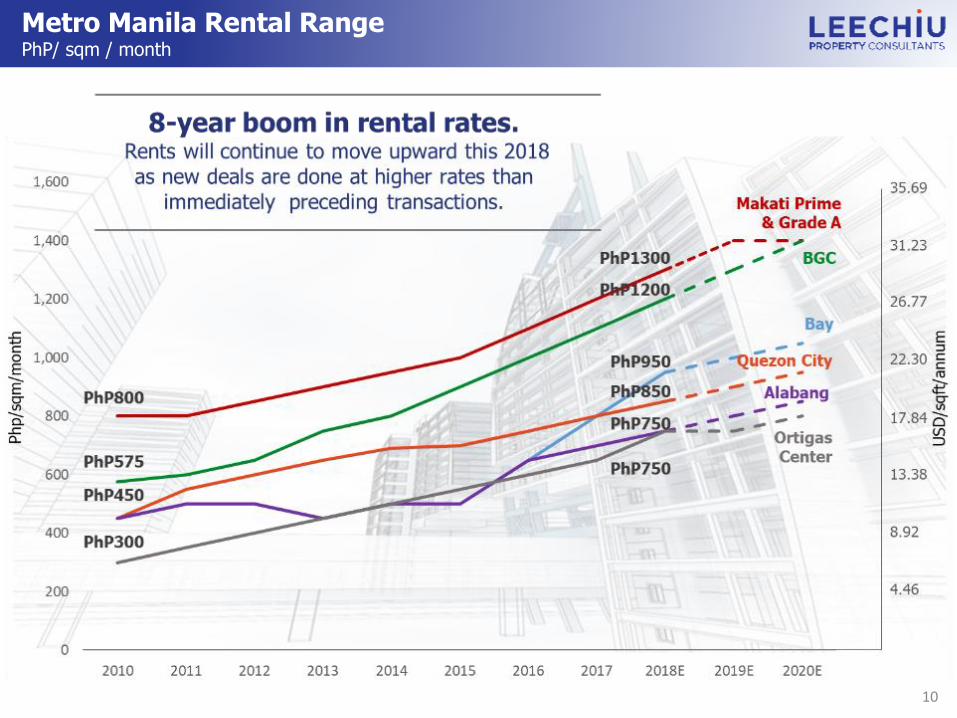
Metro Manila Rental RangePhP/ sqm / month
10
2016 2017 2016-17 YTD 2018 2017-18
Business District
*FAR Range
Land Values PhP/sqm
AV (GFA/sqm)
Land ValuesPhP/sqm
AV (GFA/sqm)
Y-o-Y Increase
Land ValuesPhP/sqm
AV (GFA/sqm)
Y-o-Y Increase
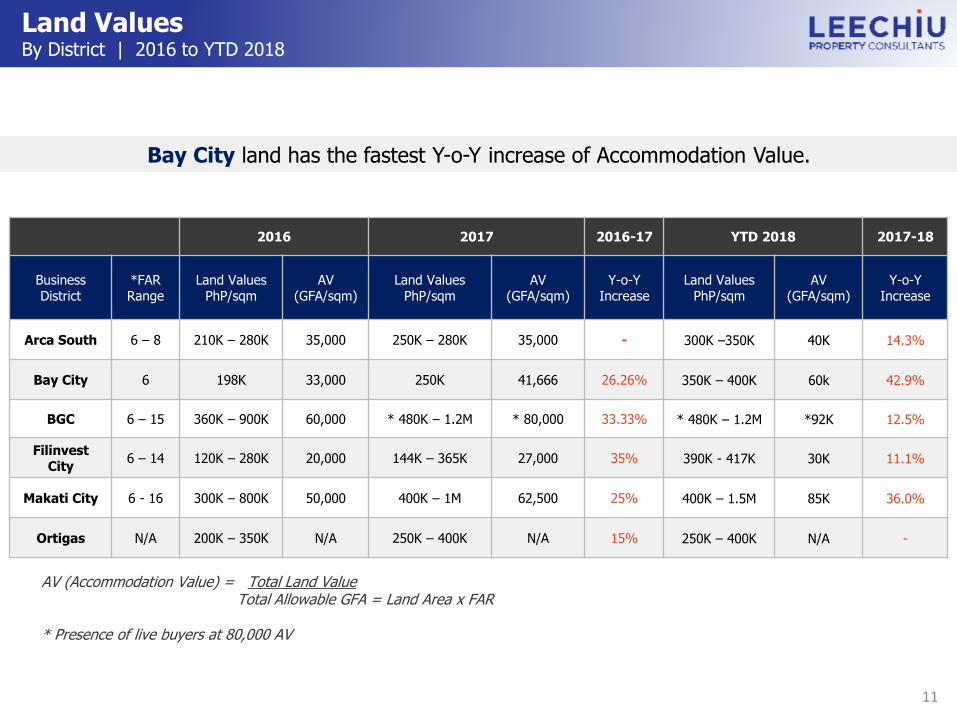
Arca South 6 – 8 210K – 280K 35,000 250K – 280K 35,000 - 300K –350K 40K 14.3%
Bay City 6 198K 33,000 250K 41,666 26.26% 350K – 400K 60k 42.9%
BGC 6 – 15 360K – 900K 60,000 * 480K – 1.2M * 80,000 33.33% * 480K – 1.2M *92K 12.5%
Filinvest City
6 – 14 120K – 280K 20,000 144K – 365K 27,000 35% 390K - 417K 30K 11.1%
Makati City 6 - 16 300K – 800K 50,000 400K – 1M 62,500 25% 400K – 1.5M 85K 36.0%
Ortigas N/A 200K – 350K N/A 250K – 400K N/A 15% 250K – 400K N/A -
Land ValuesBy District | 2016 to YTD 2018
11
Bay City land has the fastest Y-o-Y increase of Accommodation Value.
AV (Accommodation Value) = Total Land Value Total Allowable GFA = Land Area x FAR
* Presence of live buyers at 80,000 AV
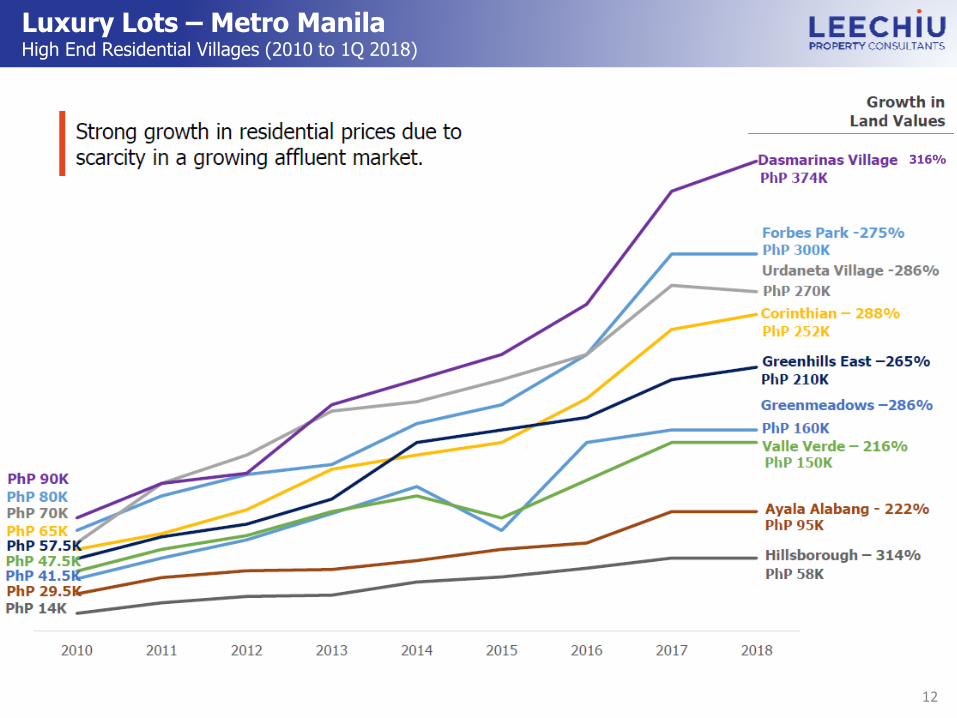
Luxury Lots – Metro ManilaHigh End Residential Villages (2010 to 1Q 2018)
316%
12
YearDasmariñas
VillageForbes Park Urdaneta Village
San Lorenzo Village
Bel-Air Village Ayala Alabang
1962 PhP 88.00 PhP 88.00 PhP 75.00 PhP 55.00 PhP 57.00 -
1972(growth)
PhP 200.00(2.27x)
PhP 228.00(2.6x)
PhP 195.00(2.6x)
PhP 175.00(3.18x)
PhP 188.00(3.30x)
PhP 170.00
1982(growth)
PhP 1,500.00(7.5x)
PhP 1,750.00(7.67x)
PhP 1,400.00(7.18x)
PhP 1,375.00(7.86x)
PhP 1,300.00(6.91x)
PhP 300.00(1.76x)
1992(growth)
PhP 10,500.00(7.5x)
PhP 10,500.00(6x)
PhP 6,875.00(4.91x)
PhP 5,550.00(4.04x)
PhP 8,500.00(6.54x)
PhP 10,000.00(33.33x)
2002(growth)
PhP 42,000.00(4x)
PhP 57,500.00(5.48x)
PhP 41,470.00(6.03x)
PhP 20,428.00(3.68x)
PhP 28,758.00(3.38x)
PhP 22,500.00(2.25x)
2012(growth)
PhP 180,000.00(4.28x)
PhP 130,000.00(2.26x)
PhP 85,000.00(2.05x)
PhP 110,000.00(5.38x)
PhP 159,000.00(5.53x)
PhP 65,000.00(2.89x)
2017(growth)
PhP 345,000.00(1.91x)
PhP 280,000.00(2.15x)
PhP 250,000.00(2.94x)
PhP 260,000.00(2.36x)
PhP 260,000.00(1.64x)
PhP 95,000.00(1.46x)
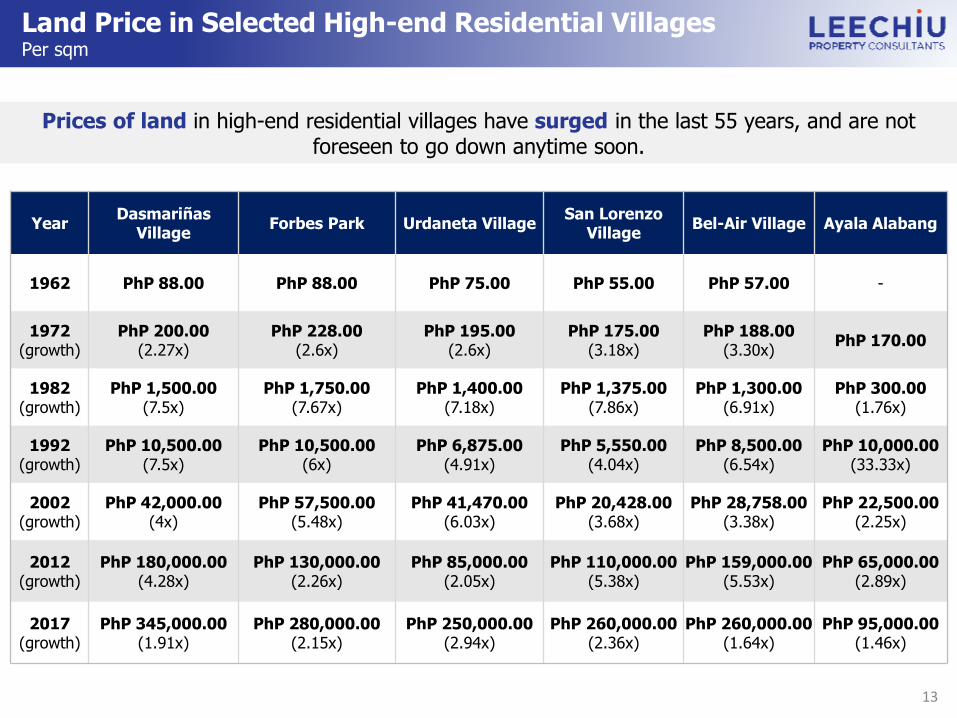
Land Price in Selected High-end Residential VillagesPer sqm
Prices of land in high-end residential villages have surged in the last 55 years, and are not foreseen to go down anytime soon.
13

CEBU OFFICE MARKET
15Legend: Leased Vacant Under Nego
*Gross Leasable Area in thousands (sqm)
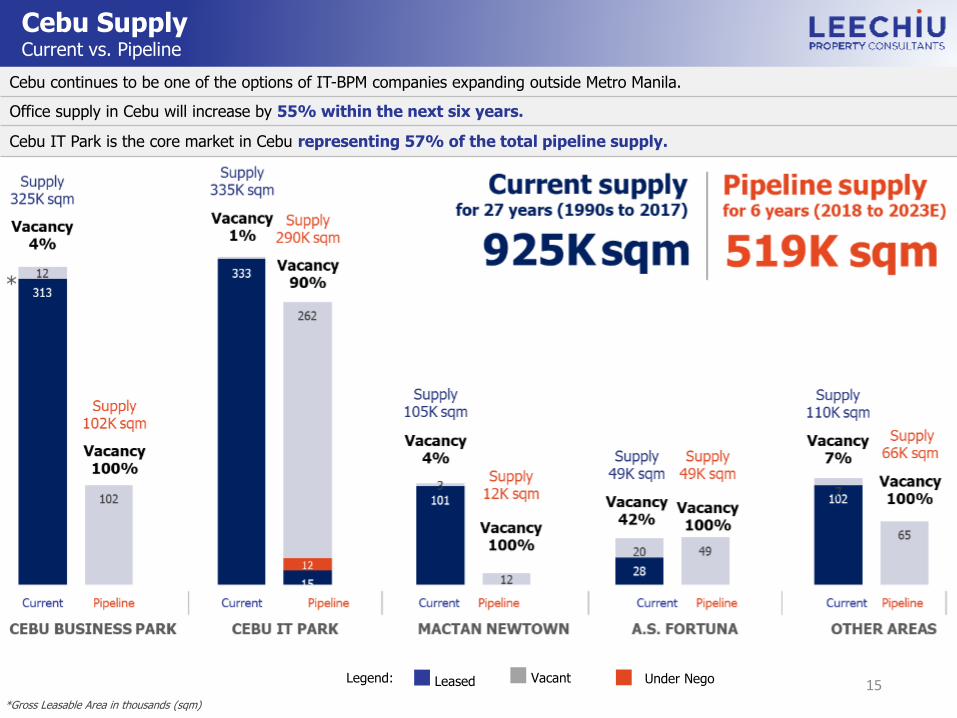
Cebu continues to be one of the options of IT-BPM companies expanding outside Metro Manila.
Office supply in Cebu will increase by 55% within the next six years.
Cebu IT Park is the core market in Cebu representing 57% of the total pipeline supply.
Cebu SupplyCurrent vs. Pipeline
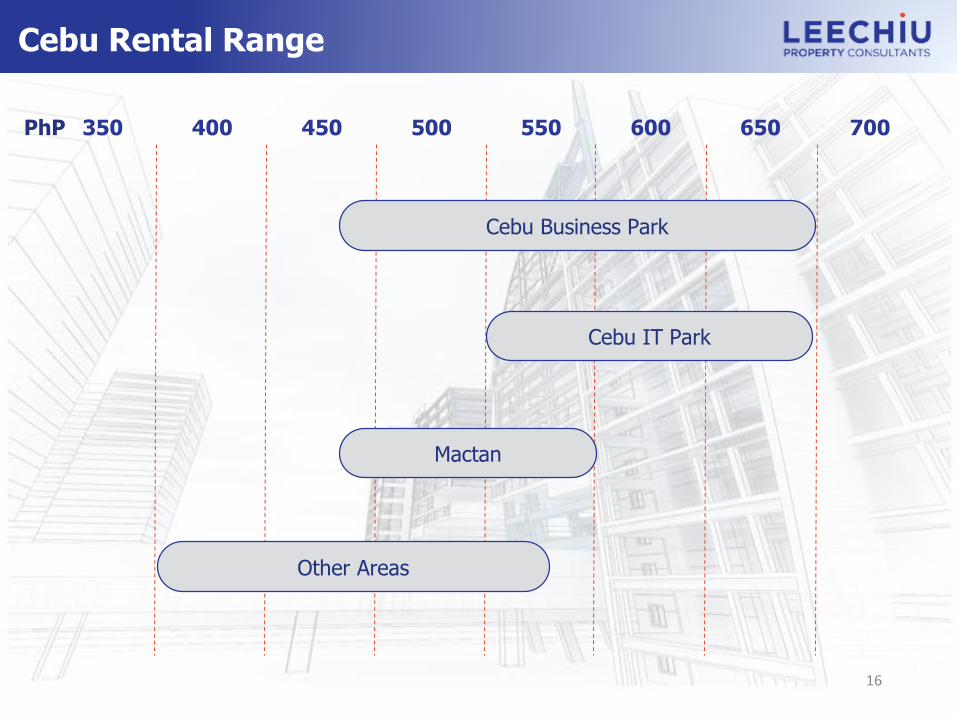
Cebu Rental Range
350 400 450 500 550 600 650 700PhP
Cebu Business Park
Cebu IT Park
Mactan
Other Areas
16
17
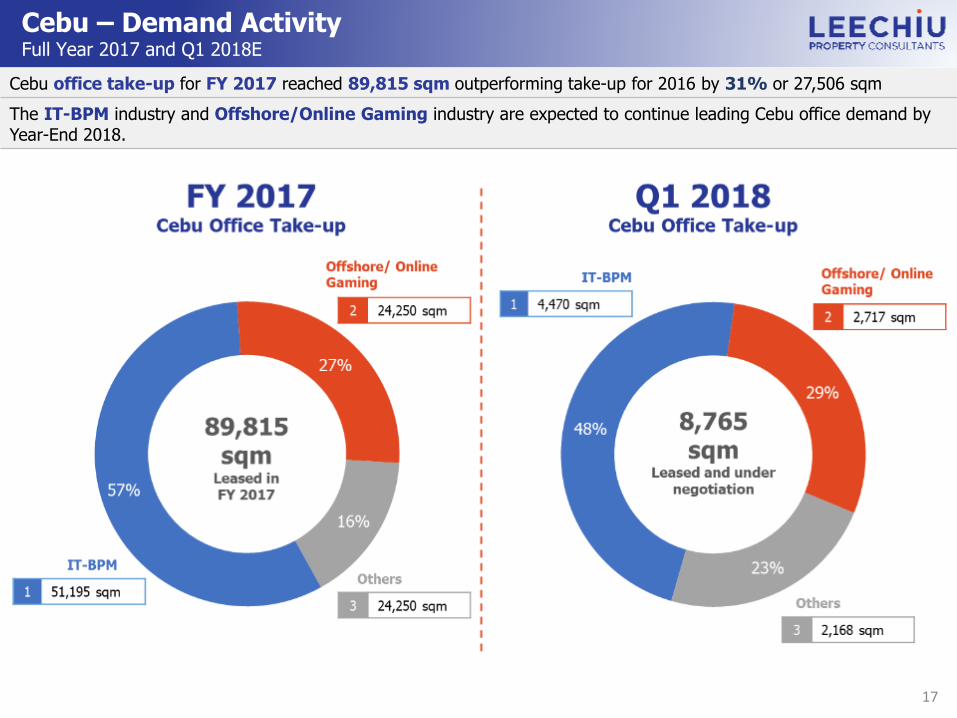
Cebu – Demand ActivityFull Year 2017 and Q1 2018E
Cebu office take-up for FY 2017 reached 89,815 sqm outperforming take-up for 2016 by 31% or 27,506 sqm
The IT-BPM industry and Offshore/Online Gaming industry are expected to continue leading Cebu office demand by Year-End 2018.

PROVINCIALOFFICE MARKET
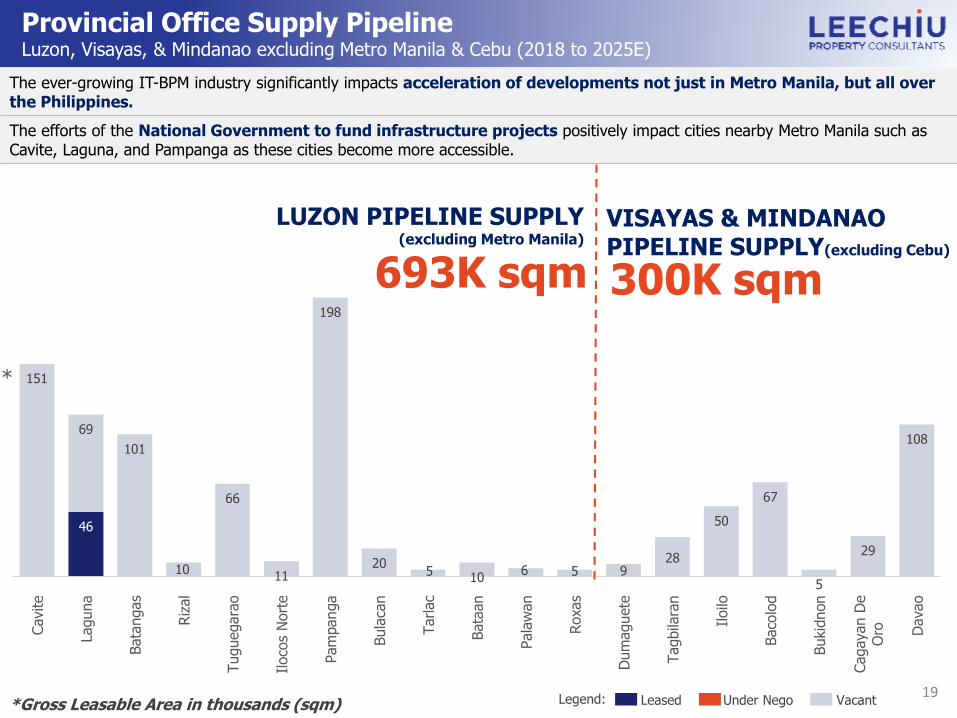
Provincial Office Supply PipelineLuzon, Visayas, & Mindanao excluding Metro Manila & Cebu (2018 to 2025E)
*
The ever-growing IT-BPM industry significantly impacts acceleration of developments not just in Metro Manila, but all over the Philippines.
The efforts of the National Government to fund infrastructure projects positively impact cities nearby Metro Manila such as Cavite, Laguna, and Pampanga as these cities become more accessible.
Legend: Leased Under Nego Vacant
46
151
69
101
10
66
11
198
205 10
6 5 928
50
67
5
29
108
Cavite
Laguna
Bata
ngas
Riz
al
Tuguegara
o
Iloco
s N
ort
e
Pam
panga
Bula
can
Tarlac
Bata
an
Pala
wan
Roxas
Dum
aguete
Tagbila
ran
Iloilo
Baco
lod
Bukid
non
Cagayan D
eO
ro Davao
*Gross Leasable Area in thousands (sqm)
693K sqm
LUZON PIPELINE SUPPLY (excluding Metro Manila)
VISAYAS & MINDANAO PIPELINE SUPPLY(excluding Cebu)
300K sqm
19
20
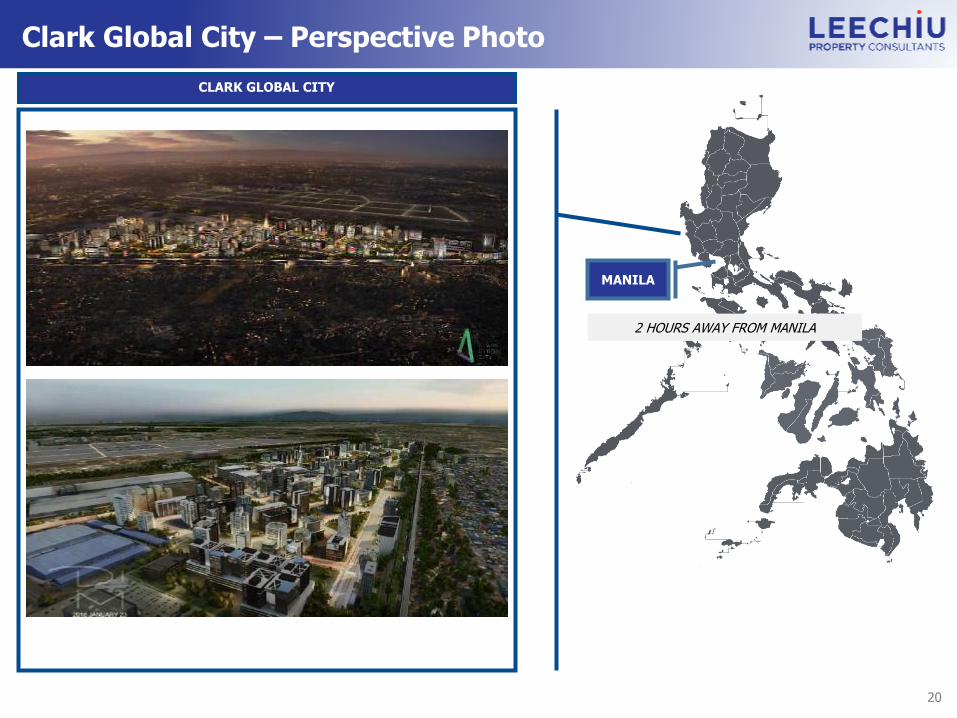
Clark Global City – Perspective Photo
MANILA
2 HOURS AWAY FROM MANILA
CLARK GLOBAL CITY
21
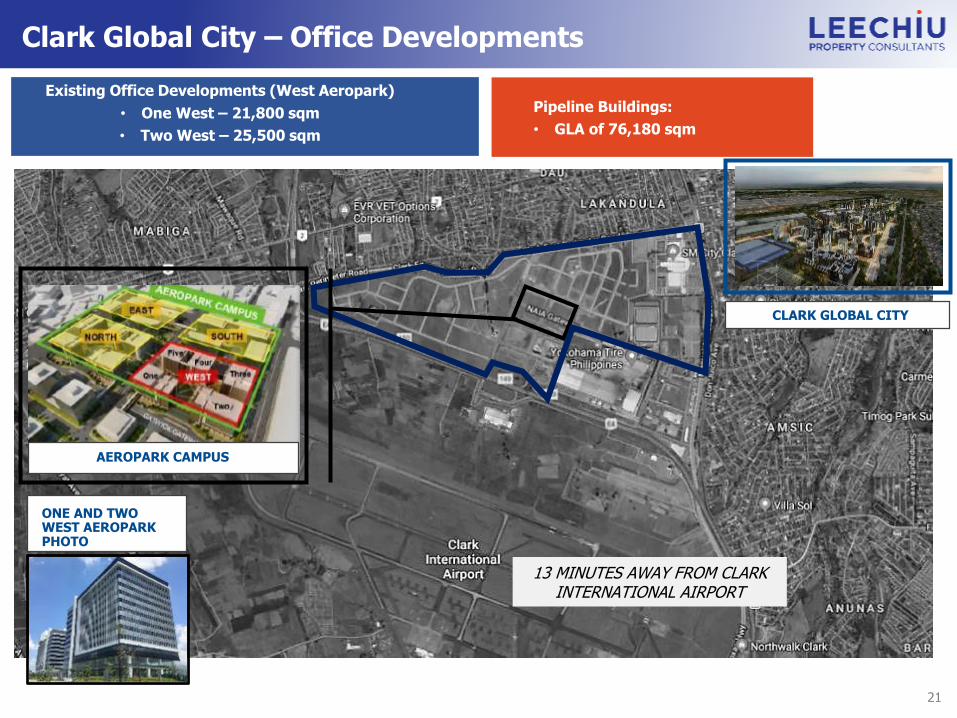
Existing Office Developments (West Aeropark)
• One West – 21,800 sqm
• Two West – 25,500 sqm
ONE AND TWO WEST AEROPARK PHOTO
Pipeline Buildings:
• GLA of 76,180 sqm
CLARK GLOBAL CITY
AEROPARK CAMPUS
13 MINUTES AWAY FROM CLARK INTERNATIONAL AIRPORT
Clark Global City – Office Developments
22
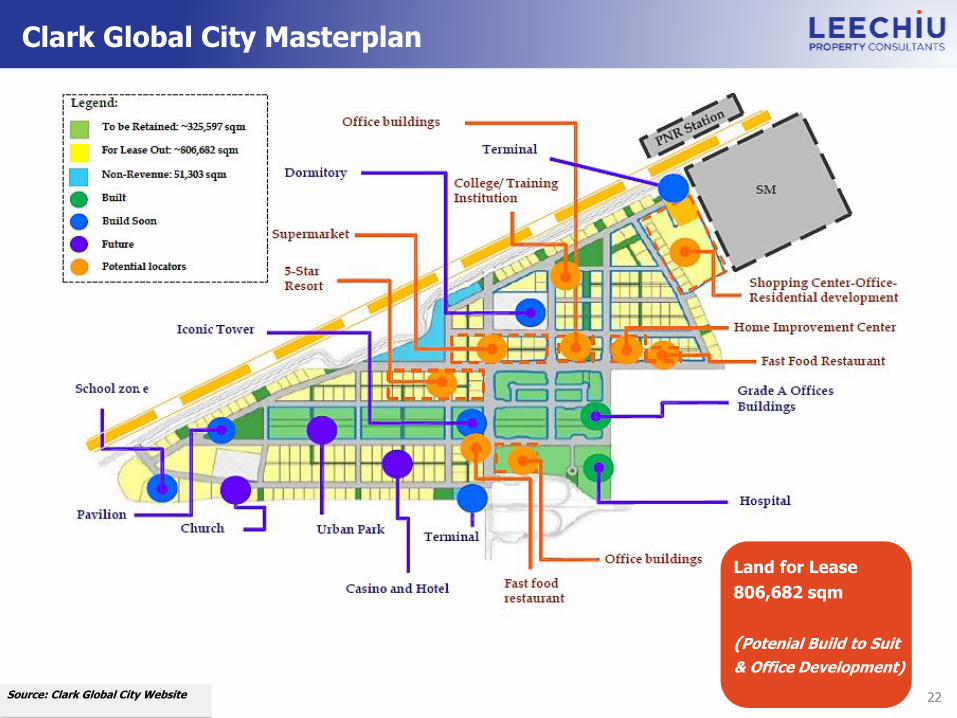
Land for Lease
806,682 sqm
(Potenial Build to Suit
& Office Development)
Source: Clark Global City Website
Clark Global City Masterplan
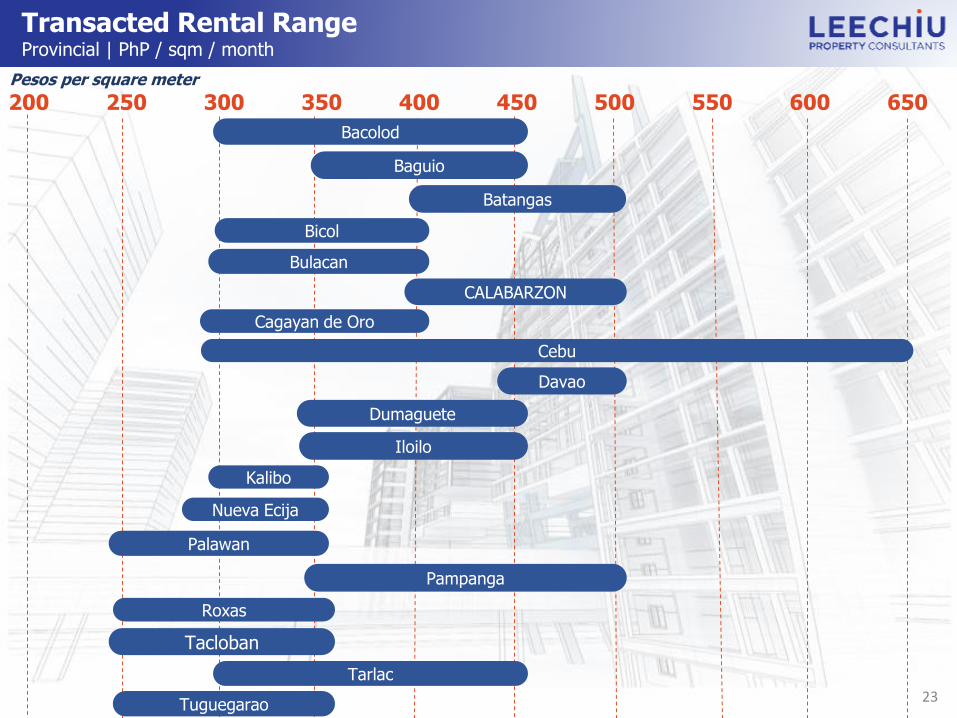
Transacted Rental RangeProvincial | PhP / sqm / month
200 250 300 350 400 450 500 550 600 650
Cebu
Pampanga
CALABARZON
Iloilo
Davao
Cagayan de Oro
Bulacan
Bicol
Bacolod
Baguio
Dumaguete
Tarlac
Kalibo
Nueva Ecija
Palawan
Tuguegarao
Tacloban
Roxas
Pesos per square meter
23
Batangas
Bombing in ZamboangaCapture and sentence ofJemaah Islamiyah2
00
2
Oakwood MutinySARS OutbreakJemaah Islamayah escapeJose Pidal plunder caseDavao airport bombing2
00
3
Infanta Mud SlideSuperferry BombingPhil. General ElectionsGeneral Santos Christmas Bombing2
00
4
V-day BombingHello Garci ScandalGeneral Santos City Mall Bombing2
00
5
MilenyoSouthern Leyte Mud SlideState of Emergency Declaration2
00
6
ZTE ScandalConviction of ERAPGlorietta 2 BombingManila Peninsula MutinyCotabato Bus Station BombingCongress Bombing
20
07
Cotabato City BombingCes Drilon KidnappingMV Princess of the Star SankZTE-NBN IrregularitiesMeralco Stockholders Meeting2
00
8
H1N1 OutbreakTyphoon OndoyTyphoon PepengTyphoon MarakotSuperferry sank in ZamboangaDeath of Corazon AquinoGreenbelt 5 RobberyMaguindanao Massacre
20
09
Typhoon MegiManila Hostage CrisisPhil. General ElectionsDLSU explosion during Bar ExamsInauguration of Pres. Noynoy AquinoVizconde Massacre Case Finished
20
10
Makati Bus ExplosionTropical Storm JuaningTyphoon SendongArrest of former Pres. Gloria Arroyo2
01
1
Corona Impeachment TrialTyphoon PabloCebu Governor Suspension6.9 Magnitude Earthquake Negros and CebuTropical Dispute with China
20
12
Super Typhoon HaiyanCebu Ferry TragedyKilling of Taiwanese FishermanSenate Pork Barrel Scam Hearing5.4 Magnitude Earthquake Cebu and Bohol
20
13
Typhoon HagupitBinay Alleged Corruption HearingsDMCI Construction Hearings2
01
4
Pres. Aquino’s Final SONAKentex Manufacturing Slippers Factory FireTyphoon NonaTyphoon KoppuPNP-SAF killed in Maguindanao
20
15
GDP expanded by 7%National and Local ElectionsRodrigo Duterte proclaimed as new Pres.Pres. Duterte enjoys a record high trust rating of 92%Spratly Islands DisputeDavao BombingWar on DrugsAbove investment grade rating (BBB)State of Emergency Declaration
20
16
20
17
Resorts World Manila AttackExtrajudicial Killings Terrorism threats in Hamilo Coast, Bohol, and PalawanMindanao Martial LawBird Flu OutbreakMarawi SiegePres. Duterte threatens to expel EU Diplomats from the PHFitch upgraded PH credit rating to ‘BBB’ from ‘BBB-”
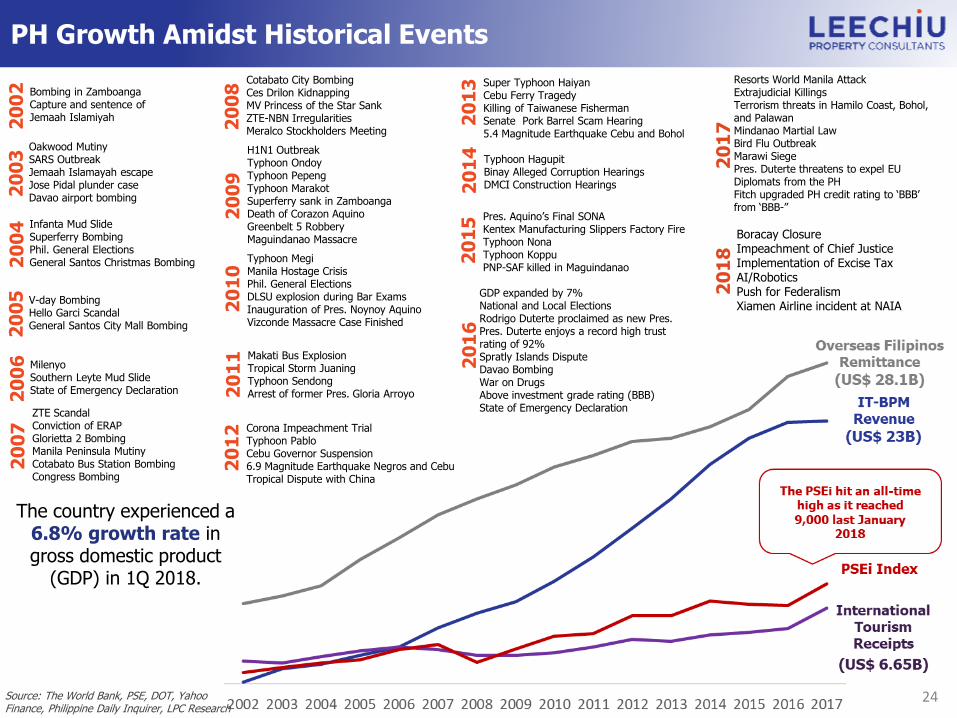
Source: The World Bank, PSE, DOT, Yahoo Finance, Philippine Daily Inquirer, LPC Research
The country experienced a 6.8% growth rate in gross domestic product
(GDP) in 1Q 2018.
24
20
18
Boracay ClosureImpeachment of Chief JusticeImplementation of Excise TaxAI/RoboticsPush for FederalismXiamen Airline incident at NAIA
PH Growth Amidst Historical Events

RESIDENTIALMARKET
26
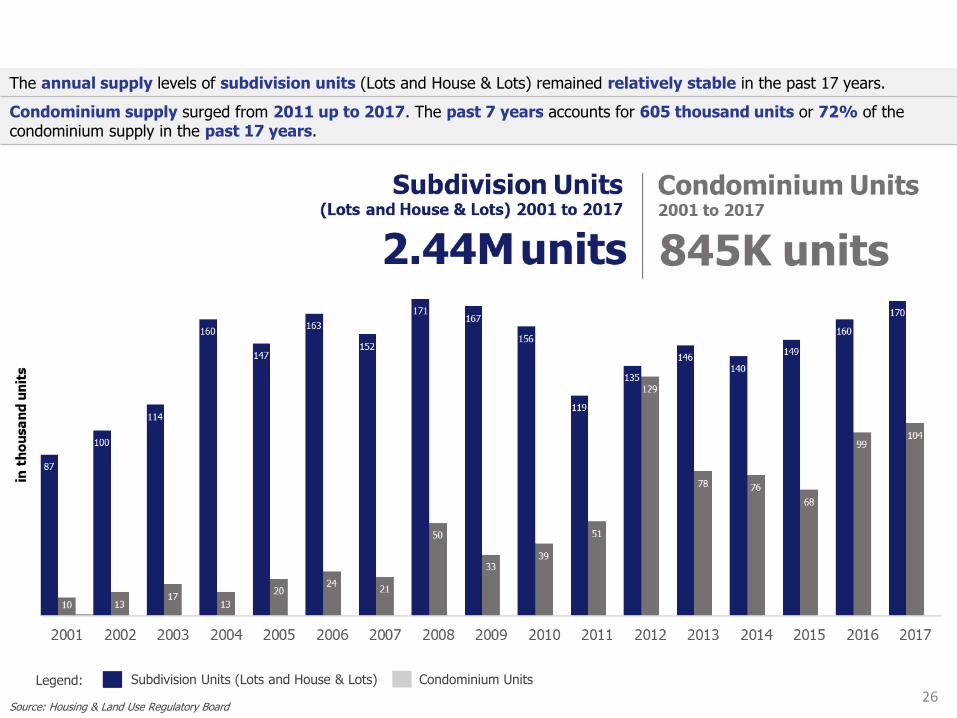
PH Supply of Condominium & Subdivision UnitsBased on Licenses to Sell (2001 to 2017)
Legend: Subdivision Units (Lots and House & Lots) Condominium Units
Source: Housing & Land Use Regulatory Board
The annual supply levels of subdivision units (Lots and House & Lots) remained relatively stable in the past 17 years.
Condominium supply surged from 2011 up to 2017. The past 7 years accounts for 605 thousand units or 72% of the condominium supply in the past 17 years.

GLOBAL TRENDS
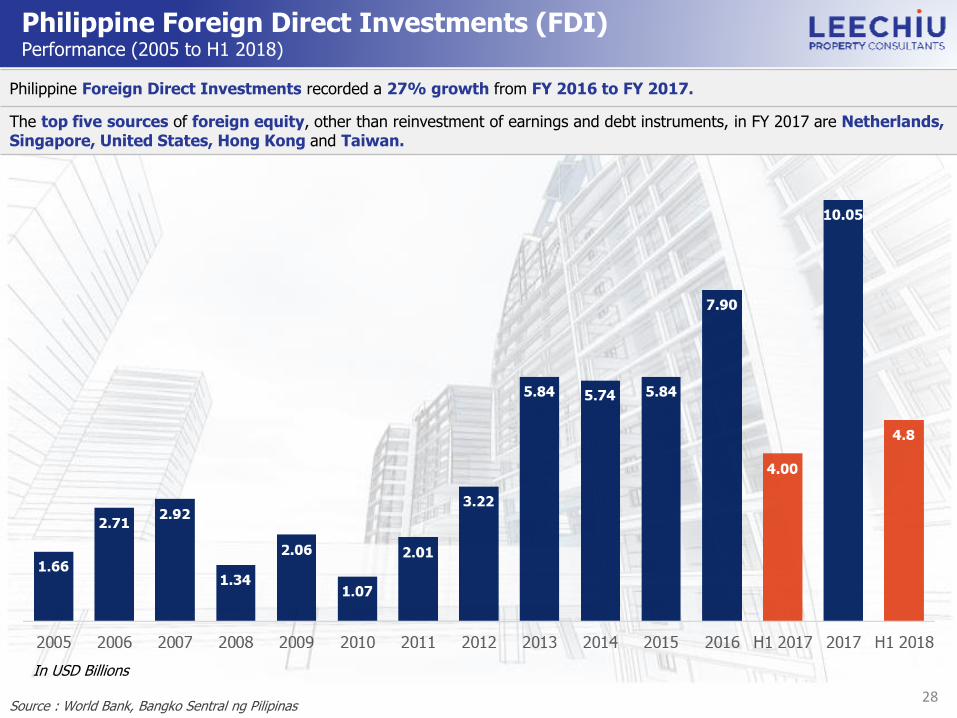
In USD Billions
28
Philippine Foreign Direct Investments (FDI)Performance (2005 to H1 2018)
Source : World Bank, Bangko Sentral ng Pilipinas
Philippine Foreign Direct Investments recorded a 27% growth from FY 2016 to FY 2017.
The top five sources of foreign equity, other than reinvestment of earnings and debt instruments, in FY 2017 are Netherlands, Singapore, United States, Hong Kong and Taiwan.
29
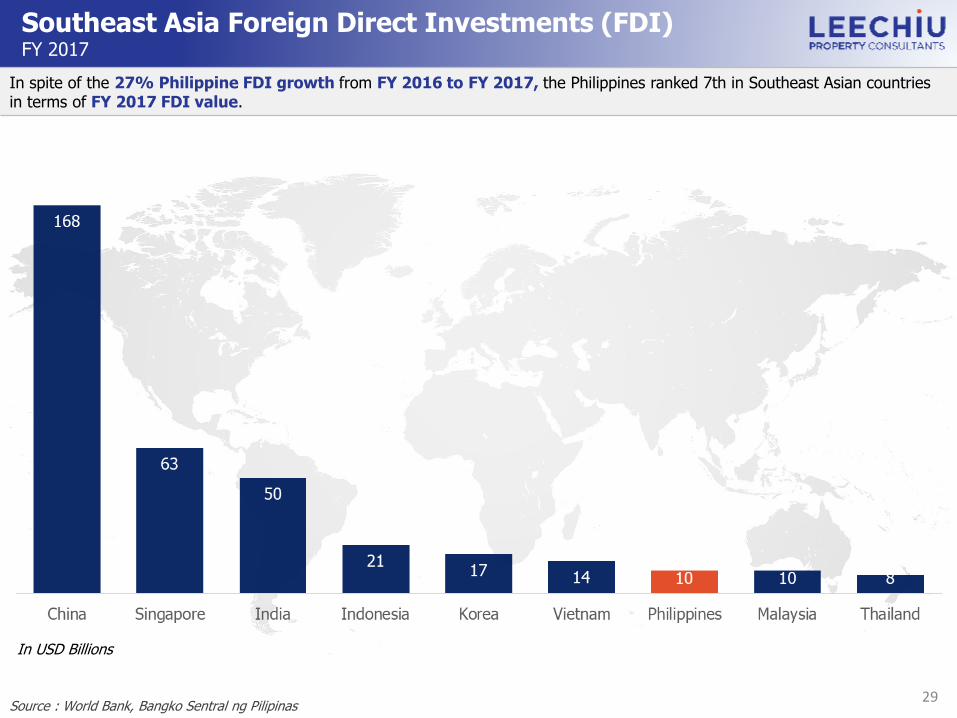
Southeast Asia Foreign Direct Investments (FDI)FY 2017
Source : World Bank, Bangko Sentral ng Pilipinas
In USD Billions
In spite of the 27% Philippine FDI growth from FY 2016 to FY 2017, the Philippines ranked 7th in Southeast Asian countries in terms of FY 2017 FDI value.
30
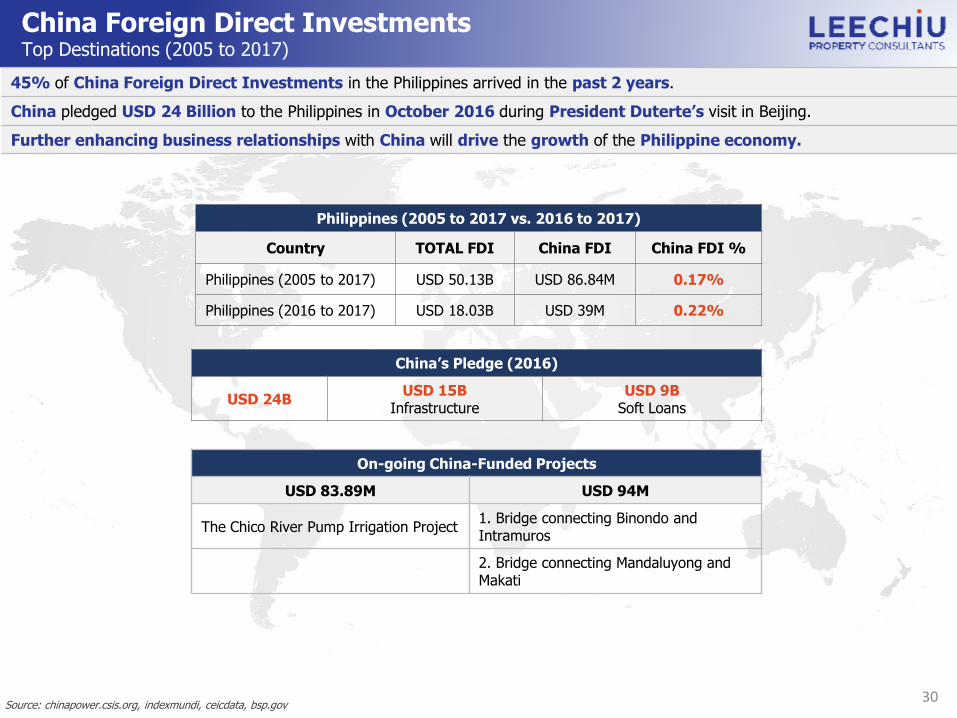
China Foreign Direct InvestmentsTop Destinations (2005 to 2017)
Source: chinapower.csis.org, indexmundi, ceicdata, bsp.gov
45% of China Foreign Direct Investments in the Philippines arrived in the past 2 years.
China pledged USD 24 Billion to the Philippines in October 2016 during President Duterte’s visit in Beijing.
Further enhancing business relationships with China will drive the growth of the Philippine economy.
China’s Pledge (2016)
USD 24BUSD 15B
InfrastructureUSD 9B
Soft Loans
On-going China-Funded Projects
USD 83.89M USD 94M
The Chico River Pump Irrigation Project1. Bridge connecting Binondo and Intramuros
2. Bridge connecting Mandaluyong and Makati
Philippines (2005 to 2017 vs. 2016 to 2017)
Country TOTAL FDI China FDI China FDI %
Philippines (2005 to 2017) USD 50.13B USD 86.84M 0.17%
Philippines (2016 to 2017) USD 18.03B USD 39M 0.22%
31
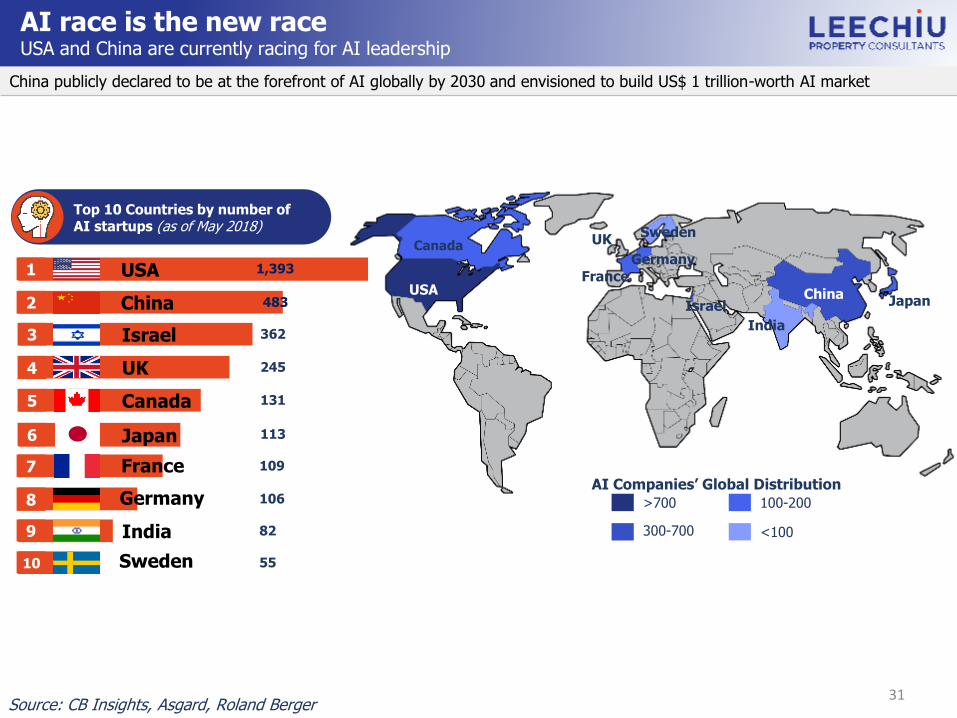
AI race is the new raceUSA and China are currently racing for AI leadership
China publicly declared to be at the forefront of AI globally by 2030 and envisioned to build US$ 1 trillion-worth AI market
Top 10 Countries by number of AI startups (as of May 2018)
USA1 1,393
China2 483
Israel3 362
UK4 245
Canada5
Japan6
7
8
9
10
131
113
109France
106Germany
India 82
55Sweden
>700
300-700
100-200
<100
AI Companies’ Global Distribution
USA
Canada
France
UK
Germany
Sweden
IsraelChina
Japan
India
Source: CB Insights, Asgard, Roland Berger
32
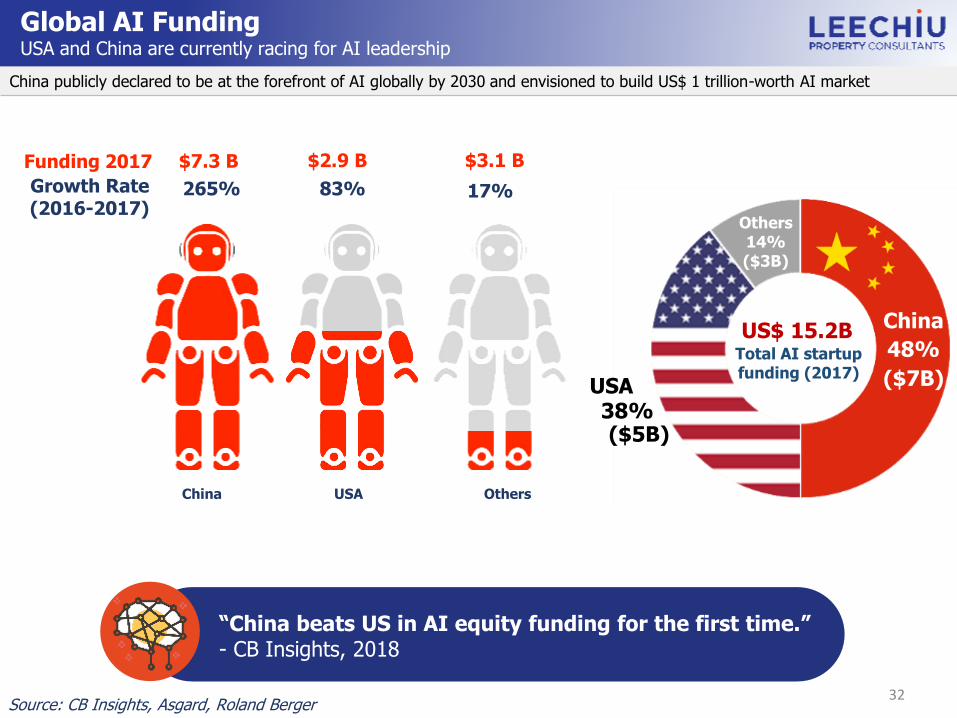
Global AI FundingUSA and China are currently racing for AI leadership
China publicly declared to be at the forefront of AI globally by 2030 and envisioned to build US$ 1 trillion-worth AI market
Source: CB Insights, Asgard, Roland Berger
China USA
Funding 2017
Growth Rate (2016-2017)
$7.3 B
265%
$2.9 B
83%
Others
$3.1 B
17%
US$ 15.2BTotal AI startup funding (2017)
48%
($7B)
38%($5B)
China
USA
Others14%($3B)
“China beats US in AI equity funding for the first time.”- CB Insights, 2018
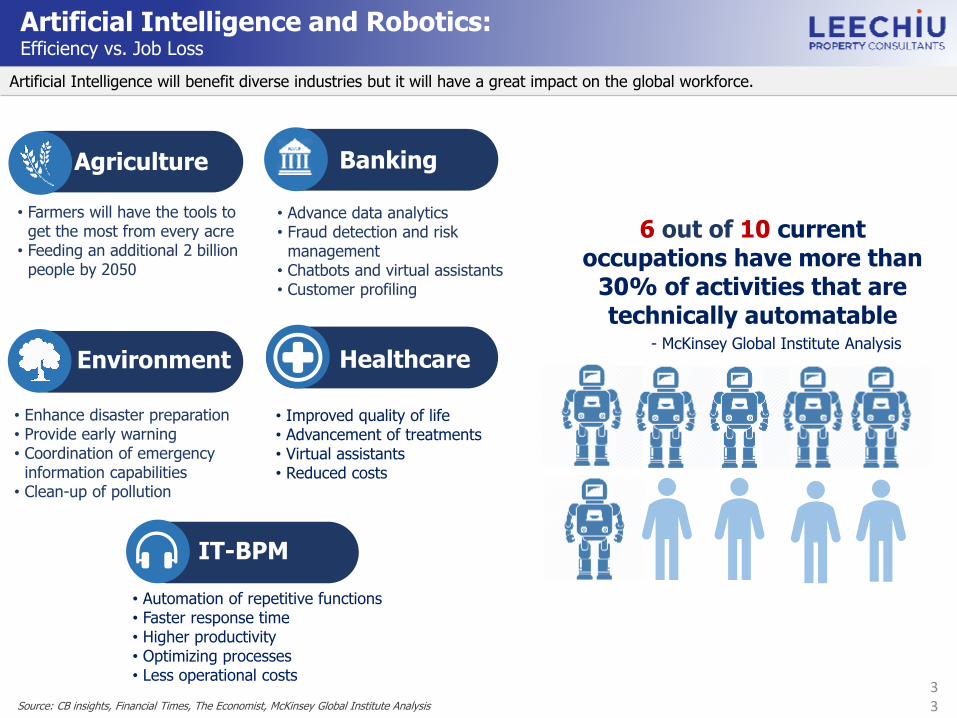
Artificial Intelligence will benefit diverse industries but it will have a great impact on the global workforce.
33
Artificial Intelligence and Robotics:Efficiency vs. Job Loss
• Automation of repetitive functions• Faster response time • Higher productivity• Optimizing processes• Less operational costs
Source: CB insights, Financial Times, The Economist, McKinsey Global Institute Analysis
Healthcare
• Improved quality of life• Advancement of treatments• Virtual assistants• Reduced costs
• Enhance disaster preparation• Provide early warning • Coordination of emergency
information capabilities• Clean-up of pollution
Environment
Banking
IT-BPM
• Advance data analytics• Fraud detection and risk
management• Chatbots and virtual assistants• Customer profiling
Agriculture
• Farmers will have the tools to get the most from every acre
• Feeding an additional 2 billion people by 2050
6 out of 10 current occupations have more than
30% of activities that are technically automatable
- McKinsey Global Institute Analysis
34
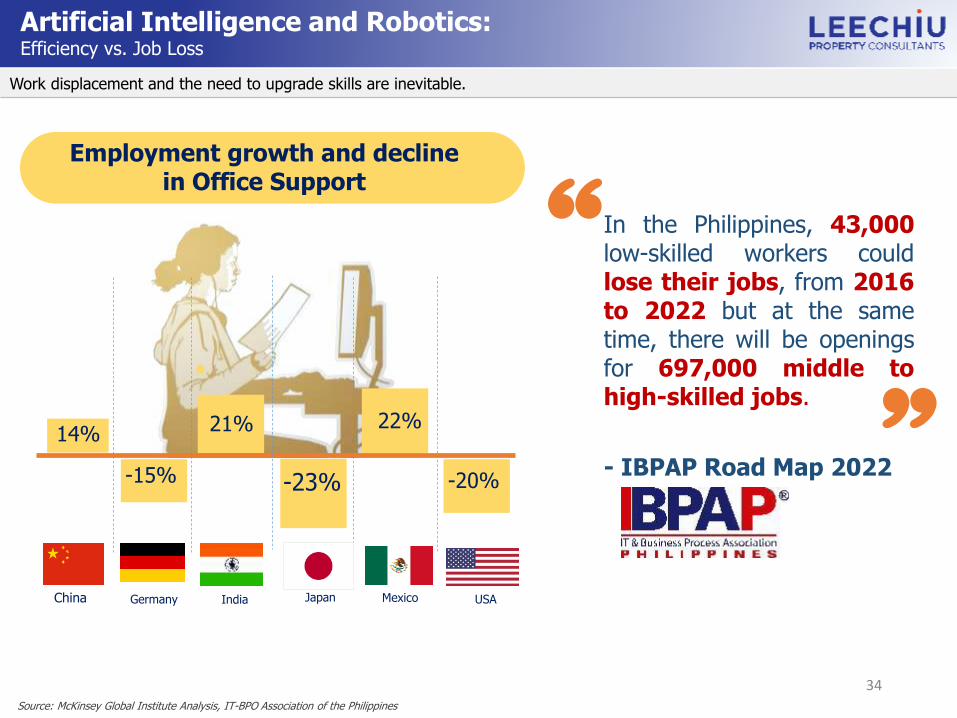
14% 21% 22%
-15% -23% -20%
China Germany India Japan Mexico USA
In the Philippines, 43,000low-skilled workers couldlose their jobs, from 2016to 2022 but at the sametime, there will be openingsfor 697,000 middle tohigh-skilled jobs.
Source: McKinsey Global Institute Analysis, IT-BPO Association of the Philippines
“
- IBPAP Road Map 2022
“
Work displacement and the need to upgrade skills are inevitable.
Employment growth and declinein Office Support
Artificial Intelligence and Robotics:Efficiency vs. Job Loss

TOURISM
36
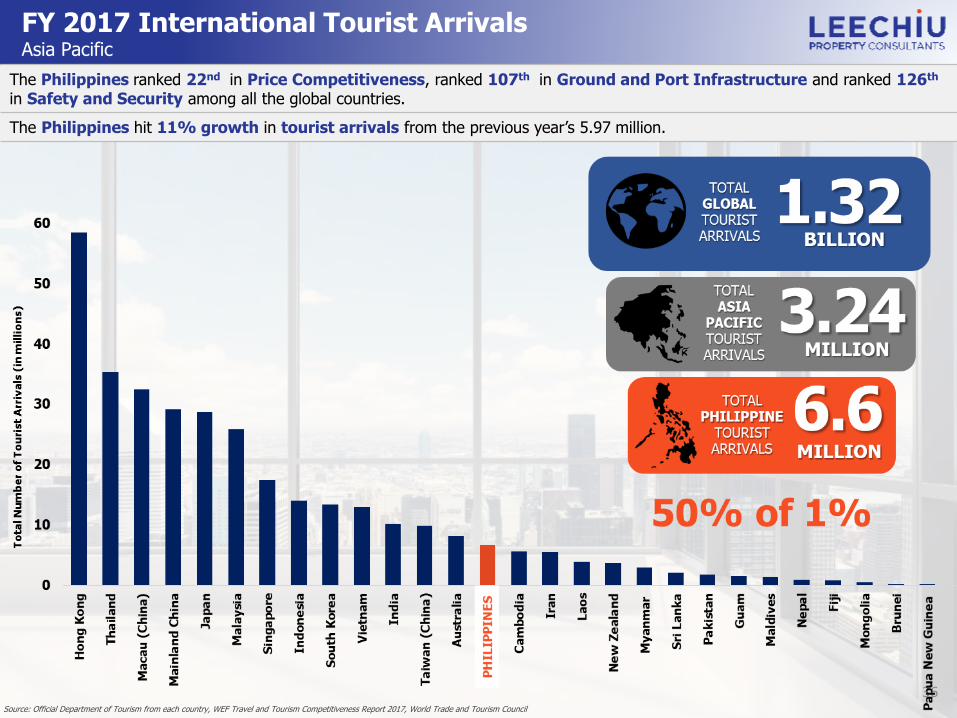
FY 2017 International Tourist ArrivalsAsia Pacific
Source: Official Department of Tourism from each country, WEF Travel and Tourism Competitiveness Report 2017, World Trade and Tourism Council
The Philippines ranked 22nd in Price Competitiveness, ranked 107th in Ground and Port Infrastructure and ranked 126th
in Safety and Security among all the global countries.
The Philippines hit 11% growth in tourist arrivals from the previous year’s 5.97 million.
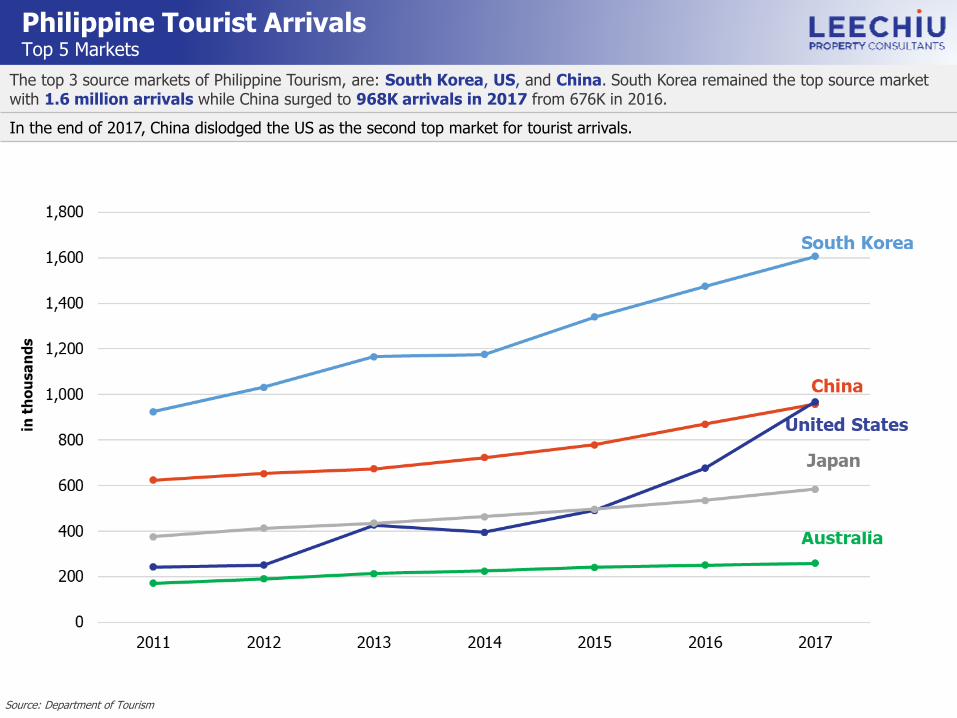
Philippine Tourist ArrivalsTop 5 Markets
Source: Department of Tourism
The top 3 source markets of Philippine Tourism, are: South Korea, US, and China. South Korea remained the top source market with 1.6 million arrivals while China surged to 968K arrivals in 2017 from 676K in 2016.
In the end of 2017, China dislodged the US as the second top market for tourist arrivals.
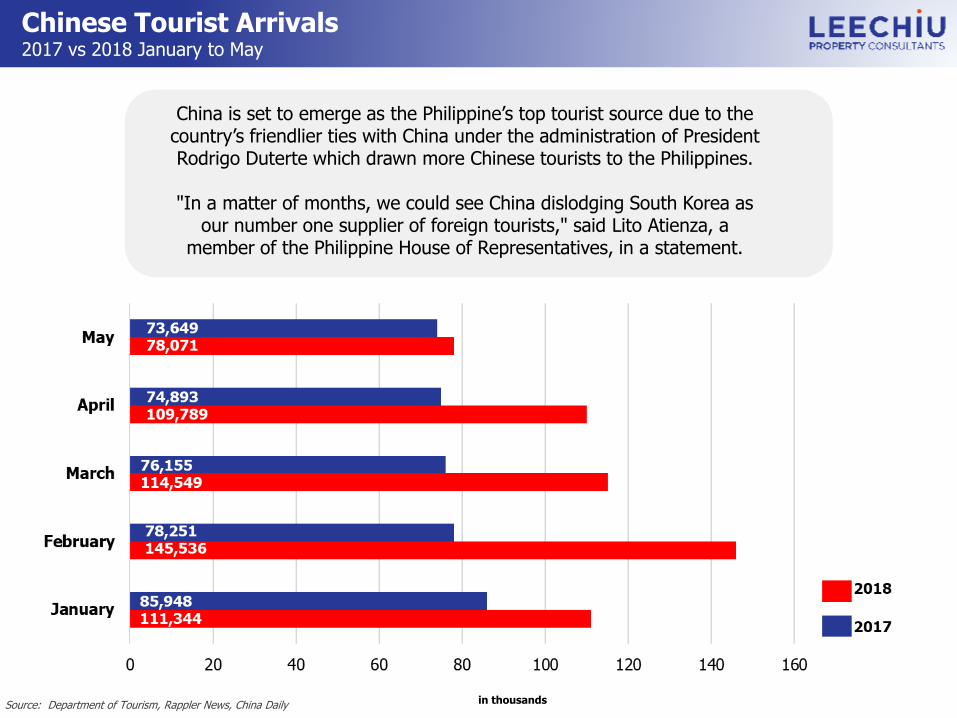
Chinese Tourist Arrivals2017 vs 2018 January to May
Source: Department of Tourism, Rappler News, China Daily in thousands
China is set to emerge as the Philippine’s top tourist source due to the country’s friendlier ties with China under the administration of President Rodrigo Duterte which drawn more Chinese tourists to the Philippines.
"In a matter of months, we could see China dislodging South Korea as our number one supplier of foreign tourists," said Lito Atienza, a
member of the Philippine House of Representatives, in a statement.
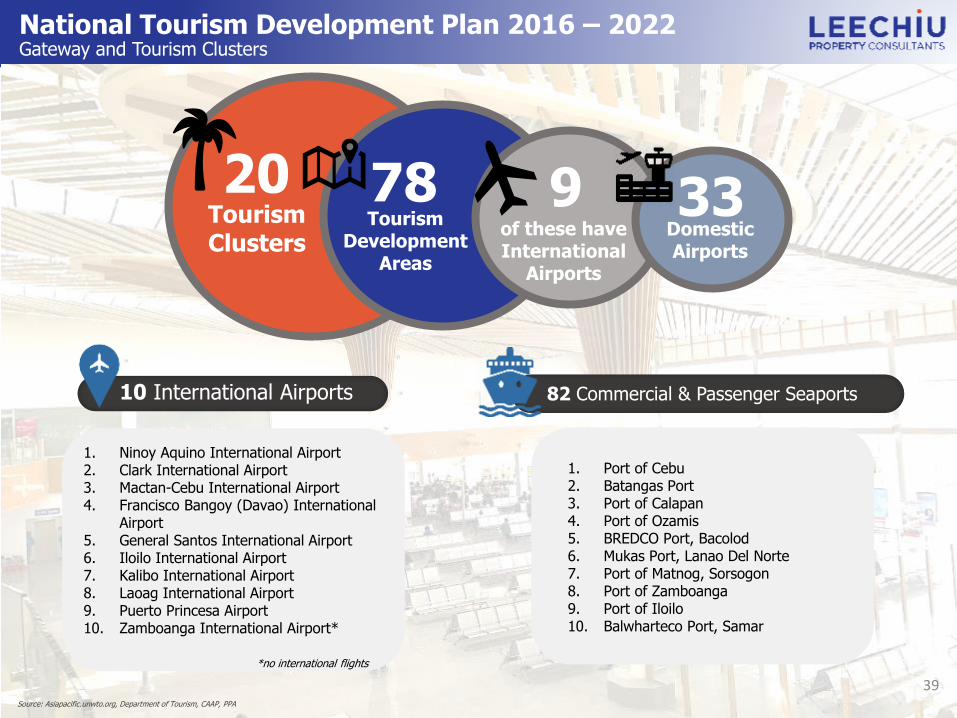
National Tourism Development Plan 2016 – 2022Gateway and Tourism Clusters
Source: Asiapacific.unwto.org, Department of Tourism, CAAP, PPA
39
10 International Airports 82 Commercial & Passenger Seaports
20Tourism Clusters
78 Tourism
Development Areas
9of these have International
Airports
1. Ninoy Aquino International Airport 2. Clark International Airport 3. Mactan-Cebu International Airport4. Francisco Bangoy (Davao) International
Airport5. General Santos International Airport6. Iloilo International Airport 7. Kalibo International Airport8. Laoag International Airport 9. Puerto Princesa Airport 10. Zamboanga International Airport*
1. Port of Cebu2. Batangas Port 3. Port of Calapan4. Port of Ozamis5. BREDCO Port, Bacolod 6. Mukas Port, Lanao Del Norte 7. Port of Matnog, Sorsogon 8. Port of Zamboanga 9. Port of Iloilo 10. Balwharteco Port, Samar
*no international flights
33 DomesticAirports
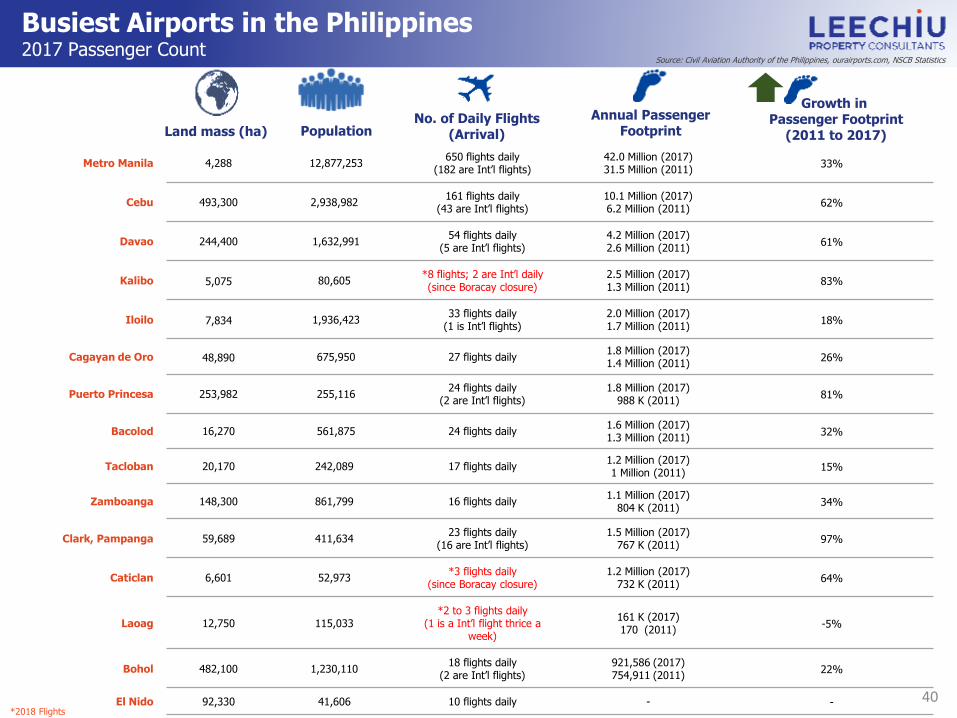
Metro Manila 4,288 12,877,253650 flights daily
(182 are Int’l flights) 42.0 Million (2017)31.5 Million (2011)
33%
Cebu 493,300 2,938,982161 flights daily
(43 are Int’l flights)10.1 Million (2017)6.2 Million (2011)
62%
Davao 244,400 1,632,99154 flights daily
(5 are Int’l flights)4.2 Million (2017)2.6 Million (2011)
61%
Kalibo 5,075 80,605*8 flights; 2 are Int’l daily (since Boracay closure)
2.5 Million (2017)1.3 Million (2011)
83%
Iloilo 7,834 1,936,42333 flights daily
(1 is Int’l flights)2.0 Million (2017)1.7 Million (2011)
18%
Cagayan de Oro 48,890 675,950 27 flights daily1.8 Million (2017)1.4 Million (2011)
26%
Puerto Princesa 253,982 255,11624 flights daily
(2 are Int’l flights)1.8 Million (2017)
988 K (2011)81%
Bacolod 16,270 561,875 24 flights daily1.6 Million (2017)1.3 Million (2011)
32%
Tacloban 20,170 242,089 17 flights daily1.2 Million (2017)1 Million (2011)
15%
Zamboanga 148,300 861,799 16 flights daily1.1 Million (2017)
804 K (2011)34%
Clark, Pampanga 59,689 411,63423 flights daily
(16 are Int’l flights)1.5 Million (2017)
767 K (2011)97%
Caticlan 6,601 52,973*3 flights daily
(since Boracay closure) 1.2 Million (2017)
732 K (2011)64%
Laoag 12,750 115,033*2 to 3 flights daily
(1 is a Int’l flight thrice a week)
161 K (2017)170 (2011)
-5%
Bohol 482,100 1,230,11018 flights daily
(2 are Int’l flights)921,586 (2017)754,911 (2011)
22%
El Nido 92,330 41,606 10 flights daily - -
Land mass (ha) PopulationNo. of Daily Flights
(Arrival)
Annual Passenger Footprint
Busiest Airports in the Philippines2017 Passenger Count
Growth inPassenger Footprint
(2011 to 2017)
Source: Civil Aviation Authority of the Philippines, ourairports.com, NSCB Statistics
40*2018 Flights
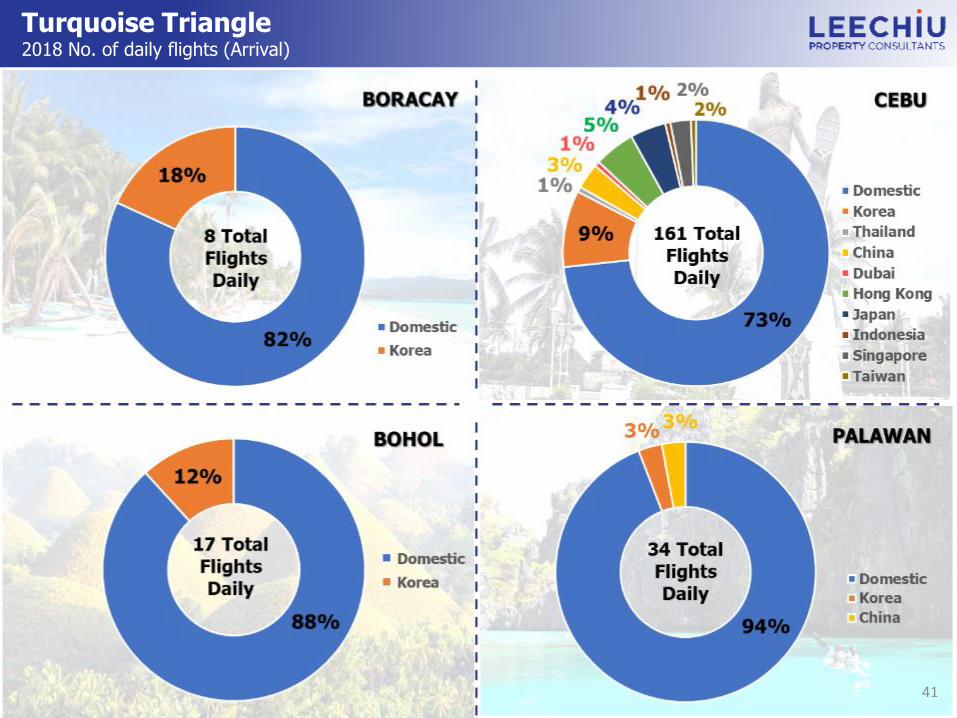
41
Turquoise Triangle 2018 No. of daily flights (Arrival)
42
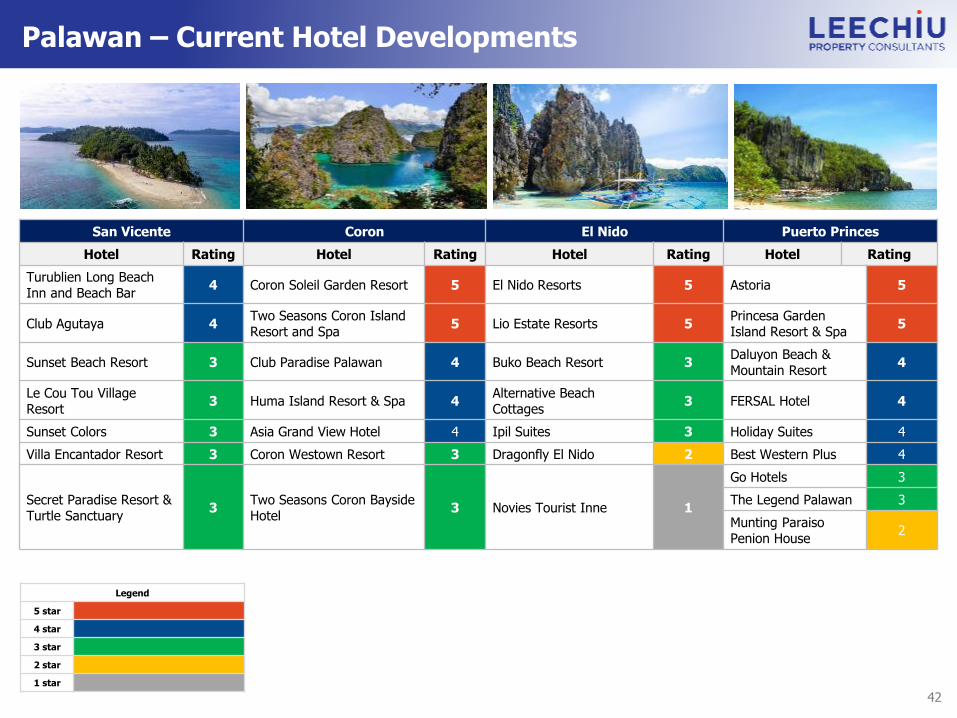
Palawan – Current Hotel Developments
San Vicente Coron El Nido Puerto Princes
Hotel Rating Hotel Rating Hotel Rating Hotel Rating
Turublien Long Beach Inn and Beach Bar
4 Coron Soleil Garden Resort 5 El Nido Resorts 5 Astoria 5
Club Agutaya 4Two Seasons Coron Island Resort and Spa
5 Lio Estate Resorts 5Princesa Garden Island Resort & Spa
5
Sunset Beach Resort 3 Club Paradise Palawan 4 Buko Beach Resort 3Daluyon Beach & Mountain Resort
4
Le Cou Tou Village Resort
3 Huma Island Resort & Spa 4Alternative Beach Cottages
3 FERSAL Hotel 4
Sunset Colors 3 Asia Grand View Hotel 4 Ipil Suites 3 Holiday Suites 4
Villa Encantador Resort 3 Coron Westown Resort 3 Dragonfly El Nido 2 Best Western Plus 4
Secret Paradise Resort & Turtle Sanctuary
3Two Seasons Coron Bayside Hotel
3 Novies Tourist Inne 1
Go Hotels 3
The Legend Palawan 3
Munting Paraiso Penion House
2
Legend
5 star
4 star
3 star
2 star
1 star
43
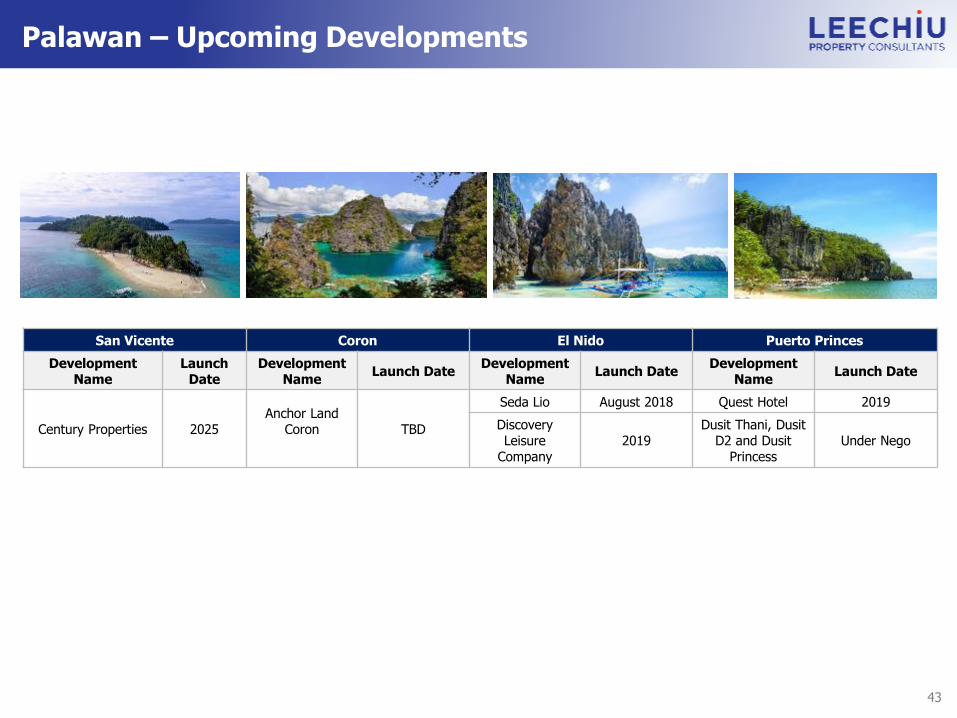
Palawan – Upcoming Developments
San Vicente Coron El Nido Puerto Princes
Development Name
Launch Date
Development Name
Launch DateDevelopment
NameLaunch Date
Development Name
Launch Date
Century Properties 2025Anchor Land
Coron TBD
Seda Lio August 2018 Quest Hotel 2019
Discovery Leisure
Company2019
Dusit Thani, Dusit D2 and Dusit
PrincessUnder Nego
44
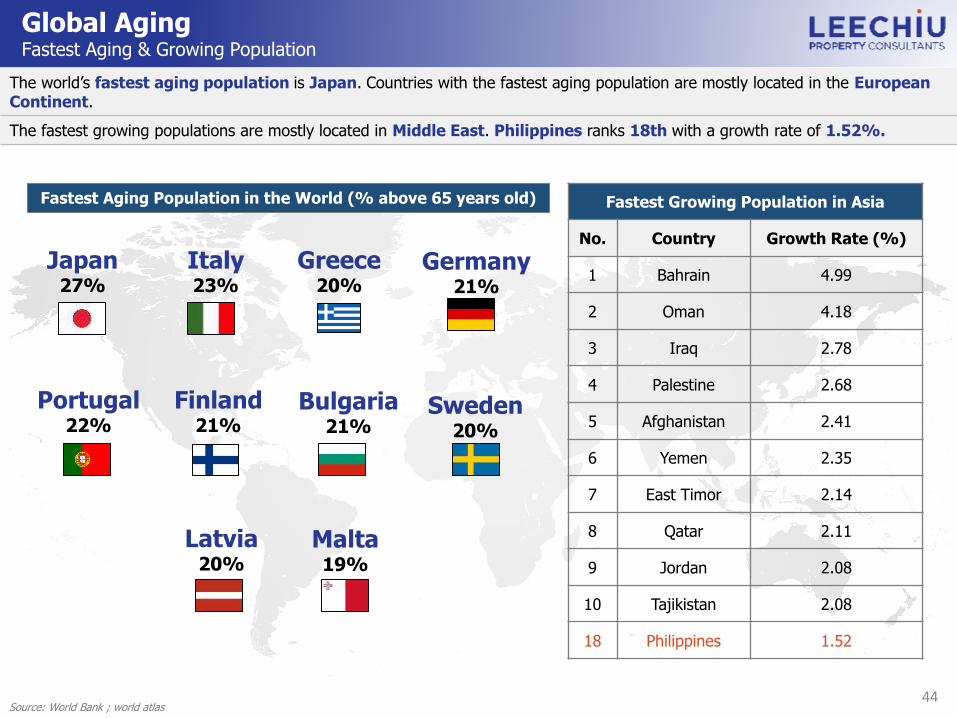
Global AgingFastest Aging & Growing Population
The world’s fastest aging population is Japan. Countries with the fastest aging population are mostly located in the European Continent.
The fastest growing populations are mostly located in Middle East. Philippines ranks 18th with a growth rate of 1.52%.
Japan27%
Italy23%
Greece20%
Germany21%
Portugal22%
Finland21%
Bulgaria21%
Sweden20%
Latvia20%
Malta19%
Fastest Growing Population in Asia
No. Country Growth Rate (%)
1 Bahrain 4.99
2 Oman 4.18
3 Iraq 2.78
4 Palestine 2.68
5 Afghanistan 2.41
6 Yemen 2.35
7 East Timor 2.14
8 Qatar 2.11
9 Jordan 2.08
10 Tajikistan 2.08
18 Philippines 1.52
Fastest Aging Population in the World (% above 65 years old)
Source: World Bank ; world atlas
45
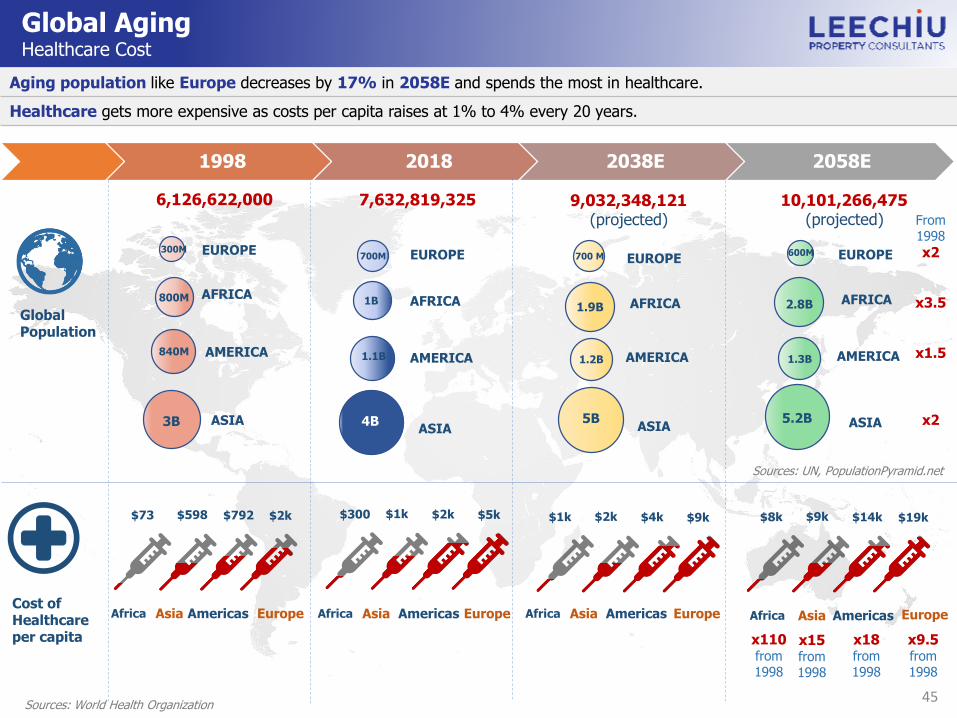
Global AgingHealthcare Cost
Aging population like Europe decreases by 17% in 2058E and spends the most in healthcare.
Healthcare gets more expensive as costs per capita raises at 1% to 4% every 20 years.
1998 2018 2038E 2058E
Global Population
EUROPE300M
800M
840M
3B
AFRICA
AMERICA
ASIA
6,126,622,000 7,632,819,325 9,032,348,121(projected)
10,101,266,475(projected)
Sources: UN, PopulationPyramid.net
Cost of Healthcare per capita
Africa Asia Americas Europe
$2k$792$598$73
Africa Asia Americas Europe Africa Asia Americas Europe Africa Asia Americas Europe
Sources: World Health Organization
$5k$2k$1k$300 $9k$4k$2k$1k $19k$14k$9k$8k
EUROPE700M
1B
1.1B
4B
AFRICA
AMERICA
ASIA
700 M
1.2B
1.9B
5B
EUROPE
AFRICA
AMERICA
ASIA
600M
1.3B
2.8B
5.2B
EUROPE
AFRICA
AMERICA
ASIA
x110from 1998
x15from 1998
x18from 1998
x9.5from 1998
From1998
x2
x3.5
x1.5
x2
SUSTAINABLE MASTERPLANNING
47
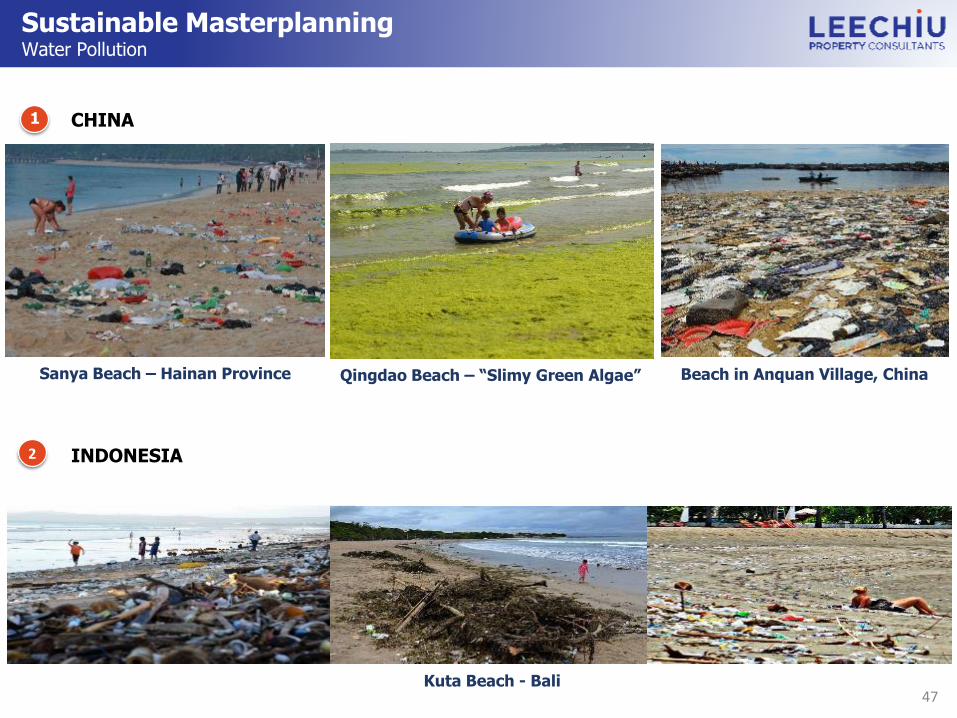
Sustainable MasterplanningWater Pollution
Sanya Beach – Hainan Province Qingdao Beach – “Slimy Green Algae” Beach in Anquan Village, China
1 CHINA
2 INDONESIA
Kuta Beach - Bali
48
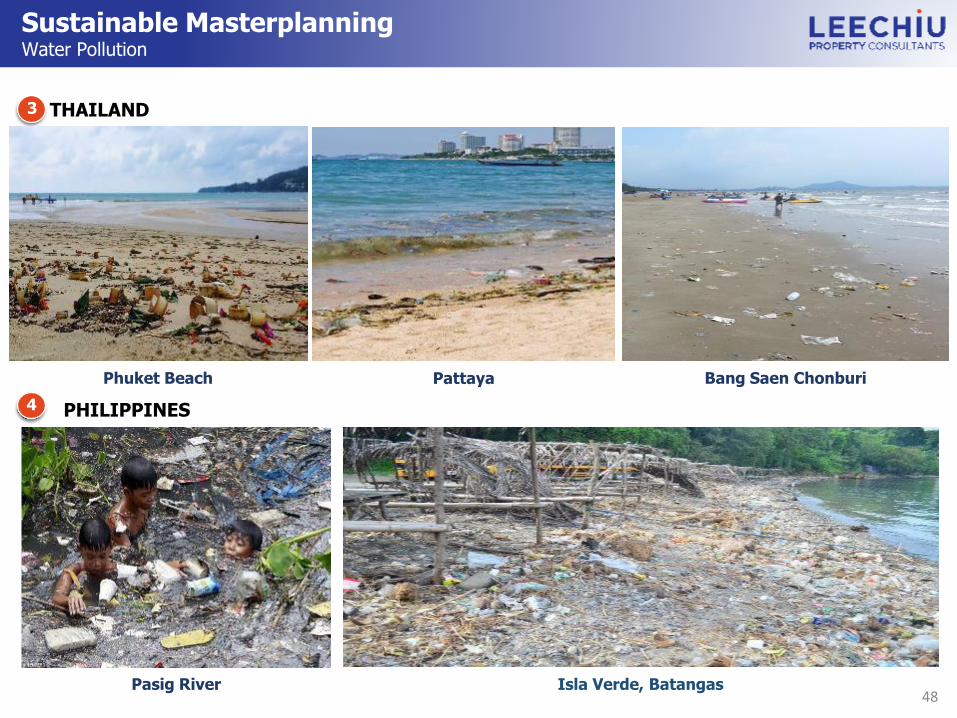
Sustainable MasterplanningWater Pollution
Phuket Beach Pattaya Bang Saen Chonburi
3 THAILAND
PHILIPPINES
Pasig River Isla Verde, Batangas
4
49
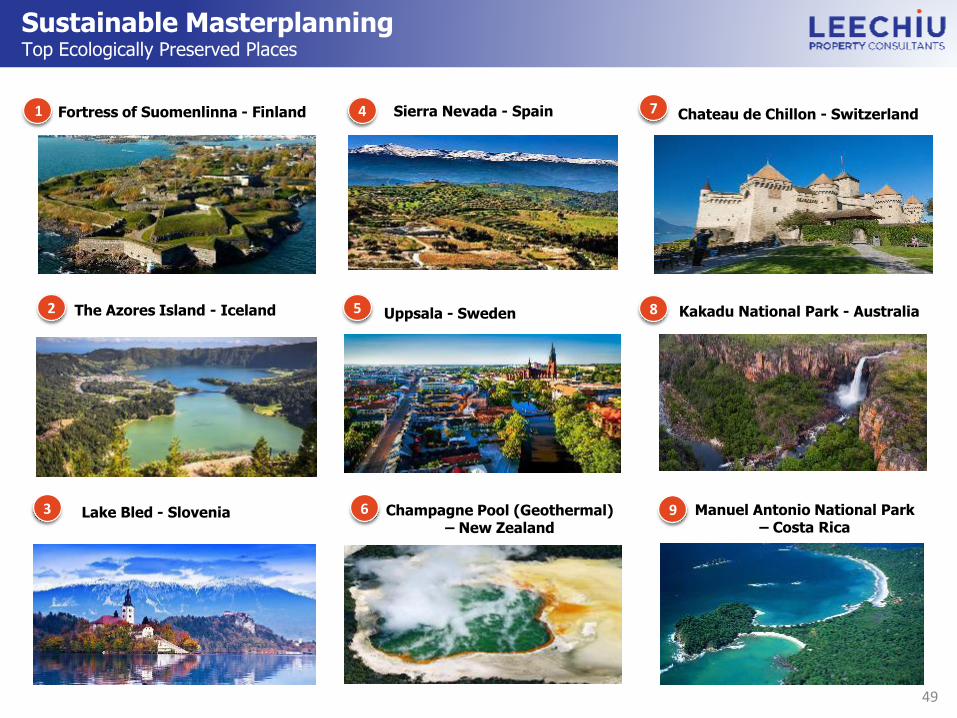
Sustainable MasterplanningTop Ecologically Preserved Places
1 Fortress of Suomenlinna - Finland
2 The Azores Island - Iceland
Lake Bled - Slovenia
Sierra Nevada - Spain
Uppsala - Sweden
Champagne Pool (Geothermal) – New Zealand
3
8
7
6
5
4 Chateau de Chillon - Switzerland
Kakadu National Park - Australia
9 Manuel Antonio National Park – Costa Rica
50
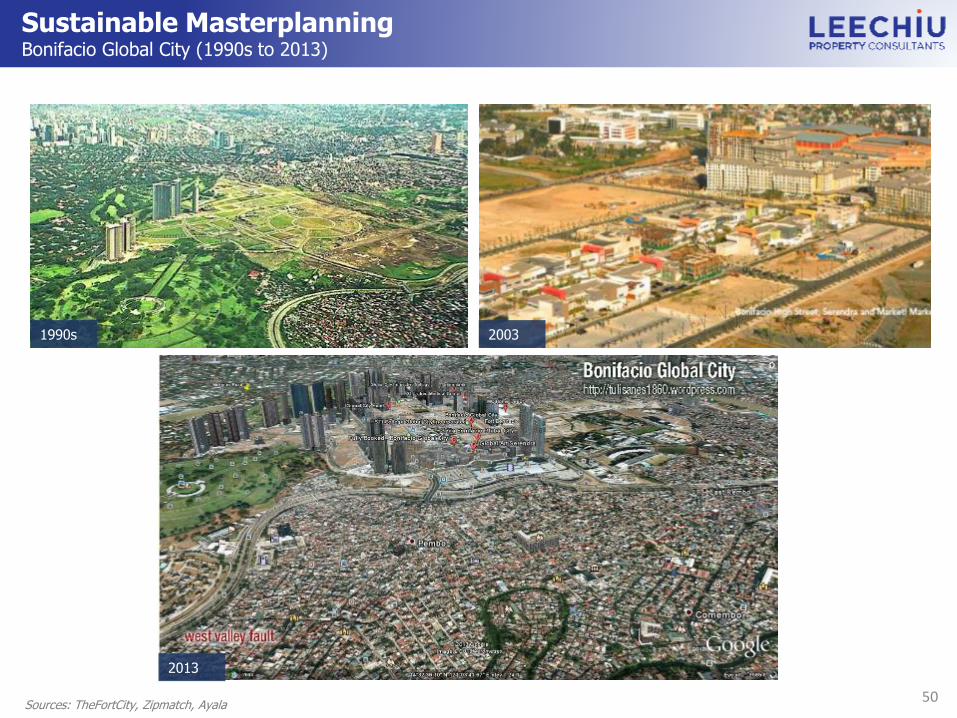
Sustainable MasterplanningBonifacio Global City (1990s to 2013)
1
Sources: TheFortCity, Zipmatch, Ayala
1990s 2003
2013
51
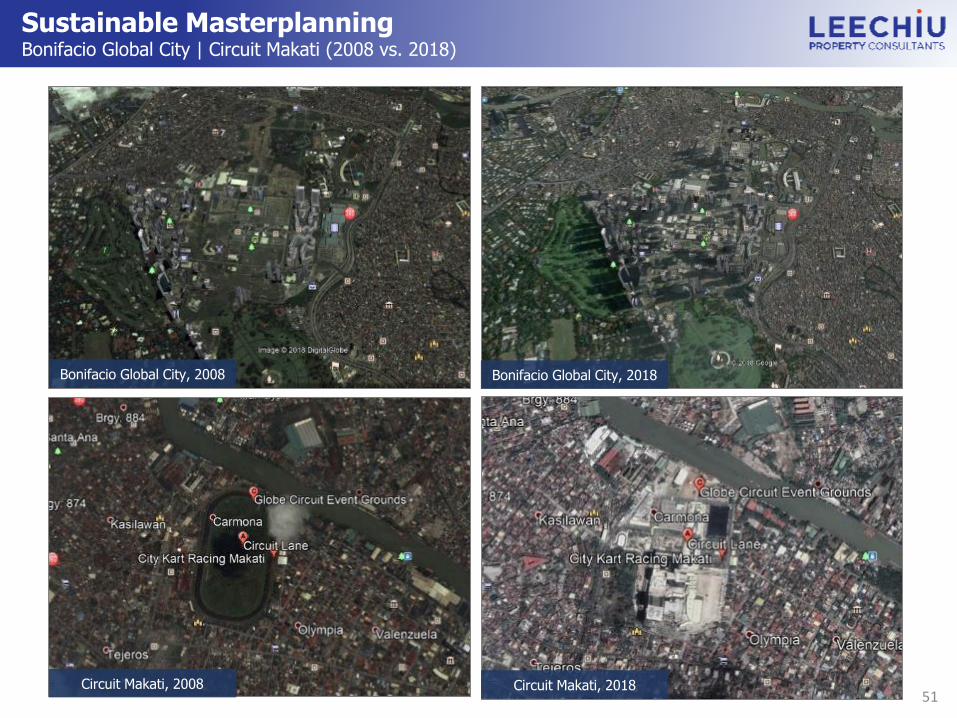
Sustainable MasterplanningBonifacio Global City | Circuit Makati (2008 vs. 2018)
Bonifacio Global City, 2008 Bonifacio Global City, 2018
Circuit Makati, 2008 Circuit Makati, 2018
52
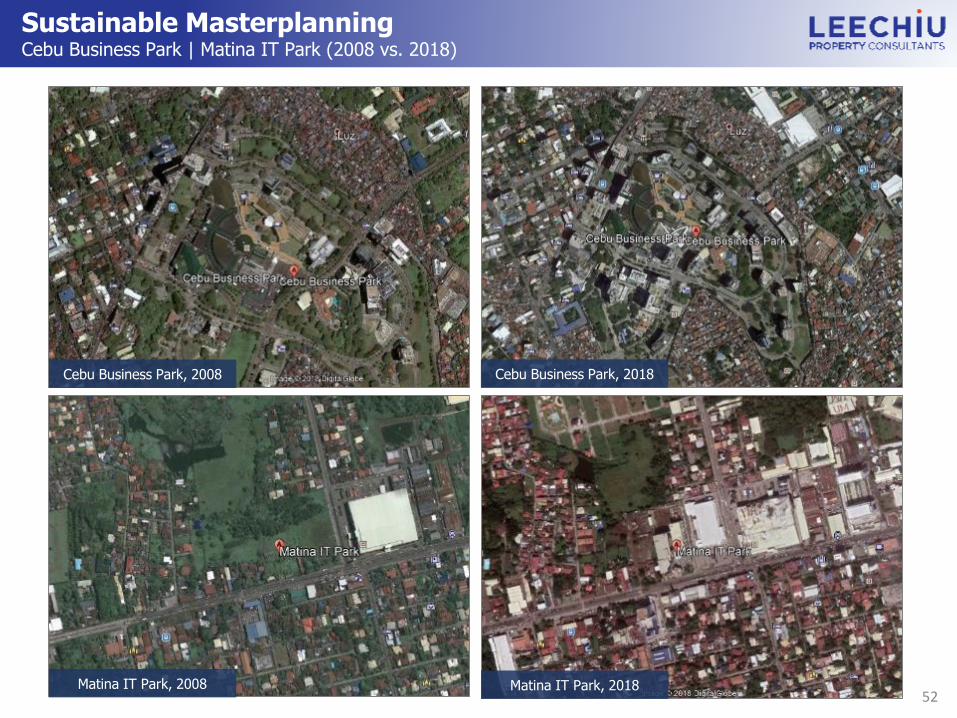
Sustainable MasterplanningCebu Business Park | Matina IT Park (2008 vs. 2018)
Cebu Business Park, 2008 Cebu Business Park, 2018
Matina IT Park, 2008 Matina IT Park, 2018
53
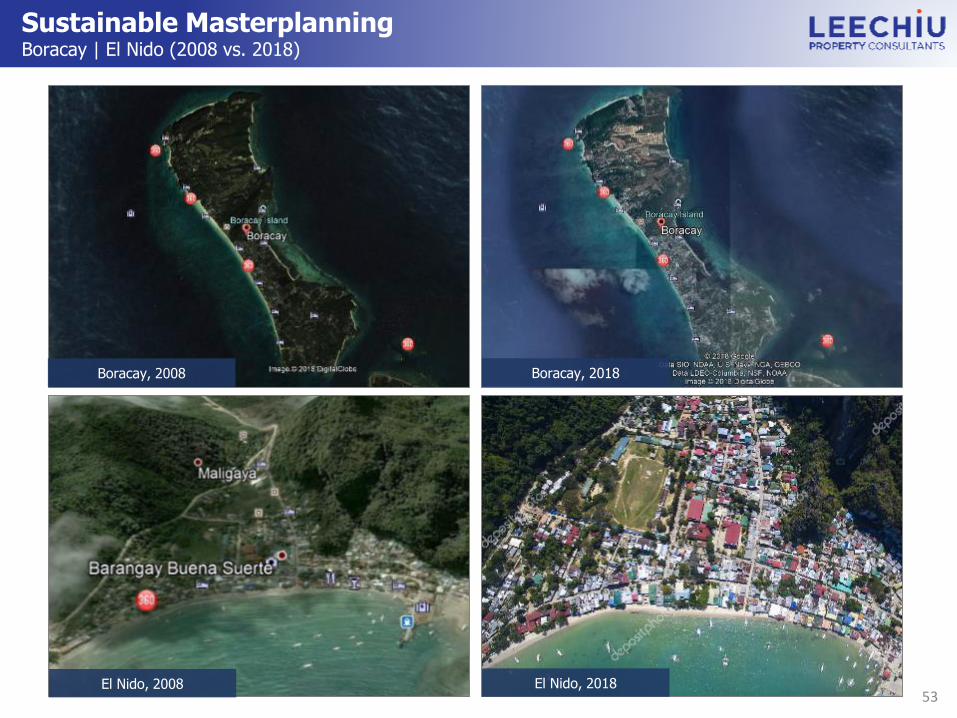
Sustainable MasterplanningBoracay | El Nido (2008 vs. 2018)
Boracay, 2008 Boracay, 2018
El Nido, 2008 El Nido, 2018
54
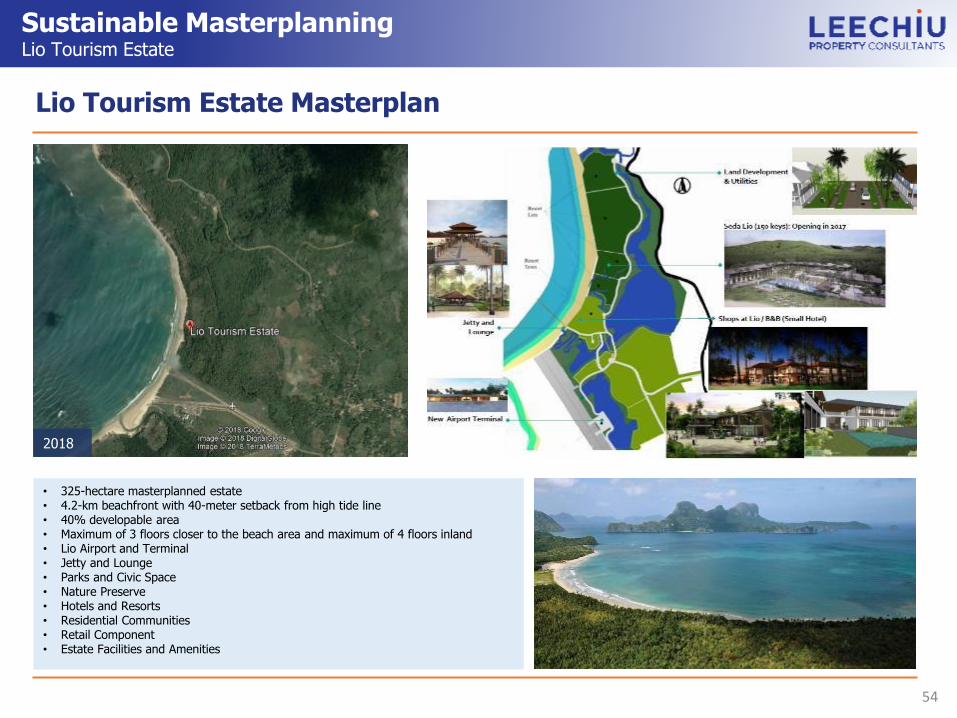
Sustainable MasterplanningLio Tourism Estate
• 325-hectare masterplanned estate• 4.2-km beachfront with 40-meter setback from high tide line• 40% developable area• Maximum of 3 floors closer to the beach area and maximum of 4 floors inland• Lio Airport and Terminal• Jetty and Lounge• Parks and Civic Space• Nature Preserve• Hotels and Resorts• Residential Communities• Retail Component• Estate Facilities and Amenities
2018
Lio Tourism Estate Masterplan

AboutLEECHIU PROPERTY
CONSULTANTS
Currently marketing 43 projects
Total of 917,000 sqm
BGC. Citibank Plaza. Ecoprime. MenarcoTower. Net Park. Milestone at Fifth Avenue. Orē Central. The Curve. Twenty-five Seven McKinley. W CityCenter. W Fifth Avenue. W Global Center. W Office at High Street.
High Street South Corporate Plaza I. One Park Drive. The Finance Centre Retail. G.S.C. Corporate Tower. Asian Century CenterQUEZON CITY. Hexagon Corporate Center. One Luna Global Connections.
Panorama Technocenter. The SkySuitesTowers. Jackman Plaza I.T. Center.
MPIRE CenterALABANG. Asian Star Building. One Griffinstone Building. MAKATI CITY.
Frabelle Corporate Plaza. Liberty Plaza. M1 Tower. MJ Corporate Plaza. NEX Tower.
ORTIGAS. St. Francis Square.Ortigas Technopoint Two. Unioil Tower.
BAY AREA.DoubleDragon Plaza. Nexgen Tower.
CAVITE. Suntech iPark. CBC Asia TechnozoneCEBU. Latitude Corporate Center.
Mabuhay Tower.
Notable Lease Transactions
in a span of two years
Closed Deals562,000 sqm
Live Deals560,000 sqm
Adviser of choice by
top BPM companies
We have accumulated
knowledge of potential sites
for IT-BPO clients through
first-hand experience in both
emerging & established
cities in the country. We are
well-versed in the processes
and requirements of various
stakeholders such as: ICT
councils, LGUs, DTI, and
PEZA.
Looking to transact circa
PhP 25 billion or USD 500 million in
2018
Prime Commercial Lots in Bonifacio Global City ;
Office floor in Grade AAA Building along Ayala
Avenue ; Prime Residential Apartment
Building in Salcedo Village ; Residential Apartment Buildings in Kalayaan
Avenue, Makati ; Sales of office Floors in Filinvest City; Industrial land sale in Southern Luzon; Long-term warehouse lease for a large logistics company
USD to PhP $1 : PhP 50
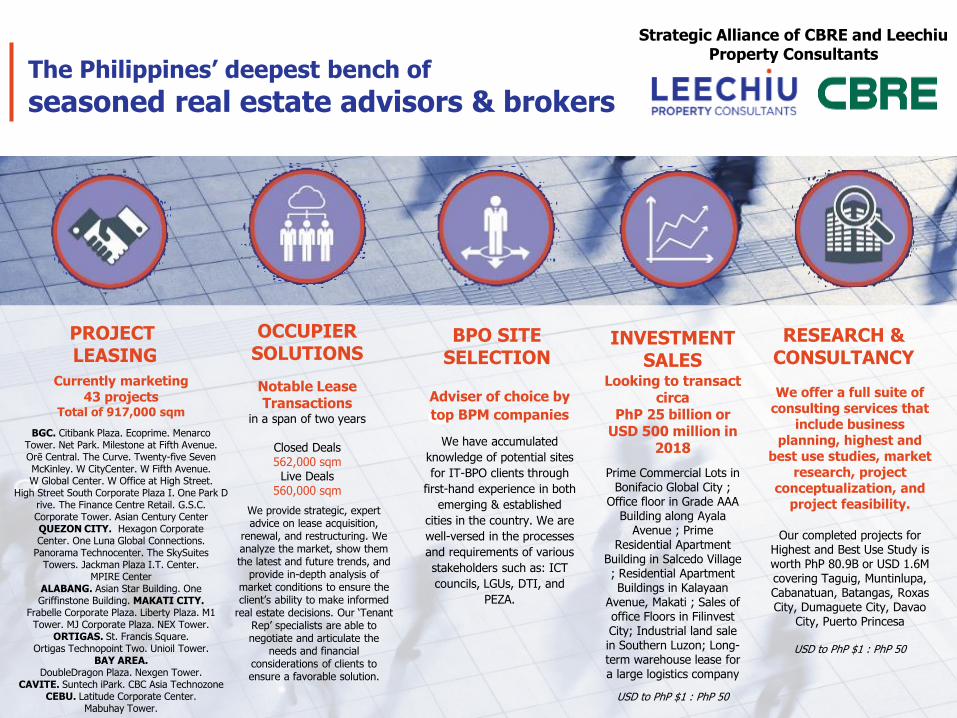
The Philippines’ deepest bench of
seasoned real estate advisors & brokers
PROJECT LEASING
OCCUPIER SOLUTIONS
BPO SITESELECTION
INVESTMENT SALES
We provide strategic, expert advice on lease acquisition,
renewal, and restructuring. We analyze the market, show them the latest and future trends, and
provide in-depth analysis of market conditions to ensure the client’s ability to make informed
real estate decisions. Our ‘Tenant Rep’ specialists are able to negotiate and articulate the
needs and financial considerations of clients to ensure a favorable solution.
RESEARCH &CONSULTANCY
We offer a full suite of consulting services that
include business planning, highest and
best use studies, market research, project
conceptualization, and project feasibility.
Our completed projects for Highest and Best Use Study is worth PhP 80.9B or USD 1.6M covering Taguig, Muntinlupa, Cabanatuan, Batangas, RoxasCity, Dumaguete City, Davao
City, Puerto Princesa
USD to PhP $1 : PhP 50
Strategic Alliance of CBRE and Leechiu Property Consultants

The Philippines’ deepest bench of
seasoned real estate advisors & brokers
Strategic Alliance of CBRE and Leechiu Property Consultants