Embed Size (px)
Citation preview
1
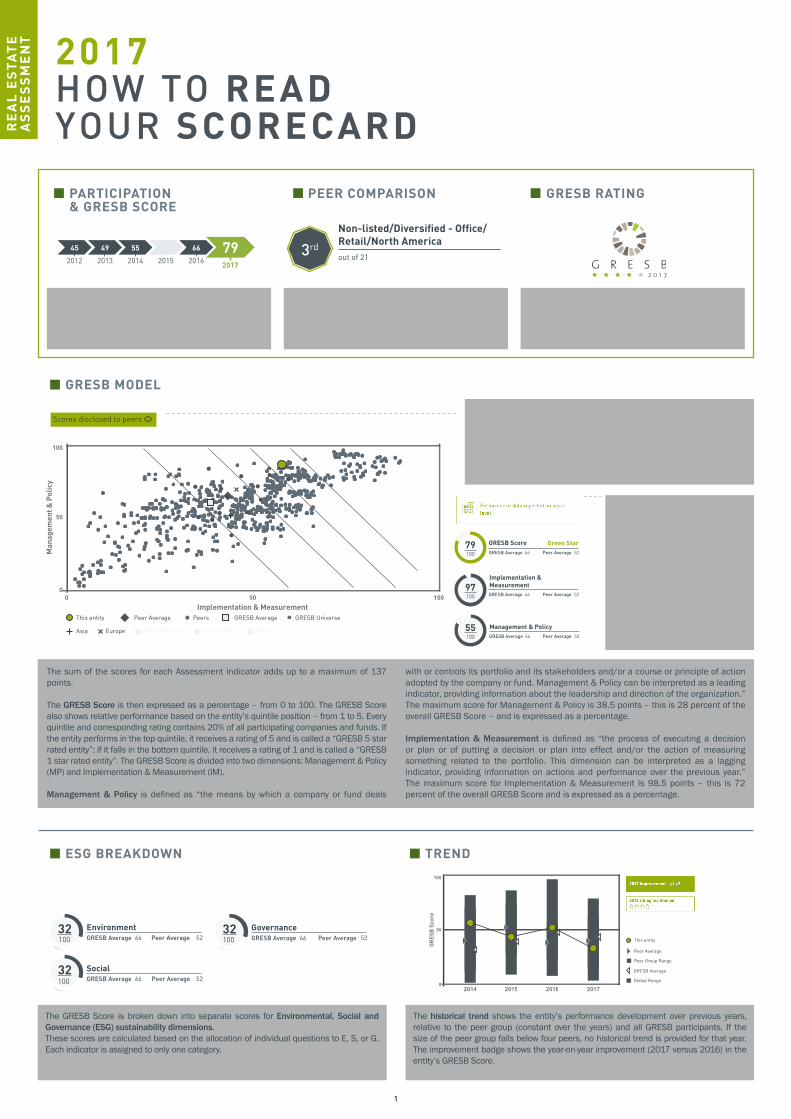
Overall measure of how well ESG issues are integrated into the management and practices of companies and funds. The rating is based on the GRESB Score and its quintile position relative to the GRESB universe.
As a default, GRESB does not disclose a participant’s data to oth-er participants. In 2017, GRESB introduced an opt-in function that will disclose the entity’s name (listed companies) or fund manager’s name (non-listed entities), as well as the scores for the two dimen-sions, to participants in the peer group that also opted to disclose their name and dimension scores. Note: This functionality is only available in the Benchmark Report.
Indicates whether the partici-pant used the asset level tools to streamline data flows and in-crease data quality. The asset-lev-el data provided to GRESB is strict-ly confidential and is only used for aggregation to portfolio level. No asset level information is dis-closed to participant’s investors, unless the participant provides access.
Each entity is allocated to a peer group, based on the property type (the threshold is set at 75% GAV) and geographical location (the threshold is set at 60% GAV) of underlying assets.
Historical participation and the GRESB Score over the past 6 years.
2017HOW TO READ YOUR SCORECARDR
EA
L E
ST
AT
EA
SS
ES
SM
EN
T
PEER COMPARISON GRESB RATING
Non-listed/Diversified - Office/Retail/North Americaout of 213rd
PARTICIPATION & GRESB SCORE
GRESB MODEL
ESG BREAKDOWN TREND
45
2012
49
2013
55
2014 2015
66
2016792017
Peer Average 52GRESB Average 66
Management & Policy55100
Peer Average 52GRESB Average 66
Implementation & Measurement97
1000 50 100
50
0
100
Man
agem
ent &
Pol
icy
Implementation & MeasurementThis entity GRESB AveragePeer Average GRESB UniversePeers
Asia Europe North America Australia/NZ Other
Peer Average 52GRESB Average 6679100
GRESB Score Green Star
The sum of the scores for each Assessment indicator adds up to a maximum of 137 points.
The GRESB Score is then expressed as a percentage – from 0 to 100. The GRESB Score also shows relative performance based on the entity’s quintile position – from 1 to 5. Every quintile and corresponding rating contains 20% of all participating companies and funds. If the entity performs in the top quintile, it receives a rating of 5 and is called a “GRESB 5 star rated entity”; if it falls in the bottom quintile, it receives a rating of 1 and is called a “GRESB 1 star rated entity”. The GRESB Score is divided into two dimensions: Management & Policy (MP) and Implementation & Measurement (IM).
Management & Policy is defined as “the means by which a company or fund deals
with or controls its portfolio and its stakeholders and/or a course or principle of action adopted by the company or fund. Management & Policy can be interpreted as a leading indicator, providing information about the leadership and direction of the organization.” The maximum score for Management & Policy is 38.5 points – this is 28 percent of the overall GRESB Score – and is expressed as a percentage.
Implementation & Measurement is defined as “the process of executing a decision or plan or of putting a decision or plan into effect and/or the action of measuring something related to the portfolio. This dimension can be interpreted as a lagging indicator, providing information on actions and performance over the previous year.” The maximum score for Implementation & Measurement is 98.5 points – this is 72 percent of the overall GRESB Score and is expressed as a percentage.
The GRESB Score is broken down into separate scores for Environmental, Social and Governance (ESG) sustainability dimensions. These scores are calculated based on the allocation of individual questions to E, S, or G. Each indicator is assigned to only one category.
The historical trend shows the entity’s performance development over previous years, relative to the peer group (constant over the years) and all GRESB participants. If the size of the peer group falls below four peers, no historical trend is provided for that year. The improvement badge shows the year-on-year improvement (2017 versus 2016) in the entity’s GRESB Score.
Peer Average 52GRESB Average 66
Social32100
Peer Average 52GRESB Average 66
Environment32100 Peer Average 52GRESB Average 66
Governance32100
50
02014 2015 2016 2017
100
GR
ESB
Sco
re
This entity
Peer Group Range
GRESB AveragePeer Average
Global Range
50
02014 2015 2016 2017
100
GR
ESB
Sco
re
This entity
Peer Group Range
GRESB AveragePeer Average
Global Range
50
02014 2015 2016 2017
100
GR
ESB
Sco
re
This entity
Peer Group Range
GRESB AveragePeer Average
Global Range
50
02014 2015 2016 2017
100
GR
ESB
Sco
re
This entity
Peer Group Range
GRESB AveragePeer Average
Global Range
Scores disclosed to peers eye
2
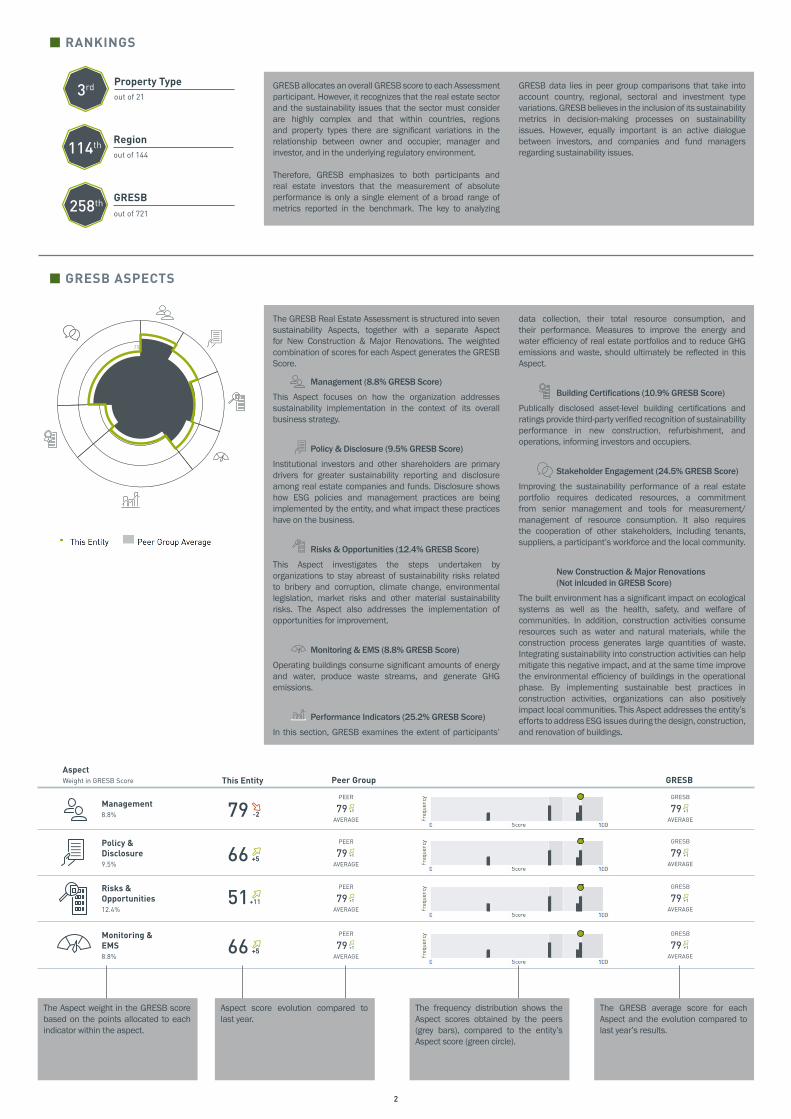
RANKINGS
GRESB allocates an overall GRESB score to each Assessment participant. However, it recognizes that the real estate sector and the sustainability issues that the sector must consider are highly complex and that within countries, regions and property types there are significant variations in the relationship between owner and occupier, manager and investor, and in the underlying regulatory environment.
Therefore, GRESB emphasizes to both participants and real estate investors that the measurement of absolute performance is only a single element of a broad range of metrics reported in the benchmark. The key to analyzing
GRESB data lies in peer group comparisons that take into account country, regional, sectoral and investment type variations. GRESB believes in the inclusion of its sustainability metrics in decision-making processes on sustainability issues. However, equally important is an active dialogue between investors, and companies and fund managers regarding sustainability issues.
The Aspect weight in the GRESB score based on the points allocated to each indicator within the aspect.
Aspect score evolution compared to last year.
The frequency distribution shows the Aspect scores obtained by the peers (grey bars), compared to the entity’s Aspect score (green circle).
The GRESB average score for each Aspect and the evolution compared to last year’s results.
The GRESB Real Estate Assessment is structured into seven sustainability Aspects, together with a separate Aspect for New Construction & Major Renovations. The weighted combination of scores for each Aspect generates the GRESB Score.
Management (8.8% GRESB Score)
This Aspect focuses on how the organization addresses sustainability implementation in the context of its overall business strategy.
Policy & Disclosure (9.5% GRESB Score)
Institutional investors and other shareholders are primary drivers for greater sustainability reporting and disclosure among real estate companies and funds. Disclosure shows how ESG policies and management practices are being implemented by the entity, and what impact these practices have on the business.
Risks & Opportunities (12.4% GRESB Score)
This Aspect investigates the steps undertaken by organizations to stay abreast of sustainability risks related to bribery and corruption, climate change, environmental legislation, market risks and other material sustainability risks. The Aspect also addresses the implementation of opportunities for improvement.
Monitoring & EMS (8.8% GRESB Score)
Operating buildings consume significant amounts of energy and water, produce waste streams, and generate GHG emissions.
Performance Indicators (25.2% GRESB Score)
In this section, GRESB examines the extent of participants’
data collection, their total resource consumption, and their performance. Measures to improve the energy and water efficiency of real estate portfolios and to reduce GHG emissions and waste, should ultimately be reflected in this Aspect.
Building Certifications (10.9% GRESB Score)
Publically disclosed asset-level building certifications and ratings provide third-party verified recognition of sustainability performance in new construction, refurbishment, and operations, informing investors and occupiers.
Stakeholder Engagement (24.5% GRESB Score)
Improving the sustainability performance of a real estate portfolio requires dedicated resources, a commitment from senior management and tools for measurement/management of resource consumption. It also requires the cooperation of other stakeholders, including tenants, suppliers, a participant’s workforce and the local community.
New Construction & Major Renovations(Not inlcuded in GRESB Score)
The built environment has a significant impact on ecological systems as well as the health, safety, and welfare of communities. In addition, construction activities consume resources such as water and natural materials, while the construction process generates large quantities of waste. Integrating sustainability into construction activities can help mitigate this negative impact, and at the same time improve the environmental efficiency of buildings in the operational phase. By implementing sustainable best practices in construction activities, organizations can also positively impact local communities. This Aspect addresses the entity’s efforts to address ESG issues during the design, construction, and renovation of buildings.
GRESB out of 721
Regionout of 144114th
258th
Property Typeout of 213rd
GRESB ASPECTS
75
50
25
66 +5
PEER
AVERAGE
79 +1
GRESB
AVERAGE
79 +1
Policy & Disclosure9.5%
51 +11
PEER
AVERAGE
79 +1
GRESB
AVERAGE
79 +1
Risks & Opportunities12.4%
+5
PEER
+1
GRESB
AVERAGE
79 +1
79 -2⬊
PEER
AVERAGE
79 +1⬈ ⬈
⬈ ⬈ ⬈
⬈
⬈
⬈
⬈
⬈
⬈
GRESB
AVERAGE
79 +1Management8.8%
AspectWeight in GRESB Score This Entity Peer Group GRESB
Monitoring & EMS8.8%
66 79 AVERAGE

3
Like-for-like Change2015-2016 (relative)
Ener
gyW
ater
GH
GW
aste
Footprint 2016 (absolute)
Intensities (entity and peer average)
⌁
☁
💧
TRASHCAN
22,167 MWh
100% Portfolio Coverage
22,167 tonnes CO2
100% Portfolio Coverage
22,167 metric tonnes
90% Diverted
24,001 m3
7% Portfolio Coverage
24,001metric tonnes
7% Portfolio Coverage
1,203 MWh-3%
Waste diverted from landfill
metric tonnes/USD
metric tonnes/sqft
MWh/millionUSD
tonnes CO2/USD
tonnes CO2/sqft
kWh/m3
1,203 m3-3%
1,203 tonnes CO2
+7%
Peers
Peers
Peers
Peers
Peers
Peers
Entity
Entity
Entity
Entity
Entity
Entity
4.7
4.7
4.7
5.2
5.2
5.2
5.3
5.3
5.3
6.1
6.1
6.1
Only displayed with 100% coverage
PORTFOLIO IMPACT
The footprint of the portfolio is defined as the absolute consumption reported by the entity.
Portfolio coverage is a measure of data availability for each performance indicator. Data availability is expressed as a fraction of total floor area.
GRESB defines “like-for-like” as the fraction of a portfolio continuously owned by an entity for at least 24 months. Like-for-like measurements represent a relatively stable sub-set of a portfolio, and they may better reflect management action to improve performance. GRESB like-for-like metrics do not directly account for variation in weather, occupancy, and other factors.
GRESB provides two complementary measures of portfolio-level resource productivity, including environmental impact (energy, GHG, water and waste) per floor area and per dollar of Gross Asset Value (GAV). Resource productivity varies between property types. Lower intensities indicate relatively less environmental impact per unit floor area or per dollar of asset value.
Impact reduction targets
TypeLong-term
target Baseline year End year 2016 target Portfolio coverage
Energy Absolute 20% 2006 2025 1% 25%-50%
GHG Absolute 25% 2006 2030 - 0%-25%
Water Absolute 25% 2006 2030 2% 0%-25%
Waste Like-for-like 25% 2006 2030 2% 0%-25%
⌁
☁
💧
TRASHCAN
Impact reduction targets guide organizations and their employees to aim for measurable improvements, as well as the integration of those targets into the business. GRESB
assesses the existence of targets and whether they are externally communicated, not the ambition levels of the targets.

4
ENTITY & PEER GROUP CHARACTERISTICS
This Entity
Legal Structure: Listed
Sector: Industrial
Region: East Asia
Total GAV: $756 Million
Activity: Management of standing assets
Peer Group
Legal Structure: Listed
Sector: Industrial
Region: East Asia
Average GAV: $756 Million
Activity: Management of standing assets
Countries
[100%] Netherlands
Peer Group Countries
[25%] United Kingdom
[25%] Germany
[25%] Sweden
[22%] France
[25%] All Others
[25%] Spain
[25%] Netherlands
[25%] Poland
[25%] Italy
[25%] Belgium
Sectors
[25%] Industrial, Distribution Warehouse
[25%] Industrial, Manufacturing
Management Control
[25%] Indirect
[25%] Managed
Peer Group Management Control
[25%] Indirect
[25%] Managed
Peer Group Sectors
[25%] Industrial, Distribution Warehouse
[25%] Industrial, Manufacturing
Entity characteristics:The geographic location and property type characterization of participants is determined by a pre-set allocation threshold. It is set at 75 percent of the Gross Asset Value (GAV), while the threshold for determining the geographic location is set at 60 percent of the GAV. If a participant does not reach the threshold for allocation to a specific geography, it is allocated to “globally diversified.” Likewise, if a participant does not reach to a specific property type, it is allocated to “diversified.” Within the latter, three additional classifications are made: retail/office, residential/office, and office.
Peer group characteristics:The peer group composition is determined by a simple set of rules and, to guarantee consistent treatment of all participants, involves no manual judgment or intervention.
If the entity is a listed company, the Peer Group Constituents list includes all peer group entities with the entity name. If the entity is a non-listed company/fund, the Peer Group Constituents list includes the fund manager names of the peer group entities.
PEER GROUP CONSTITUENTS

5
VALIDATION
All the data submitted in the benchmark goes through GRESB’s data validation process.
There are three validation levels:
• All Participant Checks: For selected data points GRESB checks all benchmark submissions;
• Validation Plus: An additional desktop review of a sub-section of the total Assessment submissions. The review is undertaken by a member of the GRESB validation team
who will review selected data points. In 2017, approx. 20% entities were selected for Validation Plus;
• Validation Interviews: An in-person meeting and/or a phone-call for a selection of Assessment participants. The review takes place with a member of the GRESB validation team for a maximum of half a day. In 2017, 2.5% entities including Developers were selected for a Validation Interview.
Third party checks on sustainability disclosure provide investors and participants with confidence regarding the integrity and reliability of the reported data.
Questions 24.4, 25.3, 26.3, 27.2 are not asked per property type but enquire about the review, verification and assurance of data across the whole portfolio.
The purpose of this sample report is to demonstrate the appearance and format of GRESB’s assessment. To protect data confidentially, the sample contains randomised data and does not include any real data submitted in the 2017 GRESB Assessment. As a result, displayed
data may contain inconsistencies which will not appear in a company or fund’s actual Report.
GRESB VALIDATION
THIRD PARTY VALIDATION
REPORTING BOUNDARIES
Question Data Review
7.2 Organization’s sustainability disclosure Externally checked by our consultant
24.4 Energy consumption data reported Externally certified by Multiple Providers
25.3 GHG emissions data reported No third party validation
26.3 Water consumption data reported Not applicable
27.2 Waste management data reported Externally assured by our consultant
[ACCEPTED}
[ACCEPTED}
[ACCEPTED}
The participant can use this field to provide additional context for the information reported throughout the Assessment. This can include elements related to changes in the portfolio’s composition, the organization’s development strategy, reporting boundaries.