Embed Size (px)
Citation preview
Ready for Kindergarten: Maryland’s
Early Childhood Comprehensive
Assessment System
2014-2015
Kindergarten Readiness Assessment
readiness matters!
4

MARYLAND STATE BOARD OF EDUCATION
Dr. Charlene M. Dukes President
Dr. Mary Kay Finan
Vice President
S. James Gates, Jr. James H. Degraffenreidt, Jr.
Donna Hill Staton, Esq. Luisa Montero-Diaz
Sayed M. Naved Gayon M. Sampson
Madhu Sidhu Guffrie M. Smith, Jr. Dr. Ivan C.A. Walks
Kate Walsh
Dr. Lillian Lowery State Superintendent of Schools
Dr. Rolf Grafwallner
Assistant State Superintendent Division of Early Childhood Development
Marcella Franczkowski
Assistant State Superintendent Division of Special Education and Early Intervention Services
Larry J. Hogan, Jr. Governor
The Maryland State Department of Education does not discriminate on the basis of race, color, sex, age, national origin, religion, or disability in matters affecting employment or in providing access to
programs. For inquiries related to departmental policy, contact the Equity Assurance and Compliance Office, Maryland State Department of Education, 200 W. Baltimore Street, Baltimore, MD 21201.
410.767.0433 (voice) 410.767.0431 (fax) 410.333.6442 (TTY/TDD)
For more information about the contents of this document, contact 410.767.0335 ©2015 Maryland State Department of Education

Table of Contents School Readiness Results for School Year 2014-2015 .............................................................................. 1 Reporting and Interpreting of KRA Results .............................................................................................. 5 What do the KRA results represent? .......................................................................................................... 7 Availability of the 2014-2015 School Readiness Report ........................................................................... 7 Background of Maryland’s School Readiness Initiative ............................................................................ 7
New System of Measuring School Readiness in Maryland ....................................................................... 8 Alignment of Kindergarten Readiness Assessment Standards with the Maryland College and Career-Ready Standards......................................................................................................................................... 9
KRA Item Types ........................................................................................................................................ 9
Use of Data and Accountability ................................................................................................................. 10
Accessibility for Special Populations: Guidelines on Allowable Supports ............................................... 11
Validity and Reliability of Data ................................................................................................................. 11
Measurement of the Internal Consistency of the KRA – Cronbach’s Alpha (α) ....................................... 12
KRA Item Reduction and Standard Setting ............................................................................................... 13
Appendix A: Ready for Kindergarten: Maryland’s Kindergarten Readiness Assessment Common Language Standards Assessed .................................................................................................... A2 Appendix B: Definitions.................................................................................................................................................. B3 Presentation of School Readiness Information .......................................................................................... B4
• State of Maryland • 24 Local School Systems • Maryland School for the Deaf
Appendix C: Individual Stakeholders, Group Participants and Testing Sites ................................................................. C3 Appendix D: Frequently Asked Questions ...................................................................................................................... D3
• Assessment Overview • Technology • Implementation • Special Education • English Language Learners

1
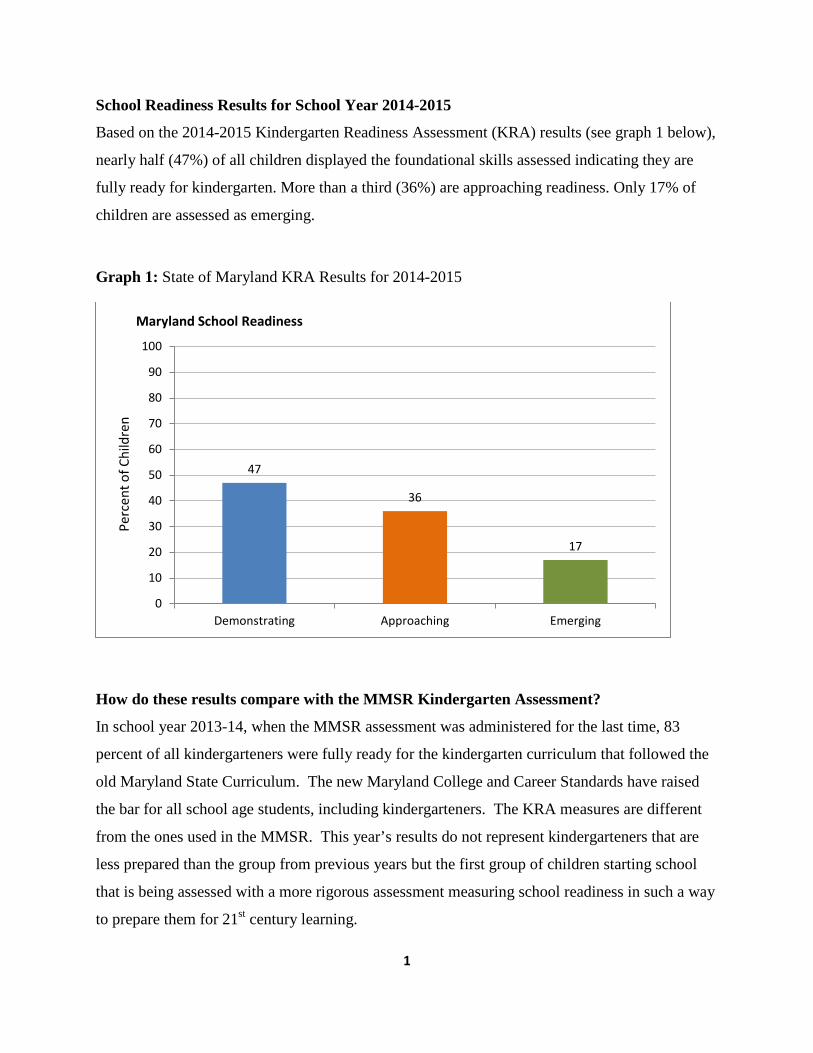
School Readiness Results for School Year 2014-2015
Based on the 2014-2015 Kindergarten Readiness Assessment (KRA) results (see graph 1 below),
nearly half (47%) of all children displayed the foundational skills assessed indicating they are
fully ready for kindergarten. More than a third (36%) are approaching readiness. Only 17% of
children are assessed as emerging.
Graph 1: State of Maryland KRA Results for 2014-2015
How do these results compare with the MMSR Kindergarten Assessment?
In school year 2013-14, when the MMSR assessment was administered for the last time, 83
percent of all kindergarteners were fully ready for the kindergarten curriculum that followed the
old Maryland State Curriculum. The new Maryland College and Career Standards have raised
the bar for all school age students, including kindergarteners. The KRA measures are different
from the ones used in the MMSR. This year’s results do not represent kindergarteners that are
less prepared than the group from previous years but the first group of children starting school
that is being assessed with a more rigorous assessment measuring school readiness in such a way
to prepare them for 21st century learning.
47
36
17
0
10
20
30
40
50
60
70
80
90
100
Demonstrating Approaching Emerging
Maryland School Readiness
Perc
ent o
f Chi
ldre
n
2
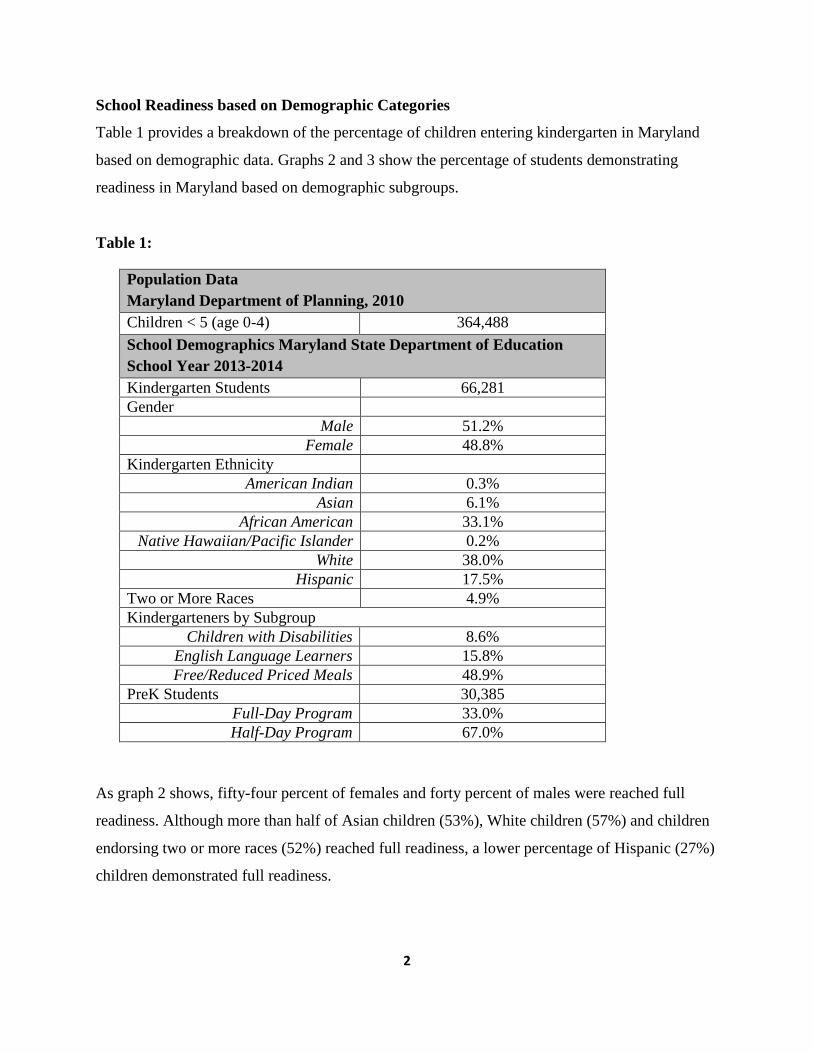
School Readiness based on Demographic Categories
Table 1 provides a breakdown of the percentage of children entering kindergarten in Maryland
based on demographic data. Graphs 2 and 3 show the percentage of students demonstrating
readiness in Maryland based on demographic subgroups.
Table 1:
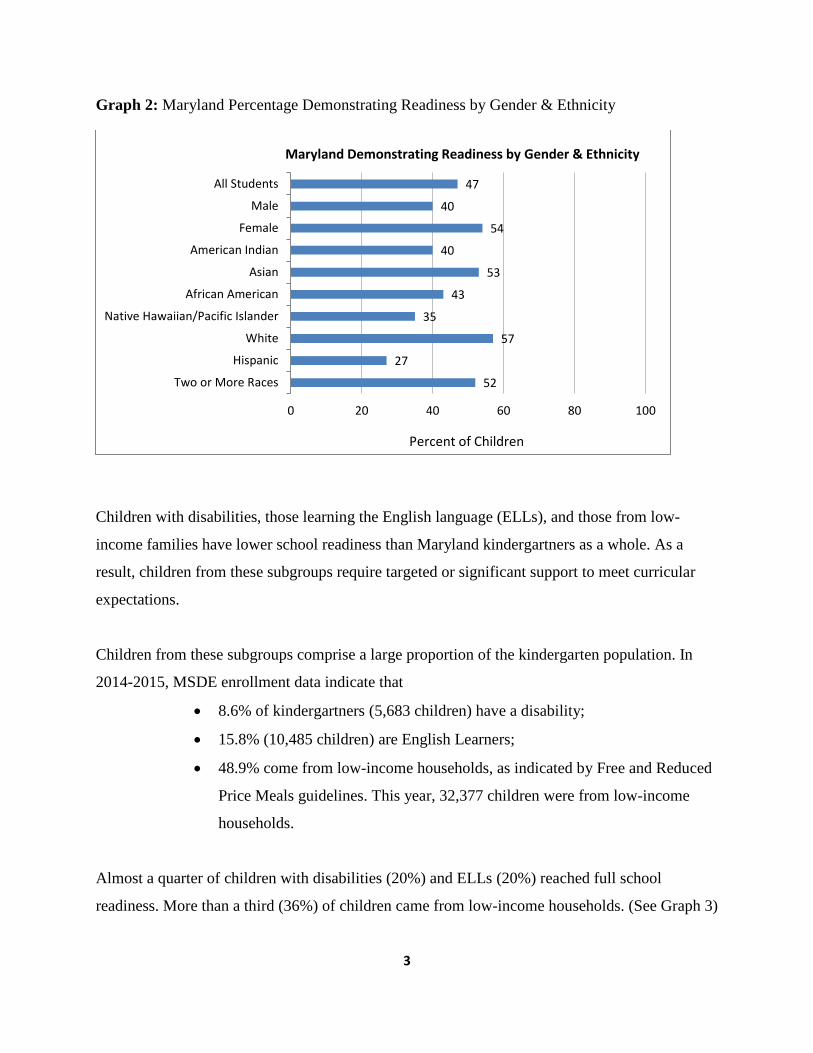
As graph 2 shows, fifty-four percent of females and forty percent of males were reached full
readiness. Although more than half of Asian children (53%), White children (57%) and children
endorsing two or more races (52%) reached full readiness, a lower percentage of Hispanic (27%)
children demonstrated full readiness.
Population Data Maryland Department of Planning, 2010 Children < 5 (age 0-4) 364,488 School Demographics Maryland State Department of Education School Year 2013-2014 Kindergarten Students 66,281 Gender
Male 51.2% Female 48.8%
Kindergarten Ethnicity American Indian 0.3%
Asian 6.1% African American 33.1%
Native Hawaiian/Pacific Islander 0.2% White 38.0%
Hispanic 17.5% Two or More Races 4.9% Kindergarteners by Subgroup
Children with Disabilities 8.6% English Language Learners 15.8% Free/Reduced Priced Meals 48.9%
PreK Students 30,385 Full-Day Program 33.0% Half-Day Program 67.0%
3
Graph 2: Maryland Percentage Demonstrating Readiness by Gender & Ethnicity
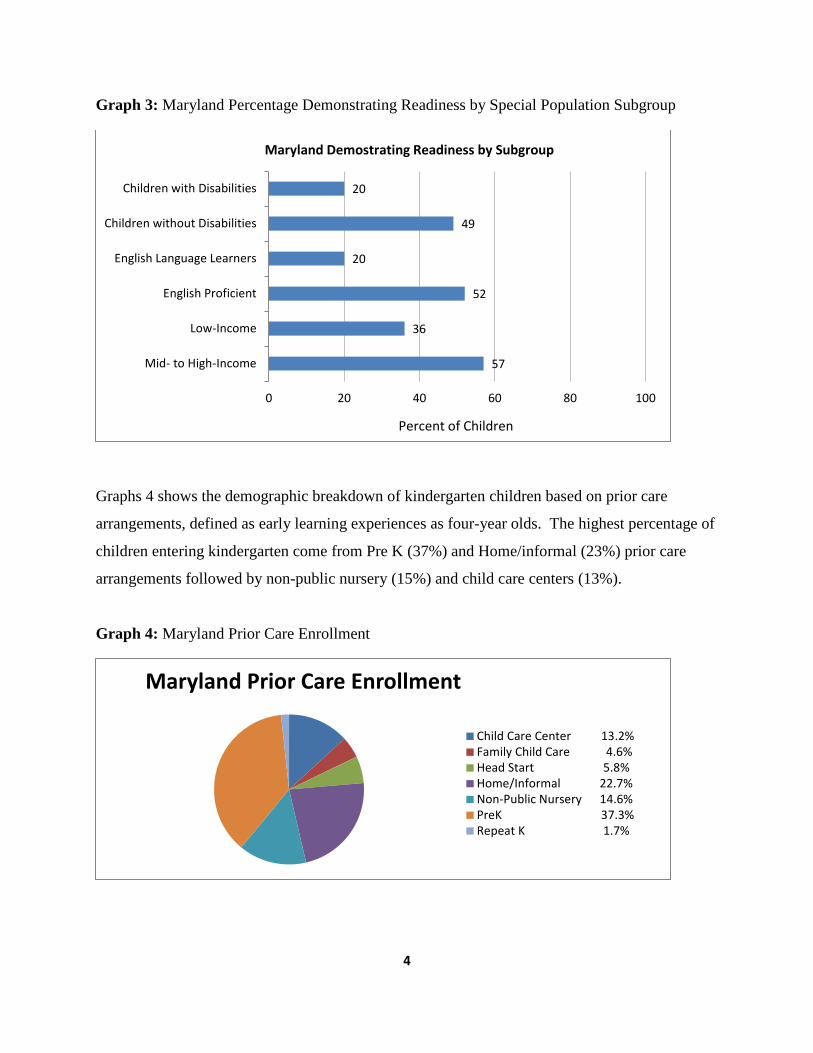
Children with disabilities, those learning the English language (ELLs), and those from low-
income families have lower school readiness than Maryland kindergartners as a whole. As a
result, children from these subgroups require targeted or significant support to meet curricular
expectations.
Children from these subgroups comprise a large proportion of the kindergarten population. In
2014-2015, MSDE enrollment data indicate that
• 8.6% of kindergartners (5,683 children) have a disability;
• 15.8% (10,485 children) are English Learners;
• 48.9% come from low-income households, as indicated by Free and Reduced
Price Meals guidelines. This year, 32,377 children were from low-income
households.
Almost a quarter of children with disabilities (20%) and ELLs (20%) reached full school
readiness. More than a third (36%) of children came from low-income households. (See Graph 3)
52
27
57
35
43
53
40
54
40
47
0 20 40 60 80 100
Two or More Races
Hispanic
White
Native Hawaiian/Pacific Islander
African American
Asian
American Indian
Female
Male
All Students
Maryland Demonstrating Readiness by Gender & Ethnicity
Percent of Children
4
Graph 3: Maryland Percentage Demonstrating Readiness by Special Population Subgroup
Graphs 4 shows the demographic breakdown of kindergarten children based on prior care
arrangements, defined as early learning experiences as four-year olds. The highest percentage of
children entering kindergarten come from Pre K (37%) and Home/informal (23%) prior care
arrangements followed by non-public nursery (15%) and child care centers (13%).
Graph 4: Maryland Prior Care Enrollment
57
36
52
20
49
20
0 20 40 60 80 100
Mid- to High-Income
Low-Income
English Proficient
English Language Learners
Children without Disabilities
Children with Disabilities
Maryland Demostrating Readiness by Subgroup
Percent of Children
Maryland Prior Care Enrollment
Child Care Center 13.2%Family Child Care 4.6%Head Start 5.8%Home/Informal 22.7%Non-Public Nursery 14.6%PreK 37.3%Repeat K 1.7%
5
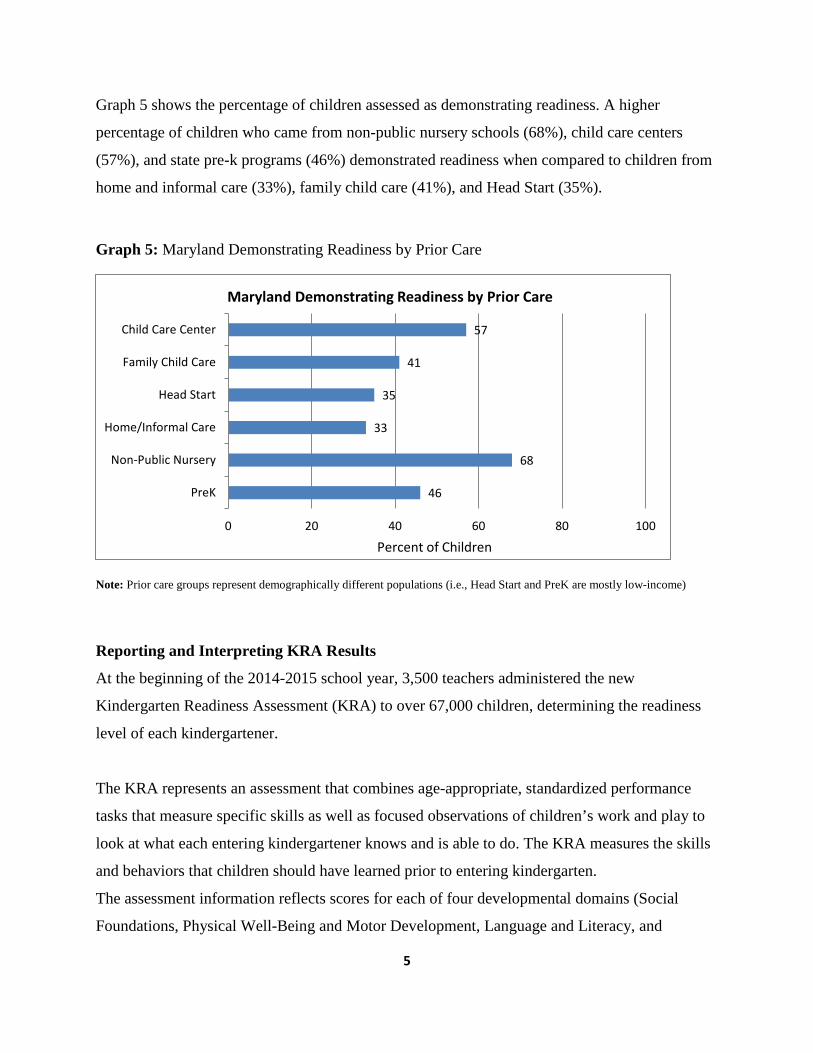
Graph 5 shows the percentage of children assessed as demonstrating readiness. A higher
percentage of children who came from non-public nursery schools (68%), child care centers
(57%), and state pre-k programs (46%) demonstrated readiness when compared to children from
home and informal care (33%), family child care (41%), and Head Start (35%).
Graph 5: Maryland Demonstrating Readiness by Prior Care
Note: Prior care groups represent demographically different populations (i.e., Head Start and PreK are mostly low-income)
Reporting and Interpreting KRA Results
At the beginning of the 2014-2015 school year, 3,500 teachers administered the new
Kindergarten Readiness Assessment (KRA) to over 67,000 children, determining the readiness
level of each kindergartener.
The KRA represents an assessment that combines age-appropriate, standardized performance
tasks that measure specific skills as well as focused observations of children’s work and play to
look at what each entering kindergartener knows and is able to do. The KRA measures the skills
and behaviors that children should have learned prior to entering kindergarten.
The assessment information reflects scores for each of four developmental domains (Social
Foundations, Physical Well-Being and Motor Development, Language and Literacy, and
46
68
33
35
41
57
0 20 40 60 80 100
PreK
Non-Public Nursery
Home/Informal Care
Head Start
Family Child Care
Child Care Center
Maryland Demonstrating Readiness by Prior Care
Percent of Children
6
Mathematics) and the composite score overall and based on the following student demographic
information:
• race/ethnicity;
• gender;
• prior early care;
• special education;
• English Language Learners (ELL); and,
• Enrollment in free and reduced priced meals program.
Reporting of the domain level scores is based on the percentage of students who are
demonstrating readiness or not yet demonstrating readiness in the four domains assessed:
• Demonstrating readiness: Student demonstrates foundational skills and behaviors that
prepare [him/her] for curriculum based on kindergarten standards in this domain.
• Not yet demonstrating readiness: Student does not yet demonstrate the foundational
skills and behaviors that prepare [him/her] for curriculum based on kindergarten
standards in this domain.
Reporting of the KRA scores overall is based on Performance Level Descriptors (PLD’s)
that reflect the percentage of students who have reached one of the following levels of
readiness:
• Demonstrating Readiness: Student demonstrates foundational skills and behaviors
that prepare [him/her] for curriculum based on kindergarten standards.
• Approaching Readiness: Student demonstrates some foundational skills and
behaviors that prepare [him/her] for curriculum based on kindergarten standards.
• Emerging Readiness: Student demonstrates limited foundational skills and behaviors
that prepare [him/her] for curriculum based on kindergarten standards.
• Other: A child was not able able to access one or more assessment items resulting in a
“No Score” for those items due to limited English proficiency, a disability, or other

7
circumstances, such as a documented medical condition during assessment
administration.
Children whose readiness skills and behaviors are “developing and/or emerging” require
instructional support to be successful in kindergarten and beyond. Detailed results of composite
and domains by state and jurisdiction are posted in Appendix B.
What do the KRA results represent?
The key idea for interpreting KRA results is the standard that has been set for what professionals
from Maryland and Ohio consider school readiness based on the new curricular standards. The
KRA results, as presented in Appendix B for the State of Maryland and its 24 jurisdictions as
well as the Maryland School of the Deaf, represent an incoming kindergarten student’s set of
skills and behaviors as expressed in the Composite Score. The subset of skills and behaviors are
research based and have been defined as critical for being ready for school and comprise such
skills across four domains of learning – Language/Literacy, Mathematics, Social Foundations,
and Physical Development. This means that a kindergartener must demonstrate these skills and
behaviors for all the four domains in order to reach a composite score that represents
“demonstrating readiness.” A student who has not yet demonstrated those skills in one of the
domains has either a composite score of “approaching” or “emerging” readiness.
Availability of the 2014-2015 School Readiness Report
On May 26, 2015, the school readiness information for school year 2014-2015 will be available
online at www.marylandpublicschools.org and at www.readyatfive.org. Hard copies of the
report are available upon request from the Maryland State Department of Education, Division of
Early Childhood Development, Early Learning Office, at 410-767-0335.
Background of Maryland’s School Readiness Initiative
On January 20, 2000, the Subcabinet for Children, Youth, and Families submitted a report to the
Joint Committee on Children, Youth, and Families outlining strategies to improve services for
young children and to prepare them to enter school ready to learn. In 2001, The Maryland State
Board of Education incorporated a school readiness goal in MSDE’s strategic plan. Since that
time, the annual school readiness information, based on The Maryland Model of School
8
Readiness (MMSR), has been used to measure progress toward this goal and an annual school
readiness report has been issued since school year 2001-02.
Maryland continues to be committed to creating a world-class education system that prepares
students for college and career success in the 21st century. Early education is an integral part of
this vision. Maryland’s reform efforts were validated with the award of a federal Race to the Top
grant in 2010 and a Race to the Top Early Learning Challenge Fund Grant (RTTT-ECL) in
December 2011 and the Preschool Development Grant to expand prekindergarten for low-
income four-year olds.
New System of Measuring School Readiness in Maryland
The Race to the Top initiative has already lifted Maryland’s preparedness for future challenges
such as eliminating the school readiness gap and providing equitable access to quality learning
opportunities for all children. Maryland is once again at the forefront of strengthening school
readiness. We are taking the MMSR to the next level. As part of the $50 million Early Learning
Challenge grant, the Maryland State Department of Education, the Divisions of Early Childhood
Development and Special Education/Early Intervention Services, developed a comprehensive
assessment system that not only advances continuous improvement of early learning among
programs in early childhood education, but, most importantly, helps early childhood educators
improve early learning opportunities for young learners.
The new system, known as Ready for Kindergarten (R4K): Maryland’s Early Childhood -
Comprehensive Assessment System, aligns with the new State Standards for K-12 instruction.
Developed in partnership with the Ohio Department of Education, the R4K provides one system
for recognizing the needs and measuring the learning progress of all children from 3 to 6 years of
age in four domains of child learning1.
The R4K has two components:
1. Early Learning Assessment (i.e., formative assessment) gauges the progress of
learning in young children, 36 to 72 months, for seven developmental domains. They
1 Both states are supported by a unique partnership with Johns Hopkins University – Center for Technology in Education (JHU-CTE) and WestEd
9
describe the pathway that children typically follow as they learn or the sequence in which
knowledge and skills develop. Each child’s progress is monitored along a continuum and
tracked over time. In this way, early educators, working with 3- and 4-year-olds can
create individualized learning opportunities and plan interventions, if needed, to ensure
that children are on the path of kindergarten readiness.
2. Kindergarten Readiness Assessment (KRA) is administered to kindergarteners,
measuring school readiness in four developmental domains. The KRA provides a
snapshot of school readiness levels for all incoming kindergarteners. The readiness
assessment makes it possible to confidently determine if entering students have the skills
and abilities needed for kindergarten. The KRA also identifies the individual needs of
children, enabling teachers to make informed instructional decisions.
Alignment of Kindergarten Readiness Assessment Standards with the Maryland College
and Career-Ready Standards
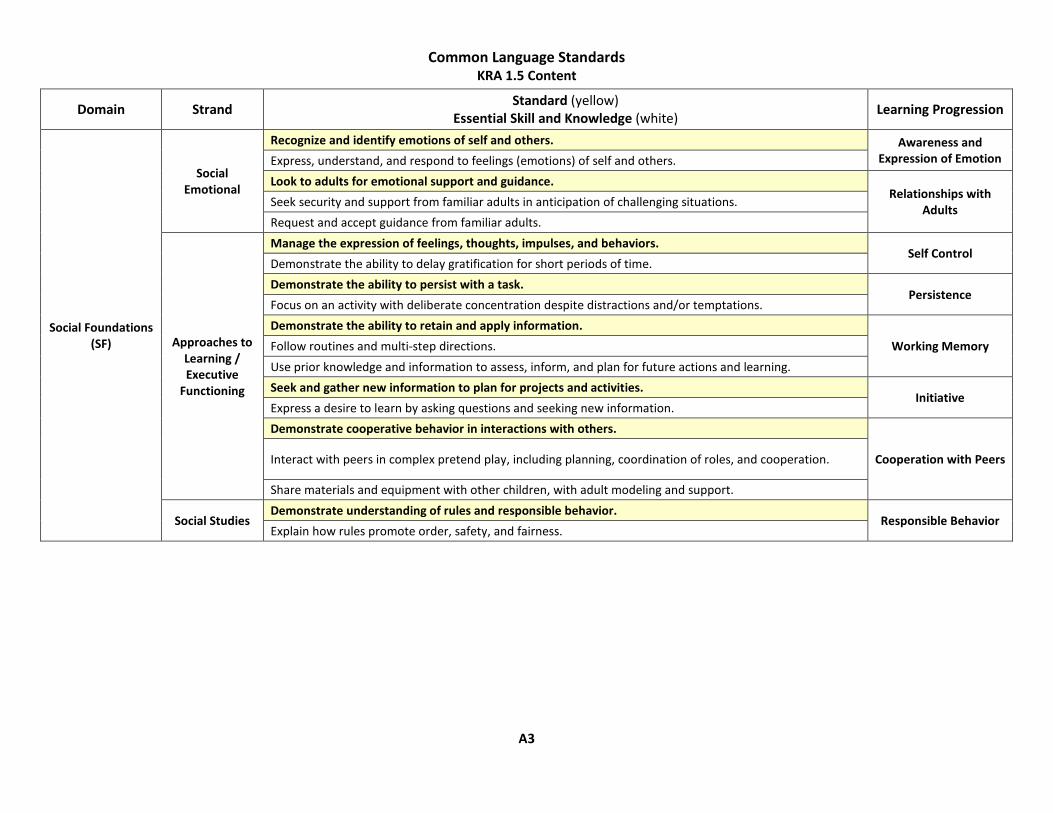
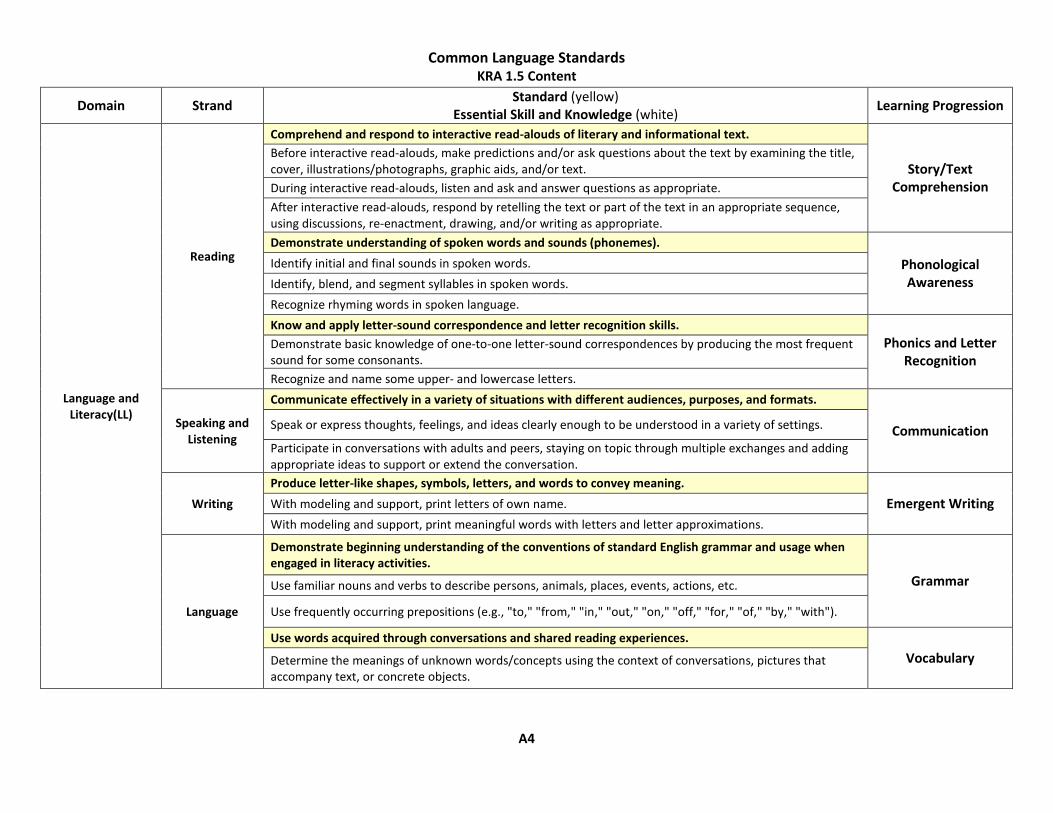
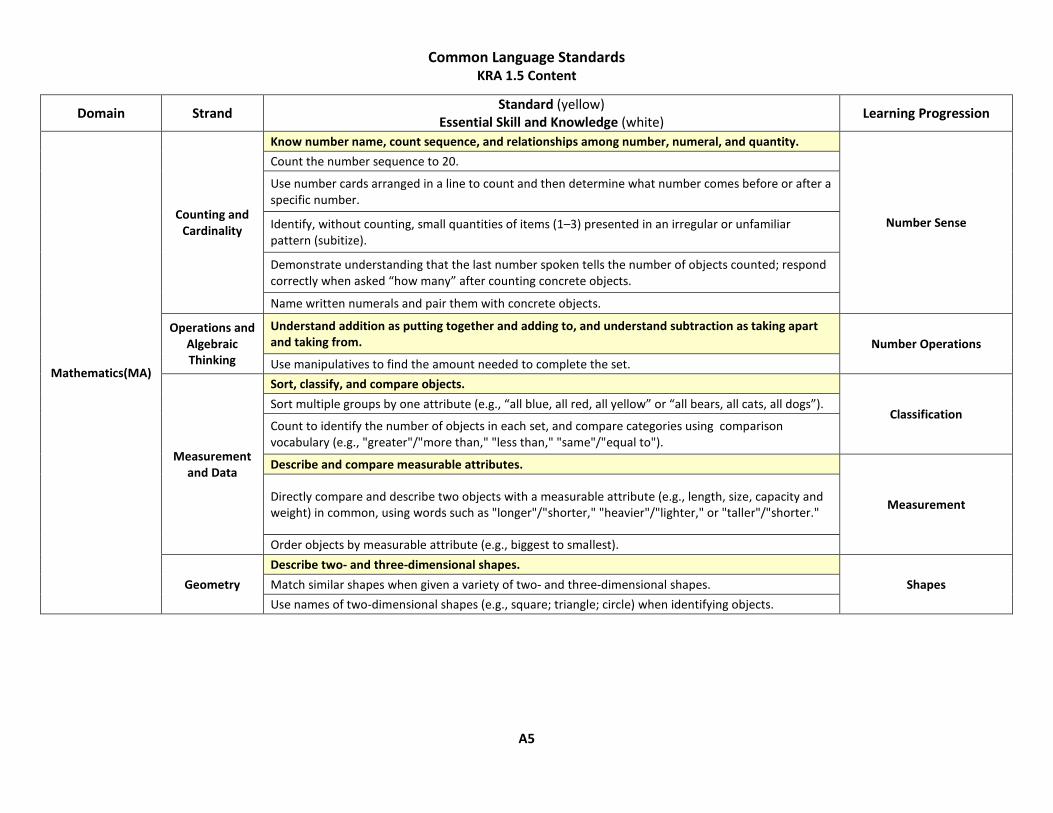
The foundation for the R4K is a set of common language standards (CLS) that were developed
based on an alignment study of Maryland and Ohio’s standards for pre-kindergarten and
kindergarten. The alignment study informed the drafting of the CLS (see appendix A), which are
based on a hierarchical structure and contain four levels: domain, strand, standard, and essential
skills and knowledge (ESKs). The ESKs provide the most specific content descriptions, and item
content and KRA assessment items were mapped to this level. The CLS cover essential domains
for kindergarten readiness, which include Social Foundations (including approaches to learning
and executive functioning), Language and Literacy, Mathematics, and Physical Well-Being and
Motor Development. 2
KRA Item Types
A KRA item is one question or observation that is aligned to a specific ESK statement drawn
from the CLS and results in a score. More than one question may be clustered around a common
stimulus (e.g., a story), and each item in the cluster results in a score.
2 An earlier version included the domains Science and Social Studies, which were eliminated based on an item review analysis and reduction process.
10
The KRA is composed of three item types: selected response, performance task, and
observational rubric.
• Selected-response items consist of a question or prompt, that is read to the child along
with three possible answer options. There is only one correct answer per question. The
child indicates his or her response by touching one of the three answer options. Each
selected-response items is worth one score point.
• Performance-task items consist of an activity or action that is completed by the child,
typically after a prompt is read by the teacher. In some instances, manipulatives are
provided to allow the student to demonstrate the skill being assessed. Performance-task
items are scored with a rubric and can be worth up to one, two, or three points.
• Observational-rubric items describe specific behaviors or skills to be observed by the
teacher during typical classroom activities. Observational-rubrics items are worth up to
two points.
The items were reviewed and validated in terms of age-appropriateness, and cultural sensitivity.
Use of Data and Accountability
In Maryland, early childhood professionals share accountability for the results of providing early
learning opportunities. Any assessment, determining such results, is rooted in each practitioner’s
interaction with the young child as a learner. This relationship provides for an in-depth
understanding of the strengths and needs of individual learners. The assessment of young
children should promote learning and improvement of early childhood programs, not simply
measure it. The R4K, which includes the Kindergarten Readiness Assessment (KRA), provides a
framework to assess what students should know and be able to do when they enter kindergarten
to ensure they are ready to learn. The KRA will provide data that teachers can use to identify
learning gaps and ensure quality early learning opportunities for children by building on the
strengths of every child. Specifically, the KRA will support and advance children’s early
learning and academic achievement by:
o Informing prior education and care stakeholders of early learning standards and
experiences that promote kindergarten readiness;
11
o Identifying individual children’s needs and providing necessary supports to
children and teachers;
o Assisting teachers in data-driven instructional decision making at the child and
classroom level; and
o Providing families with information about their children’s learning and
development;
Accessibility for Special Populations: Guidelines on Allowable Supports
The Guidelines on Allowable Supports for Administration of the Kindergarten Readiness
Assessment document was developed and includes a list of universally designed allowable
supports that can be used with any student participating in the KRA. If the universally designed
supports are not sufficient to enable children with disabilities or English language learners to
demonstrate their skills and knowledge, teachers are expected to use the appropriate Level the
Field support(s) described in the Guidelines on Allowable Supports for Administration of the
Kindergarten Readiness Assessment. Alternate Test Administration Manuals and Test Item
Images Booklets were developed for children with significant vision and hearing impairments for
which the standard KRA materials and items were not accessible.
Validity and Reliability of Data
A three step development process (pre-pilot, pilot, and field test) that follows research and best
practice in assessment development was used to thoroughly test the items developed for the KRA
and ensure the KRA was a valid and reliable assessment of kindergarten readiness. The
development process included tests of the KRA items through cognitive interviews with teachers
and students, a pilot test, and a field test. As part of the process, three primary questions were
asked:
• What item/task characteristics are needed to effectively measure the intended content in
the KRA?
• What item characteristics are needed to ensure that the access needs of all children are
considered?
12
• Which item types most strongly demonstrate those characteristics identified as most
important and developmentally valid?
By asking these questions it was possible to evaluate the degree to which system components
work together as intended (i.e., use of multiple measures to assess a specific skill), and evaluate
the degree to which technology-supported items and traditional items perform to ensure and
maintain comparability.
MSDE engaged local school system leaders and teachers throughout every phase of the
development process, including testing of the system. Stakeholder and expert input, including
kindergarten teachers, was gathered and used at every level of development. Engagement
included the following:
National Technical Advisory Committee (facilitated by the Council of Chief State
School Officers)
State and Local Advisory Councils
Stakeholder and Expert Ad Hoc Committees (Ad Hoc Group Meetings for Item
Content Analysis and Bias and Sensitivity Review and Sub-group meetings in
professional development, Technology, Special Education, and English Learners)
Multi-partner Leadership Teams (including accessibility and accommodations
workgroups for special populations.)
For a complete list of individual stakeholder and group participants, please see Appendix C.
Measurement of the Internal Consistency of the KRA – Cronbach’s Alpha (α)
All KRA items were evaluated for their difficulty, discrimination (i.e., item-total correlation),
and internal consistency. The internal structure of the KRA was examined using a common
psychometric analysis procedure to obtain an estimate of the reliability or a measure of the extent
the items on the KRA measure the same construct. Cronbach’s Alpha (α) provides an internal
consistency estimate of the assessment, which is based on the correlation between each test item
with other test items to form one construct. Generally, the alpha increases when the correlation
between test items increases. Table 3 shows that the inter-correlations among KRA assessment
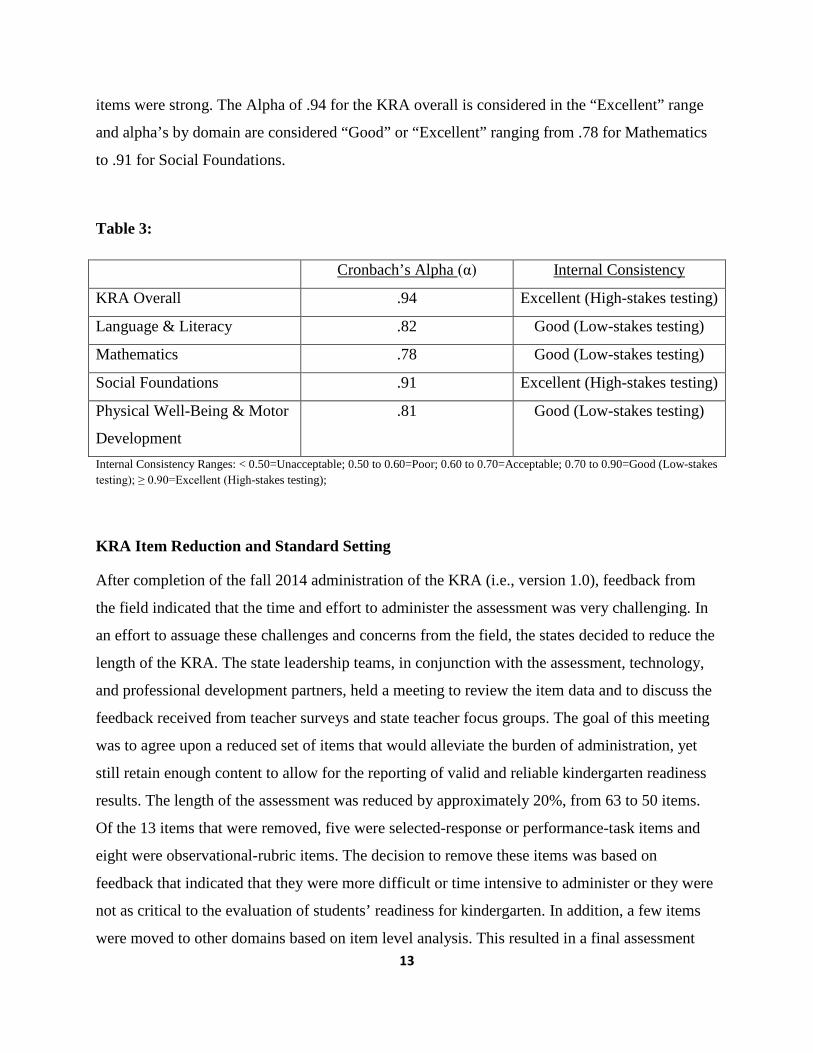
13
items were strong. The Alpha of .94 for the KRA overall is considered in the “Excellent” range
and alpha’s by domain are considered “Good” or “Excellent” ranging from .78 for Mathematics
to .91 for Social Foundations.
Table 3:
Cronbach’s Alpha (α) Internal Consistency
KRA Overall .94 Excellent (High-stakes testing)
Language & Literacy .82 Good (Low-stakes testing)
Mathematics .78 Good (Low-stakes testing)
Social Foundations .91 Excellent (High-stakes testing)
Physical Well-Being & Motor
Development
.81 Good (Low-stakes testing)
Internal Consistency Ranges: < 0.50=Unacceptable; 0.50 to 0.60=Poor; 0.60 to 0.70=Acceptable; 0.70 to 0.90=Good (Low-stakes testing); ≥ 0.90=Excellent (High-stakes testing);
KRA Item Reduction and Standard Setting
After completion of the fall 2014 administration of the KRA (i.e., version 1.0), feedback from
the field indicated that the time and effort to administer the assessment was very challenging. In
an effort to assuage these challenges and concerns from the field, the states decided to reduce the
length of the KRA. The state leadership teams, in conjunction with the assessment, technology,
and professional development partners, held a meeting to review the item data and to discuss the
feedback received from teacher surveys and state teacher focus groups. The goal of this meeting
was to agree upon a reduced set of items that would alleviate the burden of administration, yet
still retain enough content to allow for the reporting of valid and reliable kindergarten readiness
results. The length of the assessment was reduced by approximately 20%, from 63 to 50 items.
Of the 13 items that were removed, five were selected-response or performance-task items and
eight were observational-rubric items. The decision to remove these items was based on
feedback that indicated that they were more difficult or time intensive to administer or they were
not as critical to the evaluation of students’ readiness for kindergarten. In addition, a few items
were moved to other domains based on item level analysis. This resulted in a final assessment
14
broken out into four domains, rather than the six originally developed. The resulting version of
the KRA, called version 1.5, will be administered in fall 2015.
The standard setting process immediately followed the item reduction decision making process.
The role of standard setting is to determine how performance, as defined by scores on the
assessment, relate to the performance levels. In other words, what score determines whether a
student should be classified as demonstrating, approaching, or emerging readiness?
After initial internal consistency estimates of reliability were obtained, a common Standard
Setting Process called “Bookmarking” was used to determine cut scores for the KRA. A total of
23 teachers and early learning specialists from Maryland and Ohio, who represented a range of
educational backgrounds and subgroup populations, served as panelists in this process. An
essential feature of this method is the mapping of items, based on skill/item difficulty, onto a
proficiency distribution where cut scores are set. With this method, panelists review an ordered
item booklet in which the content of the assessment is presented in the order of difficulty, based
on how students actually performed on the items. Panelists are then asked to place their
“bookmark” at that point in the ordered item booklet where they believe the items would
separate students into the different performance levels. For the KRA, panelists were asked to set
two bookmarks. The first bookmark identified the items that separated students from the
emerging to approaching readiness levels, and the second bookmark at the point in the ordered
item booklet that separated students that were approaching readiness from those that were
demonstrating readiness. The key distinction between the levels focused on the degree of
remediation required. Students in the emerging level require significant support on a breadth of
content or are lacking significant skills or behaviors in a particular domain. Those students
demonstrating readiness are those who require no significant support. These students are ready to
begin with instruction based on the kindergarten content standards beginning day one of the
school year. The approaching readiness students are those who fall in between.
A1
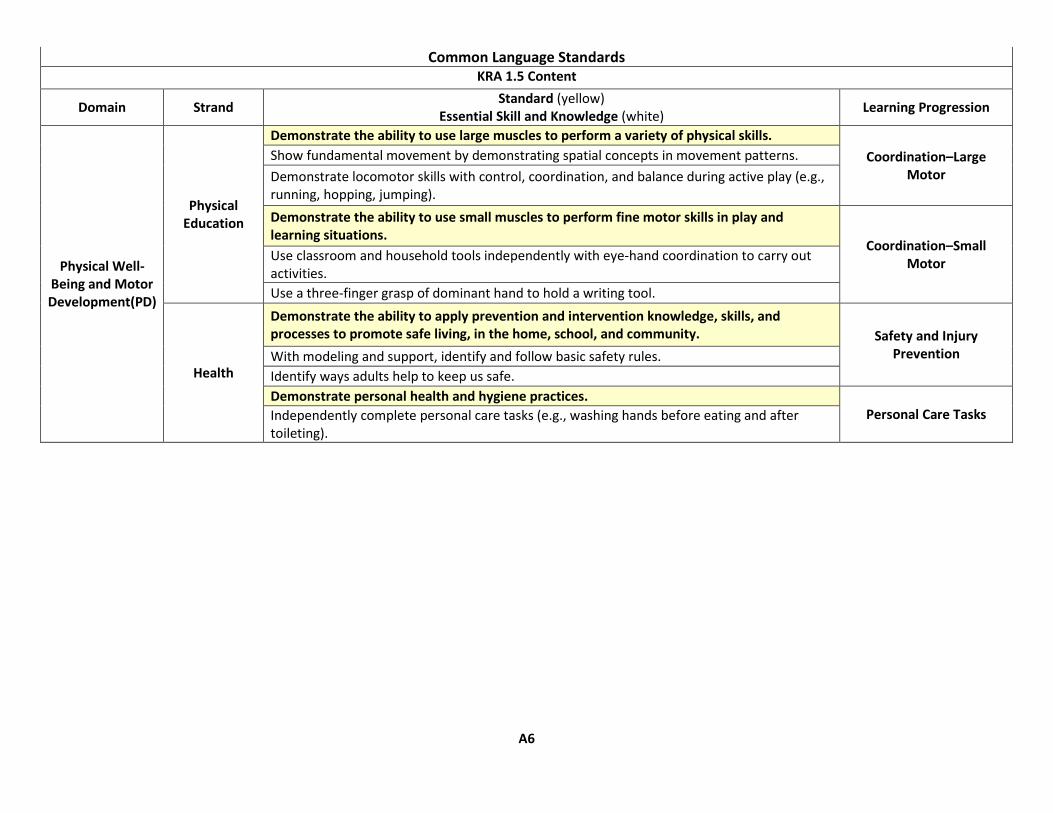
Appendix A
Ready for Kindergarten: Maryland’s Kindergarten Readiness Assessment
Common Language Standards Assessed

A2
A3
Common Language Standards KRA 1.5 Content
Domain Strand Standard (yellow) Essential Skill and Knowledge (white) Learning Progression
Social Foundations (SF)
Social Emotional
Recognize and identify emotions of self and others. Awareness and Expression of Emotion Express, understand, and respond to feelings (emotions) of self and others.
Look to adults for emotional support and guidance. Relationships with
Adults Seek security and support from familiar adults in anticipation of challenging situations. Request and accept guidance from familiar adults.
Approaches to Learning / Executive
Functioning
Manage the expression of feelings, thoughts, impulses, and behaviors. Self Control
Demonstrate the ability to delay gratification for short periods of time. Demonstrate the ability to persist with a task.
Persistence Focus on an activity with deliberate concentration despite distractions and/or temptations. Demonstrate the ability to retain and apply information.
Working Memory Follow routines and multi-step directions. Use prior knowledge and information to assess, inform, and plan for future actions and learning. Seek and gather new information to plan for projects and activities.
Initiative Express a desire to learn by asking questions and seeking new information. Demonstrate cooperative behavior in interactions with others.
Cooperation with Peers Interact with peers in complex pretend play, including planning, coordination of roles, and cooperation.
Share materials and equipment with other children, with adult modeling and support.
Social Studies Demonstrate understanding of rules and responsible behavior.
Responsible Behavior Explain how rules promote order, safety, and fairness.
A4
Common Language Standards KRA 1.5 Content
Domain Strand Standard (yellow) Essential Skill and Knowledge (white) Learning Progression
Language and Literacy(LL)
Reading
Comprehend and respond to interactive read-alouds of literary and informational text.
Story/Text Comprehension
Before interactive read-alouds, make predictions and/or ask questions about the text by examining the title, cover, illustrations/photographs, graphic aids, and/or text. During interactive read-alouds, listen and ask and answer questions as appropriate. After interactive read-alouds, respond by retelling the text or part of the text in an appropriate sequence, using discussions, re-enactment, drawing, and/or writing as appropriate. Demonstrate understanding of spoken words and sounds (phonemes).
Phonological Awareness
Identify initial and final sounds in spoken words. Identify, blend, and segment syllables in spoken words. Recognize rhyming words in spoken language. Know and apply letter-sound correspondence and letter recognition skills.
Phonics and Letter Recognition
Demonstrate basic knowledge of one-to-one letter-sound correspondences by producing the most frequent sound for some consonants. Recognize and name some upper- and lowercase letters.
Speaking and Listening
Communicate effectively in a variety of situations with different audiences, purposes, and formats.
Communication Speak or express thoughts, feelings, and ideas clearly enough to be understood in a variety of settings.
Participate in conversations with adults and peers, staying on topic through multiple exchanges and adding appropriate ideas to support or extend the conversation.
Writing Produce letter-like shapes, symbols, letters, and words to convey meaning.
Emergent Writing With modeling and support, print letters of own name. With modeling and support, print meaningful words with letters and letter approximations.
Language
Demonstrate beginning understanding of the conventions of standard English grammar and usage when engaged in literacy activities.
Grammar Use familiar nouns and verbs to describe persons, animals, places, events, actions, etc.
Use frequently occurring prepositions (e.g., "to," "from," "in," "out," "on," "off," "for," "of," "by," "with").
Use words acquired through conversations and shared reading experiences. Vocabulary Determine the meanings of unknown words/concepts using the context of conversations, pictures that
accompany text, or concrete objects.
A5
Common Language Standards KRA 1.5 Content
Domain Strand Standard (yellow) Essential Skill and Knowledge (white) Learning Progression
Mathematics(MA)
Counting and Cardinality
Know number name, count sequence, and relationships among number, numeral, and quantity.
Number Sense
Count the number sequence to 20.
Use number cards arranged in a line to count and then determine what number comes before or after a specific number.
Identify, without counting, small quantities of items (1–3) presented in an irregular or unfamiliar pattern (subitize).
Demonstrate understanding that the last number spoken tells the number of objects counted; respond correctly when asked “how many” after counting concrete objects.
Name written numerals and pair them with concrete objects.
Operations and Algebraic Thinking
Understand addition as putting together and adding to, and understand subtraction as taking apart and taking from. Number Operations Use manipulatives to find the amount needed to complete the set.
Measurement and Data
Sort, classify, and compare objects.
Classification Sort multiple groups by one attribute (e.g., “all blue, all red, all yellow” or “all bears, all cats, all dogs”).
Count to identify the number of objects in each set, and compare categories using comparison vocabulary (e.g., "greater"/"more than," "less than," "same"/"equal to").
Describe and compare measurable attributes.
Measurement Directly compare and describe two objects with a measurable attribute (e.g., length, size, capacity and weight) in common, using words such as "longer"/"shorter," "heavier"/"lighter," or "taller"/"shorter."
Order objects by measurable attribute (e.g., biggest to smallest).
Geometry Describe two- and three-dimensional shapes.
Shapes Match similar shapes when given a variety of two- and three-dimensional shapes. Use names of two-dimensional shapes (e.g., square; triangle; circle) when identifying objects.
A6
Common Language Standards KRA 1.5 Content
Domain Strand Standard (yellow) Essential Skill and Knowledge (white) Learning Progression
Physical Well-Being and Motor Development(PD)
Physical Education
Demonstrate the ability to use large muscles to perform a variety of physical skills. Coordination–Large
Motor Show fundamental movement by demonstrating spatial concepts in movement patterns. Demonstrate locomotor skills with control, coordination, and balance during active play (e.g., running, hopping, jumping). Demonstrate the ability to use small muscles to perform fine motor skills in play and learning situations.
Coordination–Small Motor Use classroom and household tools independently with eye-hand coordination to carry out
activities. Use a three-finger grasp of dominant hand to hold a writing tool.
Health
Demonstrate the ability to apply prevention and intervention knowledge, skills, and processes to promote safe living, in the home, school, and community. Safety and Injury
Prevention With modeling and support, identify and follow basic safety rules. Identify ways adults help to keep us safe. Demonstrate personal health and hygiene practices.
Personal Care Tasks Independently complete personal care tasks (e.g., washing hands before eating and after toileting).

B1
Appendix B
Presentation of School Readiness Information
Definitions

B2
B3
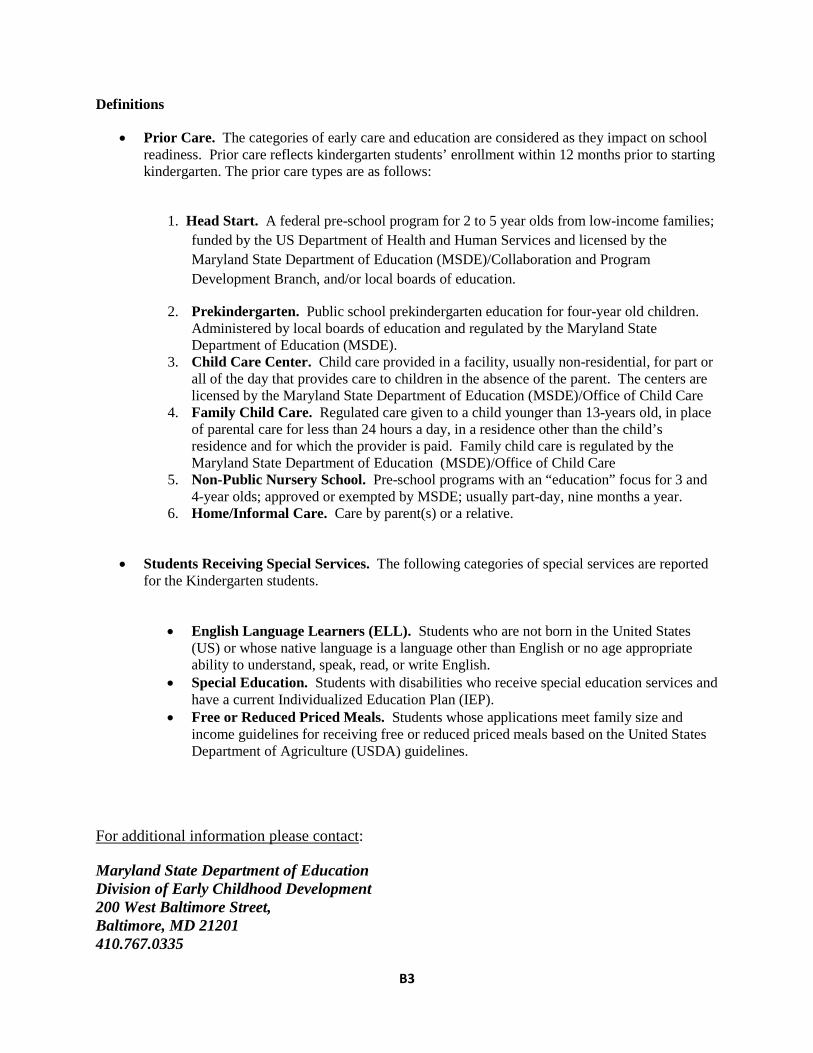
Definitions
• Prior Care. The categories of early care and education are considered as they impact on school readiness. Prior care reflects kindergarten students’ enrollment within 12 months prior to starting kindergarten. The prior care types are as follows:
1. Head Start. A federal pre-school program for 2 to 5 year olds from low-income families; funded by the US Department of Health and Human Services and licensed by the Maryland State Department of Education (MSDE)/Collaboration and Program Development Branch, and/or local boards of education.
2. Prekindergarten. Public school prekindergarten education for four-year old children. Administered by local boards of education and regulated by the Maryland State Department of Education (MSDE).
3. Child Care Center. Child care provided in a facility, usually non-residential, for part or all of the day that provides care to children in the absence of the parent. The centers are licensed by the Maryland State Department of Education (MSDE)/Office of Child Care
4. Family Child Care. Regulated care given to a child younger than 13-years old, in place of parental care for less than 24 hours a day, in a residence other than the child’s residence and for which the provider is paid. Family child care is regulated by the Maryland State Department of Education (MSDE)/Office of Child Care
5. Non-Public Nursery School. Pre-school programs with an “education” focus for 3 and 4-year olds; approved or exempted by MSDE; usually part-day, nine months a year.
6. Home/Informal Care. Care by parent(s) or a relative.
• Students Receiving Special Services. The following categories of special services are reported for the Kindergarten students.
• English Language Learners (ELL). Students who are not born in the United States (US) or whose native language is a language other than English or no age appropriate ability to understand, speak, read, or write English.
• Special Education. Students with disabilities who receive special education services and have a current Individualized Education Plan (IEP).
• Free or Reduced Priced Meals. Students whose applications meet family size and income guidelines for receiving free or reduced priced meals based on the United States Department of Agriculture (USDA) guidelines.
For additional information please contact:
Maryland State Department of Education Division of Early Childhood Development 200 West Baltimore Street, Baltimore, MD 21201 410.767.0335

B4
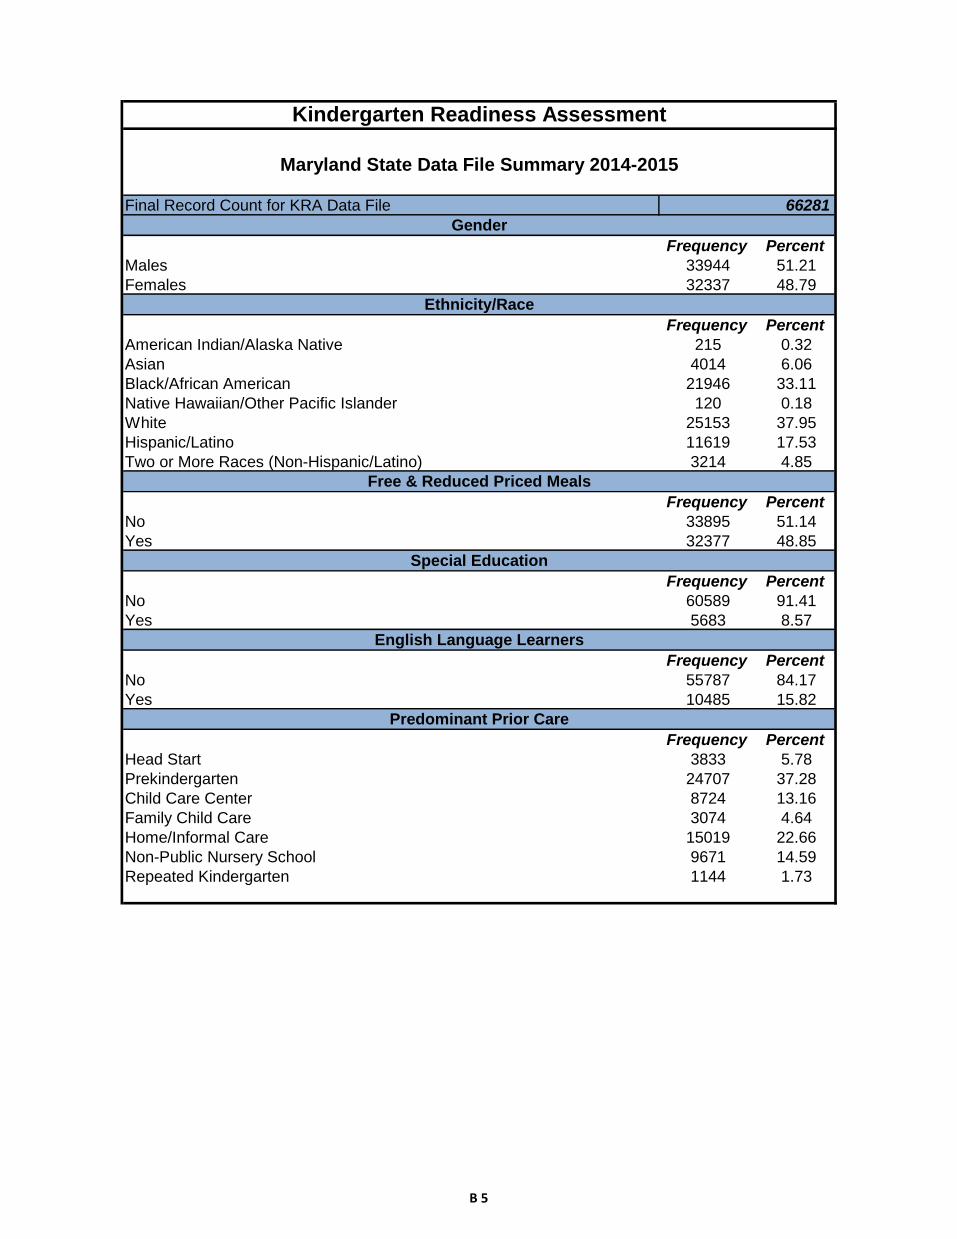
Frequency Percent
Males 33944 51.21
Females 32337 48.79
Frequency Percent
American Indian/Alaska Native 215 0.32
Asian 4014 6.06
Black/African American 21946 33.11
Native Hawaiian/Other Pacific Islander 120 0.18
White 25153 37.95
Hispanic/Latino 11619 17.53
Two or More Races (Non-Hispanic/Latino) 3214 4.85
Frequency Percent
No 33895 51.14
Yes 32377 48.85
Frequency Percent
No 60589 91.41
Yes 5683 8.57
Frequency Percent
No 55787 84.17
Yes 10485 15.82
Frequency Percent
Head Start 3833 5.78
Prekindergarten 24707 37.28
Child Care Center 8724 13.16
Family Child Care 3074 4.64
Home/Informal Care 15019 22.66
Non-Public Nursery School 9671 14.59
Repeated Kindergarten 1144 1.73
Free & Reduced Priced Meals
Special Education
English Language Learners
Predominant Prior Care
Final Record Count for KRA Data File 66281
Kindergarten Readiness Assessment
Maryland State Data File Summary 2014-2015
Gender
Ethnicity/Race
B 5

Demonstrating
Not Yet
Demonstrating
Demonstrating
Not Yet
Demonstrating
Demonstrating
Not Yet
Demonstrating
Demonstrating
Not Yet
Demonstrating
Demonstrating
Approaching
Emerging
Rac
e/E
thn
icity
Am
eric
an In
dia
n/A
laskan N
ativ
e8
51
24
71
13
89
31
16
11
09
88
39
62
9
Asia
n1,8
34
2,0
35
2,0
03
1,8
70
2,1
22
1,7
31
2,4
22
1,4
77
2,0
03
1,2
07
56
2
Afric
an A
meric
an
9,5
49
11
,71
47,6
58
13
,70
19,8
46
11
,40
910
,77
810
,53
48
,96
68,1
46
3,8
52
Nativ
e H
aw
aiia
n/P
acific
Isla
nde
r4
37
43
58
15
66
25
76
03
94
92
4
White
14
,39
010
,41
413
,08
111
,75
214
,08
410
,74
214
,49
610
,35
614
,12
97,7
63
2,7
09
His
panic
2,5
81
8,4
44
2,6
42
8,5
44
4,3
59
6,7
94
5,1
05
6,0
97
2,9
52
4,4
67
3,4
70
Tw
o o
r More
Race
s (N
on-H
ispanic
/La
tino)
1,6
52
1,5
12
1,4
33
1,7
28
1,6
58
1,4
98
1,7
96
1,3
68
1,6
21
1,0
87
41
7
Gen
der
Male
14
,22
018
,71
312
,95
820
,13
914
,07
618
,96
214
,45
218
,69
013
,12
112
,42
36,9
90
Fem
ale
15
,91
415
,60
413
,96
517
,67
518
,14
213
,39
020
,31
211
,30
016
,67
210
,39
24,0
73
Prio
r Care
Child
Care
Cente
r5,0
85
3,5
20
4,3
27
4,2
72
4,6
87
3,8
91
5,0
06
3,5
91
4,8
24
2,8
50
81
8
Fam
ily C
hild
Care
1,2
44
1,7
53
1,0
62
1,9
41
1,3
73
1,6
40
1,4
58
1,5
57
1,2
17
1,1
14
63
6
Hea
d S
tart
1,3
44
2,3
52
1,1
41
2,5
86
1,5
60
2,1
47
1,7
27
2,0
02
1,2
78
1,5
40
82
3
Hom
e / In
form
al C
are
4,5
97
9,7
52
4,4
03
10
,06
45,8
68
8,5
63
6,3
68
8,1
25
4,6
51
5,4
02
4,1
03
Non-p
ublic
Nurs
ery
6,4
40
3,1
51
6,1
28
3,4
56
6,0
63
3,4
85
6,3
05
3,2
99
6,4
26
2,5
59
49
4
Pre
-Kin
de
rgarte
n10
,89
613
,12
89,3
17
14
,85
512
,09
612
,00
713
,23
810
,89
110
,86
38,9
13
3,9
92
Sp
ec
ial E
du
ca
tion
No
28
,98
030
,21
825
,78
533
,62
730
,87
528
,33
433
,37
125
,97
328
,76
921
,01
38,7
22
Yes
1,1
52
4,0
96
1,1
36
4,1
84
1,3
40
4,0
16
1,3
90
4,0
15
1,0
22
1,8
00
2,3
40
En
glis
h L
an
gu
ag
e L
ea
rners
No
28
58
92
59
35
24
95
92
97
09
28
79
32
57
38
30
46
92
41
71
27
81
81
86
71
74
26
Yes
15
43
83
79
19
62
81
02
34
22
66
12
42
92
58
17
19
73
41
42
36
36
Fre
e a
nd
Red
uce
d P
rice
Mea
ls
No
19
,15
014
,08
417
,36
115
,89
118
,66
714
,52
819
,60
913
,71
018
,79
110
,36
93,6
53
Yes
10
,98
220
,23
09,5
60
21
,92
013
,54
817
,82
215
,15
216
,27
811
,00
012
,44
47,4
09
Aggre
gate
d D
ata
30
,13
434
,31
726
,92
337
,81
432
,21
832
,35
234
,76
429
,99
029
,79
322
,81
511
,06
3
* = G
roup s
ize fe
wer th
an 5
Mary
lan
d S
tate
- Nu
mb
er o
f Kin
derg
arte
n S
tud
en
ts
Socia
l Founda
tions
Physic
al
Develo
pm
ent
La
nguage a
nd
Lite
racy
Math
em
atic
sC
om
posite
B 6

Demonstrating
Not Yet
Demonstrating
Demonstrating
Not Yet
Demonstrating
Demonstrating
Not Yet
Demonstrating
Demonstrating
Not Yet
Demonstrating
Demonstrating
Approaching
Emerging
Rac
e/E
thn
icity
Am
eric
an In
dia
n/A
laskan N
ativ
e4
15
93
46
64
45
65
34
74
04
61
4
Asia
n4
75
35
24
85
54
56
23
85
33
21
5
Afric
an A
meric
an
45
55
36
64
46
54
51
49
43
39
18
Nativ
e H
aw
aiia
n/P
acific
Isla
nde
r3
76
33
07
04
75
34
95
13
54
42
1
White
58
42
53
47
57
43
58
42
57
32
11
His
panic
23
77
24
76
39
61
46
54
27
41
32
Tw
o o
r More
Race
s (N
on-H
ispanic
/La
tino)
52
48
45
55
53
47
57
43
52
35
13
Gen
der
Male
43
57
39
61
43
57
44
56
40
38
21
Fem
ale
50
50
44
56
58
42
64
36
54
33
13
Prio
r Care
Child
Care
Cente
r5
94
15
05
05
54
55
84
25
73
41
0
Fam
ily C
hild
Care
42
58
35
65
46
54
48
52
41
38
21
Hea
d S
tart
36
64
31
69
42
58
46
54
35
42
23
Hom
e / In
form
al C
are
32
68
30
70
41
59
44
56
33
38
29
Non-p
ublic
Nurs
ery
67
33
64
36
64
36
66
34
68
27
5
Pre
-Kin
de
rgarte
n4
55
53
96
15
05
05
54
54
63
81
7
Sp
ec
ial E
du
ca
tion
No
49
51
43
57
52
48
56
44
49
36
15
Yes
22
78
21
79
25
75
26
74
20
35
45
En
glis
h L
an
gu
ag
e L
ea
rne
rs
No
52
48
46
54
53
47
56
44
52
35
14
Yes
16
84
19
81
34
66
42
58
20
42
37
Fre
e a
nd
Red
uce
d P
rice
Mea
ls
No
58
42
52
48
56
44
59
41
57
32
11
Yes
35
65
30
70
43
57
48
52
36
40
24
Aggre
gate
d D
ata
47
53
42
58
50
50
54
46
47
36
17
* = P
erc
enta
ge c
ould
not b
e re
porte
d d
ue to
gro
up s
ize fe
wer th
an 5
Socia
l
Founda
tions
Physic
al
Develo
pm
ent
Com
posite
Mary
lan
d S
tate
- Perc
en
tag
e o
f Kin
derg
arte
n S
tud
en
ts
La
nguage a
nd
Lite
racy
Math
em
atic
s
B 7

Other: A child was not able to access one or more assessment items
during assessment administration due to limited English proficiency, a
disability, or other circumstances, such as a documented medical condition,
resulting in a "Not Scorable" for those items.
Special Education Students 351 0.52%
Percent of Students
0.66%English Language Learners
Number of Students
445
Kindergarten Readiness Assessment 2014-2015Composite Results
Maryland State
"Other" Scores - LEA 01
47
36
17
0%
10%
20%
30%
40%
50%
60%
70%
80%
90%
100%
2014-15
Composite
Demonstrating Approaching Emerging
Pe
rce
nt
of
Stu
de
nts
B 8
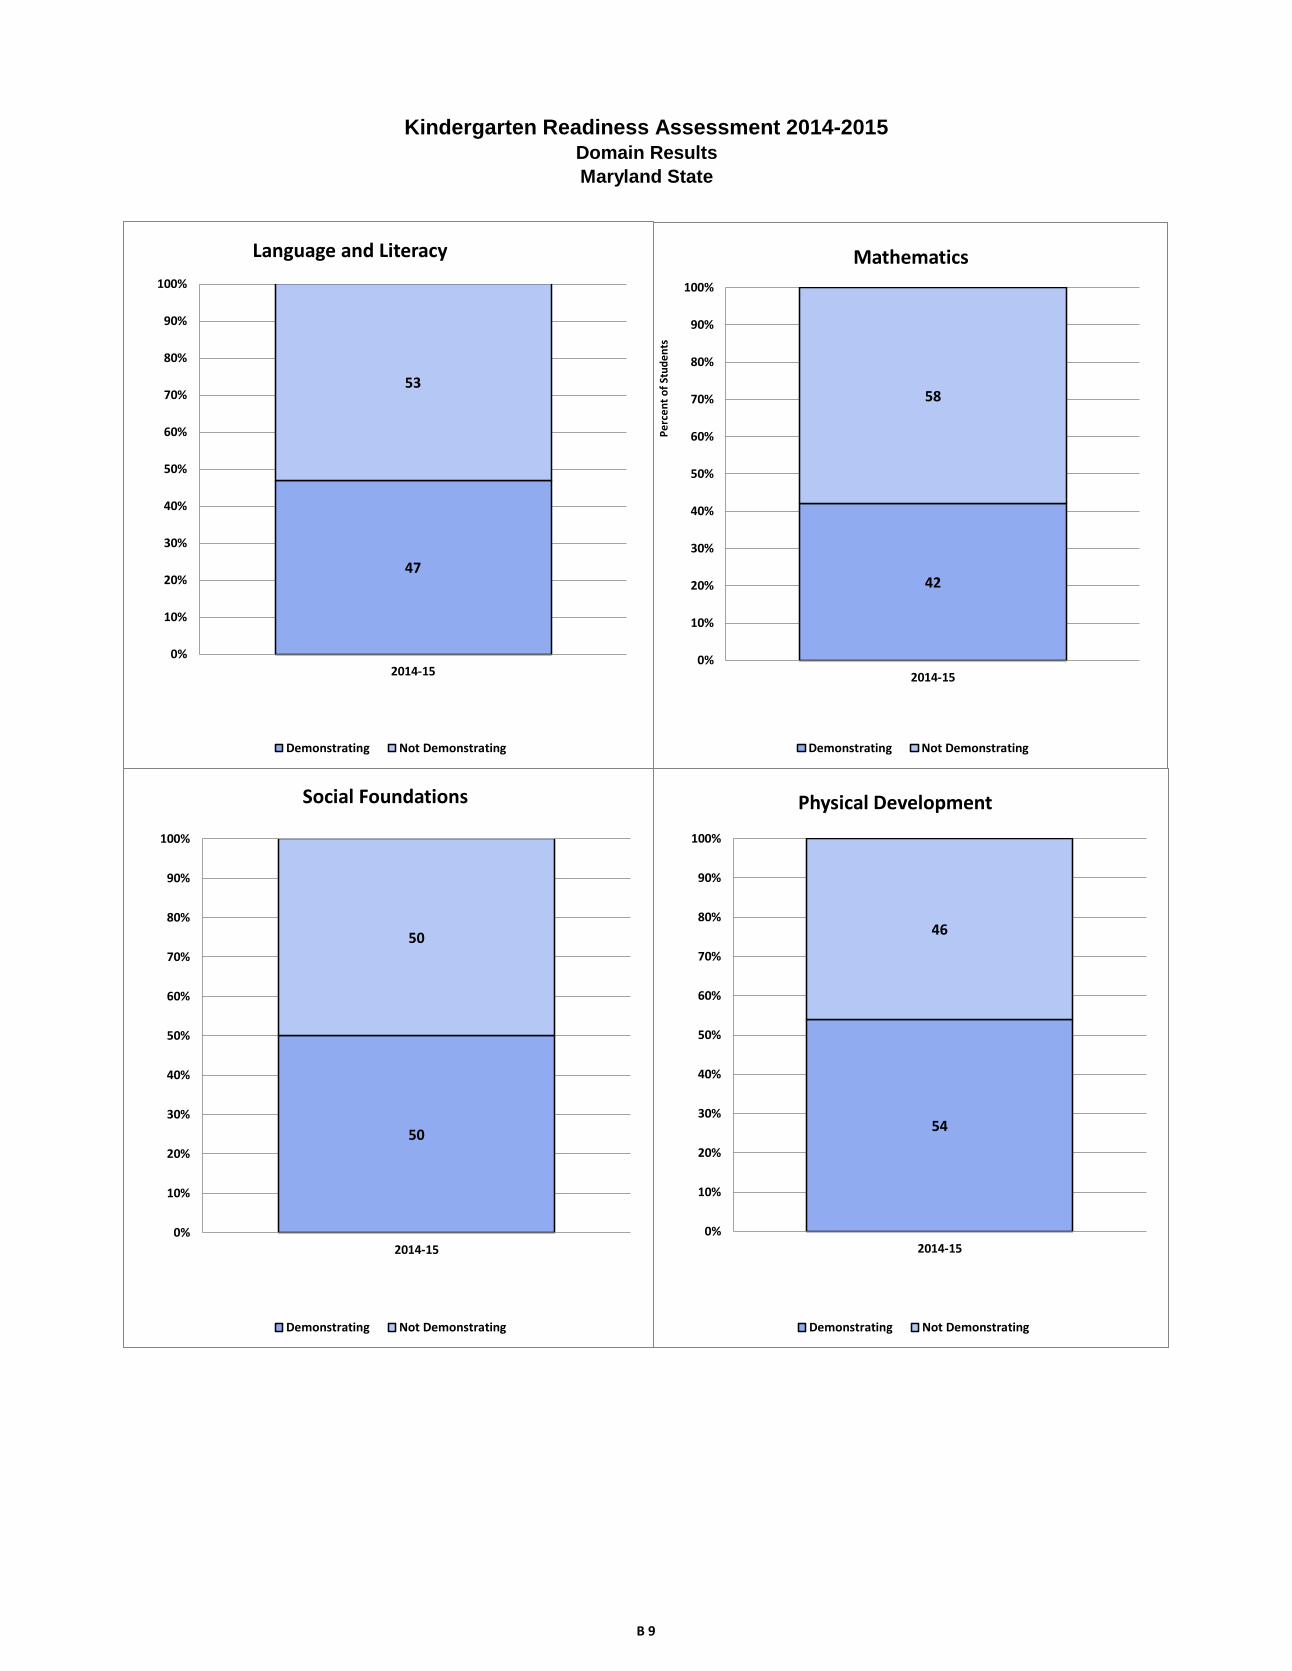
Kindergarten Readiness Assessment 2014-2015Domain Results
Maryland State
47
53
0%
10%
20%
30%
40%
50%
60%
70%
80%
90%
100%
2014-15
Language and Literacy
Demonstrating Not Demonstrating
42
58
0%
10%
20%
30%
40%
50%
60%
70%
80%
90%
100%
2014-15
Mathematics
Demonstrating Not Demonstrating
Pe
rce
nt
of
Stu
de
nts
54
46
0%
10%
20%
30%
40%
50%
60%
70%
80%
90%
100%
2014-15
Social Foundations
Demonstrating Not Yet Demonstrating
53
47
0%
10%
20%
30%
40%
50%
60%
70%
80%
90%
100%
2014-15
Physical Development
Demonstrating Not Yet Demonstrating
50
50
0%
10%
20%
30%
40%
50%
60%
70%
80%
90%
100%
2014-15
Social Foundations
Demonstrating Not Demonstrating
54
46
0%
10%
20%
30%
40%
50%
60%
70%
80%
90%
100%
2014-15
Physical Development
Demonstrating Not Demonstrating
B 9

Frequency Percent
Males 358 53.83
Females 307 46.17
Frequency Percent
American Indian/Alaska Native 2 0.30
Asian 6 0.90
Black/African American 18 2.71
Native Hawaiian/Other Pacific Islander 0 0.00
White 589 88.57
Hispanic/Latino 8 1.20
Two or More Races (Non-Hispanic/Latino) 42 6.32
Frequency Percent
No 221 33.23
Yes 444 66.77
Frequency Percent
No 571 85.86
Yes 94 14.14
Frequency Percent
No 665 100.00
Yes 0 0.00
Frequency Percent
Head Start 35 5.26
Prekindergarten 468 70.38
Child Care Center 40 6.02
Family Child Care 86 12.93
Home/Informal Care 58 8.72
Non-Public Nursery School 34 5.11
Repeated Kindergarten 0 0.00
Kindergarten Readiness Assessment
Allegany County Data File Summary 2014-2015
Gender
Ethnicity/Race
Free & Reduced Priced Meals
Special Education
English Language Learners
Predominant Prior Care
Final Record Count for KRA Data File 665
B 10
Demonstrating
Not Yet
Demonstrating
Demonstrating
Not Yet
Demonstrating
Demonstrating
Not Yet
Demonstrating
Demonstrating
Not Yet
Demonstrating
Demonstrating
Approaching
Emerging
Rac
e/E
thn
icity
Am
eric
an In
dia
n/A
laskan N
ativ
e*
**
**
**
**
**
Asia
n3
34
23
33
33
12
Afric
an A
meric
an
71
17
11
12
61
17
10
71
Nativ
e H
aw
aiia
n/P
acific
Isla
nde
r*
**
**
**
**
**
White
26
63
22
25
73
31
31
62
73
31
92
70
28
01
98
11
0
His
panic
26
35
44
35
31
4
Tw
o o
r More
Race
s (N
on-H
ispanic
/La
tino)
16
26
14
28
20
22
15
27
13
19
10
Gen
der
Male
14
52
12
13
52
22
15
82
00
16
11
97
14
21
26
89
Fem
ale
14
91
58
15
01
57
19
81
09
19
11
16
16
71
02
38
Prio
r Care
Child
Care
Cente
r1
62
41
52
51
82
22
21
81
61
31
1
Fam
ily C
hild
Care
19
67
23
63
37
49
33
53
27
31
28
Hea
d S
tart
16
19
11
24
15
20
16
19
13
15
7
Hom
e / In
form
al C
are
14
44
14
44
23
35
25
33
17
24
17
Non-p
ublic
Nurs
ery
19
15
17
17
24
10
25
92
38
3
Pre
-Kin
de
rgarte
n2
24
24
32
19
24
82
62
20
62
55
21
32
30
15
97
8
Sp
ec
ial E
du
ca
tion
No
28
02
91
26
53
06
32
42
47
32
12
50
29
02
02
79
Yes
14
79
20
73
32
62
31
63
19
26
48
En
glis
h L
an
gu
ag
e L
ea
rners
No
29
43
70
28
53
79
35
63
09
35
23
13
30
92
28
12
7
Yes
**
**
**
**
**
*
Fre
e a
nd
Red
uce
d P
rice
Mea
ls
No
13
38
81
23
98
15
56
61
49
72
14
46
01
7
Yes
16
12
82
16
22
81
20
12
43
20
32
41
16
51
68
11
0
Aggre
gate
d D
ata
29
43
70
28
53
79
35
63
09
35
23
13
30
92
28
12
7
* = G
roup s
ize fe
wer th
an 5
Alle
gan
y C
ou
nty
- Nu
mb
er o
f Kin
derg
arte
n S
tud
en
ts
Socia
l Founda
tions
Physic
al
Develo
pm
ent
La
nguage a
nd
Lite
racy
Math
em
atic
sC
om
posite
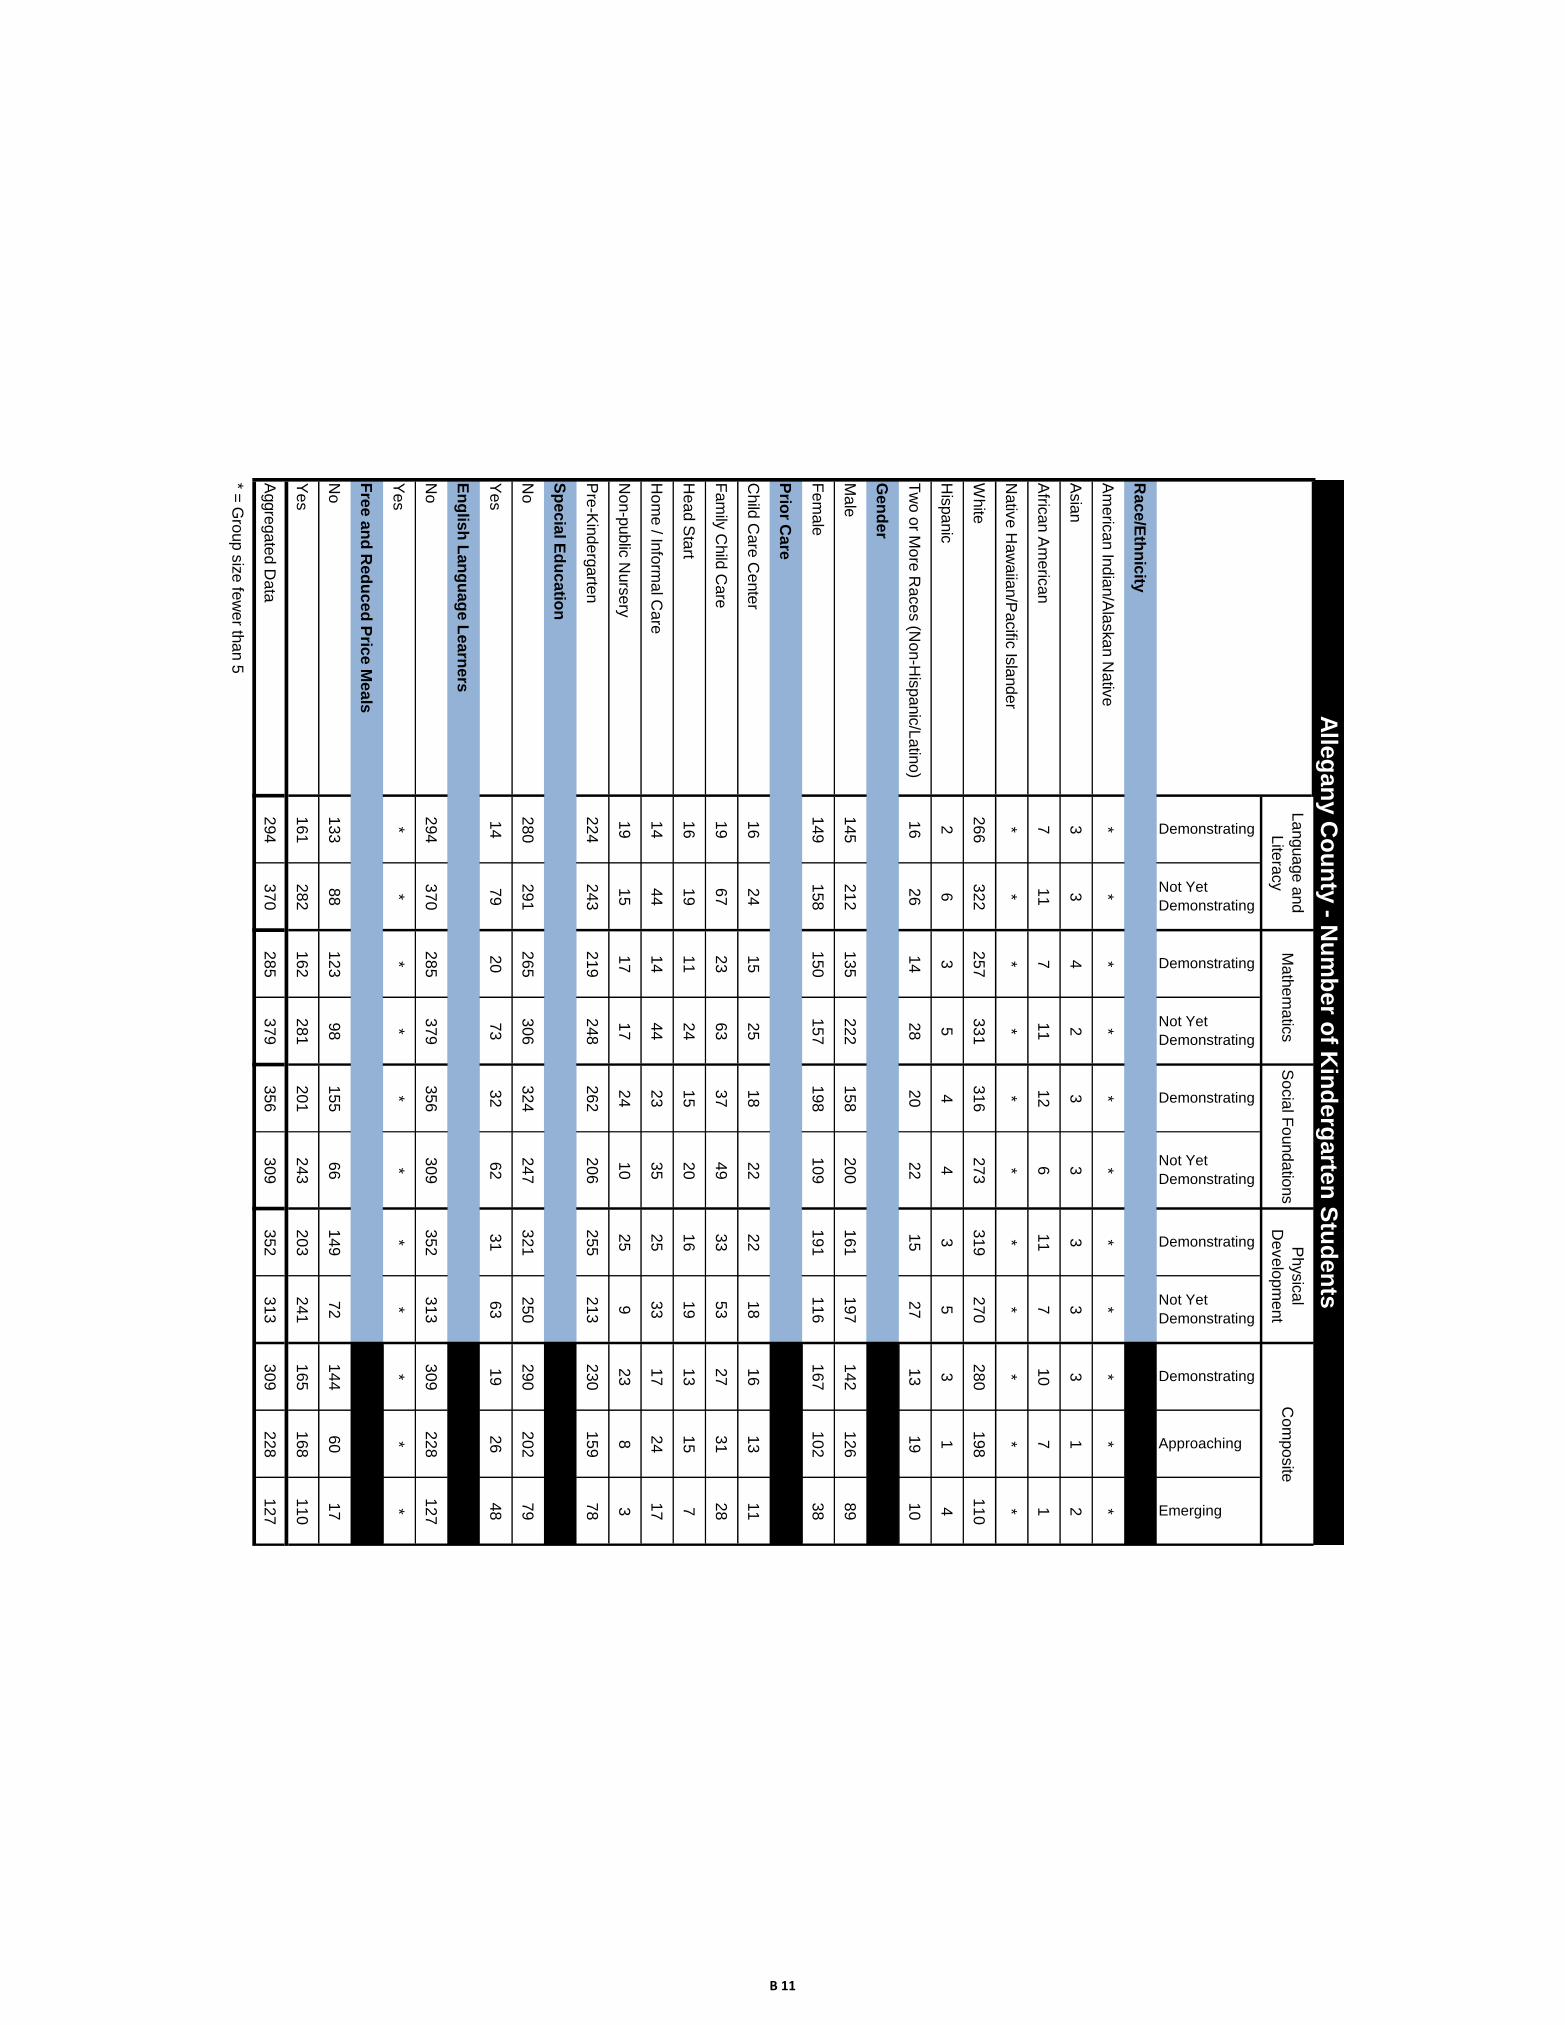
B 11

Demonstrating
Not Yet
Demonstrating
Demonstrating
Not Yet
Demonstrating
Demonstrating
Not Yet
Demonstrating
Demonstrating
Not Yet
Demonstrating
Demonstrating
Approaching
Emerging
Rac
e/E
thn
icity
Am
eric
an In
dia
n/A
laskan N
ativ
e*
**
**
**
**
**
Asia
n5
05
06
73
35
05
05
05
05
01
73
3
Afric
an A
meric
an
39
61
39
61
67
33
61
39
56
39
6
Nativ
e H
aw
aiia
n/P
acific
Isla
nde
r*
**
**
**
**
**
White
45
55
44
56
54
46
54
46
48
34
19
His
panic
25
75
38
63
50
50
38
63
38
13
50
Tw
o o
r More
Race
s (N
on-H
ispanic
/La
tino)
38
62
33
67
48
52
36
64
31
45
24
Gen
der
Male
41
59
38
62
44
56
45
55
40
35
25
Fem
ale
49
51
49
51
64
36
62
38
54
33
12
Prio
r Care
Child
Care
Cente
r4
06
03
86
34
55
55
54
54
03
32
8
Fam
ily C
hild
Care
22
78
27
73
43
57
38
62
31
36
33
Hea
d S
tart
46
54
31
69
43
57
46
54
37
43
20
Hom
e / In
form
al C
are
24
76
24
76
40
60
43
57
29
41
29
Non-p
ublic
Nurs
ery
56
44
50
50
71
29
74
26
68
24
9
Pre
-Kin
de
rgarte
n4
85
24
75
35
64
45
44
64
93
41
7
Sp
ec
ial E
du
ca
tion
No
49
51
46
54
57
43
56
44
51
35
14
Yes
15
85
22
78
34
66
33
67
20
28
52
En
glis
h L
an
gu
ag
e L
ea
rne
rs
No
44
56
43
57
54
46
53
47
47
34
19
Yes
**
**
**
**
**
*
Fre
e a
nd
Red
uce
d P
rice
Mea
ls
No
60
40
56
44
70
30
67
33
65
27
8
Yes
36
64
37
63
45
55
46
54
37
38
25
Aggre
gate
d D
ata
44
56
43
57
54
46
53
47
47
34
19
* = P
erc
enta
ge c
ould
not b
e re
porte
d d
ue to
gro
up s
ize fe
wer th
an 5
Socia
l
Founda
tions
Physic
al
Develo
pm
ent
Com
posite
Alle
gan
y C
ou
nty
- Perc
en
tag
e o
f Kin
derg
arte
n S
tud
en
ts
La
nguage a
nd
Lite
racy
Math
em
atic
s
B 12
Other: A child was not able to access one or more assessment items
during assessment administration due to limited English proficiency, a
disability, or other circumstances, such as a documented medical condition,
resulting in a "Not Scorable" for those items.
0
Kindergarten Readiness Assessment 2014-2015Composite Results
Allegany County
"Other" Scores - LEA 01
Special Education Students 0 0%
Percent of Students
0%English Language Learners
Number of Students
47
34
19
0%
10%
20%
30%
40%
50%
60%
70%
80%
90%
100%
2014-15
Composite
Demonstrating Approaching Emerging
Pe
rce
nt
of
Stu
de
nts
B 13
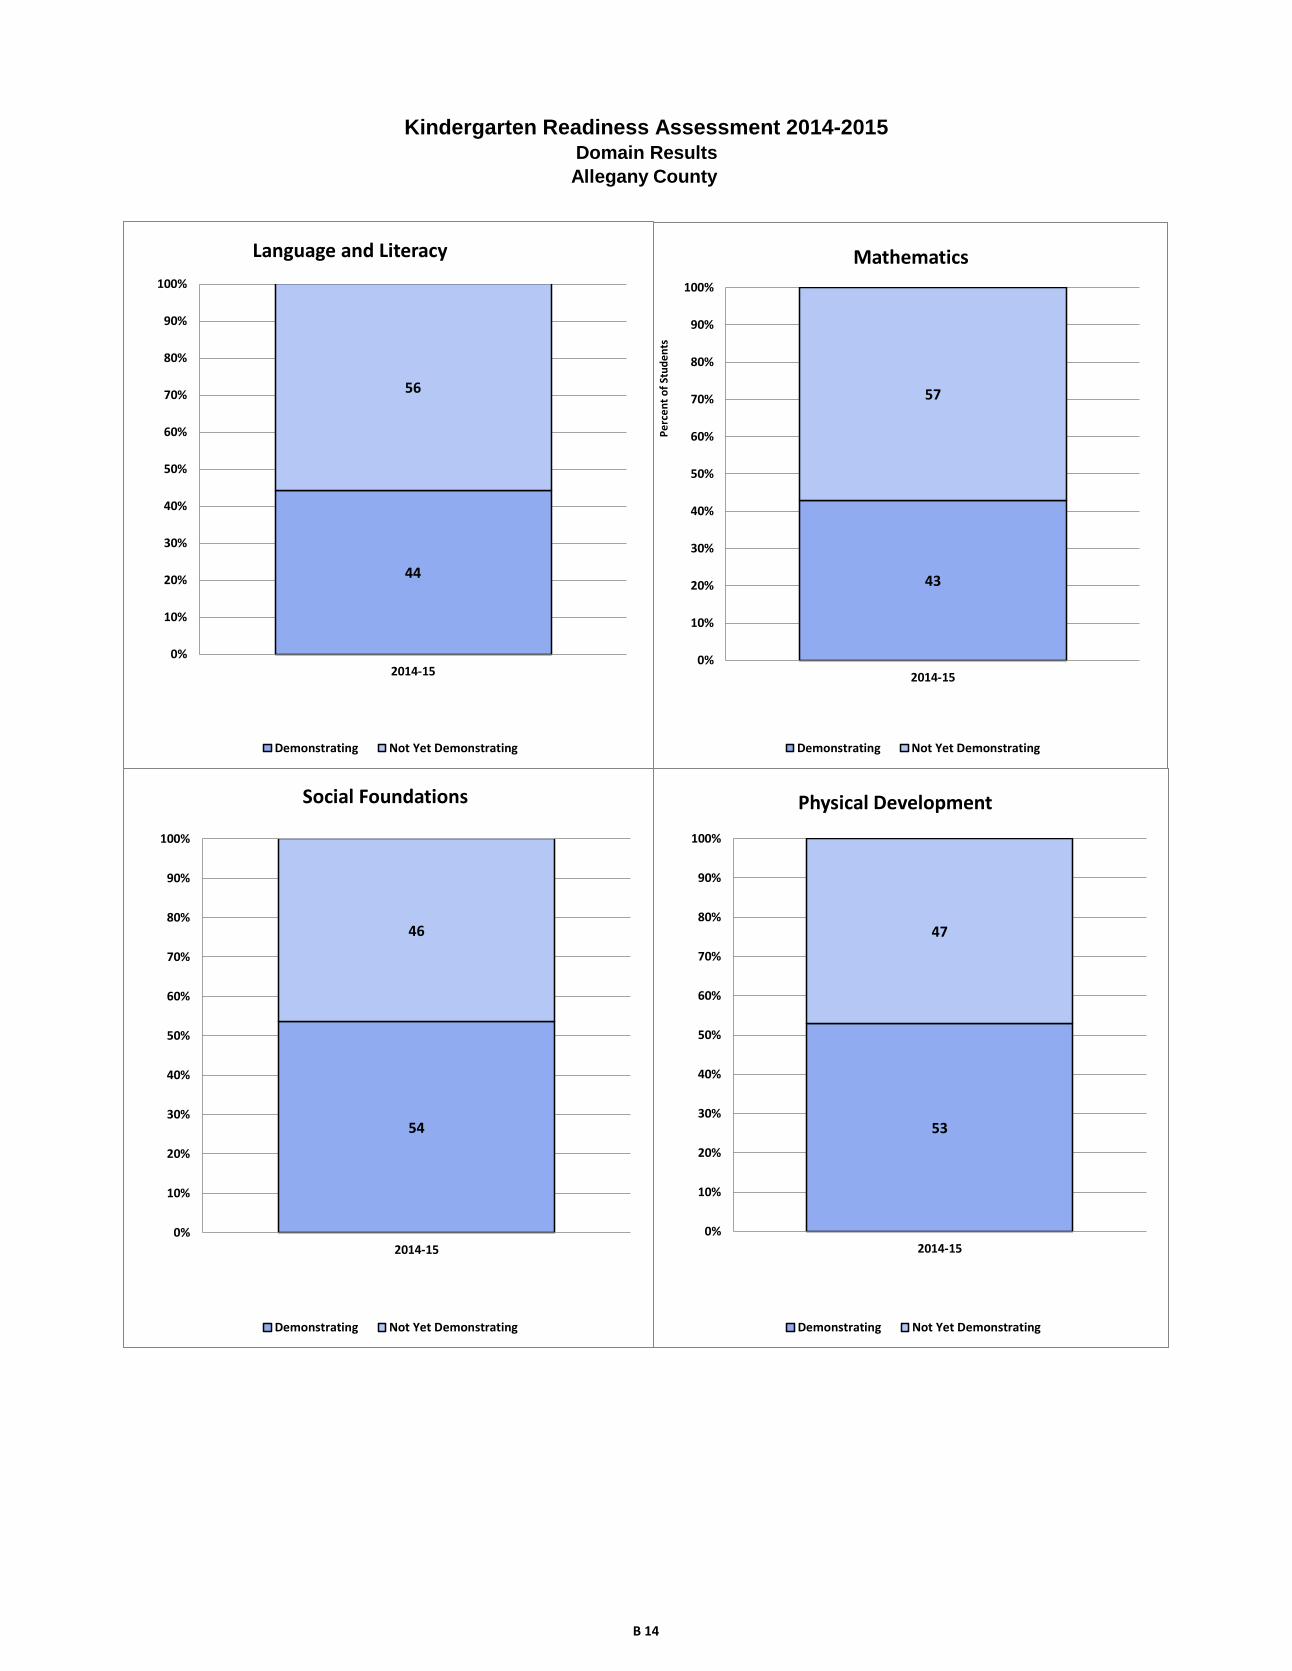
Kindergarten Readiness Assessment 2014-2015Domain Results
Allegany County
44
56
0%
10%
20%
30%
40%
50%
60%
70%
80%
90%
100%
2014-15
Language and Literacy
Demonstrating Not Yet Demonstrating
43
57
0%
10%
20%
30%
40%
50%
60%
70%
80%
90%
100%
2014-15
Mathematics
Demonstrating Not Yet Demonstrating
Pe
rce
nt
of
Stu
de
nts
53.53383459
46.46616541
0%
10%
20%
30%
40%
50%
60%
70%
80%
90%
100%
2014-15
Social Foundations
Demonstrating Not Yet Demonstrating
52.93233083
47.06766917
0%
10%
20%
30%
40%
50%
60%
70%
80%
90%
100%
2014-15
Physical Development
Demonstrating Not Yet Demonstrating
54
46
0%
10%
20%
30%
40%
50%
60%
70%
80%
90%
100%
2014-15
Social Foundations
Demonstrating Not Yet Demonstrating
53
47
0%
10%
20%
30%
40%
50%
60%
70%
80%
90%
100%
2014-15
Physical Development
Demonstrating Not Yet Demonstrating
B 14
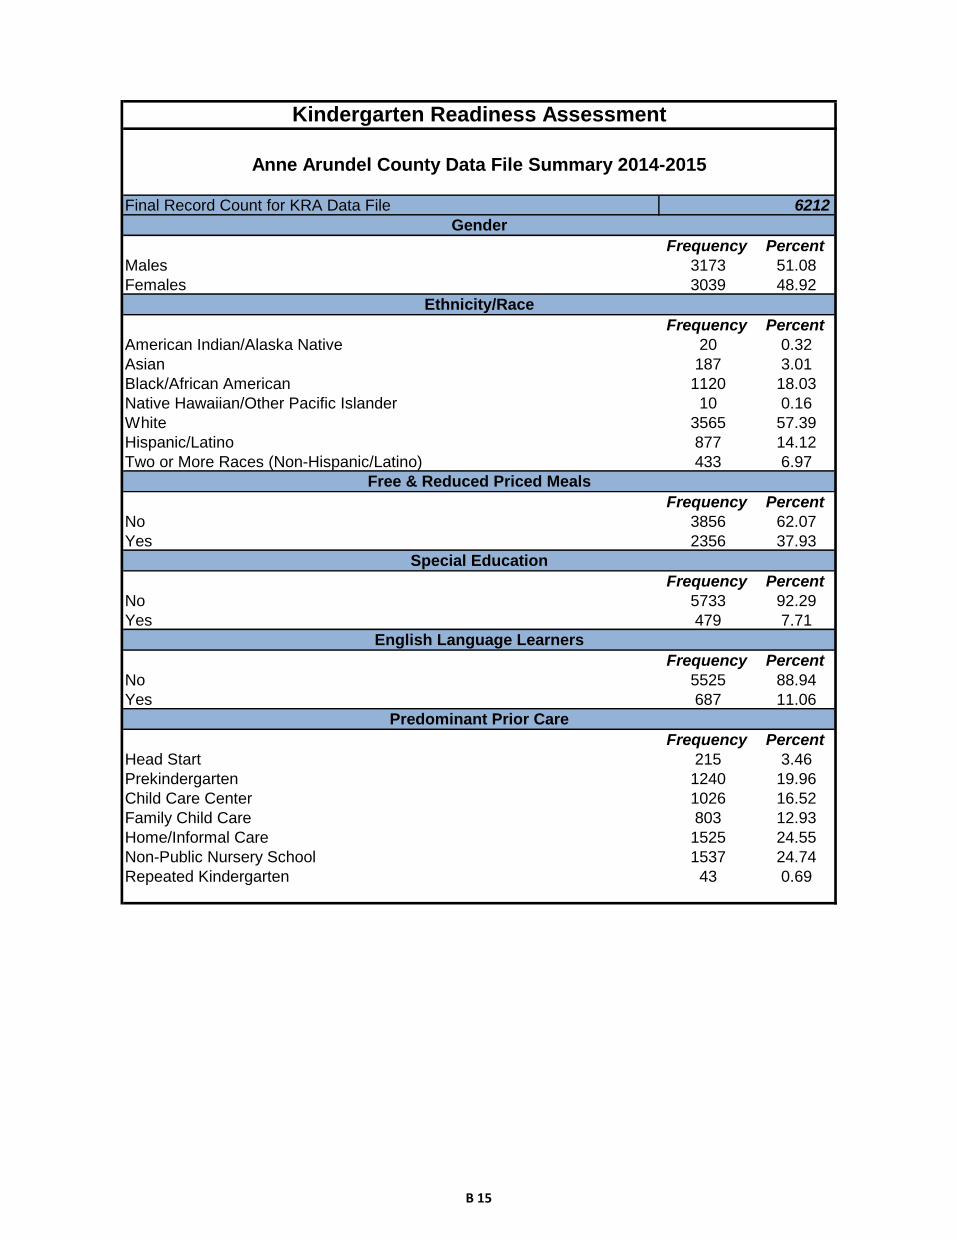
Frequency Percent
Males 3173 51.08
Females 3039 48.92
Frequency Percent
American Indian/Alaska Native 20 0.32
Asian 187 3.01
Black/African American 1120 18.03
Native Hawaiian/Other Pacific Islander 10 0.16
White 3565 57.39
Hispanic/Latino 877 14.12
Two or More Races (Non-Hispanic/Latino) 433 6.97
Frequency Percent
No 3856 62.07
Yes 2356 37.93
Frequency Percent
No 5733 92.29
Yes 479 7.71
Frequency Percent
No 5525 88.94
Yes 687 11.06
Frequency Percent
Head Start 215 3.46
Prekindergarten 1240 19.96
Child Care Center 1026 16.52
Family Child Care 803 12.93
Home/Informal Care 1525 24.55
Non-Public Nursery School 1537 24.74
Repeated Kindergarten 43 0.69
Special Education
English Language Learners
Predominant Prior Care
Final Record Count for KRA Data File 6212
Kindergarten Readiness Assessment
Anne Arundel County Data File Summary 2014-2015
Gender
Ethnicity/Race
Free & Reduced Priced Meals
B 15
Demonstrating
Not Yet
Demonstrating
Demonstrating
Not Yet
Demonstrating
Demonstrating
Not Yet
Demonstrating
Demonstrating
Not Yet
Demonstrating
Demonstrating
Approaching
Emerging
An
ne A
run
del C
ou
nty
Data
File
Su
mm
ary
20
14
-20
15
Am
eric
an In
dia
n/A
laskan N
ativ
e1
28
91
19
11
81
21
08
2
Asia
n7
91
05
59
12
88
79
61
03
82
79
66
37
Afric
an A
meric
an
45
36
56
24
08
71
43
76
74
49
16
20
37
94
93
23
7
Nativ
e H
aw
aiia
n/P
acific
Isla
nde
r4
61
94
63
72
71
White
1,9
68
1,5
69
1,4
31
2,1
09
1,7
25
1,8
18
1,9
57
1,5
92
1,7
34
1,3
09
48
6
His
panic
24
55
89
14
37
12
31
95
33
35
94
97
22
83
44
26
0
Tw
o o
r More
Race
s (N
on-H
ispanic
/La
tino)
22
02
11
15
62
74
20
82
24
22
42
08
19
71
72
60
Gen
der
Male
1,4
02
1,7
14
94
32,1
92
1,1
75
1,9
62
1,2
79
1,8
69
1,1
06
1,2
99
70
3
Fem
ale
1,5
79
1,4
30
1,0
96
1,9
22
1,6
14
1,4
00
1,8
66
1,1
49
1,5
23
1,1
00
38
0
Prio
r Care
Child
Care
Cente
r4
91
33
63
22
50
63
90
43
84
46
38
34
13
32
19
3
Fam
ily C
hild
Care
23
42
94
16
13
67
22
43
07
23
32
98
19
32
34
10
0
Hea
d S
tart
68
12
13
11
59
73
12
17
81
14
53
84
50
Hom
e / In
form
al C
are
1,0
20
1,4
88
74
61,7
86
1,0
50
1,4
73
1,1
82
1,3
55
92
51,0
07
56
9
Non-p
ublic
Nurs
ery
81
34
16
55
16
79
71
05
19
81
64
13
73
94
12
77
Pre
-Kin
de
rgarte
n3
40
47
52
15
60
13
27
48
93
69
44
62
91
33
11
90
Sp
ec
ial E
du
ca
tion
No
2,8
92
2,7
88
1,9
78
3,7
23
2,7
12
2,9
85
3,0
40
2,6
58
2,5
62
2,2
49
85
8
Yes
89
35
66
13
91
77
37
71
05
36
06
71
50
22
5
En
glis
h L
an
gu
ag
e L
ea
rne
rs
No
28
79
26
02
19
79
35
05
25
86
29
04
28
80
26
18
25
19
21
18
83
4
Yes
10
25
42
60
60
92
03
45
82
65
40
01
10
28
12
49
Fre
e a
nd
Red
uce
d P
rice
Mea
ls
No
2,6
89
2,5
31
1,8
54
3,3
84
2,4
29
2,8
04
2,7
61
2,4
81
2,3
87
1,9
76
84
4
Yes
29
26
13
18
57
30
36
05
58
38
45
37
24
24
23
23
9
Aggre
gate
d D
ata
2,9
81
3,1
44
2,0
39
4,1
14
2,7
89
3,3
62
3,1
45
3,0
18
2,6
29
2,3
99
1,0
83
* = G
roup s
ize fe
wer th
an 5
An
ne A
run
del C
ou
nty
- Nu
mb
er o
f Kin
derg
arte
n S
tud
en
ts
Socia
l
Founda
tions
Physic
al
Develo
pm
ent
La
nguage a
nd
Lite
racy
Math
em
atic
sC
om
posite
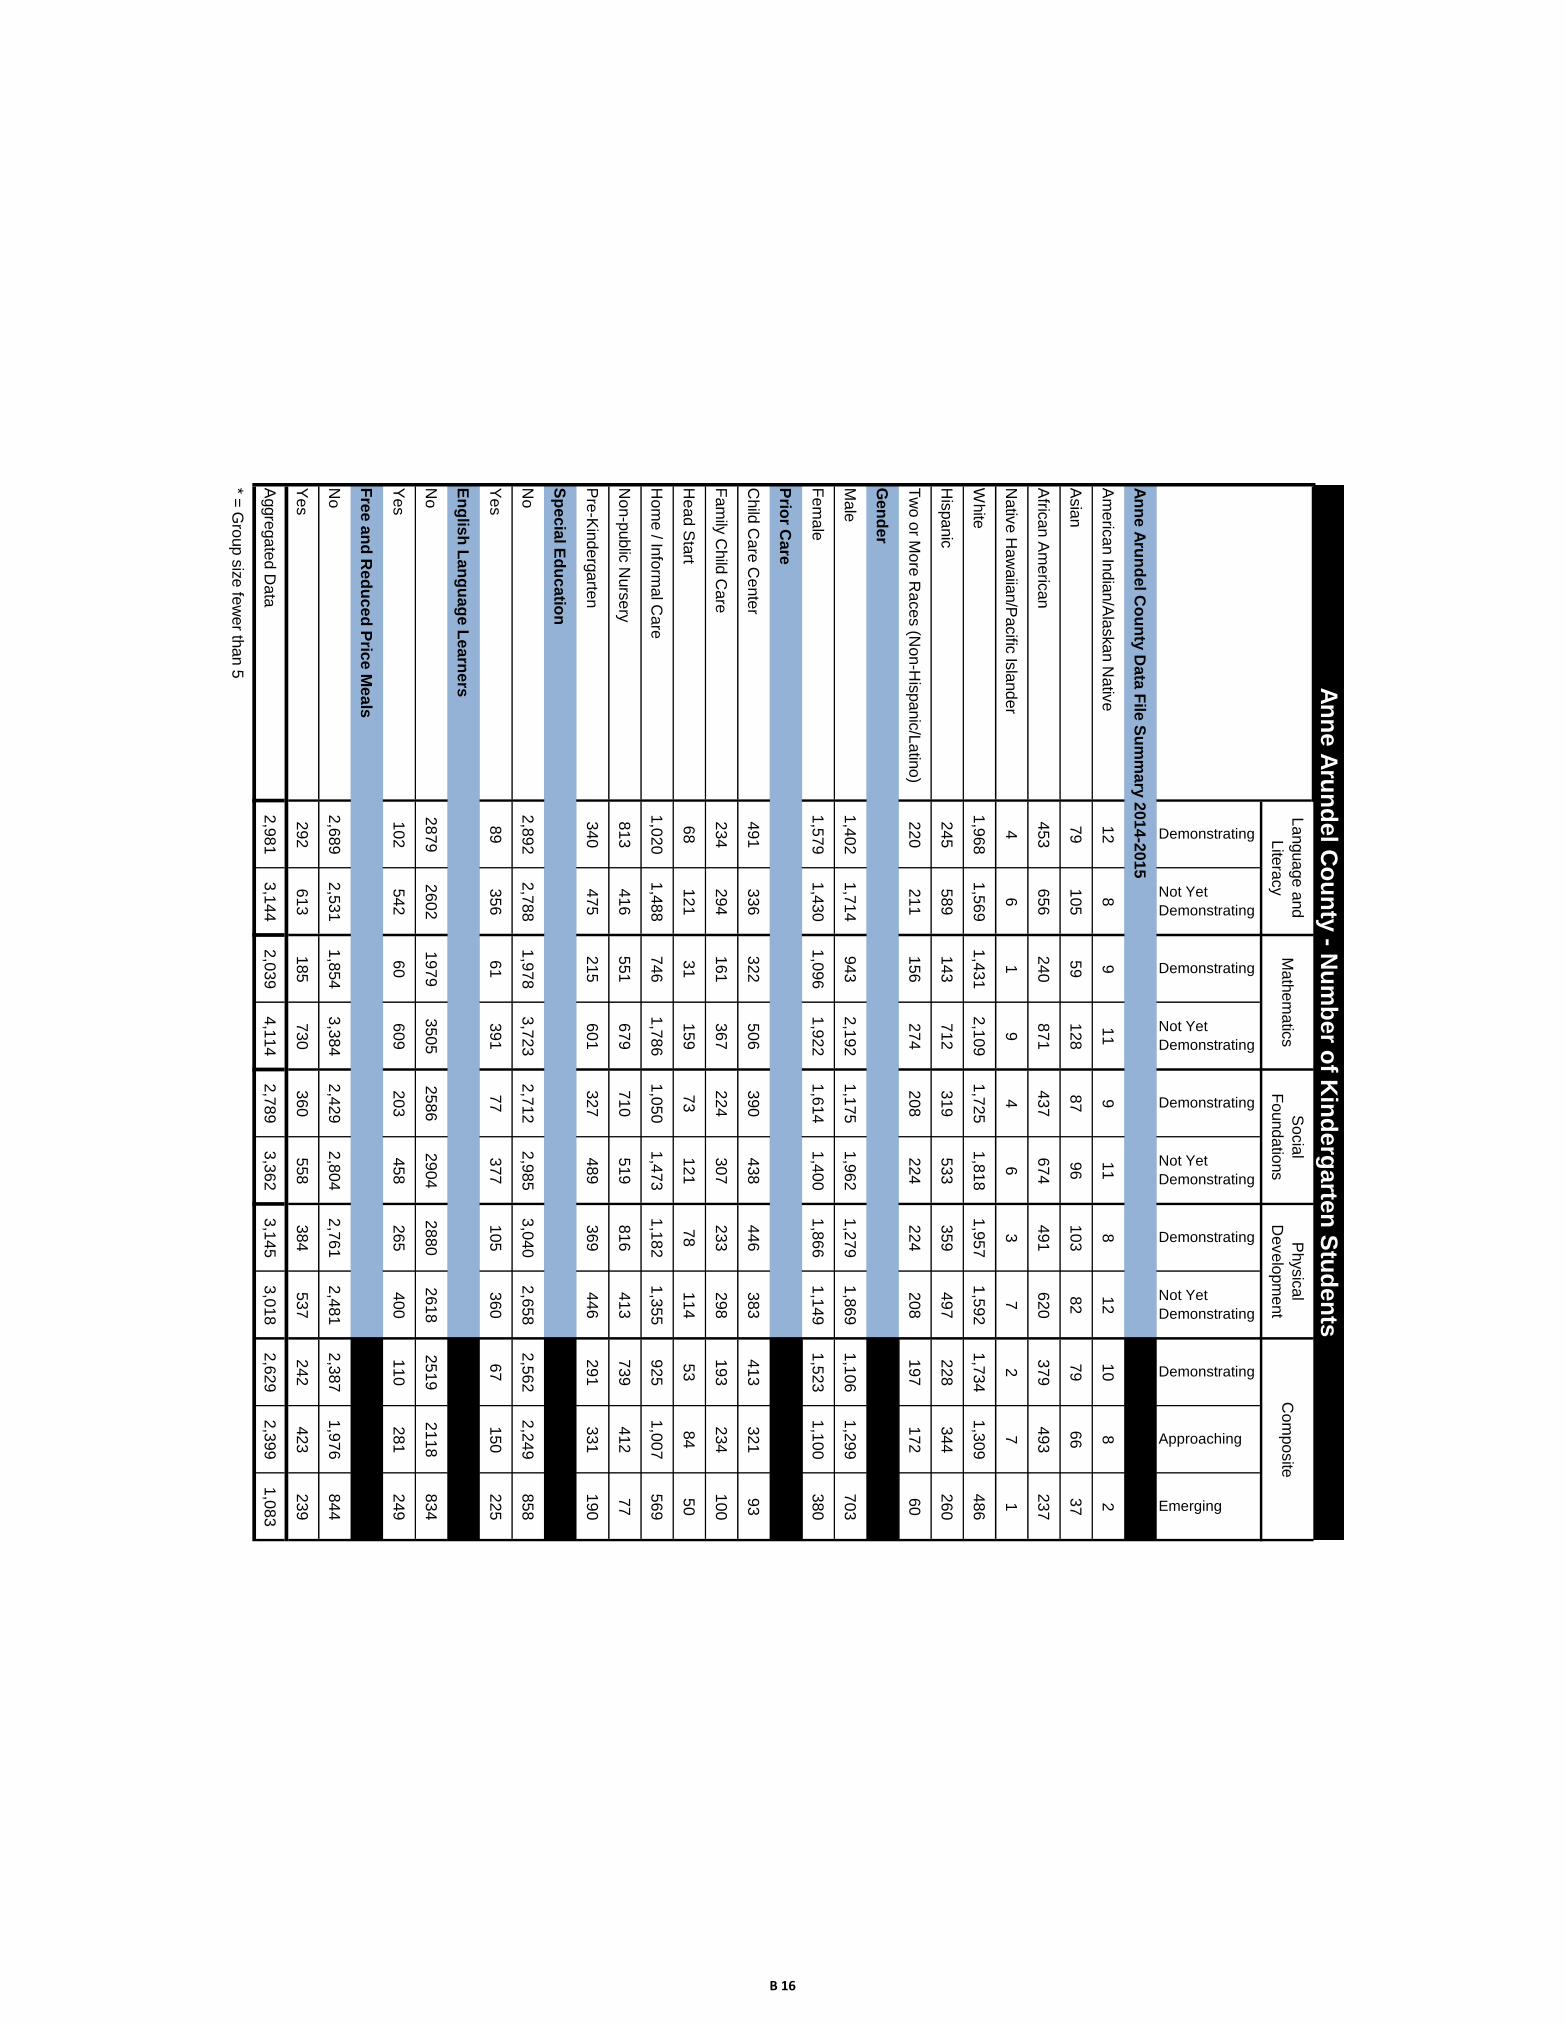
B 16
Demonstrating
Not Yet
Demonstrating
Demonstrating
Not Yet
Demonstrating
Demonstrating
Not Yet
Demonstrating
Demonstrating
Not Yet
Demonstrating
Demonstrating
Approaching
Emerging
An
ne A
run
del C
ou
nty
Data
File
Su
mm
ary
20
14
-20
15
Am
eric
an In
dia
n/A
laskan N
ativ
e6
04
04
55
54
55
54
06
05
04
01
0
Asia
n4
35
73
26
84
85
25
64
44
33
62
0
Afric
an A
meric
an
41
59
22
78
39
61
44
56
34
44
21
Nativ
e H
aw
aiia
n/P
acific
Isla
nde
r4
06
01
09
04
06
03
07
02
07
01
0
White
56
44
40
60
49
51
55
45
49
37
14
His
panic
29
71
17
83
37
63
42
58
27
41
31
Tw
o o
r More
Race
s (N
on-H
ispanic
/La
tino)
51
49
36
64
48
52
52
48
46
40
14
Gen
der
Male
45
55
30
70
37
63
41
59
36
42
23
Fem
ale
52
48
36
64
54
46
62
38
51
37
13
Prio
r Care
Child
Care
Cente
r5
94
13
96
14
75
35
44
65
03
91
1
Fam
ily C
hild
Care
44
56
30
70
42
58
44
56
37
44
19
Hea
d S
tart
36
64
16
84
38
62
41
59
28
45
27
Hom
e / In
form
al C
are
41
59
29
71
42
58
47
53
37
40
23
Non-p
ublic
Nurs
ery
66
34
45
55
58
42
66
34
60
34
6
Pre
-Kin
de
rgarte
n4
25
82
67
44
06
04
55
53
64
12
3
Sp
ec
ial E
du
ca
tion
No
51
49
35
65
48
52
53
47
45
40
15
Yes
20
80
13
87
17
83
23
77
15
34
51
En
glis
h L
an
gu
ag
e L
ea
rne
rs
No
53
47
36
64
47
53
52
48
46
39
15
Yes
16
84
99
13
16
94
06
01
74
43
9
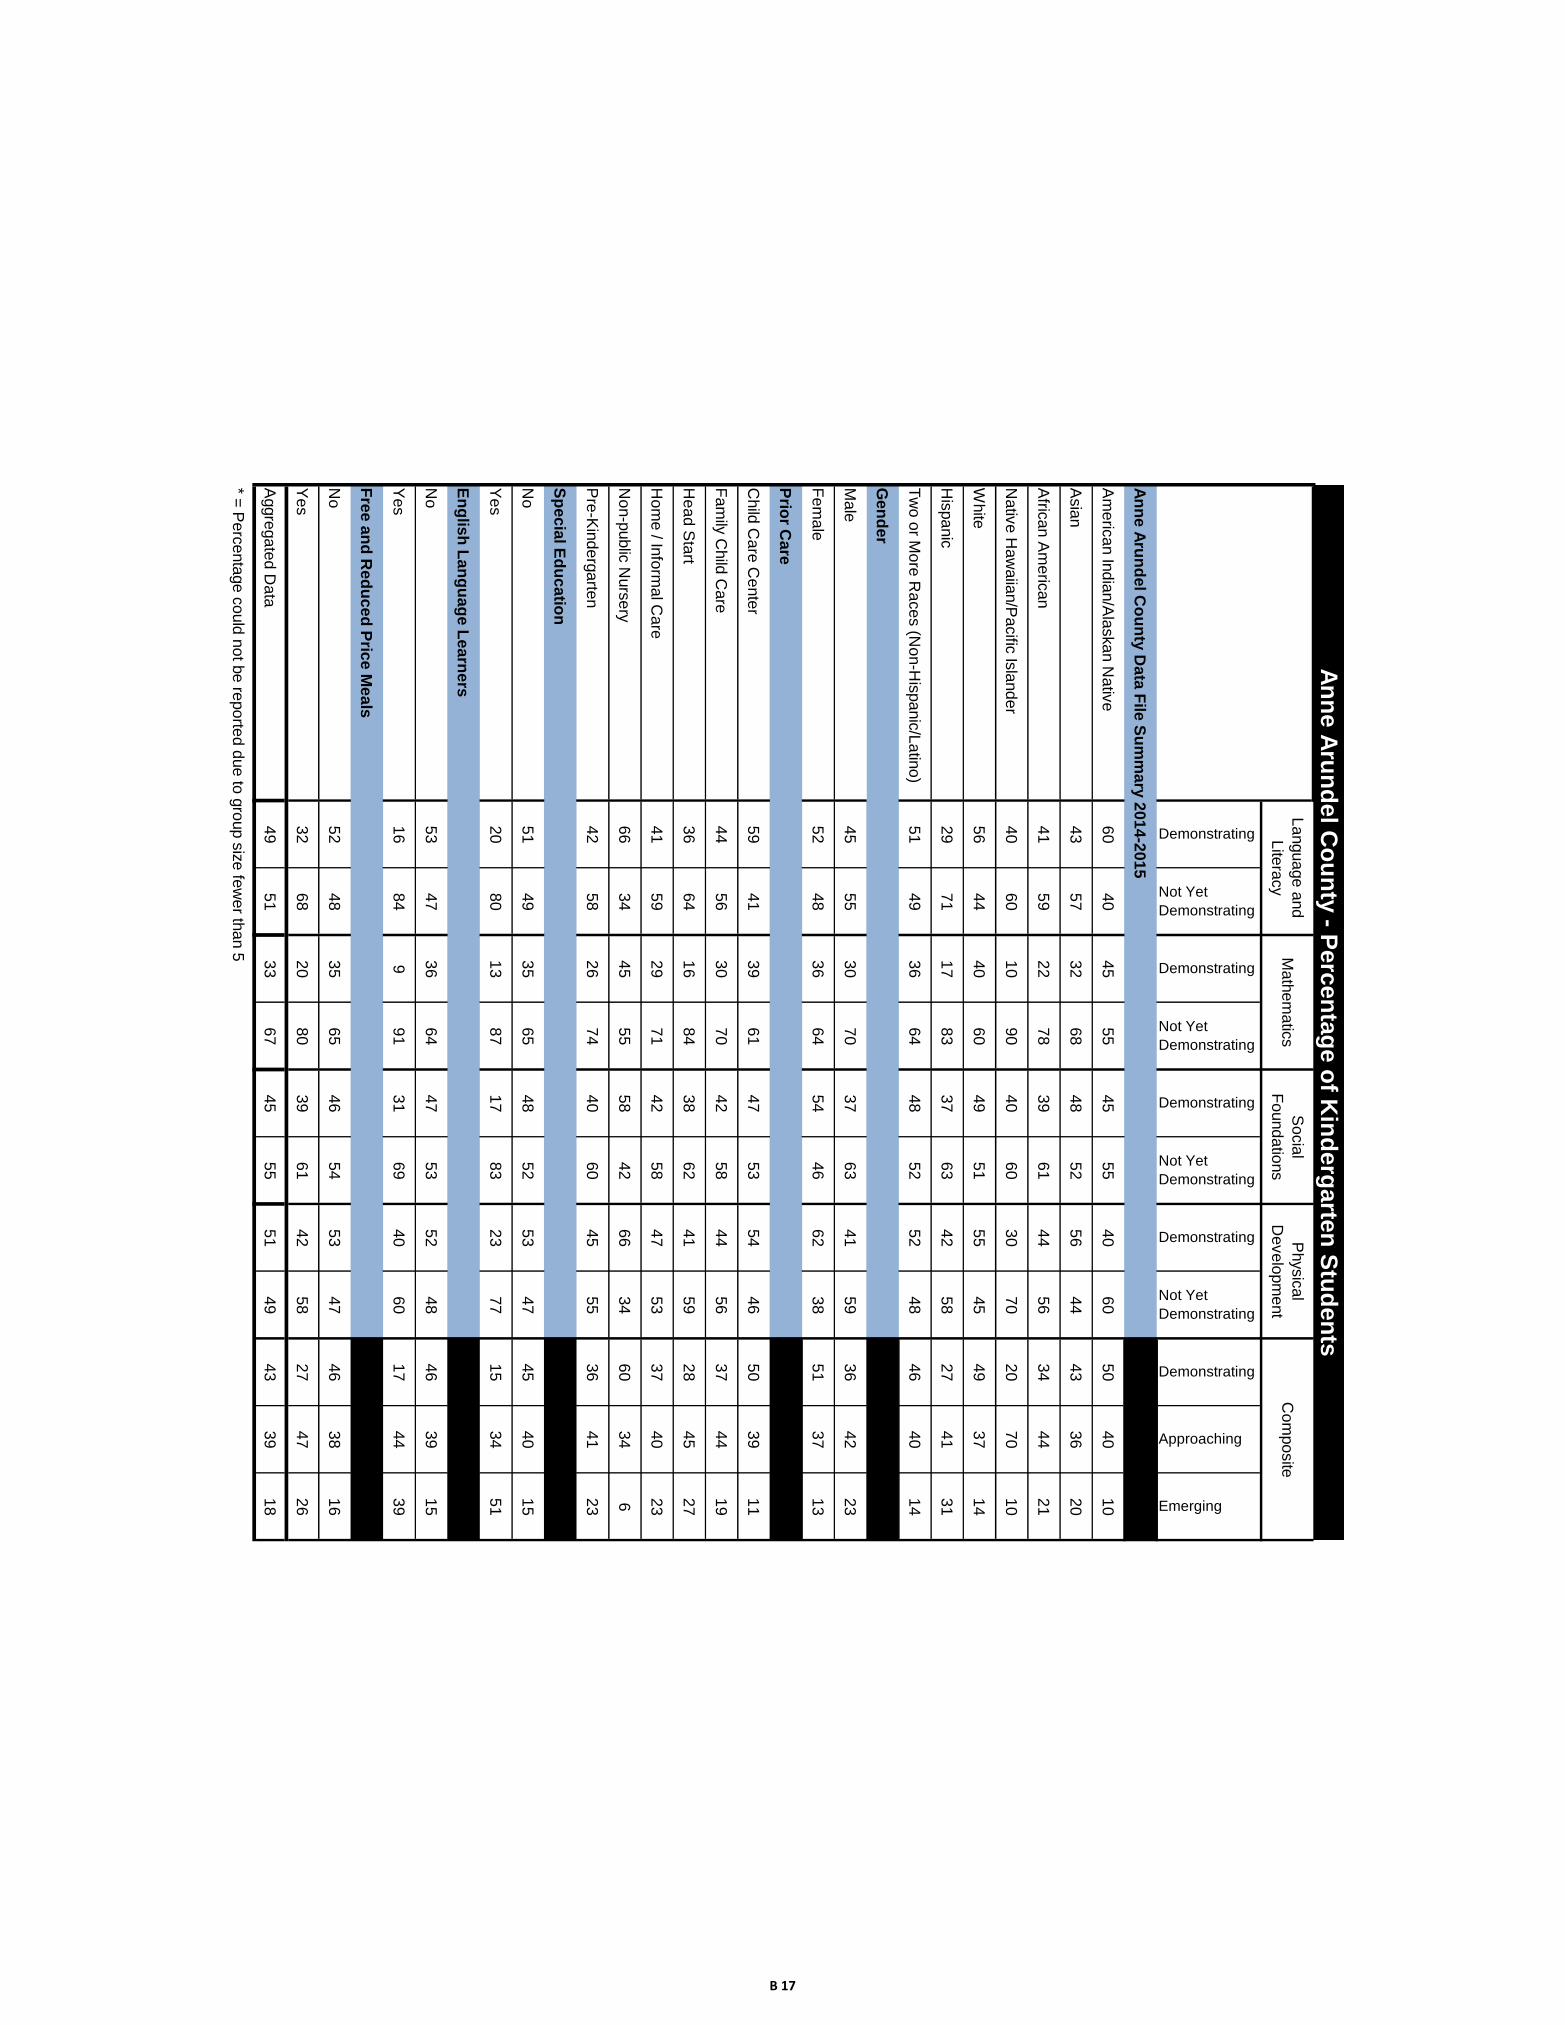
Fre
e a
nd
Red
uce
d P
rice
Mea
ls
No
52
48
35
65
46
54
53
47
46
38
16
Yes
32
68
20
80
39
61
42
58
27
47
26
Aggre
gate
d D
ata
49
51
33
67
45
55
51
49
43
39
18
* = P
erc
enta
ge c
ould
not b
e re
porte
d d
ue to
gro
up s
ize fe
wer th
an 5
Socia
l
Founda
tions
Physic
al
Develo
pm
ent
Com
posite
An
ne A
run
del C
ou
nty
- Perc
en
tag
e o
f Kin
derg
arte
n S
tud
en
ts
La
nguage a
nd
Lite
racy
Math
em
atic
s
B 17
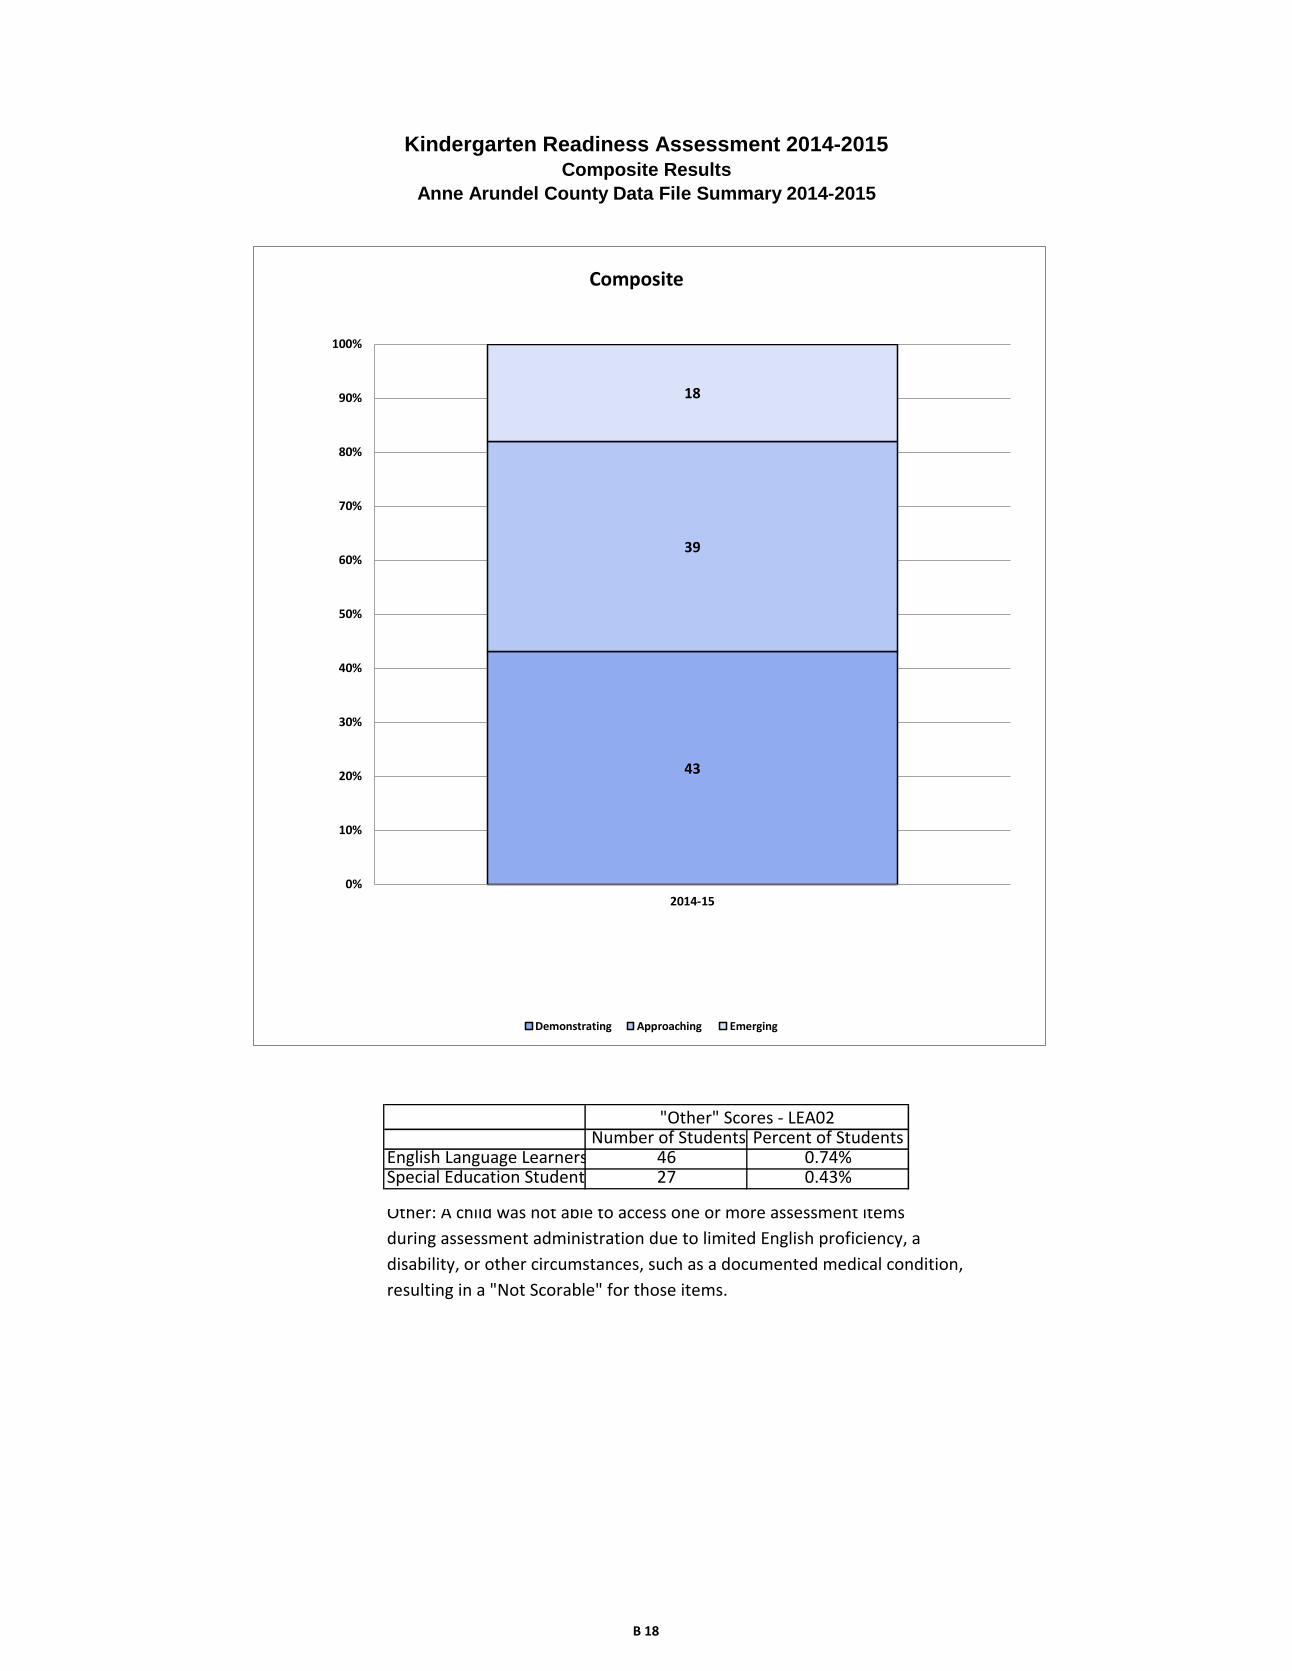
Other: A child was not able to access one or more assessment items
during assessment administration due to limited English proficiency, a
disability, or other circumstances, such as a documented medical condition,
resulting in a "Not Scorable" for those items.
"Other" Scores - LEA02 Number of Students Percent of Students
English Language Learners 46Special Education Students 27 0.43%
0.74%
Kindergarten Readiness Assessment 2014-2015Composite Results
Anne Arundel County Data File Summary 2014-2015
43
39
18
0%
10%
20%
30%
40%
50%
60%
70%
80%
90%
100%
2014-15
Composite
Demonstrating Approaching Emerging
B 18
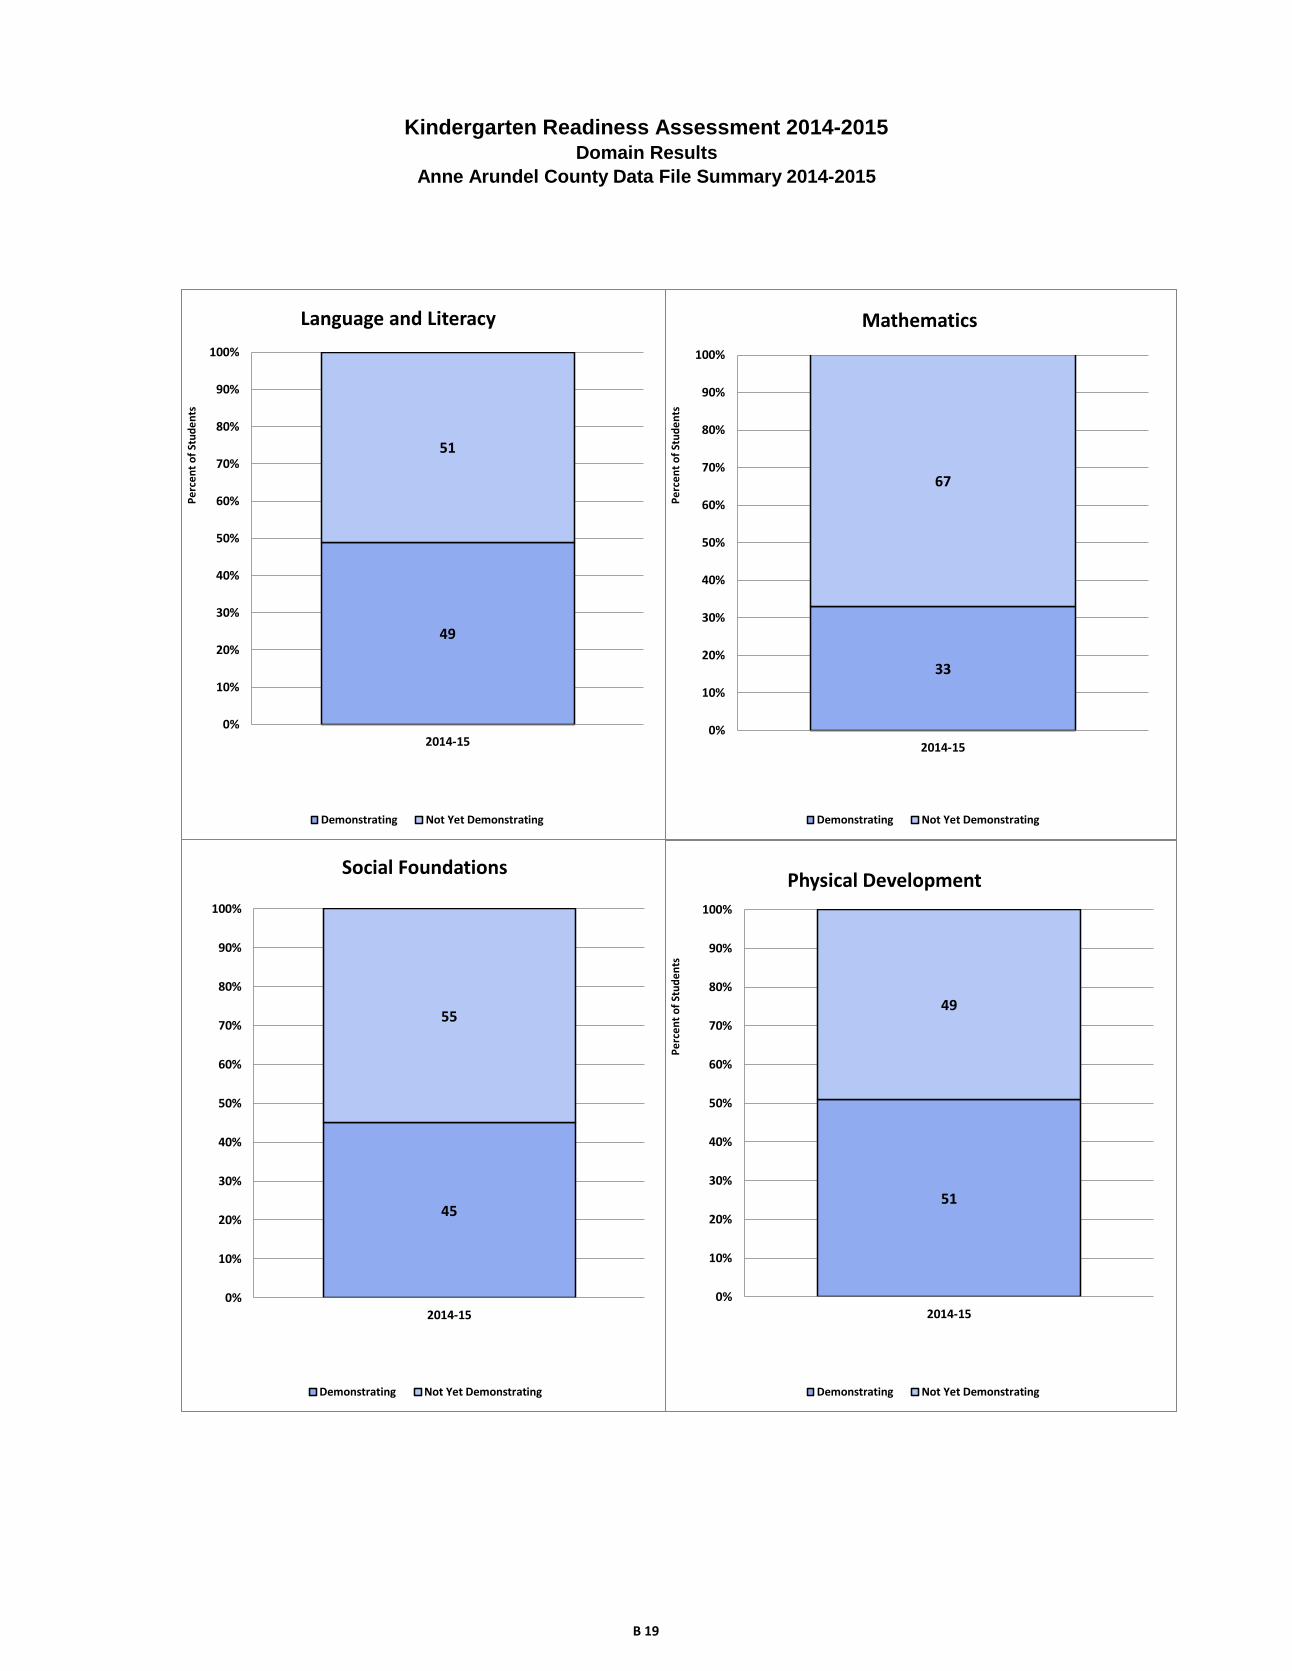
Kindergarten Readiness Assessment 2014-2015Domain Results
Anne Arundel County Data File Summary 2014-2015
49
51
0%
10%
20%
30%
40%
50%
60%
70%
80%
90%
100%
2014-15
Language and Literacy
Demonstrating Not Yet Demonstrating
Pe
rce
nt
of
Stu
de
nts
33
67
0%
10%
20%
30%
40%
50%
60%
70%
80%
90%
100%
2014-15
Mathematics
Demonstrating Not Yet Demonstrating
Pe
rce
nt
of
Stu
de
nts
45
55
0%
10%
20%
30%
40%
50%
60%
70%
80%
90%
100%
2014-15
Social Foundations
Demonstrating Not Yet Demonstrating
51
49
0%
10%
20%
30%
40%
50%
60%
70%
80%
90%
100%
2014-15
Physical Development
Demonstrating Not Yet Demonstrating
Pe
rce
nt
of
Stu
de
nts
B 19
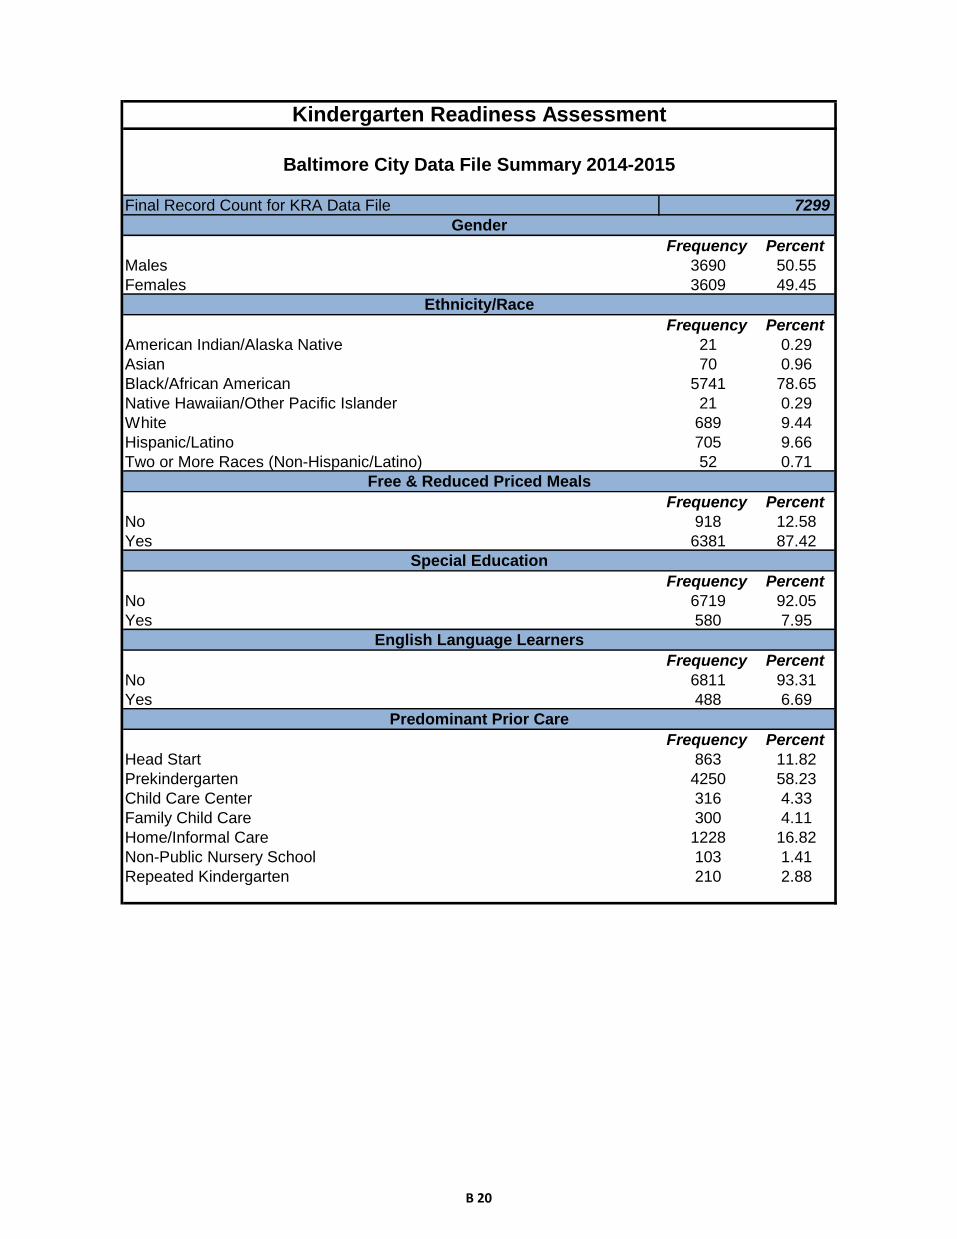
Frequency Percent
Males 3690 50.55
Females 3609 49.45
Frequency Percent
American Indian/Alaska Native 21 0.29
Asian 70 0.96
Black/African American 5741 78.65
Native Hawaiian/Other Pacific Islander 21 0.29
White 689 9.44
Hispanic/Latino 705 9.66
Two or More Races (Non-Hispanic/Latino) 52 0.71
Frequency Percent
No 918 12.58
Yes 6381 87.42
Frequency Percent
No 6719 92.05
Yes 580 7.95
Frequency Percent
No 6811 93.31
Yes 488 6.69
Frequency Percent
Head Start 863 11.82
Prekindergarten 4250 58.23
Child Care Center 316 4.33
Family Child Care 300 4.11
Home/Informal Care 1228 16.82
Non-Public Nursery School 103 1.41
Repeated Kindergarten 210 2.88
Free & Reduced Priced Meals
Special Education
English Language Learners
Predominant Prior Care
Final Record Count for KRA Data File 7299
Kindergarten Readiness Assessment
Baltimore City Data File Summary 2014-2015
Gender
Ethnicity/Race
B 20

Demonstrating
Not Yet
Demonstrating
Demonstrating
Not Yet
Demonstrating
Demonstrating
Not Yet
Demonstrating
Demonstrating
Not Yet
Demonstrating
Demonstrating
Approaching
Emerging
Rac
e/E
thn
icity
Am
eric
an In
dia
n/A
laskan N
ativ
e1
19
91
11
19
13
71
17
2
Asia
n2
43
92
83
83
03
53
03
52
62
01
7
Afric
an A
meric
an
2,7
32
2,8
38
2,5
00
3,1
07
2,7
73
2,8
37
3,0
91
2,5
16
2,6
90
1,8
62
98
5
Nativ
e H
aw
aiia
n/P
acific
Isla
nde
r6
12
99
11
95
15
84
4
White
35
82
79
41
32
33
34
92
97
34
03
06
37
01
61
99
His
panic
18
34
95
27
14
14
27
64
01
31
73
62
23
32
48
18
6
Tw
o o
r More
Race
s (N
on-H
ispanic
/La
tino)
29
19
28
21
26
22
29
19
26
20
2
Gen
der
Male
1,5
29
2,0
25
1,5
34
2,0
49
1,4
78
2,1
06
1,6
07
1,9
85
1,4
42
1,2
94
79
2
Fem
ale
1,8
14
1,6
66
1,7
24
1,7
84
1,9
98
1,5
04
2,2
18
1,2
75
1,9
22
1,0
28
50
3
Prio
r Care
Child
Care
Cente
r1
60
14
91
47
16
21
63
14
71
66
14
31
65
90
52
Fam
ily C
hild
Care
10
21
91
10
41
92
10
41
91
12
21
71
10
88
89
3
Hea
d S
tart
35
24
91
30
45
46
37
04
79
39
94
49
32
43
26
18
6
Hom
e / In
form
al C
are
32
08
63
32
58
69
41
97
74
44
97
44
31
74
32
42
5
Non-p
ublic
Nurs
ery
73
29
80
23
69
34
69
34
74
22
6
Pre
-Kin
de
rgarte
n2,2
71
1,8
11
2,2
21
1,8
96
2,2
79
1,8
35
2,5
19
1,5
98
2,3
18
1,2
62
47
3
Sp
ec
ial E
du
ca
tion
No
3,2
19
3,2
91
3,1
23
3,4
38
3,3
36
3,2
14
3,6
67
2,8
77
3,2
42
2,1
56
1,0
66
Yes
12
44
00
13
53
95
14
03
96
15
83
83
12
21
66
22
9
En
glis
h L
an
gu
ag
e L
ea
rne
rs
No
32
80
32
99
31
25
35
02
33
39
32
86
36
45
29
78
32
67
21
49
11
22
Yes
63
39
21
33
33
11
37
32
41
80
28
29
71
73
17
3
Fre
e a
nd
Red
uce
d P
rice
Mea
ls
No
58
43
01
59
12
97
53
13
58
55
33
38
58
22
18
79
Yes
2,7
59
3,3
90
2,6
67
3,5
36
2,9
45
3,2
52
3,2
72
2,9
22
2,7
82
2,1
04
1,2
16
Aggre
gate
d D
ata
3,3
43
3,6
91
3,2
58
3,8
33
3,4
76
3,6
10
3,8
25
3,2
60
3,3
64
2,3
22
1,2
95
* = G
roup s
ize fe
wer th
an 5
Baltim
ore
City
- Nu
mb
er o
f Kin
derg
arte
n S
tud
en
ts
Socia
l
Founda
tions
Physic
al
Develo
pm
ent
La
nguage a
nd
Lite
racy
Math
em
atic
sC
om
posite
B 21

Demonstrating
Not Yet
Demonstrating
Demonstrating
Not Yet
Demonstrating
Demonstrating
Not Yet
Demonstrating
Demonstrating
Not Yet
Demonstrating
Demonstrating
Approaching
Emerging
Rac
e/E
thn
icity
Am
eric
an In
dia
n/A
laskan N
ativ
e5
54
54
55
55
54
56
53
55
53
51
0
Asia
n3
86
24
25
84
65
44
65
44
13
22
7
Afric
an A
meric
an
49
51
45
55
49
51
55
45
49
34
18
Nativ
e H
aw
aiia
n/P
acific
Isla
nde
r3
36
75
05
05
54
52
57
55
02
52
5
White
56
44
64
36
54
46
53
47
59
26
16
His
panic
27
73
40
60
41
59
47
53
35
37
28
Tw
o o
r More
Race
s (N
on-H
ispanic
/La
tino)
60
40
57
43
54
46
60
40
54
42
4
Gen
der
Male
43
57
43
57
41
59
45
55
41
37
22
Fem
ale
52
48
49
51
57
43
63
37
56
30
15
Prio
r Care
Child
Care
Cente
r5
24
84
85
25
34
75
44
65
42
91
7
Fam
ily C
hild
Care
35
65
35
65
35
65
42
58
37
30
32
Hea
d S
tart
42
58
36
64
44
56
47
53
39
39
22
Hom
e / In
form
al C
are
27
73
27
73
35
65
38
62
27
37
36
Non-p
ublic
Nurs
ery
72
28
78
22
67
33
67
33
73
22
6
Pre
-Kin
de
rgarte
n5
64
45
44
65
54
56
13
95
73
11
2
Sp
ec
ial E
du
ca
tion
No
49
51
48
52
51
49
56
44
50
33
16
Yes
24
76
25
75
26
74
29
71
24
32
44
En
glis
h L
an
gu
ag
e L
ea
rne
rs
No
50
50
47
53
50
50
55
45
50
33
17
Yes
14
86
29
71
30
70
39
61
22
39
39
Fre
e a
nd
Red
uce
d P
rice
Mea
ls
No
66
34
67
33
60
40
62
38
66
25
9
Yes
45
55
43
57
48
52
53
47
46
34
20
Aggre
gate
d D
ata
48
52
46
54
49
51
54
46
48
33
19
* = P
erc
enta
ge c
ould
not b
e re
porte
d d
ue to
gro
up s
ize fe
wer th
an 5
Socia
l
Founda
tions
Physic
al
Develo
pm
ent
Com
posite
Baltim
ore
City
- Perc
en
tag
e o
f Kin
derg
arte
n S
tud
en
ts
La
nguage a
nd
Lite
racy
Math
em
atic
s
B 22
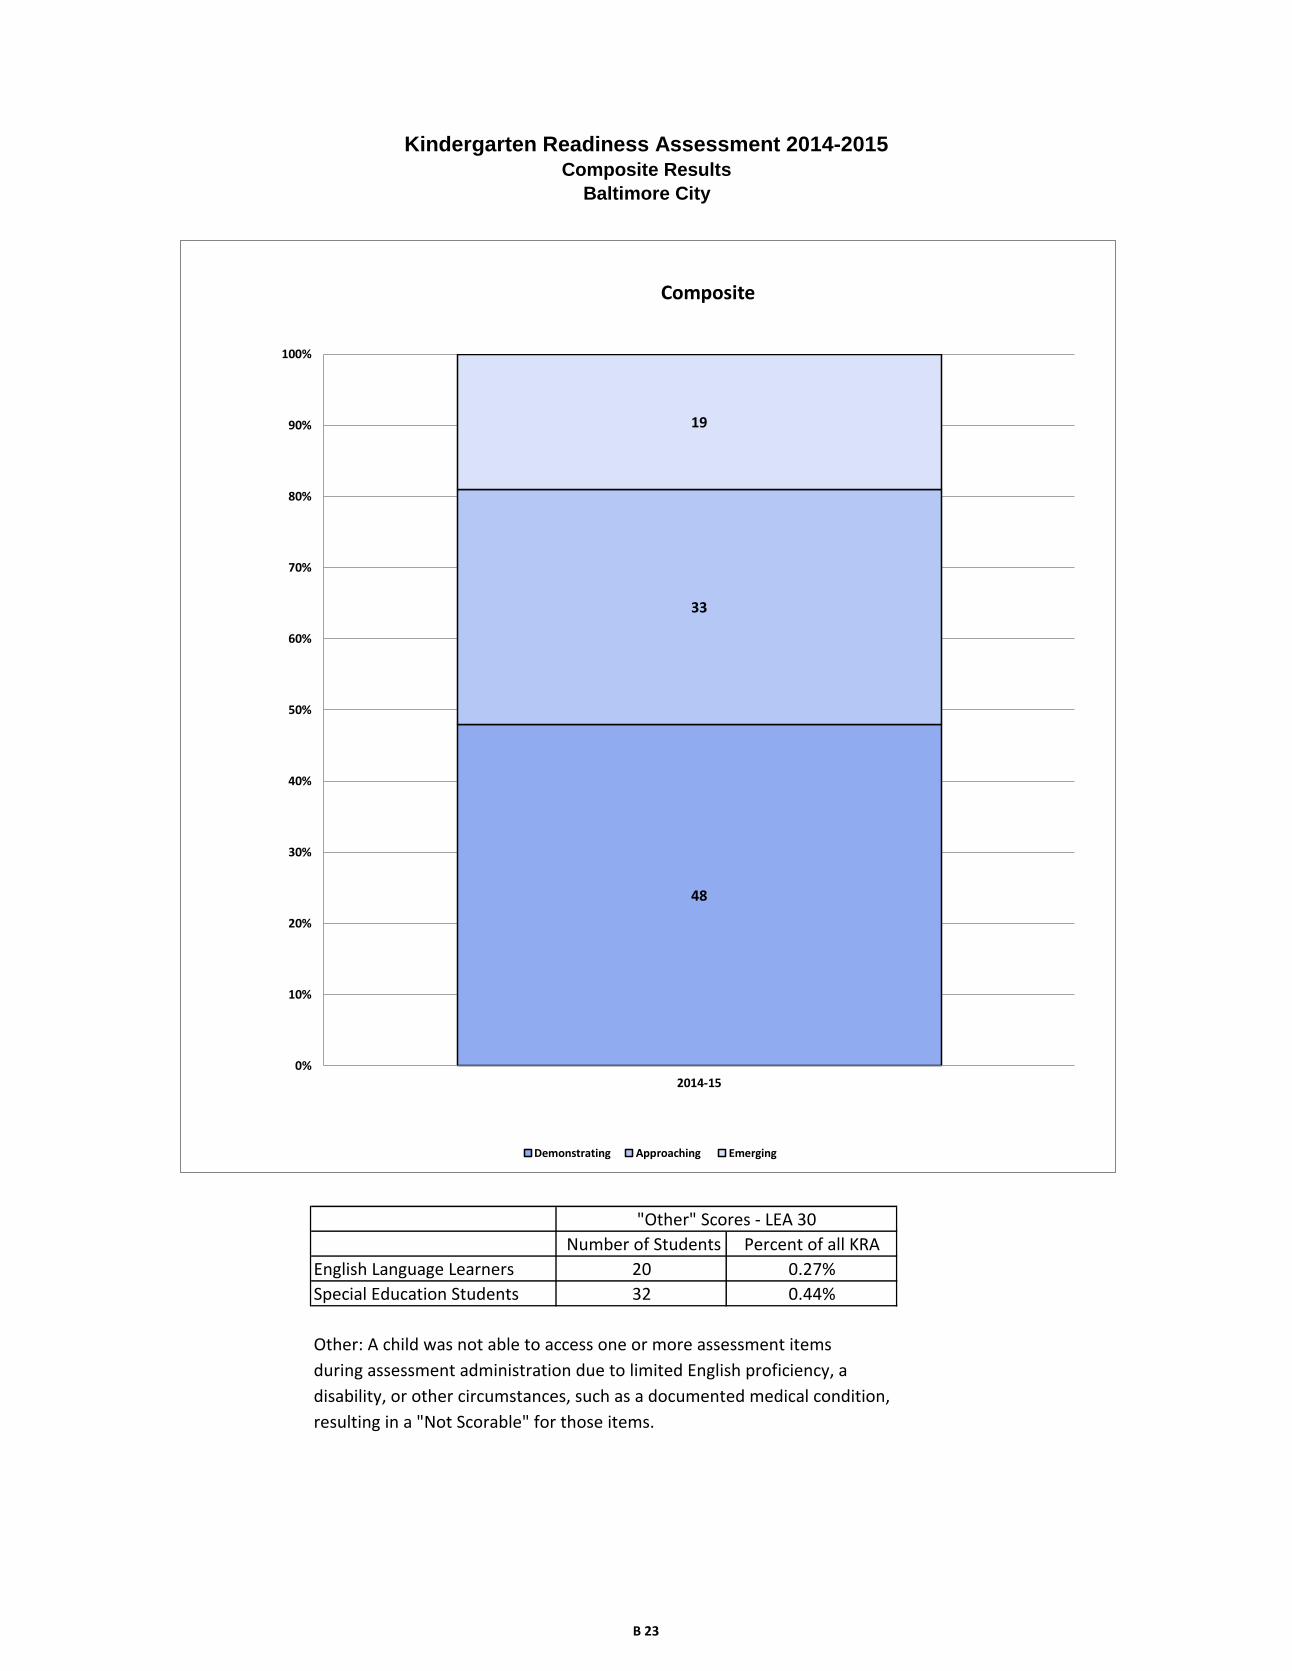
Other: A child was not able to access one or more assessment items
during assessment administration due to limited English proficiency, a
disability, or other circumstances, such as a documented medical condition,
resulting in a "Not Scorable" for those items.
Kindergarten Readiness Assessment 2014-2015Composite Results
Baltimore City
English Language Learners 20 0.27%
Special Education Students 32 0.44%
"Other" Scores - LEA 30
Number of Students Percent of all KRA
48
33
19
0%
10%
20%
30%
40%
50%
60%
70%
80%
90%
100%
2014-15
Composite
Demonstrating Approaching Emerging
B 23
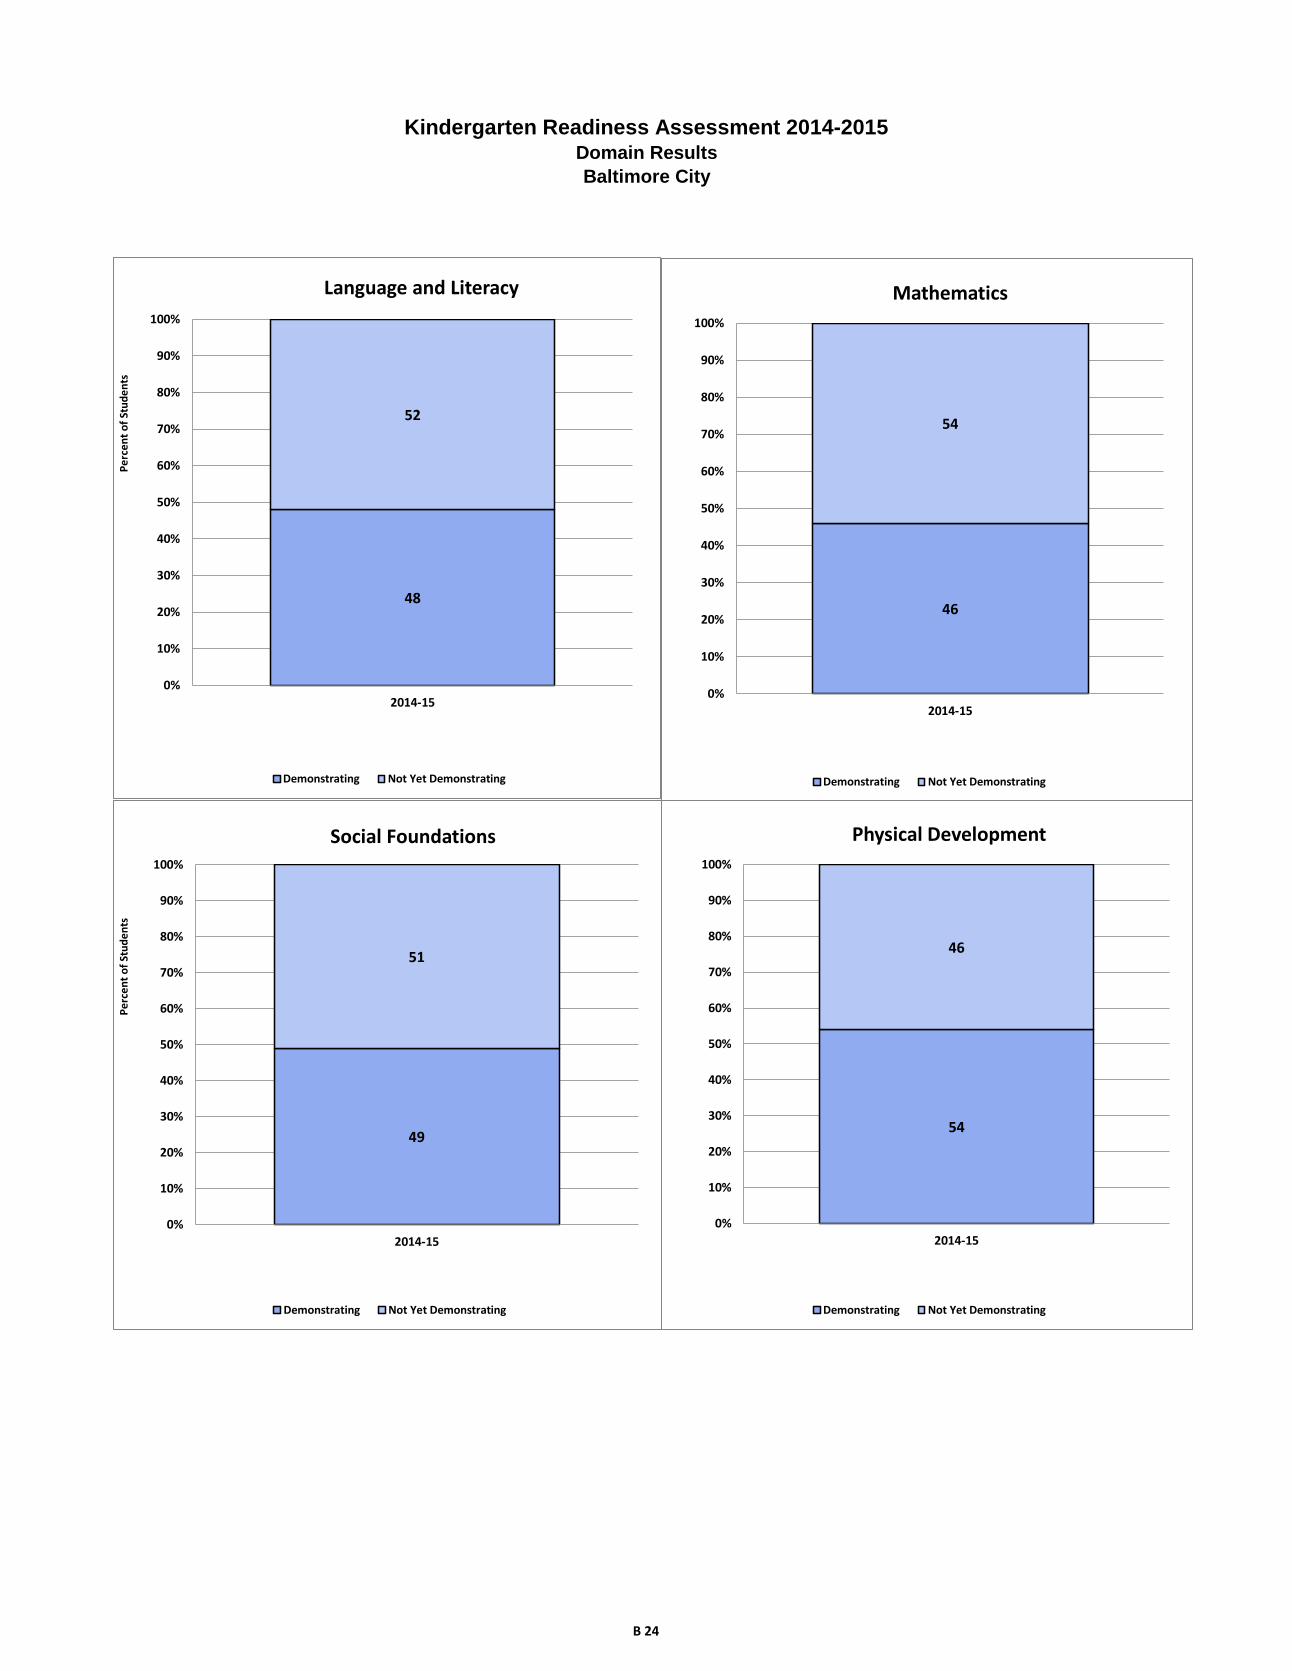
Kindergarten Readiness Assessment 2014-2015Domain Results
Baltimore City
48
52
0%
10%
20%
30%
40%
50%
60%
70%
80%
90%
100%
2014-15
Language and Literacy
Demonstrating Not Yet Demonstrating
Pe
rce
nt
of
Stu
de
nts
46
54
0%
10%
20%
30%
40%
50%
60%
70%
80%
90%
100%
2014-15
Mathematics
Demonstrating Not Yet Demonstrating
49
51
0%
10%
20%
30%
40%
50%
60%
70%
80%
90%
100%
2014-15
Social Foundations
Demonstrating Not Yet Demonstrating
Pe
rce
nt
of
Stu
de
nts
54
46
0%
10%
20%
30%
40%
50%
60%
70%
80%
90%
100%
2014-15
Physical Development
Demonstrating Not Yet Demonstrating
B 24
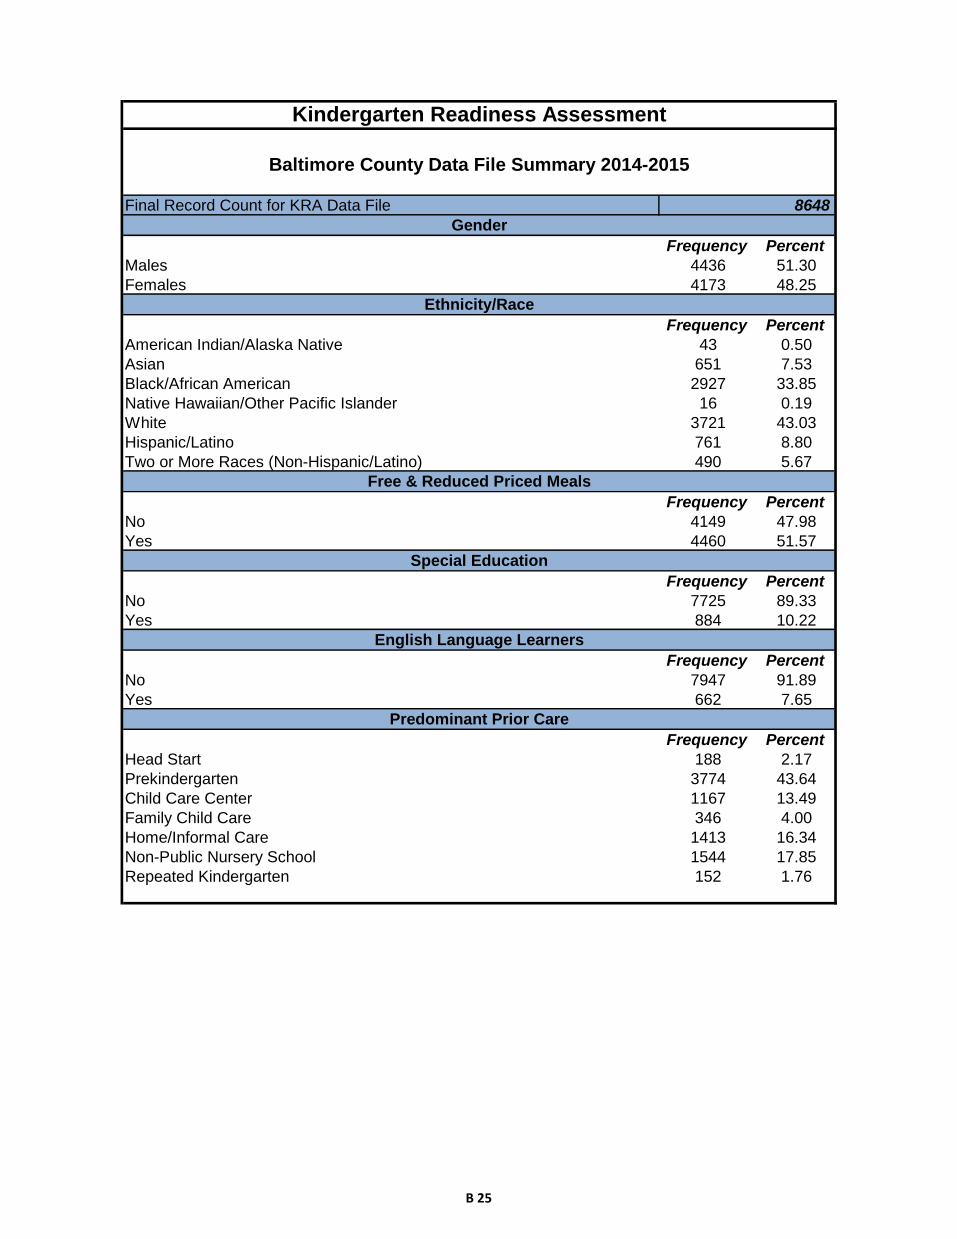
Frequency Percent
Males 4436 51.30
Females 4173 48.25
Frequency Percent
American Indian/Alaska Native 43 0.50
Asian 651 7.53
Black/African American 2927 33.85
Native Hawaiian/Other Pacific Islander 16 0.19
White 3721 43.03
Hispanic/Latino 761 8.80
Two or More Races (Non-Hispanic/Latino) 490 5.67
Frequency Percent
No 4149 47.98
Yes 4460 51.57
Frequency Percent
No 7725 89.33
Yes 884 10.22
Frequency Percent
No 7947 91.89
Yes 662 7.65
Frequency Percent
Head Start 188 2.17
Prekindergarten 3774 43.64
Child Care Center 1167 13.49
Family Child Care 346 4.00
Home/Informal Care 1413 16.34
Non-Public Nursery School 1544 17.85
Repeated Kindergarten 152 1.76
Free & Reduced Priced Meals
Special Education
English Language Learners
Predominant Prior Care
Final Record Count for KRA Data File 8648
Kindergarten Readiness Assessment
Baltimore County Data File Summary 2014-2015
Gender
Ethnicity/Race
B 25
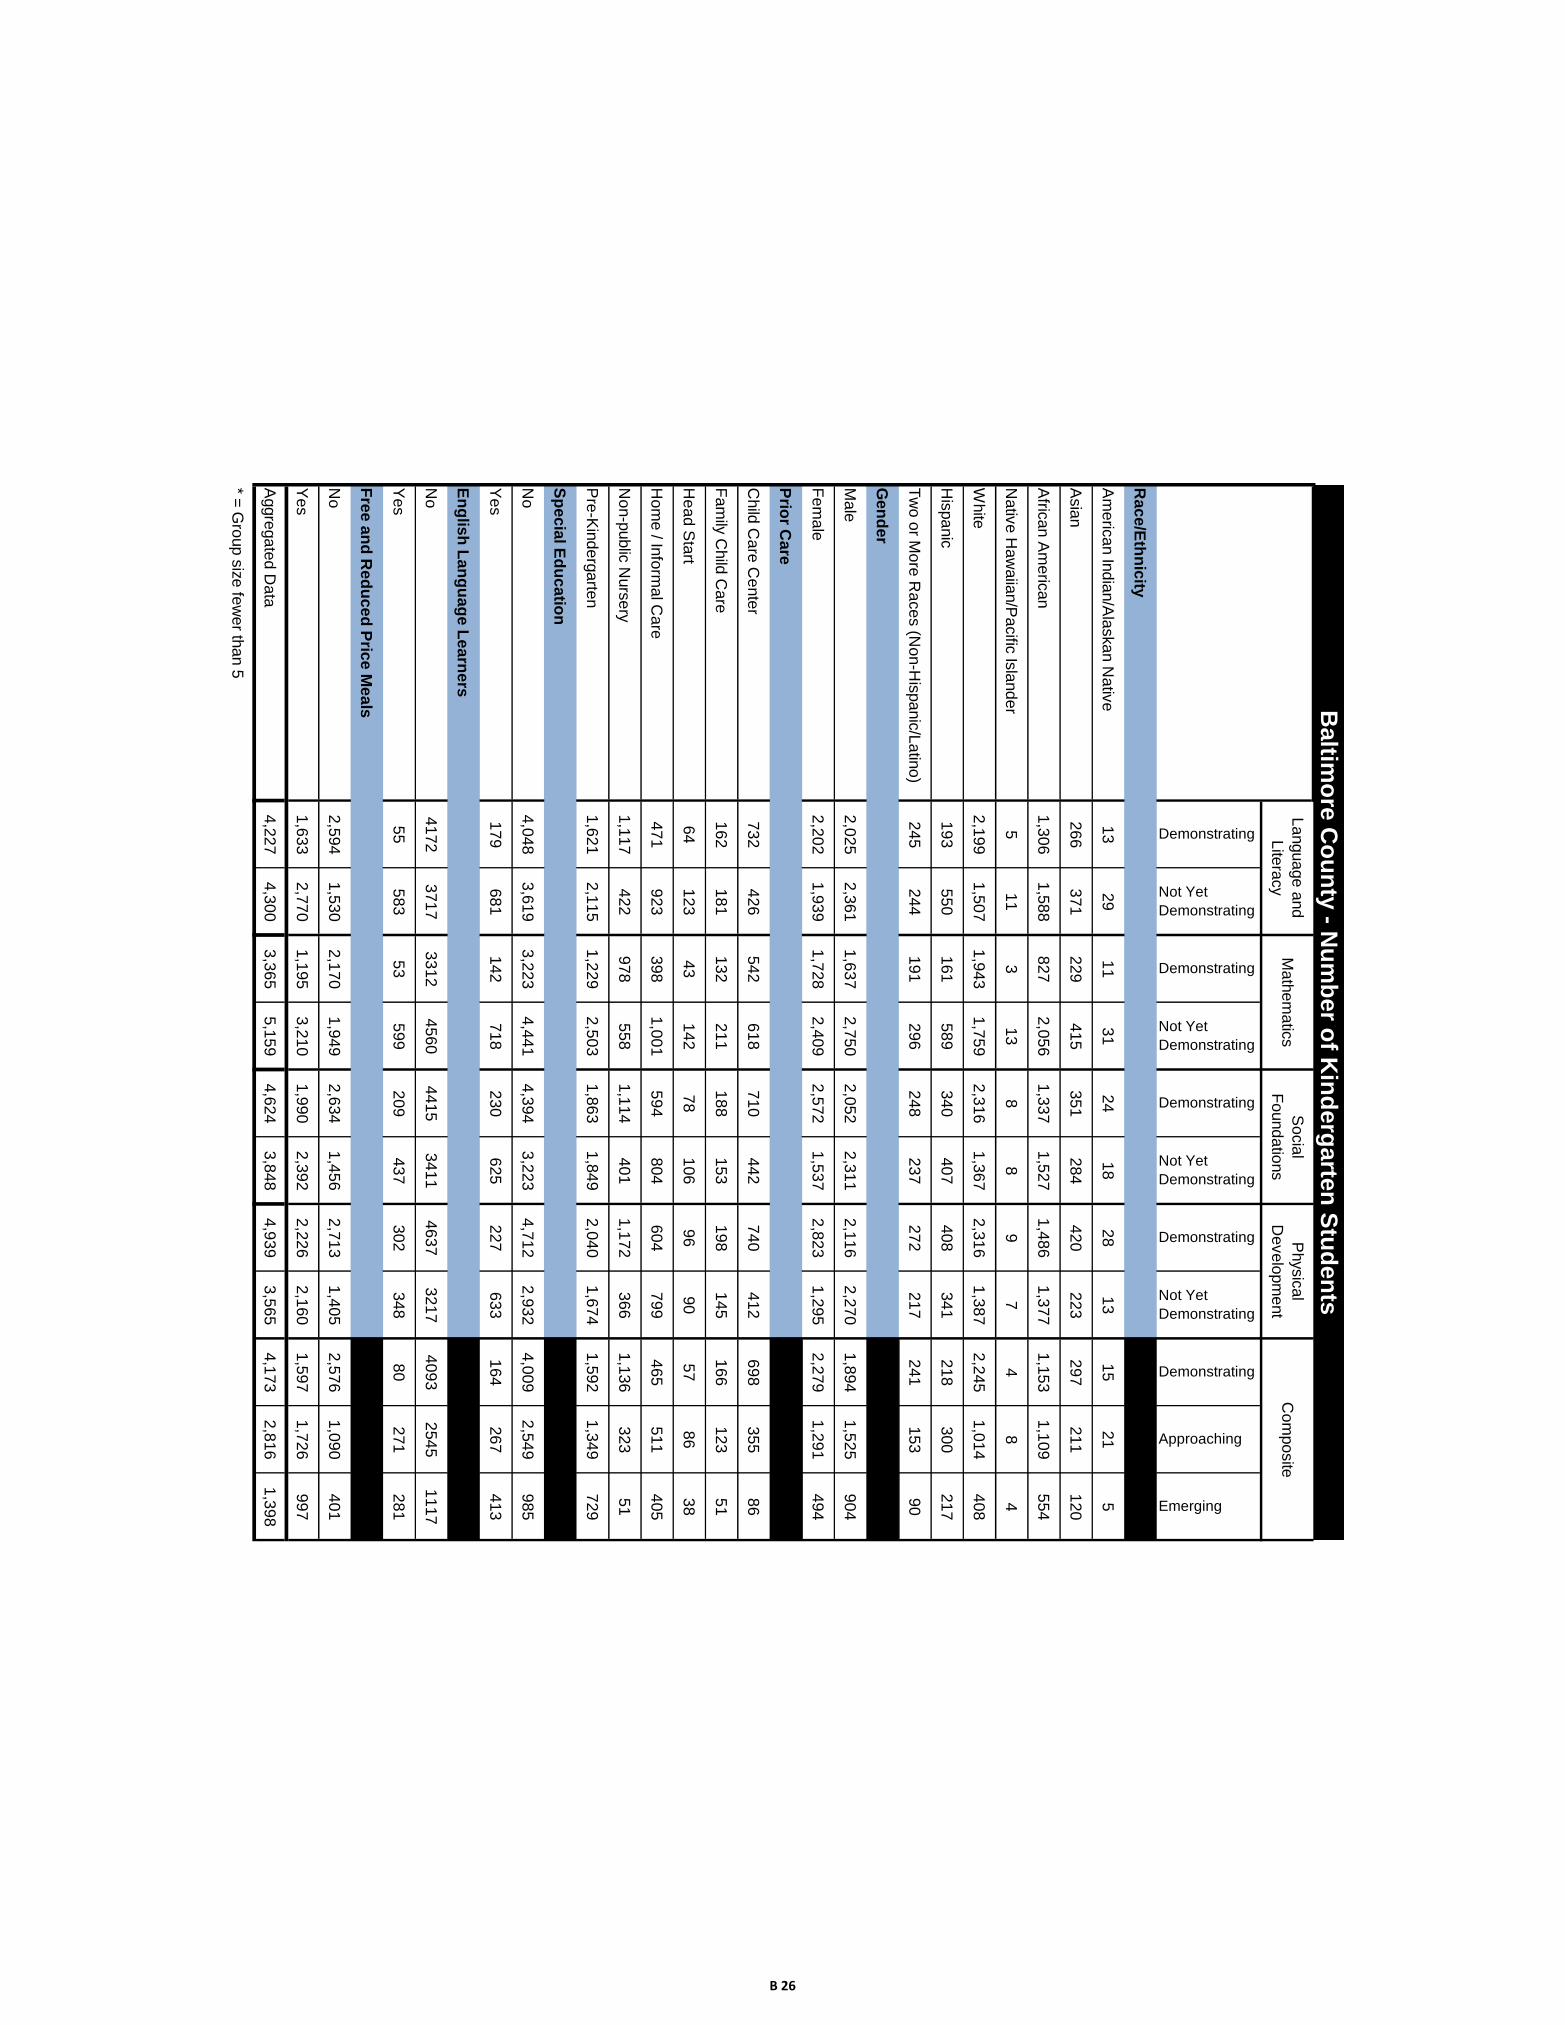
Demonstrating
Not Yet
Demonstrating
Demonstrating
Not Yet
Demonstrating
Demonstrating
Not Yet
Demonstrating
Demonstrating
Not Yet
Demonstrating
Demonstrating
Approaching
Emerging
Rac
e/E
thn
icity
Am
eric
an In
dia
n/A
laskan N
ativ
e1
32
91
13
12
41
82
81
31
52
15
Asia
n2
66
37
12
29
41
53
51
28
44
20
22
32
97
21
11
20
Afric
an A
meric
an
1,3
06
1,5
88
82
72,0
56
1,3
37
1,5
27
1,4
86
1,3
77
1,1
53
1,1
09
55
4
Nativ
e H
aw
aiia
n/P
acific
Isla
nde
r5
11
31
38
89
74
84
White
2,1
99
1,5
07
1,9
43
1,7
59
2,3
16
1,3
67
2,3
16
1,3
87
2,2
45
1,0
14
40
8
His
panic
19
35
50
16
15
89
34
04
07
40
83
41
21
83
00
21
7
Tw
o o
r More
Race
s (N
on-H
ispanic
/La
tino)
24
52
44
19
12
96
24
82
37
27
22
17
24
11
53
90
Gen
der
Male
2,0
25
2,3
61
1,6
37
2,7
50
2,0
52
2,3
11
2,1
16
2,2
70
1,8
94
1,5
25
90
4
Fem
ale
2,2
02
1,9
39
1,7
28
2,4
09
2,5
72
1,5
37
2,8
23
1,2
95
2,2
79
1,2
91
49
4
Prio
r Care
Child
Care
Cente
r7
32
42
65
42
61
87
10
44
27
40
41
26
98
35
58
6
Fam
ily C
hild
Care
16
21
81
13
22
11
18
81
53
19
81
45
16
61
23
51
Hea
d S
tart
64
12
34
31
42
78
10
69
69
05
78
63
8
Hom
e / In
form
al C
are
47
19
23
39
81,0
01
59
48
04
60
47
99
46
55
11
40
5
Non-p
ublic
Nurs
ery
1,1
17
42
29
78
55
81,1
14
40
11,1
72
36
61,1
36
32
35
1
Pre
-Kin
de
rgarte
n1,6
21
2,1
15
1,2
29
2,5
03
1,8
63
1,8
49
2,0
40
1,6
74
1,5
92
1,3
49
72
9
Sp
ec
ial E
du
ca
tion
No
4,0
48
3,6
19
3,2
23
4,4
41
4,3
94
3,2
23
4,7
12
2,9
32
4,0
09
2,5
49
98
5
Yes
17
96
81
14
27
18
23
06
25
22
76
33
16
42
67
41
3
En
glis
h L
an
gu
ag
e L
ea
rne
rs
No
41
72
37
17
33
12
45
60
44
15
34
11
46
37
32
17
40
93
25
45
11
17
Yes
55
58
35
35
99
20
94
37
30
23
48
80
27
12
81
Fre
e a
nd
Red
uce
d P
rice
Mea
ls
No
2,5
94
1,5
30
2,1
70
1,9
49
2,6
34
1,4
56
2,7
13
1,4
05
2,5
76
1,0
90
40
1
Yes
1,6
33
2,7
70
1,1
95
3,2
10
1,9
90
2,3
92
2,2
26
2,1
60
1,5
97
1,7
26
99
7
Aggre
gate
d D
ata
4,2
27
4,3
00
3,3
65
5,1
59
4,6
24
3,8
48
4,9
39
3,5
65
4,1
73
2,8
16
1,3
98
* = G
roup s
ize fe
wer th
an 5
Baltim
ore
Co
un
ty - N
um
ber o
f Kin
derg
arte
n S
tud
en
ts
Socia
l
Founda
tions
Physic
al
Develo
pm
ent
La
nguage a
nd
Lite
racy
Math
em
atic
sC
om
posite
B 26

Demonstrating
Not Yet
Demonstrating
Demonstrating
Not Yet
Demonstrating
Demonstrating
Not Yet
Demonstrating
Demonstrating
Not Yet
Demonstrating
Demonstrating
Approaching
Emerging
Rac
e/E
thn
icity
Am
eric
an In
dia
n/A
laskan N
ativ
e3
16
92
67
45
74
36
83
23
75
11
2
Asia
n4
25
83
66
45
54
56
53
54
73
41
9
Afric
an A
meric
an
45
55
29
71
47
53
52
48
41
39
20
Nativ
e H
aw
aiia
n/P
acific
Isla
nde
r3
16
91
98
15
05
05
64
42
55
02
5
White
59
41
52
48
63
37
63
37
61
28
11
His
panic
26
74
21
79
46
54
54
46
30
41
30
Tw
o o
r More
Race
s (N
on-H
ispanic
/La
tino)
50
50
39
61
51
49
56
44
50
32
19
Gen
der
Male
46
54
37
63
47
53
48
52
44
35
21
Fem
ale
53
47
42
58
63
37
69
31
56
32
12
Prio
r Care
Child
Care
Cente
r6
33
74
75
36
23
86
43
66
13
18
Fam
ily C
hild
Care
47
53
38
62
55
45
58
42
49
36
15
Hea
d S
tart
34
66
23
77
42
58
52
48
31
48
21
Hom
e / In
form
al C
are
34
66
28
72
42
58
43
57
34
37
29
Non-p
ublic
Nurs
ery
73
27
64
36
74
26
76
24
75
21
3
Pre
-Kin
de
rgarte
n4
35
73
36
75
05
05
54
54
33
72
0
Sp
ec
ial E
du
ca
tion
No
53
47
42
58
58
42
62
38
53
34
13
Yes
21
79
17
83
27
73
26
74
19
32
49
En
glis
h L
an
gu
ag
e L
ea
rne
rs
No
53
47
42
58
56
44
59
41
53
33
14
Yes
99
18
92
32
68
46
54
13
43
44
Fre
e a
nd
Red
uce
d P
rice
Mea
ls
No
63
37
53
47
64
36
66
34
63
27
10
Yes
37
63
27
73
45
55
51
49
37
40
23
Aggre
gate
d D
ata
50
50
39
61
55
45
58
42
50
34
17
* = P
erc
enta
ge c
ould
not b
e re
porte
d d
ue to
gro
up s
ize fe
wer th
an 5
Baltim
ore
Co
un
ty - P
erc
en
tag
e o
f Kin
derg
arte
n S
tud
en
ts
Socia
l
Founda
tions
Physic
al
Develo
pm
ent
Com
posite
La
nguage a
nd
Lite
racy
Math
em
atic
s
B 27
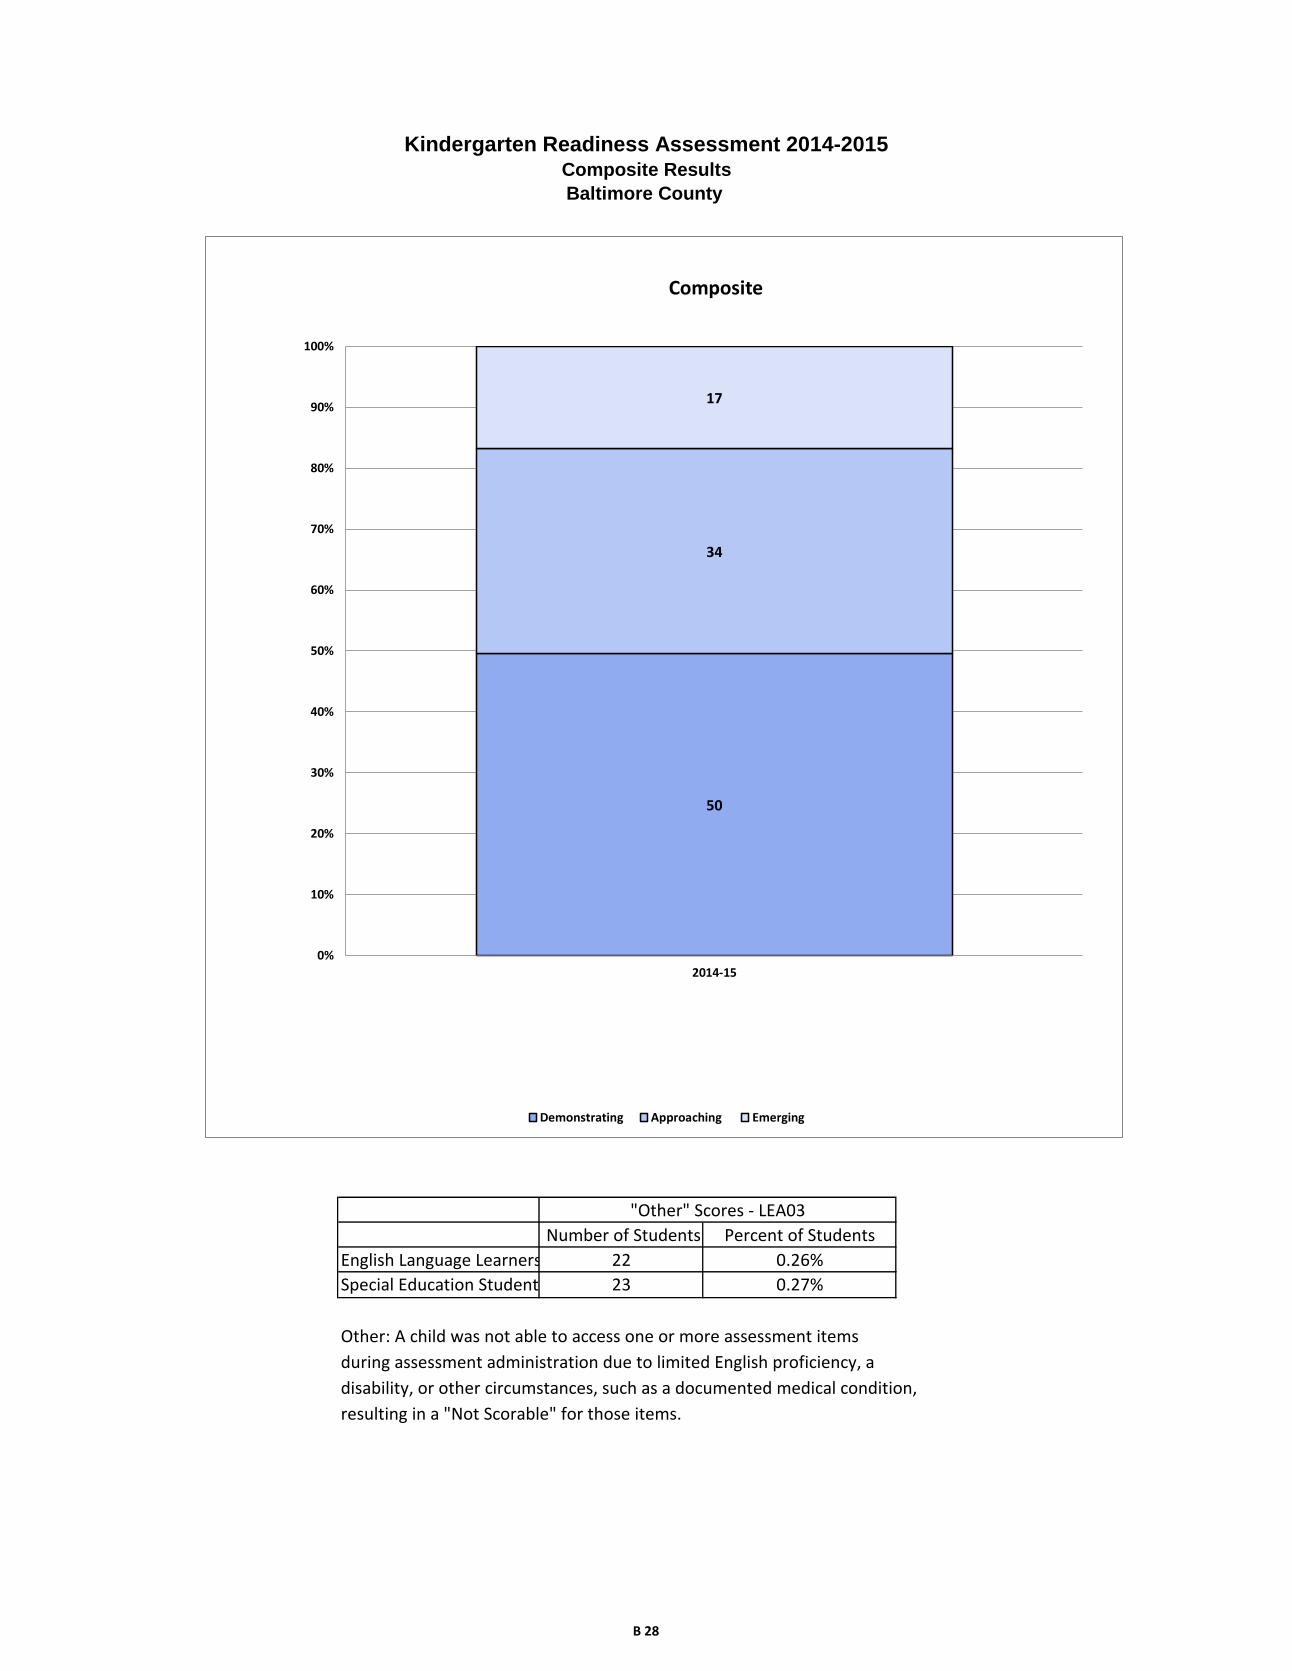
Other: A child was not able to access one or more assessment items
during assessment administration due to limited English proficiency, a
disability, or other circumstances, such as a documented medical condition,
resulting in a "Not Scorable" for those items.
Kindergarten Readiness Assessment 2014-2015
0.26%
Special Education Students 23 0.27%
Composite Results
Baltimore County
"Other" Scores - LEA03
Number of Students Percent of Students
English Language Learners 22
50
34
17
0%
10%
20%
30%
40%
50%
60%
70%
80%
90%
100%
2014-15
Composite
Demonstrating Approaching Emerging
B 28
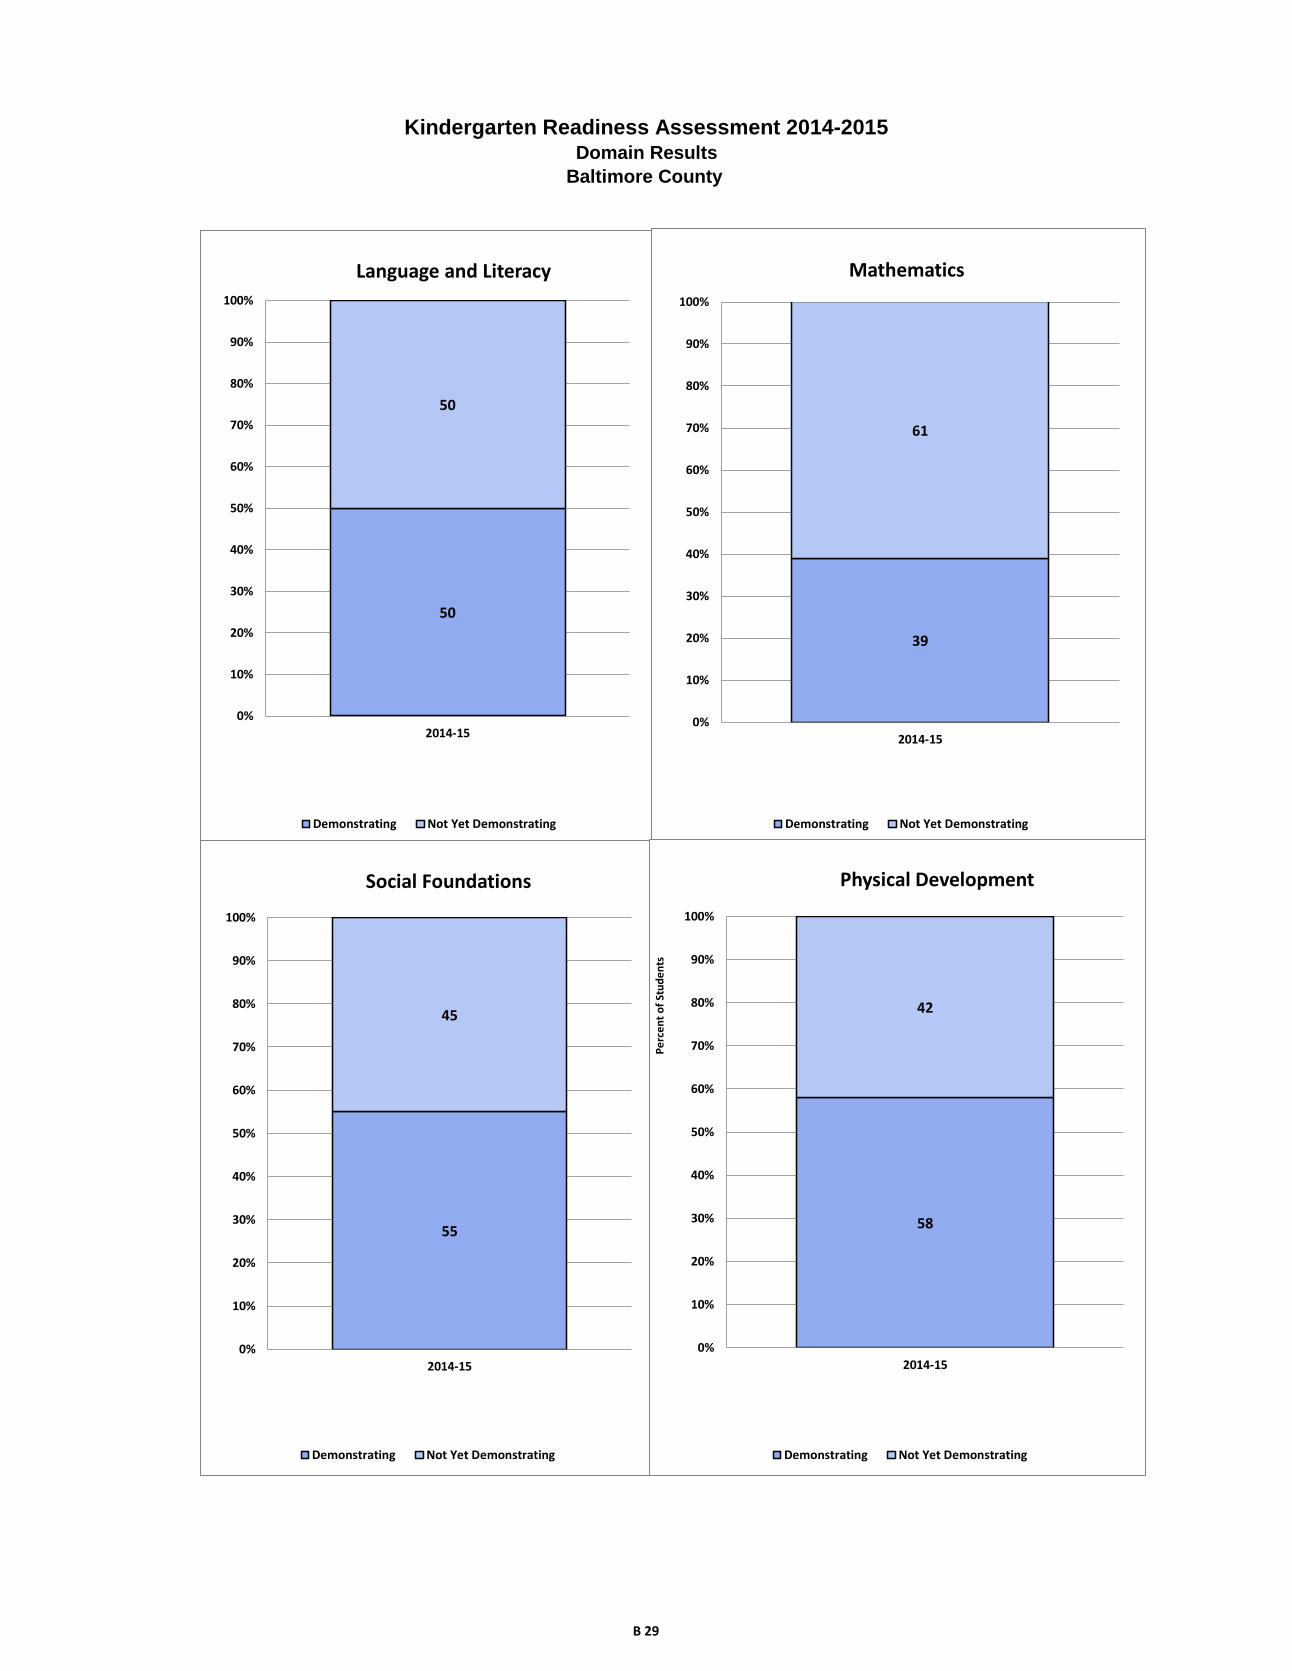
Kindergarten Readiness Assessment 2014-2015Domain Results
Baltimore County
50
50
0%
10%
20%
30%
40%
50%
60%
70%
80%
90%
100%
2014-15
Language and Literacy
Demonstrating Not Yet Demonstrating
39
61
0%
10%
20%
30%
40%
50%
60%
70%
80%
90%
100%
2014-15
Mathematics
Demonstrating Not Yet Demonstrating
55
45
0%
10%
20%
30%
40%
50%
60%
70%
80%
90%
100%
2014-15
Social Foundations
Demonstrating Not Yet Demonstrating
58
42
0%
10%
20%
30%
40%
50%
60%
70%
80%
90%
100%
2014-15
Physical Development
Demonstrating Not Yet Demonstrating
Pe
rce
nt
of
Stu
de
nts
B 29

Frequency Percent
Males 540 52.48
Females 489 47.52
Frequency Percent
American Indian/Alaska Native 0 0.00
Asian 8 0.78
Black/African American 132 12.83
Native Hawaiian/Other Pacific Islander 0 0.00
White 730 70.94
Hispanic/Latino 51 4.96
Two or More Races (Non-Hispanic/Latino) 108 10.50
Frequency Percent
No 716 69.58
Yes 313 30.42
Frequency Percent
No 929 90.28
Yes 100 9.72
Frequency Percent
No 1012 98.35
Yes 17 1.65
Frequency Percent
Head Start 49 4.76
Prekindergarten 208 20.21
Child Care Center 307 29.83
Family Child Care 89 8.65
Home/Informal Care 245 23.81
Non-Public Nursery School 129 12.54
Repeated Kindergarten 1 0.10
Special Education
English Language Learners
Predominant Prior Care
Final Record Count for KRA Data File 1029
Kindergarten Readiness Assessment
Calvert County Data File Summary 2014-2015
Gender
Ethnicity/Race
Free & Reduced Priced Meals
B 30
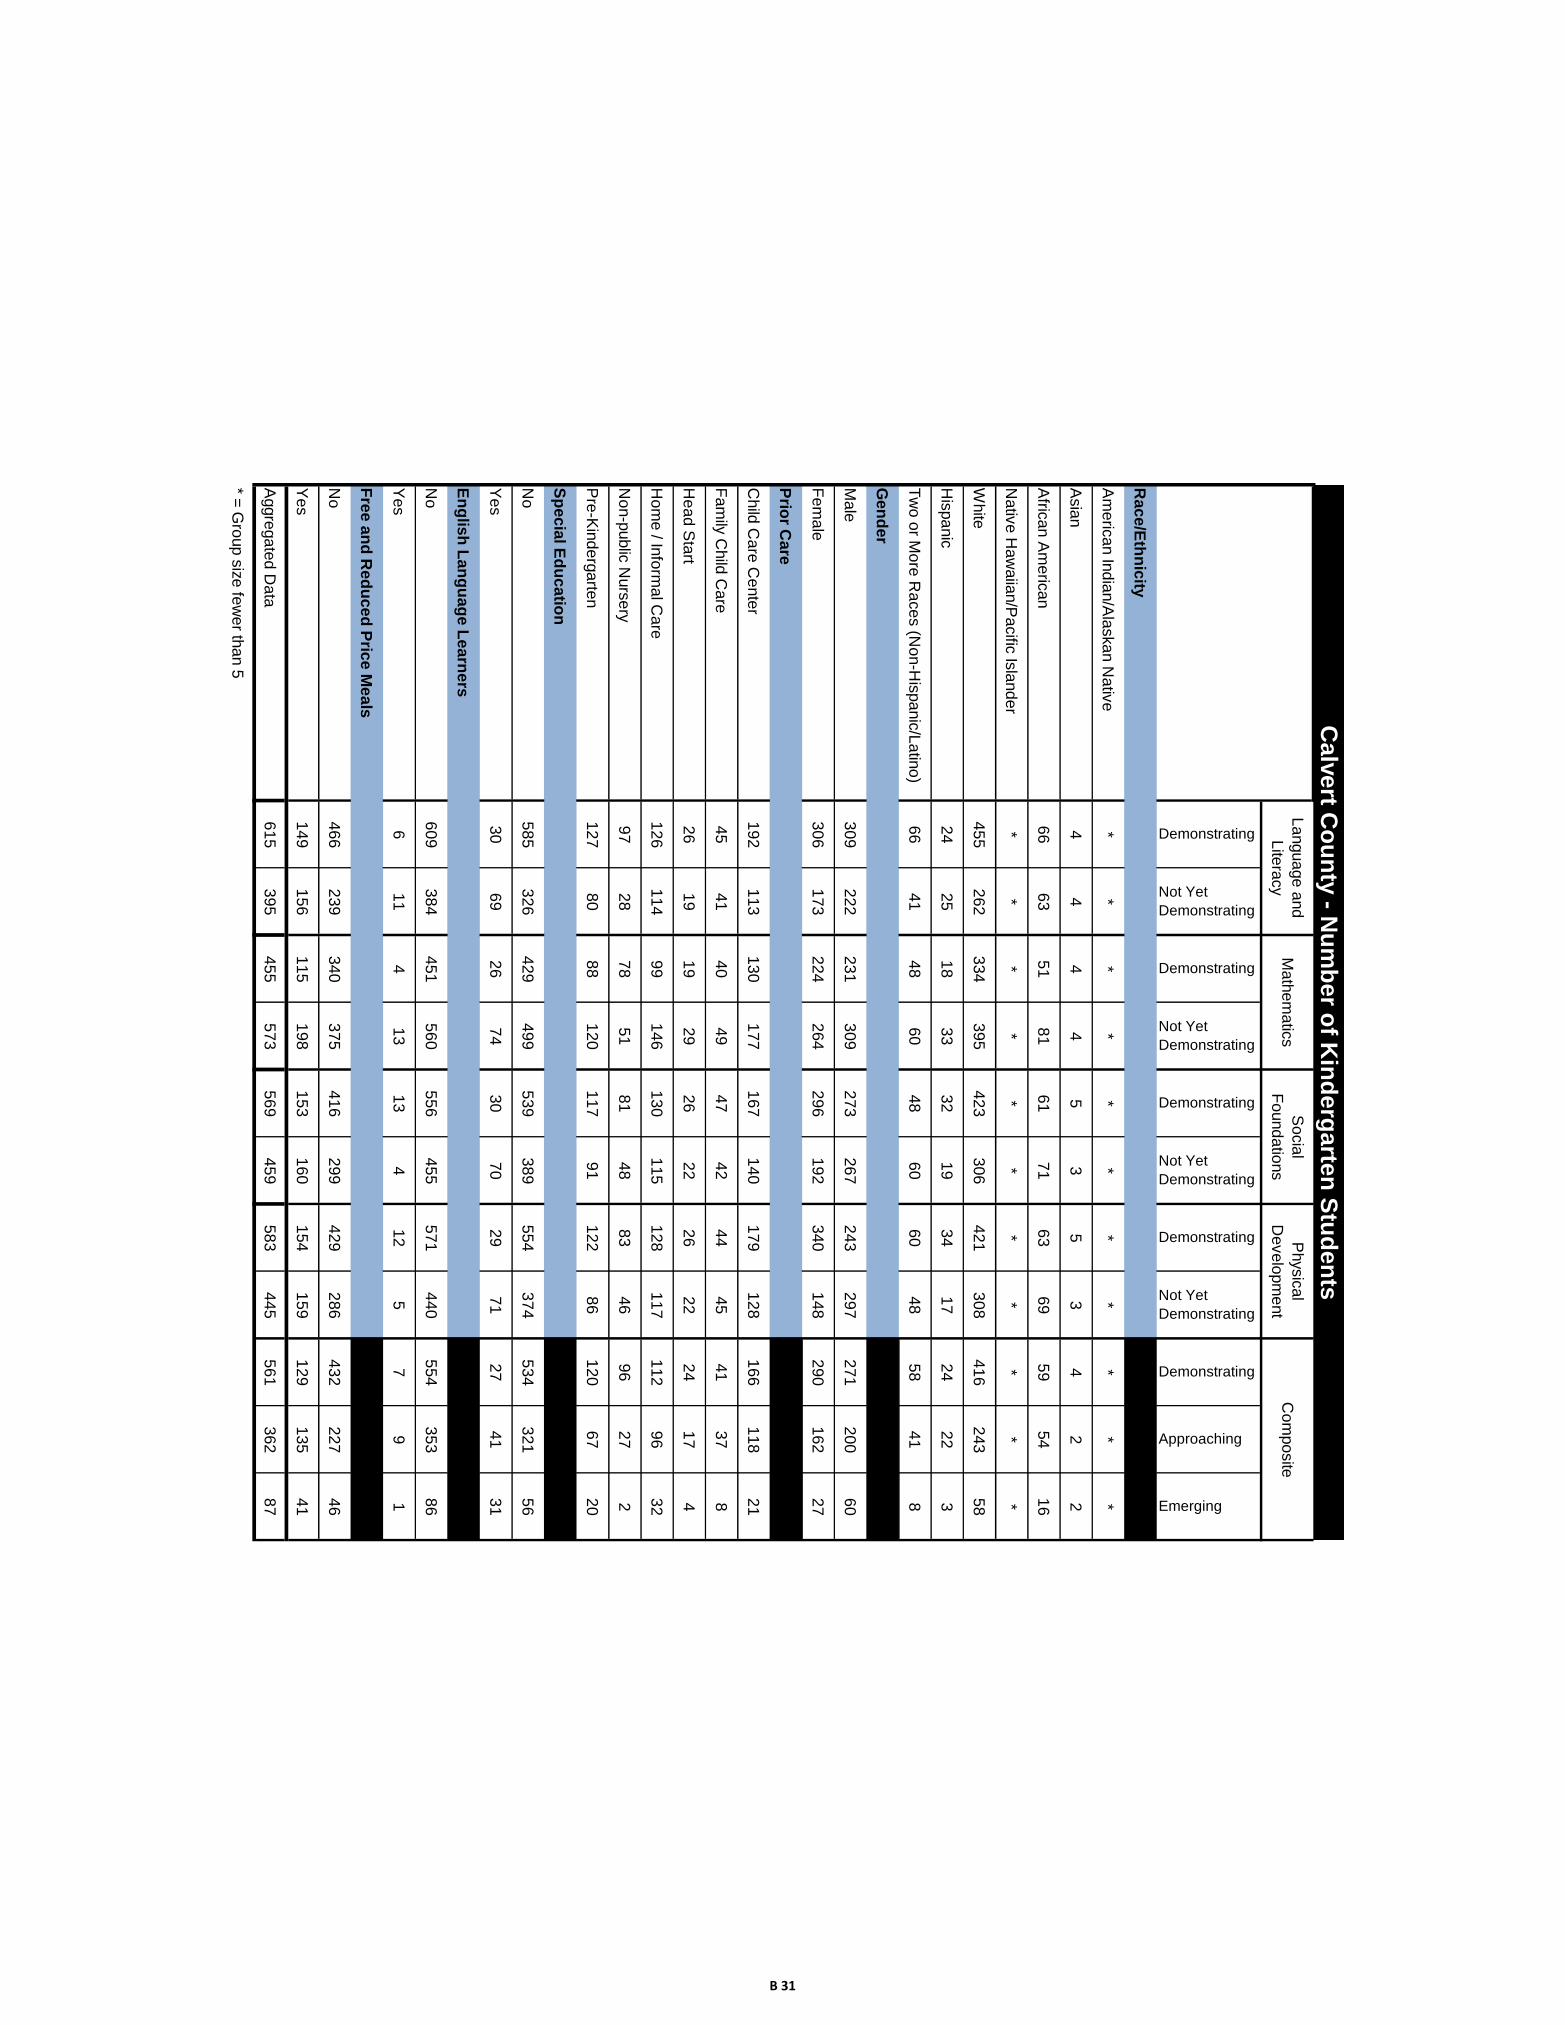
Demonstrating
Not Yet
Demonstrating
Demonstrating
Not Yet
Demonstrating
Demonstrating
Not Yet
Demonstrating
Demonstrating
Not Yet
Demonstrating
Demonstrating
Approaching
Emerging
Rac
e/E
thn
icity
Am
eric
an In
dia
n/A
laskan N
ativ
e*
**
**
**
**
**
Asia
n4
44
45
35
34
22
Afric
an A
meric
an
66
63
51
81
61
71
63
69
59
54
16
Nativ
e H
aw
aiia
n/P
acific
Isla
nde
r*
**
**
**
**
**
White
45
52
62
33
43
95
42
33
06
42
13
08
41
62
43
58
His
panic
24
25
18
33
32
19
34
17
24
22
3
Tw
o o
r More
Race
s (N
on-H
ispanic
/La
tino)
66
41
48
60
48
60
60
48
58
41
8
Gen
der
Male
30
92
22
23
13
09
27
32
67
24
32
97
27
12
00
60
Fem
ale
30
61
73
22
42
64
29
61
92
34
01
48
29
01
62
27
Prio
r Care
Child
Care
Cente
r1
92
11
31
30
17
71
67
14
01
79
12
81
66
11
82
1
Fam
ily C
hild
Care
45
41
40
49
47
42
44
45
41
37
8
Hea
d S
tart
26
19
19
29
26
22
26
22
24
17
4
Hom
e / In
form
al C
are
12
61
14
99
14
61
30
11
51
28
11
71
12
96
32
Non-p
ublic
Nurs
ery
97
28
78
51
81
48
83
46
96
27
2
Pre
-Kin
de
rgarte
n1
27
80
88
12
01
17
91
12
28
61
20
67
20
Sp
ec
ial E
du
ca
tion
No
58
53
26
42
94
99
53
93
89
55
43
74
53
43
21
56
Yes
30
69
26
74
30
70
29
71
27
41
31
En
glis
h L
an
gu
ag
e L
ea
rne
rs
No
60
93
84
45
15
60
55
64
55
57
14
40
55
43
53
86
Yes
61
14
13
13
41
25
79
1
Fre
e a
nd
Red
uce
d P
rice
Mea
ls
No
46
62
39
34
03
75
41
62
99
42
92
86
43
22
27
46
Yes
14
91
56
11
51
98
15
31
60
15
41
59
12
91
35
41
Aggre
gate
d D
ata
61
53
95
45
55
73
56
94
59
58
34
45
56
13
62
87
* = G
roup s
ize fe
wer th
an 5
Calv
ert C
ou
nty
- Nu
mb
er o
f Kin
derg
arte
n S
tud
en
ts
Socia
l
Founda
tions
Physic
al
Develo
pm
ent
La
nguage a
nd
Lite
racy
Math
em
atic
sC
om
posite
B 31

Demonstrating
Not Yet
Demonstrating
Demonstrating
Not Yet
Demonstrating
Demonstrating
Not Yet
Demonstrating
Demonstrating
Not Yet
Demonstrating
Demonstrating
Approaching
Emerging
Rac
e/E
thn
icity
Am
eric
an In
dia
n/A
laskan N
ativ
e*
**
**
**
**
**
Asia
n5
05
05
05
06
33
86
33
85
02
52
5
Afric
an A
meric
an
51
49
39
61
46
54
48
52
46
42
12
Nativ
e H
aw
aiia
n/P
acific
Isla
nde
r*
**
**
**
**
**
White
63
37
46
54
58
42
58
42
58
34
8
His
panic
49
51
35
65
63
37
67
33
49
45
6
Tw
o o
r More
Race
s (N
on-H
ispanic
/La
tino)
62
38
44
56
44
56
56
44
54
38
7
Gen
der
Male
58
42
43
57
51
49
45
55
51
38
11
Fem
ale
64
36
46
54
61
39
70
30
61
34
6
Prio
r Care
Child
Care
Cente
r6
33
74
25
85
44
65
84
25
43
97
Fam
ily C
hild
Care
52
48
45
55
53
47
49
51
48
43
9
Hea
d S
tart
58
42
40
60
54
46
54
46
53
38
9
Hom
e / In
form
al C
are
53
48
40
60
53
47
52
48
47
40
13
Non-p
ublic
Nurs
ery
78
22
60
40
63
37
64
36
77
22
2
Pre
-Kin
de
rgarte
n6
13
94
25
85
64
45
94
15
83
21
0
Sp
ec
ial E
du
ca
tion
No
64
36
46
54
58
42
60
40
59
35
6
Yes
30
70
26
74
30
70
29
71
27
41
31
En
glis
h L
an
gu
ag
e L
ea
rne
rs
No
61
39
45
55
55
45
56
44
56
36
9
Yes
35
65
24
76
76
24
71
29
41
53
6
Fre
e a
nd
Red
uce
d P
rice
Mea
ls
No
66
34
48
52
58
42
60
40
61
32
7
Yes
49
51
37
63
49
51
49
51
42
44
13
Aggre
gate
d D
ata
61
39
44
56
55
45
57
43
56
36
9
* = P
erc
enta
ge c
ould
not b
e re
porte
d d
ue to
gro
up s
ize fe
wer th
an 5
Socia
l
Founda
tions
Physic
al
Develo
pm
ent
Com
posite
Calv
ert C
ou
nty
- Perc
en
tag
e o
f Kin
derg
arte
n S
tud
en
ts
La
nguage a
nd
Lite
racy
Math
em
atic
s
B 32
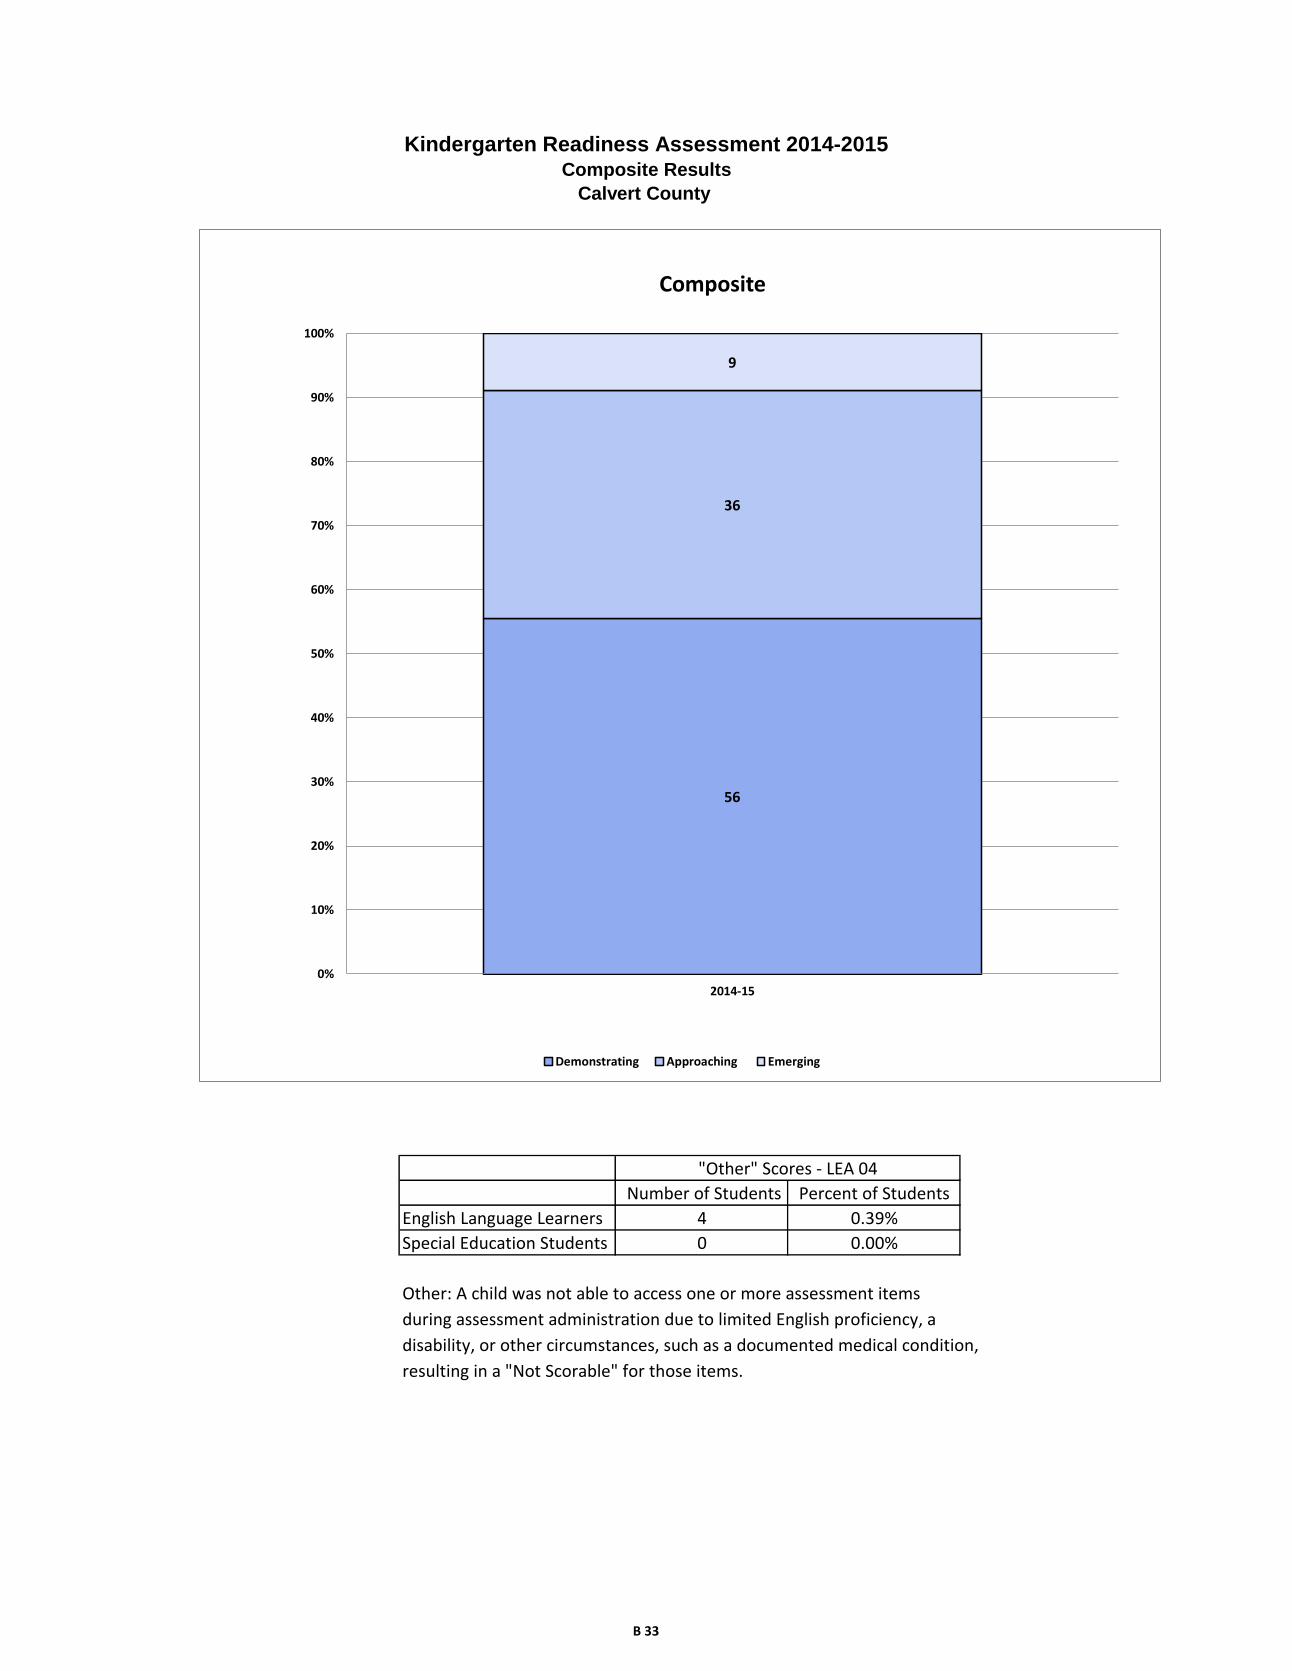
Other: A child was not able to access one or more assessment items
during assessment administration due to limited English proficiency, a
disability, or other circumstances, such as a documented medical condition,
resulting in a "Not Scorable" for those items.
"Other" Scores - LEA 04
Number of Students Percent of Students
Kindergarten Readiness Assessment 2014-2015Composite Results
Calvert County
English Language Learners 4 0.39%
Special Education Students 0 0.00%
56
36
9
0%
10%
20%
30%
40%
50%
60%
70%
80%
90%
100%
2014-15
Composite
Demonstrating Approaching Emerging
B 33
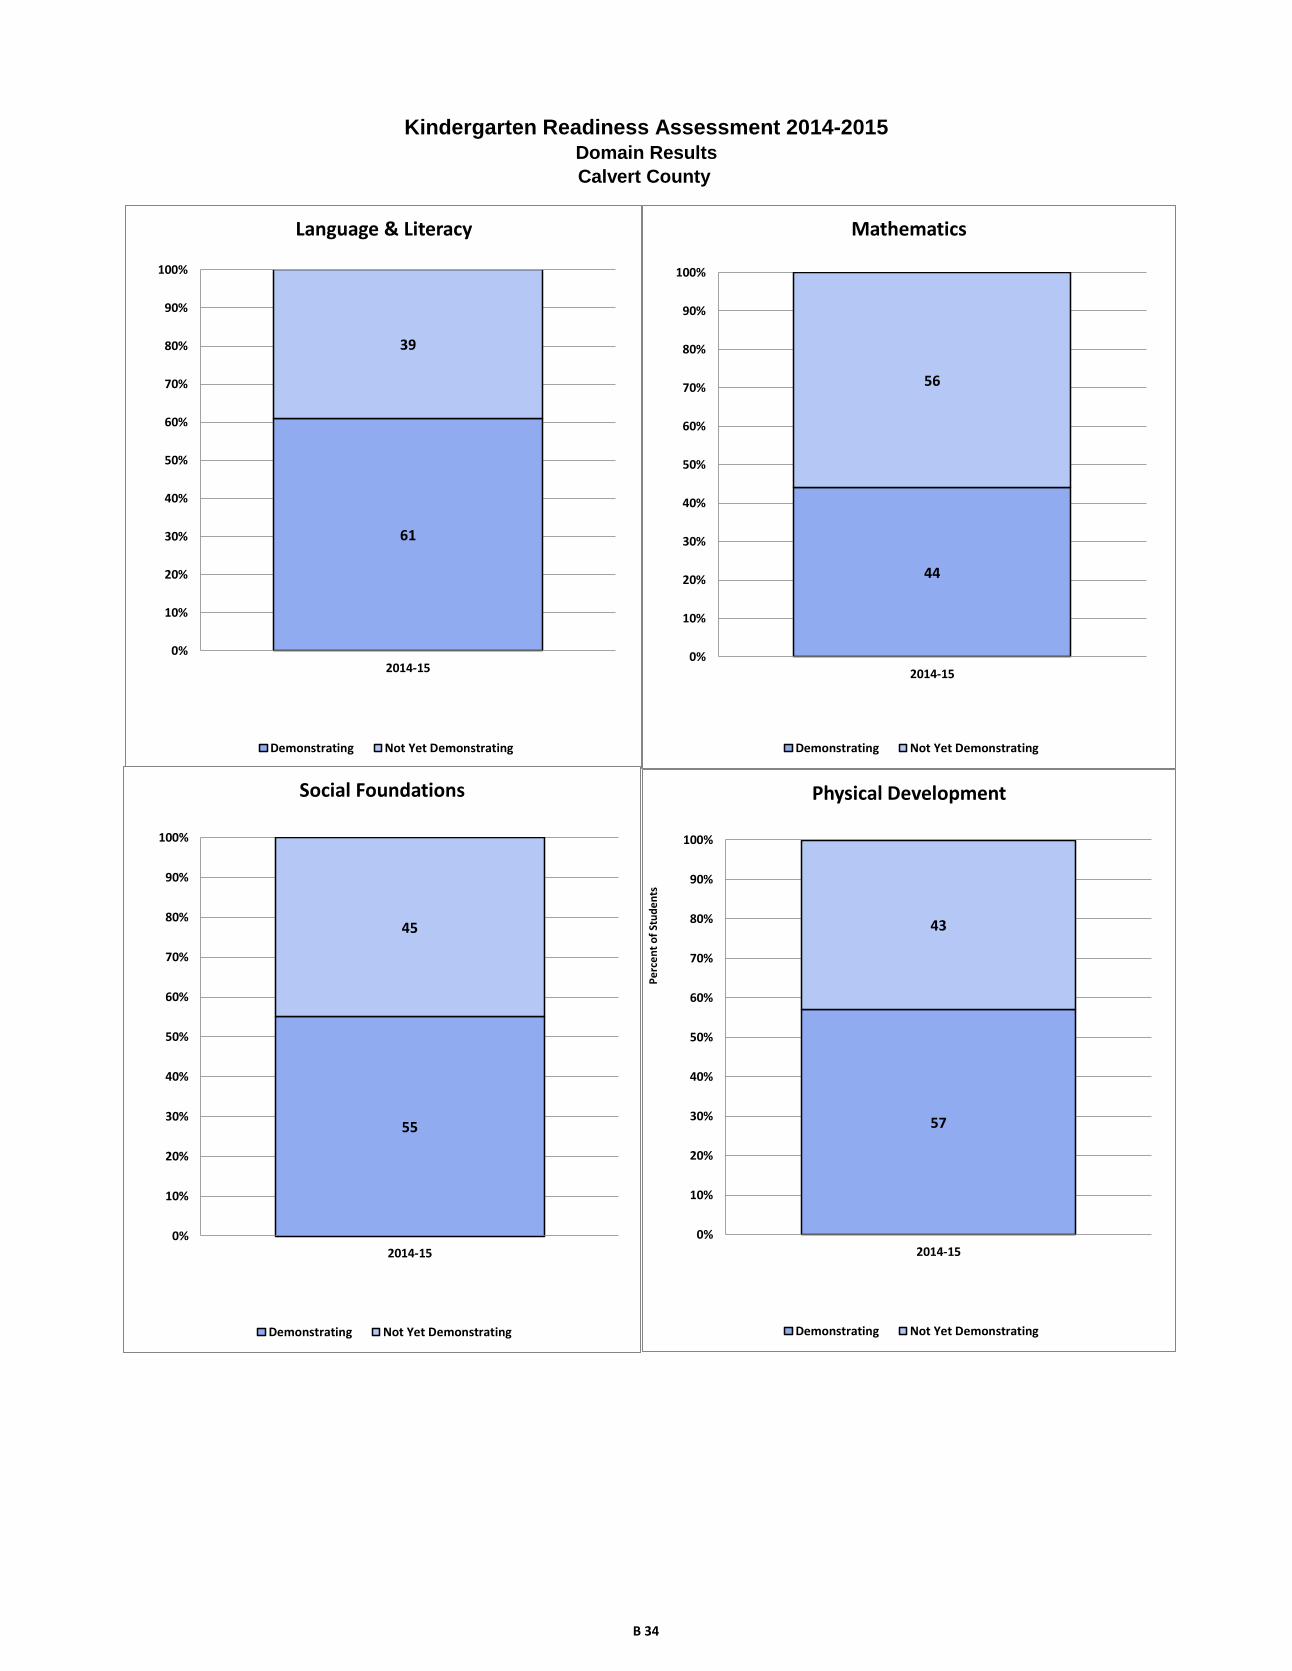
Kindergarten Readiness Assessment 2014-2015Domain Results
Calvert County
61
39
0%
10%
20%
30%
40%
50%
60%
70%
80%
90%
100%
2014-15
Language & Literacy
Demonstrating Not Yet Demonstrating
44
56
0%
10%
20%
30%
40%
50%
60%
70%
80%
90%
100%
2014-15
Mathematics
Demonstrating Not Yet Demonstrating
55
45
0%
10%
20%
30%
40%
50%
60%
70%
80%
90%
100%
2014-15
Social Foundations
Demonstrating Not Yet Demonstrating
57
43
0%
10%
20%
30%
40%
50%
60%
70%
80%
90%
100%
2014-15
Physical Development
Demonstrating Not Yet Demonstrating
Pe
rce
nt
of
Stu
de
nts
B 34

Frequency Percent
Males 208 53.06
Females 184 46.94
Frequency Percent
American Indian/Alaska Native 0 0.00
Asian 5 1.28
Black/African American 48 12.24
Native Hawaiian/Other Pacific Islander 0 0.00
White 246 62.76
Hispanic/Latino 60 15.31
Two or More Races (Non-Hispanic/Latino) 33 8.42
Frequency Percent
No 225 57.40
Yes 167 42.60
Frequency Percent
No 349 89.03
Yes 43 10.97
Frequency Percent
No 353 90.05
Yes 39 9.95
Frequency Percent
Head Start 14 3.57
Prekindergarten 289 73.72
Child Care Center 14 3.57
Family Child Care 10 2.55
Home/Informal Care 41 10.46
Non-Public Nursery School 23 5.87
Repeated Kindergarten 1 0.26
Free & Reduced Priced Meals
Special Education
English Language Learners
Predominant Prior Care
Final Record Count for KRA Data File 392
Kindergarten Readiness Assessment
Caroline County Data File Summary 2014-2015
Gender
Ethnicity/Race
B 35

Demonstrating
Not Yet
Demonstrating
Demonstrating
Not Yet
Demonstrating
Demonstrating
Not Yet
Demonstrating
Demonstrating
Not Yet
Demonstrating
Demonstrating
Approaching
Emerging
Rac
e/E
thn
icity
Am
eric
an In
dia
n/A
laskan N
ativ
e*
**
**
**
**
**
Asia
n2
31
42
33
22
21
Afric
an A
meric
an
16
32
10
38
29
19
28
20
21
20
7
Nativ
e H
aw
aiia
n/P
acific
Isla
nde
r*
**
**
**
**
**
White
15
69
01
10
13
61
91
55
16
77
91
64
60
22
His
panic
11
49
12
48
28
32
31
29
13
29
18
Tw
o o
r More
Race
s (N
on-H
ispanic
/La
tino)
18
15
92
42
11
12
31
01
89
5
Gen
der
Male
95
11
37
01
38
12
97
81
11
97
97
73
37
Fem
ale
10
87
67
21
12
14
24
21
41
43
12
14
71
6
Prio
r Care
Child
Care
Cente
r7
76
81
22
12
21
13
0
Fam
ily C
hild
Care
82
55
91
91
82
0
Hea
d S
tart
59
31
11
13
12
26
71
Hom
e / In
form
al C
are
17
24
12
29
24
17
21
20
16
14
11
Non-p
ublic
Nurs
ery
18
51
49
19
41
94
18
50
Pre
-Kin
de
rgarte
n1
48
14
11
02
18
71
96
92
17
91
10
15
98
94
0
Sp
ec
ial E
du
ca
tion
No
19
01
59
13
42
15
25
49
42
36
11
32
07
10
53
6
Yes
13
30
83
51
72
61
62
71
11
51
7
En
glis
h L
an
gu
ag
e L
ea
rne
rs
No
19
81
55
13
72
16
25
89
42
37
11
62
14
10
13
7
Yes
53
45
34
13
26
15
24
41
91
6
Fre
e a
nd
Red
uce
d P
rice
Mea
ls
No
12
89
71
01
12
41
69
55
15
76
81
40
61
23
Yes
75
92
41
12
61
02
65
95
72
78
59
30
Aggre
gate
d D
ata
20
31
89
14
22
50
27
11
20
25
21
40
21
81
20
53
* = G
roup s
ize fe
wer th
an 5
Caro
line C
ou
nty
- Nu
mb
er o
f Kin
derg
arte
n S
tud
en
ts
Socia
l
Founda
tions
Physic
al
Develo
pm
ent
La
nguage a
nd
Lite
racy
Math
em
atic
sC
om
posite
B 36

Demonstrating
Not Yet
Demonstrating
Demonstrating
Not Yet
Demonstrating
Demonstrating
Not Yet
Demonstrating
Demonstrating
Not Yet
Demonstrating
Demonstrating
Approaching
Emerging
Rac
e/E
thn
icity
Am
eric
an In
dia
n/A
laskan N
ativ
e*
**
**
**
**
**
Asia
n4
06
02
08
04
06
06
04
04
04
02
0
Afric
an A
meric
an
33
67
21
79
60
40
58
42
44
42
15
Nativ
e H
aw
aiia
n/P
acific
Isla
nde
r*
**
**
**
**
**
White
63
37
45
55
78
22
68
32
67
24
9
His
panic
18
82
20
80
47
53
52
48
22
48
30
Tw
o o
r More
Race
s (N
on-H
ispanic
/La
tino)
55
45
27
73
66
34
70
30
56
28
16
Gen
der
Male
46
54
34
66
62
38
53
47
47
35
18
Fem
ale
59
41
39
61
77
23
77
23
66
26
9
Prio
r Care
Child
Care
Cente
r5
05
04
35
78
61
48
61
47
92
10
Fam
ily C
hild
Care
80
20
50
50
90
10
90
10
80
20
0
Hea
d S
tart
36
64
21
79
79
21
86
14
43
50
7
Hom
e / In
form
al C
are
41
59
29
71
59
41
51
49
39
34
27
Non-p
ublic
Nurs
ery
78
22
61
39
83
17
83
17
78
22
0
Pre
-Kin
de
rgarte
n5
14
93
56
56
83
26
23
85
53
11
4
Sp
ec
ial E
du
ca
tion
No
54
46
38
62
73
27
68
32
59
30
10
Yes
30
70
19
81
40
60
37
63
26
35
40
En
glis
h L
an
gu
ag
e L
ea
rne
rs
No
56
44
39
61
73
27
67
33
61
29
11
Yes
13
87
13
87
33
67
38
62
10
49
41
Fre
e a
nd
Red
uce
d P
rice
Mea
ls
No
57
43
45
55
75
25
70
30
63
27
10
Yes
45
55
25
75
61
39
57
43
47
35
18
Aggre
gate
d D
ata
52
48
36
64
69
31
64
36
56
31
13
* = P
erc
enta
ge c
ould
not b
e re
porte
d d
ue to
gro
up s
ize le
ss th
an 5
Caro
line C
ou
nty
- Perc
en
tag
e o
f Kin
derg
arte
n S
tud
en
ts
Socia
l
Founda
tions
Physic
al
Develo
pm
ent
Com
posite
La
nguage a
nd
Lite
racy
Math
em
atic
s
B 37
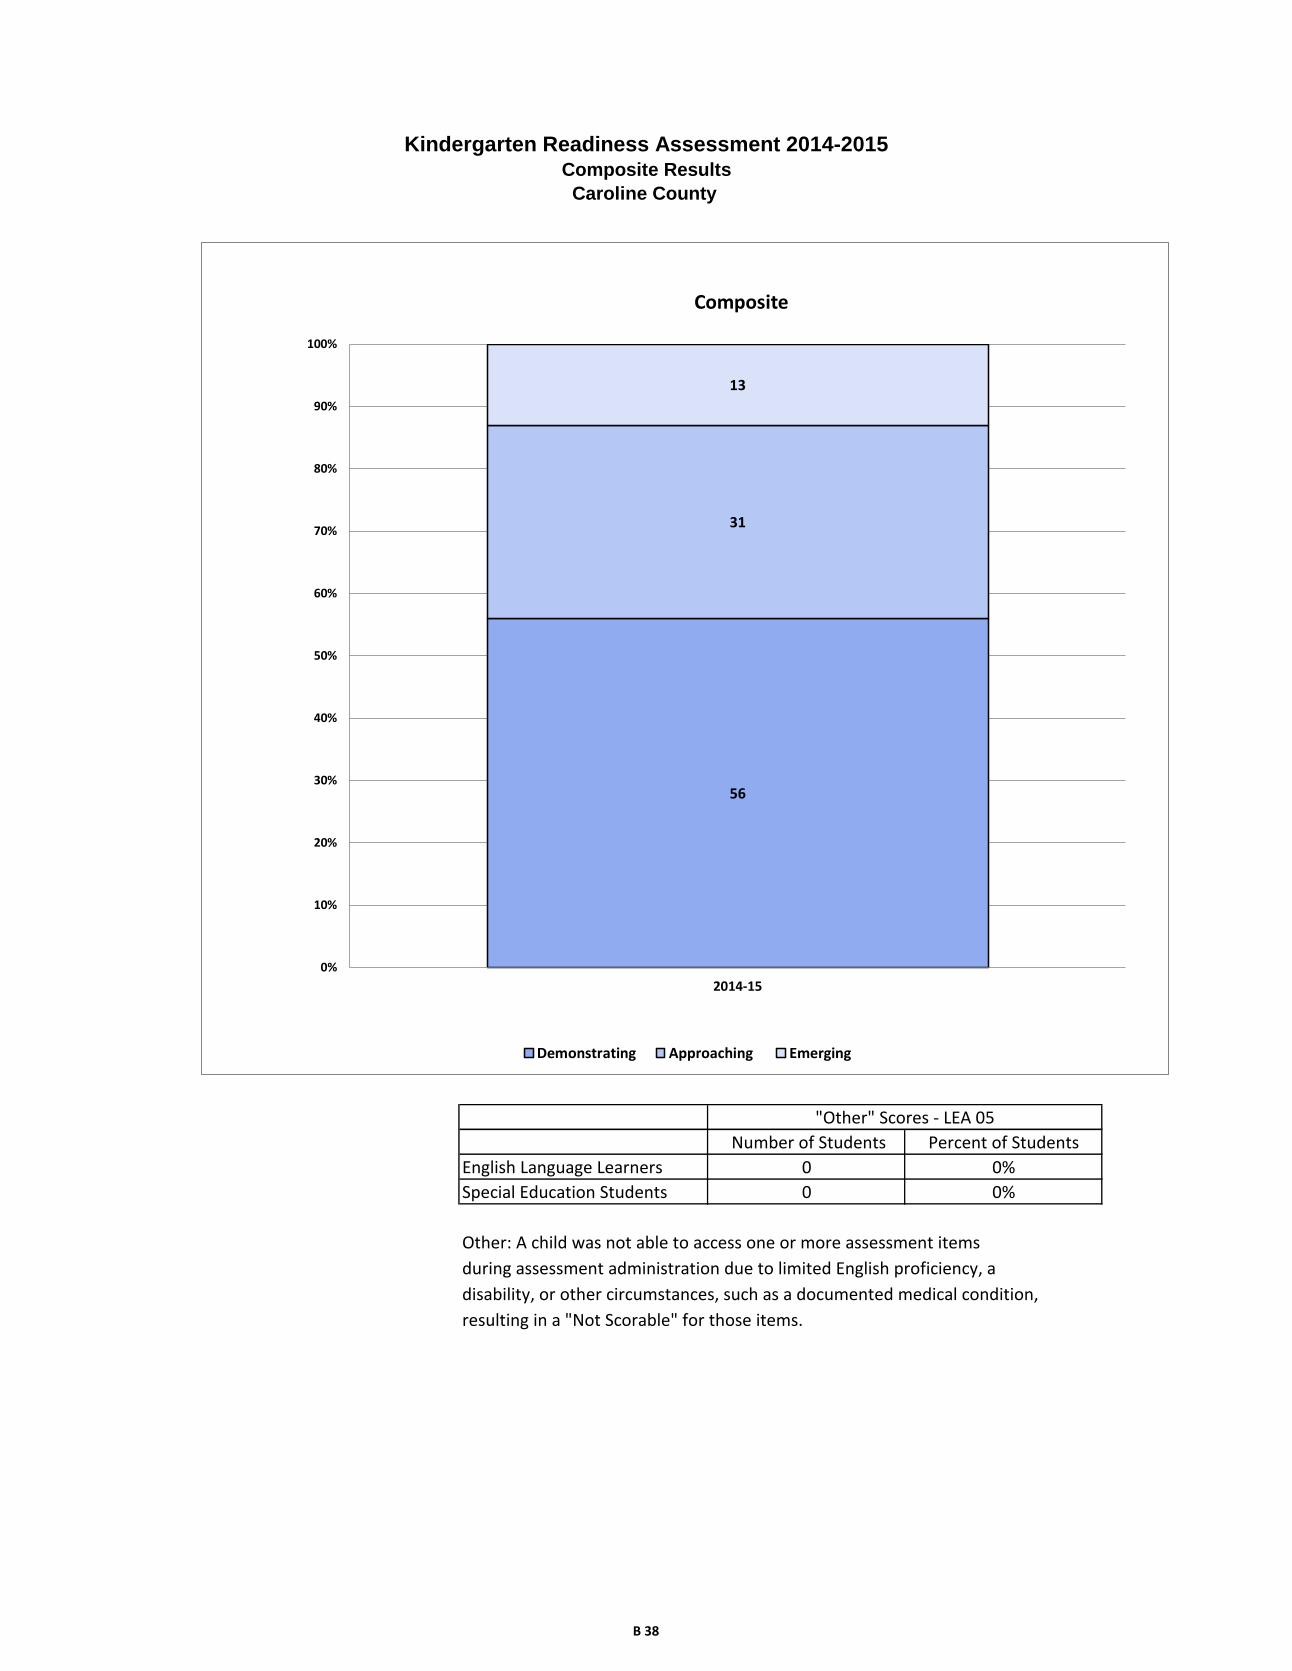
Other: A child was not able to access one or more assessment items
during assessment administration due to limited English proficiency, a
disability, or other circumstances, such as a documented medical condition,
resulting in a "Not Scorable" for those items.
"Other" Scores - LEA 05
Number of Students Percent of Students
Kindergarten Readiness Assessment 2014-2015Composite Results
English Language Learners 0 0%
Special Education Students 0 0%
Caroline County
56
31
13
0%
10%
20%
30%
40%
50%
60%
70%
80%
90%
100%
2014-15
Composite
Demonstrating Approaching Emerging
B 38
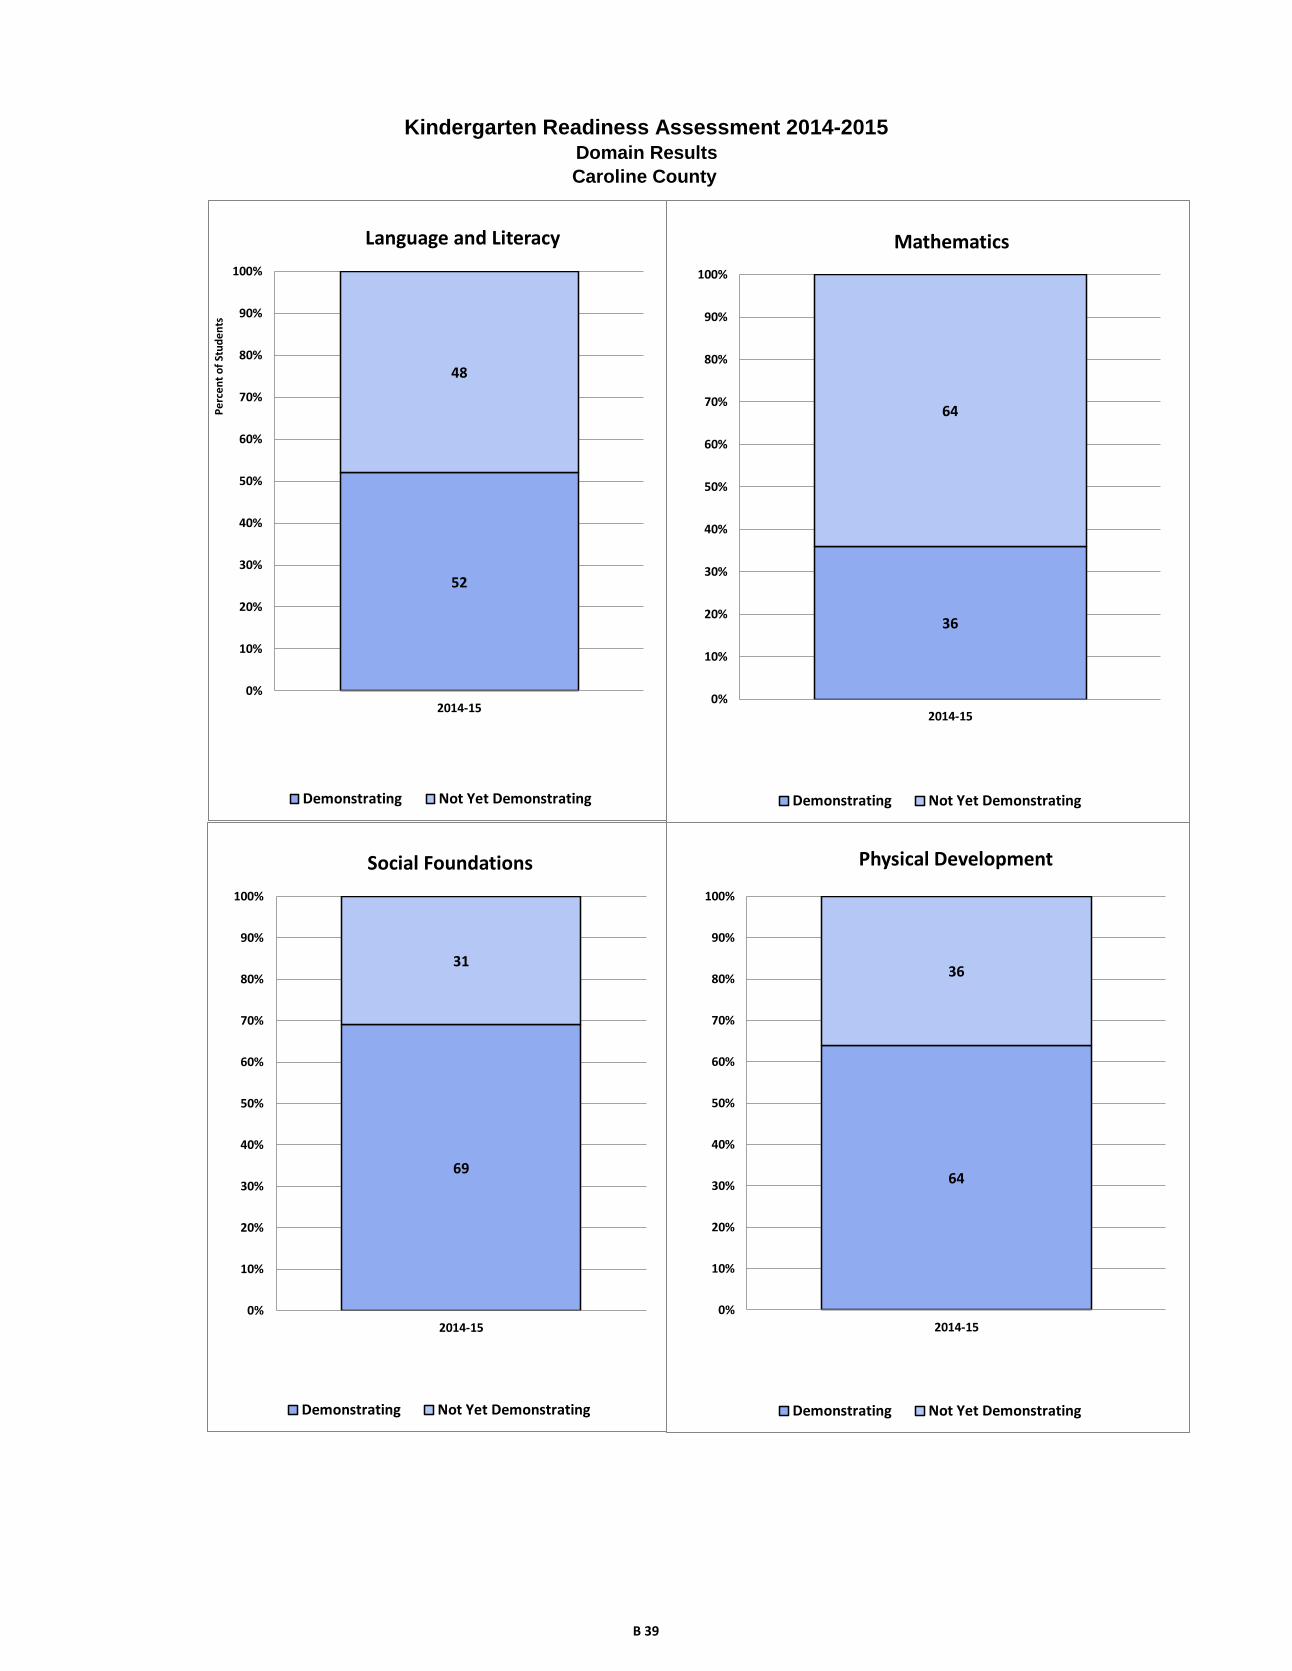
Kindergarten Readiness Assessment 2014-2015Domain Results
Caroline County
52
48
0%
10%
20%
30%
40%
50%
60%
70%
80%
90%
100%
2014-15
Language and Literacy
Demonstrating Not Yet Demonstrating
Pe
rce
nt
of
Stu
de
nts
36
64
0%
10%
20%
30%
40%
50%
60%
70%
80%
90%
100%
2014-15
Mathematics
Demonstrating Not Yet Demonstrating
69
31
0%
10%
20%
30%
40%
50%
60%
70%
80%
90%
100%
2014-15
Social Foundations
Demonstrating Not Yet Demonstrating
64
36
0%
10%
20%
30%
40%
50%
60%
70%
80%
90%
100%
2014-15
Physical Development
Demonstrating Not Yet Demonstrating
B 39

Frequency Percent
Males 877 52.36
Females 798 47.64
Frequency Percent
American Indian/Alaska Native 1 0.06
Asian 37 2.21
Black/African American 68 4.06
Native Hawaiian/Other Pacific Islander 3 0.18
White 1407 84.00
Hispanic/Latino 116 6.93
Two or More Races (Non-Hispanic/Latino) 43 2.57
Frequency Percent
No 1381 82.45
Yes 294 17.55
Frequency Percent
No 1500 89.55
Yes 175 10.45
Frequency Percent
No 1625 97.01
Yes 50 2.99
Frequency Percent
Head Start 68 4.06
Prekindergarten 339 20.24
Child Care Center 404 24.12
Family Child Care 63 3.76
Home/Informal Care 151 9.01
Non-Public Nursery School 628 37.49
Repeated Kindergarten 22 1.31
Special Education
English Language Learners
Predominant Prior Care
Final Record Count for KRA Data File 1675
Kindergarten Readiness Assessment
Carroll County Data File Summary 2014-2015
Gender
Ethnicity/Race
Free & Reduced Priced Meals
B 40

Demonstrating
Not Yet
Demonstrating
Demonstrating
Not Yet
Demonstrating
Demonstrating
Not Yet
Demonstrating
Demonstrating
Not Yet
Demonstrating
Demonstrating
Approaching
Emerging
Rac
e/E
thn
icity
Am
eric
an In
dia
n/A
laskan N
ativ
e*
**
**
**
**
**
Asia
n1
52
11
81
91
81
92
21
51
51
29
Afric
an A
meric
an
30
36
28
39
33
35
37
31
29
26
11
Nativ
e H
aw
aiia
n/P
acific
Isla
nde
r*
**
**
**
**
**
White
84
75
49
79
46
04
87
65
24
87
75
24
87
14
10
11
2
His
panic
34
78
32
80
53
58
65
47
35
60
16
Tw
o o
r More
Race
s (N
on-H
ispanic
/La
tino)
22
21
20
23
24
19
26
17
24
12
7
Gen
der
Male
46
14
08
44
34
28
45
74
16
44
64
27
45
33
09
10
4
Fem
ale
48
73
01
45
13
39
54
92
41
58
22
10
52
32
11
53
Prio
r Care
Child
Care
Cente
r2
57
14
62
46
15
72
51
15
22
58
14
52
64
11
22
7
Fam
ily C
hild
Care
39
24
36
27
43
20
43
20
40
17
6
Hea
d S
tart
19
47
14
52
26
40
29
37
18
28
20
Hom
e / In
form
al C
are
58
88
66
82
70
78
82
66
62
57
27
Non-p
ublic
Nurs
ery
42
22
04
39
92
26
43
11
94
43
11
95
44
11
56
26
Pre
-Kin
de
rgarte
n1
46
18
51
30
20
41
76
16
01
76
16
11
44
13
94
7
Sp
ec
ial E
du
ca
tion
No
89
06
00
84
96
41
94
75
42
96
75
24
92
64
52
10
8
Yes
58
10
94
51
26
59
11
56
11
13
50
68
49
En
glis
h L
an
gu
ag
e L
ea
rne
rs
No
94
56
65
88
77
26
98
96
27
99
96
18
97
34
88
14
6
Yes
34
47
41
17
30
29
19
33
21
1
Fre
e a
nd
Red
uce
d P
rice
Mea
ls
No
82
95
39
78
85
82
85
95
11
87
74
95
85
73
99
10
8
Yes
11
91
70
10
61
85
14
71
46
15
11
42
11
91
21
49
Aggre
gate
d D
ata
94
87
09
89
47
67
1,0
06
65
71,0
28
63
79
76
52
01
57
* = G
roup s
ize fe
wer th
an 5
Carro
ll Co
un
ty - N
um
ber o
f Kin
derg
arte
n S
tud
en
ts
Socia
l
Founda
tions
Physic
al
Develo
pm
ent
La
nguage a
nd
Lite
racy
Math
em
atic
sC
om
posite
B 41

Demonstrating
Not Yet
Demonstrating
Demonstrating
Not Yet
Demonstrating
Demonstrating
Not Yet
Demonstrating
Demonstrating
Not Yet
Demonstrating
Demonstrating
Approaching
Emerging
Rac
e/E
thn
icity
Am
eric
an In
dia
n/A
laskan N
ativ
e*
**
**
**
**
**
Asia
n4
25
84
95
14
95
15
94
14
23
32
5
Afric
an A
meric
an
45
55
42
58
49
51
54
46
44
39
17
Nativ
e H
aw
aiia
n/P
acific
Isla
nde
r*
**
**
**
**
**
White
61
39
57
43
63
37
63
37
63
29
8
His
panic
30
70
29
71
48
52
58
42
32
54
14
Tw
o o
r More
Race
s (N
on-H
ispanic
/La
tino)
51
49
47
53
56
44
60
40
56
28
16
Gen
der
Male
53
47
51
49
52
48
51
49
52
36
12
Fem
ale
62
38
57
43
69
31
73
27
66
27
7
Prio
r Care
Child
Care
Cente
r6
43
66
13
96
23
86
43
66
62
87
Fam
ily C
hild
Care
62
38
57
43
68
32
68
32
63
27
10
Hea
d S
tart
29
71
21
79
39
61
44
56
27
42
30
Hom
e / In
form
al C
are
40
60
45
55
47
53
55
45
42
39
18
Non-p
ublic
Nurs
ery
67
33
64
36
69
31
69
31
71
25
4
Pre
-Kin
de
rgarte
n4
45
63
96
15
24
85
24
84
44
21
4
Sp
ec
ial E
du
ca
tion
No
60
40
57
43
64
36
65
35
62
30
7
Yes
35
65
26
74
34
66
35
65
30
41
29
En
glis
h L
an
gu
ag
e L
ea
rne
rs
No
59
41
55
45
61
39
62
38
61
30
9
Yes
69
41
58
53
66
46
04
07
70
24
Fre
e a
nd
Red
uce
d P
rice
Mea
ls
No
61
39
58
42
63
37
64
36
63
29
8
Yes
41
59
36
64
50
50
52
48
41
42
17
Aggre
gate
d D
ata
57
43
54
46
60
40
62
38
59
31
9
* = P
erc
enta
ge c
ould
not b
e re
porte
d d
ue to
gro
up s
ize fe
wer th
an 5
Carro
ll Co
un
ty - P
erc
en
tag
e o
f Kin
derg
arte
n S
tud
en
ts
Socia
l
Founda
tions
Physic
al
Develo
pm
ent
Com
posite
La
nguage a
nd
Lite
racy
Math
em
atic
s
B 42
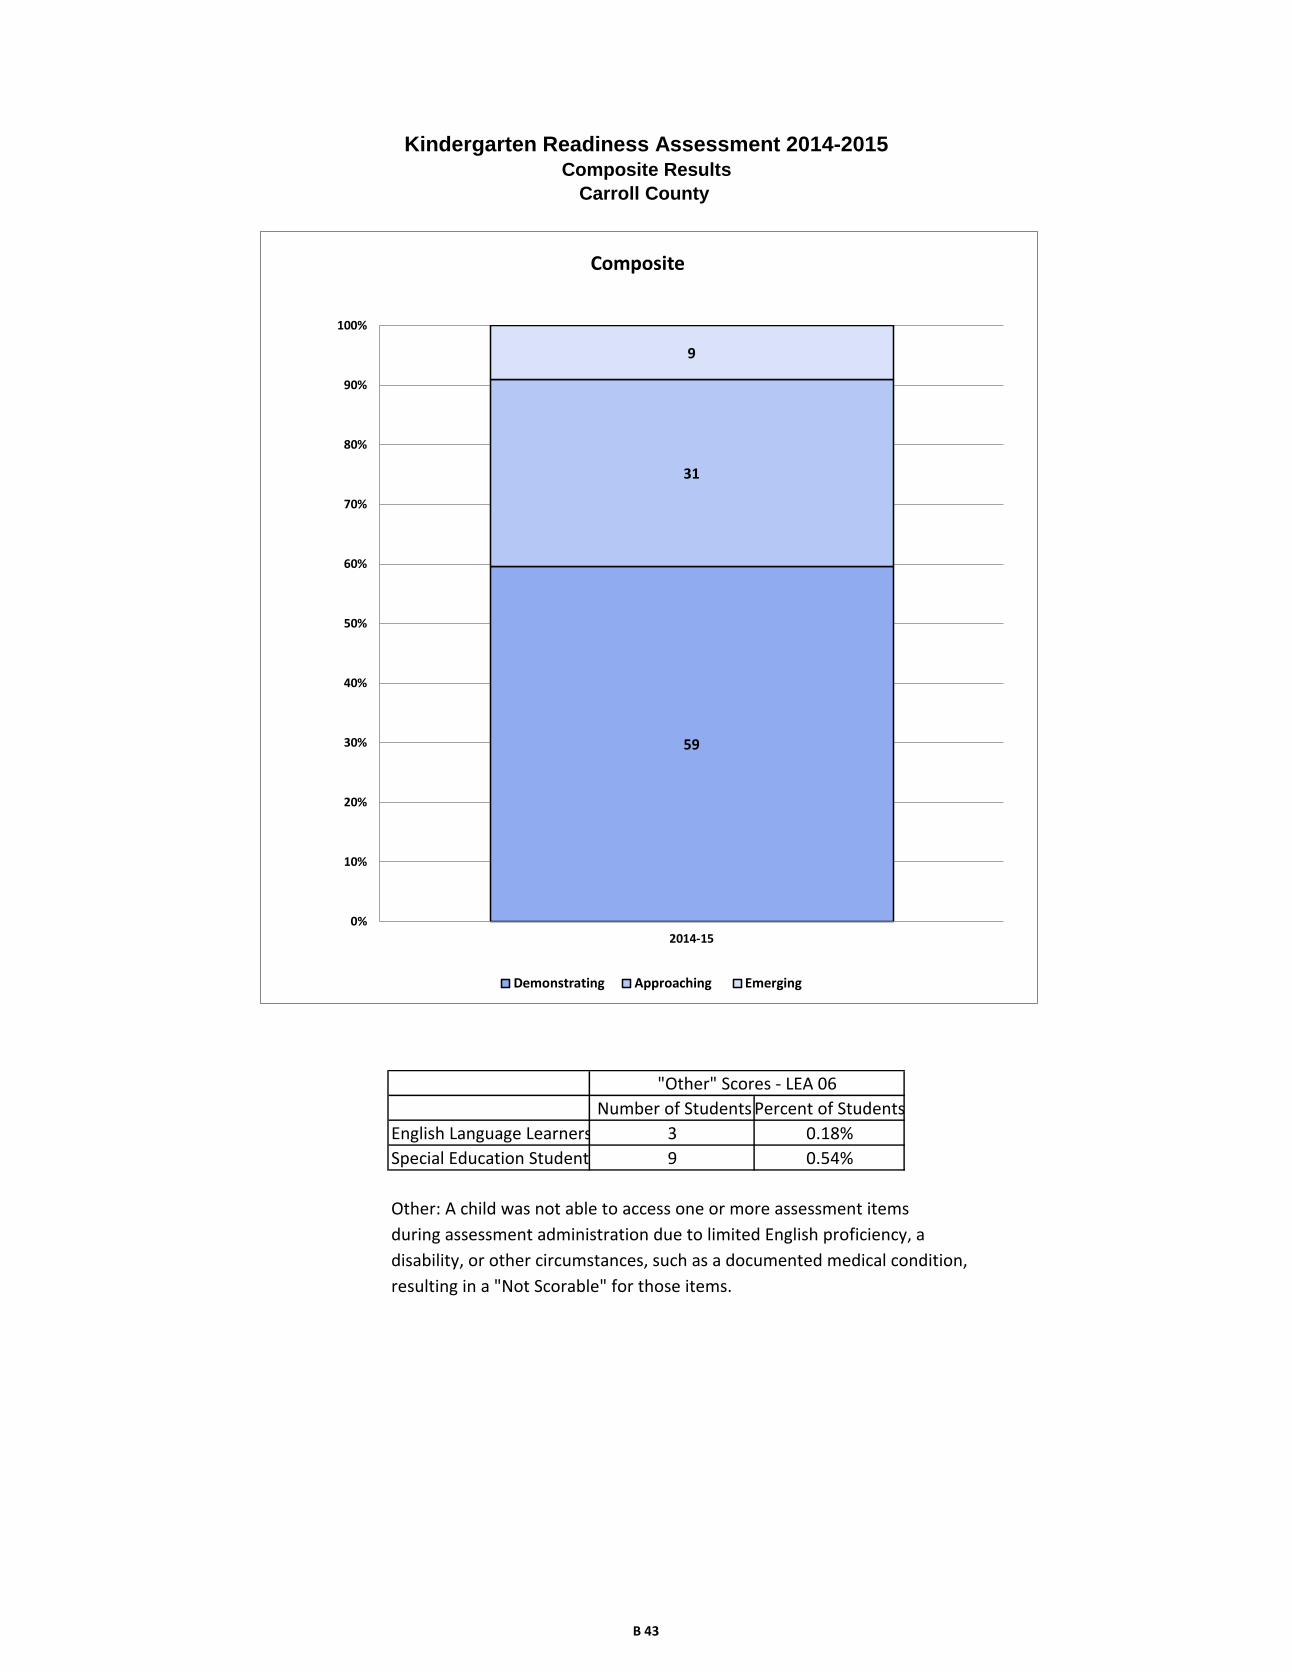
Other: A child was not able to access one or more assessment items
during assessment administration due to limited English proficiency, a
disability, or other circumstances, such as a documented medical condition,
resulting in a "Not Scorable" for those items.
Kindergarten Readiness Assessment 2014-2015Composite Results
Carroll County
0.18%
Special Education Students 9 0.54%
"Other" Scores - LEA 06
Number of Students Percent of Students
English Language Learners 3
59
31
9
0%
10%
20%
30%
40%
50%
60%
70%
80%
90%
100%
2014-15
Composite
Demonstrating Approaching Emerging
B 43
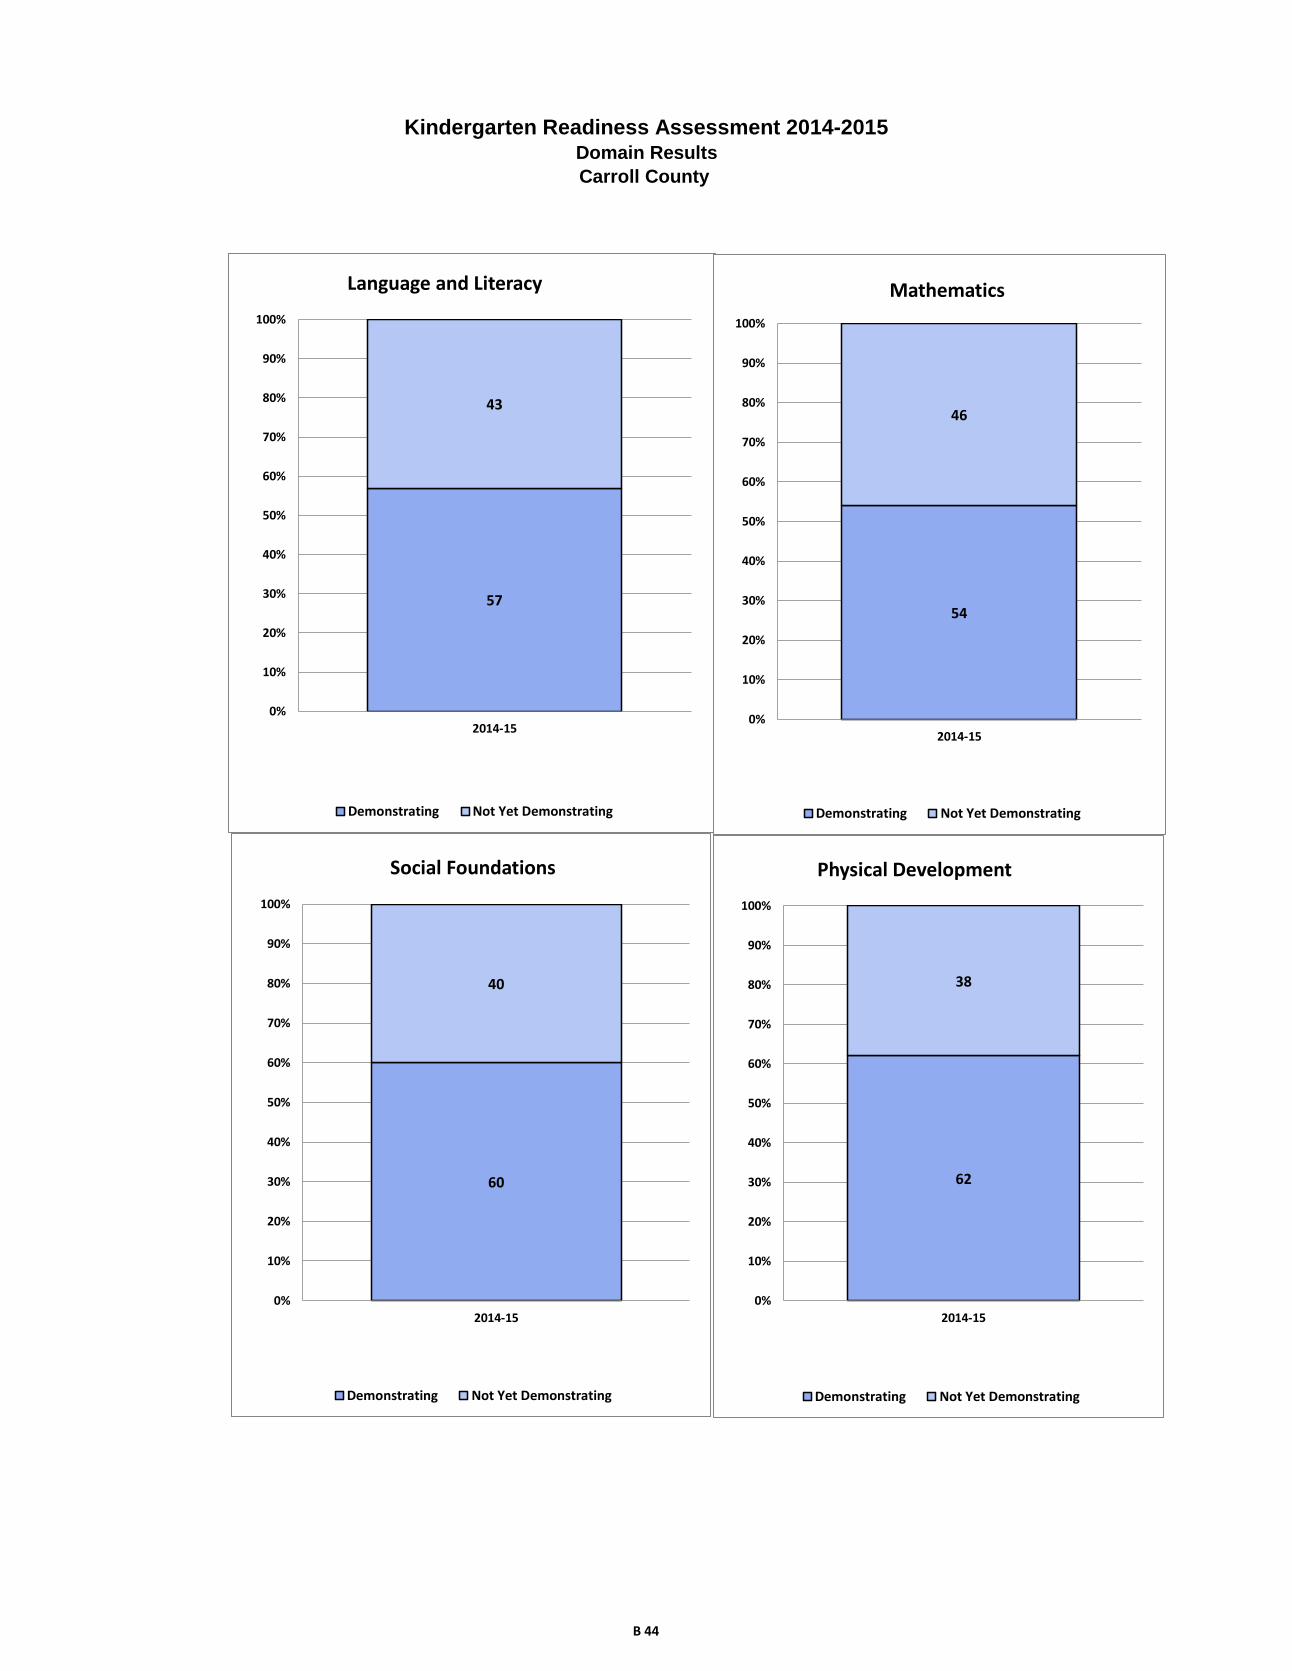
Kindergarten Readiness Assessment 2014-2015Domain Results
Carroll County
57
43
0%
10%
20%
30%
40%
50%
60%
70%
80%
90%
100%
2014-15
Language and Literacy
Demonstrating Not Yet Demonstrating
54
46
0%
10%
20%
30%
40%
50%
60%
70%
80%
90%
100%
2014-15
Mathematics
Demonstrating Not Yet Demonstrating
60
40
0%
10%
20%
30%
40%
50%
60%
70%
80%
90%
100%
2014-15
Social Foundations
Demonstrating Not Yet Demonstrating
62
38
0%
10%
20%
30%
40%
50%
60%
70%
80%
90%
100%
2014-15
Physical Development
Demonstrating Not Yet Demonstrating
B 44
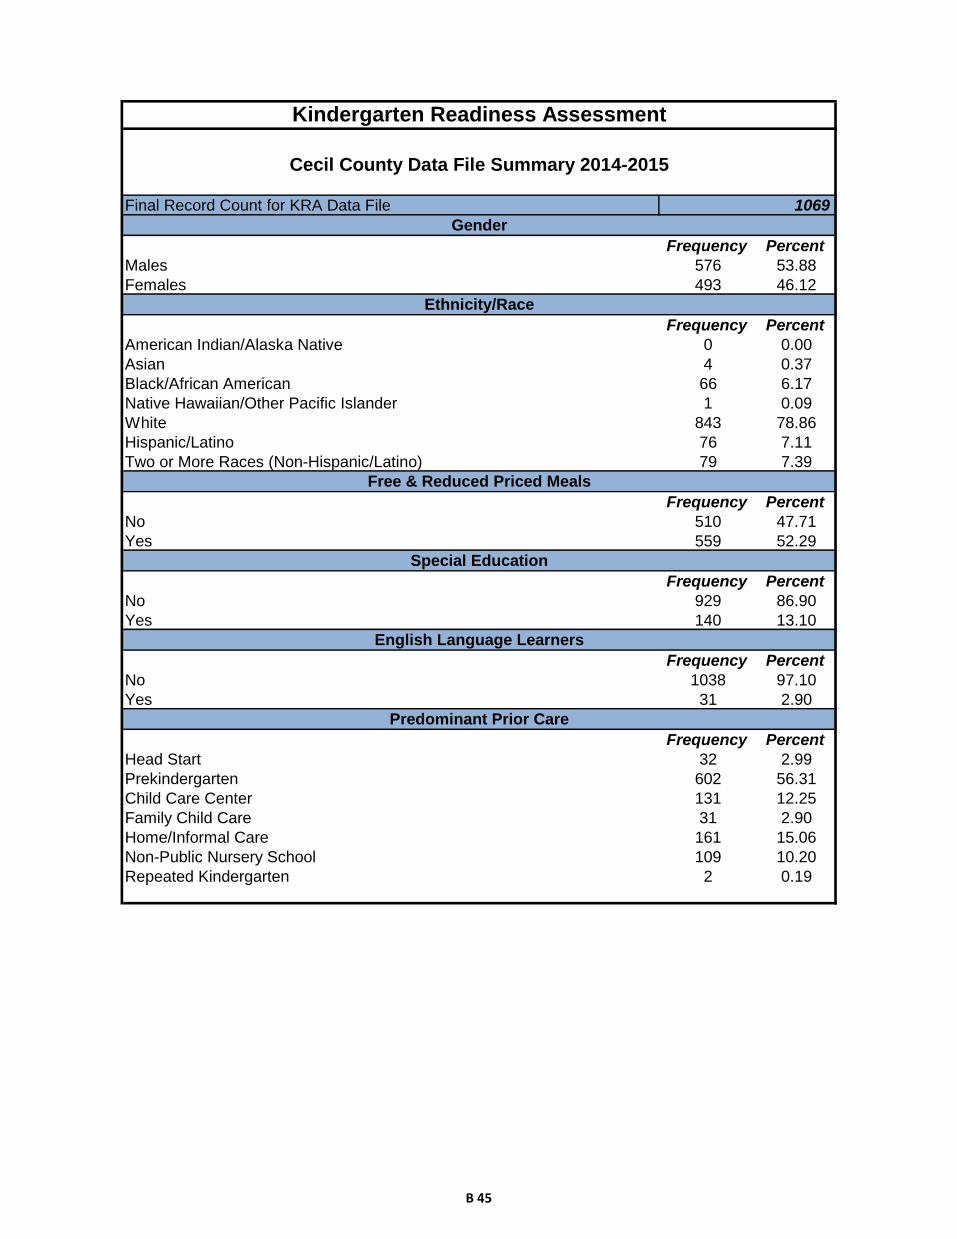
Frequency Percent
Males 576 53.88
Females 493 46.12
Frequency Percent
American Indian/Alaska Native 0 0.00
Asian 4 0.37
Black/African American 66 6.17
Native Hawaiian/Other Pacific Islander 1 0.09
White 843 78.86
Hispanic/Latino 76 7.11
Two or More Races (Non-Hispanic/Latino) 79 7.39
Frequency Percent
No 510 47.71
Yes 559 52.29
Frequency Percent
No 929 86.90
Yes 140 13.10
Frequency Percent
No 1038 97.10
Yes 31 2.90
Frequency Percent
Head Start 32 2.99
Prekindergarten 602 56.31
Child Care Center 131 12.25
Family Child Care 31 2.90
Home/Informal Care 161 15.06
Non-Public Nursery School 109 10.20
Repeated Kindergarten 2 0.19
Kindergarten Readiness Assessment
Cecil County Data File Summary 2014-2015
Gender
Ethnicity/Race
Free & Reduced Priced Meals
Special Education
English Language Learners
Predominant Prior Care
Final Record Count for KRA Data File 1069
B 45

Demonstrating
Not Yet
Demonstrating
Demonstrating
Not Yet
Demonstrating
Demonstrating
Not Yet
Demonstrating
Demonstrating
Not Yet
Demonstrating
Demonstrating
Approaching
Emerging
Rac
e/E
thn
icity
Am
eric
an In
dia
n/A
laskan N
ativ
e*
**
**
**
**
**
Asia
n*
**
**
**
**
**
Afric
an A
meric
an
26
39
11
54
22
42
26
39
18
26
20
Nativ
e H
aw
aiia
n/P
acific
Isla
nde
r*
**
**
**
**
**
White
38
34
54
25
65
83
41
24
27
43
14
08
36
33
38
13
5
His
panic
19
55
11
63
34
40
33
41
22
28
24
Tw
o o
r More
Race
s (N
on-H
ispanic
/La
tino)
38
40
21
56
43
35
47
30
38
22
17
Gen
der
Male
22
03
50
13
74
35
23
13
39
22
63
45
19
32
42
13
3
Fem
ale
24
72
42
16
33
25
28
12
09
31
41
75
24
91
74
65
Prio
r Care
Child
Care
Cente
r6
26
94
58
66
66
47
75
46
04
52
5
Fam
ily C
hild
Care
13
18
62
51
41
71
71
41
21
63
Hea
d S
tart
14
18
72
51
12
11
12
11
21
37
Hom
e / In
form
al C
are
41
11
93
01
29
59
10
06
69
34
27
24
5
Non-p
ublic
Nurs
ery
56
53
41
68
63
46
61
48
54
46
9
Pre
-Kin
de
rgarte
n2
81
31
31
71
42
42
97
29
93
07
28
82
62
22
21
09
Sp
ec
ial E
du
ca
tion
No
44
14
82
28
06
42
47
54
47
50
64
16
41
93
70
13
1
Yes
26
11
02
01
18
37
10
13
41
04
23
46
67
En
glis
h L
an
gu
ag
e L
ea
rne
rs
No
46
65
62
30
07
29
50
75
22
53
44
95
44
24
04
17
9
Yes
13
00
31
52
66
25
01
21
9
Fre
e a
nd
Red
uce
d P
rice
Mea
ls
No
26
62
42
17
93
31
28
12
29
28
32
27
25
22
03
53
Yes
20
13
50
12
14
29
23
13
19
25
72
93
19
02
13
14
5
Aggre
gate
d D
ata
46
75
92
30
07
60
51
25
48
54
05
20
44
24
16
19
8
* = G
roup s
ize fe
wer th
an 5
Cecil C
ou
nty
- Nu
mb
er o
f Kin
derg
arte
n S
tud
en
ts
Socia
l
Founda
tions
Physic
al
Develo
pm
ent
La
nguage a
nd
Lite
racy
Math
em
atic
sC
om
posite
B 46

Demonstrating
Not Yet
Demonstrating
Demonstrating
Not Yet
Demonstrating
Demonstrating
Not Yet
Demonstrating
Demonstrating
Not Yet
Demonstrating
Demonstrating
Approaching
Emerging
Rac
e/E
thn
icity
Am
eric
an In
dia
n/A
laskan N
ativ
e*
**
**
**
**
**
Asia
n*
**
**
**
**
**
Afric
an A
meric
an
40
60
17
83
34
66
40
60
28
41
31
Nativ
e H
aw
aiia
n/P
acific
Isla
nde
r*
**
**
**
**
**
White
46
54
31
69
49
51
51
49
43
40
16
His
panic
26
74
15
85
46
54
45
55
30
38
32
Tw
o o
r More
Race
s (N
on-H
ispanic
/La
tino)
49
51
27
73
55
45
61
39
49
29
22
Gen
der
Male
39
61
24
76
41
59
40
60
34
43
23
Fem
ale
51
49
33
67
57
43
64
36
51
36
13
Prio
r Care
Child
Care
Cente
r4
75
33
46
65
14
95
94
14
63
51
9
Fam
ily C
hild
Care
42
58
19
81
45
55
55
45
39
52
10
Hea
d S
tart
44
56
22
78
34
66
34
66
38
41
22
Hom
e / In
form
al C
are
26
74
19
81
37
63
42
58
26
45
28
Non-p
ublic
Nurs
ery
51
49
38
62
58
42
56
44
50
42
8
Pre
-Kin
de
rgarte
n4
75
32
97
15
05
05
24
84
43
71
8
Sp
ec
ial E
du
ca
tion
No
48
52
30
70
52
48
55
45
46
40
14
Yes
19
81
14
86
27
73
25
75
17
34
49
En
glis
h L
an
gu
ag
e L
ea
rne
rs
No
45
55
29
71
49
51
52
48
43
39
17
Yes
39
70
10
01
68
41
98
10
39
61
Fre
e a
nd
Red
uce
d P
rice
Mea
ls
No
52
48
35
65
55
45
55
45
50
40
10
Yes
36
64
22
78
42
58
47
53
35
39
26
Aggre
gate
d D
ata
44
56
28
72
48
52
51
49
42
39
19
* = P
erc
enta
ge c
ould
not b
e re
porte
d d
ue to
gro
up s
ize fe
wer th
an 5
Socia
l
Founda
tions
Physic
al
Develo
pm
ent
Com
posite
Cecil C
ou
nty
- Perc
en
tag
e o
f Kin
derg
arte
n S
tud
en
ts
La
nguage a
nd
Lite
racy
Math
em
atic
s
B 47
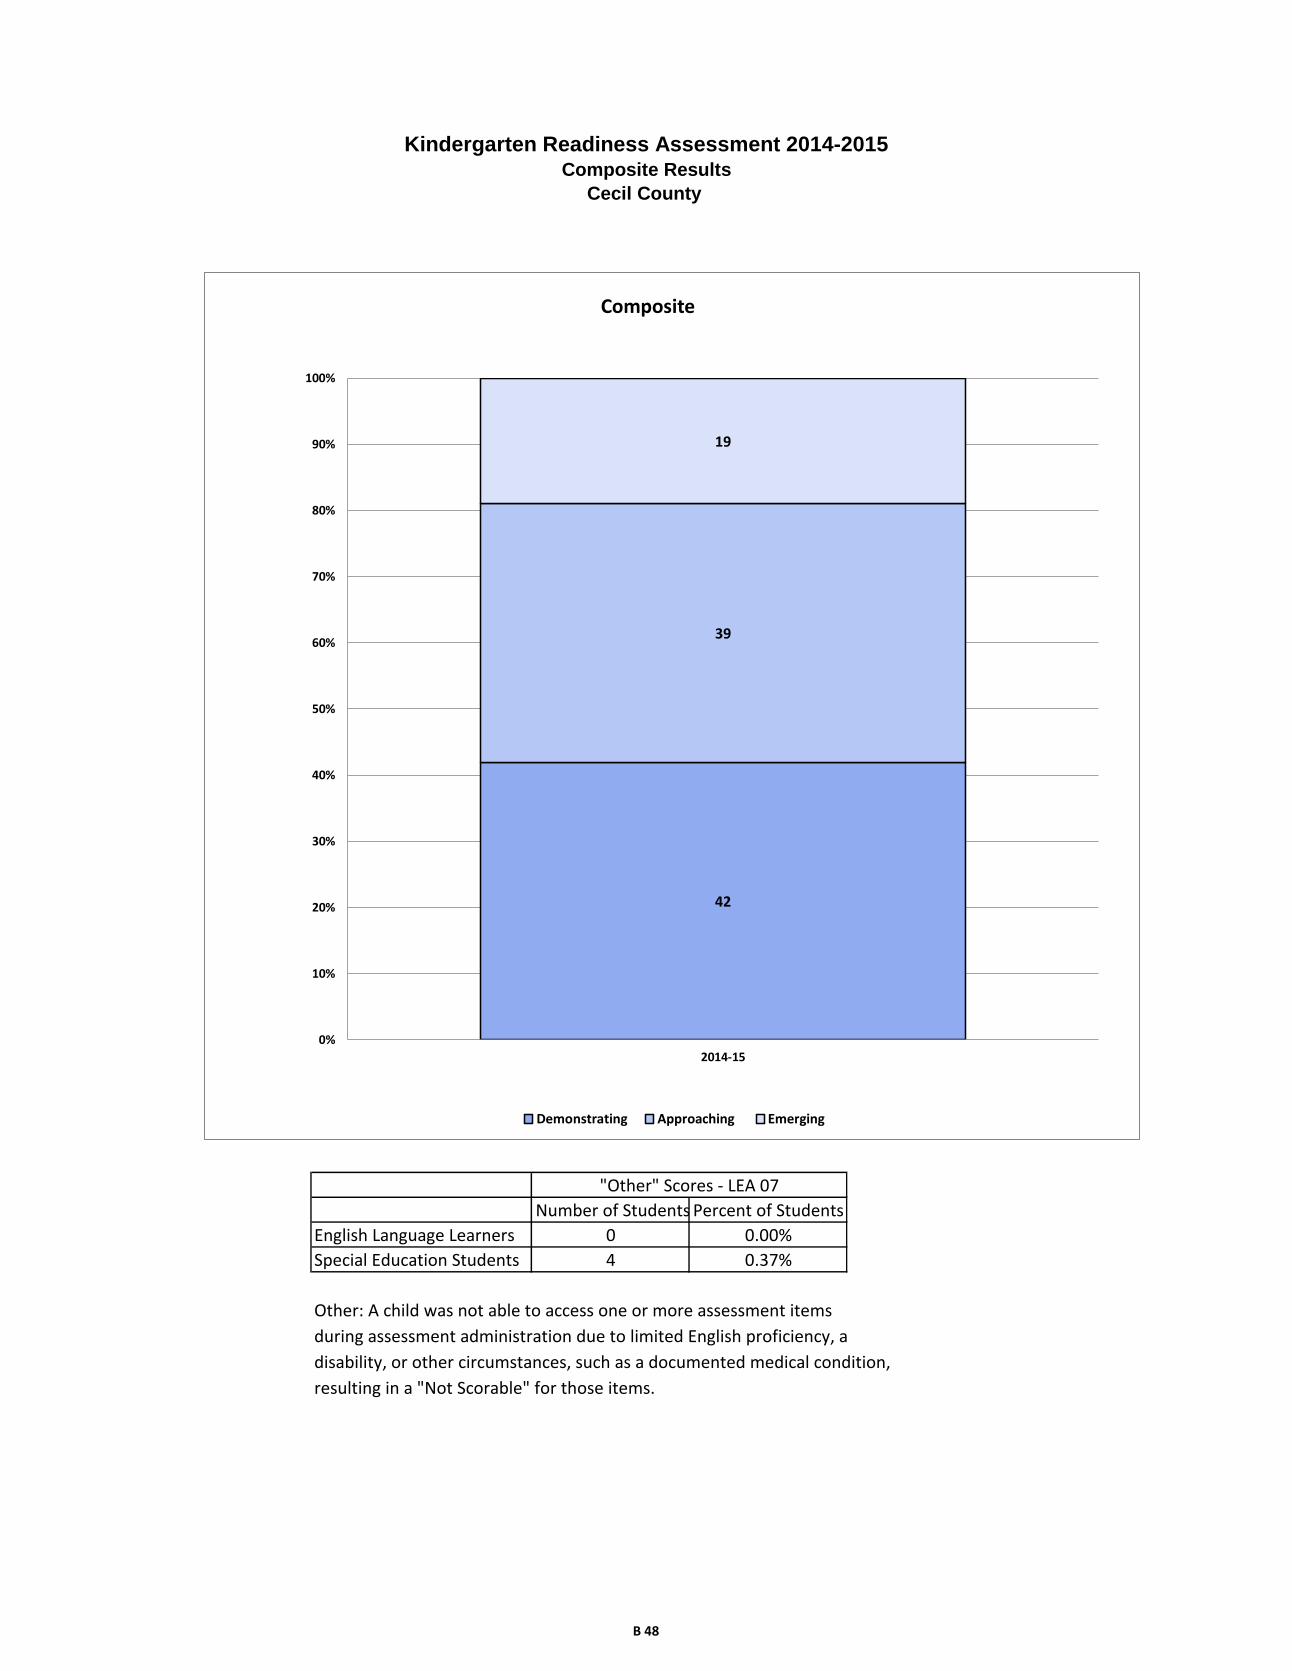
Other: A child was not able to access one or more assessment items
during assessment administration due to limited English proficiency, a
disability, or other circumstances, such as a documented medical condition,
resulting in a "Not Scorable" for those items.
"Other" Scores - LEA 07
Number of Students Percent of Students
Kindergarten Readiness Assessment 2014-2015Composite Results
Cecil County
English Language Learners 0 0.00%
Special Education Students 4 0.37%
42
39
19
0%
10%
20%
30%
40%
50%
60%
70%
80%
90%
100%
2014-15
Composite
Demonstrating Approaching Emerging
B 48
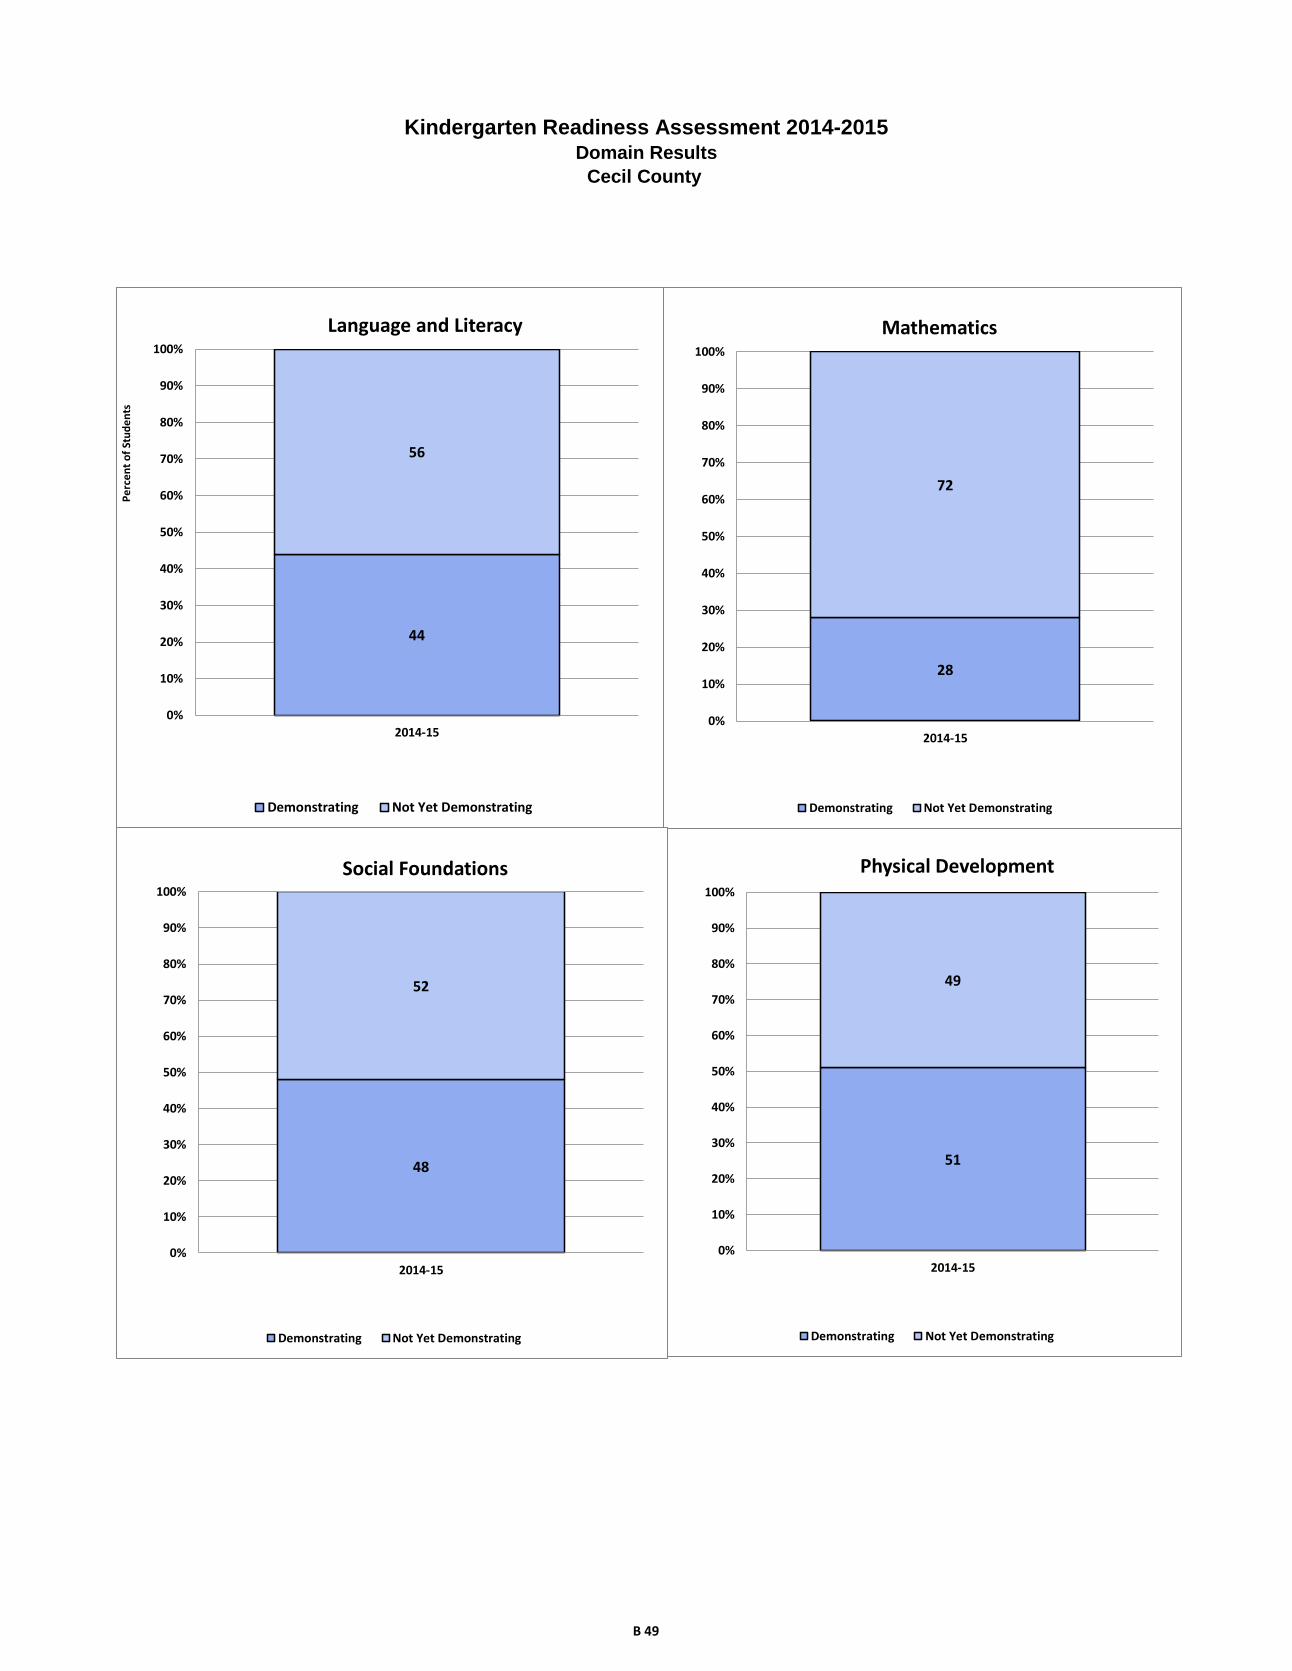
Kindergarten Readiness Assessment 2014-2015Domain Results
Cecil County
44
56
0%
10%
20%
30%
40%
50%
60%
70%
80%
90%
100%
2014-15
Language and Literacy
Demonstrating Not Yet Demonstrating
Pe
rce
nt
of
Stu
de
nts
28
72
0%
10%
20%
30%
40%
50%
60%
70%
80%
90%
100%
2014-15
Mathematics
Demonstrating Not Yet Demonstrating
48
52
0%
10%
20%
30%
40%
50%
60%
70%
80%
90%
100%
2014-15
Social Foundations
Demonstrating Not Yet Demonstrating
51
49
0%
10%
20%
30%
40%
50%
60%
70%
80%
90%
100%
2014-15
Physical Development
Demonstrating Not Yet Demonstrating
B 49
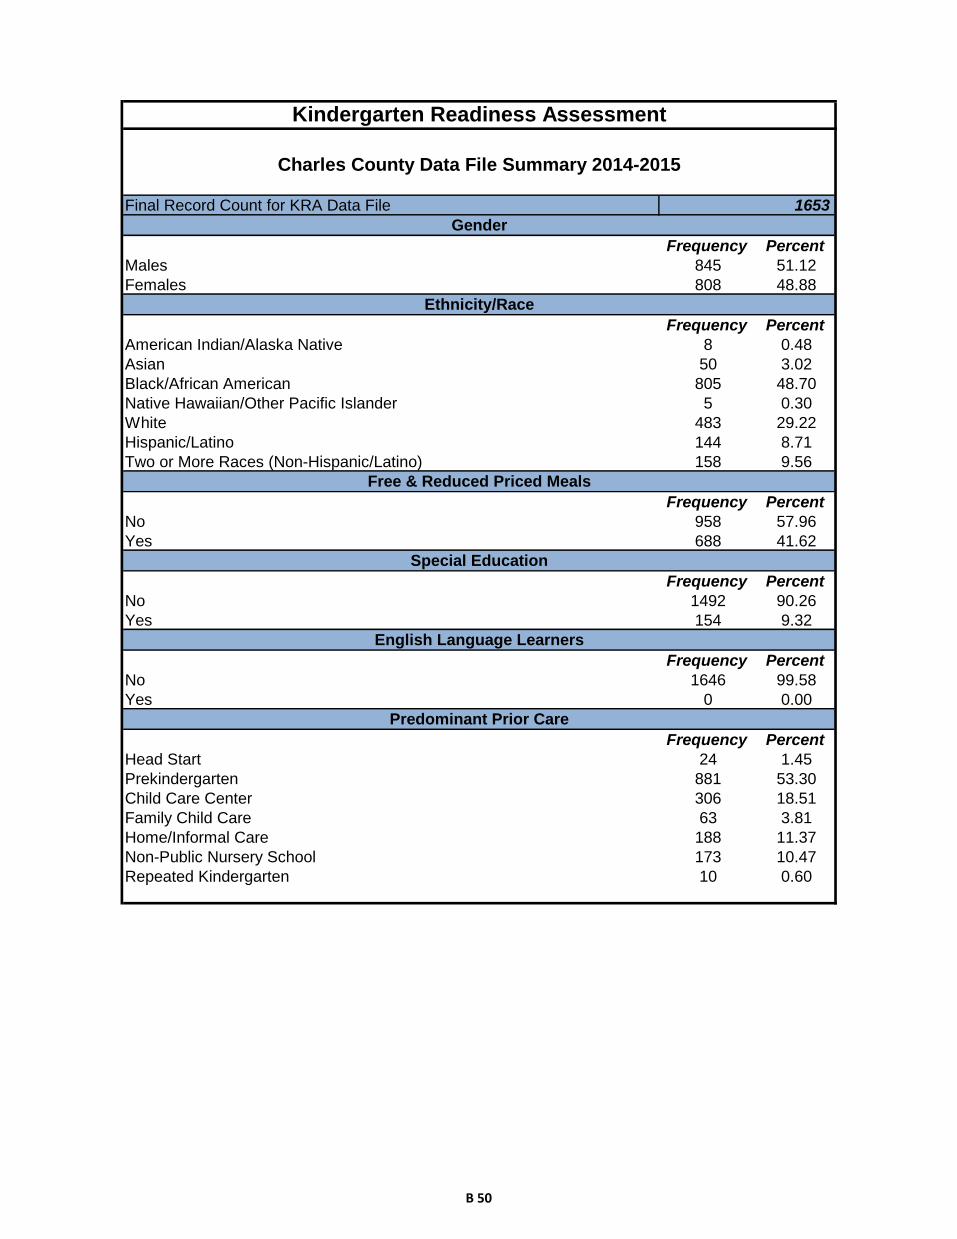
Frequency Percent
Males 845 51.12
Females 808 48.88
Frequency Percent
American Indian/Alaska Native 8 0.48
Asian 50 3.02
Black/African American 805 48.70
Native Hawaiian/Other Pacific Islander 5 0.30
White 483 29.22
Hispanic/Latino 144 8.71
Two or More Races (Non-Hispanic/Latino) 158 9.56
Frequency Percent
No 958 57.96
Yes 688 41.62
Frequency Percent
No 1492 90.26
Yes 154 9.32
Frequency Percent
No 1646 99.58
Yes 0 0.00
Frequency Percent
Head Start 24 1.45
Prekindergarten 881 53.30
Child Care Center 306 18.51
Family Child Care 63 3.81
Home/Informal Care 188 11.37
Non-Public Nursery School 173 10.47
Repeated Kindergarten 10 0.60
Special Education
English Language Learners
Predominant Prior Care
Final Record Count for KRA Data File 1653
Kindergarten Readiness Assessment
Charles County Data File Summary 2014-2015
Gender
Ethnicity/Race
Free & Reduced Priced Meals
B 50

Demonstrating
Not Yet
Demonstrating
Demonstrating
Not Yet
Demonstrating
Demonstrating
Not Yet
Demonstrating
Demonstrating
Not Yet
Demonstrating
Demonstrating
Approaching
Emerging
Rac
e/E
thn
icity
Am
eric
an In
dia
n/A
laskan N
ativ
e4
43
52
65
33
50
Asia
n1
82
91
82
92
72
13
41
42
22
05
Afric
an A
meric
an
38
24
10
25
45
41
39
34
02
44
43
53
34
13
46
10
3
Nativ
e H
aw
aiia
n/P
acific
Isla
nde
r2
33
24
14
14
10
White
28
11
98
23
22
48
27
92
01
27
02
09
26
41
58
56
His
panic
61
78
48
94
70
73
78
65
62
50
27
Tw
o o
r More
Race
s (N
on-H
ispanic
/La
tino)
59
97
52
10
48
17
59
06
67
06
52
1
Gen
der
Male
37
84
52
28
25
53
37
54
62
39
04
46
32
73
63
13
9
Fem
ale
42
93
67
32
84
70
48
13
17
53
52
65
43
92
82
73
Prio
r Care
Child
Care
Cente
r1
68
13
81
11
19
51
58
14
81
79
12
71
46
13
52
5
Fam
ily C
hild
Care
32
31
20
43
27
36
27
36
26
27
10
Hea
d S
tart
81
68
16
11
13
71
79
10
5
Hom
e / In
form
al C
are
59
12
44
71
38
76
11
18
51
02
56
86
41
Non-p
ublic
Nurs
ery
11
36
08
98
41
13
60
11
06
31
01
65
7
Pre
-Kin
de
rgarte
n4
24
44
03
31
53
74
66
40
25
13
35
64
25
31
81
18
Sp
ec
ial E
du
ca
tion
No
77
47
08
57
99
07
81
16
74
87
86
10
73
85
85
15
6
Yes
32
10
93
01
14
43
10
44
51
00
27
58
56
En
glis
h L
an
gu
ag
e L
ea
rne
rs
No
80
68
15
60
81
02
08
52
77
89
21
71
07
64
64
22
12
Yes
**
**
**
**
**
*
Fre
e a
nd
Red
uce
d P
rice
Mea
ls
No
52
84
16
40
65
40
51
54
32
55
53
92
49
03
55
97
Yes
27
84
01
20
34
81
33
93
46
36
83
18
27
52
88
11
5
Aggre
gate
d D
ata
80
78
19
61
01,0
23
85
67
79
92
57
11
76
66
45
21
2
* = G
roup s
ize fe
wer th
an 5
Ch
arle
s C
ou
nty
- Nu
mb
er o
f Kin
derg
arte
n S
tud
en
ts
Socia
l
Founda
tions
Physic
al
Develo
pm
ent
La
nguage a
nd
Lite
racy
Math
em
atic
sC
om
posite
B 51
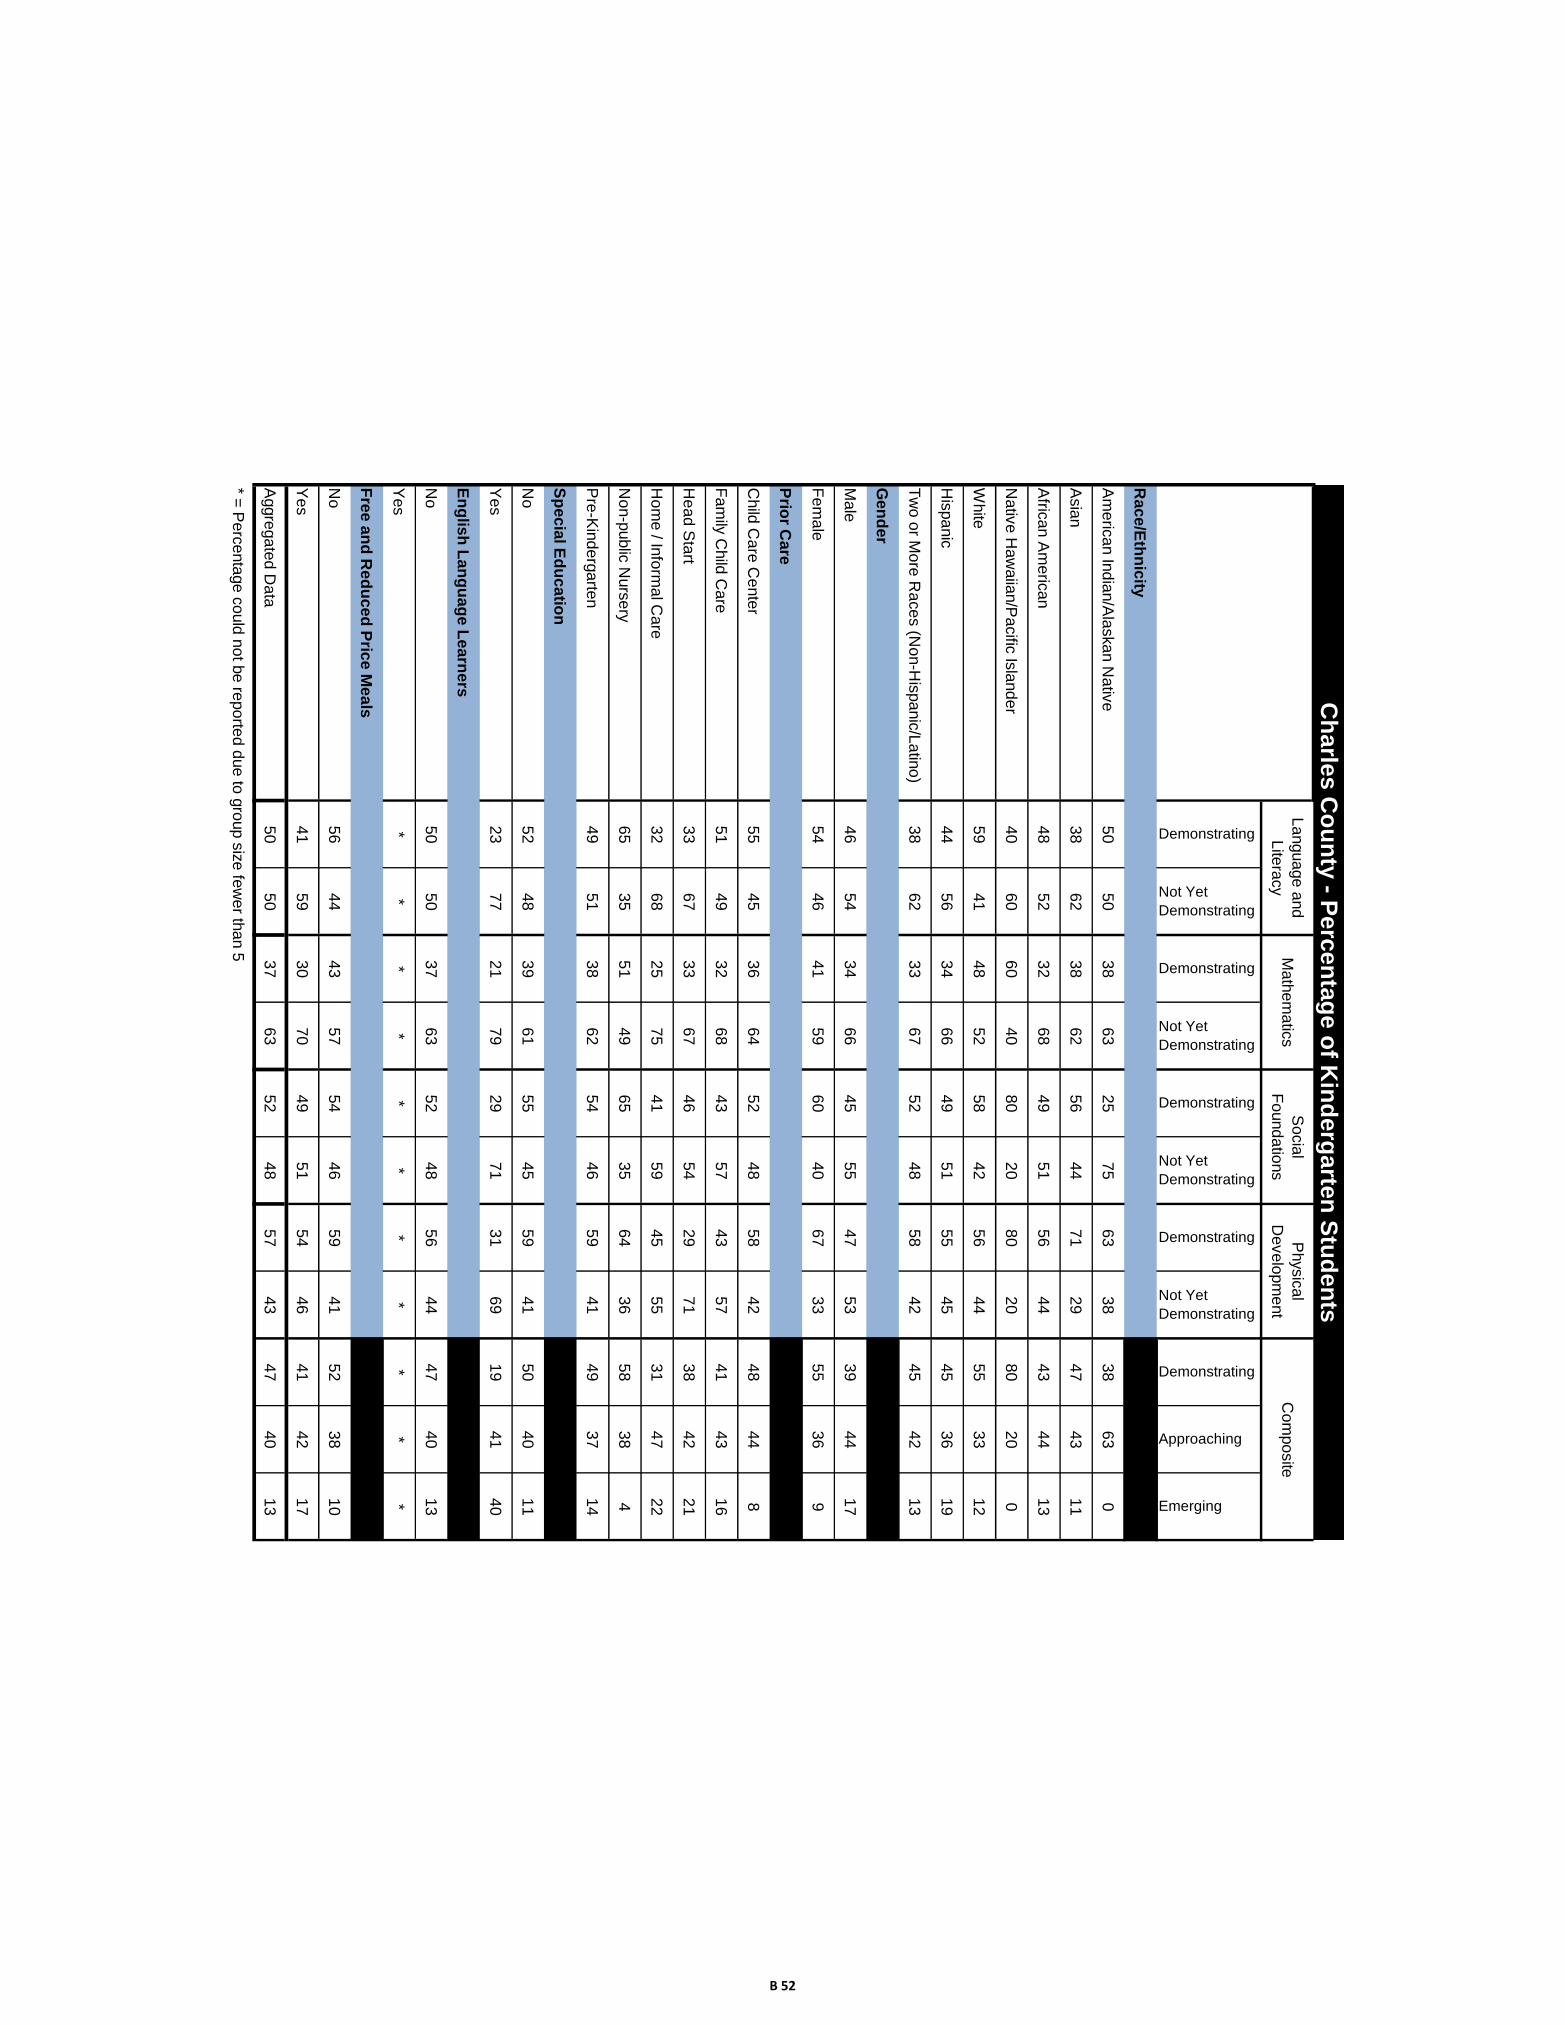
Demonstrating
Not Yet
Demonstrating
Demonstrating
Not Yet
Demonstrating
Demonstrating
Not Yet
Demonstrating
Demonstrating
Not Yet
Demonstrating
Demonstrating
Approaching
Emerging
Rac
e/E
thn
icity
Am
eric
an In
dia
n/A
laskan N
ativ
e5
05
03
86
32
57
56
33
83
86
30
Asia
n3
86
23
86
25
64
47
12
94
74
31
1
Afric
an A
meric
an
48
52
32
68
49
51
56
44
43
44
13
Nativ
e H
aw
aiia
n/P
acific
Isla
nde
r4
06
06
04
08
02
08
02
08
02
00
White
59
41
48
52
58
42
56
44
55
33
12
His
panic
44
56
34
66
49
51
55
45
45
36
19
Tw
o o
r More
Race
s (N
on-H
ispanic
/La
tino)
38
62
33
67
52
48
58
42
45
42
13
Gen
der
Male
46
54
34
66
45
55
47
53
39
44
17
Fem
ale
54
46
41
59
60
40
67
33
55
36
9
Prio
r Care
Child
Care
Cente
r5
54
53
66
45
24
85
84
24
84
48
Fam
ily C
hild
Care
51
49
32
68
43
57
43
57
41
43
16
Hea
d S
tart
33
67
33
67
46
54
29
71
38
42
21
Hom
e / In
form
al C
are
32
68
25
75
41
59
45
55
31
47
22
Non-p
ublic
Nurs
ery
65
35
51
49
65
35
64
36
58
38
4
Pre
-Kin
de
rgarte
n4
95
13
86
25
44
65
94
14
93
71
4
Sp
ec
ial E
du
ca
tion
No
52
48
39
61
55
45
59
41
50
40
11
Yes
23
77
21
79
29
71
31
69
19
41
40
En
glis
h L
an
gu
ag
e L
ea
rne
rs
No
50
50
37
63
52
48
56
44
47
40
13
Yes
**
**
**
**
**
*
Fre
e a
nd
Red
uce
d P
rice
Mea
ls
No
56
44
43
57
54
46
59
41
52
38
10
Yes
41
59
30
70
49
51
54
46
41
42
17
Aggre
gate
d D
ata
50
50
37
63
52
48
57
43
47
40
13
* = P
erc
enta
ge c
ould
not b
e re
porte
d d
ue to
gro
up s
ize fe
wer th
an 5
Ch
arle
s C
ou
nty
- Perc
en
tag
e o
f Kin
derg
arte
n S
tud
en
ts
Socia
l
Founda
tions
Physic
al
Develo
pm
ent
Com
posite
La
nguage a
nd
Lite
racy
Math
em
atic
s
B 52
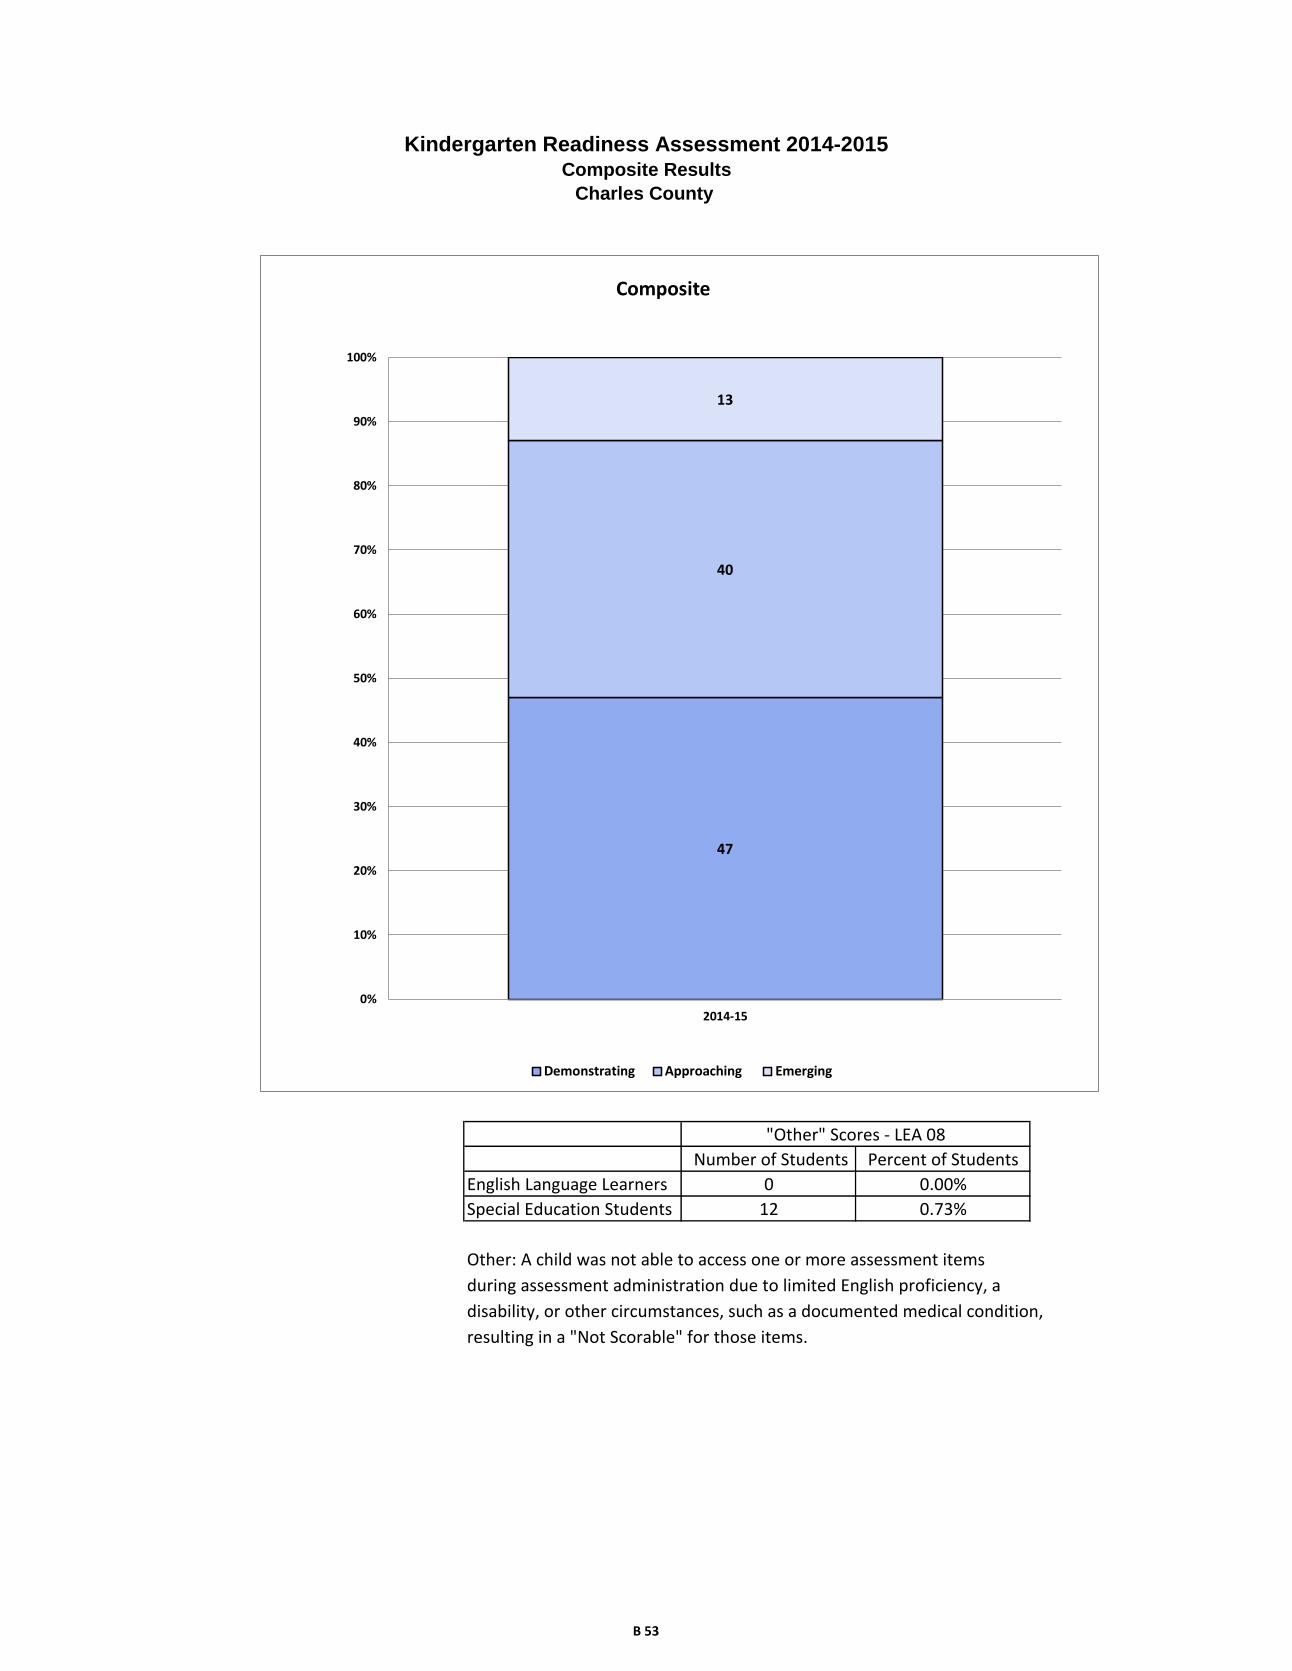
Other: A child was not able to access one or more assessment items
during assessment administration due to limited English proficiency, a
disability, or other circumstances, such as a documented medical condition,
resulting in a "Not Scorable" for those items.
Number of Students Percent of Students
English Language Learners 0
Kindergarten Readiness Assessment 2014-2015Composite Results
Charles County
0.00%
Special Education Students 12 0.73%
"Other" Scores - LEA 08
47
40
13
0%
10%
20%
30%
40%
50%
60%
70%
80%
90%
100%
2014-15
Composite
Demonstrating Approaching Emerging
B 53
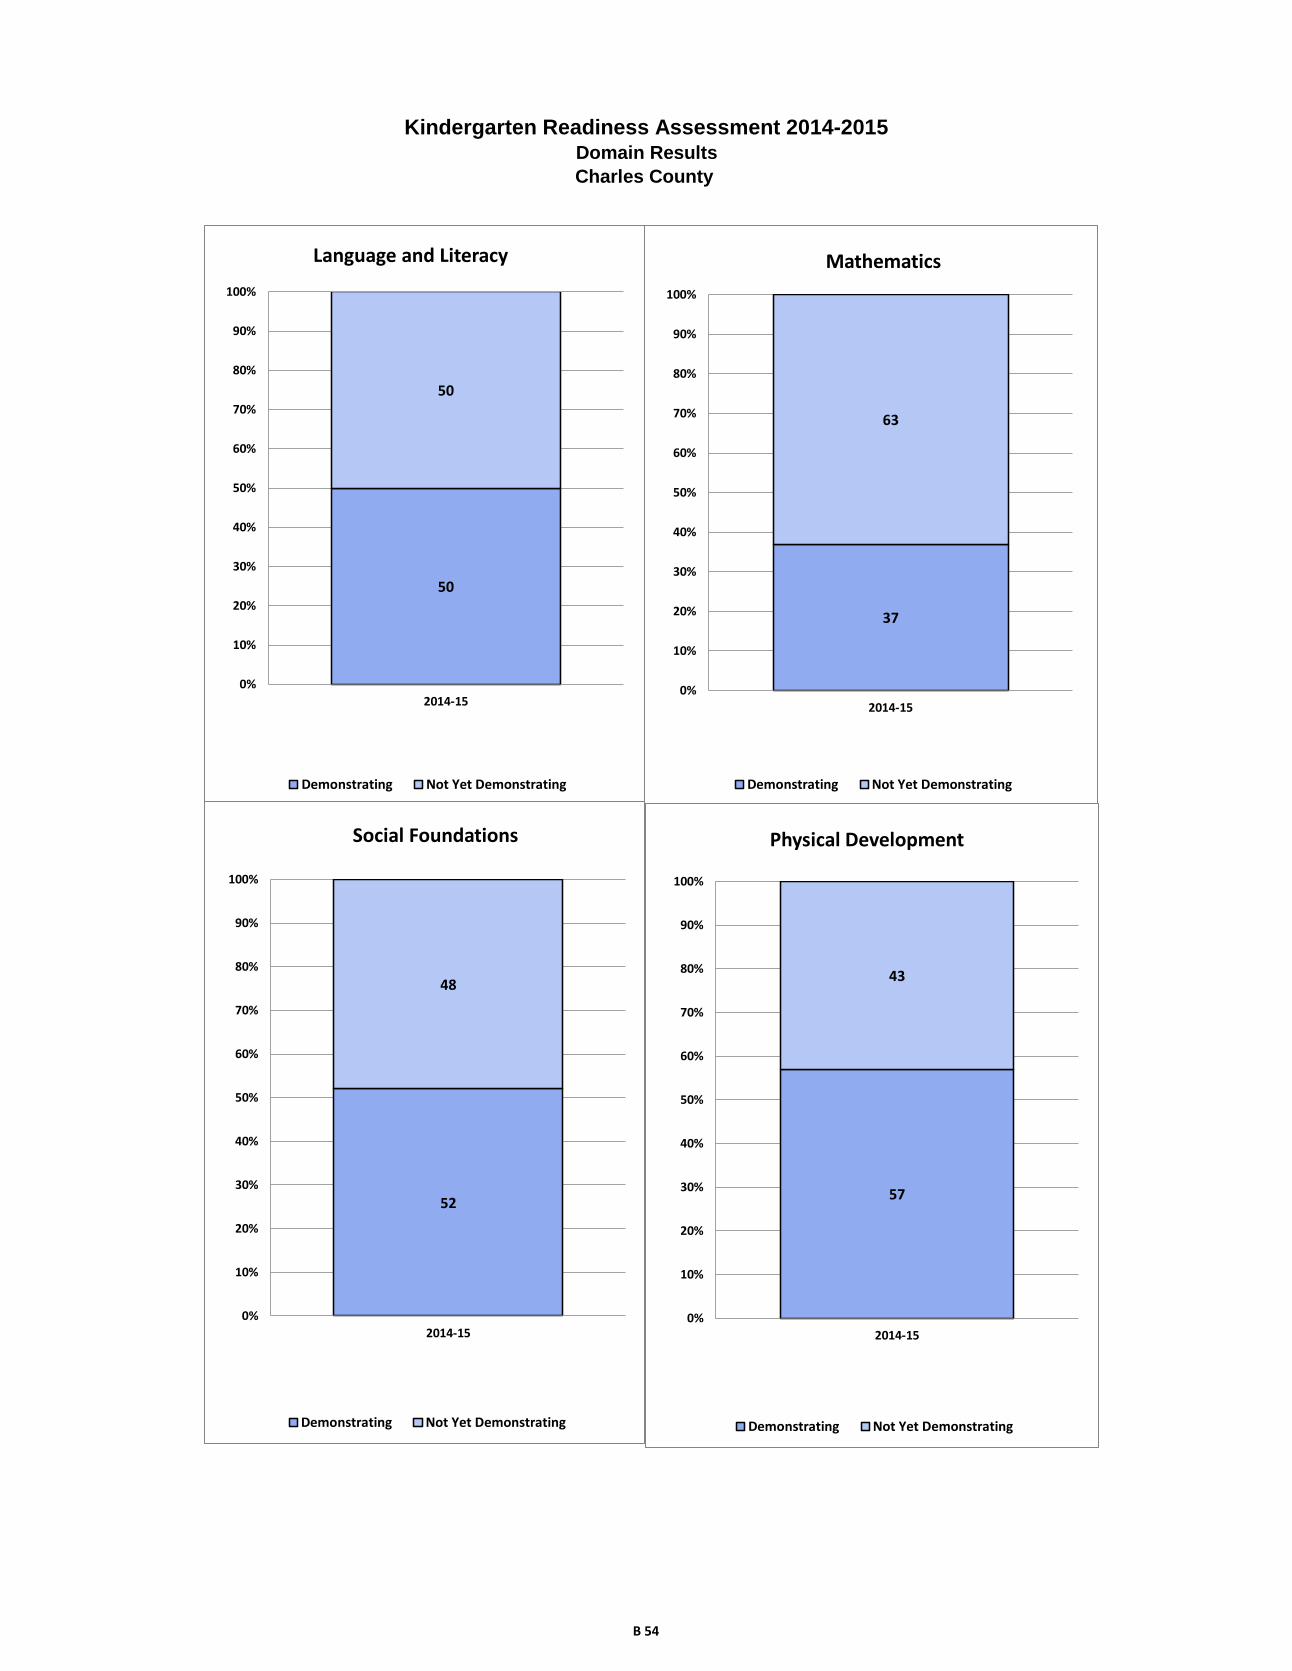
Kindergarten Readiness Assessment 2014-2015Domain Results
Charles County
50
50
0%
10%
20%
30%
40%
50%
60%
70%
80%
90%
100%
2014-15
Language and Literacy
Demonstrating Not Yet Demonstrating
37
63
0%
10%
20%
30%
40%
50%
60%
70%
80%
90%
100%
2014-15
Mathematics
Demonstrating Not Yet Demonstrating
52
48
0%
10%
20%
30%
40%
50%
60%
70%
80%
90%
100%
2014-15
Social Foundations
Demonstrating Not Yet Demonstrating
57
43
0%
10%
20%
30%
40%
50%
60%
70%
80%
90%
100%
2014-15
Physical Development
Demonstrating Not Yet Demonstrating
B 54
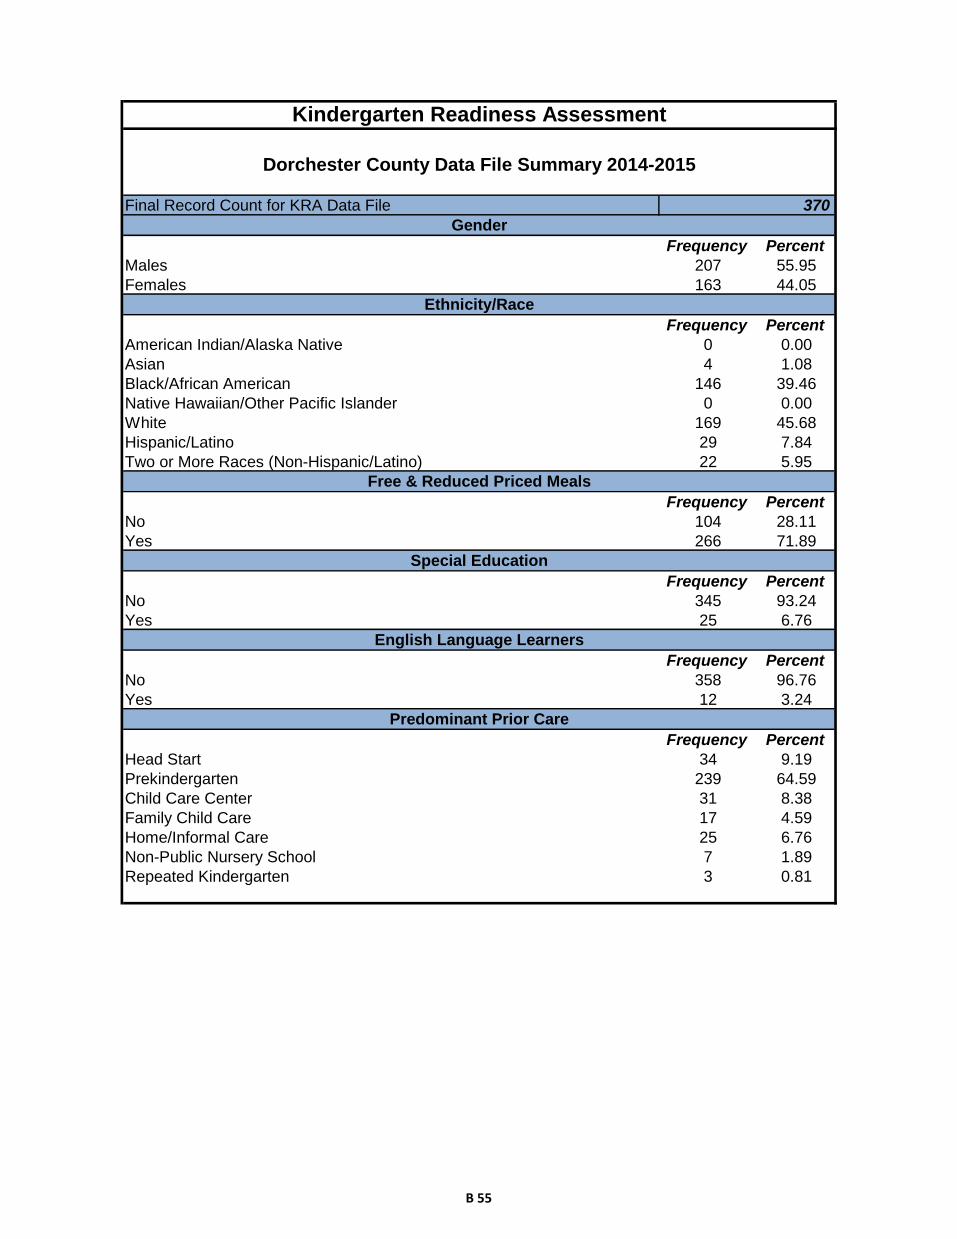
Frequency Percent
Males 207 55.95
Females 163 44.05
Frequency Percent
American Indian/Alaska Native 0 0.00
Asian 4 1.08
Black/African American 146 39.46
Native Hawaiian/Other Pacific Islander 0 0.00
White 169 45.68
Hispanic/Latino 29 7.84
Two or More Races (Non-Hispanic/Latino) 22 5.95
Frequency Percent
No 104 28.11
Yes 266 71.89
Frequency Percent
No 345 93.24
Yes 25 6.76
Frequency Percent
No 358 96.76
Yes 12 3.24
Frequency Percent
Head Start 34 9.19
Prekindergarten 239 64.59
Child Care Center 31 8.38
Family Child Care 17 4.59
Home/Informal Care 25 6.76
Non-Public Nursery School 7 1.89
Repeated Kindergarten 3 0.81
Special Education
English Language Learners
Predominant Prior Care
Final Record Count for KRA Data File 370
Kindergarten Readiness Assessment
Dorchester County Data File Summary 2014-2015
Gender
Ethnicity/Race
Free & Reduced Priced Meals
B 55

Demonstrating
Not Yet
Demonstrating
Demonstrating
Not Yet
Demonstrating
Demonstrating
Not Yet
Demonstrating
Demonstrating
Not Yet
Demonstrating
Demonstrating
Approaching
Emerging
Rac
e/E
thn
icity
Am
eric
an In
dia
n/A
laskan N
ativ
e*
**
**
**
**
**
Asia
n*
**
**
**
**
**
Afric
an A
meric
an
45
97
26
11
66
08
25
48
84
35
54
4
Nativ
e H
aw
aiia
n/P
acific
Isla
nde
r*
**
**
**
**
**
White
73
89
69
95
86
78
91
72
82
57
22
His
panic
42
22
25
91
81
31
45
10
11
Tw
o o
r More
Race
s (N
on-H
ispanic
/La
tino)
91
31
11
11
11
11
39
91
21
Gen
der
Male
66
13
45
91
42
82
11
98
01
21
68
75
57
Fem
ale
68
88
52
10
68
87
09
46
37
55
92
1
Prio
r Care
Child
Care
Cente
r2
19
15
16
21
10
21
10
20
82
Fam
ily C
hild
Care
51
16
10
88
79
58
3
Hea
d S
tart
92
54
30
15
19
12
22
91
41
1
Hom
e / In
form
al C
are
52
09
16
91
61
31
29
97
Non-p
ublic
Nurs
ery
43
61
61
52
52
0
Pre
-Kin
de
rgarte
n8
31
45
66
16
41
08
12
21
12
11
79
08
84
9
Sp
ec
ial E
du
ca
tion
No
13
22
01
11
02
25
16
51
70
17
21
63
14
11
29
63
Yes
22
11
23
51
92
21
25
15
En
glis
h L
an
gu
ag
e L
ea
rne
rs
No
13
42
10
11
12
36
16
91
78
17
11
75
14
31
30
70
Yes
01
20
12
11
13
90
48
Fre
e a
nd
Red
uce
d P
rice
Mea
ls
No
48
49
47
52
59
40
64
35
54
34
9
Yes
86
17
36
41
96
11
11
49
11
01
49
89
10
06
9
Aggre
gate
d D
ata
13
42
22
11
12
48
17
01
89
17
41
84
14
31
34
78
* = G
roup s
ize fe
wer th
an 5
Do
rch
este
r Co
un
ty - N
um
ber o
f Kin
derg
arte
n S
tud
en
ts
Socia
l
Founda
tions
Physic
al
Develo
pm
ent
La
nguage a
nd
Lite
racy
Math
em
atic
sC
om
posite
B 56
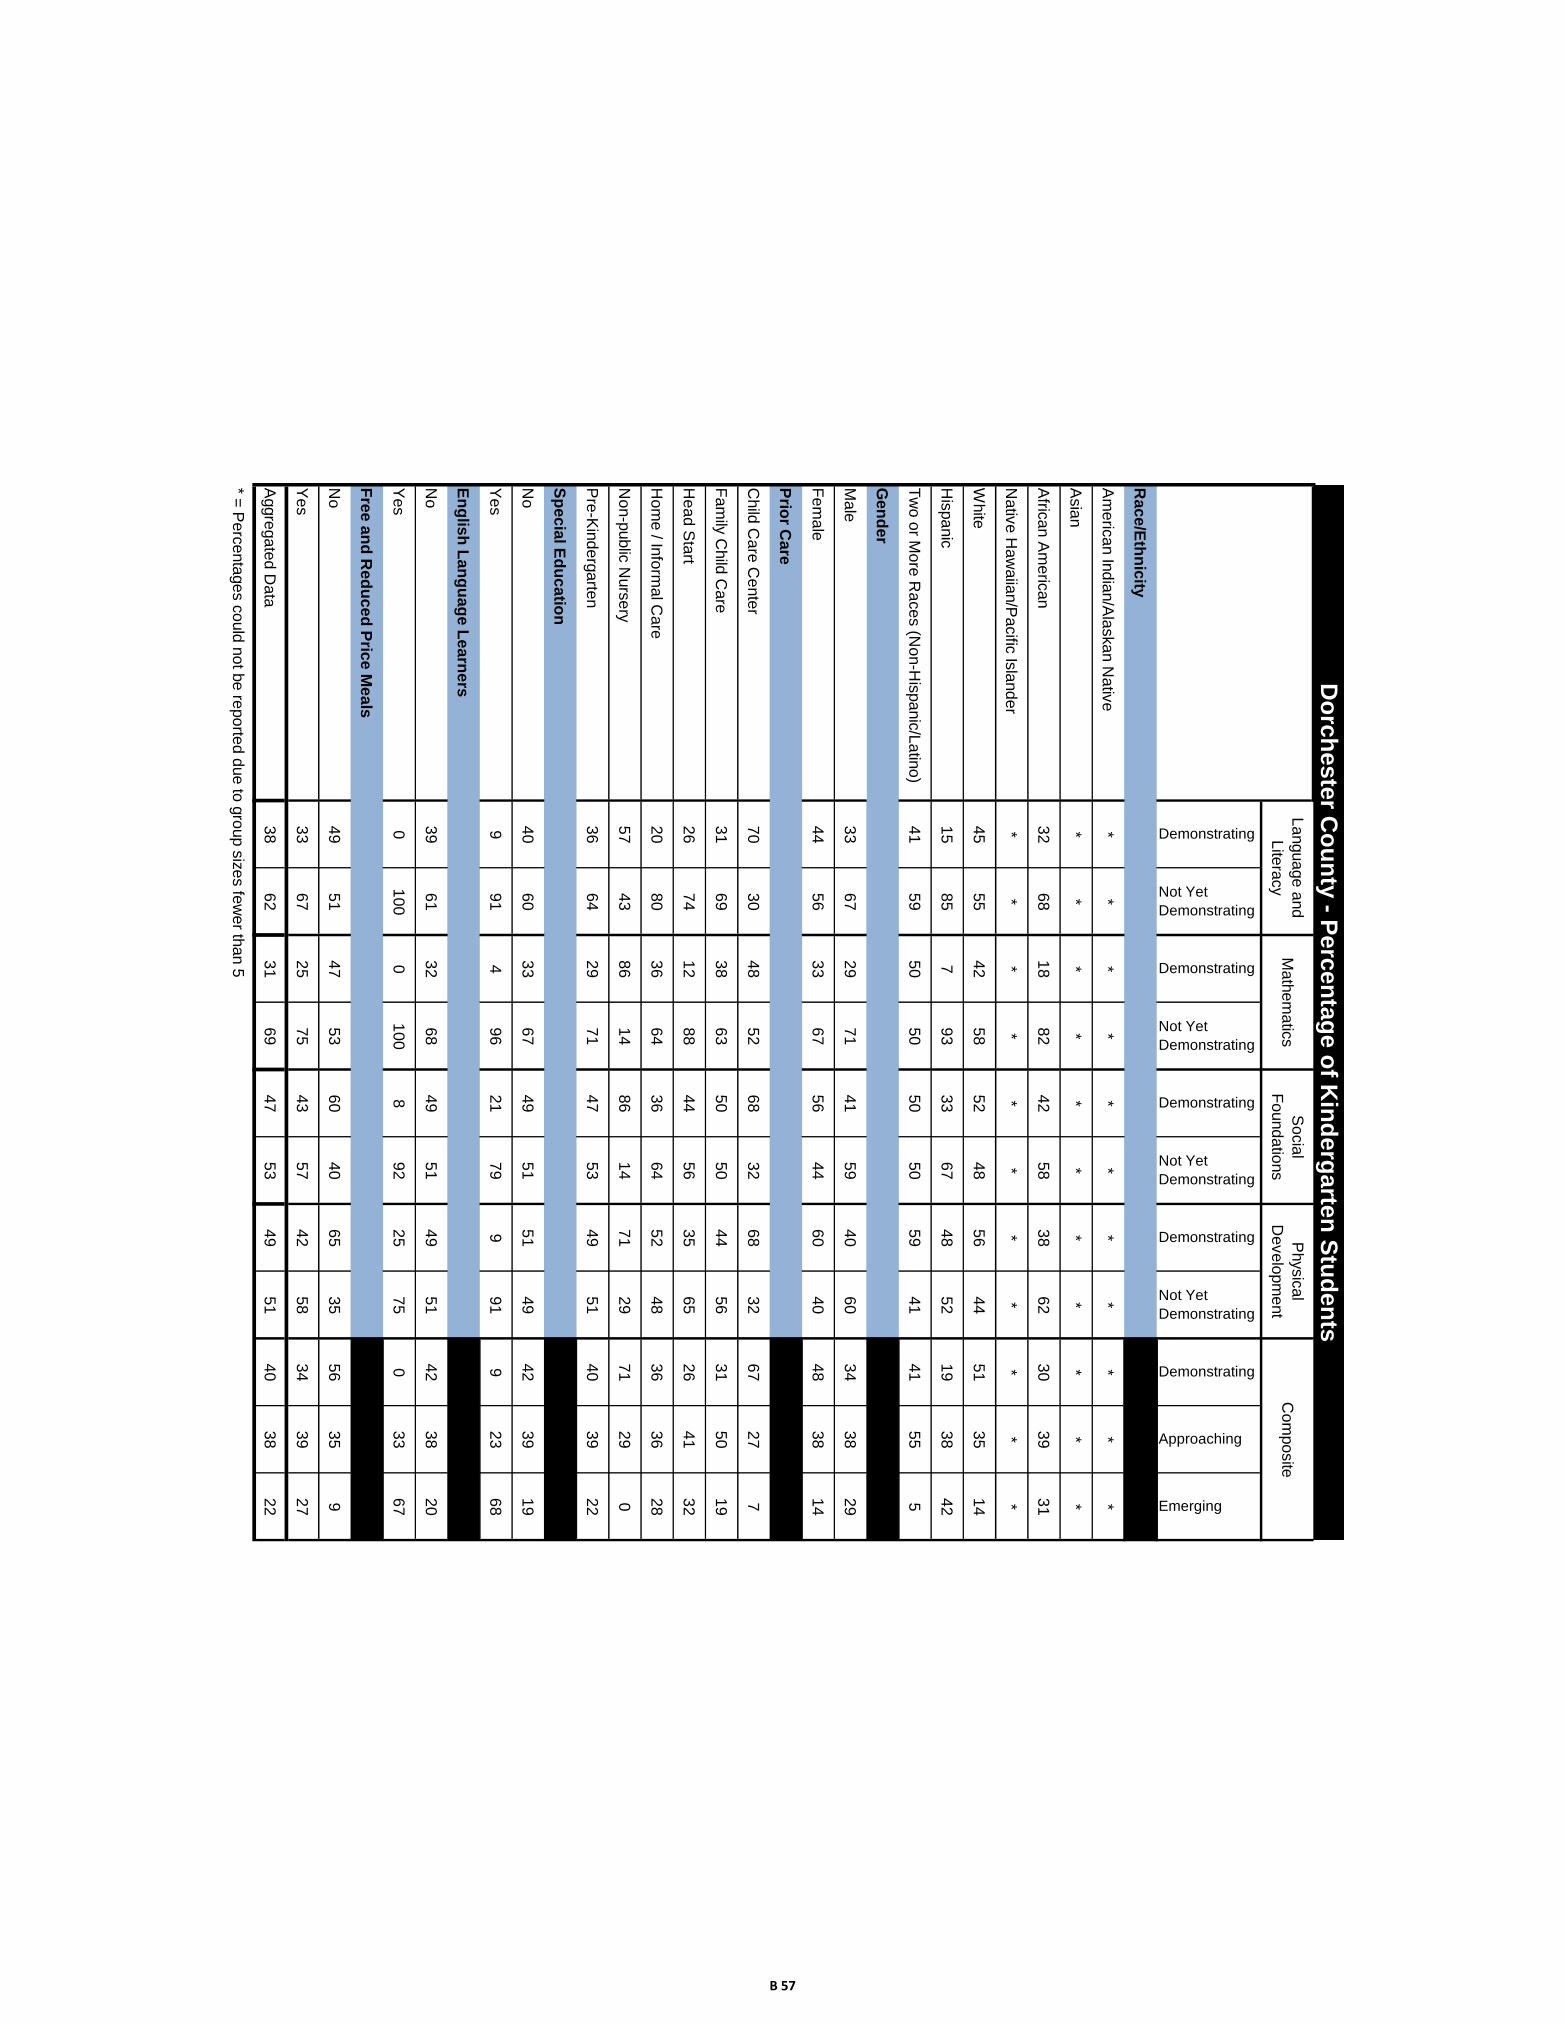
Demonstrating
Not Yet
Demonstrating
Demonstrating
Not Yet
Demonstrating
Demonstrating
Not Yet
Demonstrating
Demonstrating
Not Yet
Demonstrating
Demonstrating
Approaching
Emerging
Rac
e/E
thn
icity
Am
eric
an In
dia
n/A
laskan N
ativ
e*
**
**
**
**
**
Asia
n*
**
**
**
**
**
Afric
an A
meric
an
32
68
18
82
42
58
38
62
30
39
31
Nativ
e H
aw
aiia
n/P
acific
Isla
nde
r*
**
**
**
**
**
White
45
55
42
58
52
48
56
44
51
35
14
His
panic
15
85
79
33
36
74
85
21
93
84
2
Tw
o o
r More
Race
s (N
on-H
ispanic
/La
tino)
41
59
50
50
50
50
59
41
41
55
5
Gen
der
Male
33
67
29
71
41
59
40
60
34
38
29
Fem
ale
44
56
33
67
56
44
60
40
48
38
14
Prio
r Care
Child
Care
Cente
r7
03
04
85
26
83
26
83
26
72
77
Fam
ily C
hild
Care
31
69
38
63
50
50
44
56
31
50
19
Hea
d S
tart
26
74
12
88
44
56
35
65
26
41
32
Hom
e / In
form
al C
are
20
80
36
64
36
64
52
48
36
36
28
Non-p
ublic
Nurs
ery
57
43
86
14
86
14
71
29
71
29
0
Pre
-Kin
de
rgarte
n3
66
42
97
14
75
34
95
14
03
92
2
Sp
ec
ial E
du
ca
tion
No
40
60
33
67
49
51
51
49
42
39
19
Yes
99
14
96
21
79
99
19
23
68
En
glis
h L
an
gu
ag
e L
ea
rne
rs
No
39
61
32
68
49
51
49
51
42
38
20
Yes
01
00
01
00
89
22
57
50
33
67
Fre
e a
nd
Red
uce
d P
rice
Mea
ls
No
49
51
47
53
60
40
65
35
56
35
9
Yes
33
67
25
75
43
57
42
58
34
39
27
Aggre
gate
d D
ata
38
62
31
69
47
53
49
51
40
38
22
* = P
erc
enta
ges c
ould
not b
e re
porte
d d
ue to
gro
up s
izes fe
wer th
an 5
Socia
l
Founda
tions
Physic
al
Develo
pm
ent
Com
posite
Do
rch
este
r Co
un
ty - P
erc
en
tag
e o
f Kin
derg
arte
n S
tud
en
ts
La
nguage a
nd
Lite
racy
Math
em
atic
s
B 57
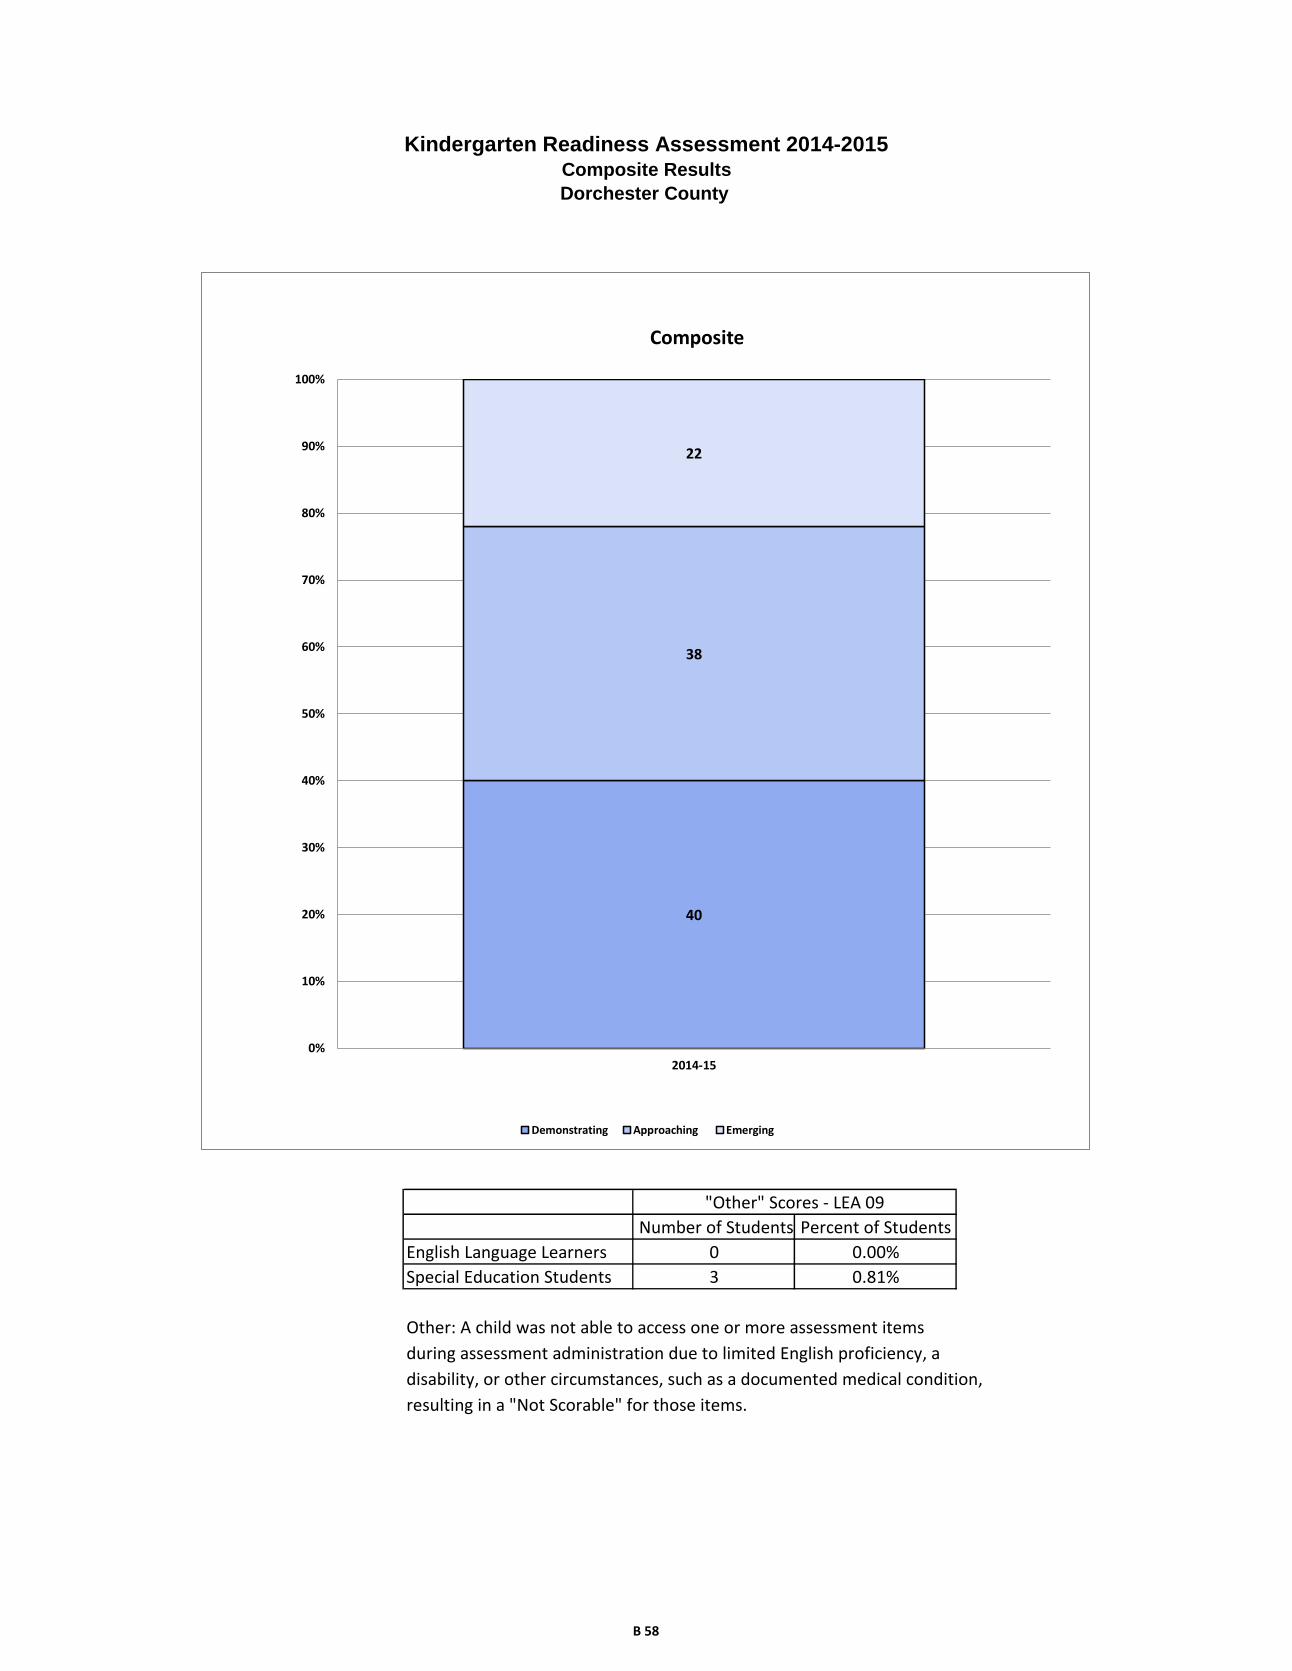
Other: A child was not able to access one or more assessment items
during assessment administration due to limited English proficiency, a
disability, or other circumstances, such as a documented medical condition,
resulting in a "Not Scorable" for those items.
Special Education Students 3 0.81%
"Other" Scores - LEA 09
Number of Students Percent of Students
Kindergarten Readiness Assessment 2014-2015Composite Results
Dorchester County
English Language Learners 0 0.00%
40
38
22
0%
10%
20%
30%
40%
50%
60%
70%
80%
90%
100%
2014-15
Composite
Demonstrating Approaching Emerging
B 58
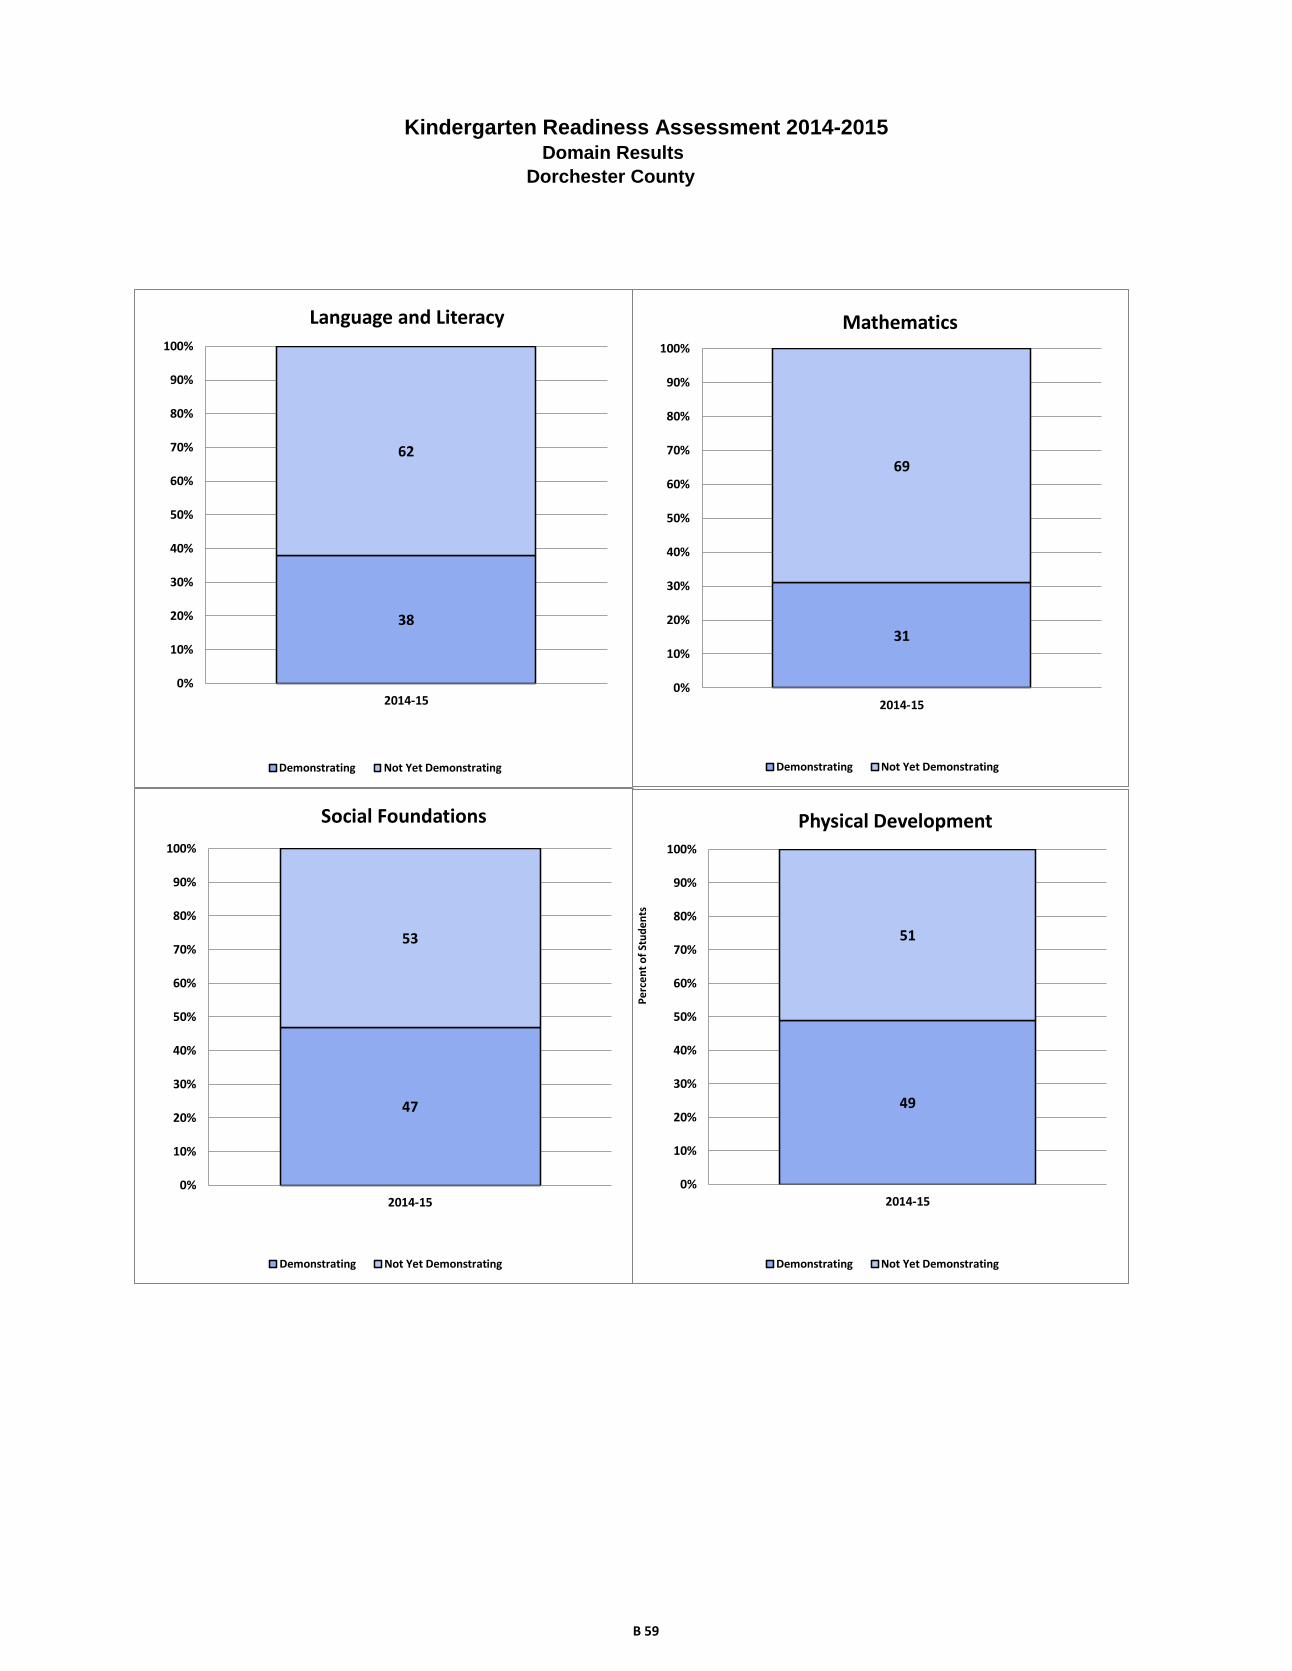
Kindergarten Readiness Assessment 2014-2015Domain Results
Dorchester County
38
62
0%
10%
20%
30%
40%
50%
60%
70%
80%
90%
100%
2014-15
Language and Literacy
Demonstrating Not Yet Demonstrating
31
69
0%
10%
20%
30%
40%
50%
60%
70%
80%
90%
100%
2014-15
Mathematics
Demonstrating Not Yet Demonstrating
47
53
0%
10%
20%
30%
40%
50%
60%
70%
80%
90%
100%
2014-15
Social Foundations
Demonstrating Not Yet Demonstrating
49
51
0%
10%
20%
30%
40%
50%
60%
70%
80%
90%
100%
2014-15
Physical Development
Demonstrating Not Yet Demonstrating
Pe
rce
nt
of
Stu
de
nts
B 59

Frequency Percent
Males 1455 50.75
Females 1412 49.25
Frequency Percent
American Indian/Alaska Native 14 0.49
Asian 160 5.58
Black/African American 319 11.13
Native Hawaiian/Other Pacific Islander 12 0.42
White 1762 61.46
Hispanic/Latino 453 15.80
Two or More Races (Non-Hispanic/Latino) 147 5.13
Frequency Percent
No 1996 69.62
Yes 871 30.38
Frequency Percent
No 2635 91.91
Yes 232 8.09
Frequency Percent
No 2541 88.63
Yes 326 11.37
Frequency Percent
Head Start 81 2.83
Prekindergarten 1118 39.00
Child Care Center 486 16.95
Family Child Care 78 2.72
Home/Informal Care 352 12.28
Non-Public Nursery School 738 25.74
Repeated Kindergarten 14 0.49
Free & Reduced Priced Meals
Special Education
English Language Learners
Predominant Prior Care
Final Record Count for KRA Data File 2867
Kindergarten Readiness Assessment
Frederick County Data File Summary 2014-2015
Gender
Ethnicity/Race
B 60

Demonstrating
Not Yet
Demonstrating
Demonstrating
Not Yet
Demonstrating
Demonstrating
Not Yet
Demonstrating
Demonstrating
Not Yet
Demonstrating
Demonstrating
Approaching
Emerging
Rac
e/E
thn
icity
Am
eric
an In
dia
n/A
laskan N
ativ
e7
78
65
95
96
71
Asia
n9
16
77
38
71
05
55
11
24
89
34
91
6
Afric
an A
meric
an
15
91
55
78
23
51
48
16
41
61
15
31
24
14
34
3
Nativ
e H
aw
aiia
n/P
acific
Isla
nde
r5
72
10
48
65
27
2
White
1,0
86
66
28
48
90
31,0
50
70
51,1
43
61
31,0
72
52
11
45
His
panic
15
72
85
10
63
39
20
72
41
26
11
90
16
51
78
96
Tw
o o
r More
Race
s (N
on-H
ispanic
/La
tino)
86
59
53
91
92
53
92
53
85
48
11
Gen
der
Male
74
26
93
51
79
25
71
17
31
74
17
05
68
15
14
22
8
Fem
ale
84
95
49
65
17
46
90
05
04
1,0
39
36
68
66
43
98
6
Prio
r Care
Child
Care
Cente
r3
11
17
32
42
24
12
99
18
63
34
15
03
09
13
73
5
Fam
ily C
hild
Care
31
46
24
53
37
41
40
38
30
35
11
Hea
d S
tart
44
36
28
52
44
37
48
33
38
33
8
Hom
e / In
form
al C
are
12
72
20
95
25
01
71
17
71
81
17
01
31
14
07
2
Non-p
ublic
Nurs
ery
51
82
17
41
53
19
50
12
36
51
12
24
52
11
83
27
Pre
-Kin
de
rgarte
n5
54
54
23
59
74
75
54
54
96
58
45
05
13
41
71
60
Sp
ec
ial E
du
ca
tion
No
1,5
34
1,0
81
1,1
24
1,4
92
1,5
51
1,0
74
1,7
15
91
11,5
02
86
42
34
Yes
57
16
14
41
79
60
16
16
51
60
45
89
80
En
glis
h L
an
gu
ag
e L
ea
rne
rs
No
15
18
10
00
11
18
14
04
14
87
10
39
16
05
92
31
47
08
08
22
4
Yes
73
24
25
02
67
12
41
96
17
51
48
77
14
59
0
Fre
e a
nd
Red
uce
d P
rice
Mea
ls
No
1,2
54
72
59
53
1,0
26
1,2
43
74
41,3
19
66
71,2
33
58
21
53
Yes
33
75
17
21
56
45
36
84
91
46
14
04
31
43
71
16
1
Aggre
gate
d D
ata
1,5
91
1,2
42
1,1
68
1,6
71
1,6
11
1,2
35
1,7
80
1,0
71
1,5
47
95
33
14
* = G
roup s
ize fe
wer th
an 5
Fre
deric
k C
ou
nty
- Nu
mb
er o
f Kin
derg
arte
n S
tud
en
ts
Socia
l
Founda
tions
Physic
al
Develo
pm
ent
La
nguage a
nd
Lite
racy
Math
em
atic
sC
om
posite
B 61
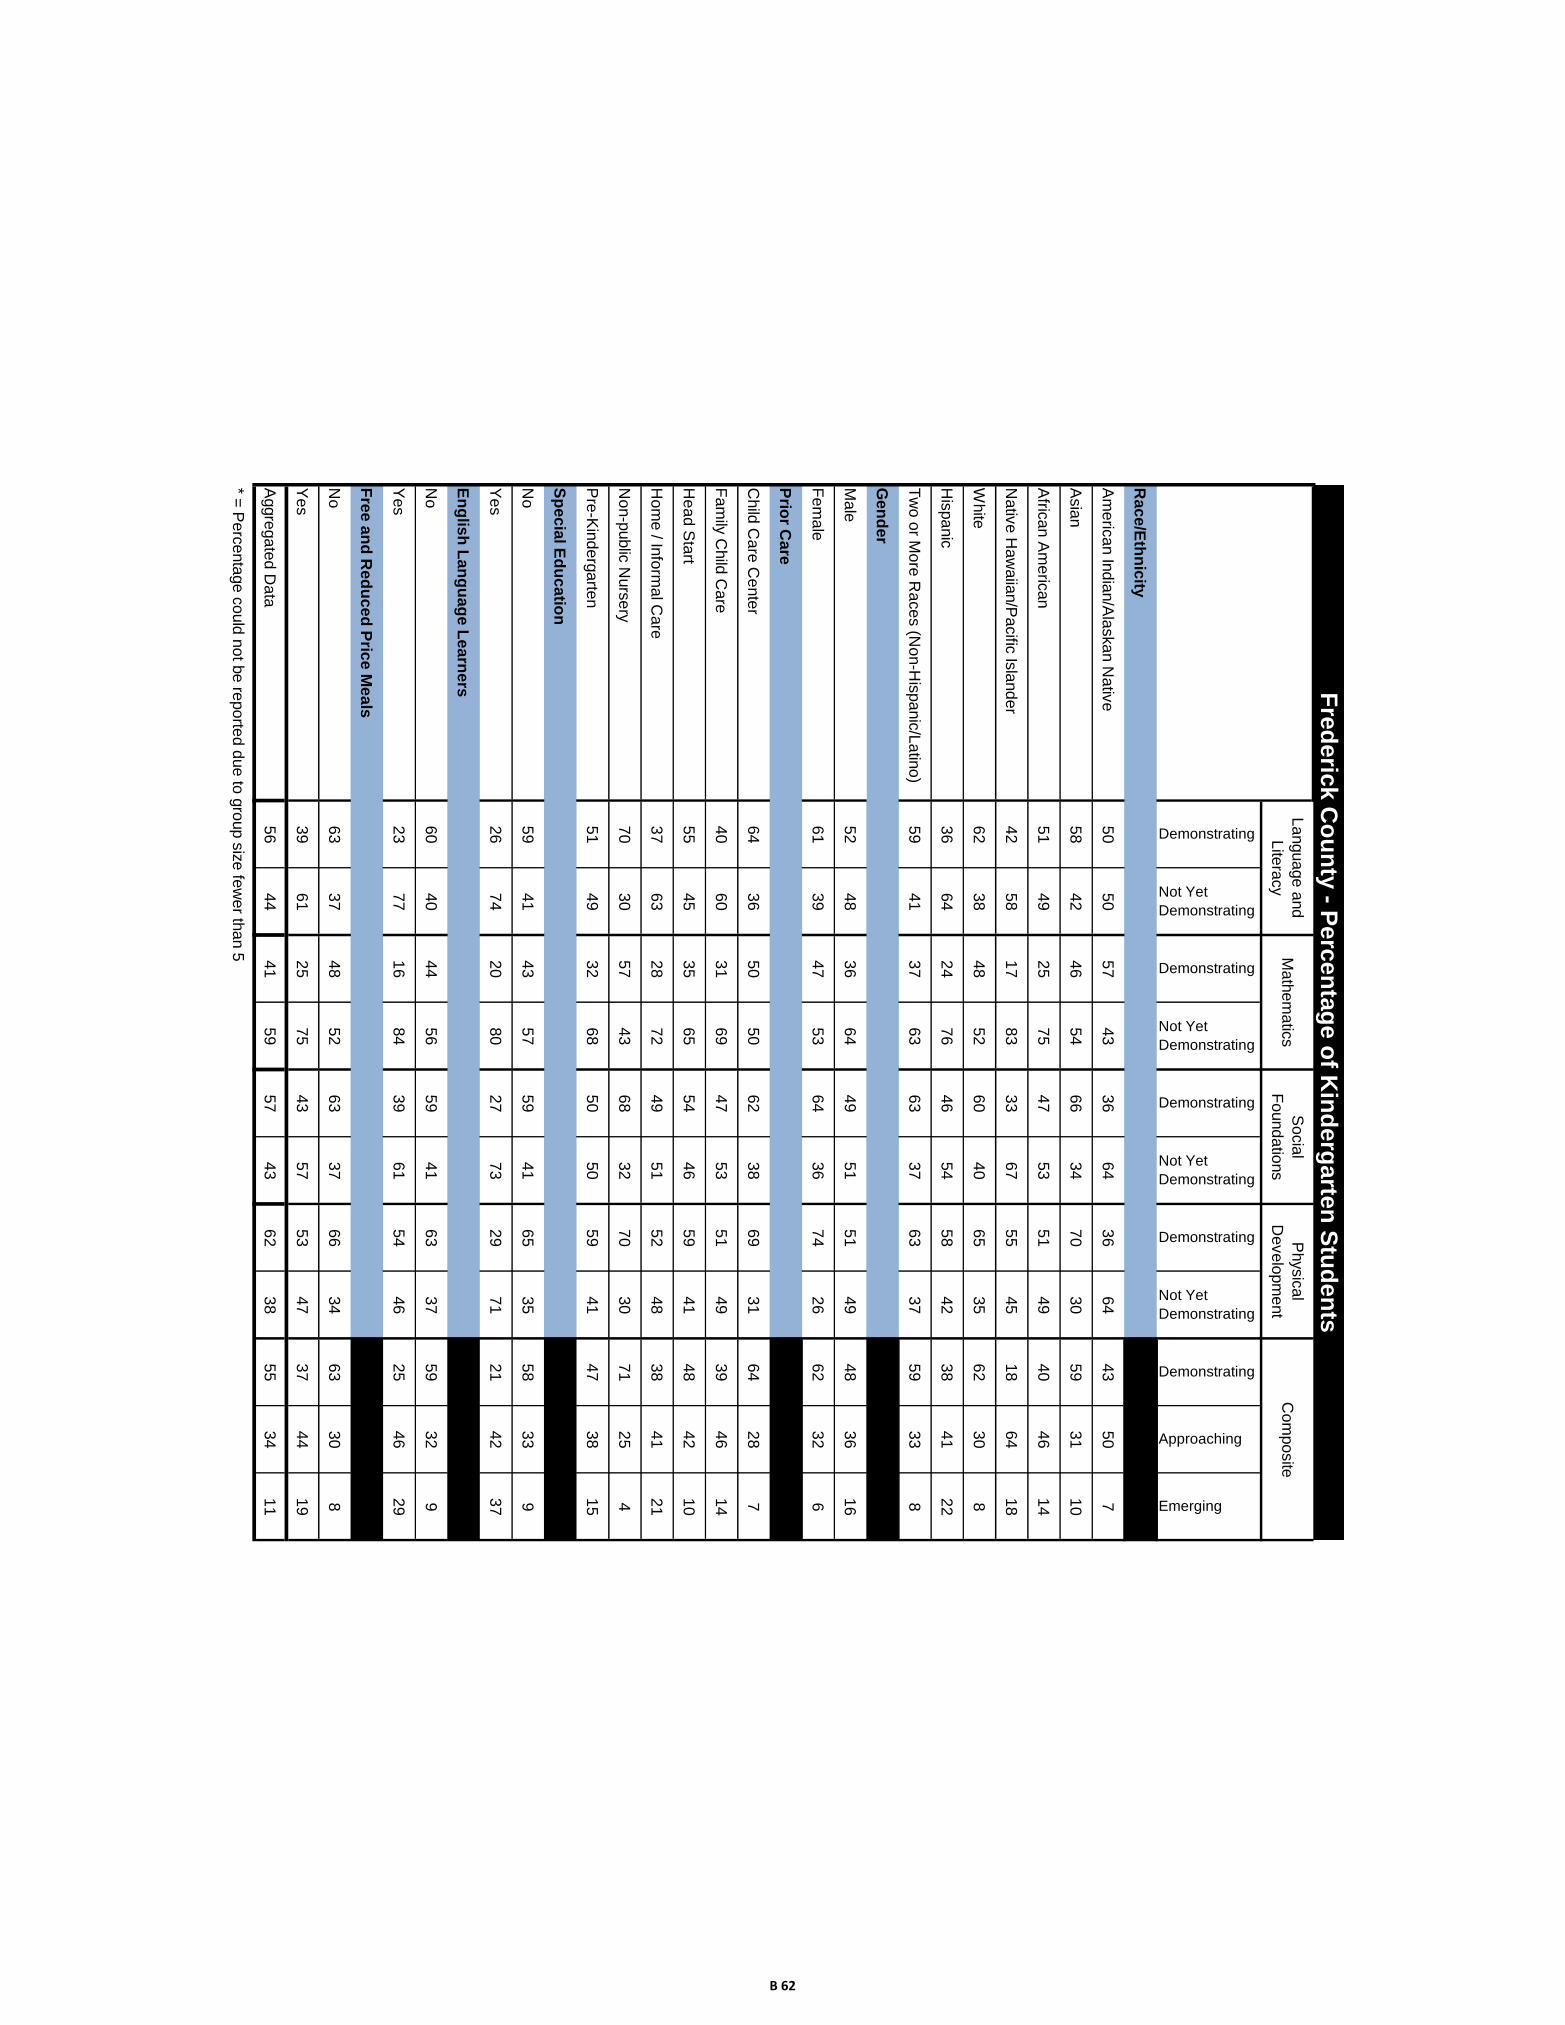
Demonstrating
Not Yet
Demonstrating
Demonstrating
Not Yet
Demonstrating
Demonstrating
Not Yet
Demonstrating
Demonstrating
Not Yet
Demonstrating
Demonstrating
Approaching
Emerging
Rac
e/E
thn
icity
Am
eric
an In
dia
n/A
laskan N
ativ
e5
05
05
74
33
66
43
66
44
35
07
Asia
n5
84
24
65
46
63
47
03
05
93
11
0
Afric
an A
meric
an
51
49
25
75
47
53
51
49
40
46
14
Nativ
e H
aw
aiia
n/P
acific
Isla
nde
r4
25
81
78
33
36
75
54
51
86
41
8
White
62
38
48
52
60
40
65
35
62
30
8
His
panic
36
64
24
76
46
54
58
42
38
41
22
Tw
o o
r More
Race
s (N
on-H
ispanic
/La
tino)
59
41
37
63
63
37
63
37
59
33
8
Gen
der
Male
52
48
36
64
49
51
51
49
48
36
16
Fem
ale
61
39
47
53
64
36
74
26
62
32
6
Prio
r Care
Child
Care
Cente
r6
43
65
05
06
23
86
93
16
42
87
Fam
ily C
hild
Care
40
60
31
69
47
53
51
49
39
46
14
Hea
d S
tart
55
45
35
65
54
46
59
41
48
42
10
Hom
e / In
form
al C
are
37
63
28
72
49
51
52
48
38
41
21
Non-p
ublic
Nurs
ery
70
30
57
43
68
32
70
30
71
25
4
Pre
-Kin
de
rgarte
n5
14
93
26
85
05
05
94
14
73
81
5
Sp
ec
ial E
du
ca
tion
No
59
41
43
57
59
41
65
35
58
33
9
Yes
26
74
20
80
27
73
29
71
21
42
37
En
glis
h L
an
gu
ag
e L
ea
rne
rs
No
60
40
44
56
59
41
63
37
59
32
9
Yes
23
77
16
84
39
61
54
46
25
46
29
Fre
e a
nd
Red
uce
d P
rice
Mea
ls
No
63
37
48
52
63
37
66
34
63
30
8
Yes
39
61
25
75
43
57
53
47
37
44
19
Aggre
gate
d D
ata
56
44
41
59
57
43
62
38
55
34
11
* = P
erc
enta
ge c
ould
not b
e re
porte
d d
ue to
gro
up s
ize fe
wer th
an 5
Fre
deric
k C
ou
nty
- Perc
en
tag
e o
f Kin
derg
arte
n S
tud
en
ts
Socia
l
Founda
tions
Physic
al
Develo
pm
ent
Com
posite
La
nguage a
nd
Lite
racy
Math
em
atic
s
B 62
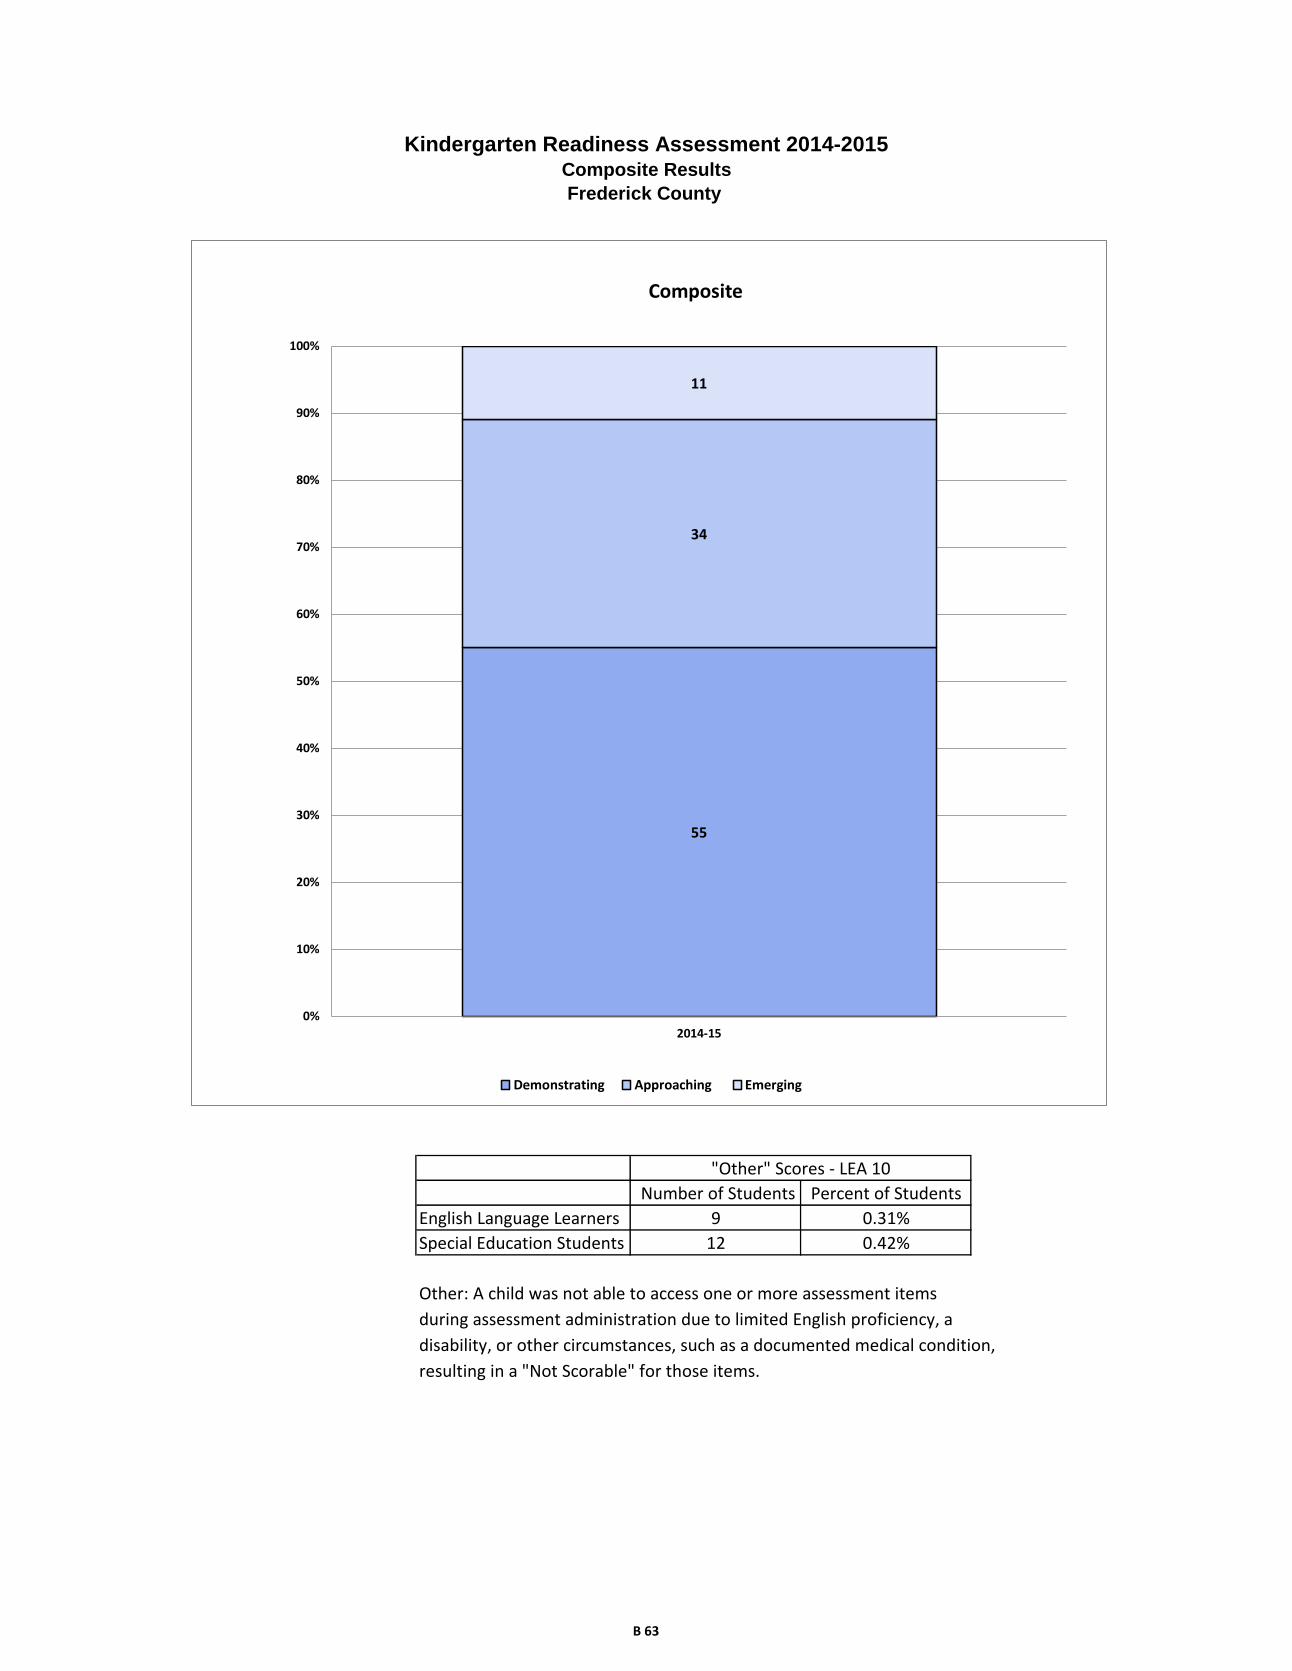
Other: A child was not able to access one or more assessment items
during assessment administration due to limited English proficiency, a
disability, or other circumstances, such as a documented medical condition,
resulting in a "Not Scorable" for those items.
Number of Students Percent of Students
English Language Learners 9
Kindergarten Readiness Assessment 2014-2015Composite Results
Frederick County
0.31%
Special Education Students 12 0.42%
"Other" Scores - LEA 10
55
34
11
0%
10%
20%
30%
40%
50%
60%
70%
80%
90%
100%
2014-15
Composite
Demonstrating Approaching Emerging
B 63
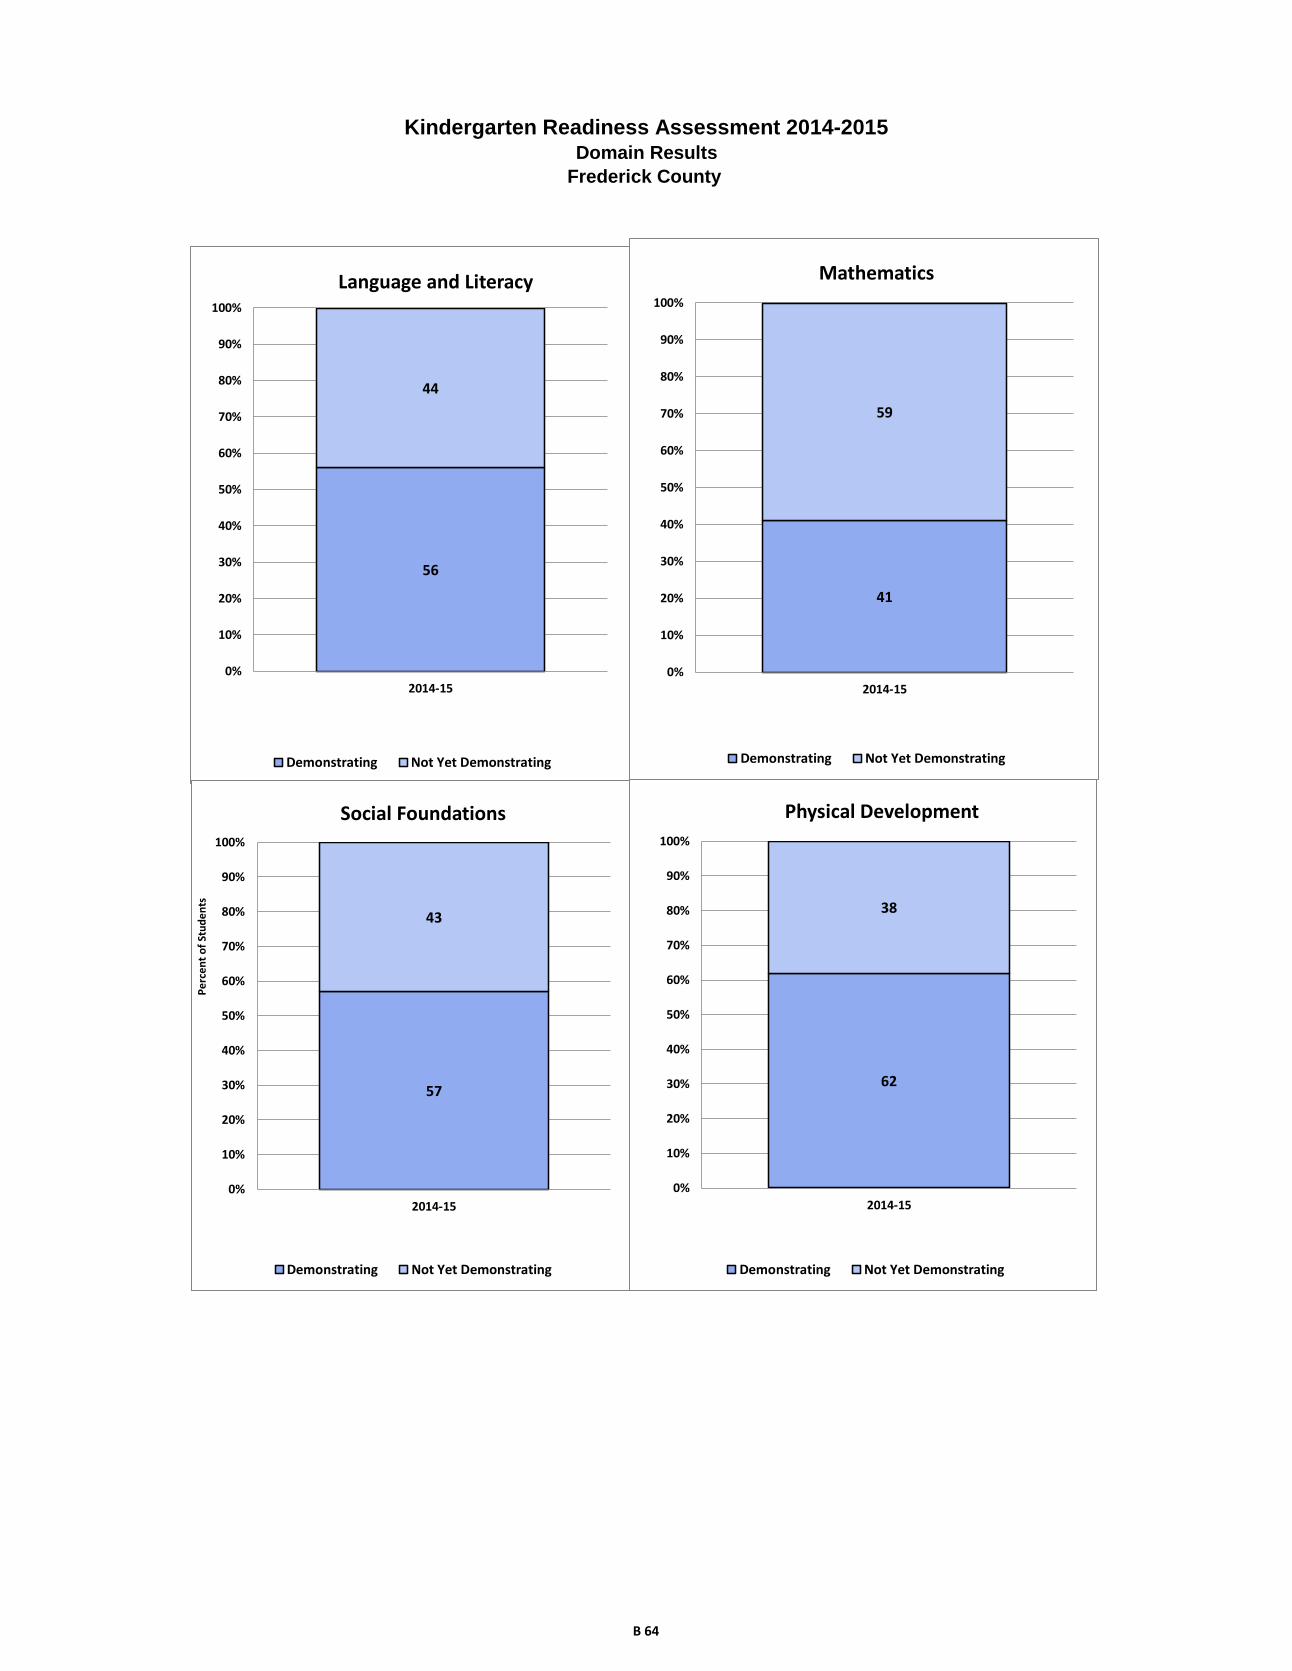
Kindergarten Readiness Assessment 2014-2015Domain Results
Frederick County
56
44
0%
10%
20%
30%
40%
50%
60%
70%
80%
90%
100%
2014-15
Language and Literacy
Demonstrating Not Yet Demonstrating
41
59
0%
10%
20%
30%
40%
50%
60%
70%
80%
90%
100%
2014-15
Mathematics
Demonstrating Not Yet Demonstrating
57
43
0%
10%
20%
30%
40%
50%
60%
70%
80%
90%
100%
2014-15
Social Foundations
Demonstrating Not Yet Demonstrating
Pe
rce
nt
of
Stu
de
nts
62
38
0%
10%
20%
30%
40%
50%
60%
70%
80%
90%
100%
2014-15
Physical Development
Demonstrating Not Yet Demonstrating
B 64
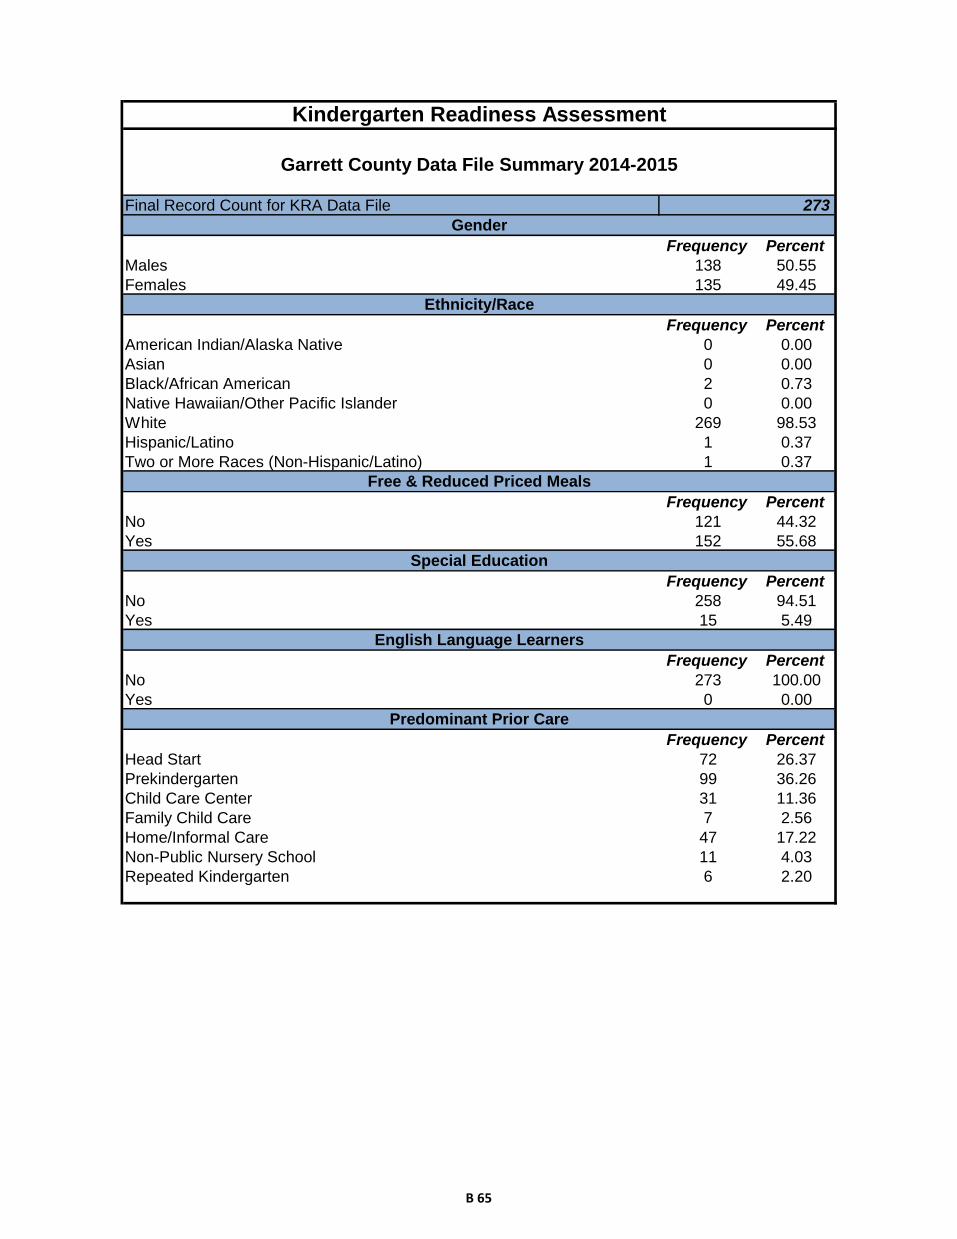
Frequency Percent
Males 138 50.55
Females 135 49.45
Frequency Percent
American Indian/Alaska Native 0 0.00
Asian 0 0.00
Black/African American 2 0.73
Native Hawaiian/Other Pacific Islander 0 0.00
White 269 98.53
Hispanic/Latino 1 0.37
Two or More Races (Non-Hispanic/Latino) 1 0.37
Frequency Percent
No 121 44.32
Yes 152 55.68
Frequency Percent
No 258 94.51
Yes 15 5.49
Frequency Percent
No 273 100.00
Yes 0 0.00
Frequency Percent
Head Start 72 26.37
Prekindergarten 99 36.26
Child Care Center 31 11.36
Family Child Care 7 2.56
Home/Informal Care 47 17.22
Non-Public Nursery School 11 4.03
Repeated Kindergarten 6 2.20
Free & Reduced Priced Meals
Special Education
English Language Learners
Predominant Prior Care
Final Record Count for KRA Data File 273
Kindergarten Readiness Assessment
Garrett County Data File Summary 2014-2015
Gender
Ethnicity/Race
B 65

Demonstrating
Not Yet
Demonstrating
Demonstrating
Not Yet
Demonstrating
Demonstrating
Not Yet
Demonstrating
Demonstrating
Not Yet
Demonstrating
Demonstrating
Approaching
Emerging
Rac
e/E
thn
icity
Am
eric
an In
dia
n/A
laskan N
ativ
e*
**
**
**
**
**
Asia
n*
**
**
**
**
**
Afric
an A
meric
an
**
**
**
**
**
*
Nativ
e H
aw
aiia
n/P
acific
Isla
nde
r*
**
**
**
**
**
White
15
61
13
13
81
31
16
51
04
17
39
61
48
94
27
His
panic
**
**
**
**
**
*
Tw
o o
r More
Race
s (N
on-H
ispanic
/La
tino)
**
**
**
**
**
*
Gen
der
Male
72
66
73
65
72
66
77
61
65
56
17
Fem
ale
84
51
66
69
94
41
99
36
84
40
11
Prio
r Care
Child
Care
Cente
r2
11
01
81
31
81
32
01
12
08
3
Fam
ily C
hild
Care
61
61
61
61
61
0
Hea
d S
tart
31
41
30
42
37
35
39
33
29
31
12
Hom
e / In
form
al C
are
20
27
21
26
26
21
28
19
21
21
5
Non-p
ublic
Nurs
ery
65
65
65
83
55
1
Pre
-Kin
de
rgarte
n7
02
95
64
37
12
87
42
56
62
85
Sp
ec
ial E
du
ca
tion
No
14
91
09
13
41
24
15
99
91
72
86
14
49
02
4
Yes
78
51
07
84
11
56
4
En
glis
h L
an
gu
ag
e L
ea
rne
rs
No
15
61
17
13
91
34
16
61
07
17
69
71
49
96
28
Yes
**
**
**
**
**
*
Fre
e a
nd
Red
uce
d P
rice
Mea
ls
No
83
38
73
48
83
38
87
34
81
34
6
Yes
73
79
66
86
83
69
89
63
68
62
22
Aggre
gate
d D
ata
15
61
17
13
91
34
16
61
07
17
69
71
49
96
28
* = G
roup s
ize fe
wer th
an 5
Garre
tt Co
un
ty - N
um
ber o
f Kin
derg
arte
n S
tud
en
ts
Socia
l
Founda
tions
Physic
al
Develo
pm
ent
La
nguage a
nd
Lite
racy
Math
em
atic
sC
om
posite
B 66

Demonstrating
Not Yet
Demonstrating
Demonstrating
Not Yet
Demonstrating
Demonstrating
Not Yet
Demonstrating
Demonstrating
Not Yet
Demonstrating
Demonstrating
Approaching
Emerging
Rac
e/E
thn
icity
Am
eric
an In
dia
n/A
laskan N
ativ
e*
**
**
**
**
**
Asia
n*
**
**
**
**
**
Afric
an A
meric
an
**
**
**
**
**
*
Nativ
e H
aw
aiia
n/P
acific
Isla
nde
r*
**
**
**
**
**
White
58
42
51
49
61
39
64
36
55
35
10
His
panic
**
**
**
**
**
*
Tw
o o
r More
Race
s (N
on-H
ispanic
/La
tino)
**
**
**
**
**
*
Gen
der
Male
52
48
53
47
52
48
56
44
47
41
12
Fem
ale
62
38
49
51
70
30
73
27
62
30
8
Prio
r Care
Child
Care
Cente
r6
83
25
84
25
84
26
53
56
52
61
0
Fam
ily C
hild
Care
86
14
86
14
86
14
86
14
86
14
0
Hea
d S
tart
43
57
42
58
51
49
54
46
40
43
17
Hom
e / In
form
al C
are
43
57
45
55
55
45
60
40
45
45
11
Non-p
ublic
Nurs
ery
55
45
55
45
55
45
73
27
45
45
9
Pre
-Kin
de
rgarte
n7
12
95
74
37
22
87
52
56
72
85
Sp
ec
ial E
du
ca
tion
No
58
42
52
48
62
38
67
33
56
35
9
Yes
47
53
33
67
47
53
27
73
33
40
27
En
glis
h L
an
gu
ag
e L
ea
rne
rs
No
57
43
51
49
61
39
64
36
55
35
10
Yes
**
**
**
**
**
*
Fre
e a
nd
Red
uce
d P
rice
Mea
ls
No
69
31
60
40
69
31
72
28
67
28
5
Yes
48
52
43
57
55
45
59
41
45
41
14
Aggre
gate
d D
ata
57
43
51
49
61
39
64
36
55
35
10
* = P
erc
enta
ge c
ould
not b
e re
porte
d d
ue to
gro
up s
ize fe
wer th
an 5
Socia
l
Founda
tions
Physic
al
Develo
pm
ent
Com
posite
Garre
tt Co
un
ty - P
erc
en
tag
e o
f Kin
derg
arte
n S
tud
en
ts
La
nguage a
nd
Lite
racy
Math
em
atic
s
B 67
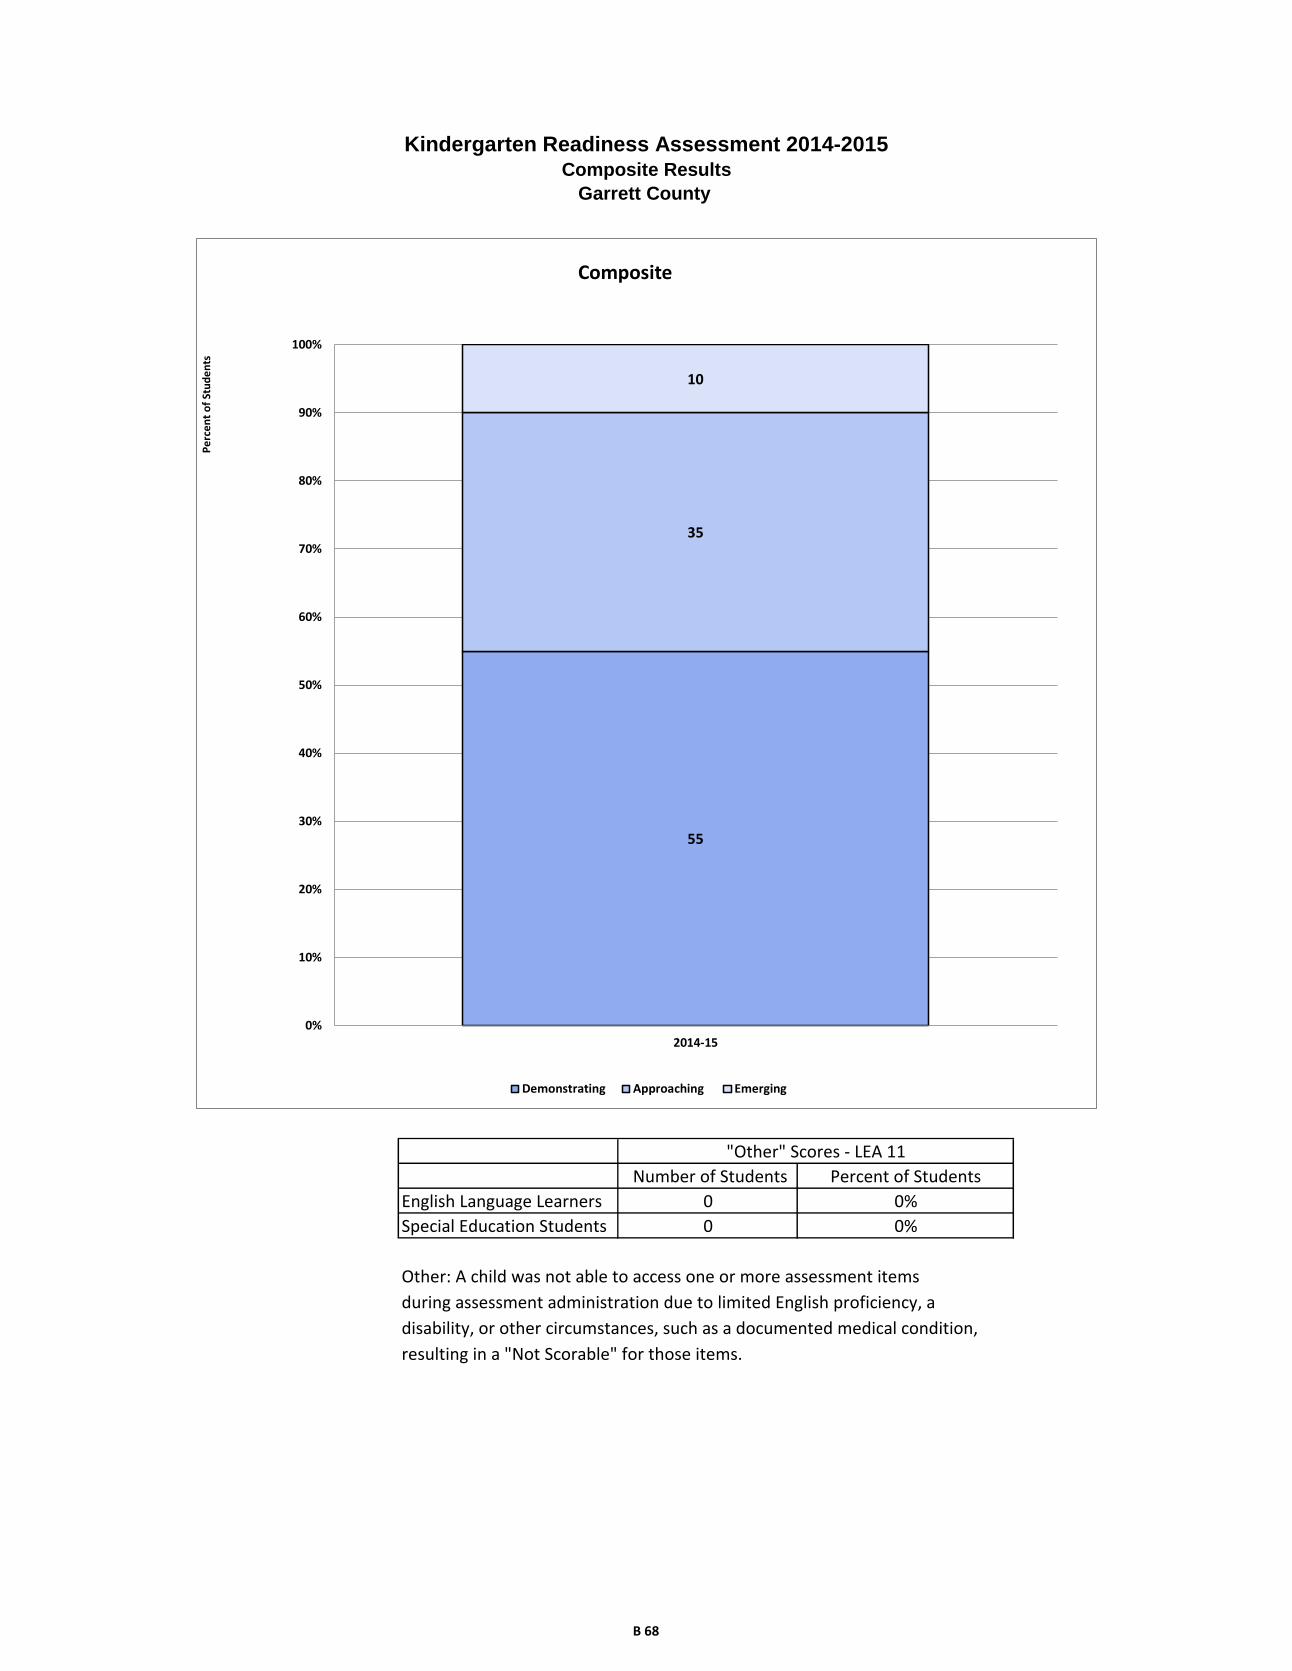
Other: A child was not able to access one or more assessment items
during assessment administration due to limited English proficiency, a
disability, or other circumstances, such as a documented medical condition,
resulting in a "Not Scorable" for those items.
English Language Learners 0 0%
Special Education Students 0 0%
Kindergarten Readiness Assessment 2014-2015Composite Results
Garrett County
"Other" Scores - LEA 11
Number of Students Percent of Students
55
35
10
0%
10%
20%
30%
40%
50%
60%
70%
80%
90%
100%
2014-15
Composite
Demonstrating Approaching Emerging
Pe
rce
nt
of
Stu
de
nts
B 68
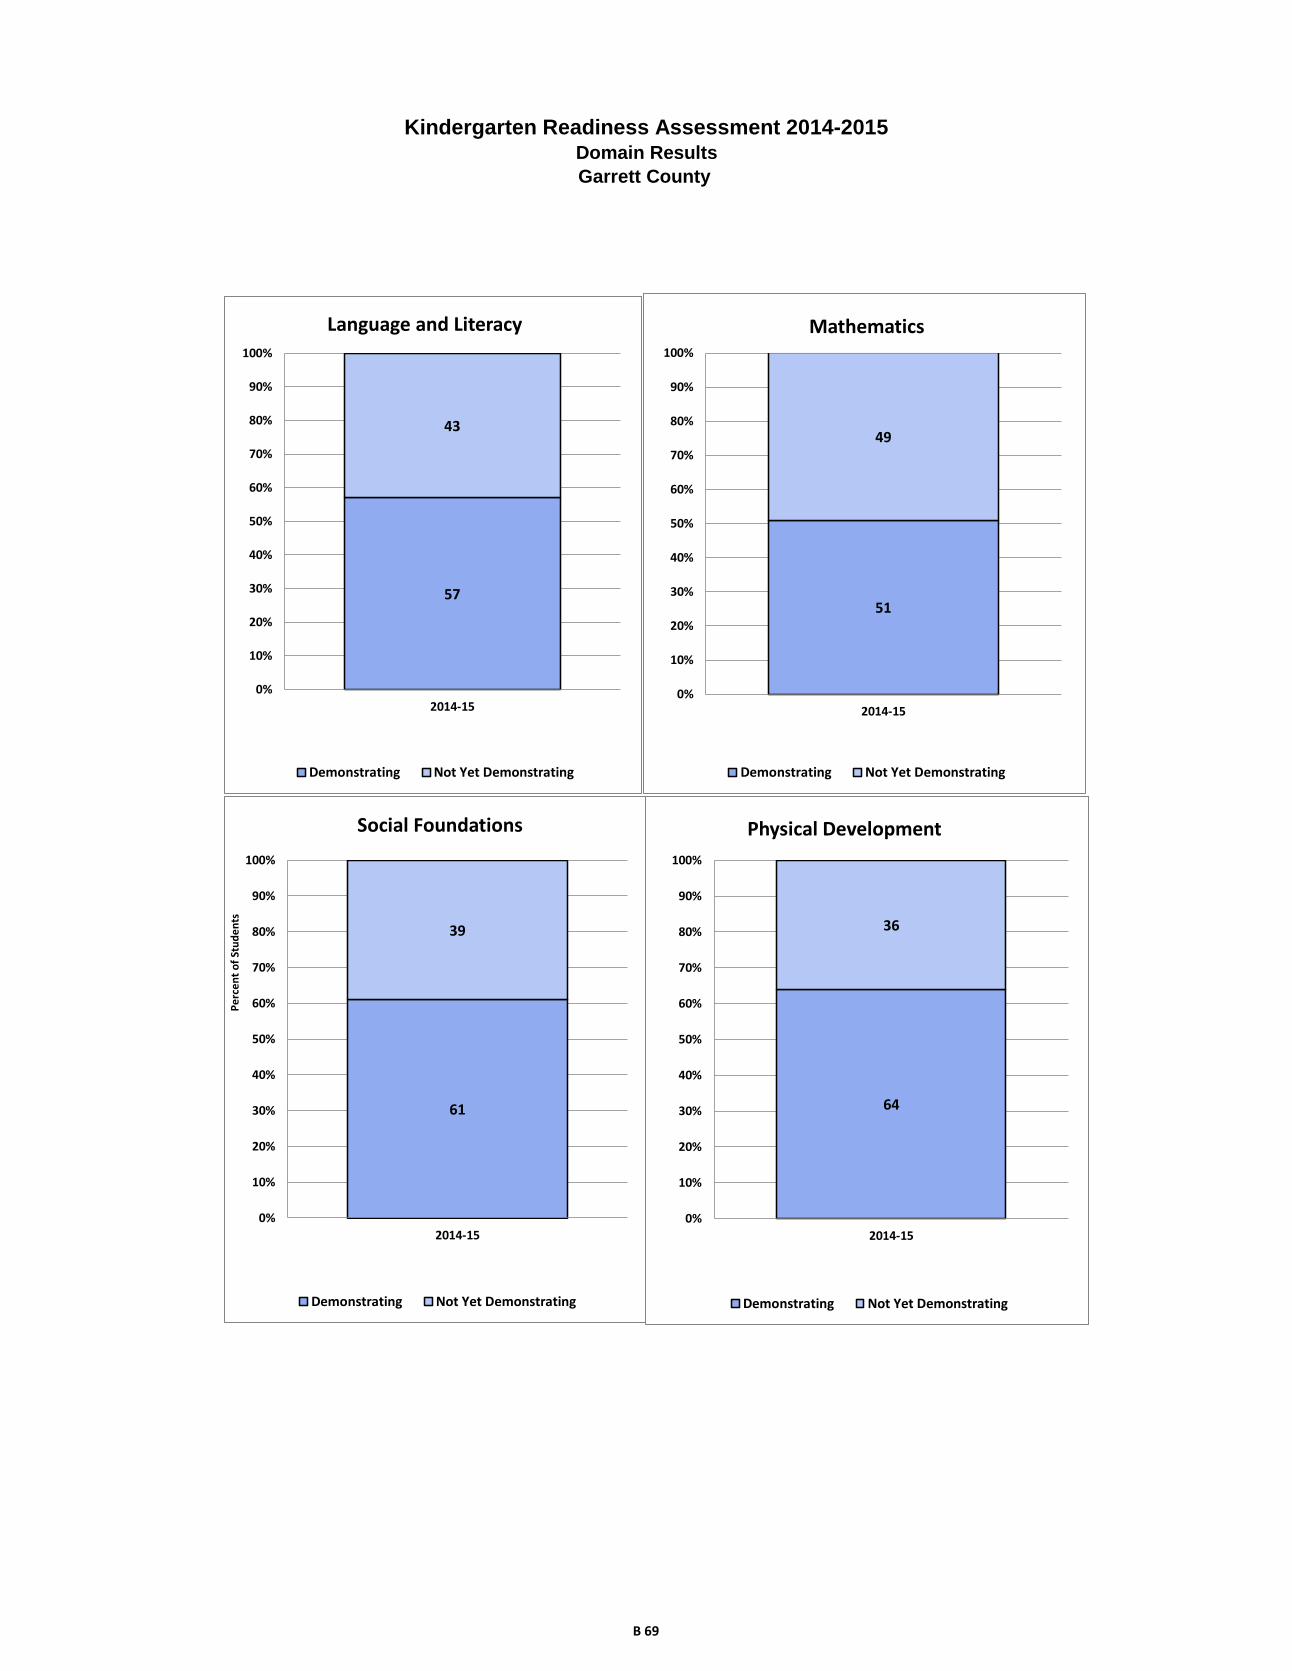
Kindergarten Readiness Assessment 2014-2015Domain Results
Garrett County
57
43
0%
10%
20%
30%
40%
50%
60%
70%
80%
90%
100%
2014-15
Language and Literacy
Demonstrating Not Yet Demonstrating
51
49
0%
10%
20%
30%
40%
50%
60%
70%
80%
90%
100%
2014-15
Mathematics
Demonstrating Not Yet Demonstrating
61
39
0%
10%
20%
30%
40%
50%
60%
70%
80%
90%
100%
2014-15
Social Foundations
Demonstrating Not Yet Demonstrating
Pe
rce
nt
of
Stu
de
nts
64
36
0%
10%
20%
30%
40%
50%
60%
70%
80%
90%
100%
2014-15
Physical Development
Demonstrating Not Yet Demonstrating
B 69

Frequency Percent
Males 1357 51.27
Females 1290 48.73
Frequency Percent
American Indian/Alaska Native 4 0.15
Asian 79 2.98
Black/African American 446 16.85
Native Hawaiian/Other Pacific Islander 7 0.26
White 1730 65.36
Hispanic/Latino 180 6.80
Two or More Races (Non-Hispanic/Latino) 201 7.59
Frequency Percent
No 1736 65.58
Yes 911 34.42
Frequency Percent
No 2446 92.41
Yes 201 7.59
Frequency Percent
No 2579 97.43
Yes 68 2.57
Frequency Percent
Head Start 65 2.46
Prekindergarten 1073 40.54
Child Care Center 430 16.24
Family Child Care 136 5.14
Home/Informal Care 469 17.72
Non-Public Nursery School 457 17.26
Repeated Kindergarten 34 1.28
Kindergarten Readiness Assessment
Harford County Data File Summary 2014-2015
Gender
Ethnicity/Race
Free & Reduced Priced Meals
Special Education
English Language Learners
Predominant Prior Care
Final Record Count for KRA Data File 2647
B 70

Demonstrating
Not Yet
Demonstrating
Demonstrating
Not Yet
Demonstrating
Demonstrating
Not Yet
Demonstrating
Demonstrating
Not Yet
Demonstrating
Demonstrating
Approaching
Emerging
Rac
e/E
thn
icity
Am
eric
an In
dia
n/A
laskan N
ativ
e*
**
**
**
**
**
Asia
n3
04
64
53
33
64
24
53
33
42
81
4
Afric
an A
meric
an
15
32
91
16
52
78
15
92
84
17
62
68
15
21
78
11
2
Nativ
e H
aw
aiia
n/P
acific
Isla
nde
r2
52
50
72
51
33
White
87
38
45
1,0
64
64
28
34
88
78
81
84
19
08
60
01
93
His
panic
57
11
87
69
96
91
09
76
10
16
37
53
4
Tw
o o
r More
Race
s (N
on-H
ispanic
/La
tino)
83
11
81
00
10
08
11
20
98
10
38
58
92
6
Gen
der
Male
56
57
80
70
26
37
50
58
44
51
58
33
54
05
46
24
7
Fem
ale
63
46
46
75
15
23
67
56
08
76
65
19
70
44
29
13
6
Prio
r Care
Child
Care
Cente
r2
30
19
72
67
16
01
85
24
42
07
22
22
21
15
84
6
Fam
ily C
hild
Care
61
69
67
62
53
77
59
71
61
43
25
Hea
d S
tart
23
42
28
37
29
36
31
34
25
28
12
Hom
e / In
form
al C
are
13
23
32
18
22
85
16
23
06
18
72
82
14
81
93
12
1
Non-p
ublic
Nurs
ery
24
62
10
31
21
40
25
32
04
25
81
99
27
71
42
32
Pre
-Kin
de
rgarte
n4
99
56
65
84
47
14
90
57
55
30
53
75
02
40
41
45
Sp
ec
ial E
du
ca
tion
No
1,1
61
1,2
70
1,3
93
1,0
27
1,1
35
1,3
04
1,2
39
1,2
01
1,2
05
92
12
85
Yes
38
15
66
01
33
45
14
84
21
51
39
54
98
En
glis
h L
an
gu
ag
e L
ea
rne
rs
No
11
94
13
68
14
38
11
08
11
65
13
99
12
57
13
08
12
34
94
93
56
Yes
55
81
55
21
55
32
44
41
02
62
7
Fre
e a
nd
Red
uce
d P
rice
Mea
ls
No
88
78
37
1,0
53
66
08
34
89
58
94
83
69
12
60
21
92
Yes
31
25
89
40
05
00
34
65
57
38
75
16
33
23
73
19
1
Aggre
gate
d D
ata
1,1
99
1,4
26
1,4
53
1,1
60
1,1
80
1,4
52
1,2
81
1,3
52
1,2
44
97
53
83
* = G
roup s
ize fe
wer th
an 5
Harfo
rd C
ou
nty
- Nu
mb
er o
f Kin
derg
arte
n S
tud
en
ts
Socia
l
Founda
tions
Physic
al
Develo
pm
ent
La
nguage a
nd
Lite
racy
Math
em
atic
sC
om
posite
B 71

Demonstrating
Not Yet
Demonstrating
Demonstrating
Not Yet
Demonstrating
Demonstrating
Not Yet
Demonstrating
Demonstrating
Not Yet
Demonstrating
Demonstrating
Approaching
Emerging
Rac
e/E
thn
icity
Am
eric
an In
dia
n/A
laskan N
ativ
e*
**
**
**
**
**
Asia
n3
96
15
84
24
65
45
84
24
53
71
8
Afric
an A
meric
an
34
66
37
63
36
64
40
60
34
40
25
Nativ
e H
aw
aiia
n/P
acific
Isla
nde
r2
97
12
97
10
10
02
97
11
44
34
3
White
51
49
62
38
48
52
51
49
53
35
11
His
panic
33
67
43
57
39
61
43
57
37
44
20
Tw
o o
r More
Race
s (N
on-H
ispanic
/La
tino)
41
59
50
50
40
60
49
51
43
45
13
Gen
der
Male
42
58
52
48
37
63
38
62
41
41
19
Fem
ale
50
50
59
41
53
47
60
40
55
34
11
Prio
r Care
Child
Care
Cente
r5
44
66
33
74
35
74
85
25
23
71
1
Fam
ily C
hild
Care
47
53
52
48
41
59
45
55
47
33
19
Hea
d S
tart
35
65
43
57
45
55
48
52
38
43
18
Hom
e / In
form
al C
are
28
72
39
61
35
65
40
60
32
42
26
Non-p
ublic
Nurs
ery
54
46
69
31
55
45
56
44
61
31
7
Pre
-Kin
de
rgarte
n4
75
35
54
54
65
45
05
04
83
81
4
Sp
ec
ial E
du
ca
tion
No
48
52
58
42
47
53
51
49
50
38
12
Yes
20
80
31
69
23
77
22
78
20
28
51
En
glis
h L
an
gu
ag
e L
ea
rne
rs
No
47
53
56
44
45
55
49
51
49
37
14
Yes
89
22
27
82
27
83
56
51
64
14
3
Fre
e a
nd
Red
uce
d P
rice
Mea
ls
No
51
49
61
39
48
52
52
48
53
35
11
Yes
35
65
44
56
38
62
43
57
37
42
21
Aggre
gate
d D
ata
46
54
56
44
45
55
49
51
48
37
15
* = P
erc
enta
ge c
ould
not b
e re
porte
d d
ue to
gro
up s
ize fe
wer th
an 5
Socia
l
Founda
tions
Physic
al
Develo
pm
ent
Com
posite
Harfo
rd C
ou
nty
- Perc
en
tag
e o
f Kin
derg
arte
n S
tud
en
ts
La
nguage a
nd
Lite
racy
Math
em
atic
s
B 72
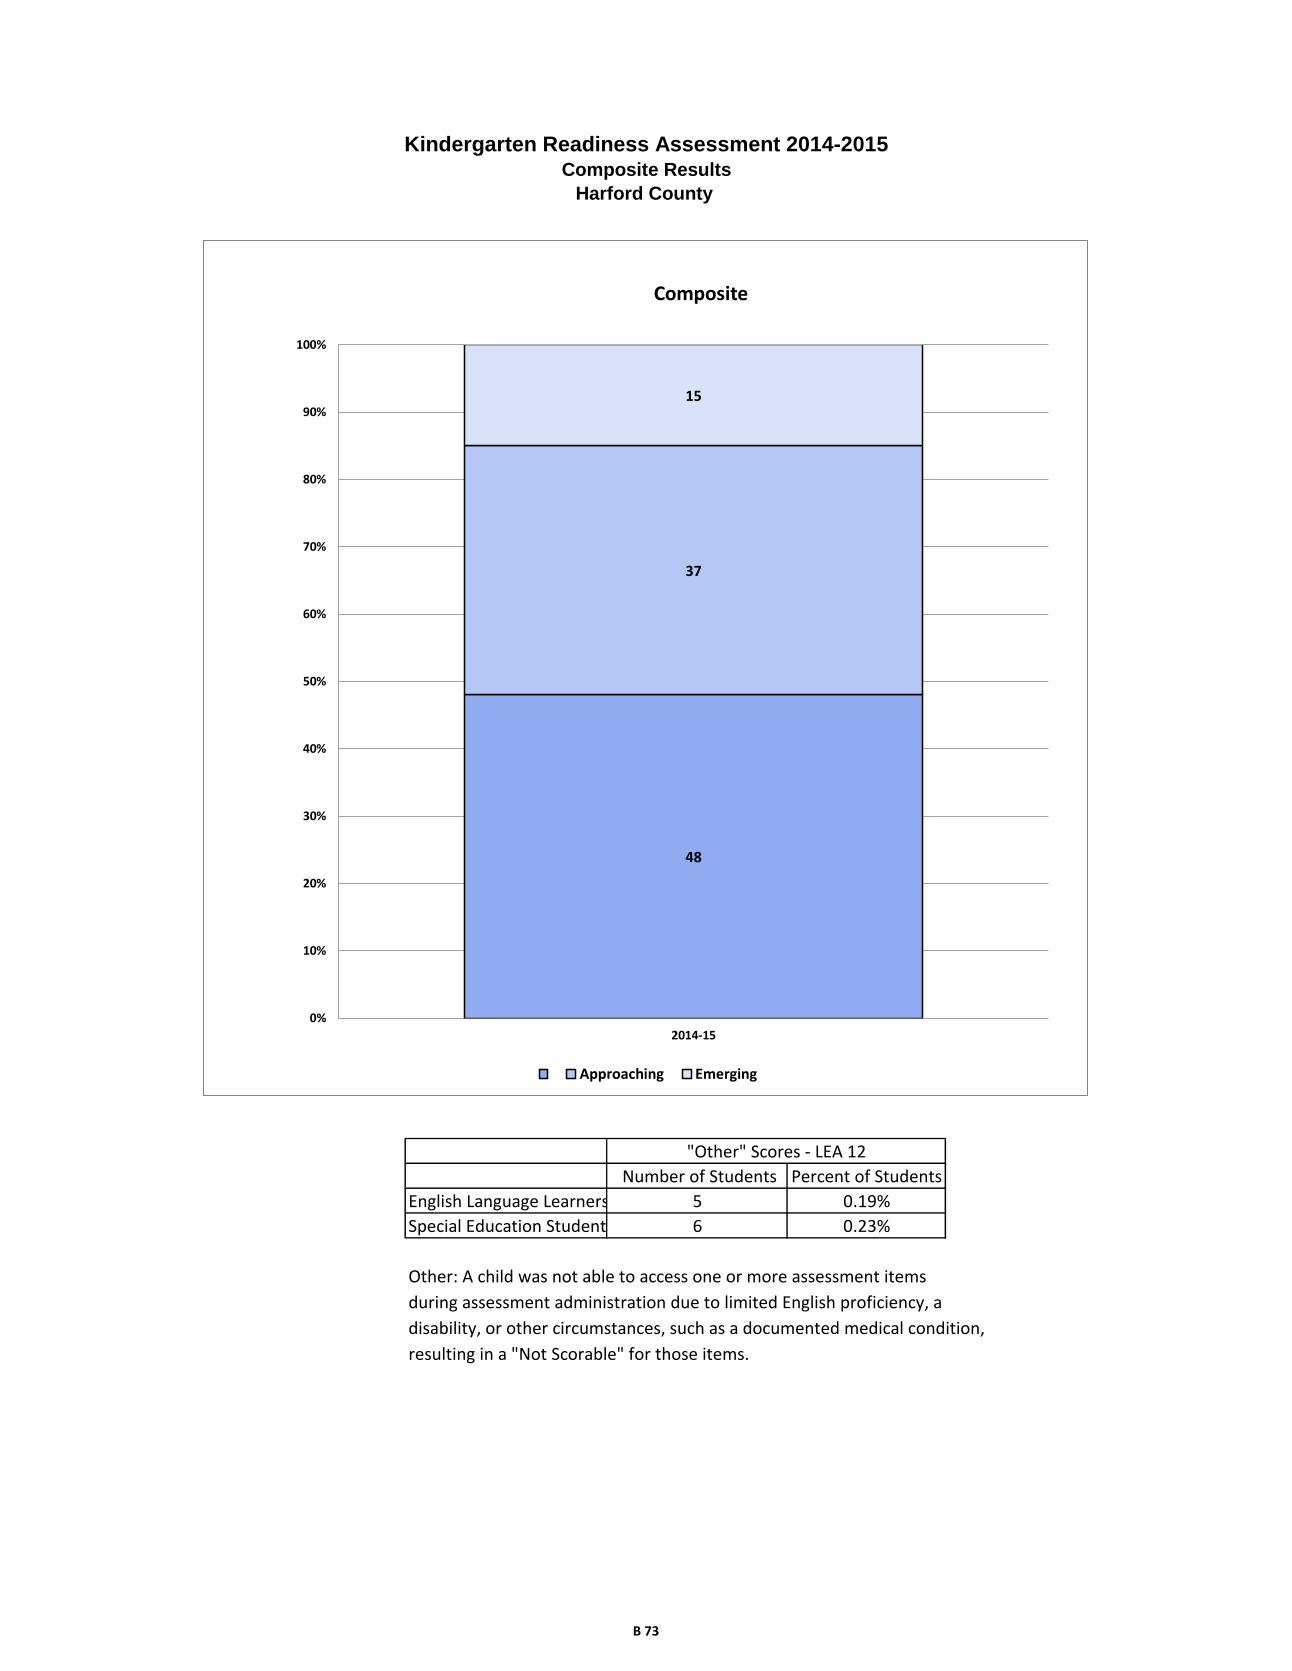
Other: A child was not able to access one or more assessment items
during assessment administration due to limited English proficiency, a
disability, or other circumstances, such as a documented medical condition,
resulting in a "Not Scorable" for those items.
"Other" Scores - LEA 12
Number of Students Percent of Students
English Language Learners 5
Harford County
0.19%
Kindergarten Readiness Assessment 2014-2015Composite Results
Special Education Students 6 0.23%
48
37
15
0%
10%
20%
30%
40%
50%
60%
70%
80%
90%
100%
2014-15
Composite
Approaching Emerging
B 73
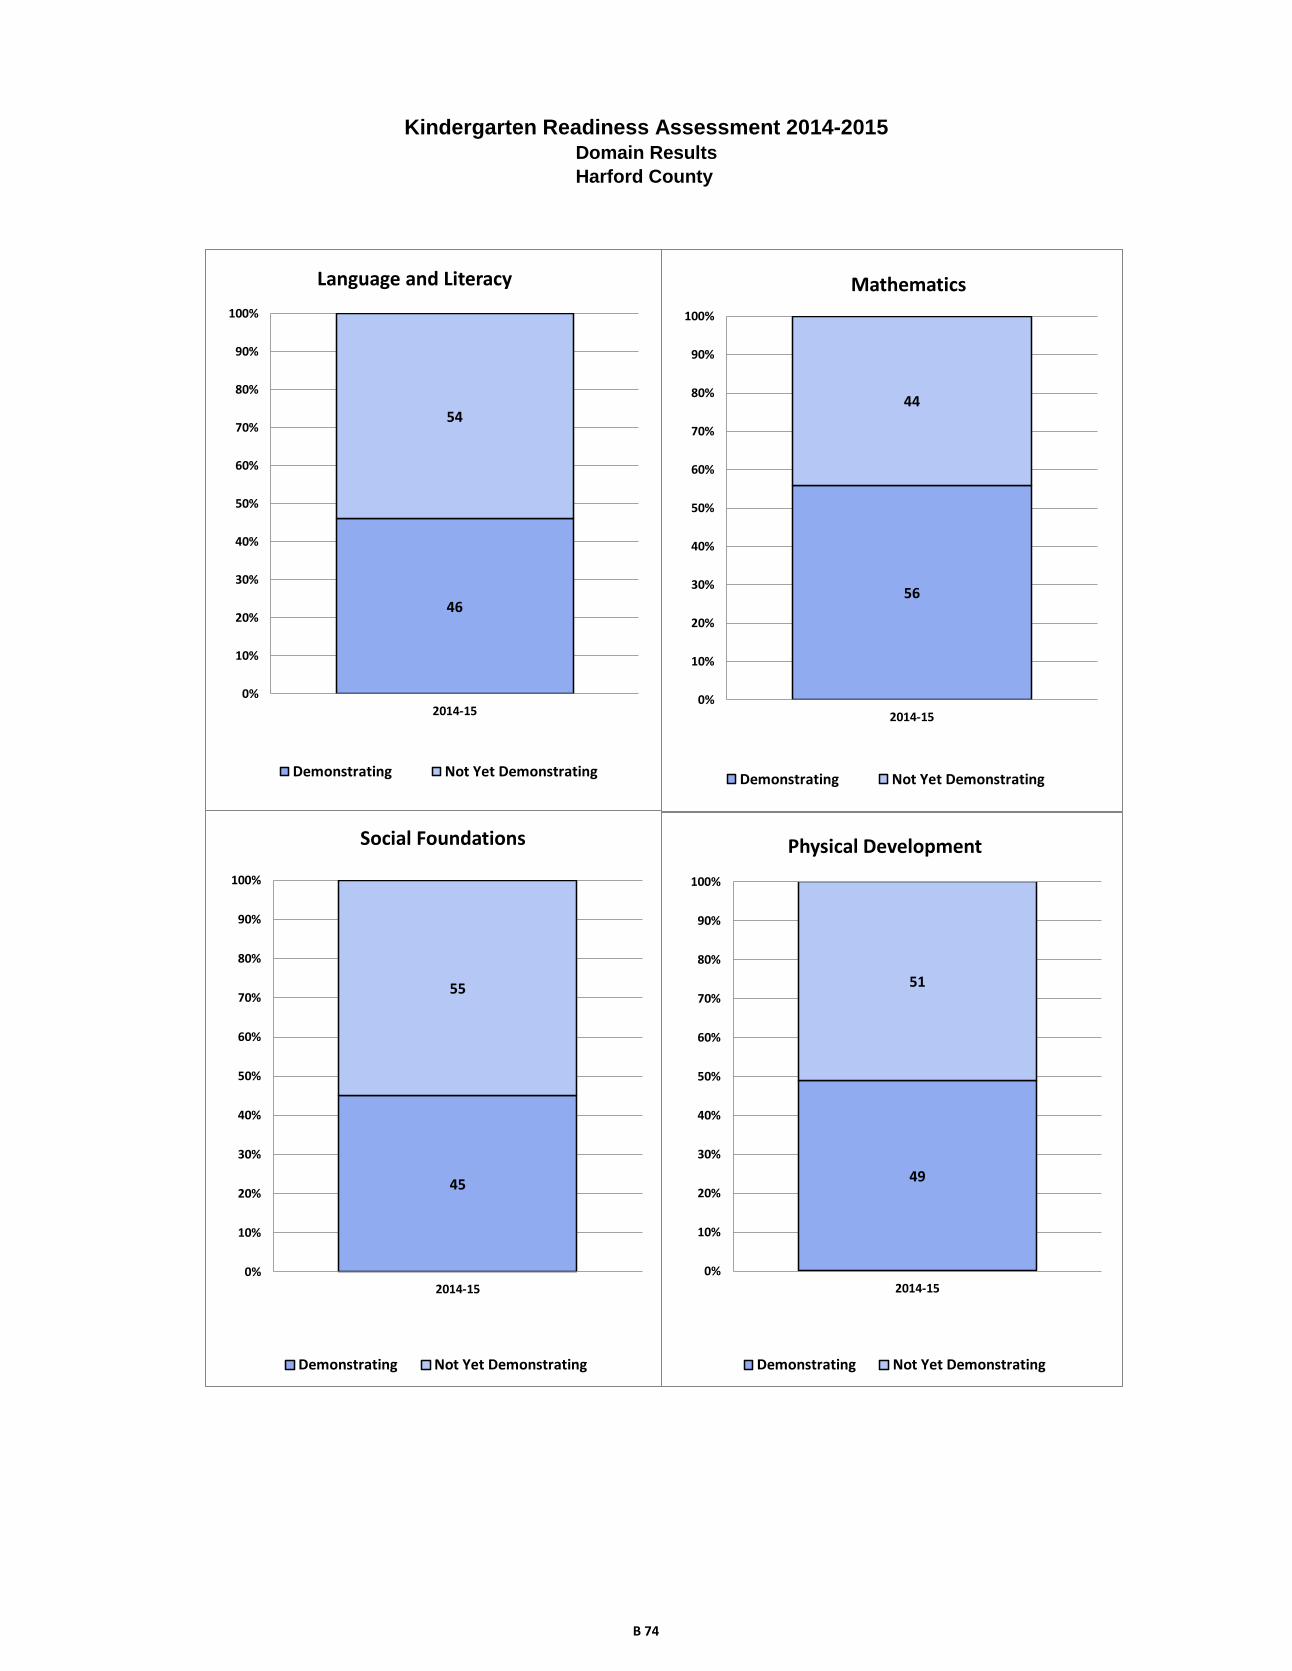
Kindergarten Readiness Assessment 2014-2015Domain Results
Harford County
46
54
0%
10%
20%
30%
40%
50%
60%
70%
80%
90%
100%
2014-15
Language and Literacy
Demonstrating Not Yet Demonstrating
56
44
0%
10%
20%
30%
40%
50%
60%
70%
80%
90%
100%
2014-15
Mathematics
Demonstrating Not Yet Demonstrating
45
55
0%
10%
20%
30%
40%
50%
60%
70%
80%
90%
100%
2014-15
Social Foundations
Demonstrating Not Yet Demonstrating
49
51
0%
10%
20%
30%
40%
50%
60%
70%
80%
90%
100%
2014-15
Physical Development
Demonstrating Not Yet Demonstrating
B 74

Frequency Percent
Males 1871 51.43
Females 1767 48.57
Frequency Percent
American Indian/Alaska Native 7 0.19
Asian 813 22.35
Black/African American 753 20.70
Native Hawaiian/Other Pacific Islander 8 0.22
White 1423 39.11
Hispanic/Latino 367 10.09
Two or More Races (Non-Hispanic/Latino) 267 7.34
Frequency Percent
No 2774 76.25
Yes 863 23.72
Frequency Percent
No 3338 91.75
Yes 299 8.22
Frequency Percent
No 3206 88.13
Yes 431 11.85
Frequency Percent
Head Start 139 3.82
Prekindergarten 944 25.95
Child Care Center 896 24.63
Family Child Care 100 2.75
Home/Informal Care 397 10.91
Non-Public Nursery School 994 27.32
Repeated Kindergarten 40 1.10
Free & Reduced Priced Meals
Special Education
English Language Learners
Predominant Prior Care
Final Record Count for KRA Data File 3638
Kindergarten Readiness Assessment
Howard County Data File Summary 2014-2015
Gender
Ethnicity/Race
B 75

Demonstrating
Not Yet
Demonstrating
Demonstrating
Not Yet
Demonstrating
Demonstrating
Not Yet
Demonstrating
Demonstrating
Not Yet
Demonstrating
Demonstrating
Approaching
Emerging
Rac
e/E
thn
icity
Am
eric
an In
dia
n/A
laskan N
ativ
e2
53
42
55
21
51
Asia
n4
39
35
74
70
32
04
61
32
65
31
25
34
48
24
08
0
Afric
an A
meric
an
34
23
94
30
14
17
33
83
78
35
83
70
31
02
85
10
2
Nativ
e H
aw
aiia
n/P
acific
Isla
nde
r6
25
35
24
34
21
White
94
04
60
95
44
28
85
05
45
85
15
36
90
53
80
79
His
panic
12
12
36
11
22
46
15
22
08
19
01
71
12
91
28
93
Tw
o o
r More
Race
s (N
on-H
ispanic
/La
tino)
15
31
09
14
71
14
15
21
11
15
41
08
15
37
53
0
Gen
der
Male
97
88
53
98
38
23
88
09
40
87
39
44
88
46
42
24
3
Fem
ale
1,0
25
71
01,0
09
70
91,0
80
63
51,2
20
49
91
,06
64
73
14
3
Prio
r Care
Child
Care
Cente
r5
94
29
35
71
29
75
18
35
65
32
33
35
43
25
95
0
Fam
ily C
hild
Care
52
44
50
46
53
45
54
43
50
35
10
Hea
d S
tart
46
93
44
91
60
73
72
64
46
59
27
Hom
e / In
form
al C
are
13
52
55
14
32
40
19
01
90
19
21
89
14
41
40
82
Non-p
ublic
Nurs
ery
71
62
69
71
02
73
63
73
44
66
83
16
70
82
29
37
Pre
-Kin
de
rgarte
n3
81
53
43
97
51
04
20
49
64
85
43
53
76
34
71
61
Sp
ec
ial E
du
ca
tion
No
1,9
37
1,3
56
1,9
15
1,3
36
1,8
92
1,3
56
2,0
26
1,2
22
1,8
92
1,0
15
28
0
Yes
66
20
67
71
95
68
21
86
72
20
58
10
01
05
En
glis
h L
an
gu
ag
e L
ea
rners
No
19
20
12
34
18
81
12
31
18
12
13
11
18
81
12
40
18
55
93
72
65
Yes
83
32
81
11
30
01
48
26
32
12
20
29
51
78
12
0
Fre
e a
nd
Red
uce
d P
rice
Mea
ls
No
1,7
31
98
81,7
42
94
61,6
20
1,0
85
1,6
93
1,0
04
1,6
91
75
41
96
Yes
27
25
74
25
05
85
34
04
89
40
04
38
25
93
61
18
9
Aggre
gate
d D
ata
2,0
03
1,5
63
1,9
92
1,5
32
1,9
60
1,5
75
2,0
93
1,4
43
1,9
50
1,1
15
38
6
* = G
roup s
ize fe
wer th
an 5
Ho
ward
Co
un
ty - N
um
ber o
f Kin
derg
arte
n S
tud
en
ts
Socia
l
Founda
tions
Physic
al
Develo
pm
ent
La
nguage a
nd
Lite
racy
Math
em
atic
sC
om
posite
B 76

Demonstrating
Not Yet
Demonstrating
Demonstrating
Not Yet
Demonstrating
Demonstrating
Not Yet
Demonstrating
Demonstrating
Not Yet
Demonstrating
Demonstrating
Approaching
Emerging
Rac
e/E
thn
icity
Am
eric
an In
dia
n/A
laskan N
ativ
e2
97
14
35
72
97
17
12
91
47
11
4
Asia
n5
54
55
94
15
94
16
83
25
83
11
0
Afric
an A
meric
an
46
54
42
58
47
53
49
51
44
41
15
Nativ
e H
aw
aiia
n/P
acific
Isla
nde
r7
52
56
33
87
12
95
74
35
72
91
4
White
67
33
69
31
61
39
61
39
66
28
6
His
panic
34
66
31
69
42
58
53
47
37
37
27
Tw
o o
r More
Race
s (N
on-H
ispanic
/La
tino)
58
42
56
44
58
42
59
41
59
29
12
Gen
der
Male
53
47
54
46
48
52
48
52
50
36
14
Fem
ale
59
41
59
41
63
37
71
29
63
28
9
Prio
r Care
Child
Care
Cente
r6
73
36
63
45
94
16
23
86
43
06
Fam
ily C
hild
Care
54
46
52
48
54
46
56
44
53
37
11
Hea
d S
tart
33
67
33
67
45
55
53
47
35
45
20
Hom
e / In
form
al C
are
35
65
37
63
50
50
50
50
39
38
22
Non-p
ublic
Nurs
ery
73
27
72
28
65
35
68
32
73
24
4
Pre
-Kin
de
rgarte
n4
25
84
45
64
65
45
34
74
33
91
8
Sp
ec
ial E
du
ca
tion
No
59
41
59
41
58
42
62
38
59
32
9
Yes
24
76
28
72
24
76
23
77
22
38
40
En
glis
h L
an
gu
ag
e L
ea
rne
rs
No
61
39
60
40
58
42
60
40
61
31
9
Yes
20
80
27
73
36
64
51
49
24
45
31
Fre
e a
nd
Red
uce
d P
rice
Mea
ls
No
64
36
65
35
60
40
63
37
64
29
7
Yes
32
68
30
70
41
59
48
52
32
45
23
Aggre
gate
d D
ata
56
44
57
43
55
45
59
41
57
32
11
* = P
erc
enta
ge c
ould
not b
e re
porte
d d
ue to
gro
up s
ize fe
wer th
an 5
Socia
l
Founda
tions
Physic
al
Develo
pm
ent
Com
posite
Ho
ward
Co
un
ty - P
erc
en
tag
e o
f Kin
derg
arte
n S
tud
en
ts
La
nguage a
nd
Lite
racy
Math
em
atic
s
B 77
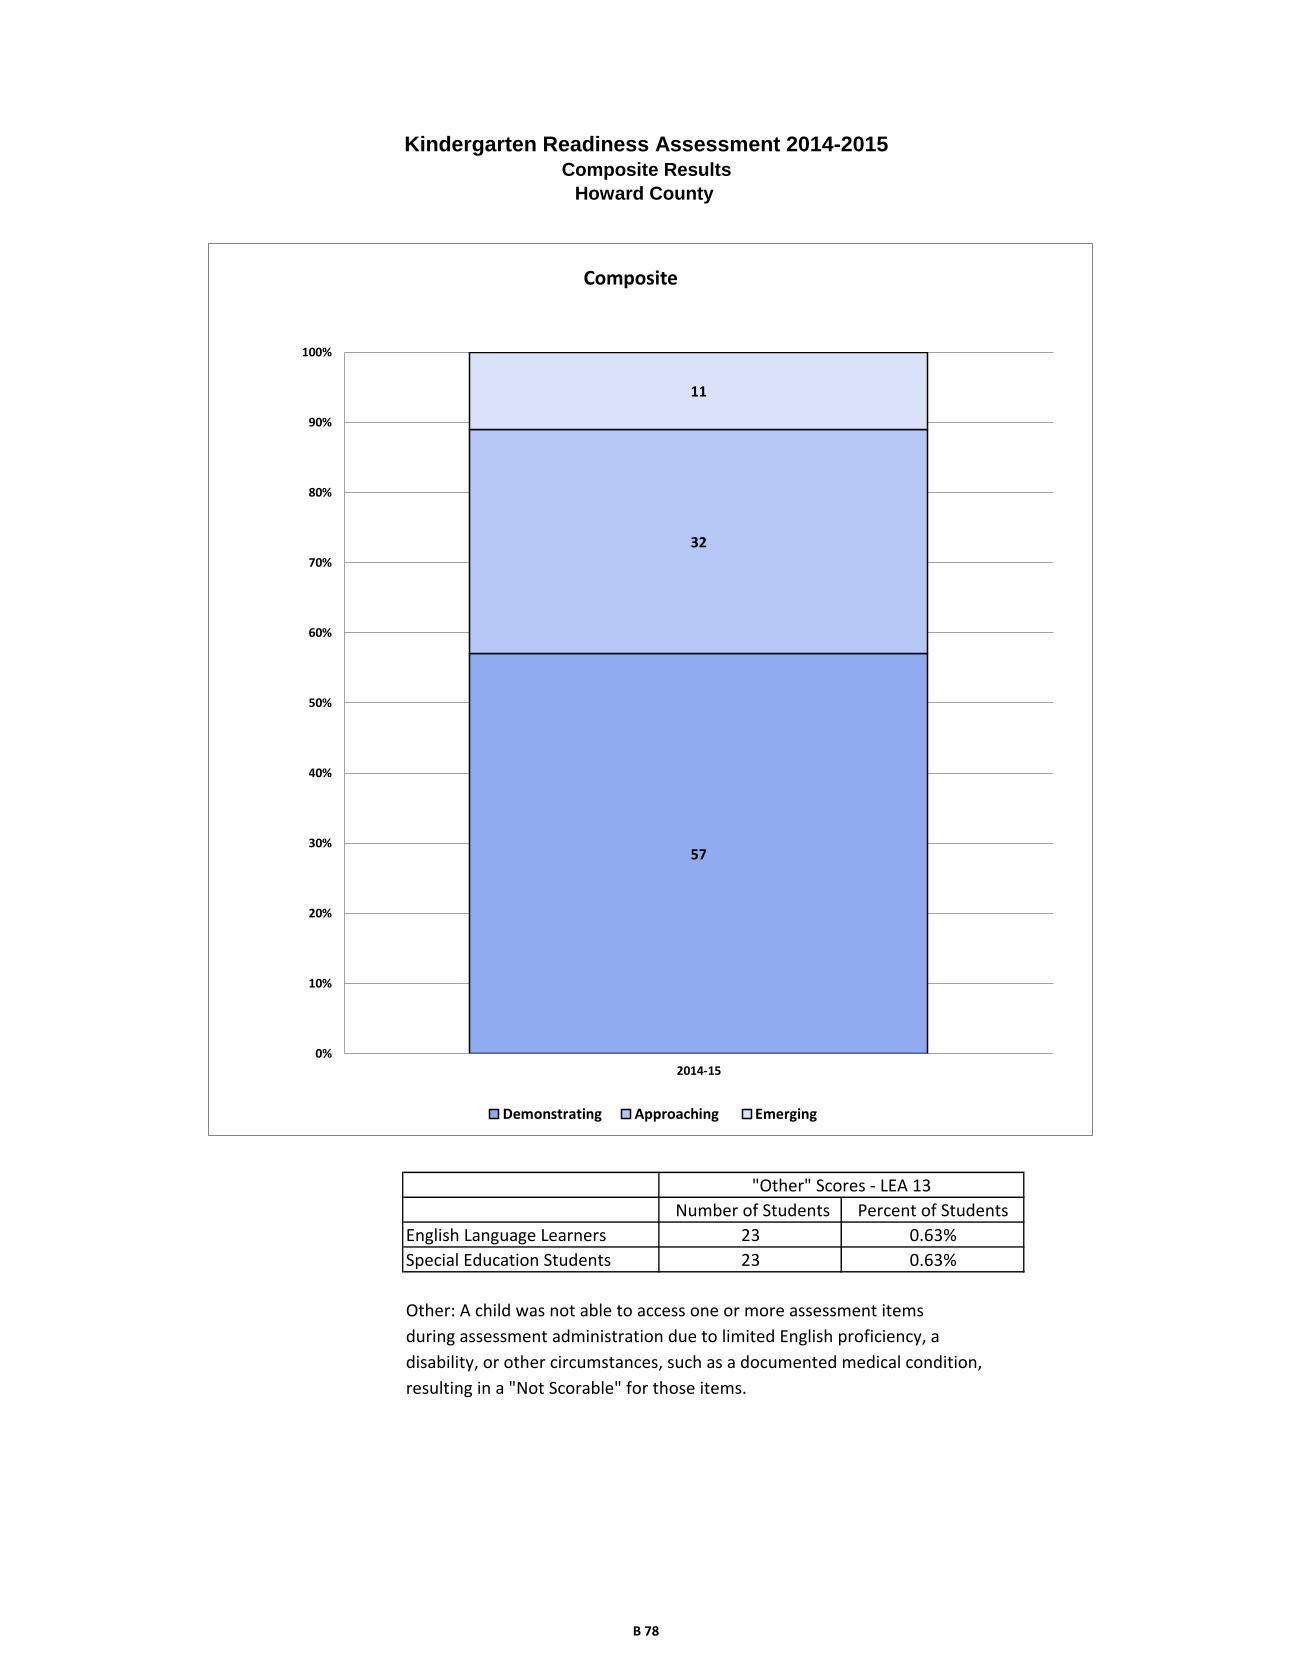
Other: A child was not able to access one or more assessment items
during assessment administration due to limited English proficiency, a
disability, or other circumstances, such as a documented medical condition,
resulting in a "Not Scorable" for those items.
English Language Learners 23 0.63%
Kindergarten Readiness Assessment 2014-2015Composite Results
Howard County
Special Education Students 23 0.63%
"Other" Scores - LEA 13
Number of Students Percent of Students
57
32
11
0%
10%
20%
30%
40%
50%
60%
70%
80%
90%
100%
2014-15
Composite
Demonstrating Approaching Emerging
B 78
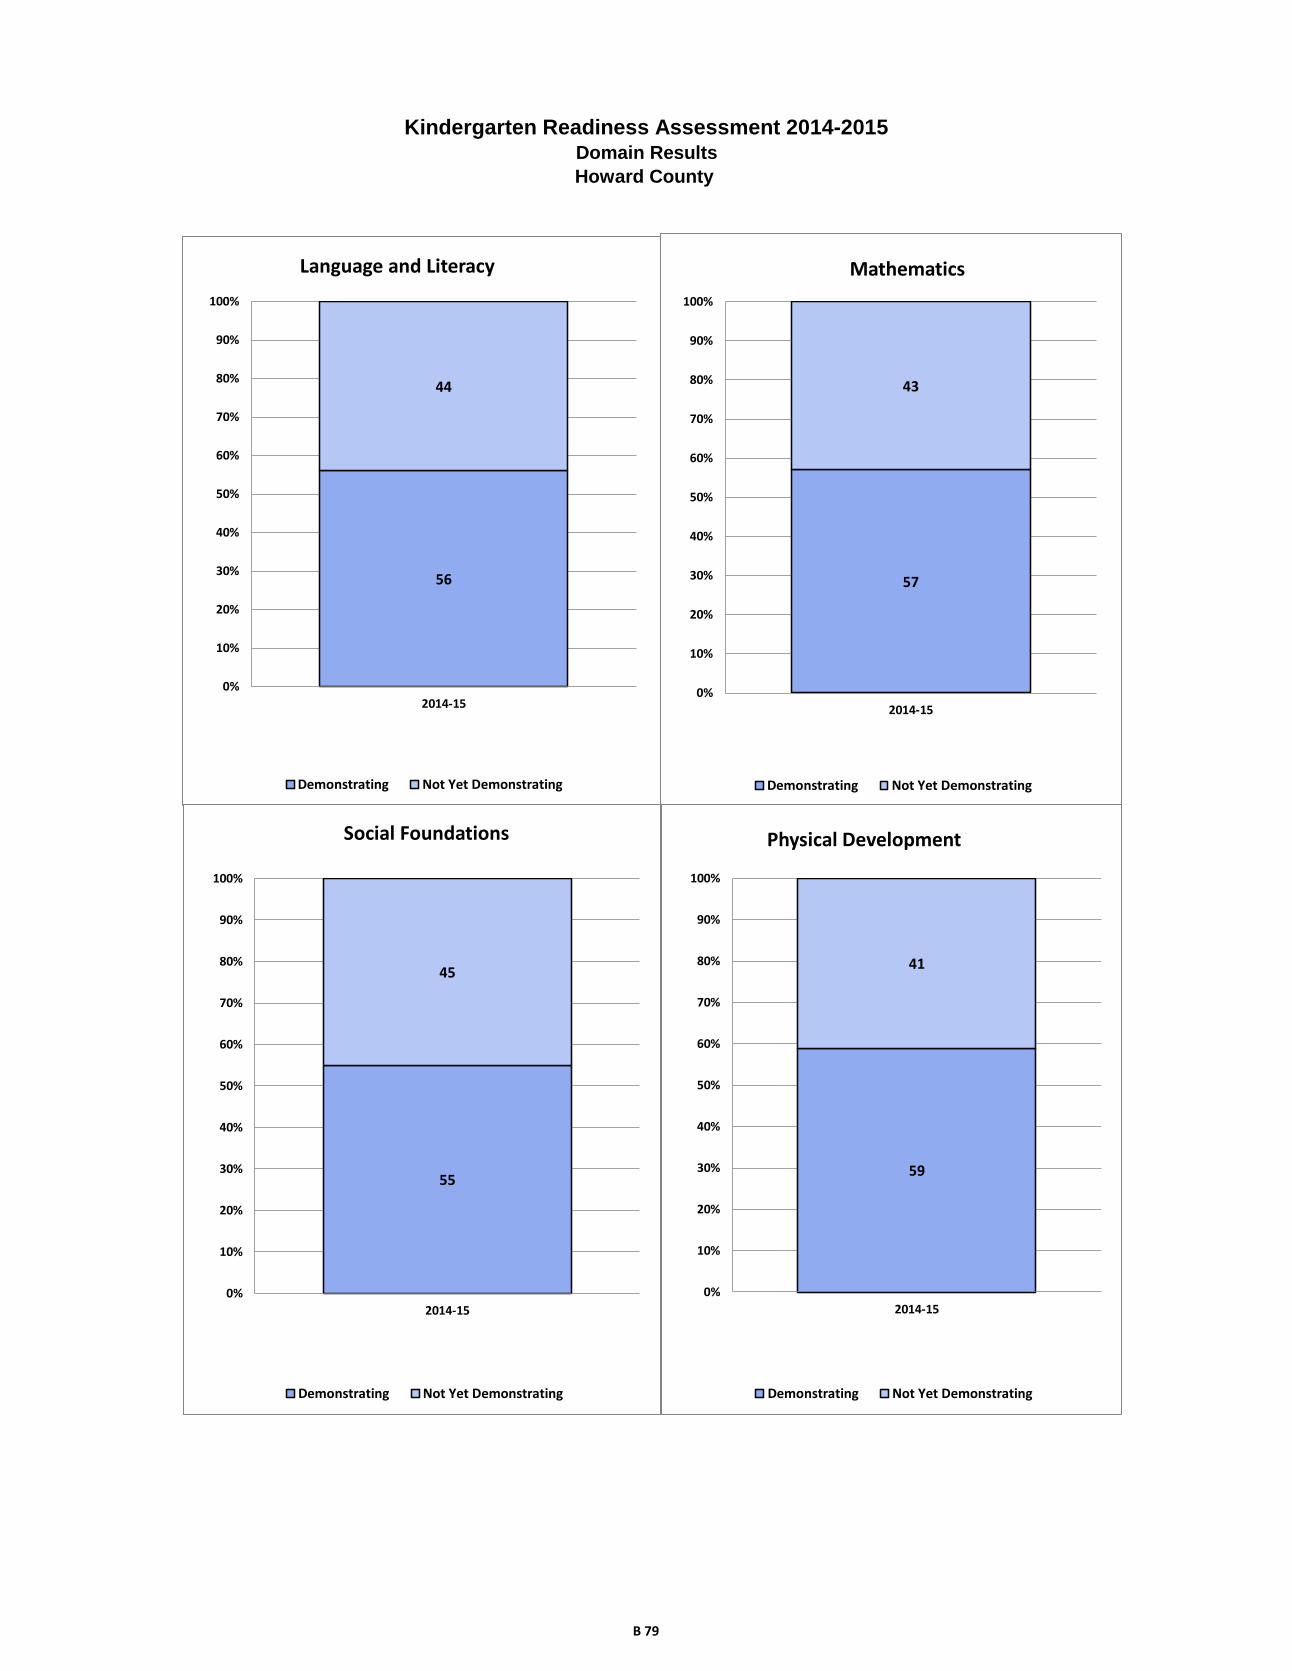
Kindergarten Readiness Assessment 2014-2015Domain Results
Howard County
56
44
0%
10%
20%
30%
40%
50%
60%
70%
80%
90%
100%
2014-15
Language and Literacy
Demonstrating Not Yet Demonstrating
57
43
0%
10%
20%
30%
40%
50%
60%
70%
80%
90%
100%
2014-15
Mathematics
Demonstrating Not Yet Demonstrating
55
45
0%
10%
20%
30%
40%
50%
60%
70%
80%
90%
100%
2014-15
Social Foundations
Demonstrating Not Yet Demonstrating
59
41
0%
10%
20%
30%
40%
50%
60%
70%
80%
90%
100%
2014-15
Physical Development
Demonstrating Not Yet Demonstrating
B 79

Frequency Percent
Males 75 51.37
Females 71 48.63
Frequency Percent
American Indian/Alaska Native 2 1.37
Asian 1 0.68
Black/African American 39 26.71
Native Hawaiian/Other Pacific Islander 0 0.00
White 86 58.90
Hispanic/Latino 14 9.59
Two or More Races (Non-Hispanic/Latino) 4 2.74
Frequency Percent
No 70 47.95
Yes 76 52.05
Frequency Percent
No 122 83.56
Yes 24 16.44
Frequency Percent
No 135 92.47
Yes 11 7.53
Frequency Percent
Head Start 3 2.05
Prekindergarten 120 82.19
Child Care Center 8 5.48
Family Child Care 8 5.48
Home/Informal Care 1 0.68
Non-Public Nursery School 6 4.11
Repeated Kindergarten 0 0.00
Free & Reduced Priced Meals
Special Education
English Language Learners
Predominant Prior Care
Final Record Count for KRA Data File 146
Kindergarten Readiness Assessment
Kent County Data File Summary 2014-2015
Gender
Ethnicity/Race
B 80

Demonstrating
Not Yet
Demonstrating
Demonstrating
Not Yet
Demonstrating
Demonstrating
Not Yet
Demonstrating
Demonstrating
Not Yet
Demonstrating
Demonstrating
Approaching
Emerging
Rac
e/E
thn
icity
Am
eric
an In
dia
n/A
laskan N
ativ
e*
**
**
**
**
**
Asia
n*
**
**
**
**
**
Afric
an A
meric
an
15
24
16
23
19
20
20
19
18
13
8
Nativ
e H
aw
aiia
n/P
acific
Isla
nde
r*
**
**
**
**
**
White
59
27
58
28
53
33
58
28
59
22
5
His
panic
59
86
77
10
47
52
Tw
o o
r More
Race
s (N
on-H
ispanic
/La
tino)
**
**
**
**
**
*
Gen
der
Male
41
34
38
37
39
36
44
31
40
23
12
Fem
ale
40
31
45
26
42
29
46
25
46
21
4
Prio
r Care
Child
Care
Cente
r6
26
21
73
55
21
Fam
ily C
hild
Care
36
26
35
53
31
4
Hea
d S
tart
**
**
**
**
**
*
Hom
e / In
form
al C
are
**
**
**
**
**
*
Non-p
ublic
Nurs
ery
42
33
42
33
42
0
Pre
-Kin
de
rgarte
n6
75
37
14
97
24
87
84
27
33
89
Sp
ec
ial E
du
ca
tion
No
76
46
76
46
75
47
84
38
82
31
9
Yes
51
97
17
61
86
18
41
37
En
glis
h L
an
gu
ag
e L
ea
rne
rs
No
80
55
79
56
77
58
83
52
83
38
14
Yes
11
04
74
77
43
62
Fre
e a
nd
Red
uce
d P
rice
Mea
ls
No
40
30
37
33
35
35
41
29
38
22
10
Yes
41
35
46
30
46
30
49
27
48
22
6
Aggre
gate
d D
ata
81
65
83
63
81
65
90
56
86
44
16
* = G
rouop s
ize fe
wer th
an 5
Ken
t Co
un
ty - N
um
ber o
f Kin
derg
arte
n S
tud
en
ts
Socia
l
Founda
tions
Physic
al
Develo
pm
ent
La
nguage a
nd
Lite
racy
Math
em
atic
sC
om
posite
B 81

Demonstrating
Not Yet
Demonstrating
Demonstrating
Not Yet
Demonstrating
Demonstrating
Not Yet
Demonstrating
Demonstrating
Not Yet
Demonstrating
Demonstrating
Approaching
Emerging
Rac
e/E
thn
icity
Am
eric
an In
dia
n/A
laskan N
ativ
e*
**
**
**
**
**
Asia
n*
**
**
**
**
**
Afric
an A
meric
an
38
62
41
59
49
51
51
49
46
33
21
Nativ
e H
aw
aiia
n/P
acific
Isla
nde
r*
**
**
**
**
**
White
69
31
67
33
62
38
67
33
69
26
6
His
panic
36
64
57
43
50
50
71
29
50
36
14
Tw
o o
r More
Race
s (N
on-H
ispanic
/La
tino)
**
**
**
**
**
*
Gen
der
Male
55
45
51
49
52
48
59
41
53
31
16
Fem
ale
56
44
63
37
59
41
65
35
65
30
6
Prio
r Care
Child
Care
Cente
r7
52
57
52
51
38
83
86
36
32
51
3
Fam
ily C
hild
Care
38
75
25
75
38
63
63
38
38
13
50
Hea
d S
tart
**
**
**
**
**
*
Hom
e / In
form
al C
are
**
**
**
**
**
*
Non-p
ublic
Nurs
ery
67
33
50
50
67
33
50
50
67
33
0
Pre
-Kin
de
rgarte
n5
64
45
94
16
04
06
53
56
13
28
Sp
ec
ial E
du
ca
tion
No
62
38
62
38
61
39
69
31
67
25
7
Yes
21
79
29
71
25
75
25
75
17
54
29
En
glis
h L
an
gu
ag
e L
ea
rne
rs
No
59
41
59
41
57
43
61
39
61
28
10
Yes
99
13
66
43
66
46
43
62
75
51
8
Fre
e a
nd
Red
uce
d P
rice
Mea
ls
No
57
43
53
47
50
50
59
41
54
31
14
Yes
54
46
61
39
61
39
64
36
63
29
8
Aggre
gate
d D
ata
55
45
57
43
55
45
62
38
59
30
11
* = P
erc
enta
ge c
ould
not b
e re
porte
d d
ue to
gro
up s
ize fe
wer th
an 5
Socia
l
Founda
tions
Physic
al
Develo
pm
ent
Com
posite
Ken
t Co
un
ty - P
erc
en
tag
e o
f Kin
derg
arte
n S
tud
en
ts
La
nguage a
nd
Lite
racy
Math
em
atic
s
B 82
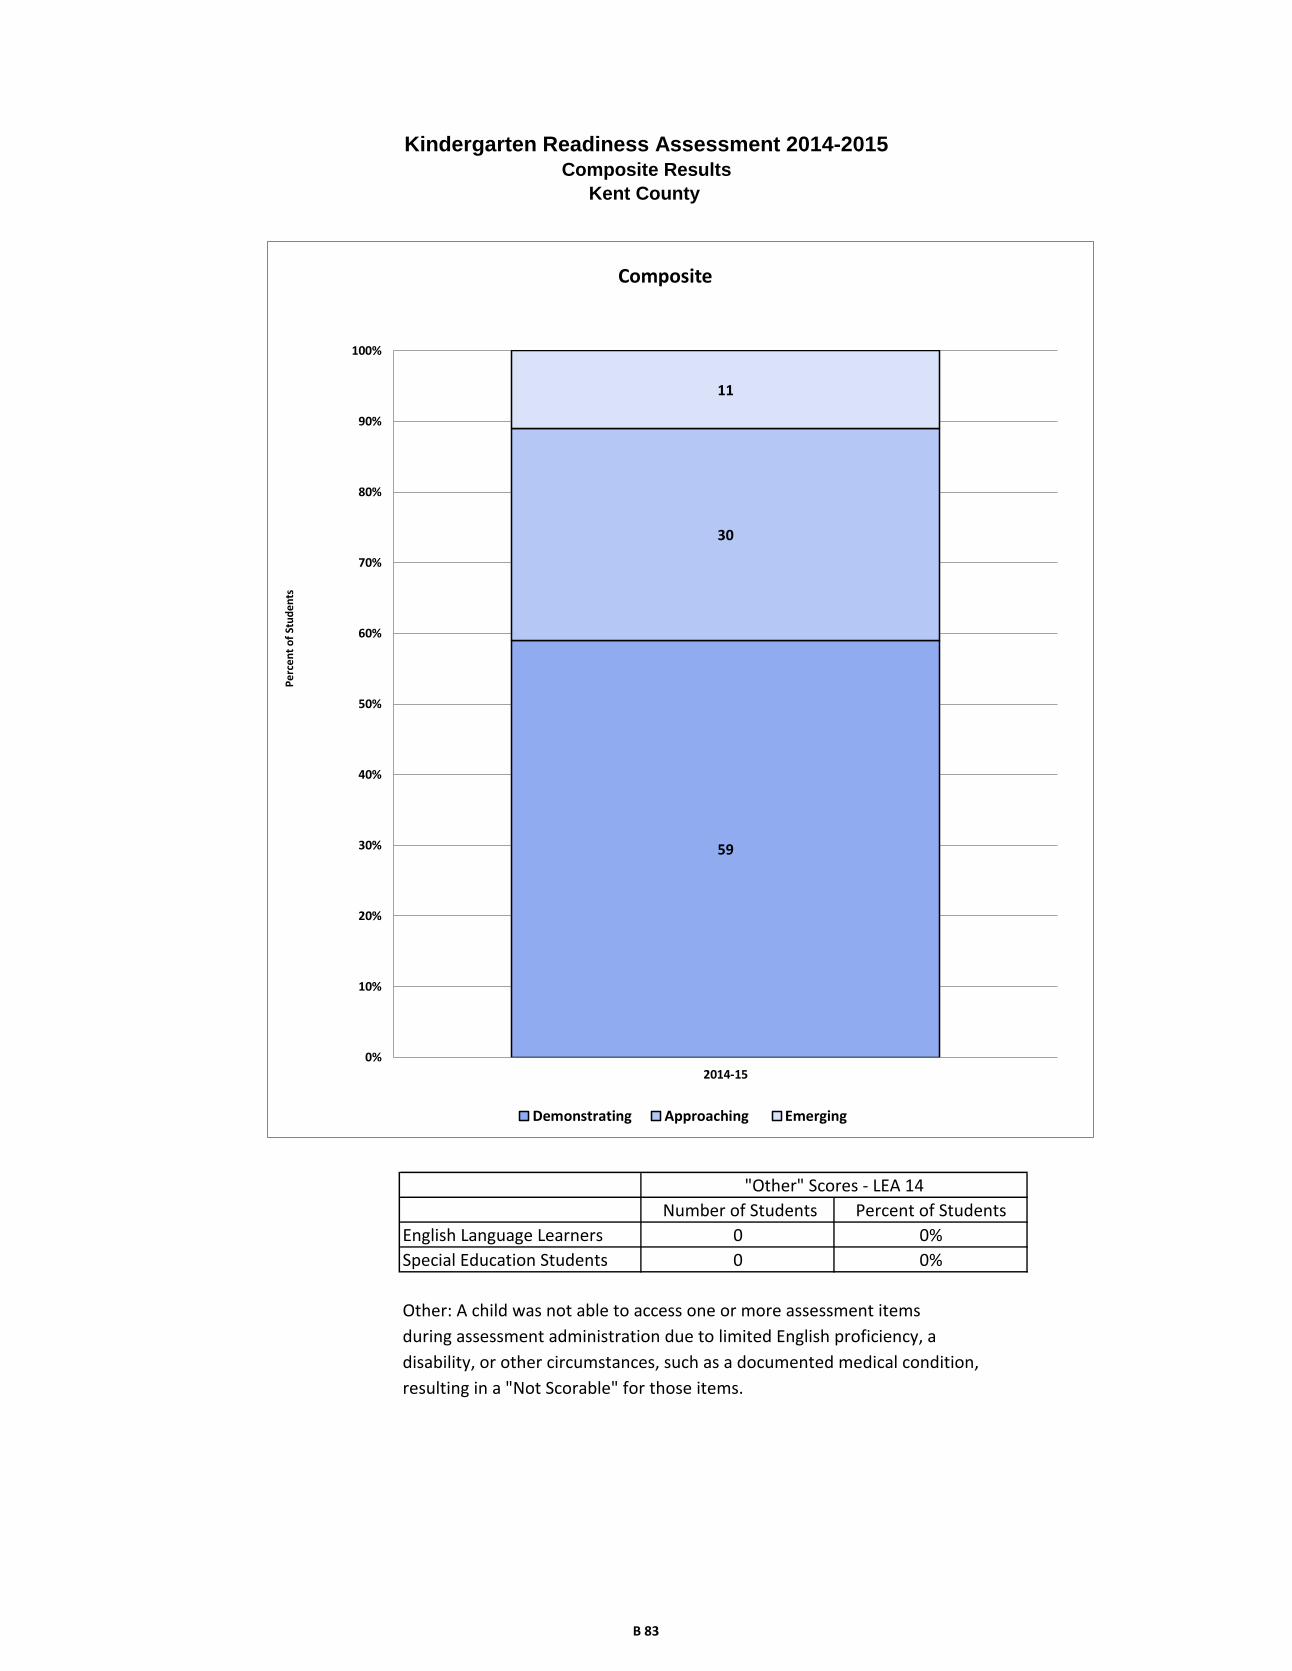
Other: A child was not able to access one or more assessment items
during assessment administration due to limited English proficiency, a
disability, or other circumstances, such as a documented medical condition,
resulting in a "Not Scorable" for those items.
Kindergarten Readiness Assessment 2014-2015Composite Results
Kent County
"Other" Scores - LEA 14
Number of Students Percent of Students
English Language Learners 0 0%
Special Education Students 0%0
59
30
11
0%
10%
20%
30%
40%
50%
60%
70%
80%
90%
100%
2014-15
Composite
Demonstrating Approaching Emerging
Pe
rce
nt
of
Stu
de
nts
B 83
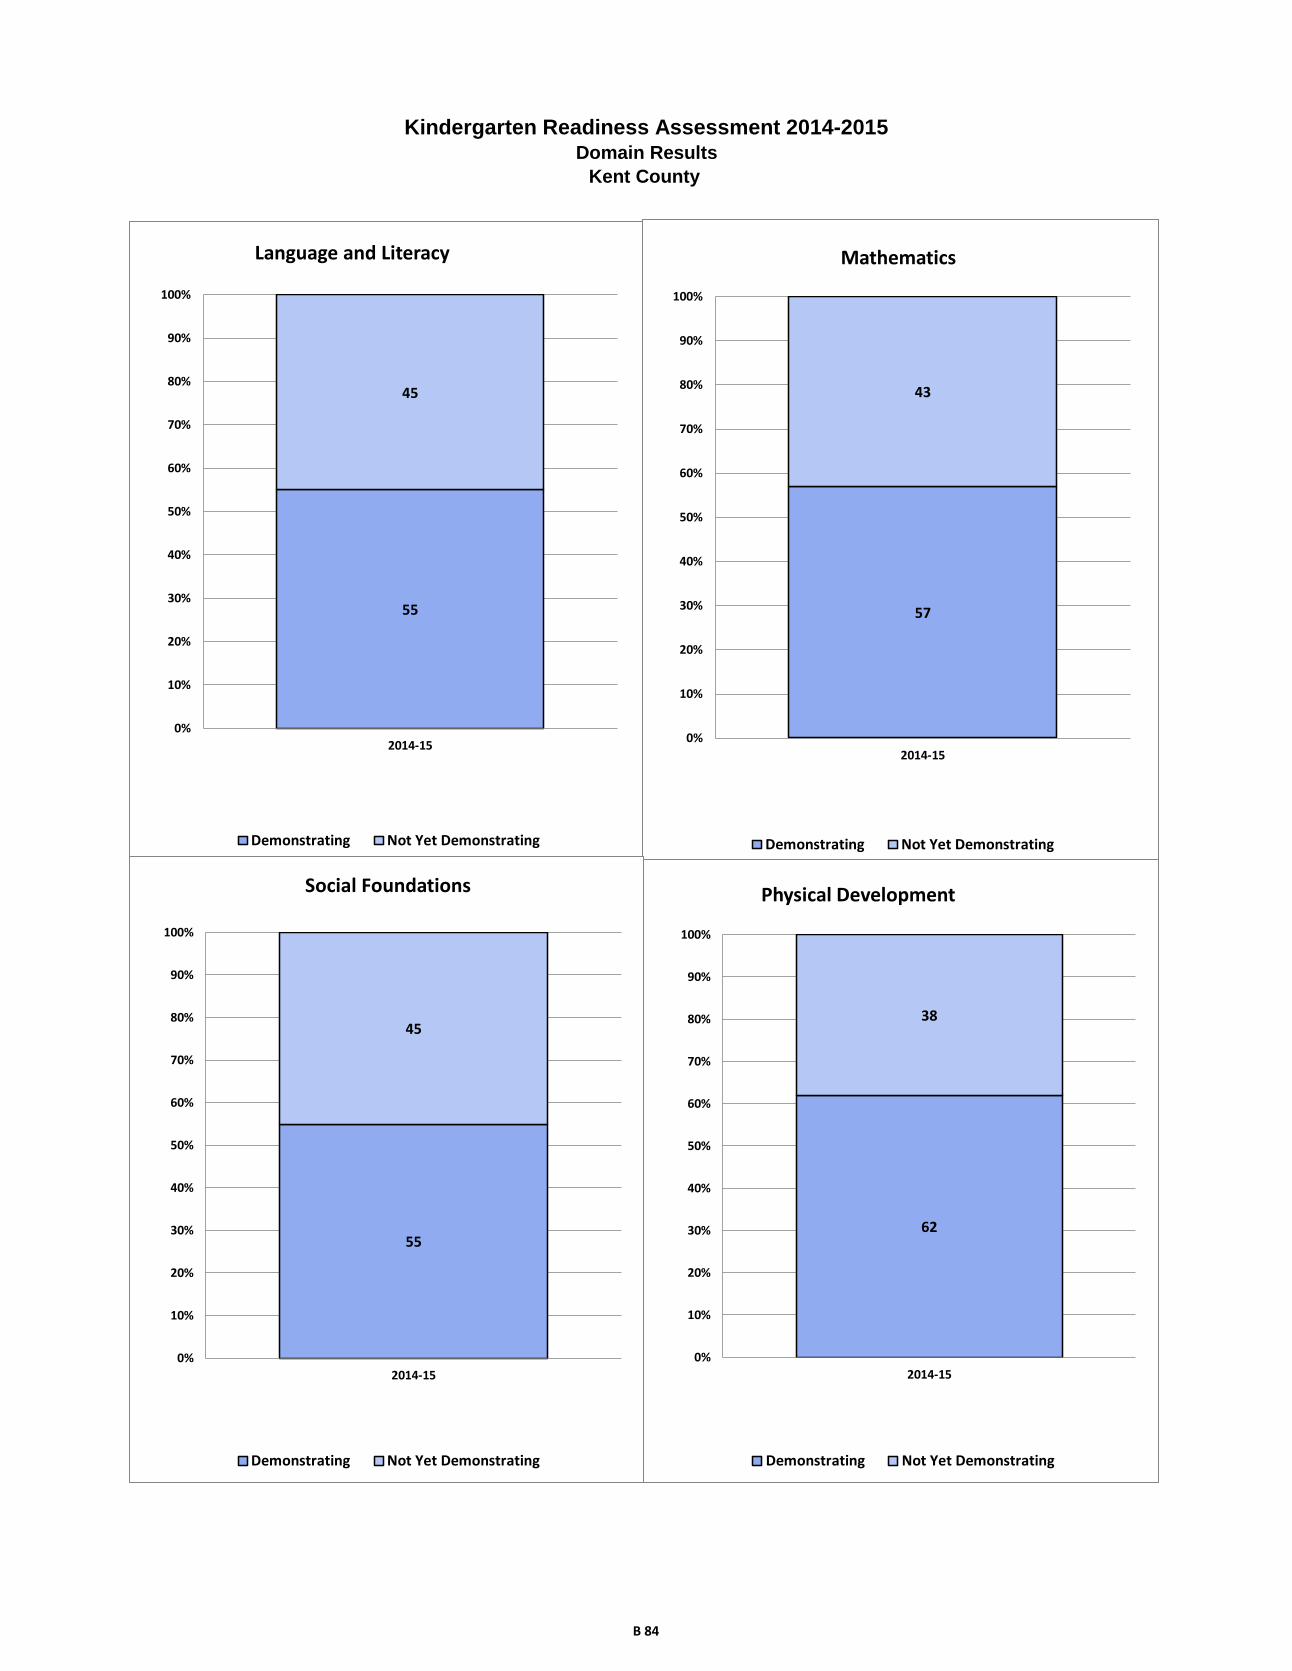
Kindergarten Readiness Assessment 2014-2015Domain Results
Kent County
55
45
0%
10%
20%
30%
40%
50%
60%
70%
80%
90%
100%
2014-15
Language and Literacy
Demonstrating Not Yet Demonstrating
57
43
0%
10%
20%
30%
40%
50%
60%
70%
80%
90%
100%
2014-15
Mathematics
Demonstrating Not Yet Demonstrating
55
45
0%
10%
20%
30%
40%
50%
60%
70%
80%
90%
100%
2014-15
Social Foundations
Demonstrating Not Yet Demonstrating
62
38
0%
10%
20%
30%
40%
50%
60%
70%
80%
90%
100%
2014-15
Physical Development
Demonstrating Not Yet Demonstrating
B 84

Frequency Percent
Males 6031 51.30
Females 5725 48.70
Frequency Percent
American Indian/Alaska Native 30 0.26
Asian 1527 12.99
Black/African American 2417 20.56
Native Hawaiian/Other Pacific Islander 2 0.02
White 3377 28.73
Hispanic/Latino 3754 31.93
Two or More Races (Non-Hispanic/Latino) 649 5.52
Frequency Percent
No 7045 59.93
Yes 4711 40.07
Frequency Percent
No 10694 90.97
Yes 1062 9.03
Frequency Percent
No 7591 64.57
Yes 4165 35.43
Frequency Percent
Head Start 1056 8.98
Prekindergarten 1719 14.62
Child Care Center 1542 13.12
Family Child Care 334 2.84
Home/Informal Care 3819 32.49
Non-Public Nursery School 2935 24.97
Repeated Kindergarten 351 2.99
Kindergarten Readiness Assessment
Montgomery County Data File Summary 2014-2015
Gender
Ethnicity/Race
Free & Reduced Priced Meals
Special Education
English Language Learners
Predominant Prior Care
Final Record Count for KRA Data File 11756
B 85

Demonstrating
Not Yet
Demonstrating
Demonstrating
Not Yet
Demonstrating
Demonstrating
Not Yet
Demonstrating
Demonstrating
Not Yet
Demonstrating
Demonstrating
Approaching
Emerging
Rac
e/E
thn
icity
Am
eric
an In
dia
n/A
laskan N
ativ
e1
11
81
01
91
21
71
11
81
01
27
Asia
n7
15
73
99
25
52
17
85
65
08
82
59
08
08
40
81
83
Afric
an A
meric
an
90
91,3
87
1,0
58
1,2
35
1,0
32
1,2
27
1,0
40
1,2
68
97
48
50
39
2
Nativ
e H
aw
aiia
n/P
acific
Isla
nde
r*
**
**
**
**
**
White
2,1
23
1,1
63
2,4
39
85
21,8
51
1,4
18
1,8
85
1,4
08
2,1
13
88
02
34
His
panic
79
22,7
42
1,0
45
2,5
18
1,3
94
2,1
65
1,6
32
1,9
73
96
61,4
49
1,0
55
Tw
o o
r More
Race
s (N
on-H
ispanic
/La
tino)
38
82
40
43
11
96
35
12
69
38
22
47
38
51
71
54
Gen
der
Male
2,3
22
3,4
06
2,9
42
2,8
08
2,3
24
3,3
89
2,3
46
3,4
44
2,3
16
2,0
85
1,1
87
Fem
ale
2,6
17
2,8
84
2,9
67
2,5
33
3,1
03
2,3
57
3,4
87
2,0
61
2,9
41
1,6
85
73
8
Prio
r Care
Child
Care
Cente
r8
86
63
51,0
13
50
28
22
67
38
70
65
29
12
45
11
21
Fam
ily C
hild
Care
10
52
15
13
11
88
12
91
95
13
91
89
11
81
12
79
Hea
d S
tart
29
67
02
35
46
50
39
66
06
43
85
87
33
54
00
23
9
Hom
e / In
form
al C
are
1,0
54
2,4
58
1,3
68
2,1
63
1,4
38
2,0
76
1,5
57
2,0
00
1,1
72
1,2
44
1,0
00
Non-p
ublic
Nurs
ery
1,8
67
1,0
23
2,1
44
74
21,6
74
1,1
93
1,7
27
1,1
72
1,8
74
78
91
70
Pre
-Kin
de
rgarte
n5
02
1,1
46
64
21,0
15
74
78
86
86
58
01
59
97
08
29
4
Sp
ec
ial E
du
ca
tion
No
4,7
25
5,5
53
5,6
28
4,6
58
5,2
03
5,0
10
5,6
00
4,7
50
5,0
59
3,4
44
1,5
28
Yes
21
47
37
28
16
83
22
47
36
23
37
55
19
83
26
39
7
En
glis
h L
an
gu
ag
e L
ea
rne
rs
No
41
96
30
85
47
96
24
90
39
73
32
36
40
86
32
27
42
76
21
48
67
8
Yes
74
33
20
51
11
32
85
11
45
42
51
01
74
72
27
89
81
16
22
12
47
Fre
e a
nd
Red
uce
d P
rice
Mea
ls
No
3,8
75
2,9
10
4,5
20
2,2
53
3,6
70
3,0
45
3,8
29
2,9
96
3,9
67
1,9
46
68
7
Yes
1,0
64
3,3
80
1,3
89
3,0
88
1,7
57
2,7
01
2,0
04
2,5
09
1,2
90
1,8
24
1,2
38
Aggre
gate
d D
ata
4,9
39
6,2
90
5,9
09
5,3
41
5,4
27
5,7
46
5,8
33
5,5
05
5,2
57
3,7
70
1,9
25
* = G
roup s
ize fe
wer th
an 5
Mo
ntg
om
ery
Co
un
ty - N
um
ber o
f Kin
derg
arte
n S
tud
en
ts
Socia
l
Founda
tions
Physic
al
Develo
pm
ent
La
nguage a
nd
Lite
racy
Math
em
atic
sC
om
posite
B 86

Demonstrating
Not Yet
Demonstrating
Demonstrating
Not Yet
Demonstrating
Demonstrating
Not Yet
Demonstrating
Demonstrating
Not Yet
Demonstrating
Demonstrating
Approaching
Emerging
Rac
e/E
thn
icity
Am
eric
an In
dia
n/A
laskan N
ativ
e3
86
23
46
64
15
93
86
23
44
12
4
Asia
n4
95
16
43
65
54
56
04
05
82
91
3
Afric
an A
meric
an
40
60
46
54
46
54
45
55
44
38
18
Nativ
e H
aw
aiia
n/P
acific
Isla
nde
r*
**
**
**
**
**
White
65
35
74
26
57
43
57
43
65
27
7
His
panic
22
78
29
71
39
61
45
55
28
42
30
Tw
o o
r More
Race
s (N
on-H
ispanic
/La
tino)
62
38
69
31
57
43
61
39
63
28
9
Gen
der
Male
41
59
51
49
41
59
41
59
41
37
21
Fem
ale
48
52
54
46
57
43
63
37
55
31
14
Prio
r Care
Child
Care
Cente
r5
84
26
73
35
54
55
74
36
13
08
Fam
ily C
hild
Care
33
67
41
59
40
60
42
58
38
36
26
Hea
d S
tart
30
70
35
65
40
60
43
57
34
41
25
Hom
e / In
form
al C
are
30
70
39
61
41
59
44
56
34
36
29
Non-p
ublic
Nurs
ery
65
35
74
26
58
42
60
40
66
28
6
Pre
-Kin
de
rgarte
n3
07
03
96
14
65
45
24
83
74
41
8
Sp
ec
ial E
du
ca
tion
No
46
54
55
45
51
49
54
46
50
34
15
Yes
23
77
29
71
23
77
24
76
21
35
43
En
glis
h L
an
gu
ag
e L
ea
rne
rs
No
58
42
66
34
55
45
56
44
60
30
10
Yes
19
81
28
72
37
63
43
57
25
42
32
Fre
e a
nd
Red
uce
d P
rice
Mea
ls
No
57
43
67
33
55
45
56
44
60
29
10
Yes
24
76
31
69
39
61
44
56
30
42
28
Aggre
gate
d D
ata
44
56
53
47
49
51
51
49
48
34
18
* = P
erc
enta
ge c
ould
not b
e re
porte
d d
ue to
gro
up s
ize fe
wer th
an 5
Socia
l
Founda
tions
Physic
al
Develo
pm
ent
Com
posite
Mo
ntg
om
ery
Co
un
ty - P
erc
en
tag
e o
f Kin
derg
arte
n S
tud
en
ts
La
nguage a
nd
Lite
racy
Math
em
atic
s
B 87
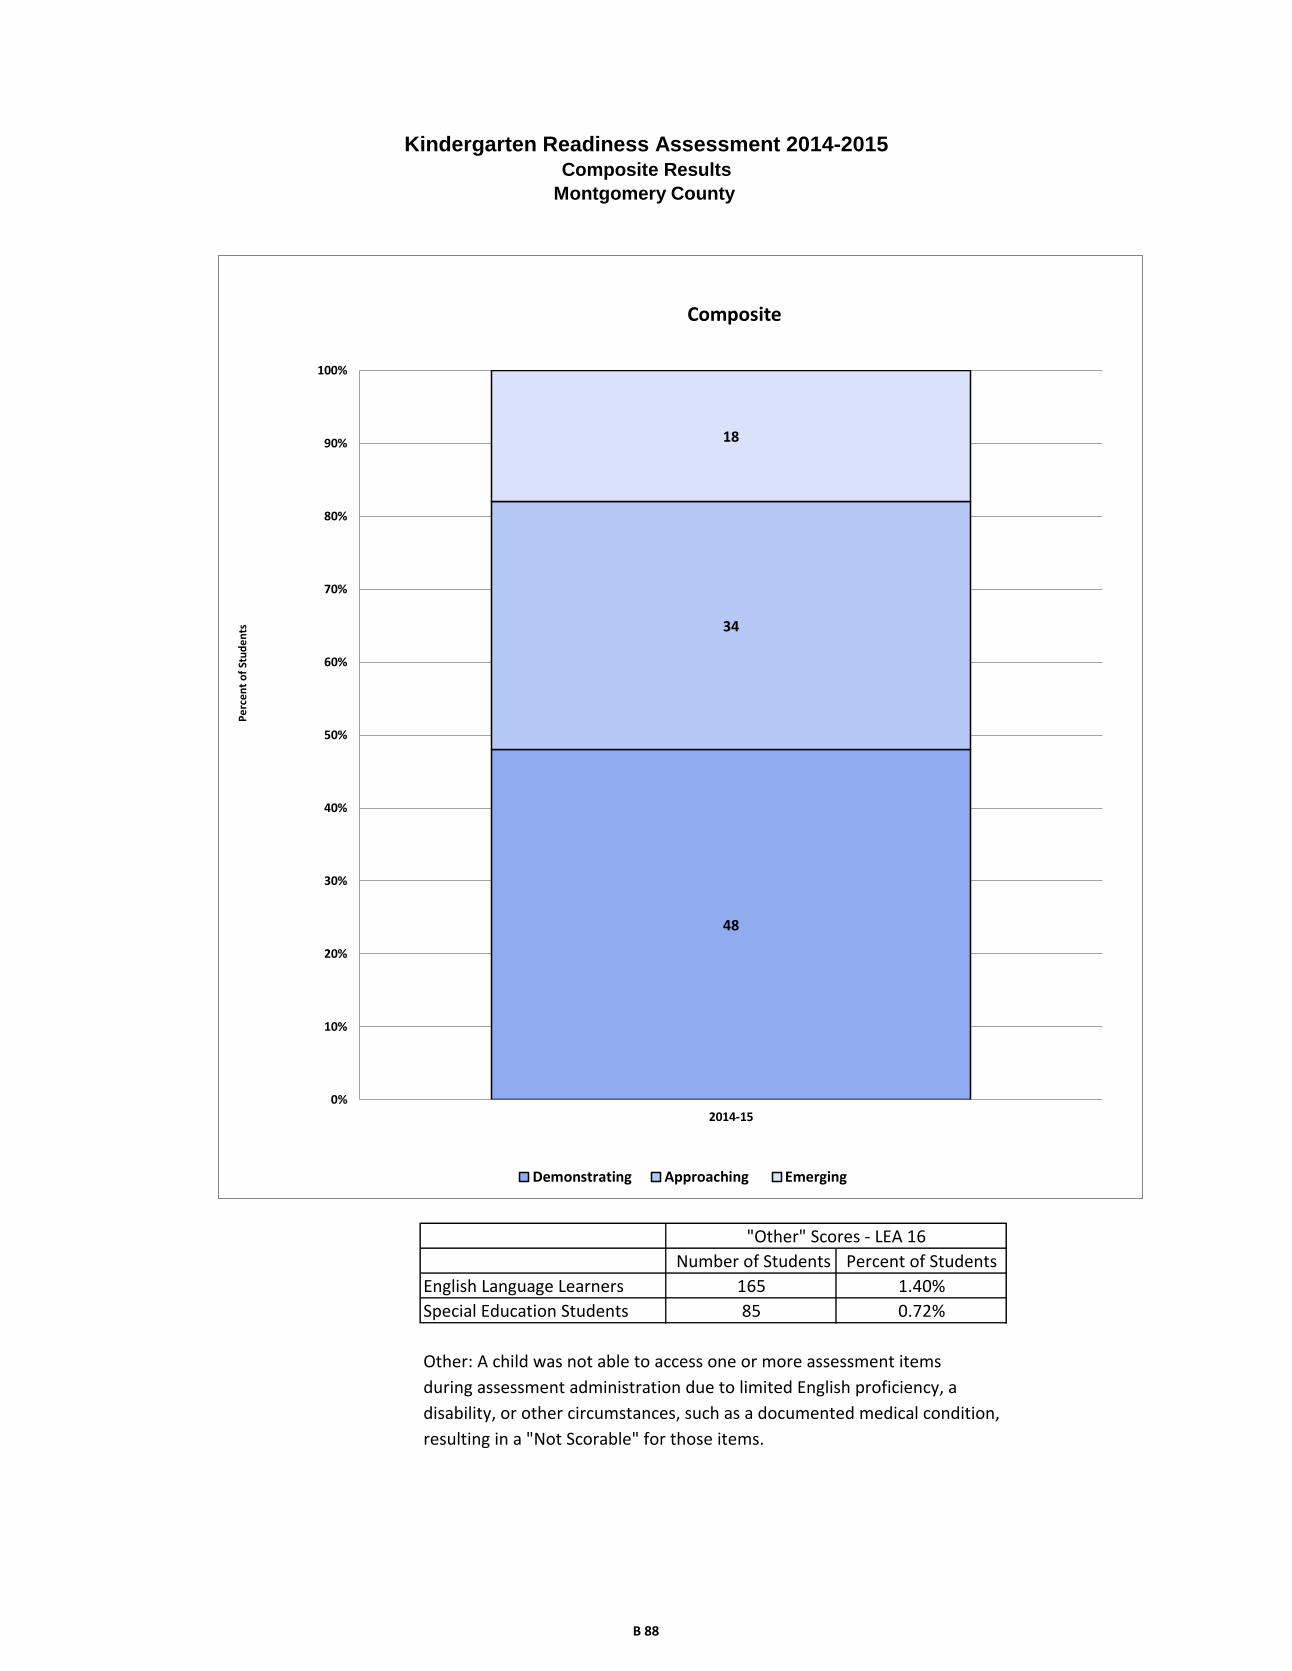
Other: A child was not able to access one or more assessment items
during assessment administration due to limited English proficiency, a
disability, or other circumstances, such as a documented medical condition,
resulting in a "Not Scorable" for those items.
English Language Learners 165 1.40%
Special Education Students 85 0.72%
Kindergarten Readiness Assessment 2014-2015Composite Results
Montgomery County
"Other" Scores - LEA 16
Number of Students Percent of Students
48
34
18
0%
10%
20%
30%
40%
50%
60%
70%
80%
90%
100%
2014-15
Composite
Demonstrating Approaching Emerging
Pe
rce
nt
of
Stu
de
nts
B 88
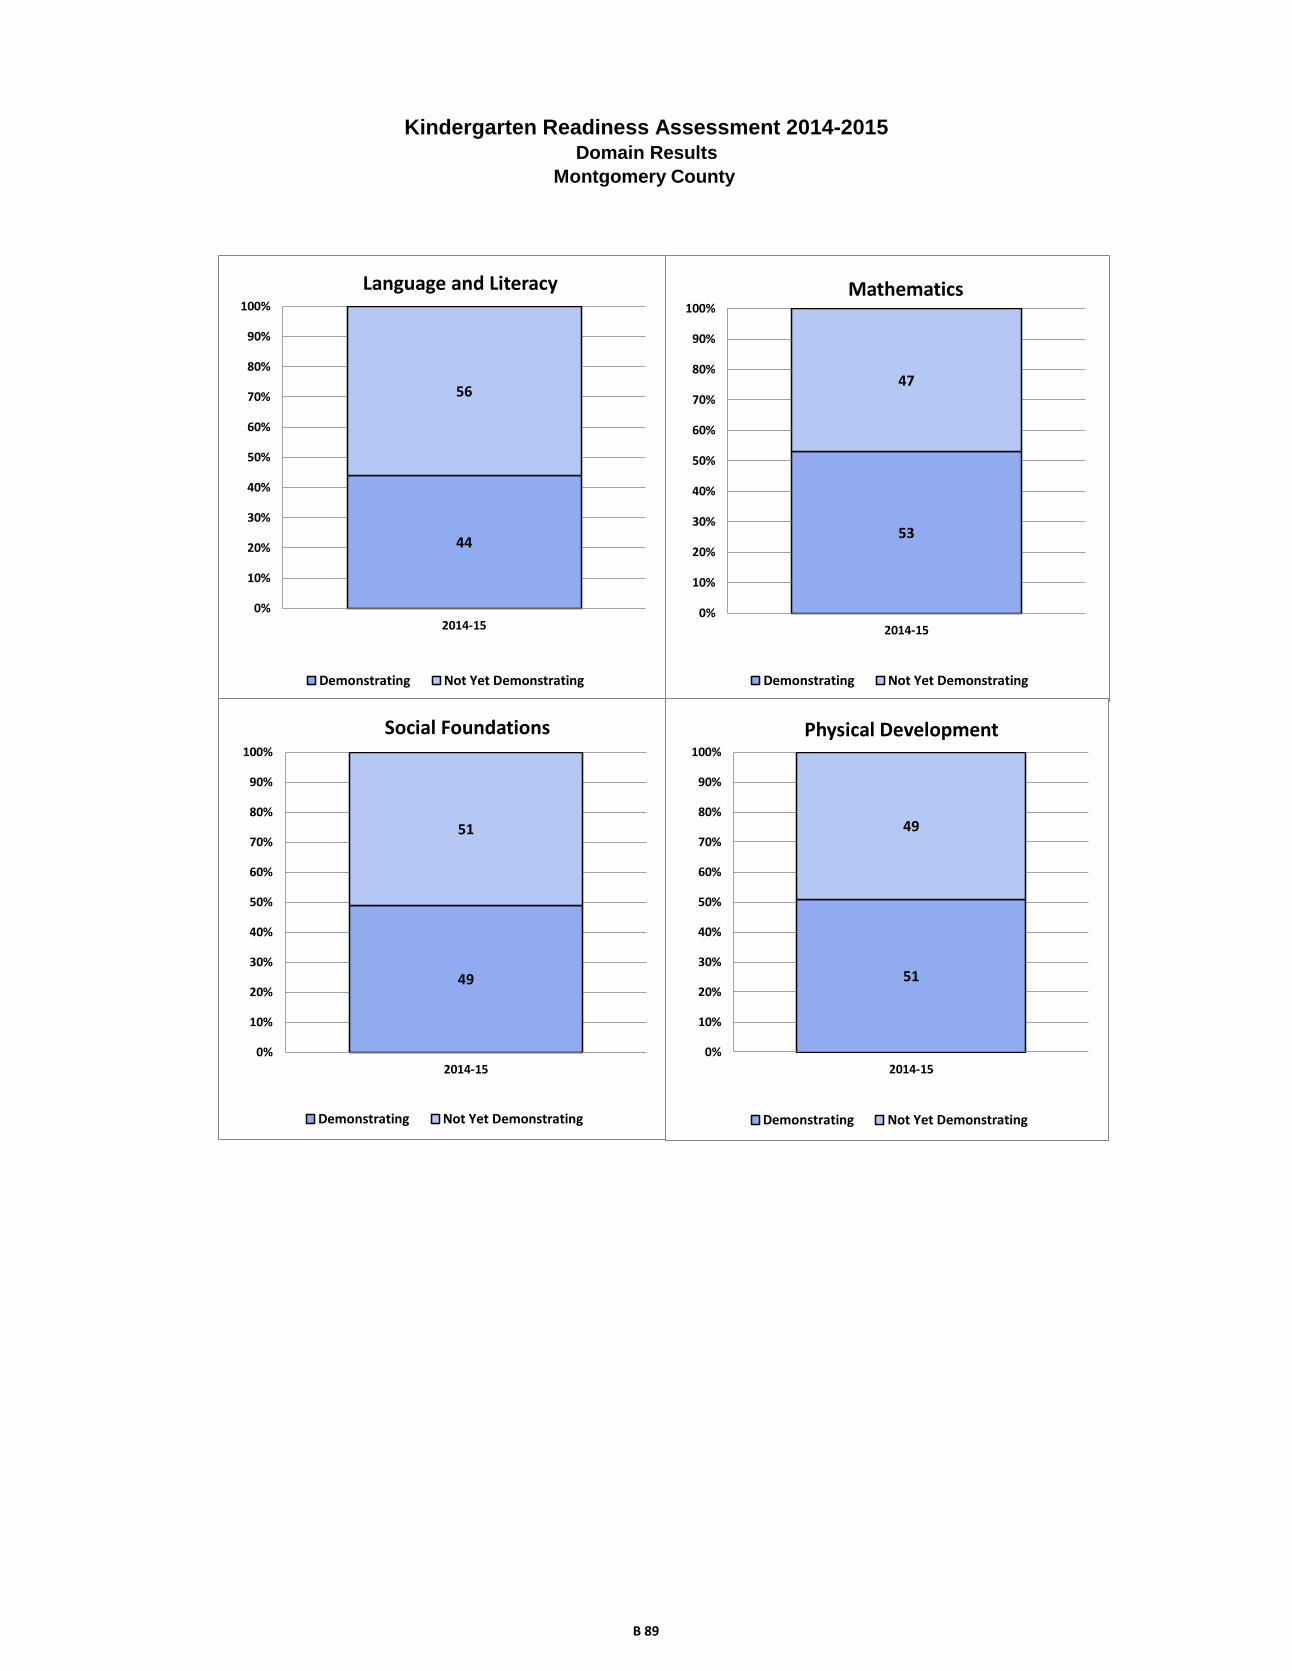
Kindergarten Readiness Assessment 2014-2015Domain Results
Montgomery County
44
56
0%
10%
20%
30%
40%
50%
60%
70%
80%
90%
100%
2014-15
Language and Literacy
Demonstrating Not Yet Demonstrating
53
47
0%
10%
20%
30%
40%
50%
60%
70%
80%
90%
100%
2014-15
Mathematics
Demonstrating Not Yet Demonstrating
49
51
0%
10%
20%
30%
40%
50%
60%
70%
80%
90%
100%
2014-15
Social Foundations
Demonstrating Not Yet Demonstrating
51
49
0%
10%
20%
30%
40%
50%
60%
70%
80%
90%
100%
2014-15
Physical Development
Demonstrating Not Yet Demonstrating
B 89
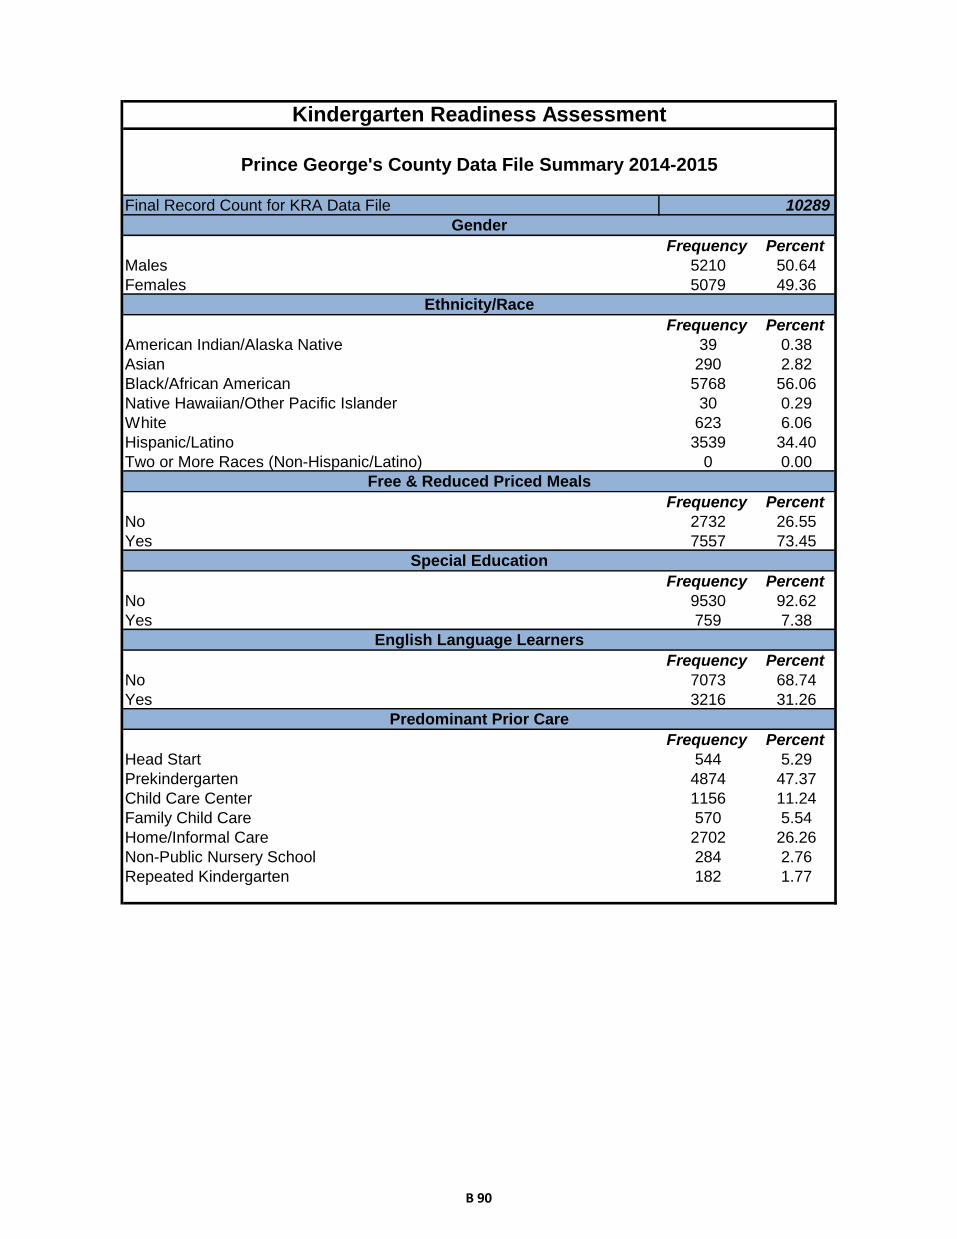
Frequency Percent
Males 5210 50.64
Females 5079 49.36
Frequency Percent
American Indian/Alaska Native 39 0.38
Asian 290 2.82
Black/African American 5768 56.06
Native Hawaiian/Other Pacific Islander 30 0.29
White 623 6.06
Hispanic/Latino 3539 34.40
Two or More Races (Non-Hispanic/Latino) 0 0.00
Frequency Percent
No 2732 26.55
Yes 7557 73.45
Frequency Percent
No 9530 92.62
Yes 759 7.38
Frequency Percent
No 7073 68.74
Yes 3216 31.26
Frequency Percent
Head Start 544 5.29
Prekindergarten 4874 47.37
Child Care Center 1156 11.24
Family Child Care 570 5.54
Home/Informal Care 2702 26.26
Non-Public Nursery School 284 2.76
Repeated Kindergarten 182 1.77
Kindergarten Readiness Assessment
Prince George's County Data File Summary 2014-2015
Gender
Ethnicity/Race
Free & Reduced Priced Meals
Special Education
English Language Learners
Predominant Prior Care
Final Record Count for KRA Data File 10289
B 90

Demonstrating
Not Yet
Demonstrating
Demonstrating
Not Yet
Demonstrating
Demonstrating
Not Yet
Demonstrating
Demonstrating
Not Yet
Demonstrating
Demonstrating
Approaching
Emerging
Rac
e/E
thn
icity
Am
eric
an In
dia
n/A
laskan N
ativ
e1
32
49
28
13
24
17
20
15
17
5
Asia
n9
31
78
88
18
31
35
14
21
54
12
41
11
10
45
4
Afric
an A
meric
an
2,5
04
3,0
00
1,8
48
3,7
29
2,5
09
3,0
21
2,7
40
2,7
93
2,2
75
2,1
78
1,0
07
Nativ
e H
aw
aiia
n/P
acific
Isla
nde
r1
02
06
24
14
16
18
12
91
65
White
29
23
07
26
83
36
32
62
76
30
42
96
28
51
99
11
1
His
panic
53
22,7
93
50
52,8
89
1,1
60
2,2
24
1,3
47
2,0
35
63
71,3
52
1,3
09
Tw
o o
r More
Race
s (N
on-H
ispanic
/La
tino)
**
**
**
**
**
*
Gen
der
Male
1,5
70
3,3
64
1,2
73
3,7
33
1,8
00
3,1
86
1,8
46
3,1
37
1,4
27
1,9
49
1,5
10
Fem
ale
1,8
74
2,9
58
1,4
51
3,4
56
2,3
57
2,5
17
2,7
34
2,1
43
1,9
05
1,9
17
98
1
Prio
r Care
Child
Care
Cente
r5
49
55
33
69
74
55
22
59
05
55
56
24
91
44
61
56
Fam
ily C
hild
Care
16
83
73
12
54
20
21
83
26
24
72
97
16
82
06
16
2
Hea
d S
tart
22
12
86
14
33
79
23
12
77
24
72
62
19
12
19
96
Hom
e / In
form
al C
are
57
91,9
38
51
92,0
47
88
31,6
77
99
51,5
70
58
49
10
99
8
Non-p
ublic
Nurs
ery
17
31
06
13
61
43
17
11
08
16
21
17
16
87
93
1
Pre
-Kin
de
rgarte
n1,7
17
2,9
49
1,4
00
3,3
34
2,0
78
2,6
24
2,3
07
2,3
86
1,7
01
1,9
20
1,0
14
Sp
ec
ial E
du
ca
tion
No
3,3
34
5,7
56
2,6
26
6,5
95
4,0
15
5,1
38
4,4
45
4,7
11
3,2
50
3,6
26
2,1
44
Yes
11
05
66
98
59
41
42
56
51
35
56
98
22
40
34
7
En
glis
h L
an
gu
ag
e L
ea
rne
rs
No
30
80
36
64
23
46
44
82
31
79
36
07
34
08
33
79
28
72
26
27
11
95
Yes
36
42
65
83
78
27
07
97
82
09
61
17
21
90
14
60
12
39
12
96
Fre
e a
nd
Red
uce
d P
rice
Mea
ls
No
1,3
26
1,2
94
1,0
75
1,5
69
1,3
30
1,3
06
1,4
04
1,2
31
1,2
69
91
04
22
Yes
2,1
18
5,0
28
1,6
49
5,6
20
2,8
27
4,3
97
3,1
76
4,0
49
2,0
63
2,9
56
2,0
69
Aggre
gate
d D
ata
3,4
44
6,3
22
2,7
24
7,1
89
4,1
57
5,7
03
4,5
80
5,2
80
3,3
32
3,8
66
2,4
91
* = G
roup s
ize fe
wer th
an 5
Prin
ce G
eo
rge's
Co
un
ty - N
um
ber o
f Kin
derg
arte
n S
tud
en
ts
Socia
l
Founda
tions
Physic
al
Develo
pm
ent
La
nguage a
nd
Lite
racy
Math
em
atic
sC
om
posite
B 91
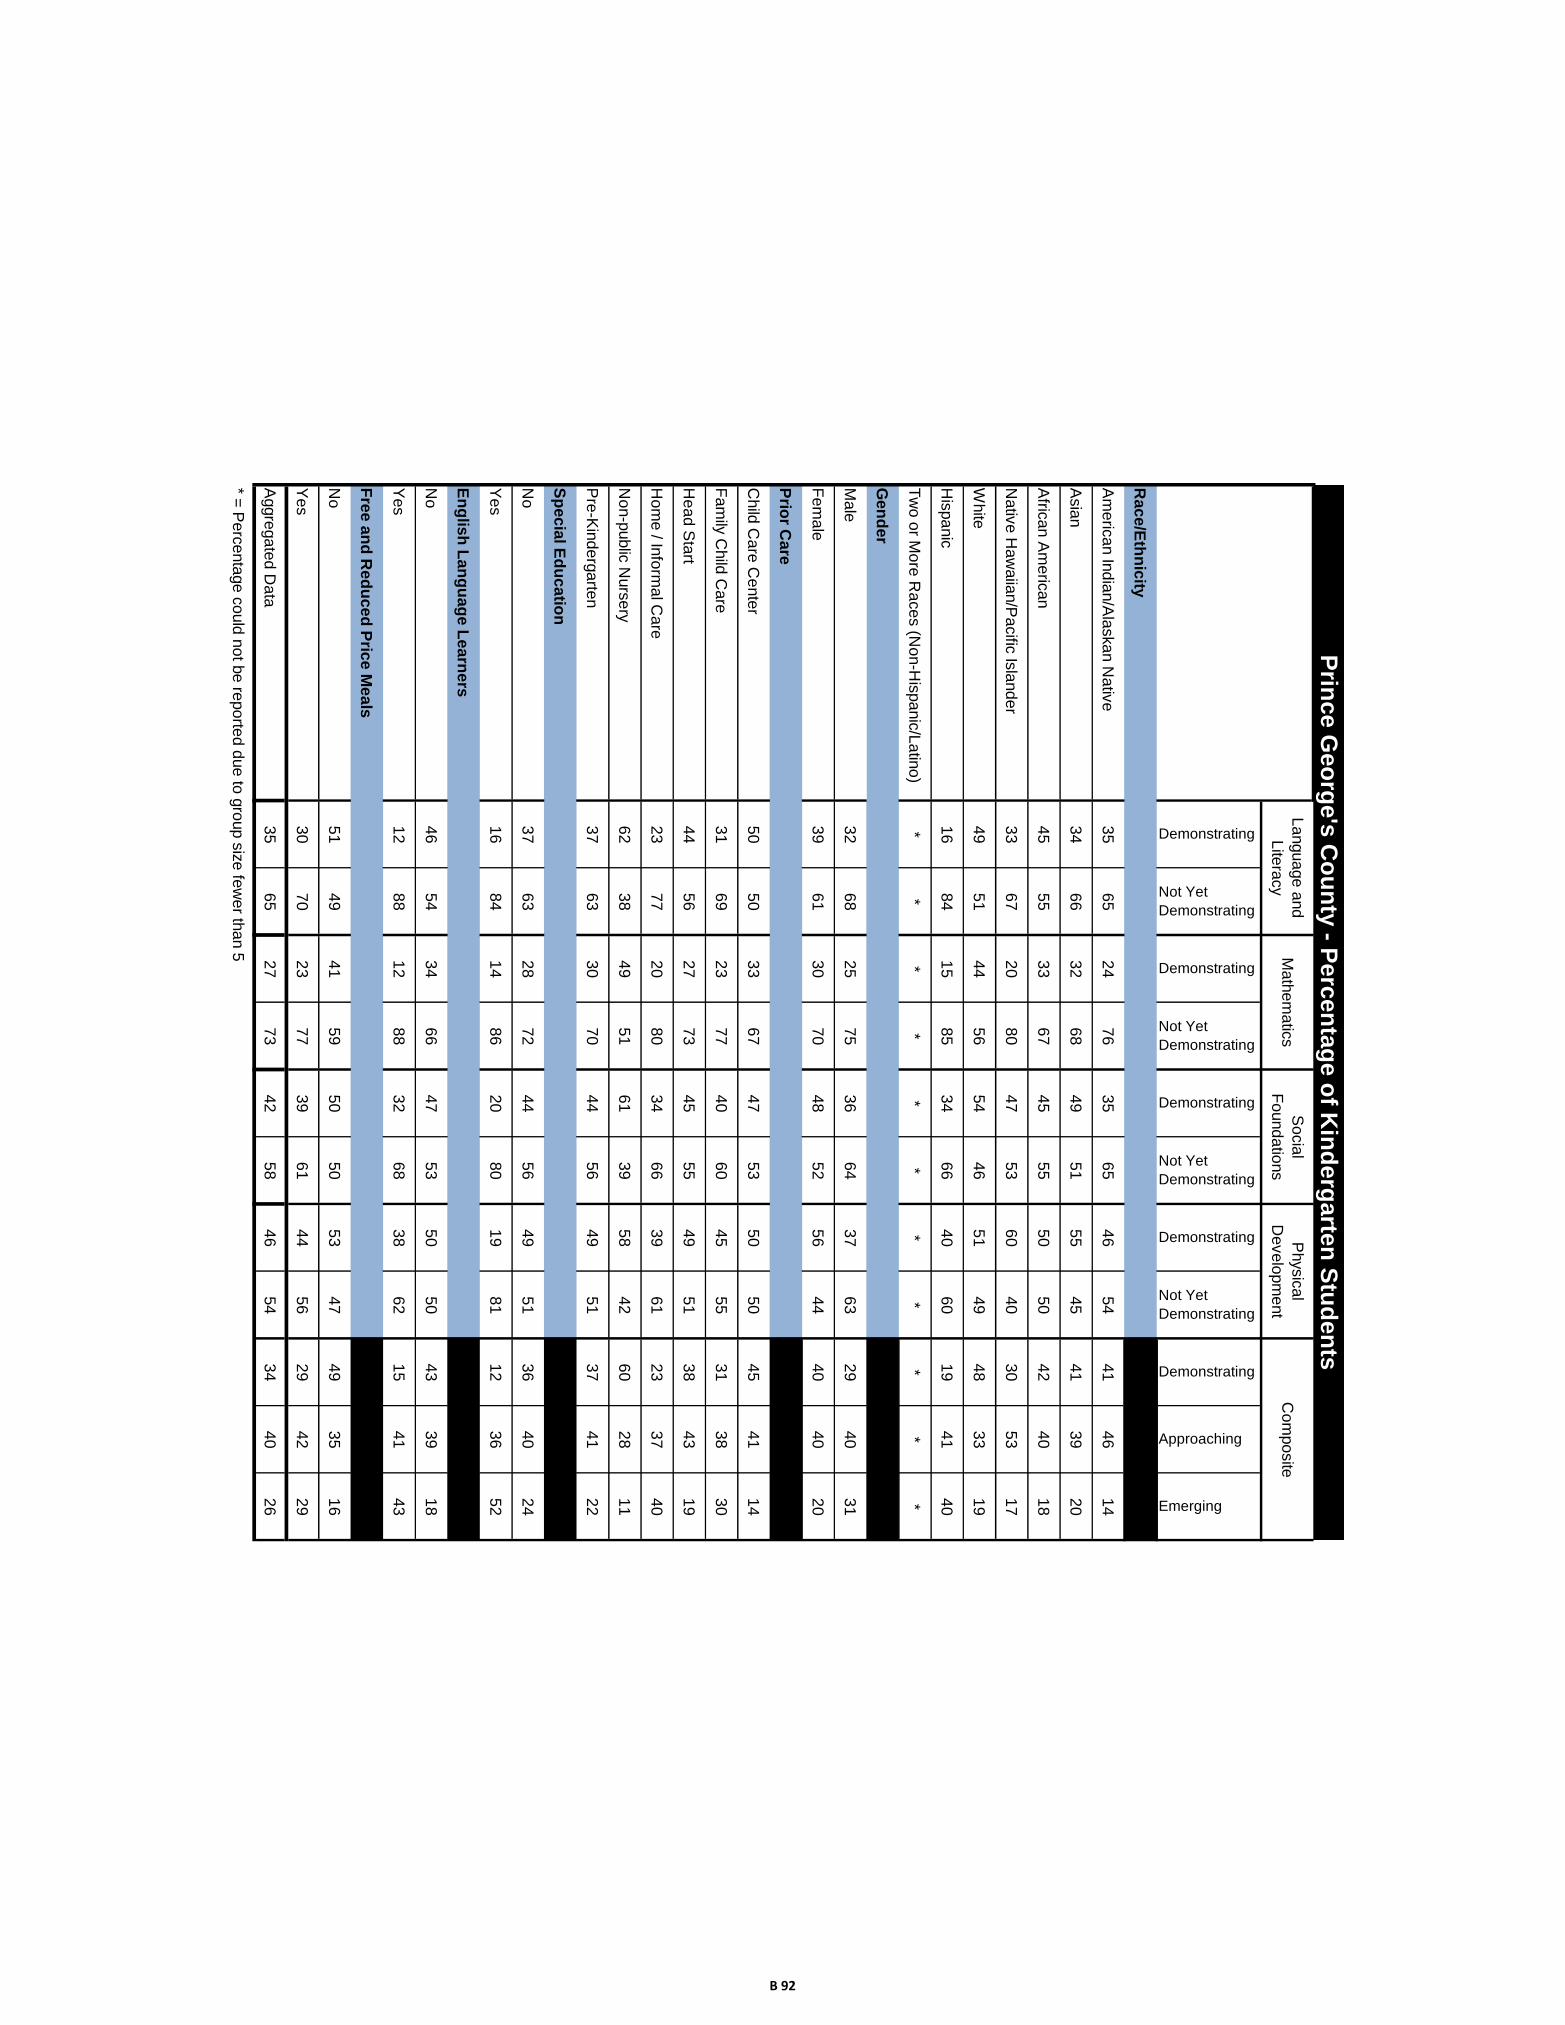
Demonstrating
Not Yet
Demonstrating
Demonstrating
Not Yet
Demonstrating
Demonstrating
Not Yet
Demonstrating
Demonstrating
Not Yet
Demonstrating
Demonstrating
Approaching
Emerging
Rac
e/E
thn
icity
Am
eric
an In
dia
n/A
laskan N
ativ
e3
56
52
47
63
56
54
65
44
14
61
4
Asia
n3
46
63
26
84
95
15
54
54
13
92
0
Afric
an A
meric
an
45
55
33
67
45
55
50
50
42
40
18
Nativ
e H
aw
aiia
n/P
acific
Isla
nde
r3
36
72
08
04
75
36
04
03
05
31
7
White
49
51
44
56
54
46
51
49
48
33
19
His
panic
16
84
15
85
34
66
40
60
19
41
40
Tw
o o
r More
Race
s (N
on-H
ispanic
/La
tino)
**
**
**
**
**
*
Gen
der
Male
32
68
25
75
36
64
37
63
29
40
31
Fem
ale
39
61
30
70
48
52
56
44
40
40
20
Prio
r Care
Child
Care
Cente
r5
05
03
36
74
75
35
05
04
54
11
4
Fam
ily C
hild
Care
31
69
23
77
40
60
45
55
31
38
30
Hea
d S
tart
44
56
27
73
45
55
49
51
38
43
19
Hom
e / In
form
al C
are
23
77
20
80
34
66
39
61
23
37
40
Non-p
ublic
Nurs
ery
62
38
49
51
61
39
58
42
60
28
11
Pre
-Kin
de
rgarte
n3
76
33
07
04
45
64
95
13
74
12
2
Sp
ec
ial E
du
ca
tion
No
37
63
28
72
44
56
49
51
36
40
24
Yes
16
84
14
86
20
80
19
81
12
36
52
En
glis
h L
an
gu
ag
e L
ea
rne
rs
No
46
54
34
66
47
53
50
50
43
39
18
Yes
12
88
12
88
32
68
38
62
15
41
43
Fre
e a
nd
Red
uce
d P
rice
Mea
ls
No
51
49
41
59
50
50
53
47
49
35
16
Yes
30
70
23
77
39
61
44
56
29
42
29
Aggre
gate
d D
ata
35
65
27
73
42
58
46
54
34
40
26
* = P
erc
enta
ge c
ould
not b
e re
porte
d d
ue to
gro
up s
ize fe
wer th
an 5
Socia
l
Founda
tions
Physic
al
Develo
pm
ent
Com
posite
Prin
ce G
eo
rge's
Co
un
ty - P
erc
en
tag
e o
f Kin
derg
arte
n S
tud
en
ts
La
nguage a
nd
Lite
racy
Math
em
atic
s
B 92
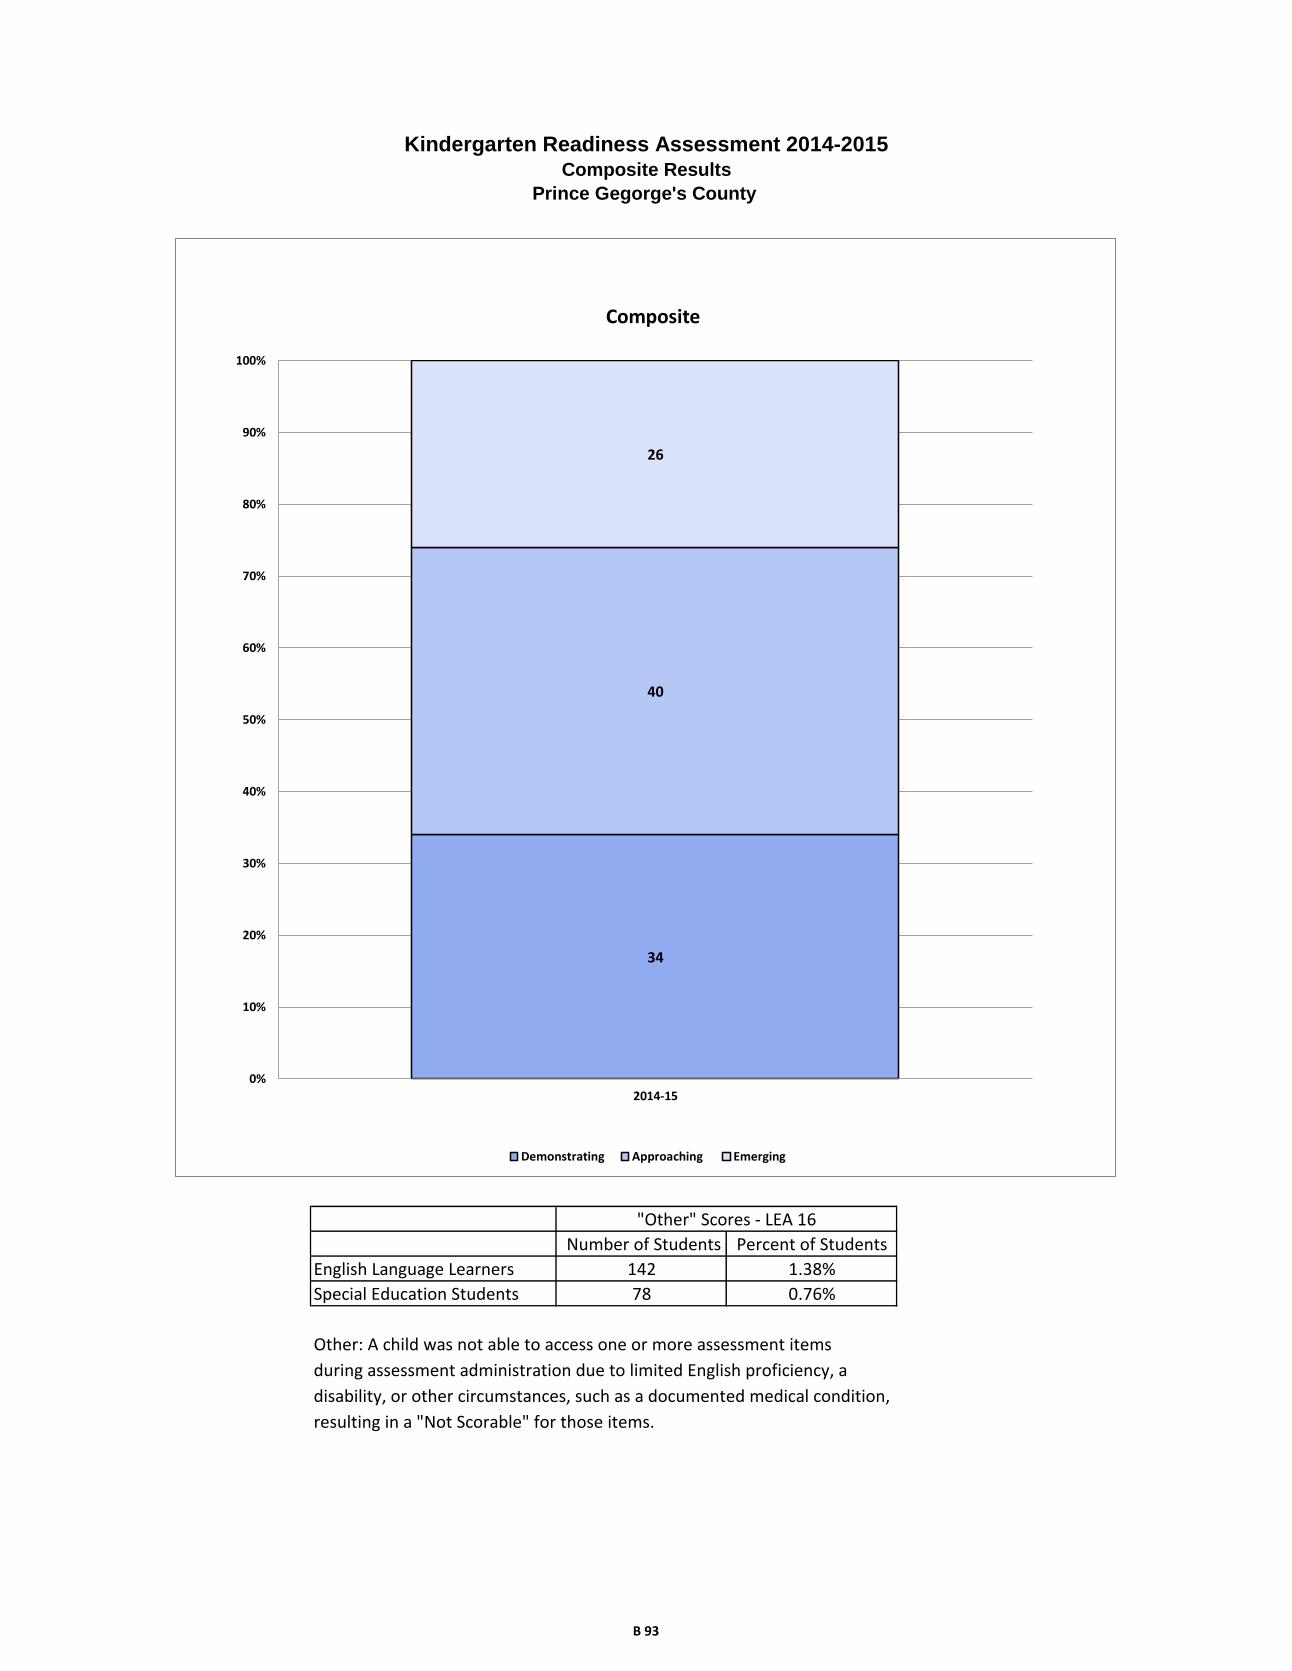
Other: A child was not able to access one or more assessment items
during assessment administration due to limited English proficiency, a
disability, or other circumstances, such as a documented medical condition,
resulting in a "Not Scorable" for those items.
0.76%
"Other" Scores - LEA 16
Number of Students Percent of Students
Kindergarten Readiness Assessment 2014-2015Composite Results
Prince Gegorge's County
English Language Learners 142 1.38%
Special Education Students 78
34
40
26
0%
10%
20%
30%
40%
50%
60%
70%
80%
90%
100%
2014-15
Composite
Demonstrating Approaching Emerging
B 93
Kindergarten Readiness Assessment 2014-2015Domain Results
Prince Georgeo's County
35
65
0%
10%
20%
30%
40%
50%
60%
70%
80%
90%
100%
2014-15
Language and Literacy
Demonstrating Not Yet Demonstrating
27
73
0%
10%
20%
30%
40%
50%
60%
70%
80%
90%
100%
2014-15
Mathematics
Demonstrating Not Yet Demonstrating
42
58
0%
10%
20%
30%
40%
50%
60%
70%
80%
90%
100%
2014-15
Social Foundations
Demonstrating Not Yet Demonstrating
46
54
0%
10%
20%
30%
40%
50%
60%
70%
80%
90%
100%
2014-15
Physical Development
Demonstrating Not Yet Demonstrating
B 94

Frequency Percent
Males 285 50.98
Females 274 49.02
Frequency Percent
American Indian/Alaska Native 0 0.00
Asian 7 1.25
Black/African American 44 7.87
Native Hawaiian/Other Pacific Islander 0 0.00
White 446 79.79
Hispanic/Latino 34 6.08
Two or More Races (Non-Hispanic/Latino) 28 5.01
Frequency Percent
No 402 71.91
Yes 157 28.09
Frequency Percent
No 523 93.56
Yes 36 6.44
Frequency Percent
No 533 95.35
Yes 26 4.65
Frequency Percent
Head Start 5 0.89
Prekindergarten 260 46.51
Child Care Center 133 23.79
Family Child Care 41 7.33
Home/Informal Care 55 9.84
Non-Public Nursery School 62 11.09
Repeated Kindergarten 3 0.54
Kindergarten Readiness Assessment
Queen Anne's County Data File Summary 2014-2015
Gender
Ethnicity/Race
Free & Reduced Priced Meals
Special Education
English Language Learners
Predominant Prior Care
Final Record Count for KRA Data File 559
B 95

Demonstrating
Not Yet
Demonstrating
Demonstrating
Not Yet
Demonstrating
Demonstrating
Not Yet
Demonstrating
Demonstrating
Not Yet
Demonstrating
Demonstrating
Approaching
Emerging
Rac
e/E
thn
icity
Am
eric
an In
dia
n/A
laskan N
ativ
e*
**
**
**
**
**
Asia
n1
60
74
32
51
42
Afric
an A
meric
an
13
30
12
31
17
26
16
27
13
17
13
Nativ
e H
aw
aiia
n/P
acific
Isla
nde
r*
**
**
**
**
**
White
27
01
74
20
52
39
29
61
50
28
21
64
26
21
39
43
His
panic
82
54
28
15
19
16
17
10
15
7
Tw
o o
r More
Race
s (N
on-H
ispanic
/La
tino)
13
15
81
91
61
21
61
21
57
5
Gen
der
Male
13
91
44
10
91
73
15
91
26
14
31
41
13
21
09
41
Fem
ale
16
61
06
12
01
51
18
98
41
89
84
16
97
32
9
Prio
r Care
Child
Care
Cente
r8
94
46
86
59
24
19
63
79
43
09
Fam
ily C
hild
Care
27
14
19
22
36
53
38
30
10
1
Hea
d S
tart
23
05
23
23
21
2
Hom
e / In
form
al C
are
19
35
17
37
26
29
23
31
17
25
12
Non-p
ublic
Nurs
ery
45
17
36
26
45
17
42
20
42
17
3
Pre
-Kin
de
rgarte
n1
23
13
48
71
68
14
51
14
13
41
25
11
49
94
2
Sp
ec
ial E
du
ca
tion
No
29
62
25
22
12
98
33
51
87
32
12
00
29
41
69
56
Yes
92
58
26
13
23
11
25
71
31
4
En
glis
h L
an
gu
ag
e L
ea
rne
rs
No
30
12
29
22
63
03
33
91
93
32
22
10
29
71
69
63
Yes
42
13
21
91
71
01
54
13
7
Fre
e a
nd
Red
uce
d P
rice
Mea
ls
No
25
51
46
19
32
07
27
71
25
26
01
42
25
21
18
30
Yes
50
10
43
61
17
71
85
72
83
49
64
40
Aggre
gate
d D
ata
30
52
50
22
93
24
34
82
10
33
22
25
30
11
82
70
* = G
roup s
ize fe
wer th
an 5
Qu
een
An
ne's
Co
un
ty - N
um
ber o
f Kin
derg
arte
n S
tud
en
ts
Socia
l
Founda
tions
Physic
al
Develo
pm
ent
La
nguage a
nd
Lite
racy
Math
em
atic
sC
om
posite
B 96

Demonstrating
Not Yet
Demonstrating
Demonstrating
Not Yet
Demonstrating
Demonstrating
Not Yet
Demonstrating
Demonstrating
Not Yet
Demonstrating
Demonstrating
Approaching
Emerging
Rac
e/E
thn
icity
Am
eric
an In
dia
n/A
laskan N
ativ
e*
**
**
**
**
**
Asia
n1
48
60
10
05
74
32
97
11
45
72
9
Afric
an A
meric
an
30
70
28
72
40
60
37
63
30
40
30
Nativ
e H
aw
aiia
n/P
acific
Isla
nde
r*
**
**
**
**
**
White
61
39
46
54
66
34
63
37
59
31
10
His
panic
24
76
13
88
44
56
48
52
31
47
22
Tw
o o
r More
Race
s (N
on-H
ispanic
/La
tino)
46
54
30
70
57
43
57
43
56
26
19
Gen
der
Male
49
51
39
61
56
44
50
50
47
39
15
Fem
ale
61
39
44
56
69
31
69
31
62
27
11
Prio
r Care
Child
Care
Cente
r6
73
35
14
96
93
17
22
87
12
37
Fam
ily C
hild
Care
66
34
46
54
88
12
80
20
73
24
2
Hea
d S
tart
40
60
01
00
40
60
40
60
40
20
40
Hom
e / In
form
al C
are
35
65
31
69
47
53
43
57
31
46
22
Non-p
ublic
Nurs
ery
73
27
58
42
73
27
68
32
68
27
5
Pre
-Kin
de
rgarte
n4
85
23
46
65
64
45
24
84
53
91
6
Sp
ec
ial E
du
ca
tion
No
57
43
43
57
64
36
62
38
57
33
11
Yes
26
74
24
76
36
64
31
69
21
38
41
En
glis
h L
an
gu
ag
e L
ea
rne
rs
No
57
43
43
57
64
36
61
39
56
32
12
Yes
16
84
13
88
35
65
40
60
17
54
29
Fre
e a
nd
Red
uce
d P
rice
Mea
ls
No
64
36
48
52
69
31
65
35
63
30
8
Yes
32
68
24
76
46
54
46
54
32
42
26
Aggre
gate
d D
ata
55
45
41
59
62
38
60
40
54
33
13
* = P
erc
enta
ge c
ould
not b
e re
porte
d d
ue to
gro
up s
ize fe
wer th
an 5
Socia
l
Founda
tions
Physic
al
Develo
pm
ent
Com
posite
Qu
een
An
ne's
Co
un
ty - P
erc
en
tag
e o
f Kin
derg
arte
n S
tud
en
ts
La
nguage a
nd
Lite
racy
Math
em
atic
s
B 97
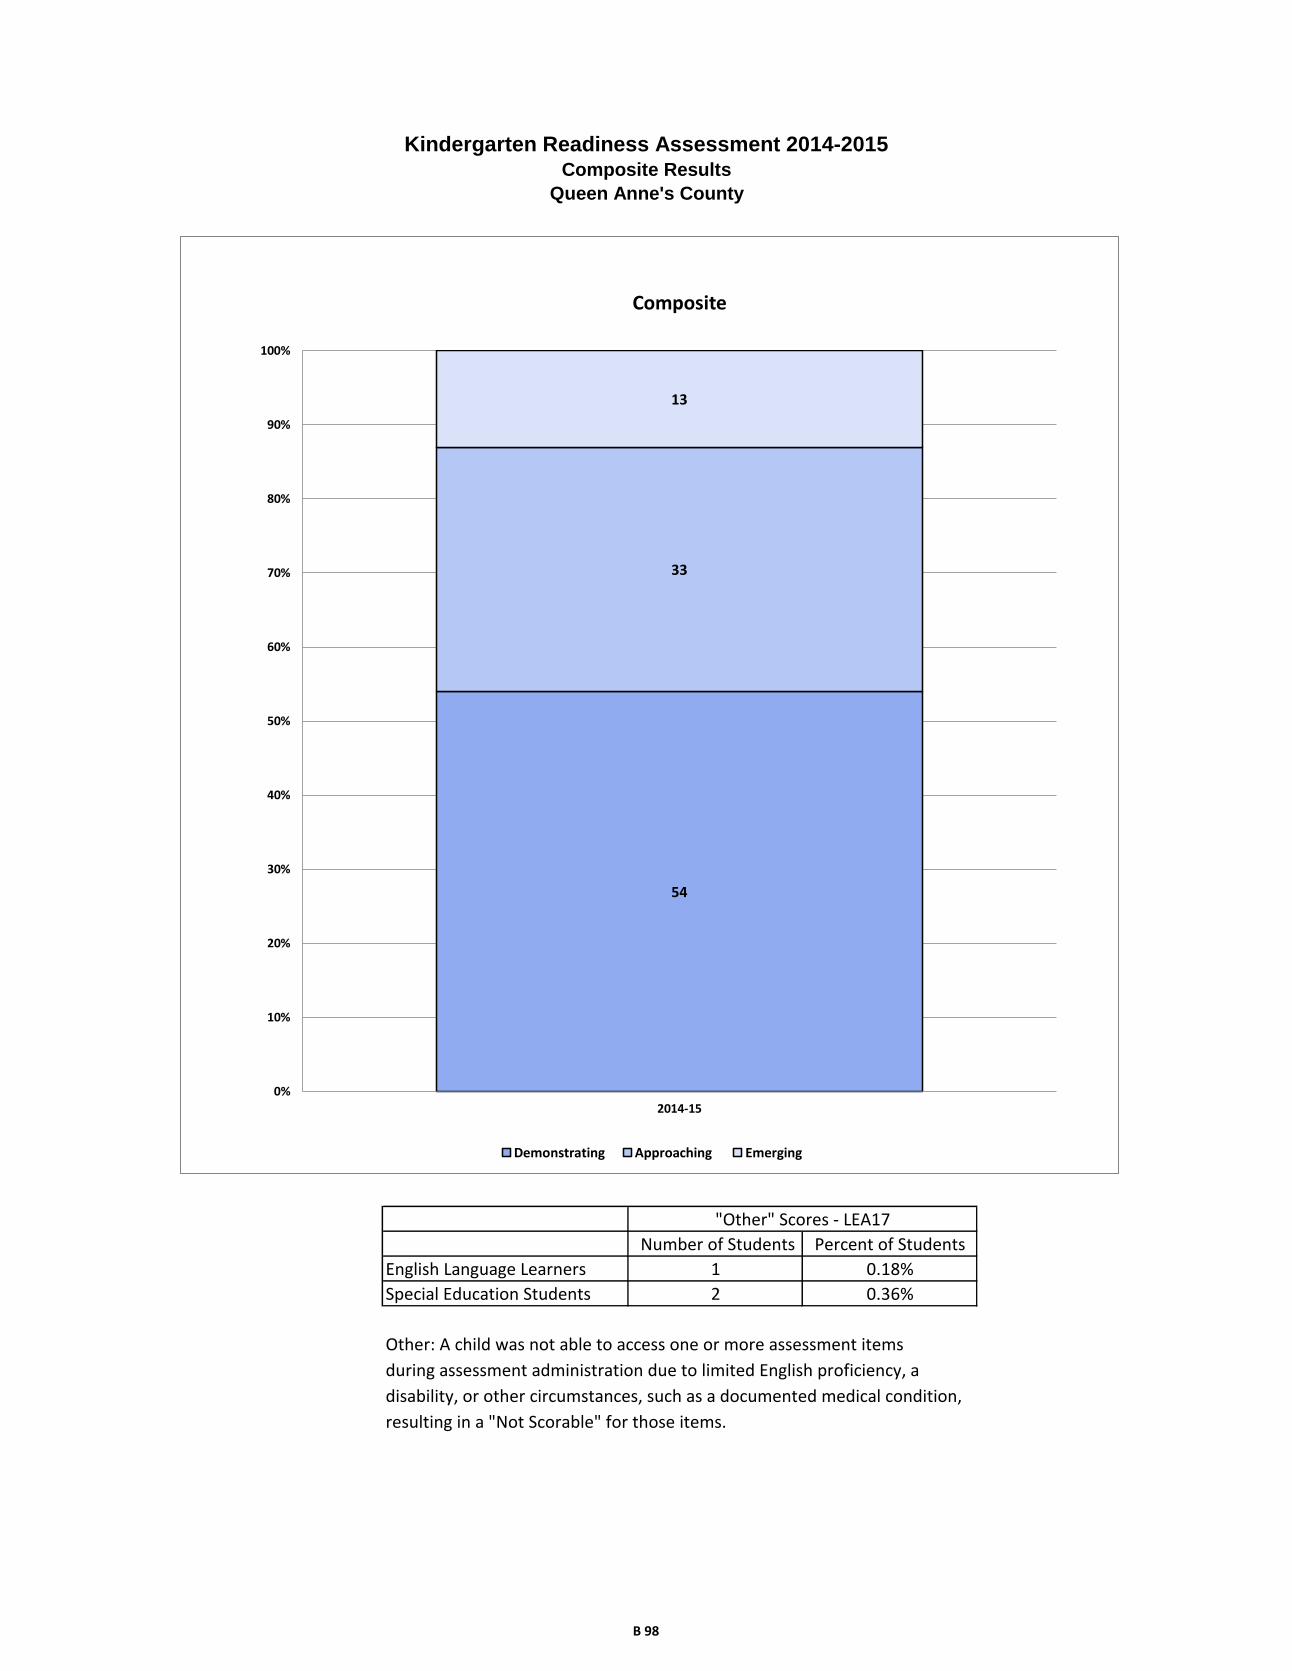
Other: A child was not able to access one or more assessment items
during assessment administration due to limited English proficiency, a
disability, or other circumstances, such as a documented medical condition,
resulting in a "Not Scorable" for those items.
Kindergarten Readiness Assessment 2014-2015Composite Results
Queen Anne's County
English Language Learners 1 0.18%
Special Education Students 2 0.36%
"Other" Scores - LEA17
Number of Students Percent of Students
54
33
13
0%
10%
20%
30%
40%
50%
60%
70%
80%
90%
100%
2014-15
Composite
Demonstrating Approaching Emerging
B 98
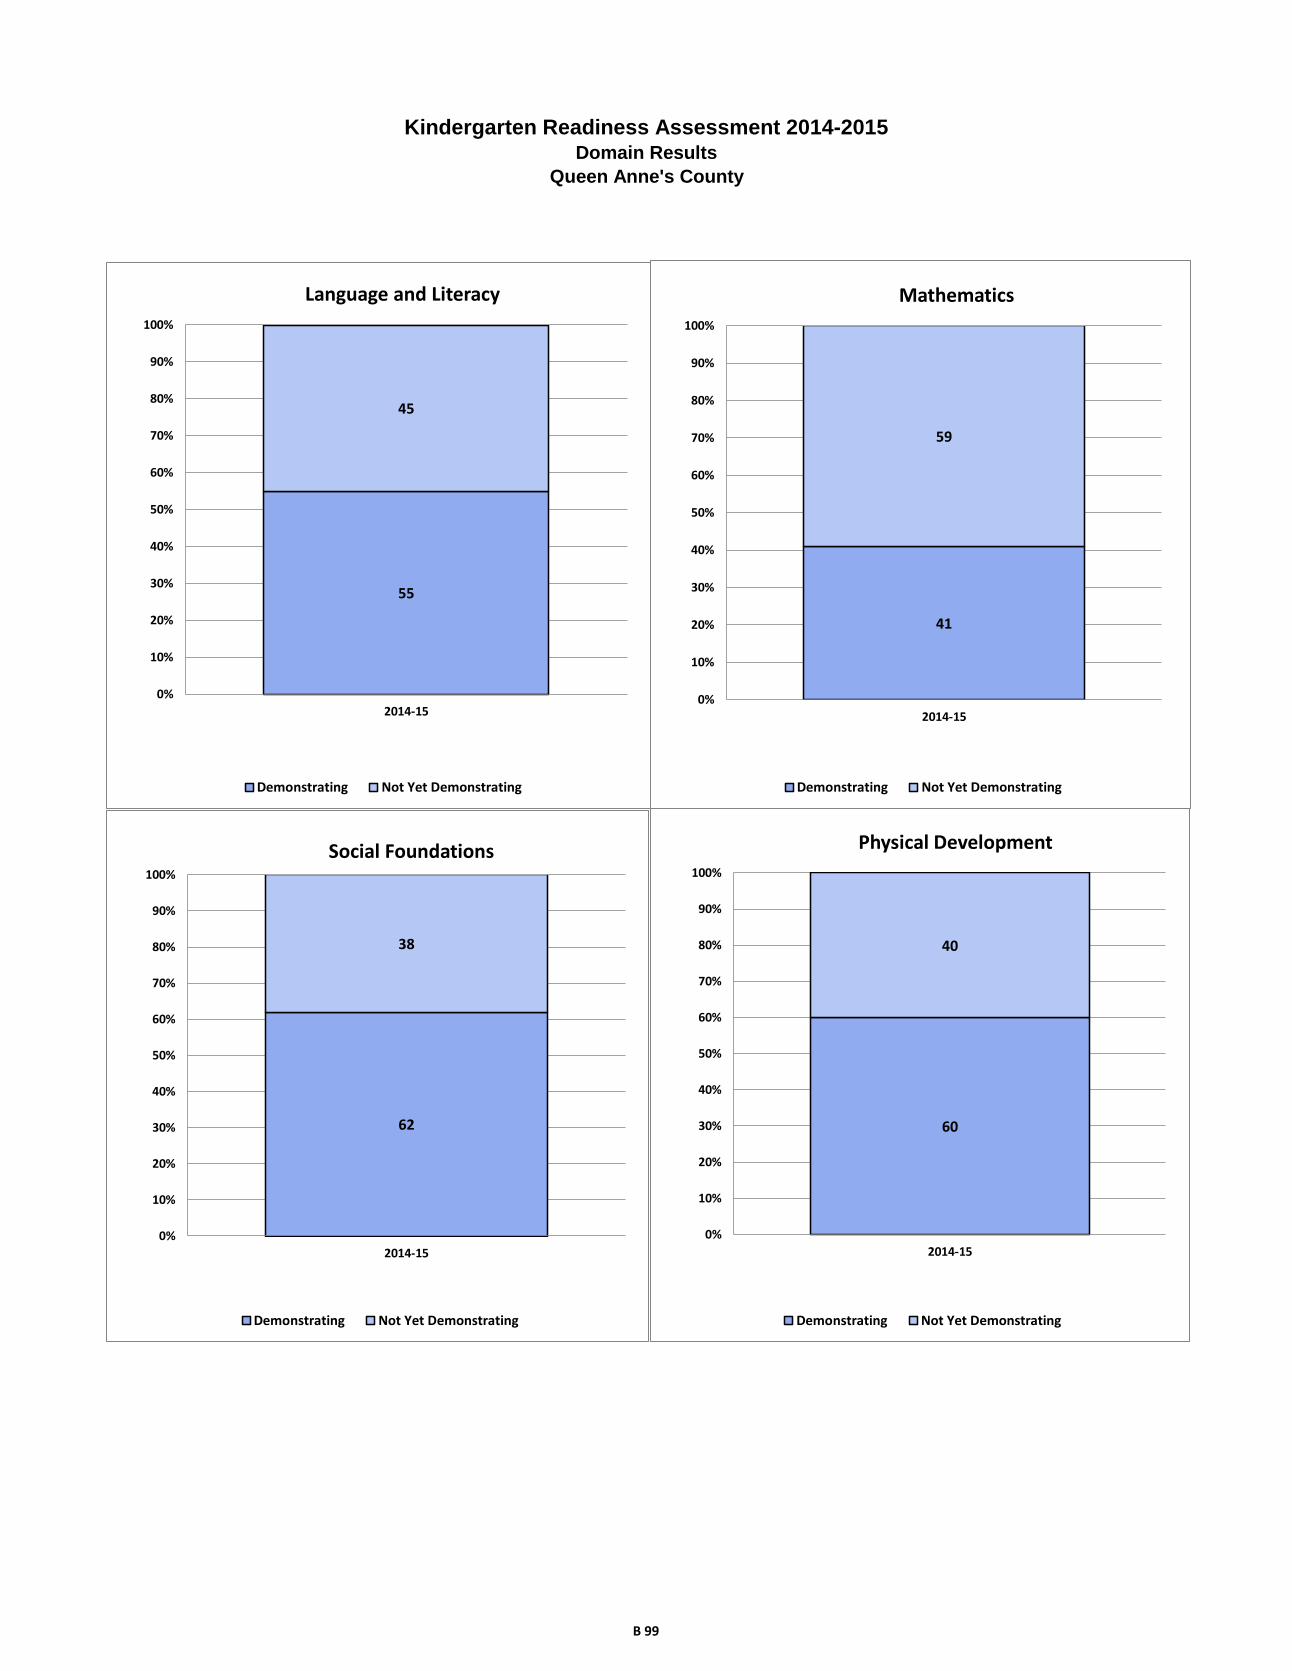
Kindergarten Readiness Assessment 2014-2015Domain Results
Queen Anne's County
55
45
0%
10%
20%
30%
40%
50%
60%
70%
80%
90%
100%
2014-15
Language and Literacy
Demonstrating Not Yet Demonstrating
41
59
0%
10%
20%
30%
40%
50%
60%
70%
80%
90%
100%
2014-15
Mathematics
Demonstrating Not Yet Demonstrating
62
38
0%
10%
20%
30%
40%
50%
60%
70%
80%
90%
100%
2014-15
Social Foundations
Demonstrating Not Yet Demonstrating
60
40
0%
10%
20%
30%
40%
50%
60%
70%
80%
90%
100%
2014-15
Physical Development
Demonstrating Not Yet Demonstrating
B 99
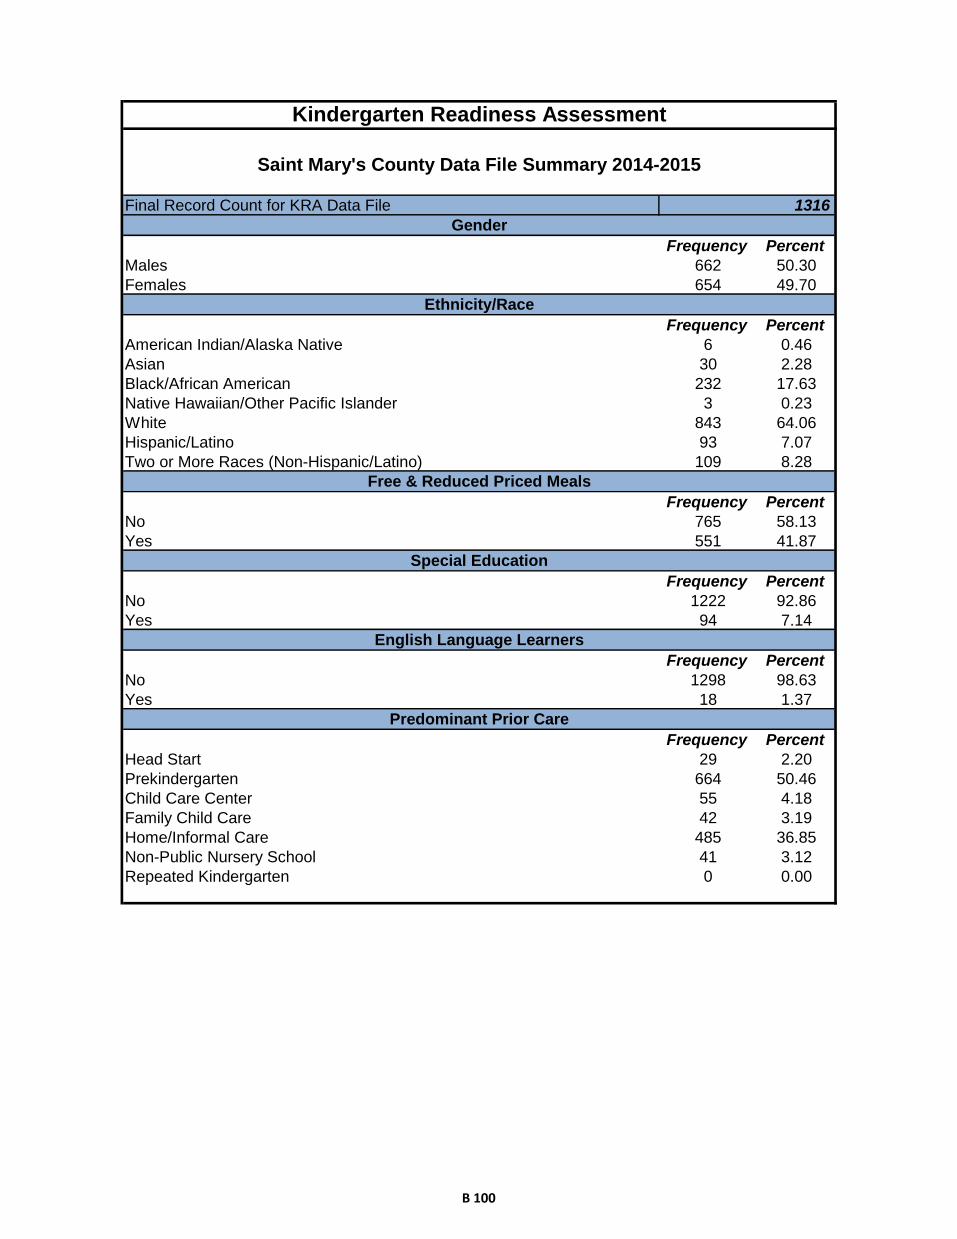
Frequency Percent
Males 662 50.30
Females 654 49.70
Frequency Percent
American Indian/Alaska Native 6 0.46
Asian 30 2.28
Black/African American 232 17.63
Native Hawaiian/Other Pacific Islander 3 0.23
White 843 64.06
Hispanic/Latino 93 7.07
Two or More Races (Non-Hispanic/Latino) 109 8.28
Frequency Percent
No 765 58.13
Yes 551 41.87
Frequency Percent
No 1222 92.86
Yes 94 7.14
Frequency Percent
No 1298 98.63
Yes 18 1.37
Frequency Percent
Head Start 29 2.20
Prekindergarten 664 50.46
Child Care Center 55 4.18
Family Child Care 42 3.19
Home/Informal Care 485 36.85
Non-Public Nursery School 41 3.12
Repeated Kindergarten 0 0.00
Free & Reduced Priced Meals
Special Education
English Language Learners
Predominant Prior Care
Final Record Count for KRA Data File 1316
Kindergarten Readiness Assessment
Saint Mary's County Data File Summary 2014-2015
Gender
Ethnicity/Race
B 100

Demonstrating
Not Yet
Demonstrating
Demonstrating
Not Yet
Demonstrating
Demonstrating
Not Yet
Demonstrating
Demonstrating
Not Yet
Demonstrating
Demonstrating
Approaching
Emerging
Rac
e/E
thn
icity
Am
eric
an In
dia
n/A
laskan N
ativ
e4
23
33
33
33
12
Asia
n1
21
71
02
02
18
18
12
16
10
3
Afric
an A
meric
an
83
13
93
51
92
10
71
16
11
91
04
80
10
13
8
Nativ
e H
aw
aiia
n/P
acific
Isla
nde
r*
**
**
**
**
**
White
45
93
71
38
94
42
54
22
88
51
33
16
49
92
58
71
His
panic
35
48
23
69
55
29
52
31
41
22
19
Tw
o o
r More
Race
s (N
on-H
ispanic
/La
tino)
44
60
38
68
65
40
62
43
51
39
14
Gen
der
Male
30
13
39
23
34
15
35
42
87
33
03
11
30
42
33
10
1
Fem
ale
33
82
99
26
73
80
44
11
98
44
01
98
38
91
98
46
Prio
r Care
Child
Care
Cente
r2
82
62
33
13
51
93
12
32
92
14
Fam
ily C
hild
Care
28
14
24
17
32
10
28
14
29
10
2
Hea
d S
tart
42
26
22
10
16
12
14
71
36
Hom
e / In
form
al C
are
21
22
54
16
23
12
25
92
08
26
62
01
21
91
82
64
Non-p
ublic
Nurs
ery
29
12
26
15
38
33
01
13
55
1
Pre
-Kin
de
rgarte
n3
38
31
02
59
39
84
21
22
94
03
24
63
74
20
07
0
Sp
ec
ial E
du
ca
tion
No
62
15
72
48
87
24
76
94
26
75
04
45
67
64
06
10
8
Yes
18
66
12
71
26
59
20
64
17
25
39
En
glis
h L
an
gu
ag
e L
ea
rne
rs
No
63
96
21
50
07
77
79
14
72
76
05
02
69
24
25
13
7
Yes
01
70
18
41
31
07
16
10
Fre
e a
nd
Red
uce
d P
rice
Mea
ls
No
42
63
29
36
53
93
52
22
34
49
22
62
47
32
26
53
Yes
21
33
09
13
54
02
27
32
51
27
82
47
22
02
05
94
Aggre
gate
d D
ata
63
96
38
50
07
95
79
54
85
77
05
09
69
34
31
14
7
* = G
roup s
ize fe
wer th
an 5
Sain
t Mary
's C
ou
nty
- Nu
mb
er o
f Kin
derg
arte
n S
tud
en
ts
Socia
l
Founda
tions
Physic
al
Develo
pm
ent
La
nguage a
nd
Lite
racy
Math
em
atic
sC
om
posite
B 101

Demonstrating
Not Yet
Demonstrating
Demonstrating
Not Yet
Demonstrating
Demonstrating
Not Yet
Demonstrating
Demonstrating
Not Yet
Demonstrating
Demonstrating
Approaching
Emerging
Rac
e/E
thn
icity
Am
eric
an In
dia
n/A
laskan N
ativ
e6
73
35
05
05
05
05
05
05
01
73
3
Asia
n4
15
93
36
77
22
86
04
05
53
41
0
Afric
an A
meric
an
37
63
15
85
48
52
53
47
37
46
17
Nativ
e H
aw
aiia
n/P
acific
Isla
nde
r*
**
**
**
**
**
White
55
45
47
53
65
35
62
38
60
31
9
His
panic
42
58
25
75
65
35
63
37
50
27
23
Tw
o o
r More
Race
s (N
on-H
ispanic
/La
tino)
42
58
36
64
62
38
59
41
49
38
13
Gen
der
Male
47
53
36
64
55
45
51
49
48
37
16
Fem
ale
53
47
41
59
69
31
69
31
61
31
7
Prio
r Care
Child
Care
Cente
r5
24
84
35
76
53
55
74
35
43
97
Fam
ily C
hild
Care
67
33
59
41
76
24
67
33
71
24
5
Hea
d S
tart
15
85
21
79
38
62
46
54
27
50
23
Hom
e / In
form
al C
are
45
55
34
66
55
45
57
43
47
39
14
Non-p
ublic
Nurs
ery
71
29
63
37
93
77
32
78
51
22
Pre
-Kin
de
rgarte
n5
24
83
96
16
53
56
23
85
83
12
Sp
ec
ial E
du
ca
tion
No
52
48
40
60
64
36
63
37
57
34
9
Yes
21
79
14
86
31
69
24
76
21
31
48
En
glis
h L
an
gu
ag
e L
ea
rne
rs
No
51
49
39
61
63
37
60
40
55
34
11
Yes
01
00
01
00
24
76
59
41
63
55
9
Fre
e a
nd
Red
uce
d P
rice
Mea
ls
No
56
44
48
52
69
31
65
35
63
30
7
Yes
41
59
25
75
52
48
53
47
42
39
18
Aggre
gate
d D
ata
50
50
39
61
62
38
60
40
55
34
12
* = P
erc
enta
ge c
ould
not b
e re
porte
d d
ue to
gro
up s
ize fe
wer th
an 5
Socia
l
Founda
tions
Physic
al
Develo
pm
ent
Com
posite
Sain
t Mary
's C
ou
nty
- Perc
en
tag
e o
f Kin
derg
arte
n S
tud
en
ts
La
nguage a
nd
Lite
racy
Math
em
atic
s
B 102
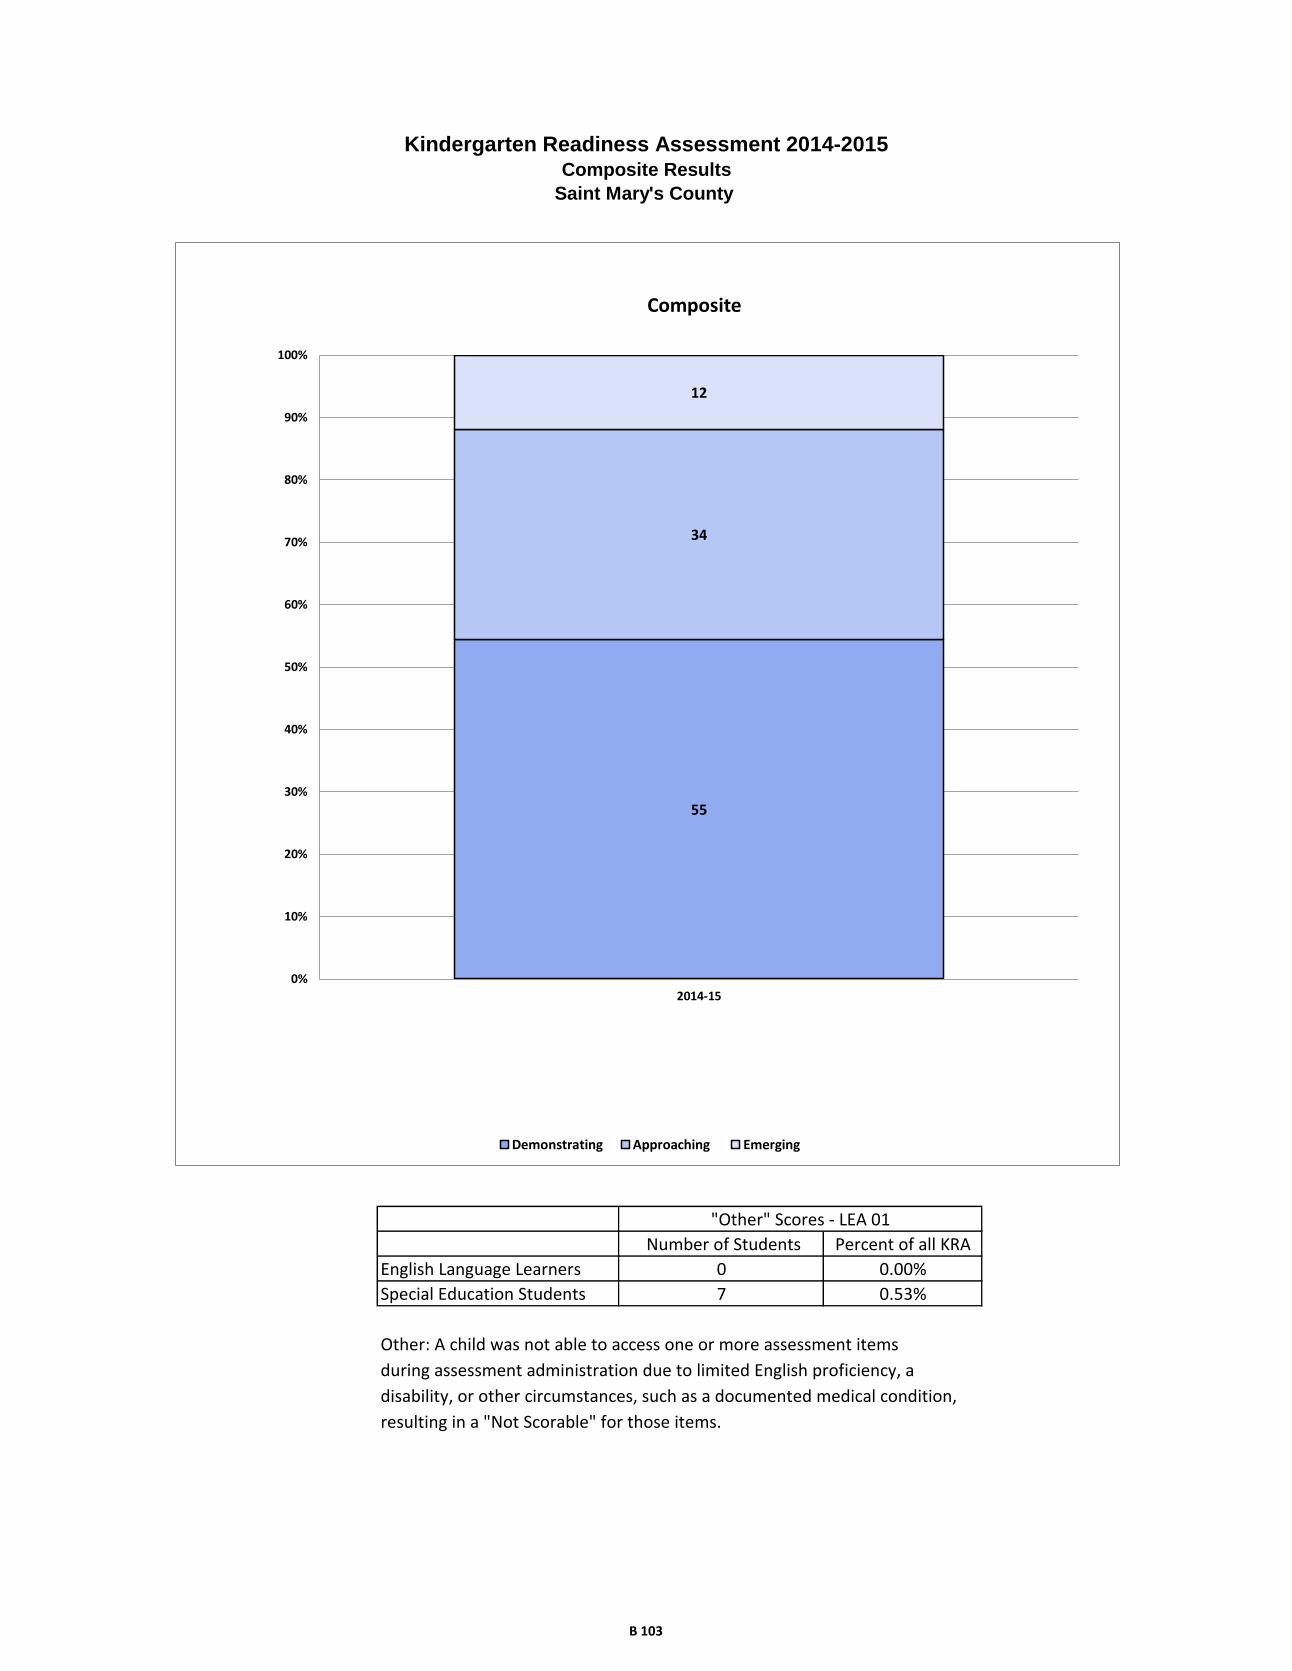
Other: A child was not able to access one or more assessment items
during assessment administration due to limited English proficiency, a
disability, or other circumstances, such as a documented medical condition,
resulting in a "Not Scorable" for those items.
English Language Learners 0 0.00%
Special Education Students 7 0.53%
"Other" Scores - LEA 01
Number of Students Percent of all KRA
Kindergarten Readiness Assessment 2014-2015Composite Results
Saint Mary's County
55
34
12
0%
10%
20%
30%
40%
50%
60%
70%
80%
90%
100%
2014-15
Composite
Demonstrating Approaching Emerging
B 103
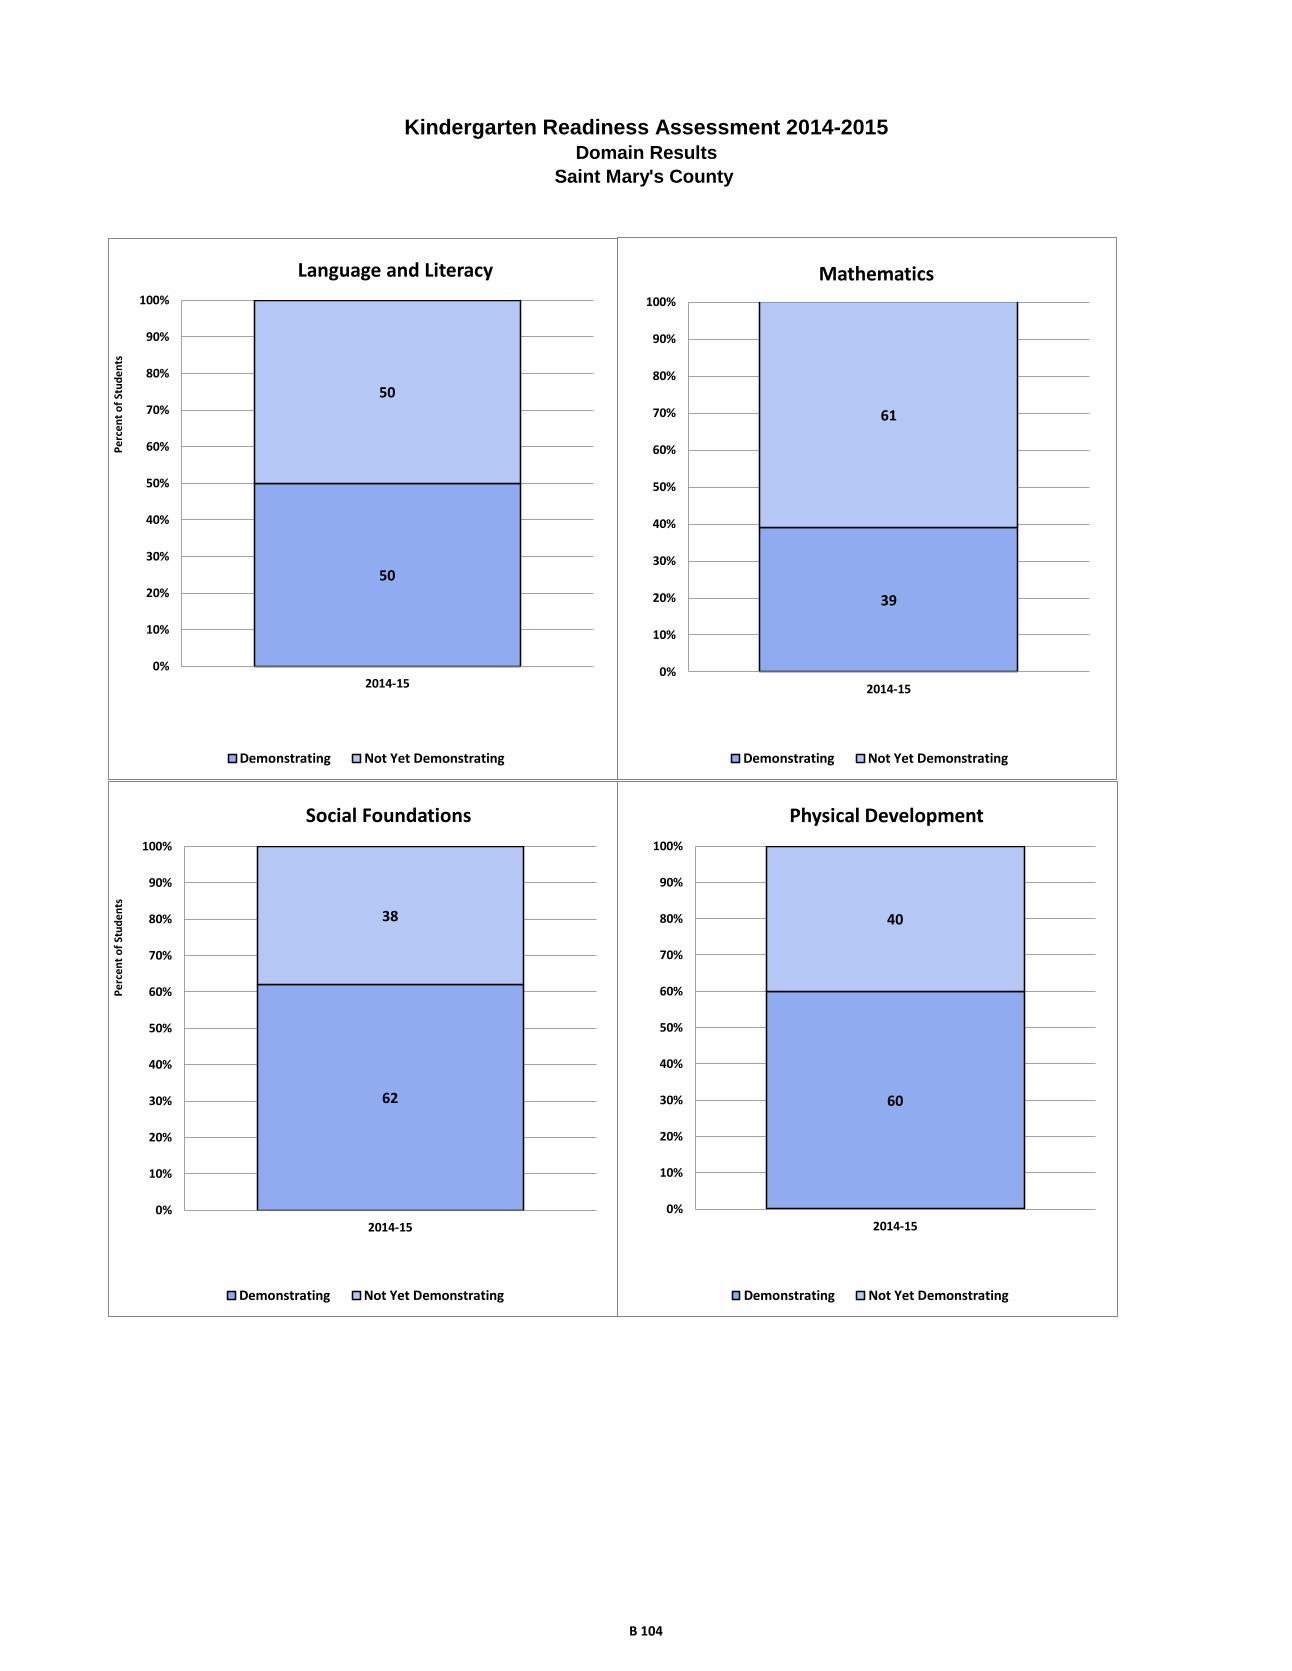
Kindergarten Readiness Assessment 2014-2015Domain Results
Saint Mary's County
50
50
0%
10%
20%
30%
40%
50%
60%
70%
80%
90%
100%
2014-15
Language and Literacy
Demonstrating Not Yet Demonstrating
Pe
rce
nt
of
Stu
de
nts
39
61
0%
10%
20%
30%
40%
50%
60%
70%
80%
90%
100%
2014-15
Mathematics
Demonstrating Not Yet Demonstrating
62
38
0%
10%
20%
30%
40%
50%
60%
70%
80%
90%
100%
2014-15
Social Foundations
Demonstrating Not Yet Demonstrating
Pe
rce
nt
of
Stu
de
nts
60
40
0%
10%
20%
30%
40%
50%
60%
70%
80%
90%
100%
2014-15
Physical Development
Demonstrating Not Yet Demonstrating
B 104

Frequency Percent
Males 129 53.09
Females 114 46.91
Frequency Percent
American Indian/Alaska Native 3 1.23
Asian 4 1.65
Black/African American 111 45.68
Native Hawaiian/Other Pacific Islander 0 0.00
White 88 36.21
Hispanic/Latino 24 9.88
Two or More Races (Non-Hispanic/Latino) 13 5.35
Frequency Percent
No 48 19.75
Yes 195 80.25
Frequency Percent
No 217 89.30
Yes 26 10.70
Frequency Percent
No 229 94.24
Yes 14 5.76
Frequency Percent
Head Start 12 4.94
Prekindergarten 199 81.89
Child Care Center 6 2.47
Family Child Care 0 0.00
Home/Informal Care 10 4.12
Non-Public Nursery School 0 0.00
Repeated Kindergarten 16 6.58
Special Education
English Language Learners
Predominant Prior Care
Final Record Count for KRA Data File 243
Kindergarten Readiness Assessment
Somerset County Data File Summary 2014-2015
Gender
Ethnicity/Race
Free & Reduced Priced Meals
B 105

Demonstrating
Not Yet
Demonstrating
Demonstrating
Not Yet
Demonstrating
Demonstrating
Not Yet
Demonstrating
Demonstrating
Not Yet
Demonstrating
Demonstrating
Approaching
Emerging
Rac
e/E
thn
icity
Am
eric
an In
dia
n/A
laskan N
ativ
e*
**
**
**
**
**
Asia
n*
**
**
**
**
**
Afric
an A
meric
an
50
59
35
73
55
53
64
45
46
46
16
Nativ
e H
aw
aiia
n/P
acific
Isla
nde
r*
**
**
**
**
**
White
51
37
48
40
54
34
52
36
49
30
9
His
panic
71
44
17
81
31
01
16
14
1
Tw
o o
r More
Race
s (N
on-H
ispanic
/La
tino)
76
76
94
10
37
51
Gen
der
Male
61
66
45
81
61
65
64
63
51
56
19
Fem
ale
56
54
50
60
68
42
75
35
60
40
10
Prio
r Care
Child
Care
Cente
r2
42
43
32
42
31
Fam
ily C
hild
Care
**
**
**
**
**
*
Hea
d S
tart
21
04
83
95
73
54
Hom
e / In
form
al C
are
28
46
46
55
34
3
Non-p
ublic
Nurs
ery
**
**
**
**
**
*
Pre
-Kin
de
rgarte
n1
05
88
80
11
21
12
80
12
17
21
00
73
19
Sp
ec
ial E
du
ca
tion
No
10
91
03
89
12
31
24
88
13
47
81
07
86
19
Yes
81
76
18
51
95
20
41
01
0
En
glis
h L
an
gu
ag
e L
ea
rne
rs
No
11
61
07
93
12
91
26
96
13
58
81
09
87
26
Yes
11
32
12
31
14
10
29
3
Fre
e a
nd
Red
uce
d P
rice
Mea
ls
No
30
17
26
21
30
17
31
16
29
13
5
Yes
87
10
36
91
20
99
90
10
88
28
28
32
4
Aggre
gate
d D
ata
11
71
20
95
14
11
29
10
71
39
98
11
19
62
9
* = G
roup s
ize fe
wer th
an 5
So
mers
et C
ou
nty
- Nu
mb
er o
f Kin
derg
arte
n S
tud
en
ts
Socia
l
Founda
tions
Physic
al
Develo
pm
ent
La
nguage a
nd
Lite
racy
Math
em
atic
sC
om
posite
B 106
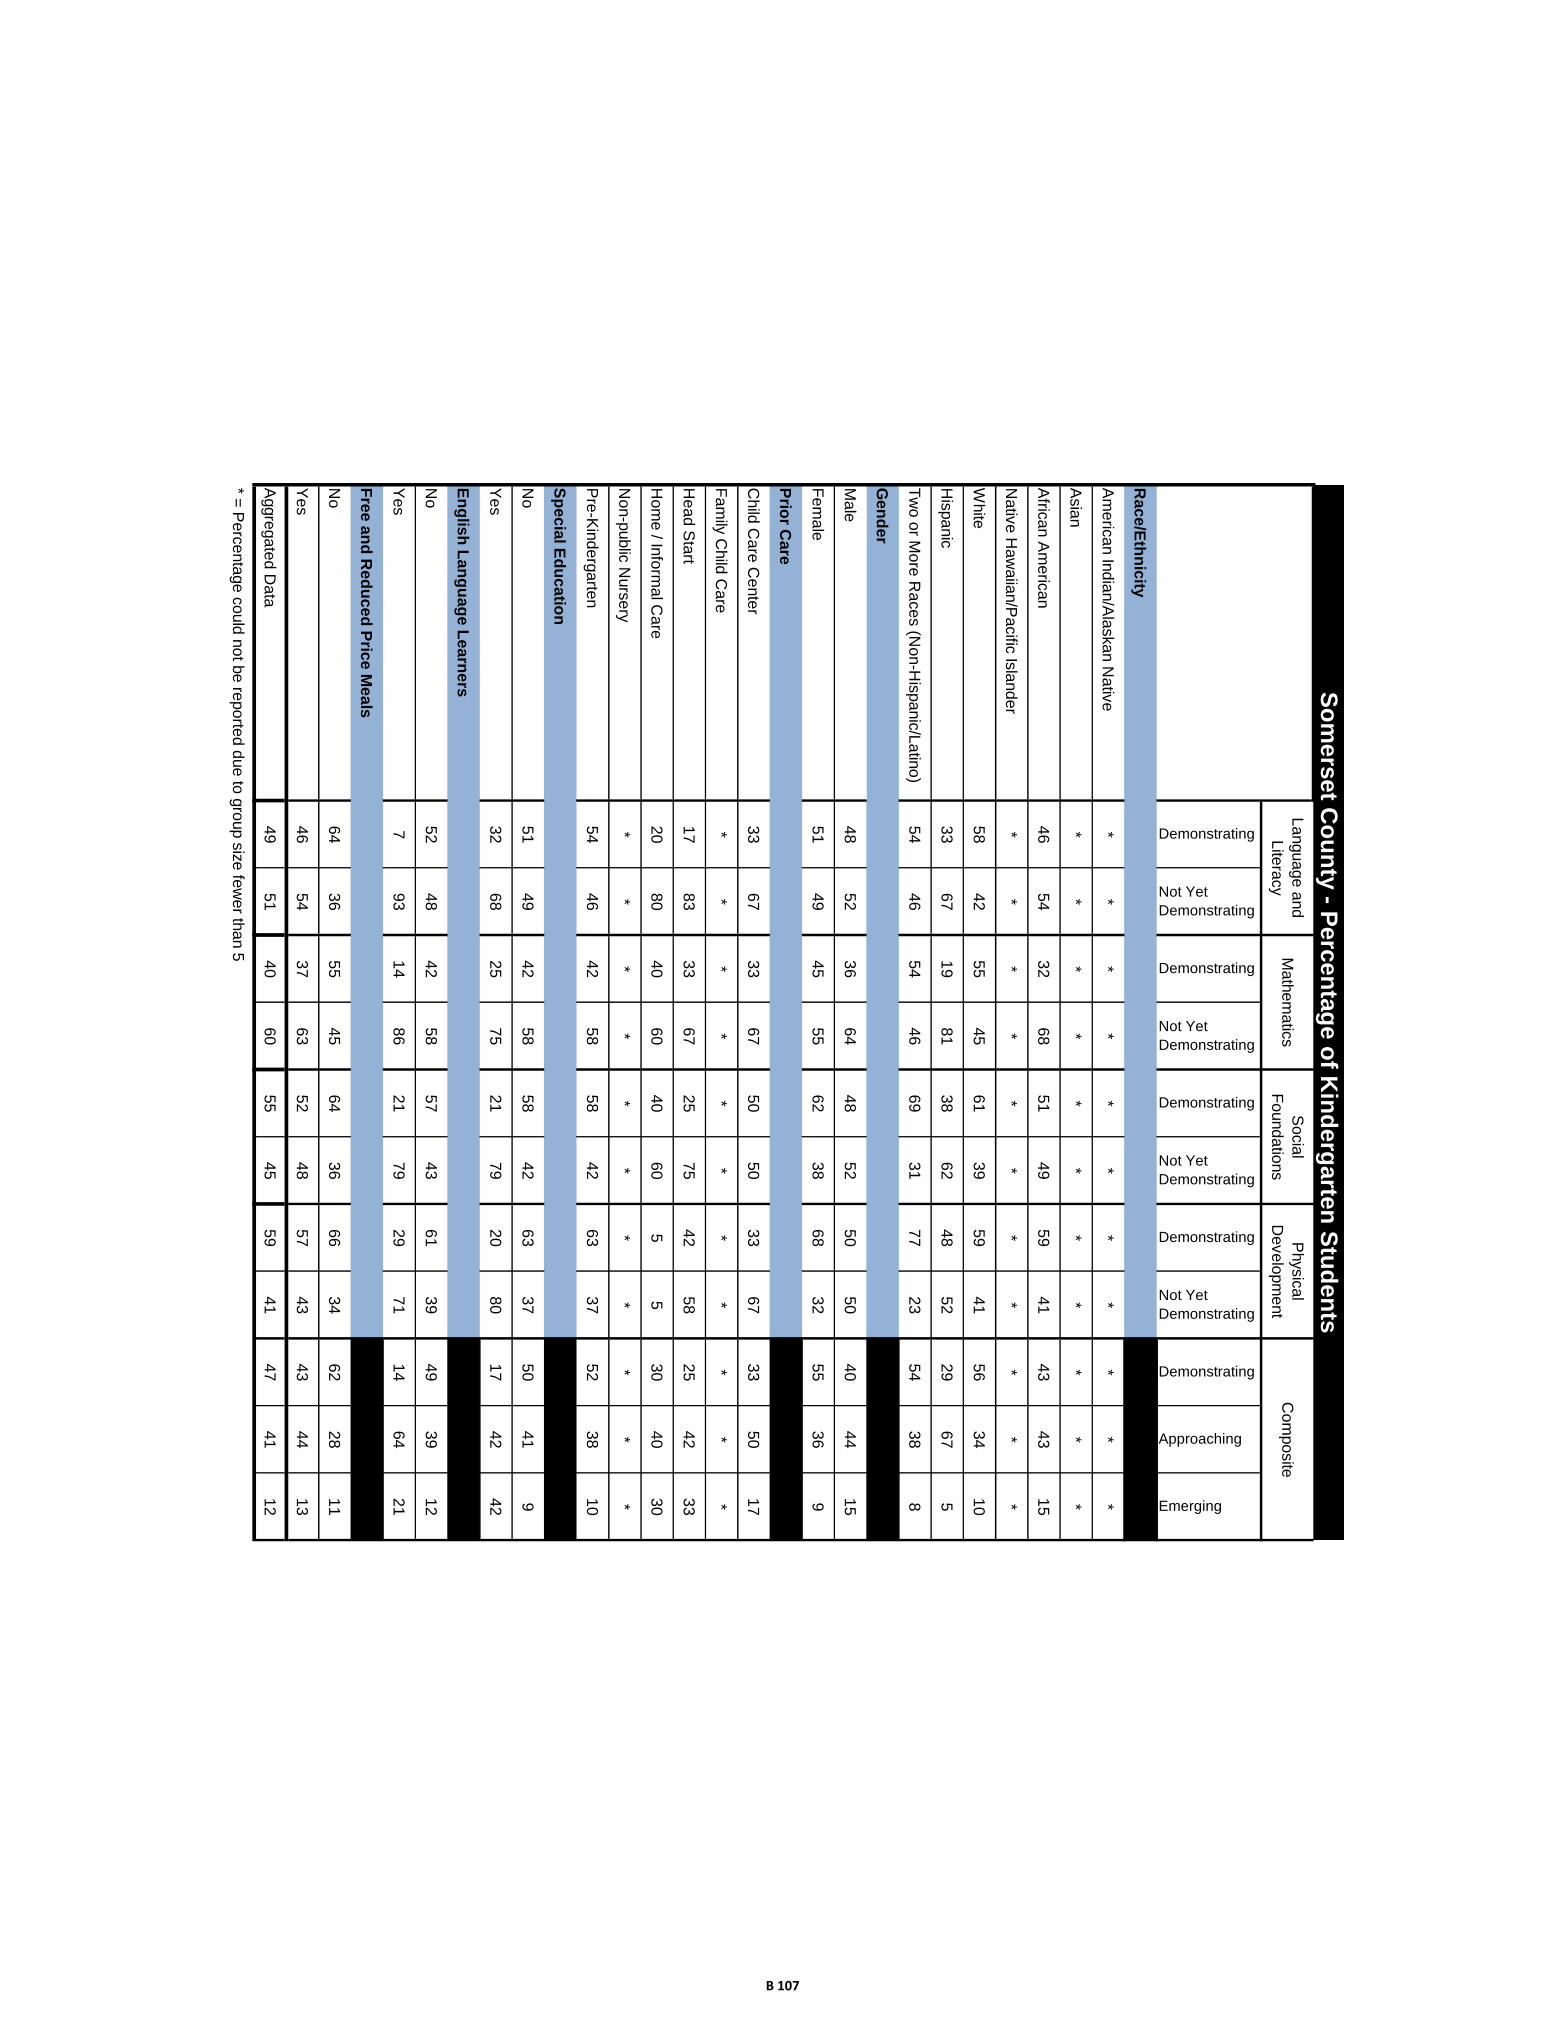
Demonstrating
Not Yet
Demonstrating
Demonstrating
Not Yet
Demonstrating
Demonstrating
Not Yet
Demonstrating
Demonstrating
Not Yet
Demonstrating
Demonstrating
Approaching
Emerging
Rac
e/E
thn
icity
Am
eric
an In
dia
n/A
laskan N
ativ
e*
**
**
**
**
**
Asia
n*
**
**
**
**
**
Afric
an A
meric
an
46
54
32
68
51
49
59
41
43
43
15
Nativ
e H
aw
aiia
n/P
acific
Isla
nde
r*
**
**
**
**
**
White
58
42
55
45
61
39
59
41
56
34
10
His
panic
33
67
19
81
38
62
48
52
29
67
5
Tw
o o
r More
Race
s (N
on-H
ispanic
/La
tino)
54
46
54
46
69
31
77
23
54
38
8
Gen
der
Male
48
52
36
64
48
52
50
50
40
44
15
Fem
ale
51
49
45
55
62
38
68
32
55
36
9
Prio
r Care
Child
Care
Cente
r3
36
73
36
75
05
03
36
73
35
01
7
Fam
ily C
hild
Care
**
**
**
**
**
*
Hea
d S
tart
17
83
33
67
25
75
42
58
25
42
33
Hom
e / In
form
al C
are
20
80
40
60
40
60
55
30
40
30
Non-p
ublic
Nurs
ery
**
**
**
**
**
*
Pre
-Kin
de
rgarte
n5
44
64
25
85
84
26
33
75
23
81
0
Sp
ec
ial E
du
ca
tion
No
51
49
42
58
58
42
63
37
50
41
9
Yes
32
68
25
75
21
79
20
80
17
42
42
En
glis
h L
an
gu
ag
e L
ea
rne
rs
No
52
48
42
58
57
43
61
39
49
39
12
Yes
79
31
48
62
17
92
97
11
46
42
1
Fre
e a
nd
Red
uce
d P
rice
Mea
ls
No
64
36
55
45
64
36
66
34
62
28
11
Yes
46
54
37
63
52
48
57
43
43
44
13
Aggre
gate
d D
ata
49
51
40
60
55
45
59
41
47
41
12
* = P
erc
enta
ge c
ould
not b
e re
porte
d d
ue to
gro
up s
ize fe
wer th
an 5
Socia
l
Founda
tions
Physic
al
Develo
pm
ent
Com
posite
So
mers
et C
ou
nty
- Perc
en
tag
e o
f Kin
derg
arte
n S
tud
en
ts
La
nguage a
nd
Lite
racy
Math
em
atic
s
B 107
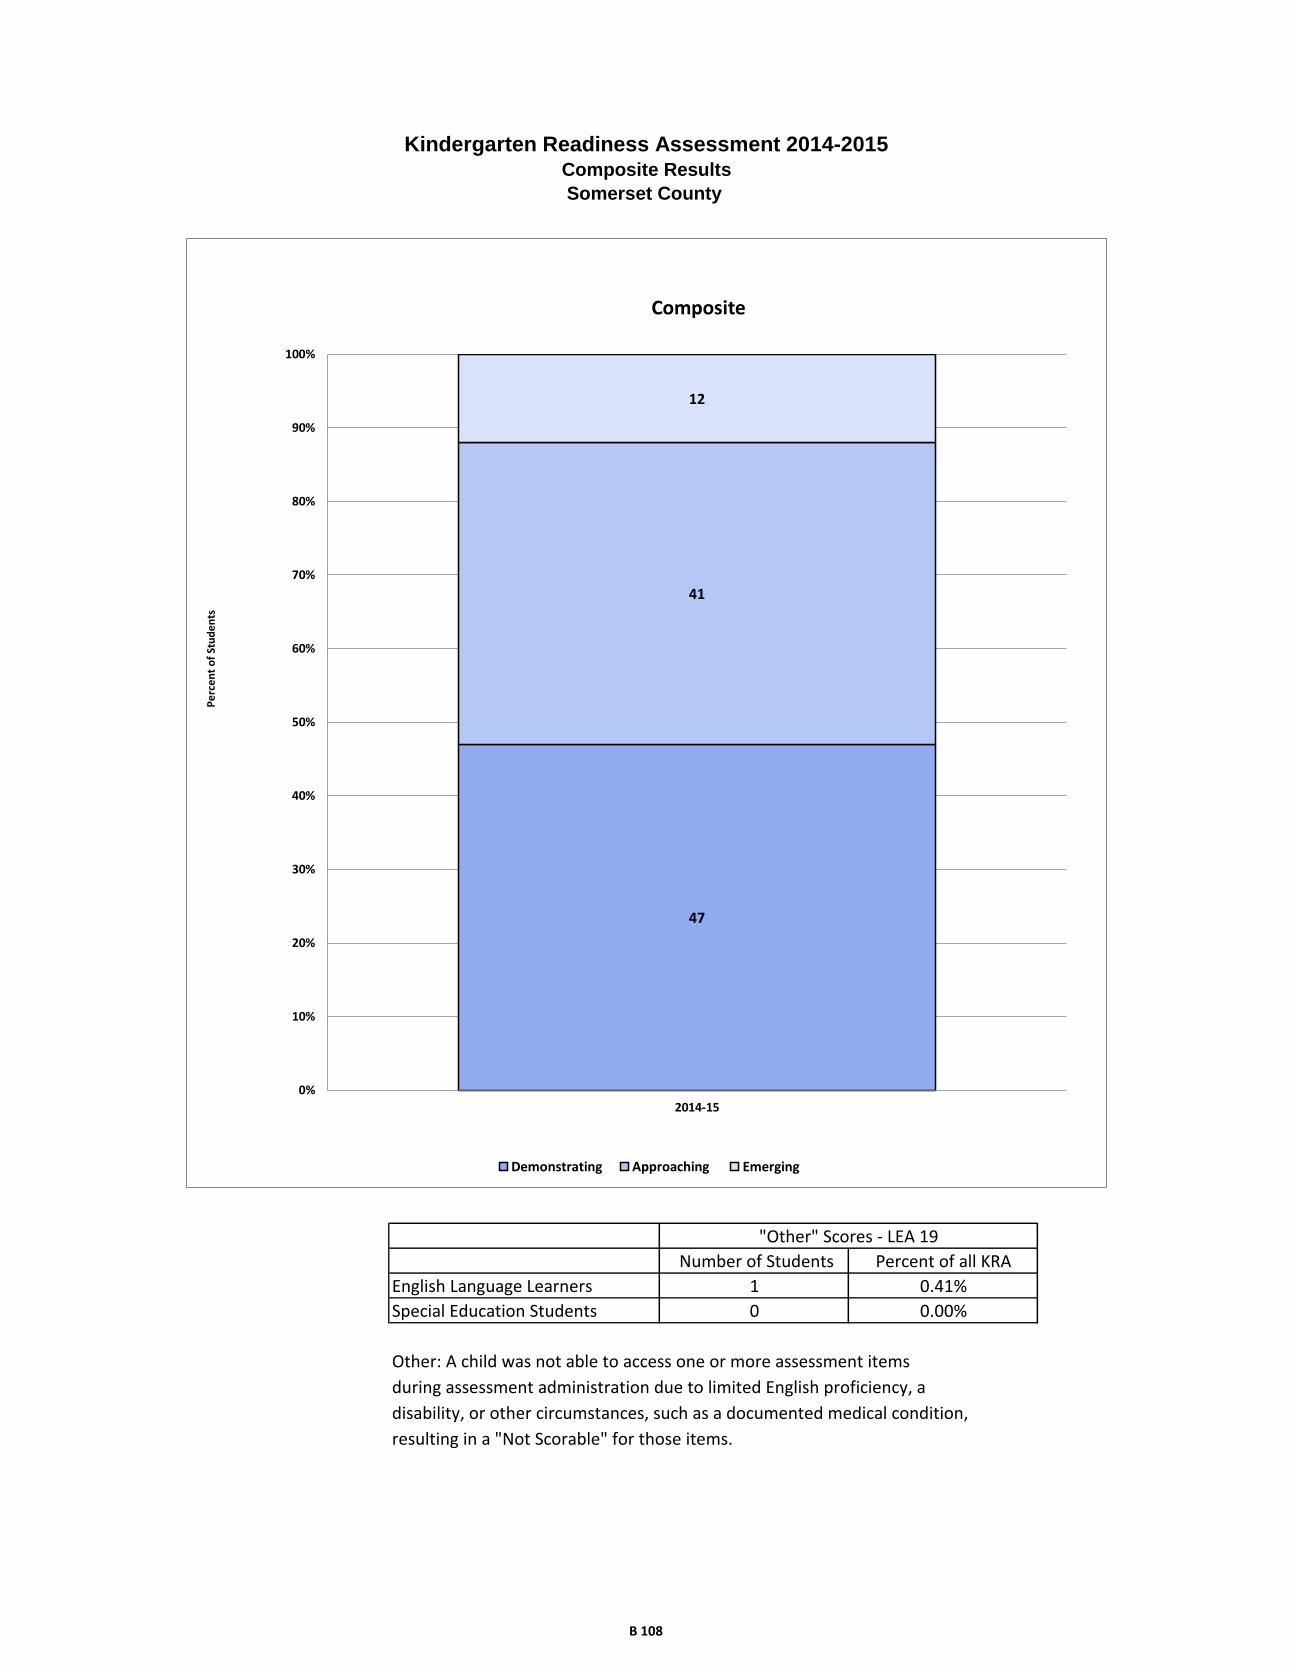
Other: A child was not able to access one or more assessment items
during assessment administration due to limited English proficiency, a
disability, or other circumstances, such as a documented medical condition,
resulting in a "Not Scorable" for those items.
Kindergarten Readiness Assessment 2014-2015Composite Results
Somerset County
"Other" Scores - LEA 19
Number of Students Percent of all KRA
English Language Learners 1 0.41%
Special Education Students 0 0.00%
47
41
12
0%
10%
20%
30%
40%
50%
60%
70%
80%
90%
100%
2014-15
Composite
Demonstrating Approaching Emerging
Pe
rce
nt
of
Stu
de
nts
B 108
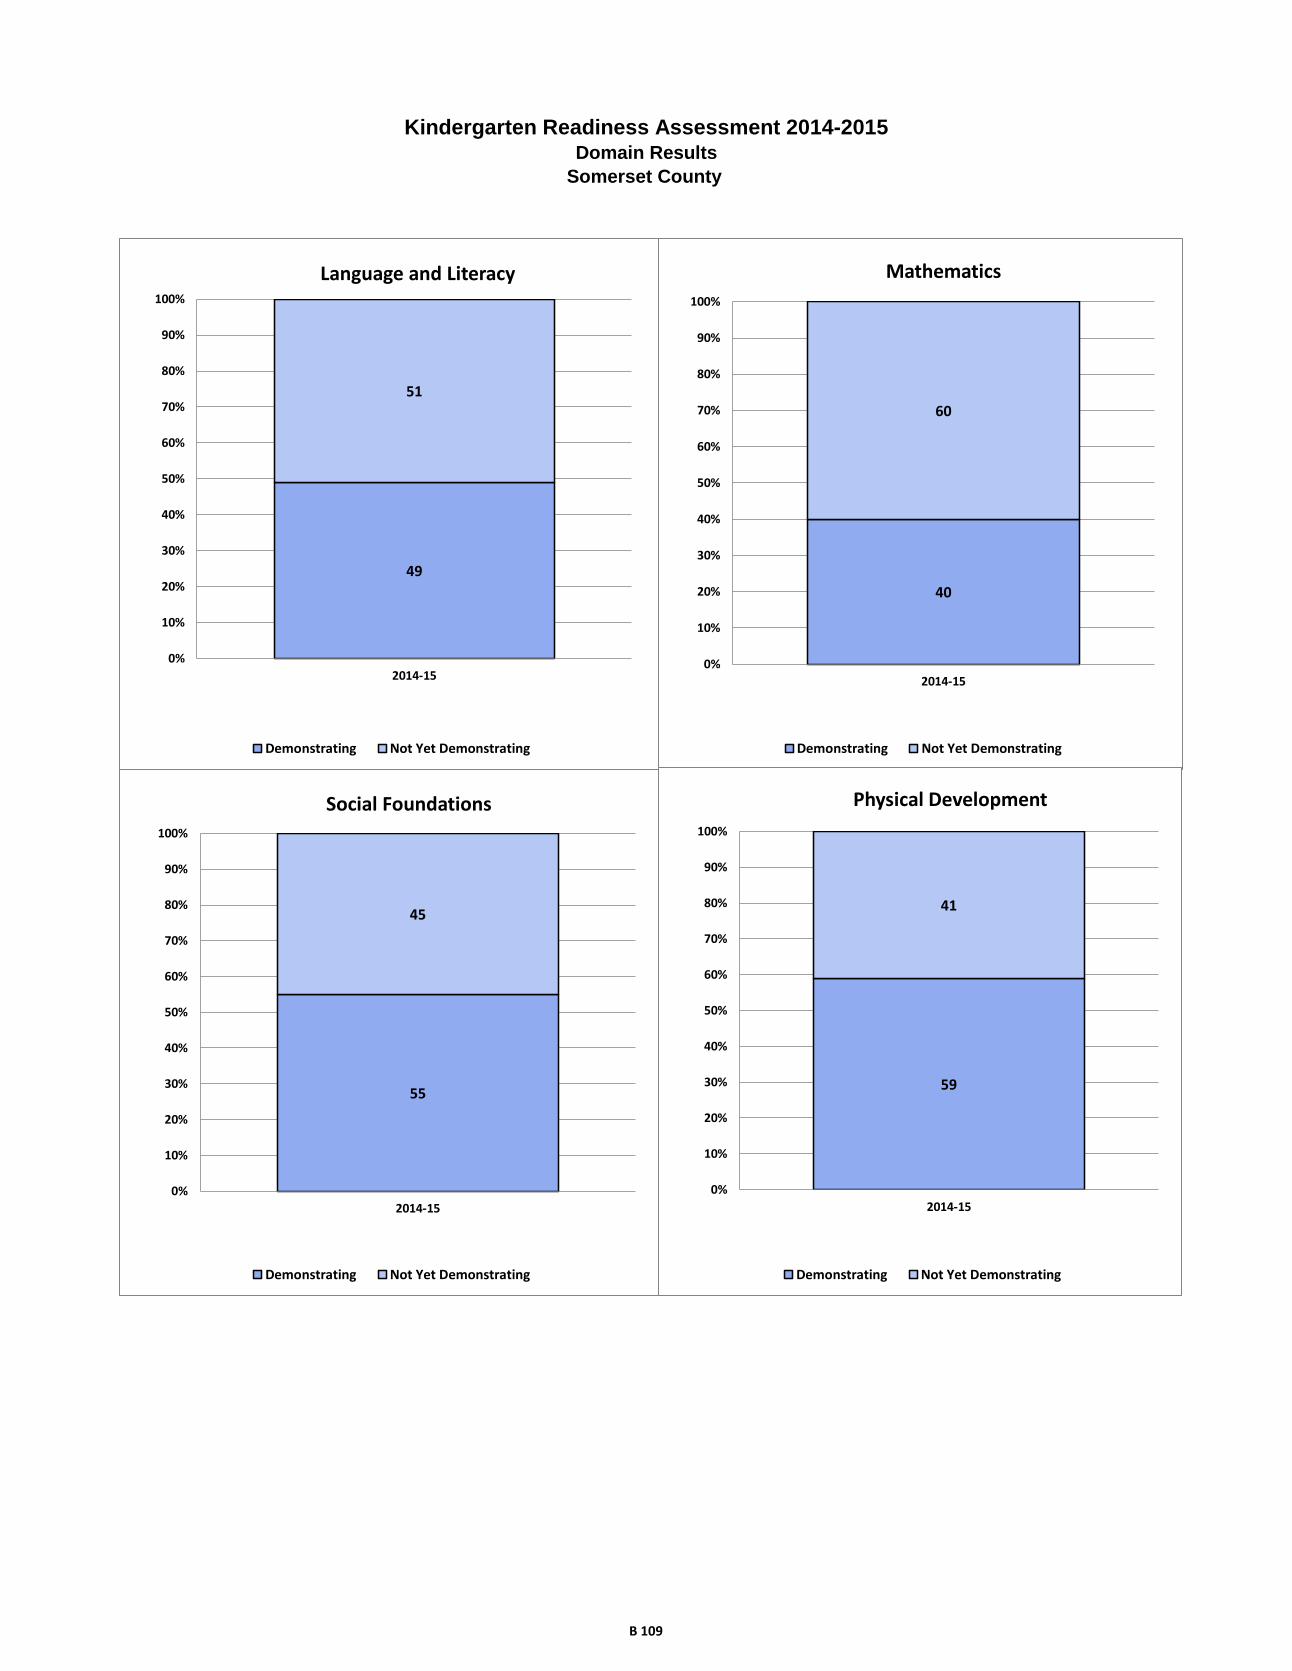
Kindergarten Readiness Assessment 2014-2015Domain Results
Somerset County
49
51
0%
10%
20%
30%
40%
50%
60%
70%
80%
90%
100%
2014-15
Language and Literacy
Demonstrating Not Yet Demonstrating
40
60
0%
10%
20%
30%
40%
50%
60%
70%
80%
90%
100%
2014-15
Mathematics
Demonstrating Not Yet Demonstrating
55
45
0%
10%
20%
30%
40%
50%
60%
70%
80%
90%
100%
2014-15
Social Foundations
Demonstrating Not Yet Demonstrating
59
41
0%
10%
20%
30%
40%
50%
60%
70%
80%
90%
100%
2014-15
Physical Development
Demonstrating Not Yet Demonstrating
B 109

Frequency Percent
Males 158 48.77
Females 166 51.23
Frequency Percent
American Indian/Alaska Native 0 0.00
Asian 10 3.09
Black/African American 54 16.67
Native Hawaiian/Other Pacific Islander 0 0.00
White 197 60.80
Hispanic/Latino 42 12.96
Two or More Races (Non-Hispanic/Latino) 22 6.79
Frequency Percent
No 170 52.47
Yes 154 47.53
Frequency Percent
No 304 93.83
Yes 20 6.17
Frequency Percent
No 290 89.51
Yes 34 10.49
Frequency Percent
Head Start 18 5.56
Prekindergarten 174 53.70
Child Care Center 72 22.22
Family Child Care 20 6.17
Home/Informal Care 20 6.17
Non-Public Nursery School 22 6.79
Repeated Kindergarten 0 0.00
Special Education
English Language Learners
Predominant Prior Care
Final Record Count for KRA Data File 324
Kindergarten Readiness Assessment
Talbot County Data File Summary 2014-2015
Gender
Ethnicity/Race
Free & Reduced Priced Meals
B 110

Demonstrating
Not Yet
Demonstrating
Demonstrating
Not Yet
Demonstrating
Demonstrating
Not Yet
Demonstrating
Demonstrating
Not Yet
Demonstrating
Demonstrating
Approaching
Emerging
Rac
e/E
thn
icity
Am
eric
an In
dia
n/A
laskan N
ativ
e*
**
**
**
**
**
Asia
n4
63
73
75
54
24
Afric
an A
meric
an
26
27
10
43
27
26
26
27
25
21
7
Nativ
e H
aw
aiia
n/P
acific
Isla
nde
r*
**
**
**
**
**
White
12
27
28
31
12
12
47
11
04
91
11
86
11
4
His
panic
72
90
41
10
26
19
17
71
81
0
Tw
o o
r More
Race
s (N
on-H
ispanic
/La
tino)
13
91
01
21
66
14
81
38
1
Gen
der
Male
90
64
64
93
76
78
64
90
77
55
22
Fem
ale
82
79
42
12
21
04
58
10
45
89
05
51
4
Prio
r Care
Child
Care
Cente
r4
32
93
04
23
83
43
73
54
22
46
Fam
ily C
hild
Care
11
97
12
12
81
01
09
91
Hea
d S
tart
69
31
55
10
87
41
01
Hom
e / In
form
al C
are
71
13
15
13
51
17
87
2
Non-p
ublic
Nurs
ery
14
81
21
01
39
12
10
22
91
8
Pre
-Kin
de
rgarte
n9
27
75
01
23
10
07
09
17
99
15
62
2
Sp
ec
ial E
du
ca
tion
No
16
41
36
10
12
01
17
01
31
15
91
42
16
11
03
34
Yes
77
41
49
58
65
72
En
glis
h L
an
gu
ag
e L
ea
rne
rs
No
16
71
19
10
51
82
17
11
16
15
31
34
16
39
82
4
Yes
42
40
33
82
01
41
43
12
12
Fre
e a
nd
Red
uce
d P
rice
Mea
ls
No
11
25
77
79
11
16
53
96
73
11
24
21
4
Yes
59
86
28
12
46
38
37
17
55
46
82
2
Aggre
gate
d D
ata
17
21
43
10
62
15
18
01
36
16
81
48
16
71
10
36
* = G
roup s
ize fe
wer th
an 5
Talb
ot C
ou
nty
- Nu
mb
er o
f Kin
derg
arte
n S
tud
en
ts
Socia
l
Founda
tions
Physic
al
Develo
pm
ent
La
nguage a
nd
Lite
racy
Math
em
atic
sC
om
posite
B 111
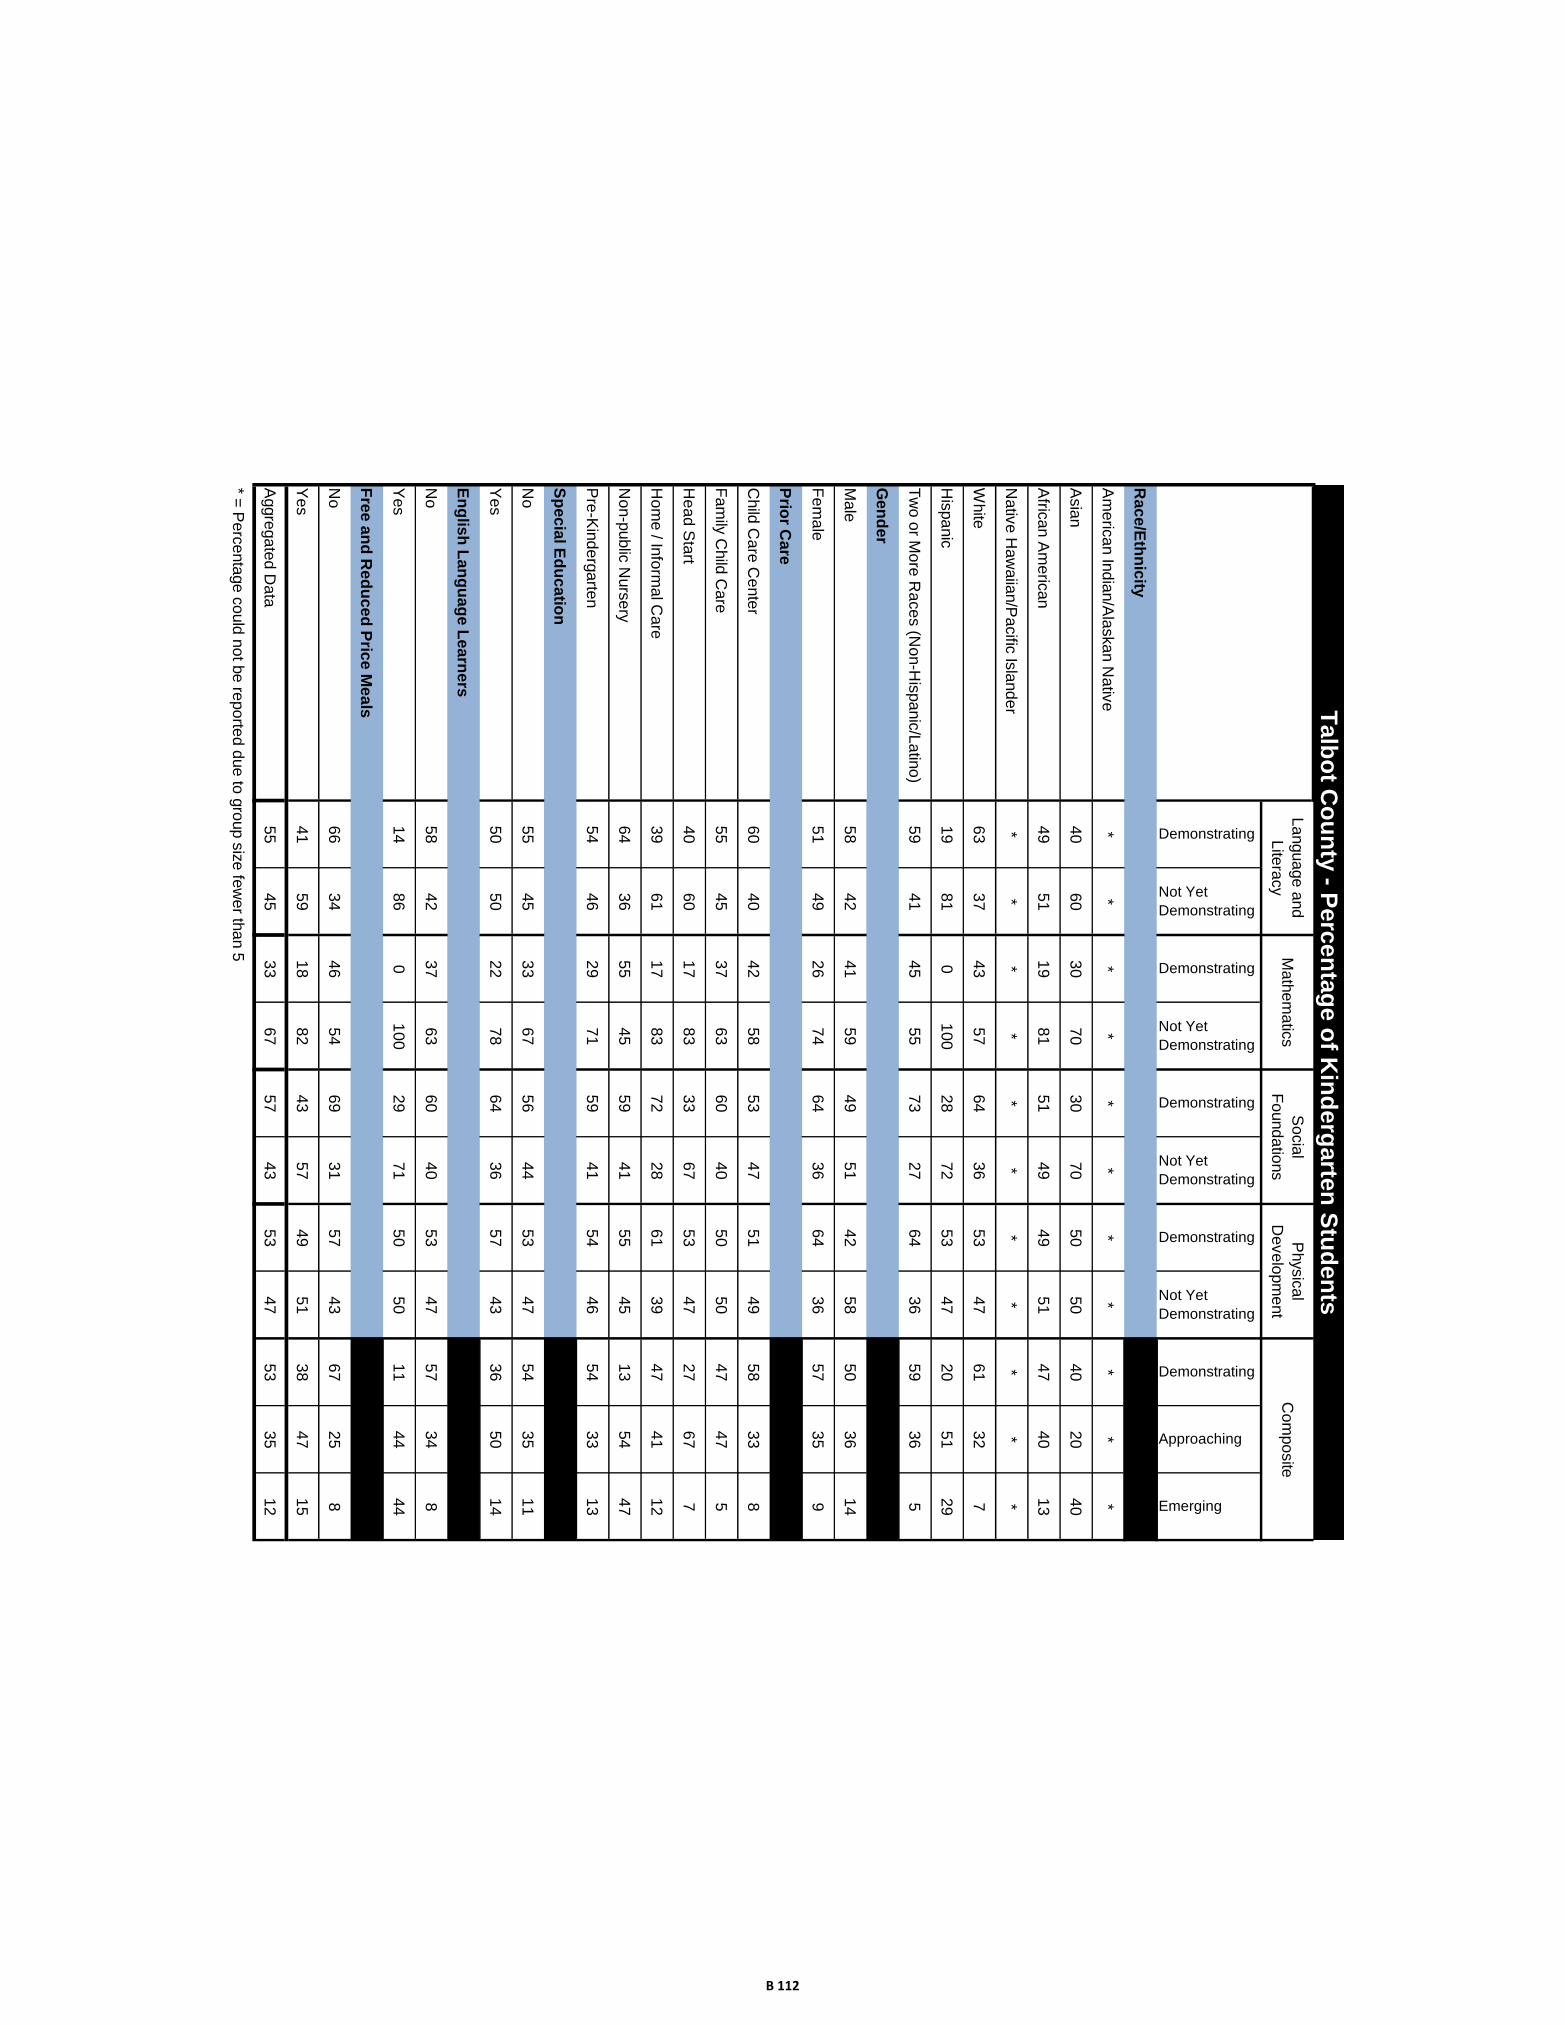
Demonstrating
Not Yet
Demonstrating
Demonstrating
Not Yet
Demonstrating
Demonstrating
Not Yet
Demonstrating
Demonstrating
Not Yet
Demonstrating
Demonstrating
Approaching
Emerging
Rac
e/E
thn
icity
Am
eric
an In
dia
n/A
laskan N
ativ
e*
**
**
**
**
**
Asia
n4
06
03
07
03
07
05
05
04
02
04
0
Afric
an A
meric
an
49
51
19
81
51
49
49
51
47
40
13
Nativ
e H
aw
aiia
n/P
acific
Isla
nde
r*
**
**
**
**
**
White
63
37
43
57
64
36
53
47
61
32
7
His
panic
19
81
01
00
28
72
53
47
20
51
29
Tw
o o
r More
Race
s (N
on-H
ispanic
/La
tino)
59
41
45
55
73
27
64
36
59
36
5
Gen
der
Male
58
42
41
59
49
51
42
58
50
36
14
Fem
ale
51
49
26
74
64
36
64
36
57
35
9
Prio
r Care
Child
Care
Cente
r6
04
04
25
85
34
75
14
95
83
38
Fam
ily C
hild
Care
55
45
37
63
60
40
50
50
47
47
5
Hea
d S
tart
40
60
17
83
33
67
53
47
27
67
7
Hom
e / In
form
al C
are
39
61
17
83
72
28
61
39
47
41
12
Non-p
ublic
Nurs
ery
64
36
55
45
59
41
55
45
13
54
47
Pre
-Kin
de
rgarte
n5
44
62
97
15
94
15
44
65
43
31
3
Sp
ec
ial E
du
ca
tion
No
55
45
33
67
56
44
53
47
54
35
11
Yes
50
50
22
78
64
36
57
43
36
50
14
En
glis
h L
an
gu
ag
e L
ea
rne
rs
No
58
42
37
63
60
40
53
47
57
34
8
Yes
14
86
01
00
29
71
50
50
11
44
44
Fre
e a
nd
Red
uce
d P
rice
Mea
ls
No
66
34
46
54
69
31
57
43
67
25
8
Yes
41
59
18
82
43
57
49
51
38
47
15
Aggre
gate
d D
ata
55
45
33
67
57
43
53
47
53
35
12
* = P
erc
enta
ge c
ould
not b
e re
porte
d d
ue to
gro
up s
ize fe
wer th
an 5
Socia
l
Founda
tions
Physic
al
Develo
pm
ent
Com
posite
Talb
ot C
ou
nty
- Perc
en
tag
e o
f Kin
derg
arte
n S
tud
en
ts
La
nguage a
nd
Lite
racy
Math
em
atic
s
B 112
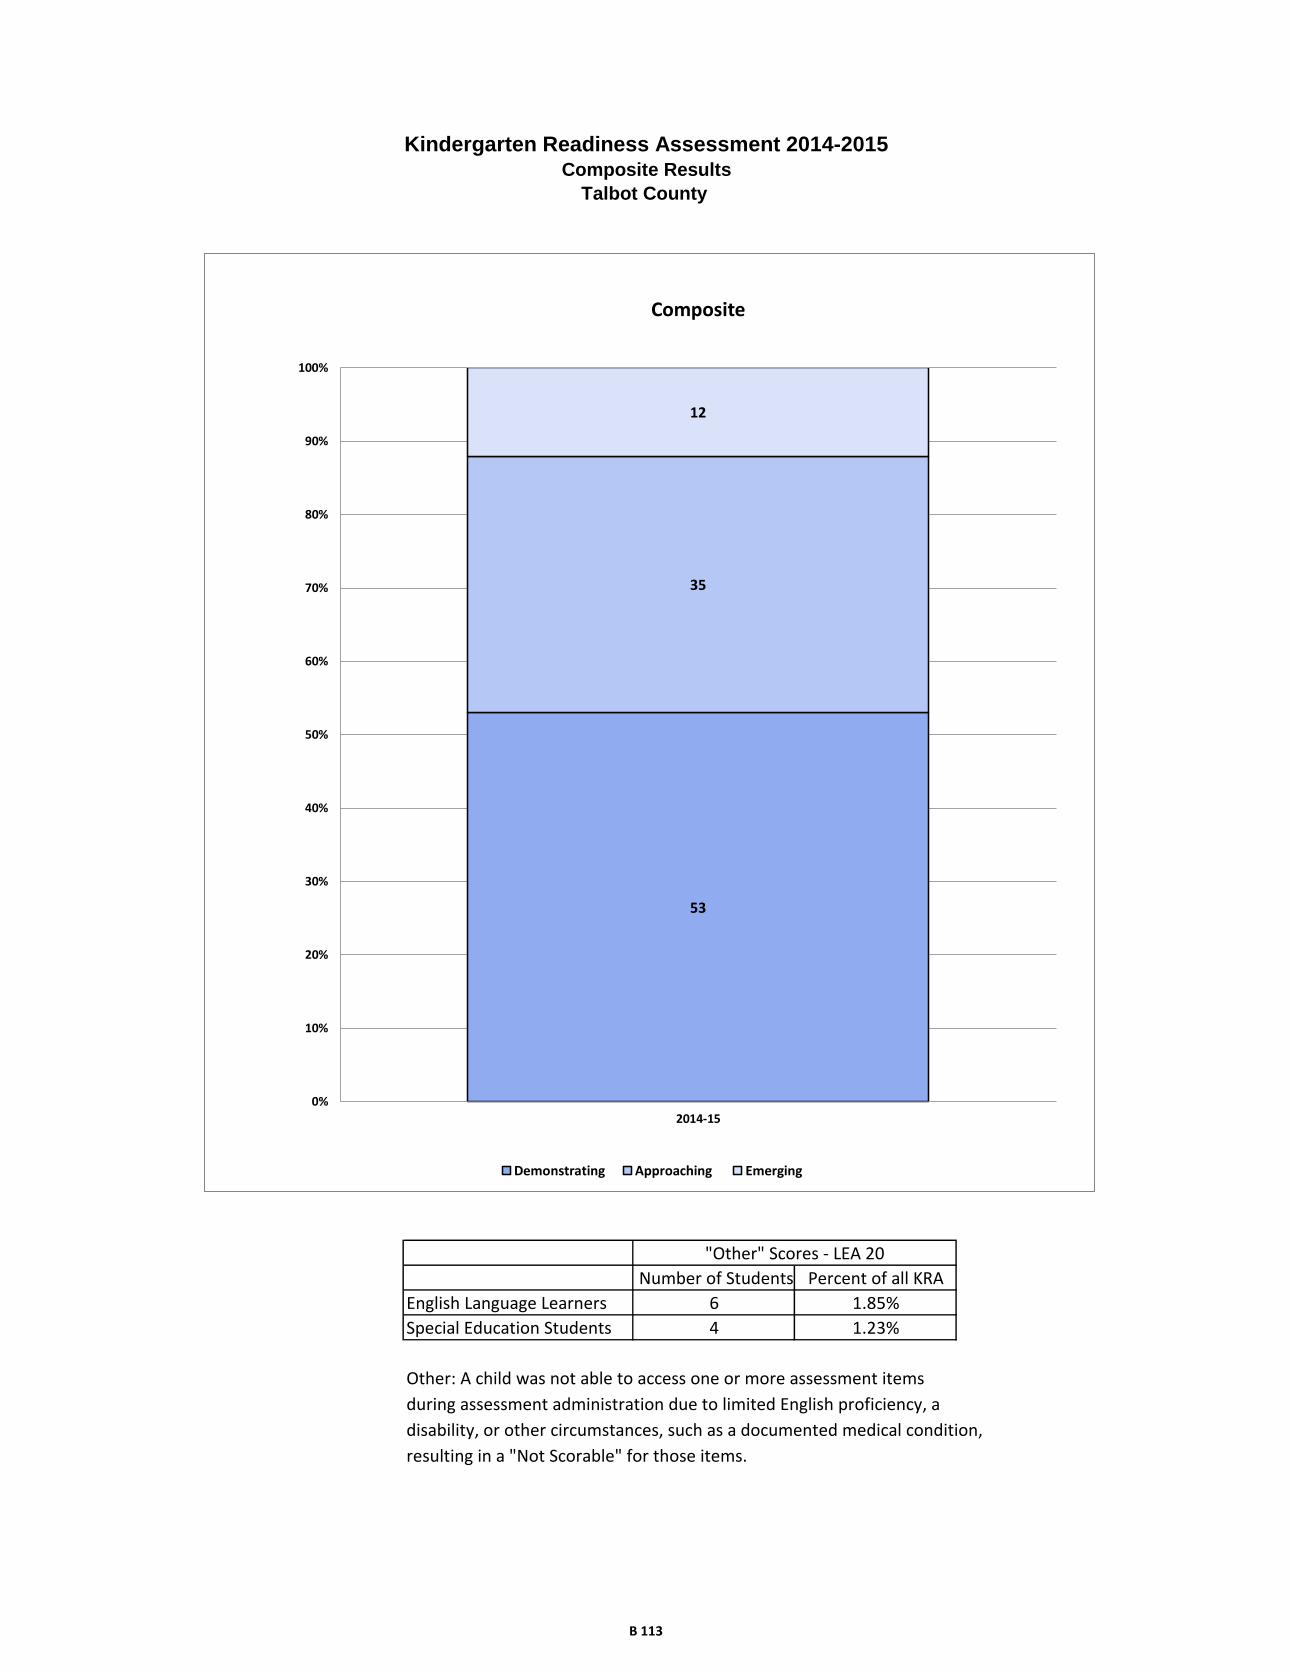
Other: A child was not able to access one or more assessment items
during assessment administration due to limited English proficiency, a
disability, or other circumstances, such as a documented medical condition,
resulting in a "Not Scorable" for those items.
"Other" Scores - LEA 20
Number of Students Percent of all KRA
Kindergarten Readiness Assessment 2014-2015Composite Results
Talbot County
English Language Learners 6 1.85%
Special Education Students 4 1.23%
53
35
12
0%
10%
20%
30%
40%
50%
60%
70%
80%
90%
100%
2014-15
Composite
Demonstrating Approaching Emerging
B 113
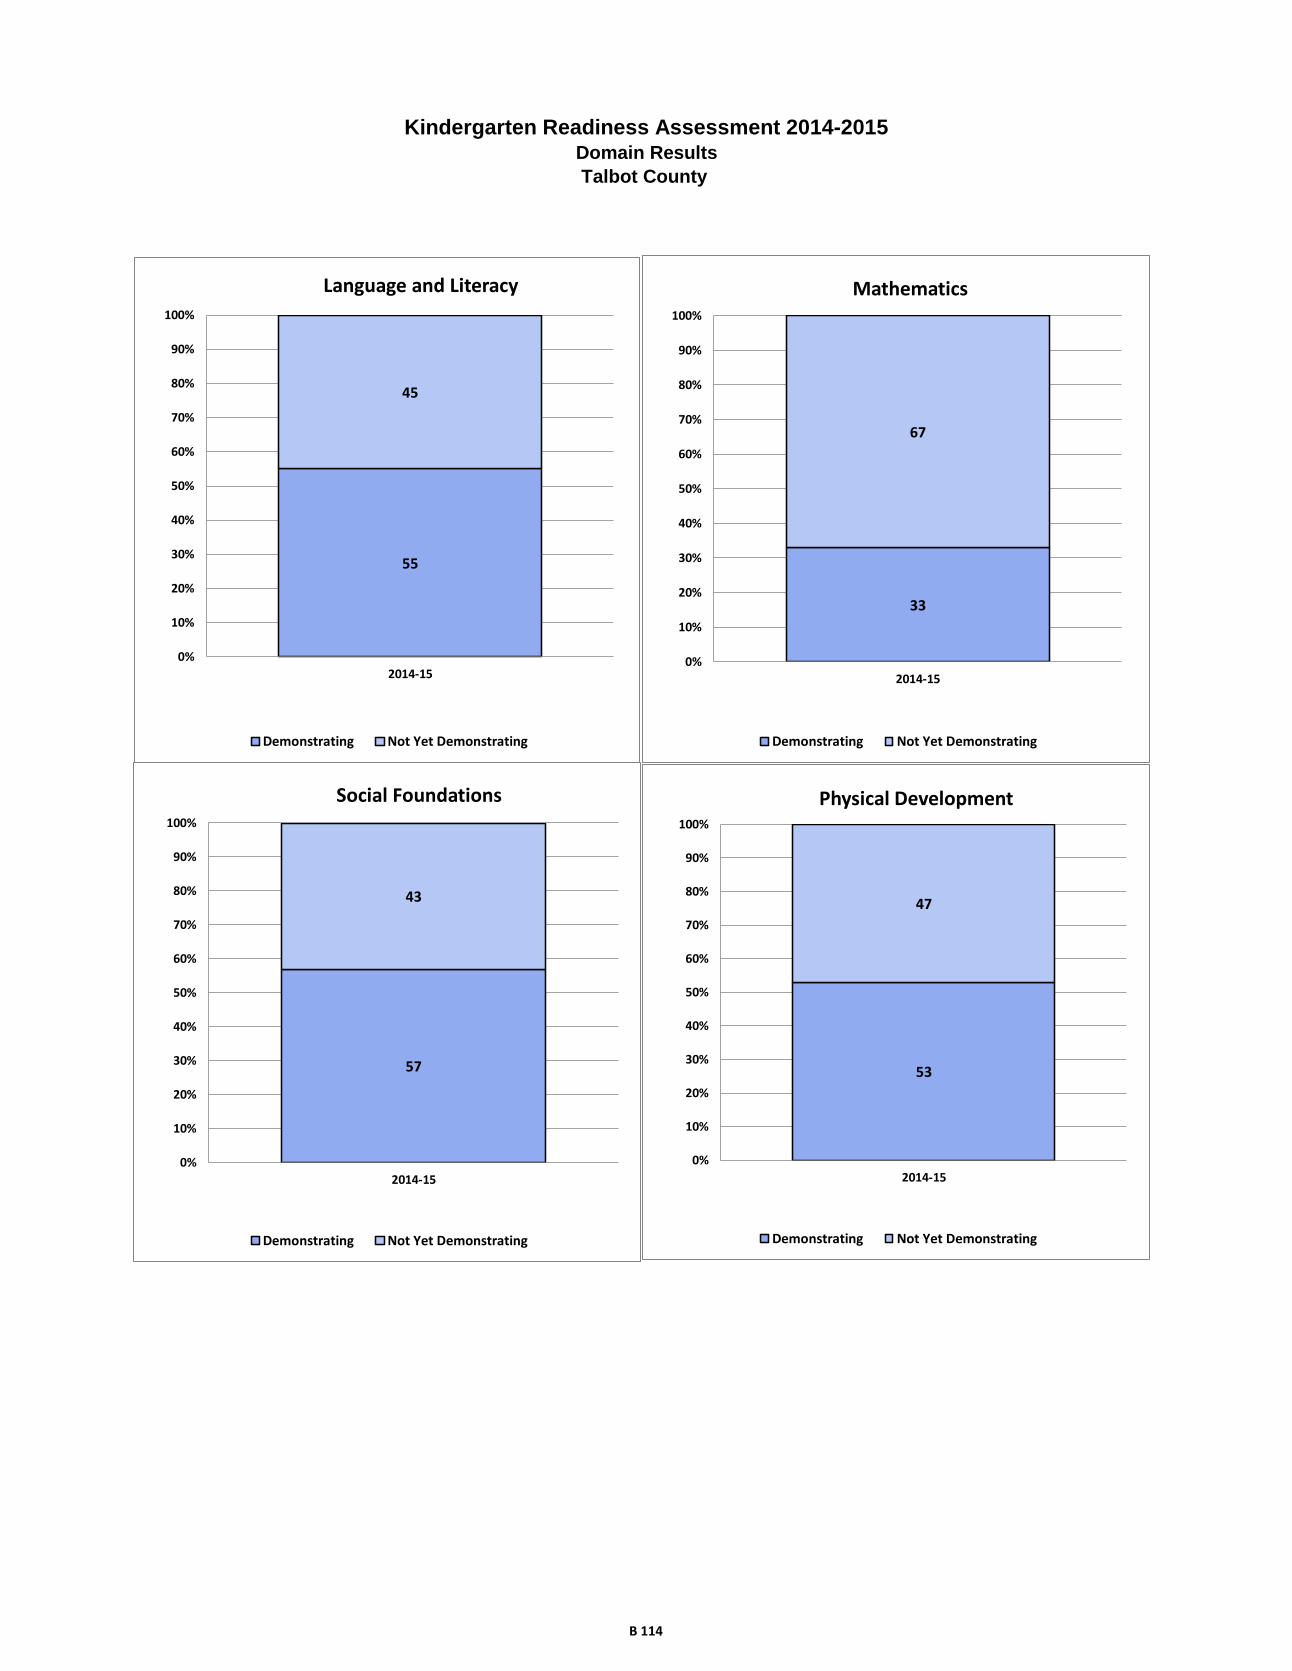
Kindergarten Readiness Assessment 2014-2015Domain Results
Talbot County
55
45
0%
10%
20%
30%
40%
50%
60%
70%
80%
90%
100%
2014-15
Language and Literacy
Demonstrating Not Yet Demonstrating
33
67
0%
10%
20%
30%
40%
50%
60%
70%
80%
90%
100%
2014-15
Mathematics
Demonstrating Not Yet Demonstrating
57
43
0%
10%
20%
30%
40%
50%
60%
70%
80%
90%
100%
2014-15
Social Foundations
Demonstrating Not Yet Demonstrating
53
47
0%
10%
20%
30%
40%
50%
60%
70%
80%
90%
100%
2014-15
Physical Development
Demonstrating Not Yet Demonstrating
B 114

Frequency Percent
Males 776 49.58
Females 789 50.42
Frequency Percent
American Indian/Alaska Native 4 0.26
Asian 31 1.98
Black/African American 191 12.20
Native Hawaiian/Other Pacific Islander 2 0.13
White 1064 67.99
Hispanic/Latino 118 7.54
Two or More Races (Non-Hispanic/Latino) 155 9.90
Frequency Percent
No 661 42.24
Yes 904 57.76
Frequency Percent
No 1481 94.63
Yes 84 5.37
Frequency Percent
No 1514 96.74
Yes 51 3.26
Frequency Percent
Head Start 151 9.65
Prekindergarten 592 37.83
Child Care Center 192 12.27
Family Child Care 142 9.07
Home/Informal Care 388 24.79
Non-Public Nursery School 93 5.94
Repeated Kindergarten 7 0.45
Special Education
English Language Learners
Predominant Prior Care
Final Record Count for KRA Data File 1565
Kindergarten Readiness Assessment
Washington County Data File Summary 2014-2015
Gender
Ethnicity/Race
Free & Reduced Priced Meals
B 115
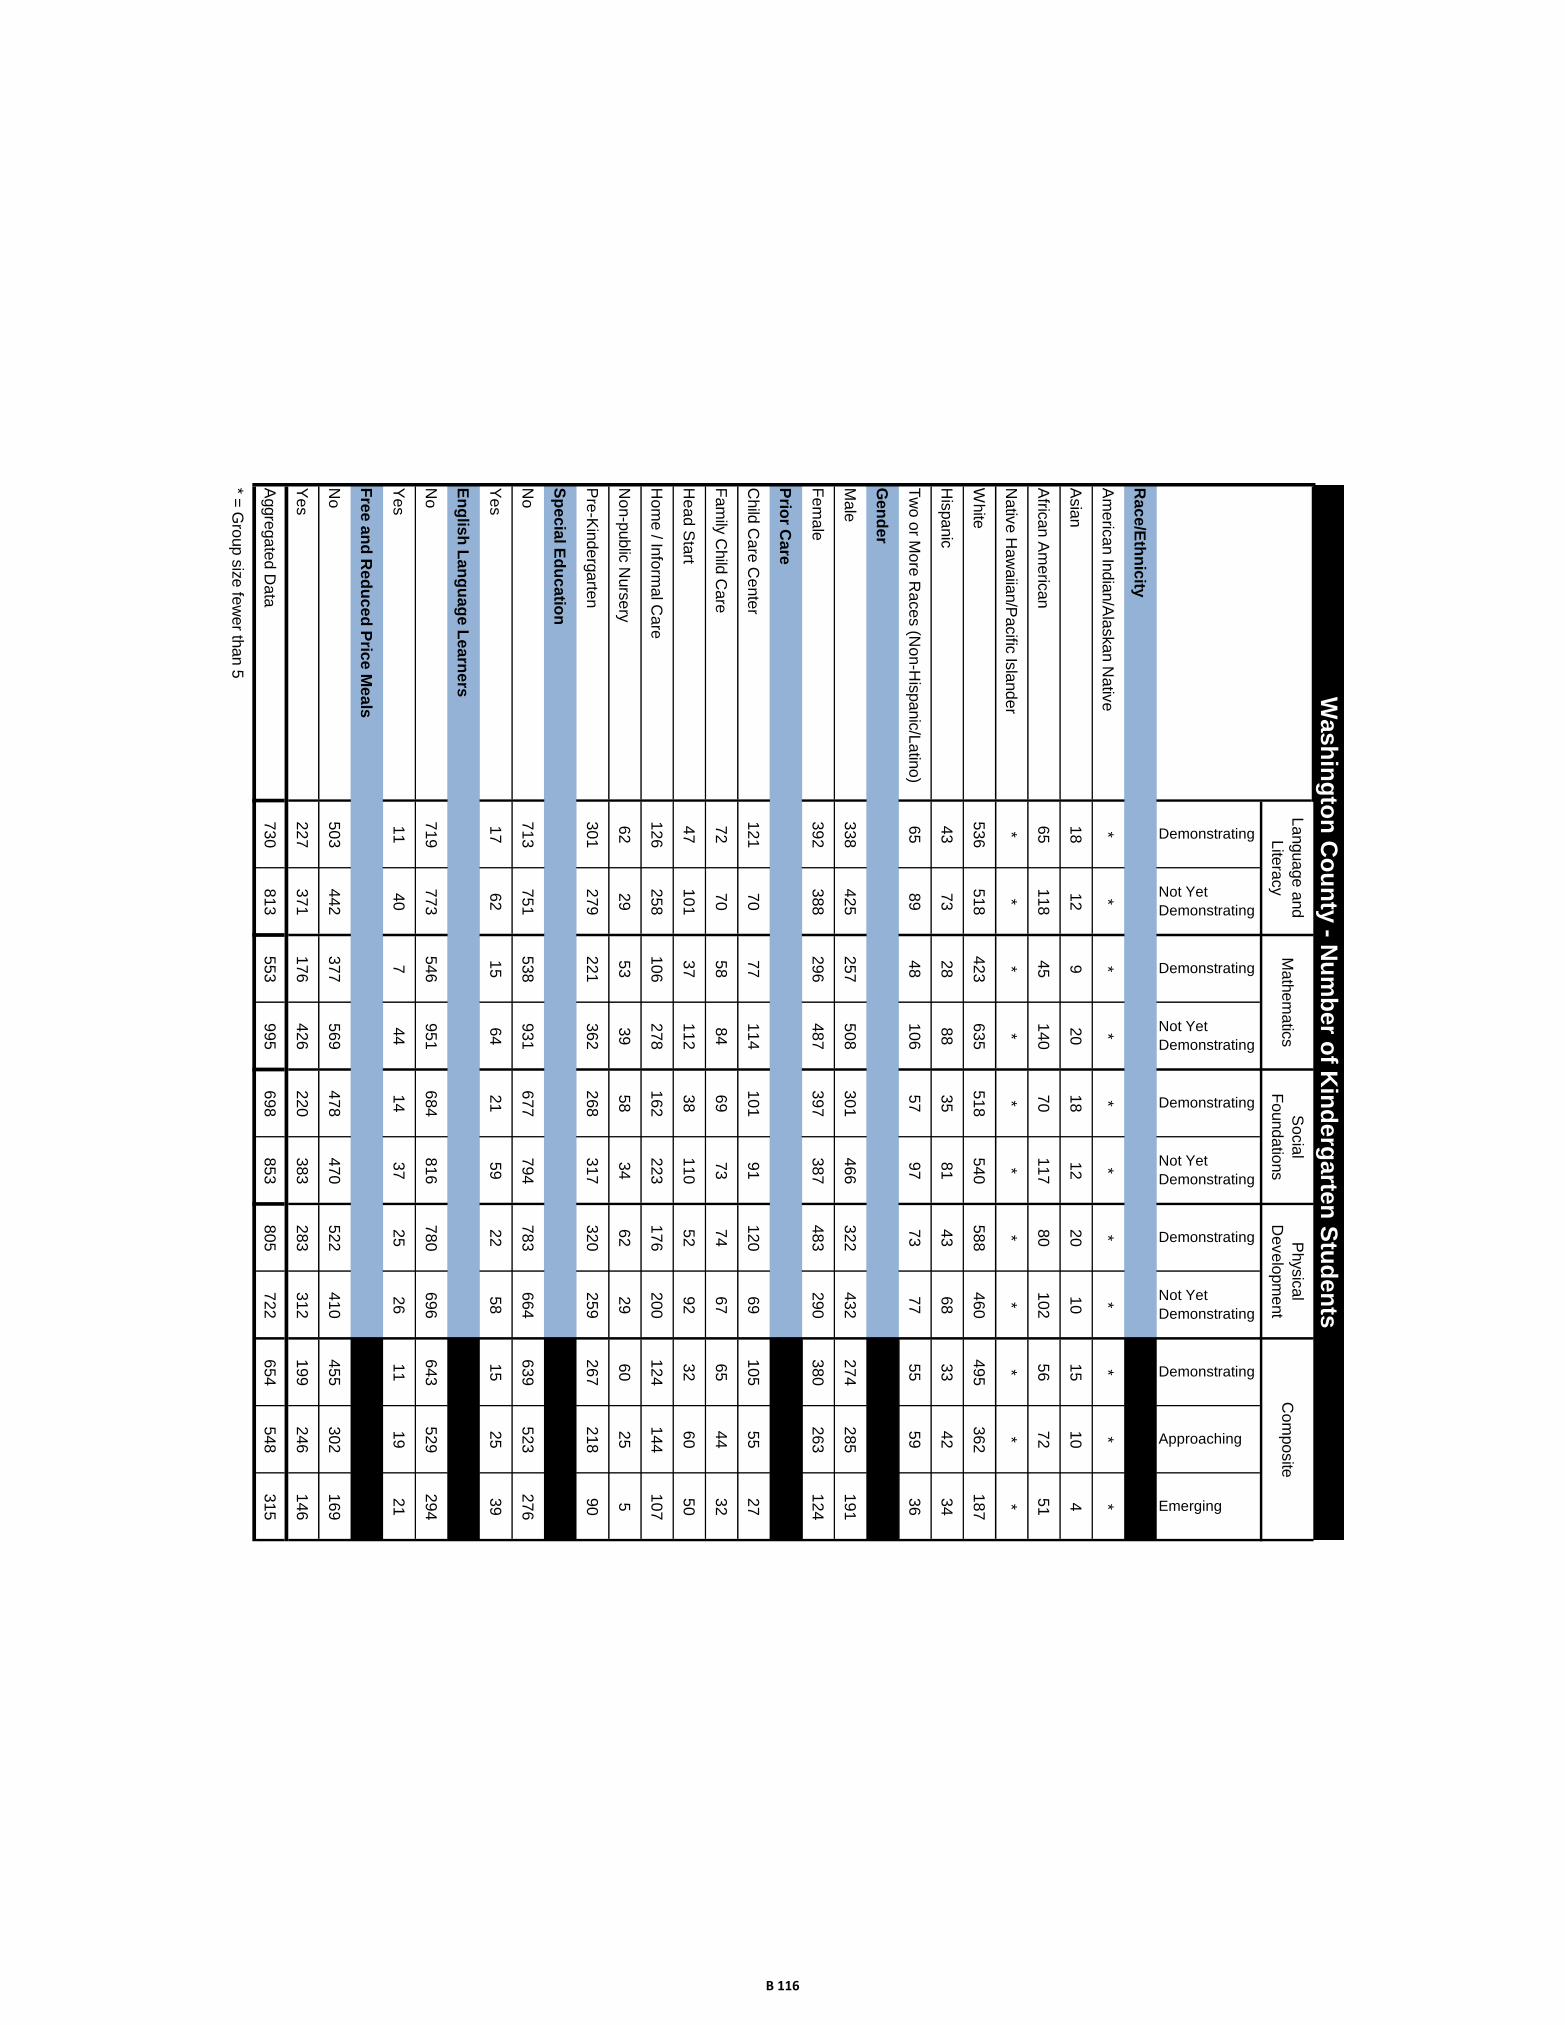
Demonstrating
Not Yet
Demonstrating
Demonstrating
Not Yet
Demonstrating
Demonstrating
Not Yet
Demonstrating
Demonstrating
Not Yet
Demonstrating
Demonstrating
Approaching
Emerging
Rac
e/E
thn
icity
Am
eric
an In
dia
n/A
laskan N
ativ
e*
**
**
**
**
**
Asia
n1
81
29
20
18
12
20
10
15
10
4
Afric
an A
meric
an
65
11
84
51
40
70
11
78
01
02
56
72
51
Nativ
e H
aw
aiia
n/P
acific
Isla
nde
r*
**
**
**
**
**
White
53
65
18
42
36
35
51
85
40
58
84
60
49
53
62
18
7
His
panic
43
73
28
88
35
81
43
68
33
42
34
Tw
o o
r More
Race
s (N
on-H
ispanic
/La
tino)
65
89
48
10
65
79
77
37
75
55
93
6
Gen
der
Male
33
84
25
25
75
08
30
14
66
32
24
32
27
42
85
19
1
Fem
ale
39
23
88
29
64
87
39
73
87
48
32
90
38
02
63
12
4
Prio
r Care
Child
Care
Cente
r1
21
70
77
11
41
01
91
12
06
91
05
55
27
Fam
ily C
hild
Care
72
70
58
84
69
73
74
67
65
44
32
Hea
d S
tart
47
10
13
71
12
38
11
05
29
23
26
05
0
Hom
e / In
form
al C
are
12
62
58
10
62
78
16
22
23
17
62
00
12
41
44
10
7
Non-p
ublic
Nurs
ery
62
29
53
39
58
34
62
29
60
25
5
Pre
-Kin
de
rgarte
n3
01
27
92
21
36
22
68
31
73
20
25
92
67
21
89
0
Sp
ec
ial E
du
ca
tion
No
71
37
51
53
89
31
67
77
94
78
36
64
63
95
23
27
6
Yes
17
62
15
64
21
59
22
58
15
25
39
En
glis
h L
an
gu
ag
e L
ea
rne
rs
No
71
97
73
54
69
51
68
48
16
78
06
96
64
35
29
29
4
Yes
11
40
74
41
43
72
52
61
11
92
1
Fre
e a
nd
Red
uce
d P
rice
Mea
ls
No
50
34
42
37
75
69
47
84
70
52
24
10
45
53
02
16
9
Yes
22
73
71
17
64
26
22
03
83
28
33
12
19
92
46
14
6
Aggre
gate
d D
ata
73
08
13
55
39
95
69
88
53
80
57
22
65
45
48
31
5
* = G
roup s
ize fe
wer th
an 5
Wash
ing
ton
Co
un
ty - N
um
ber o
f Kin
derg
arte
n S
tud
en
ts
Socia
l
Founda
tions
Physic
al
Develo
pm
ent
La
nguage a
nd
Lite
racy
Math
em
atic
sC
om
posite
B 116
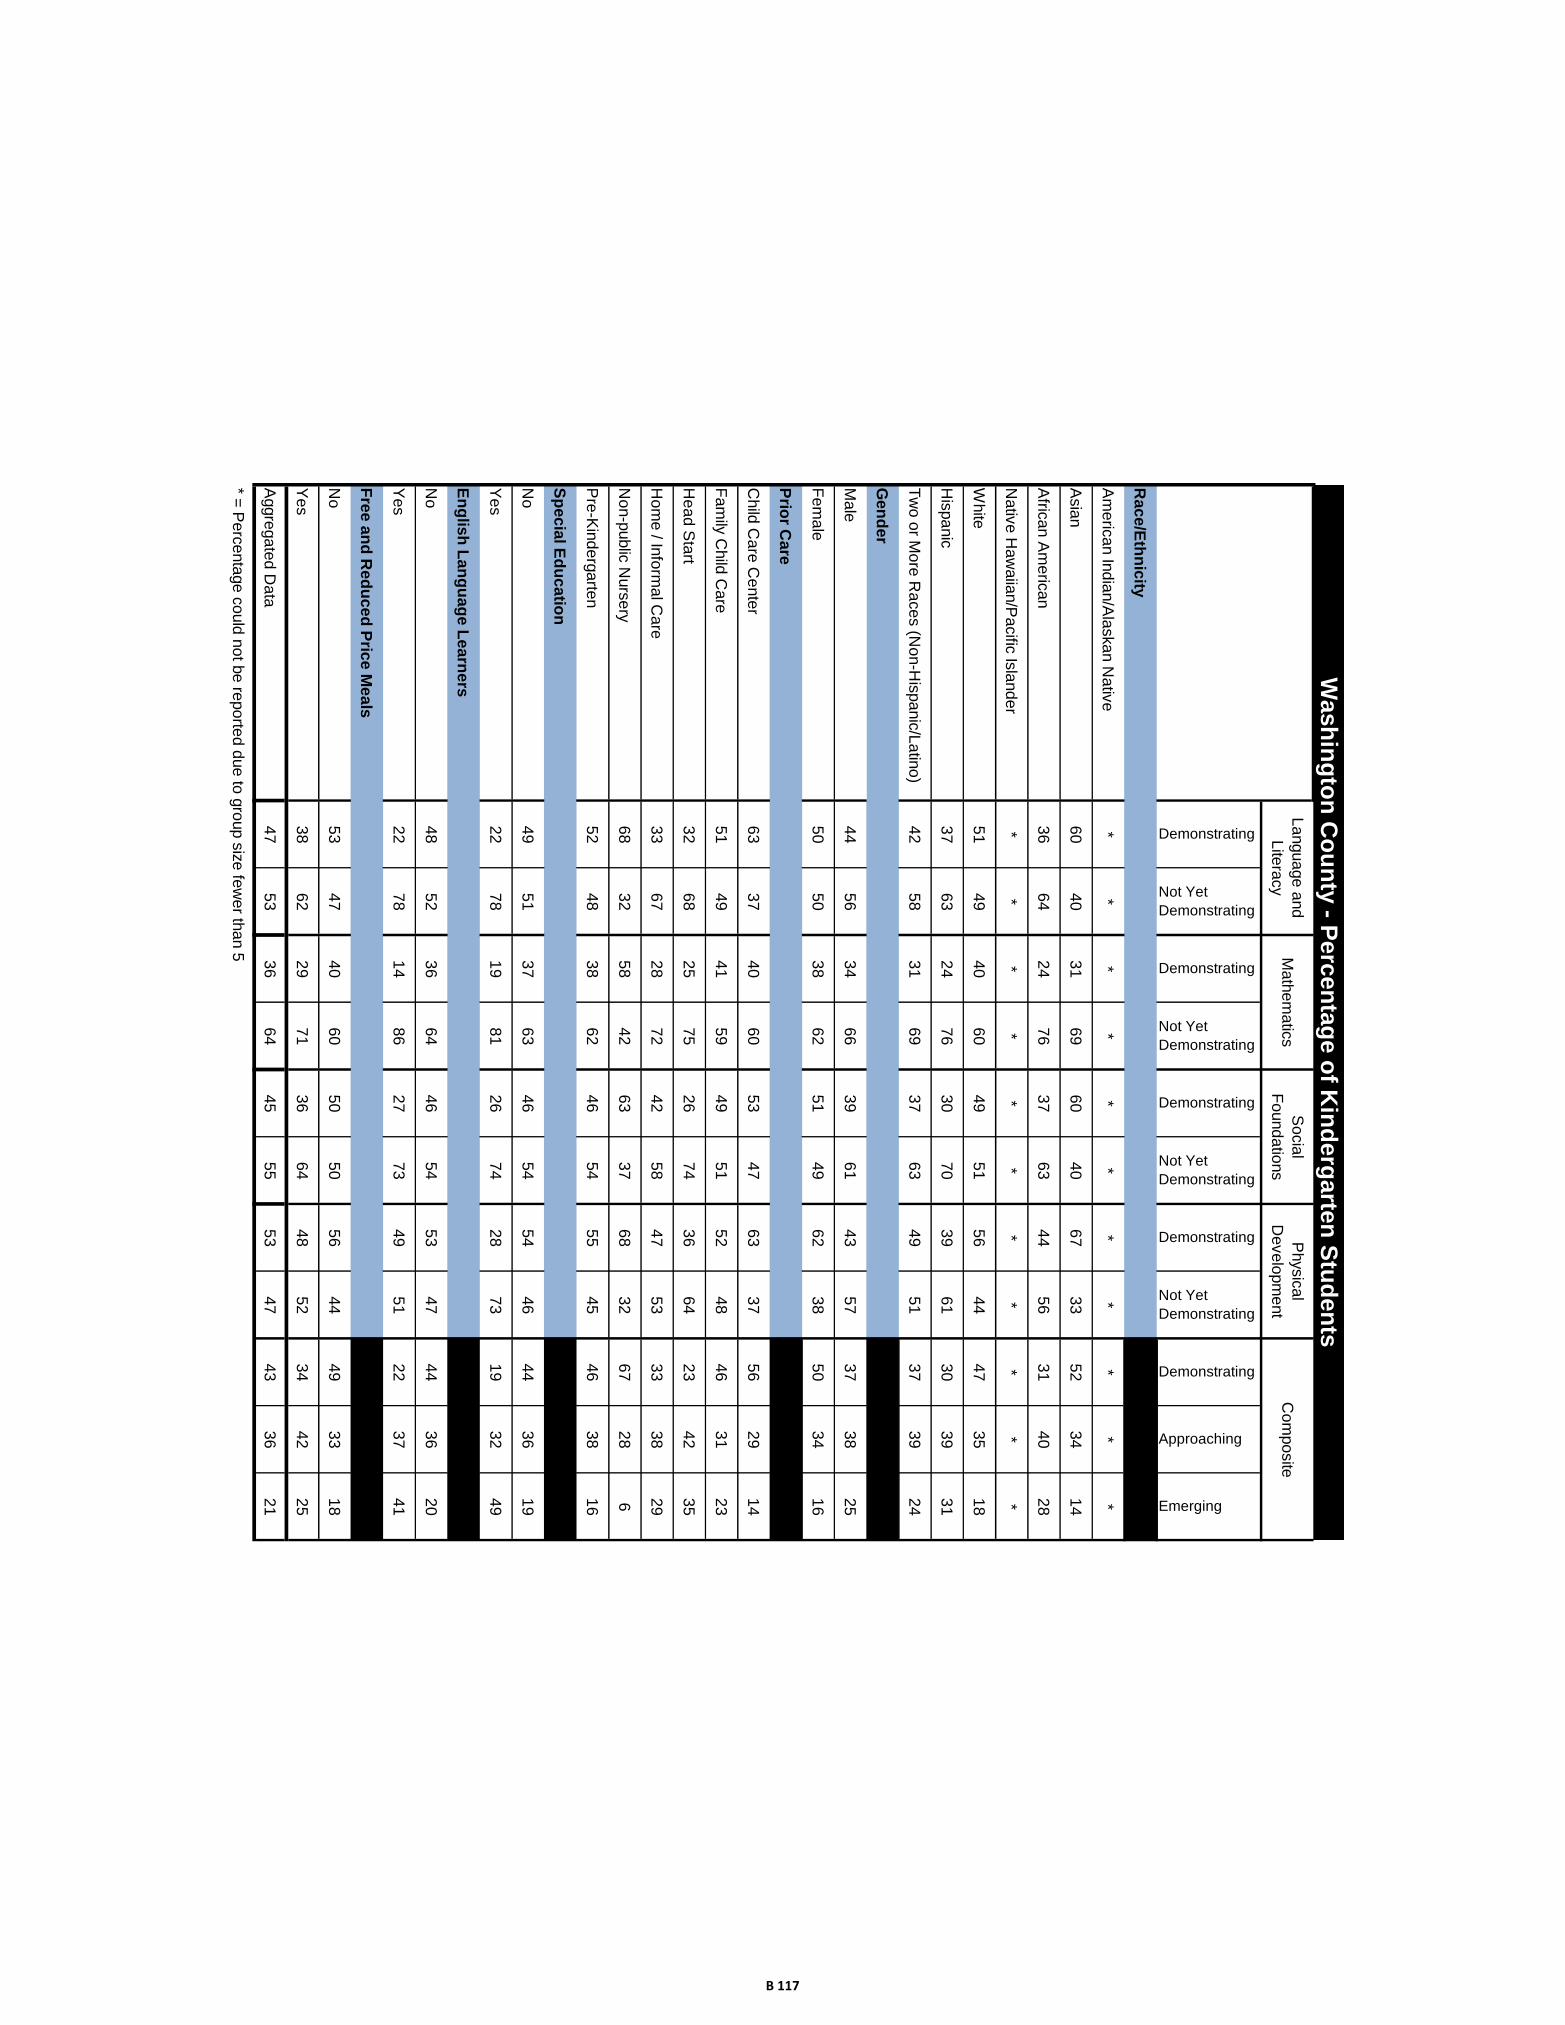
Demonstrating
Not Yet
Demonstrating
Demonstrating
Not Yet
Demonstrating
Demonstrating
Not Yet
Demonstrating
Demonstrating
Not Yet
Demonstrating
Demonstrating
Approaching
Emerging
Rac
e/E
thn
icity
Am
eric
an In
dia
n/A
laskan N
ativ
e*
**
**
**
**
**
Asia
n6
04
03
16
96
04
06
73
35
23
41
4
Afric
an A
meric
an
36
64
24
76
37
63
44
56
31
40
28
Nativ
e H
aw
aiia
n/P
acific
Isla
nde
r*
**
**
**
**
**
White
51
49
40
60
49
51
56
44
47
35
18
His
panic
37
63
24
76
30
70
39
61
30
39
31
Tw
o o
r More
Race
s (N
on-H
ispanic
/La
tino)
42
58
31
69
37
63
49
51
37
39
24
Gen
der
Male
44
56
34
66
39
61
43
57
37
38
25
Fem
ale
50
50
38
62
51
49
62
38
50
34
16
Prio
r Care
Child
Care
Cente
r6
33
74
06
05
34
76
33
75
62
91
4
Fam
ily C
hild
Care
51
49
41
59
49
51
52
48
46
31
23
Hea
d S
tart
32
68
25
75
26
74
36
64
23
42
35
Hom
e / In
form
al C
are
33
67
28
72
42
58
47
53
33
38
29
Non-p
ublic
Nurs
ery
68
32
58
42
63
37
68
32
67
28
6
Pre
-Kin
de
rgarte
n5
24
83
86
24
65
45
54
54
63
81
6
Sp
ec
ial E
du
ca
tion
No
49
51
37
63
46
54
54
46
44
36
19
Yes
22
78
19
81
26
74
28
73
19
32
49
En
glis
h L
an
gu
ag
e L
ea
rne
rs
No
48
52
36
64
46
54
53
47
44
36
20
Yes
22
78
14
86
27
73
49
51
22
37
41
Fre
e a
nd
Red
uce
d P
rice
Mea
ls
No
53
47
40
60
50
50
56
44
49
33
18
Yes
38
62
29
71
36
64
48
52
34
42
25
Aggre
gate
d D
ata
47
53
36
64
45
55
53
47
43
36
21
* = P
erc
enta
ge c
ould
not b
e re
porte
d d
ue to
gro
up s
ize fe
wer th
an 5
Socia
l
Founda
tions
Physic
al
Develo
pm
ent
Com
posite
Wash
ing
ton
Co
un
ty - P
erc
en
tag
e o
f Kin
derg
arte
n S
tud
en
ts
La
nguage a
nd
Lite
racy
Math
em
atic
s
B 117
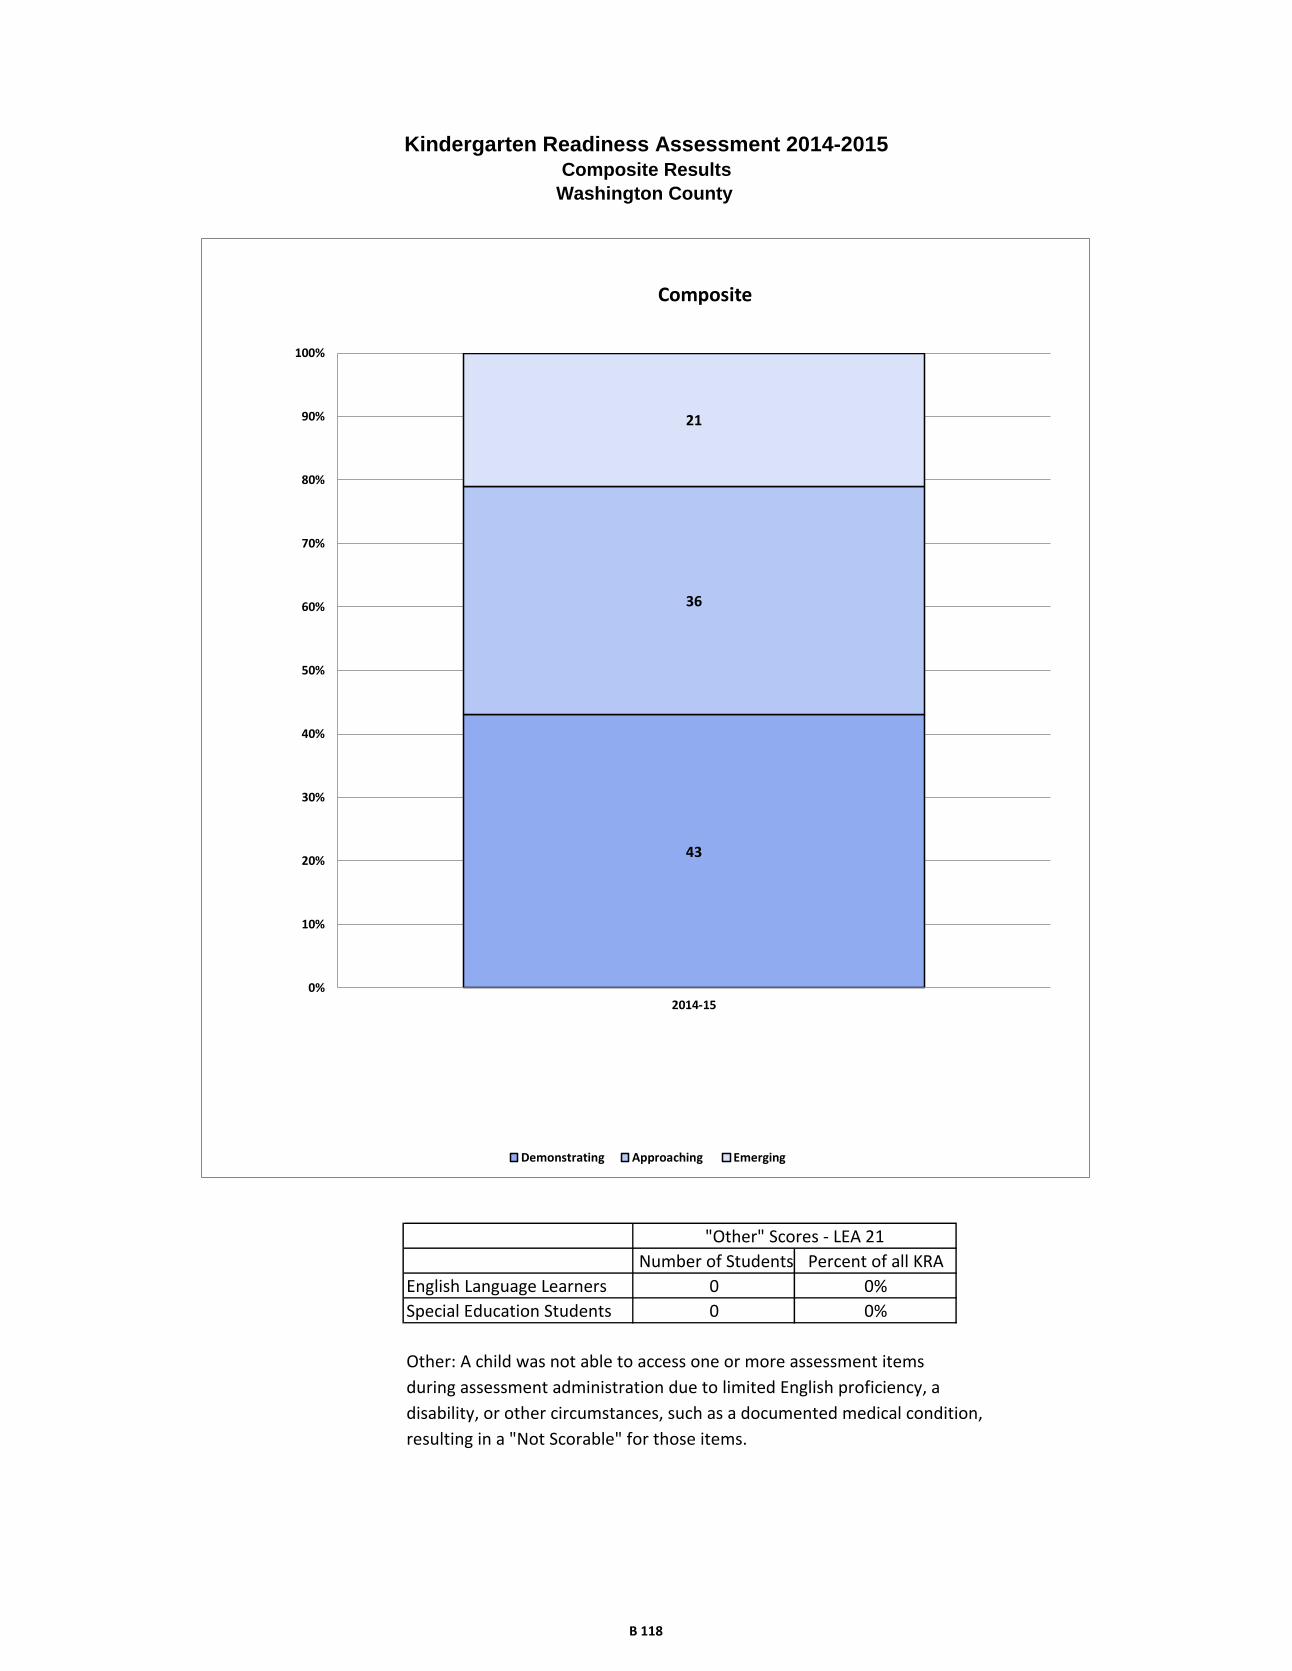
Other: A child was not able to access one or more assessment items
during assessment administration due to limited English proficiency, a
disability, or other circumstances, such as a documented medical condition,
resulting in a "Not Scorable" for those items.
0%
"Other" Scores - LEA 21
Number of Students Percent of all KRA
Kindergarten Readiness Assessment 2014-2015Composite Results
Washington County
English Language Learners 0 0%
Special Education Students 0
43
36
21
0%
10%
20%
30%
40%
50%
60%
70%
80%
90%
100%
2014-15
Composite
Demonstrating Approaching Emerging
B 118
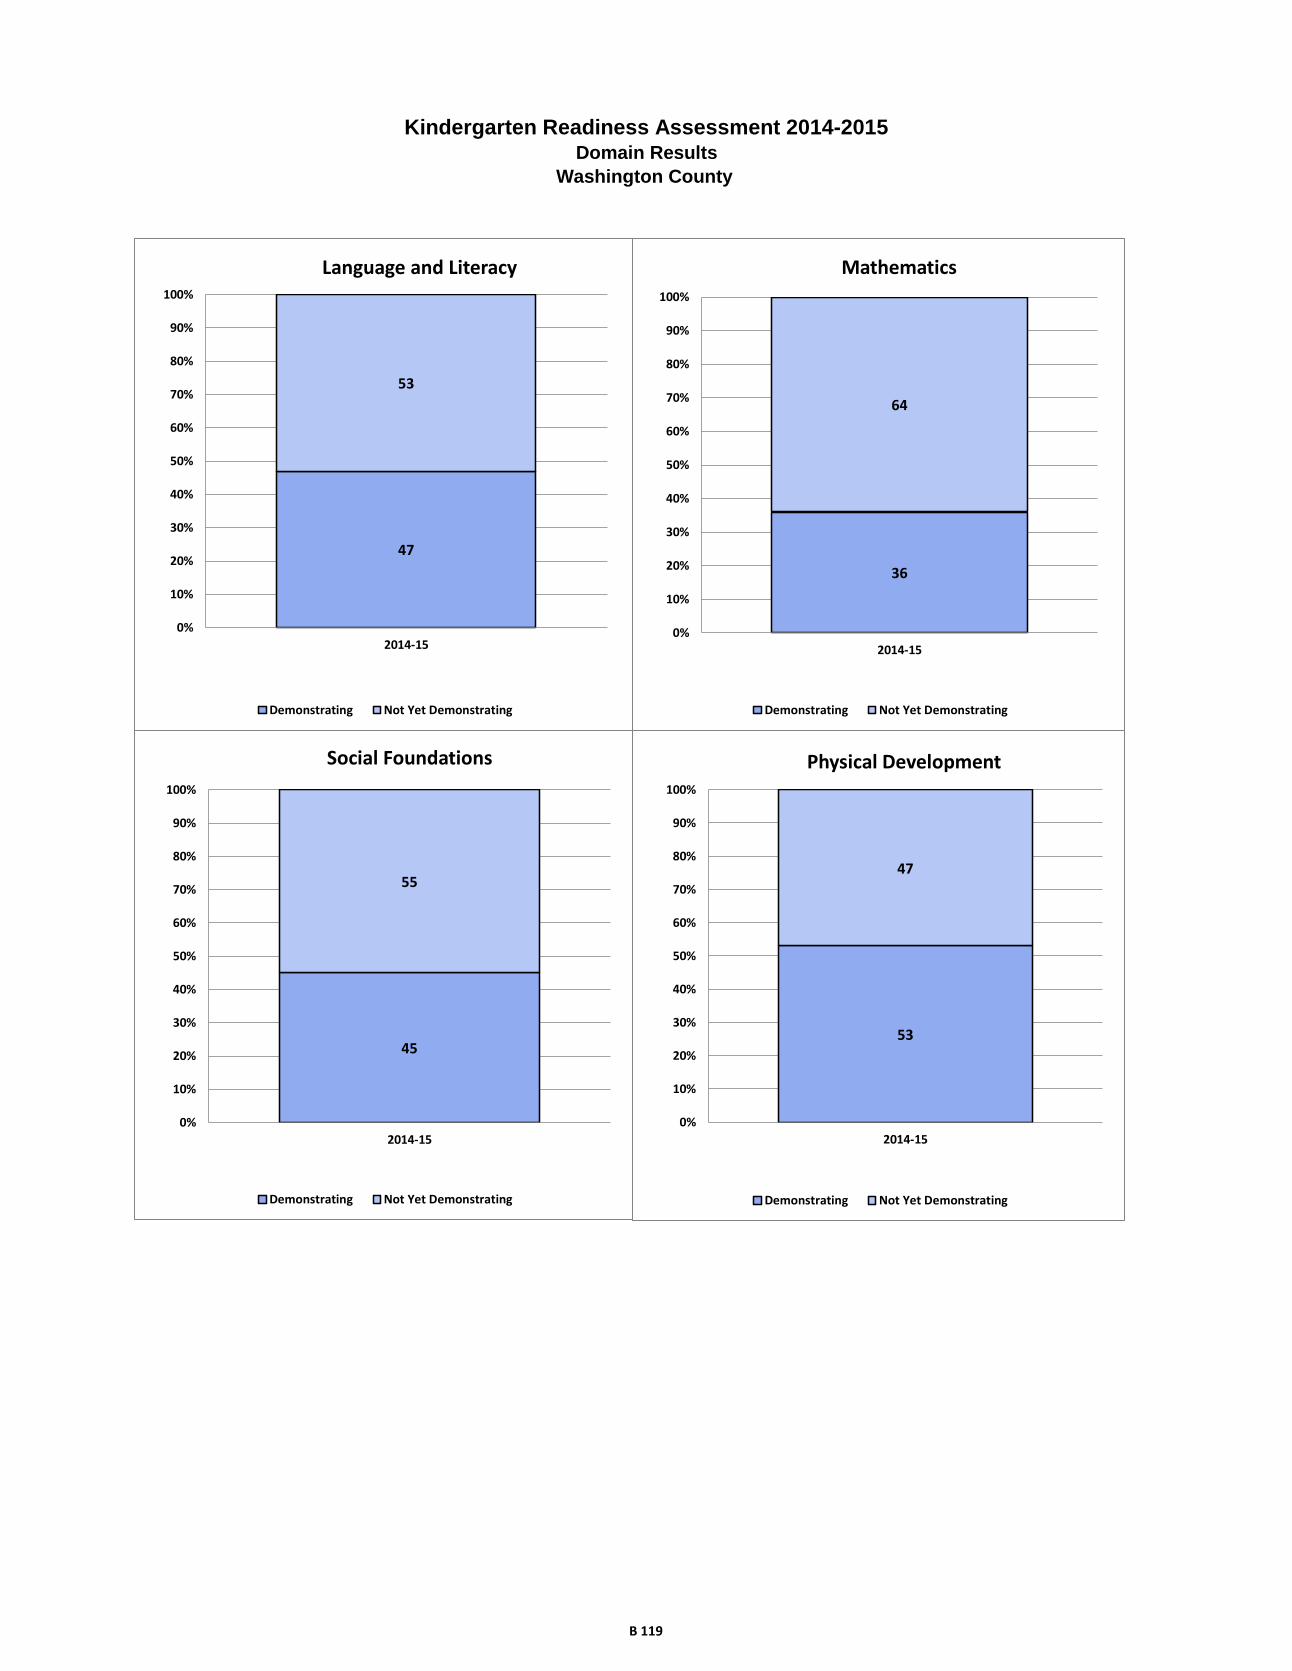
Kindergarten Readiness Assessment 2014-2015Domain Results
Washington County
47
53
0%
10%
20%
30%
40%
50%
60%
70%
80%
90%
100%
2014-15
Language and Literacy
Demonstrating Not Yet Demonstrating
36
64
0%
10%
20%
30%
40%
50%
60%
70%
80%
90%
100%
2014-15
Mathematics
Demonstrating Not Yet Demonstrating
45
55
0%
10%
20%
30%
40%
50%
60%
70%
80%
90%
100%
2014-15
Social Foundations
Demonstrating Not Yet Demonstrating
53
47
0%
10%
20%
30%
40%
50%
60%
70%
80%
90%
100%
2014-15
Physical Development
Demonstrating Not Yet Demonstrating
B 119

Frequency Percent
Males 636 52.30
Females 580 47.70
Frequency Percent
American Indian/Alaska Native 10 0.82
Asian 28 2.30
Black/African American 401 32.98
Native Hawaiian/Other Pacific Islander 0 0.00
White 510 41.94
Hispanic/Latino 138 11.35
Two or More Races (Non-Hispanic/Latino) 129 10.61
Frequency Percent
No 373 30.67
Yes 843 69.33
Frequency Percent
No 1102 90.63
Yes 114 9.38
Frequency Percent
No 1100 90.46
Yes 116 9.54
Frequency Percent
Head Start 153 12.58
Prekindergarten 637 52.38
Child Care Center 127 10.44
Family Child Care 49 4.03
Home/Informal Care 170 13.98
Non-Public Nursery School 23 1.89
Repeated Kindergarten 58 4.77
Free & Reduced Priced Meals
Special Education
English Language Learners
Predominant Prior Care
Final Record Count for KRA Data File 1216
Kindergarten Readiness Assessment
Wicomico County Data File Summary 2014-2015
Gender
Ethnicity/Race
B 120

Demonstrating
Not Yet
Demonstrating
Demonstrating
Not Yet
Demonstrating
Demonstrating
Not Yet
Demonstrating
Demonstrating
Not Yet
Demonstrating
Demonstrating
Approaching
Emerging
Rac
e/E
thn
icity
Am
eric
an In
dia
n/A
laskan N
ativ
e2
82
86
47
34
42
Asia
n8
19
91
81
71
11
71
11
21
05
Afric
an A
meric
an
12
92
66
73
32
01
80
21
42
20
16
91
28
19
16
8
Nativ
e H
aw
aiia
n/P
acific
Isla
nde
r*
**
**
**
**
**
White
26
82
37
19
03
14
28
12
25
31
21
90
26
91
74
58
His
panic
28
10
62
21
13
67
68
87
48
35
61
38
Tw
o o
r More
Race
s (N
on-H
ispanic
/La
tino)
63
64
33
94
73
54
79
47
61
50
15
Gen
der
Male
24
33
82
15
24
72
27
03
56
32
03
05
23
02
68
12
3
Fem
ale
25
53
18
17
73
95
35
42
20
40
21
63
27
92
22
63
Prio
r Care
Child
Care
Cente
r7
45
34
97
87
15
67
84
87
14
31
2
Fam
ily C
hild
Care
17
32
13
36
21
28
27
22
18
24
7
Hea
d S
tart
40
11
31
91
33
68
85
86
67
40
77
35
Hom
e / In
form
al C
are
49
11
92
91
39
70
98
80
87
53
65
49
Non-p
ublic
Nurs
ery
13
10
10
13
14
91
67
14
81
Pre
-Kin
de
rgarte
n2
89
33
31
91
43
03
52
27
23
99
21
72
92
24
57
5
Sp
ec
ial E
du
ca
tion
No
47
86
15
30
87
85
58
75
08
67
54
10
48
24
50
15
0
Yes
20
85
21
82
37
68
47
58
27
40
36
En
glis
h L
an
gu
ag
e L
ea
rne
rs
No
48
46
01
31
67
66
57
35
12
65
64
19
48
84
39
14
5
Yes
14
99
13
10
15
16
46
64
92
15
14
1
Fre
e a
nd
Red
uce
d P
rice
Mea
ls
No
21
11
55
14
32
21
22
01
47
24
11
24
21
51
24
24
Yes
28
75
45
18
66
46
40
44
29
48
13
44
29
43
66
16
2
Aggre
gate
d D
ata
49
87
00
32
98
67
62
45
76
72
24
68
50
94
90
18
6
* = fe
wer th
an 5
Wic
om
ico
Co
un
ty - N
um
ber o
f Kin
derg
arte
n S
tud
en
ts
Socia
l
Founda
tions
Physic
al
Develo
pm
ent
La
nguage a
nd
Lite
racy
Math
em
atic
sC
om
posite
B 121

Demonstrating
Not Yet
Demonstrating
Demonstrating
Not Yet
Demonstrating
Demonstrating
Not Yet
Demonstrating
Demonstrating
Not Yet
Demonstrating
Demonstrating
Approaching
Emerging
Rac
e/E
thn
icity
Am
eric
an In
dia
n/A
laskan N
ativ
e2
08
02
08
06
04
07
03
04
04
02
0
Asia
n3
07
03
36
76
13
96
13
94
43
71
9
Afric
an A
meric
an
33
67
19
81
46
54
57
43
33
49
18
Nativ
e H
aw
aiia
n/P
acific
Isla
nde
r*
**
**
**
**
**
White
53
47
38
62
56
44
62
38
54
35
12
His
panic
21
79
16
84
50
50
64
36
26
46
28
Tw
o o
r More
Race
s (N
on-H
ispanic
/La
tino)
50
50
26
74
57
43
63
37
48
40
12
Gen
der
Male
39
61
24
76
43
57
51
49
37
43
20
Fem
ale
45
55
31
69
62
38
71
29
49
39
11
Prio
r Care
Child
Care
Cente
r5
84
23
96
15
64
46
23
85
63
41
0
Fam
ily C
hild
Care
35
65
27
73
43
57
55
45
37
49
14
Hea
d S
tart
26
74
13
88
44
56
56
44
26
51
23
Hom
e / In
form
al C
are
29
71
17
83
42
58
48
52
32
39
29
Non-p
ublic
Nurs
ery
57
43
43
57
61
39
70
30
61
35
4
Pre
-Kin
de
rgarte
n4
65
43
16
95
64
46
53
54
84
01
2
Sp
ec
ial E
du
ca
tion
No
44
56
28
72
54
46
62
38
45
42
14
Yes
19
81
20
80
35
65
45
55
26
39
35
En
glis
h L
an
gu
ag
e L
ea
rne
rs
No
45
55
29
71
53
47
61
39
46
41
14
Yes
12
88
11
89
44
56
57
43
19
45
36
Fre
e a
nd
Red
uce
d P
rice
Mea
ls
No
58
42
39
61
60
40
66
34
59
34
7
Yes
34
66
22
78
48
52
58
42
36
45
20
Aggre
gate
d D
ata
42
58
28
72
52
48
61
39
43
41
16
* = fe
wer th
an 5
Socia
l
Founda
tions
Physic
al
Develo
pm
ent
Com
posite
Wic
om
ico
Co
un
ty - P
erc
en
tag
e o
f Kin
derg
arte
n S
tud
en
ts
La
nguage a
nd
Lite
racy
Math
em
atic
s
B 122
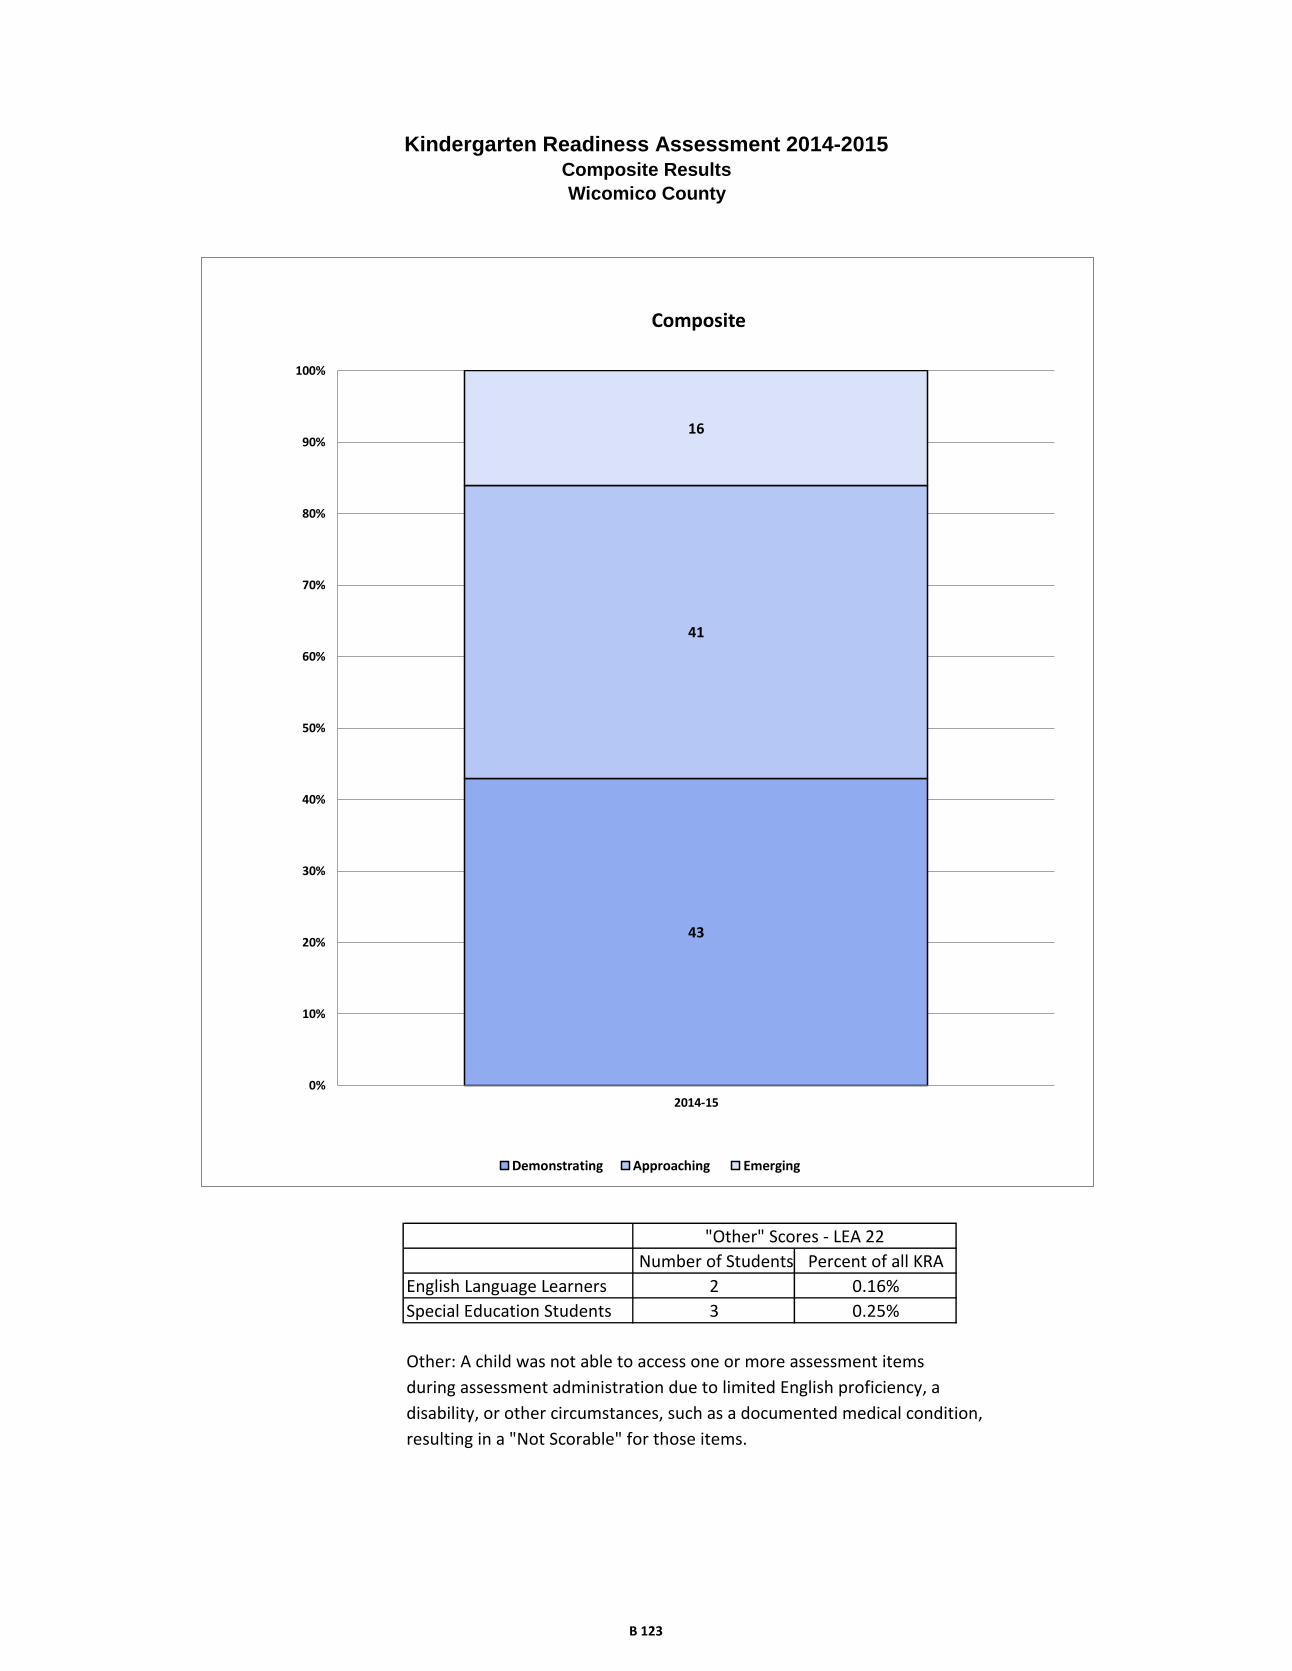
Other: A child was not able to access one or more assessment items
during assessment administration due to limited English proficiency, a
disability, or other circumstances, such as a documented medical condition,
resulting in a "Not Scorable" for those items.
"Other" Scores - LEA 22
Number of Students Percent of all KRA
Kindergarten Readiness Assessment 2014-2015Composite Results
Wicomico County
English Language Learners 2 0.16%
Special Education Students 3 0.25%
43
41
16
0%
10%
20%
30%
40%
50%
60%
70%
80%
90%
100%
2014-15
Composite
Demonstrating Approaching Emerging
B 123
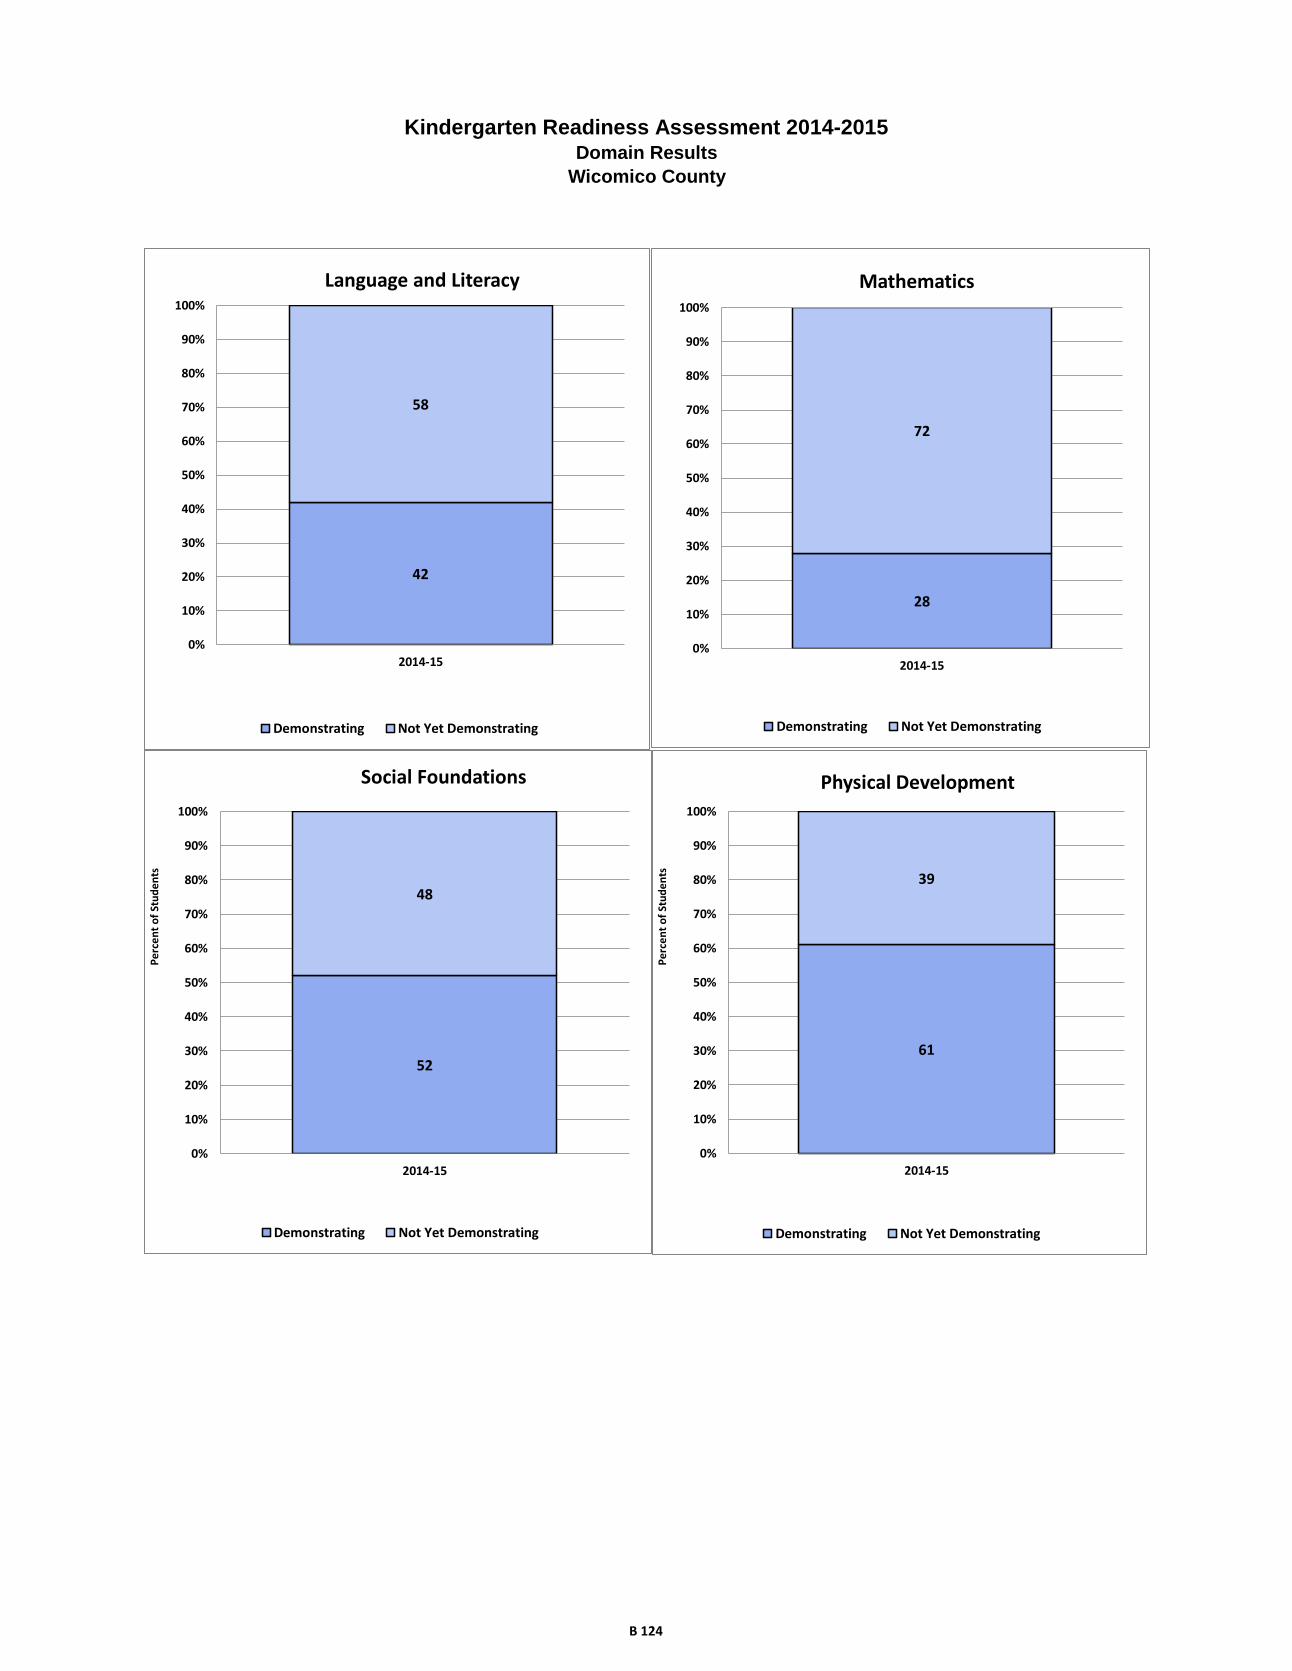
Kindergarten Readiness Assessment 2014-2015Domain Results
Wicomico County
42
58
0%
10%
20%
30%
40%
50%
60%
70%
80%
90%
100%
2014-15
Language and Literacy
Demonstrating Not Yet Demonstrating
28
72
0%
10%
20%
30%
40%
50%
60%
70%
80%
90%
100%
2014-15
Mathematics
Demonstrating Not Yet Demonstrating
52
48
0%
10%
20%
30%
40%
50%
60%
70%
80%
90%
100%
2014-15
Social Foundations
Demonstrating Not Yet Demonstrating
Pe
rce
nt
of
Stu
de
nts
61
39
0%
10%
20%
30%
40%
50%
60%
70%
80%
90%
100%
2014-15
Physical Development
Demonstrating Not Yet Demonstrating
Pe
rce
nt
of
Stu
de
nts
B 124
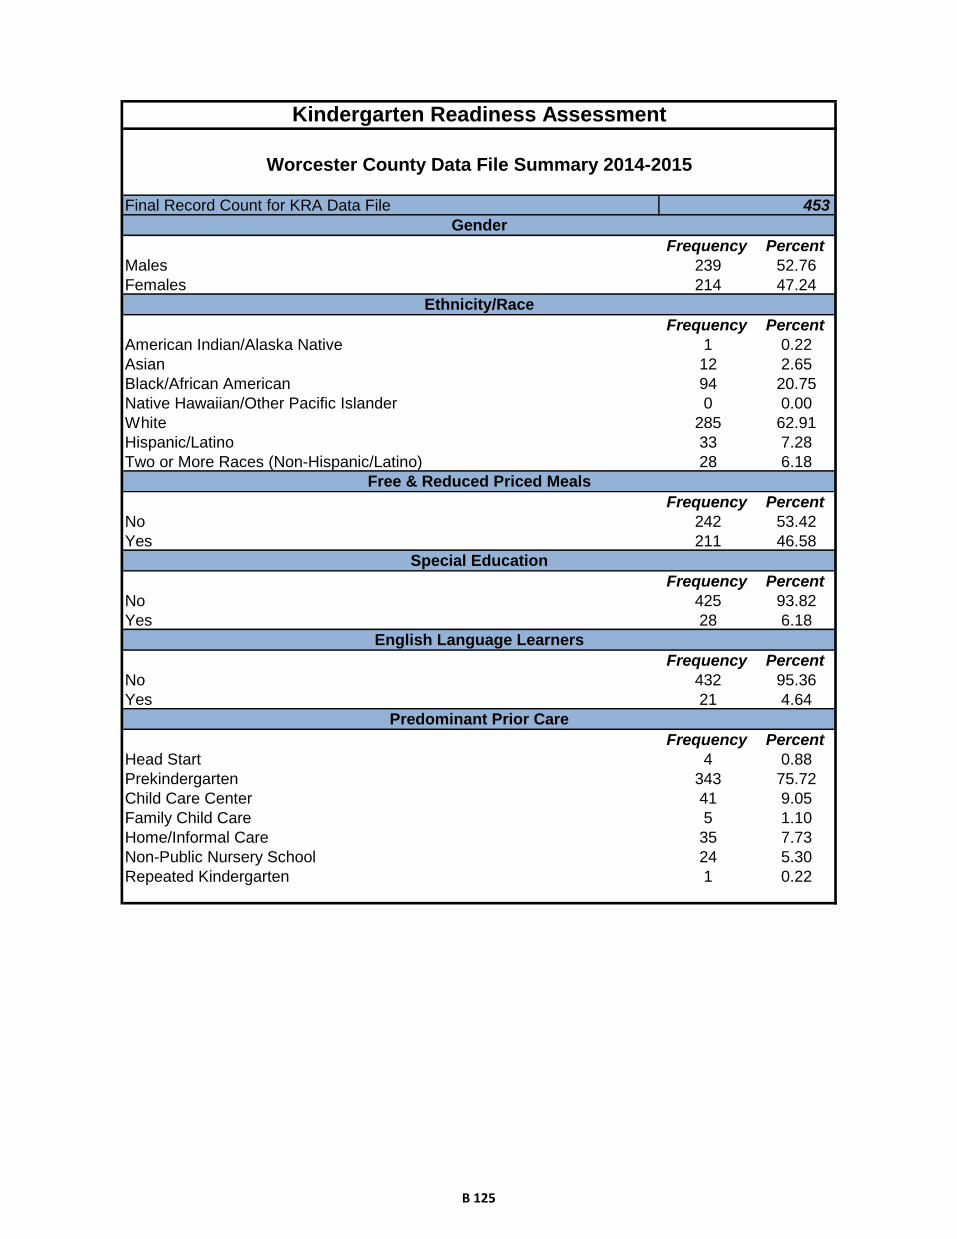
Frequency Percent
Males 239 52.76
Females 214 47.24
Frequency Percent
American Indian/Alaska Native 1 0.22
Asian 12 2.65
Black/African American 94 20.75
Native Hawaiian/Other Pacific Islander 0 0.00
White 285 62.91
Hispanic/Latino 33 7.28
Two or More Races (Non-Hispanic/Latino) 28 6.18
Frequency Percent
No 242 53.42
Yes 211 46.58
Frequency Percent
No 425 93.82
Yes 28 6.18
Frequency Percent
No 432 95.36
Yes 21 4.64
Frequency Percent
Head Start 4 0.88
Prekindergarten 343 75.72
Child Care Center 41 9.05
Family Child Care 5 1.10
Home/Informal Care 35 7.73
Non-Public Nursery School 24 5.30
Repeated Kindergarten 1 0.22
Special Education
English Language Learners
Predominant Prior Care
Final Record Count for KRA Data File 453
Kindergarten Readiness Assessment
Worcester County Data File Summary 2014-2015
Gender
Ethnicity/Race
Free & Reduced Priced Meals
B 125

Demonstrating
Not Yet
Demonstrating
Demonstrating
Not Yet
Demonstrating
Demonstrating
Not Yet
Demonstrating
Demonstrating
Not Yet
Demonstrating
Demonstrating
Approaching
Emerging
Rac
e/E
thn
icity
Am
eric
an In
dia
n/A
laskan N
ativ
e*
**
**
**
**
**
Asia
n7
56
69
31
02
75
0
Afric
an A
meric
an
38
52
27
66
27
63
23
67
22
52
16
Nativ
e H
aw
aiia
n/P
acific
Isla
nde
r*
**
**
**
**
**
White
16
91
09
13
31
51
16
61
13
15
61
23
15
89
52
5
His
panic
13
18
82
51
51
61
91
21
01
56
Tw
o o
r More
Race
s (N
on-H
ispanic
/La
tino)
14
12
72
01
41
21
41
31
59
2
Gen
der
Male
12
81
06
97
14
11
13
12
11
01
13
41
07
96
31
Fem
ale
11
39
18
41
28
11
88
71
21
84
10
58
11
8
Prio
r Care
Child
Care
Cente
r2
51
41
32
82
61
32
11
82
11
35
Fam
ily C
hild
Care
41
32
32
32
41
0
Hea
d S
tart
**
**
**
**
**
*
Hom
e / In
form
al C
are
42
98
25
10
23
12
22
61
98
Non-p
ublic
Nurs
ery
15
81
21
21
94
15
81
75
1
Pre
-Kin
de
rgarte
n1
93
14
01
45
19
71
73
16
11
71
16
31
64
13
63
3
Sp
ec
ial E
du
ca
tion
No
23
21
80
17
42
50
22
61
87
21
51
98
20
81
67
37
Yes
91
77
19
52
17
20
41
01
2
En
glis
h L
an
gu
ag
e L
ea
rne
rs
No
23
61
83
17
82
51
22
11
99
21
02
11
20
91
63
47
Yes
51
43
18
10
91
27
31
42
Fre
e a
nd
Red
uce
d P
rice
Mea
ls
No
15
28
41
25
11
61
59
77
15
38
41
50
71
15
Yes
89
11
35
61
53
72
13
16
91
34
62
10
63
4
Aggre
gate
d D
ata
24
11
97
18
12
69
23
12
08
22
22
18
21
21
77
49
* = G
roup s
ize fe
wer th
an 5
Wo
rceste
r Co
un
ty - N
um
ber o
f Kin
derg
arte
n S
tud
en
ts
Socia
l
Founda
tions
Physic
al
Develo
pm
ent
La
nguage a
nd
Lite
racy
Math
em
atic
sC
om
posite
B 126

Demonstrating
Not Yet
Demonstrating
Demonstrating
Not Yet
Demonstrating
Demonstrating
Not Yet
Demonstrating
Demonstrating
Not Yet
Demonstrating
Demonstrating
Approaching
Emerging
Rac
e/E
thn
icity
Am
eric
an In
dia
n/A
laskan N
ativ
e*
**
**
**
**
**
Asia
n5
84
25
05
07
52
58
31
75
84
20
Afric
an A
meric
an
42
58
29
71
30
70
26
74
24
58
18
Nativ
e H
aw
aiia
n/P
acific
Isla
nde
r*
**
**
**
**
**
White
61
39
47
53
59
41
56
44
57
34
9
His
panic
42
58
24
76
48
52
61
39
32
48
19
Tw
o o
r More
Race
s (N
on-H
ispanic
/La
tino)
54
46
26
74
54
46
52
48
58
35
8
Gen
der
Male
55
45
41
59
48
52
43
57
46
41
13
Fem
ale
55
45
40
60
58
42
59
41
51
40
9
Prio
r Care
Child
Care
Cente
r6
43
63
26
86
73
35
44
65
43
31
3
Fam
ily C
hild
Care
80
20
60
40
60
40
60
40
80
20
0
Hea
d S
tart
**
**
**
**
**
*
Hom
e / In
form
al C
are
12
88
24
76
30
70
35
65
18
58
24
Non-p
ublic
Nurs
ery
65
35
50
50
83
17
65
35
74
22
4
Pre
-Kin
de
rgarte
n5
84
24
25
85
24
85
14
94
94
11
0
Sp
ec
ial E
du
ca
tion
No
56
44
41
59
55
45
52
48
50
41
9
Yes
35
65
27
73
19
81
26
74
15
38
46
En
glis
h L
an
gu
ag
e L
ea
rne
rs
No
56
44
41
59
53
47
50
50
50
39
11
Yes
26
74
14
86
53
47
63
37
16
74
11
Fre
e a
nd
Red
uce
d P
rice
Mea
ls
No
64
36
52
48
67
33
65
35
64
30
6
Yes
44
56
27
73
35
65
34
66
31
52
17
Aggre
gate
d D
ata
55
45
40
60
53
47
50
50
48
40
11
* = P
erc
enta
ge c
ould
not b
e re
porte
d d
ue to
gro
up s
ize fe
wer th
an 5
Socia
l
Founda
tions
Physic
al
Develo
pm
ent
Com
posite
Wo
rceste
r Co
un
ty - P
erc
en
tag
e o
f Kin
derg
arte
n S
tud
en
ts
La
nguage a
nd
Lite
racy
Math
em
atic
s
B 127
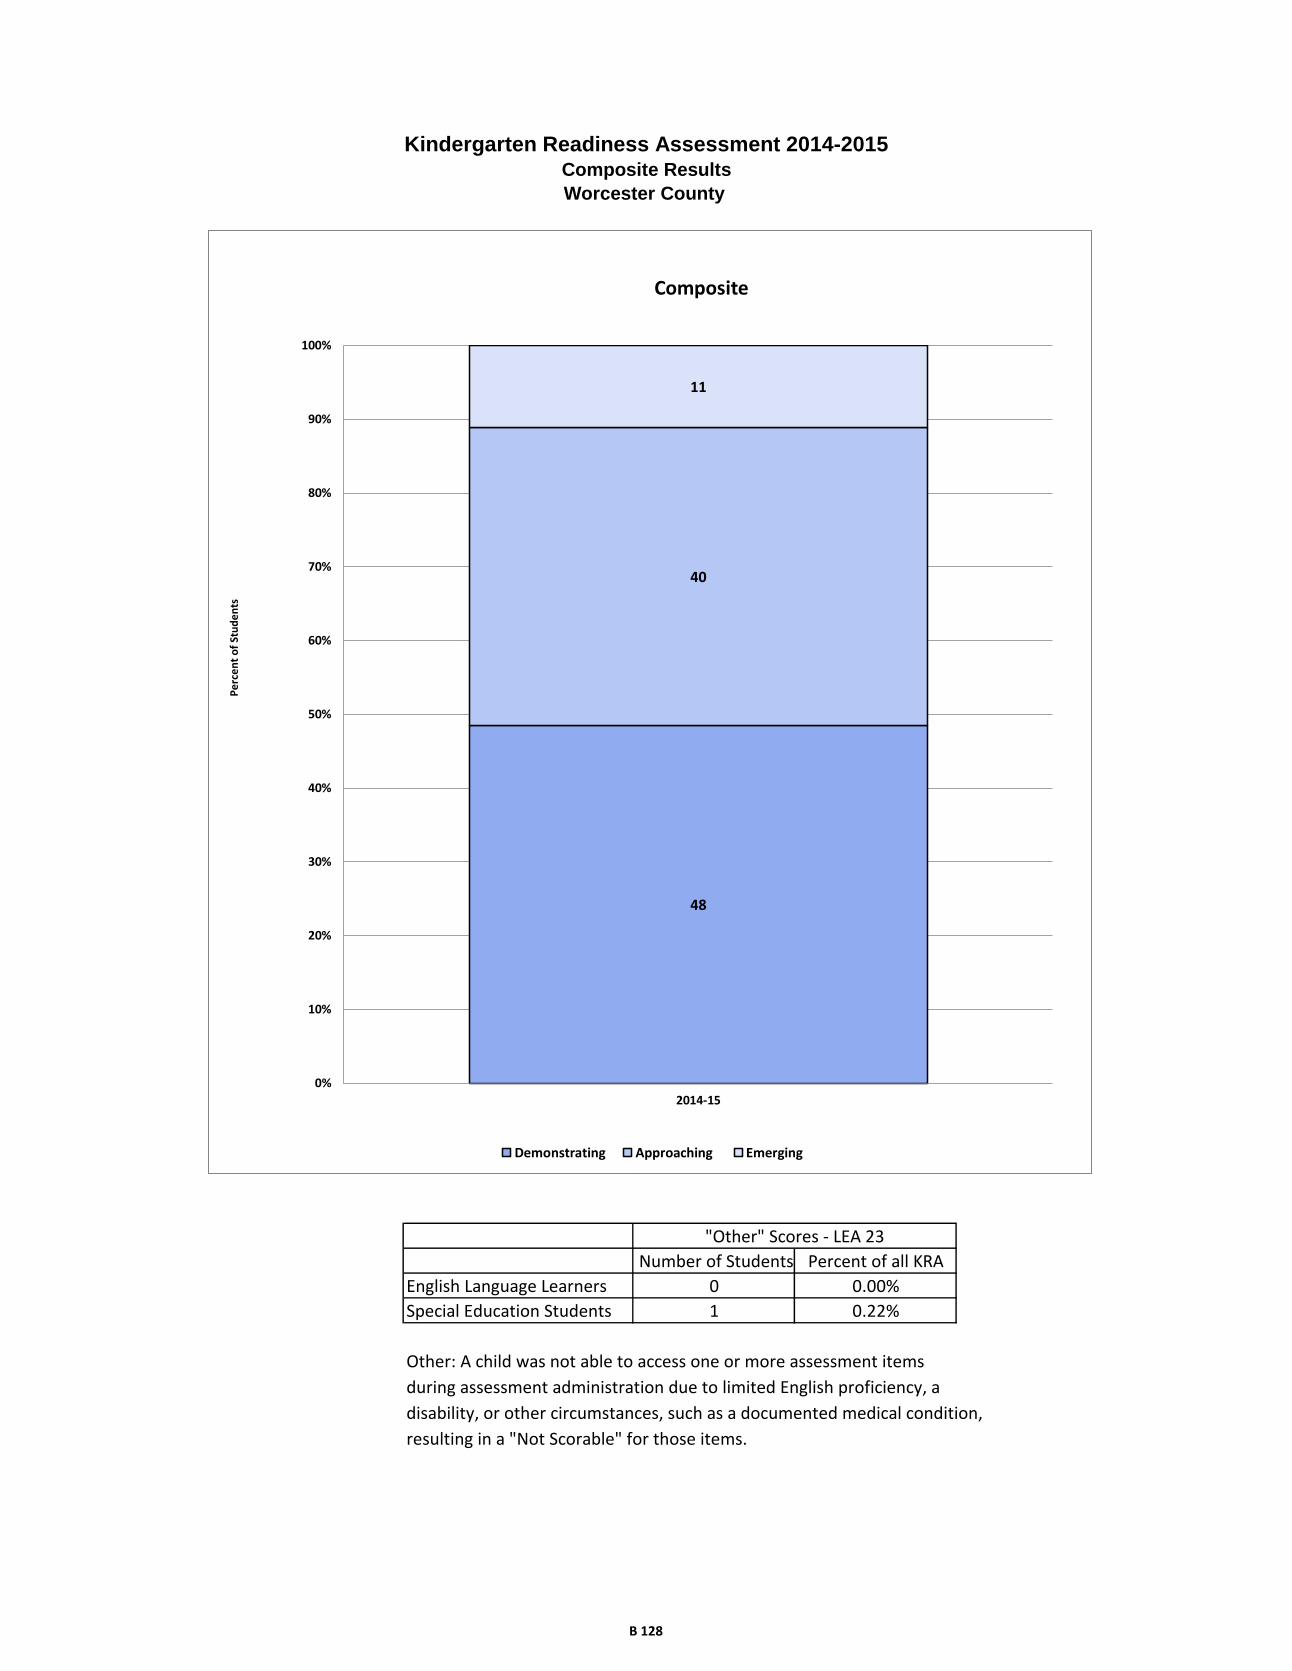
Other: A child was not able to access one or more assessment items
during assessment administration due to limited English proficiency, a
disability, or other circumstances, such as a documented medical condition,
resulting in a "Not Scorable" for those items.
Kindergarten Readiness Assessment 2014-2015Composite Results
Worcester County
English Language Learners 0 0.00%
Special Education Students 1 0.22%
"Other" Scores - LEA 23
Number of Students Percent of all KRA
48
40
11
0%
10%
20%
30%
40%
50%
60%
70%
80%
90%
100%
2014-15
Composite
Demonstrating Approaching Emerging
Pe
rce
nt
of
Stu
de
nts
B 128
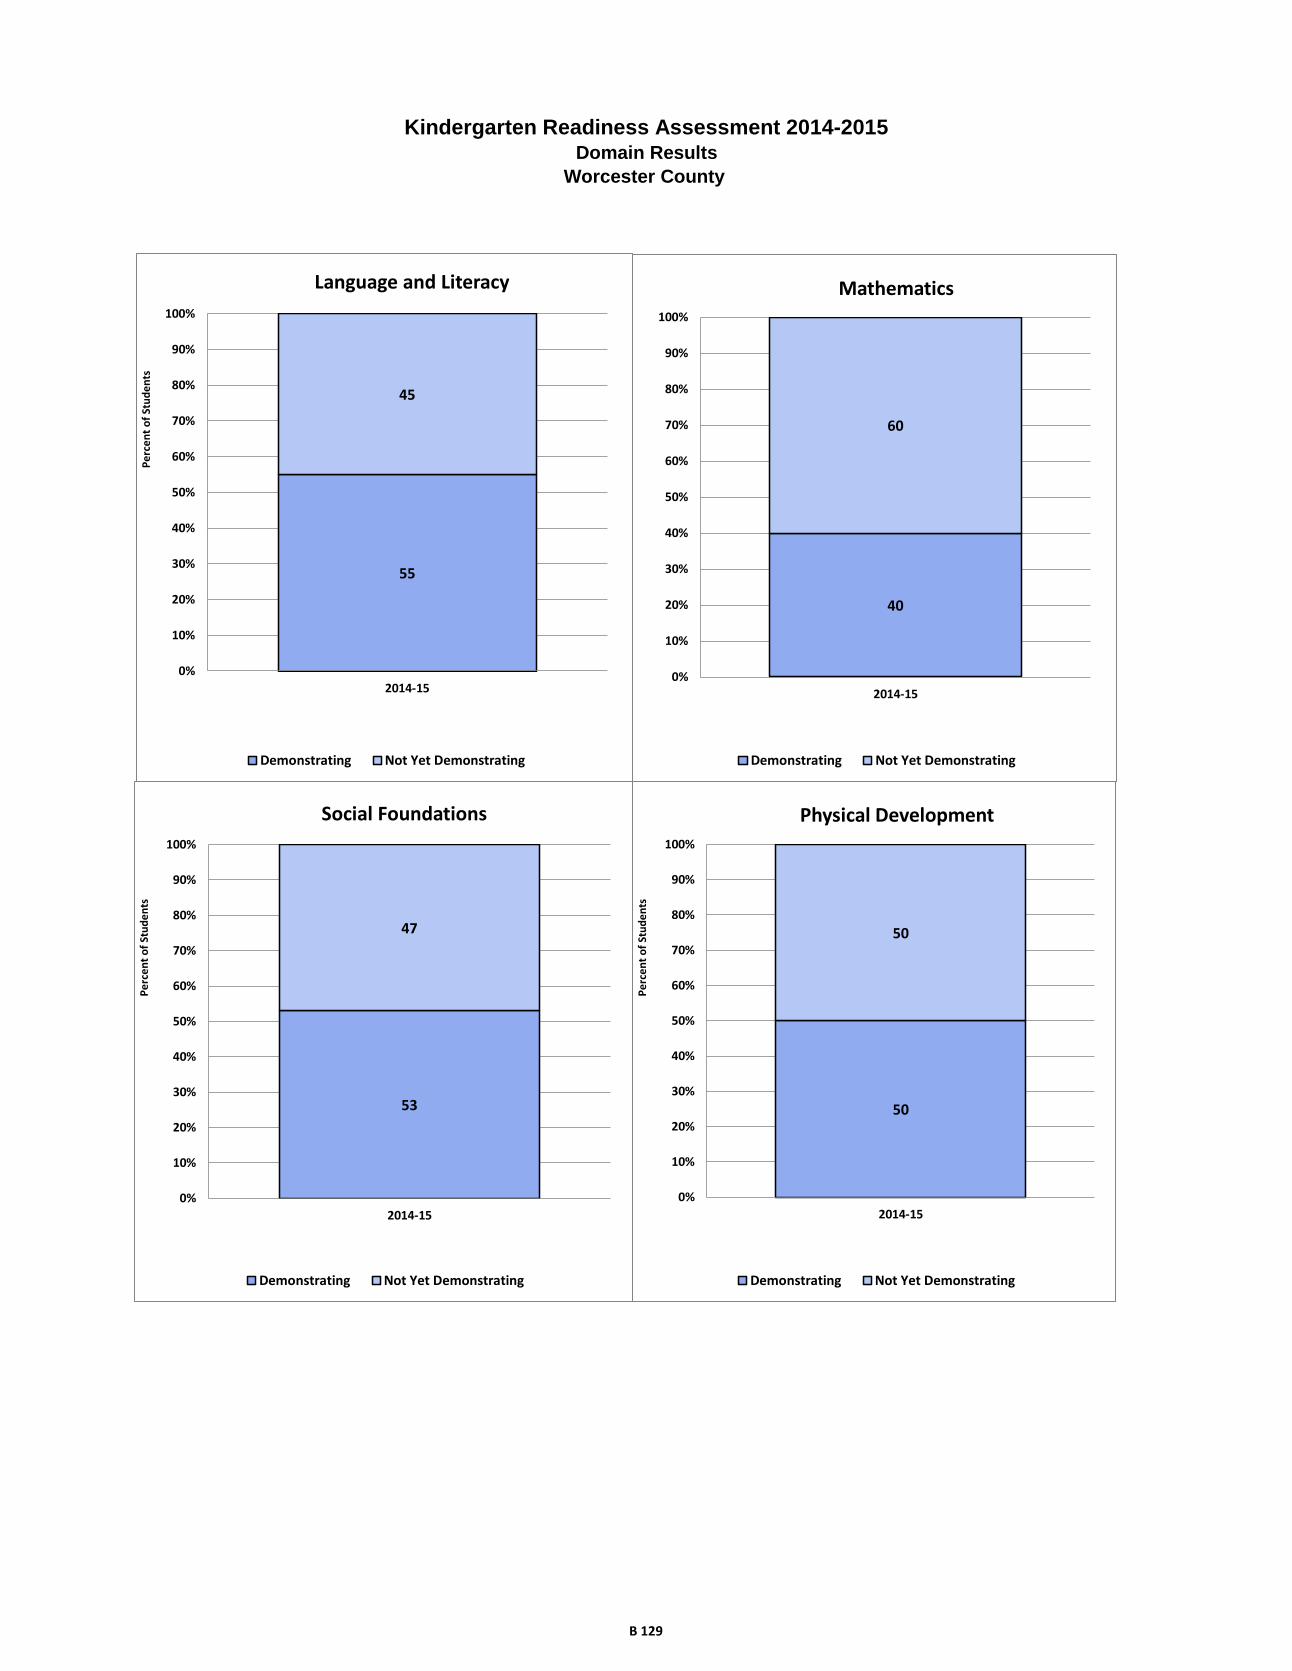
Kindergarten Readiness Assessment 2014-2015Domain Results
Worcester County
55
45
0%
10%
20%
30%
40%
50%
60%
70%
80%
90%
100%
2014-15
Language and Literacy
Demonstrating Not Yet Demonstrating
Pe
rce
nt
of
Stu
de
nts
40
60
0%
10%
20%
30%
40%
50%
60%
70%
80%
90%
100%
2014-15
Mathematics
Demonstrating Not Yet Demonstrating
53
47
0%
10%
20%
30%
40%
50%
60%
70%
80%
90%
100%
2014-15
Social Foundations
Demonstrating Not Yet Demonstrating
Pe
rce
nt
of
Stu
de
nts
50
50
0%
10%
20%
30%
40%
50%
60%
70%
80%
90%
100%
2014-15
Physical Development
Demonstrating Not Yet Demonstrating
Pe
rce
nt
of
Stu
de
nts
B 129
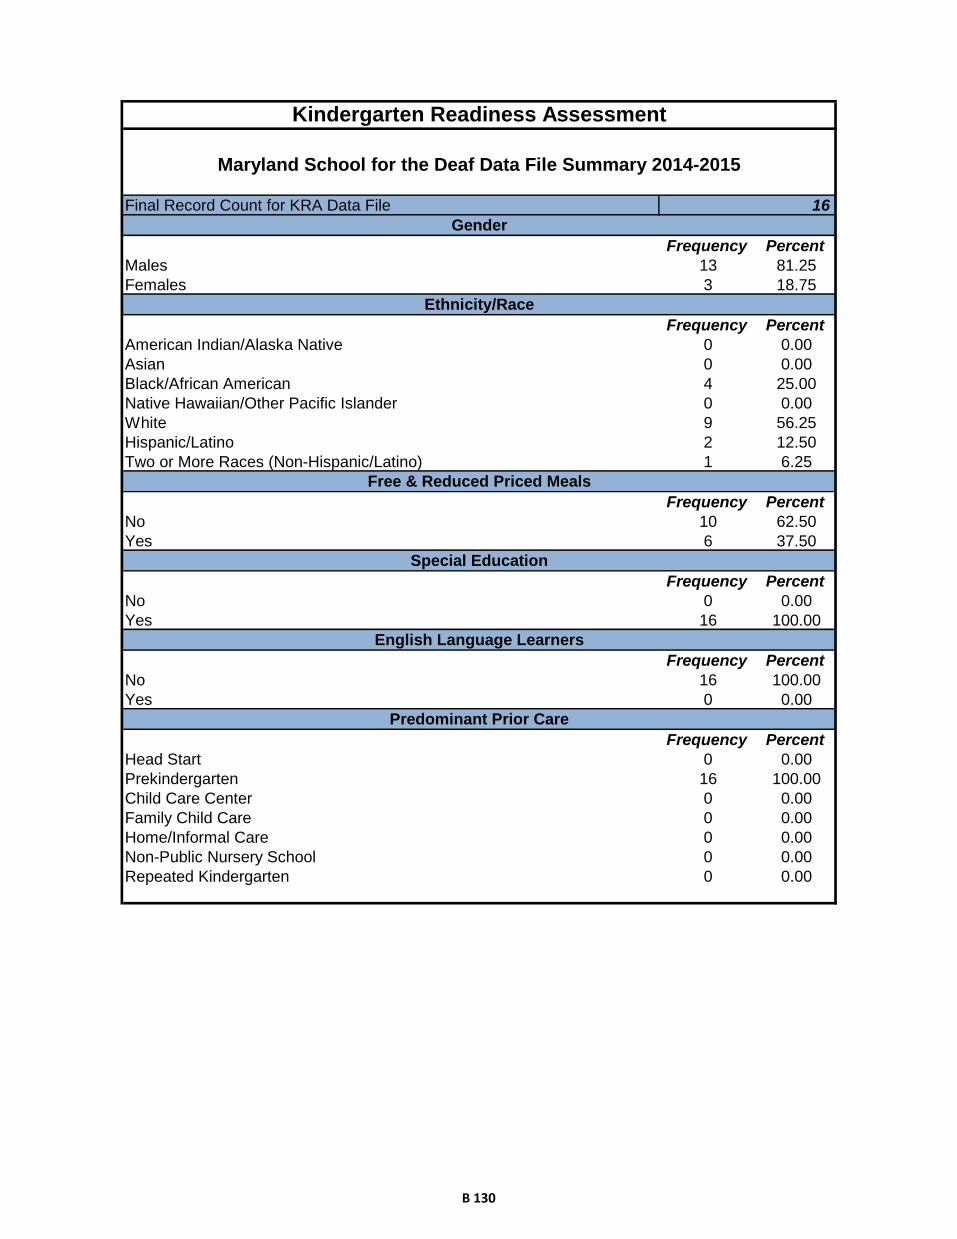
Frequency Percent
Males 13 81.25
Females 3 18.75
Frequency Percent
American Indian/Alaska Native 0 0.00
Asian 0 0.00
Black/African American 4 25.00
Native Hawaiian/Other Pacific Islander 0 0.00
White 9 56.25
Hispanic/Latino 2 12.50
Two or More Races (Non-Hispanic/Latino) 1 6.25
Frequency Percent
No 10 62.50
Yes 6 37.50
Frequency Percent
No 0 0.00
Yes 16 100.00
Frequency Percent
No 16 100.00
Yes 0 0.00
Frequency Percent
Head Start 0 0.00
Prekindergarten 16 100.00
Child Care Center 0 0.00
Family Child Care 0 0.00
Home/Informal Care 0 0.00
Non-Public Nursery School 0 0.00
Repeated Kindergarten 0 0.00
Special Education
English Language Learners
Predominant Prior Care
Final Record Count for KRA Data File 16
Kindergarten Readiness Assessment
Maryland School for the Deaf Data File Summary 2014-2015
Gender
Ethnicity/Race
Free & Reduced Priced Meals
B 130
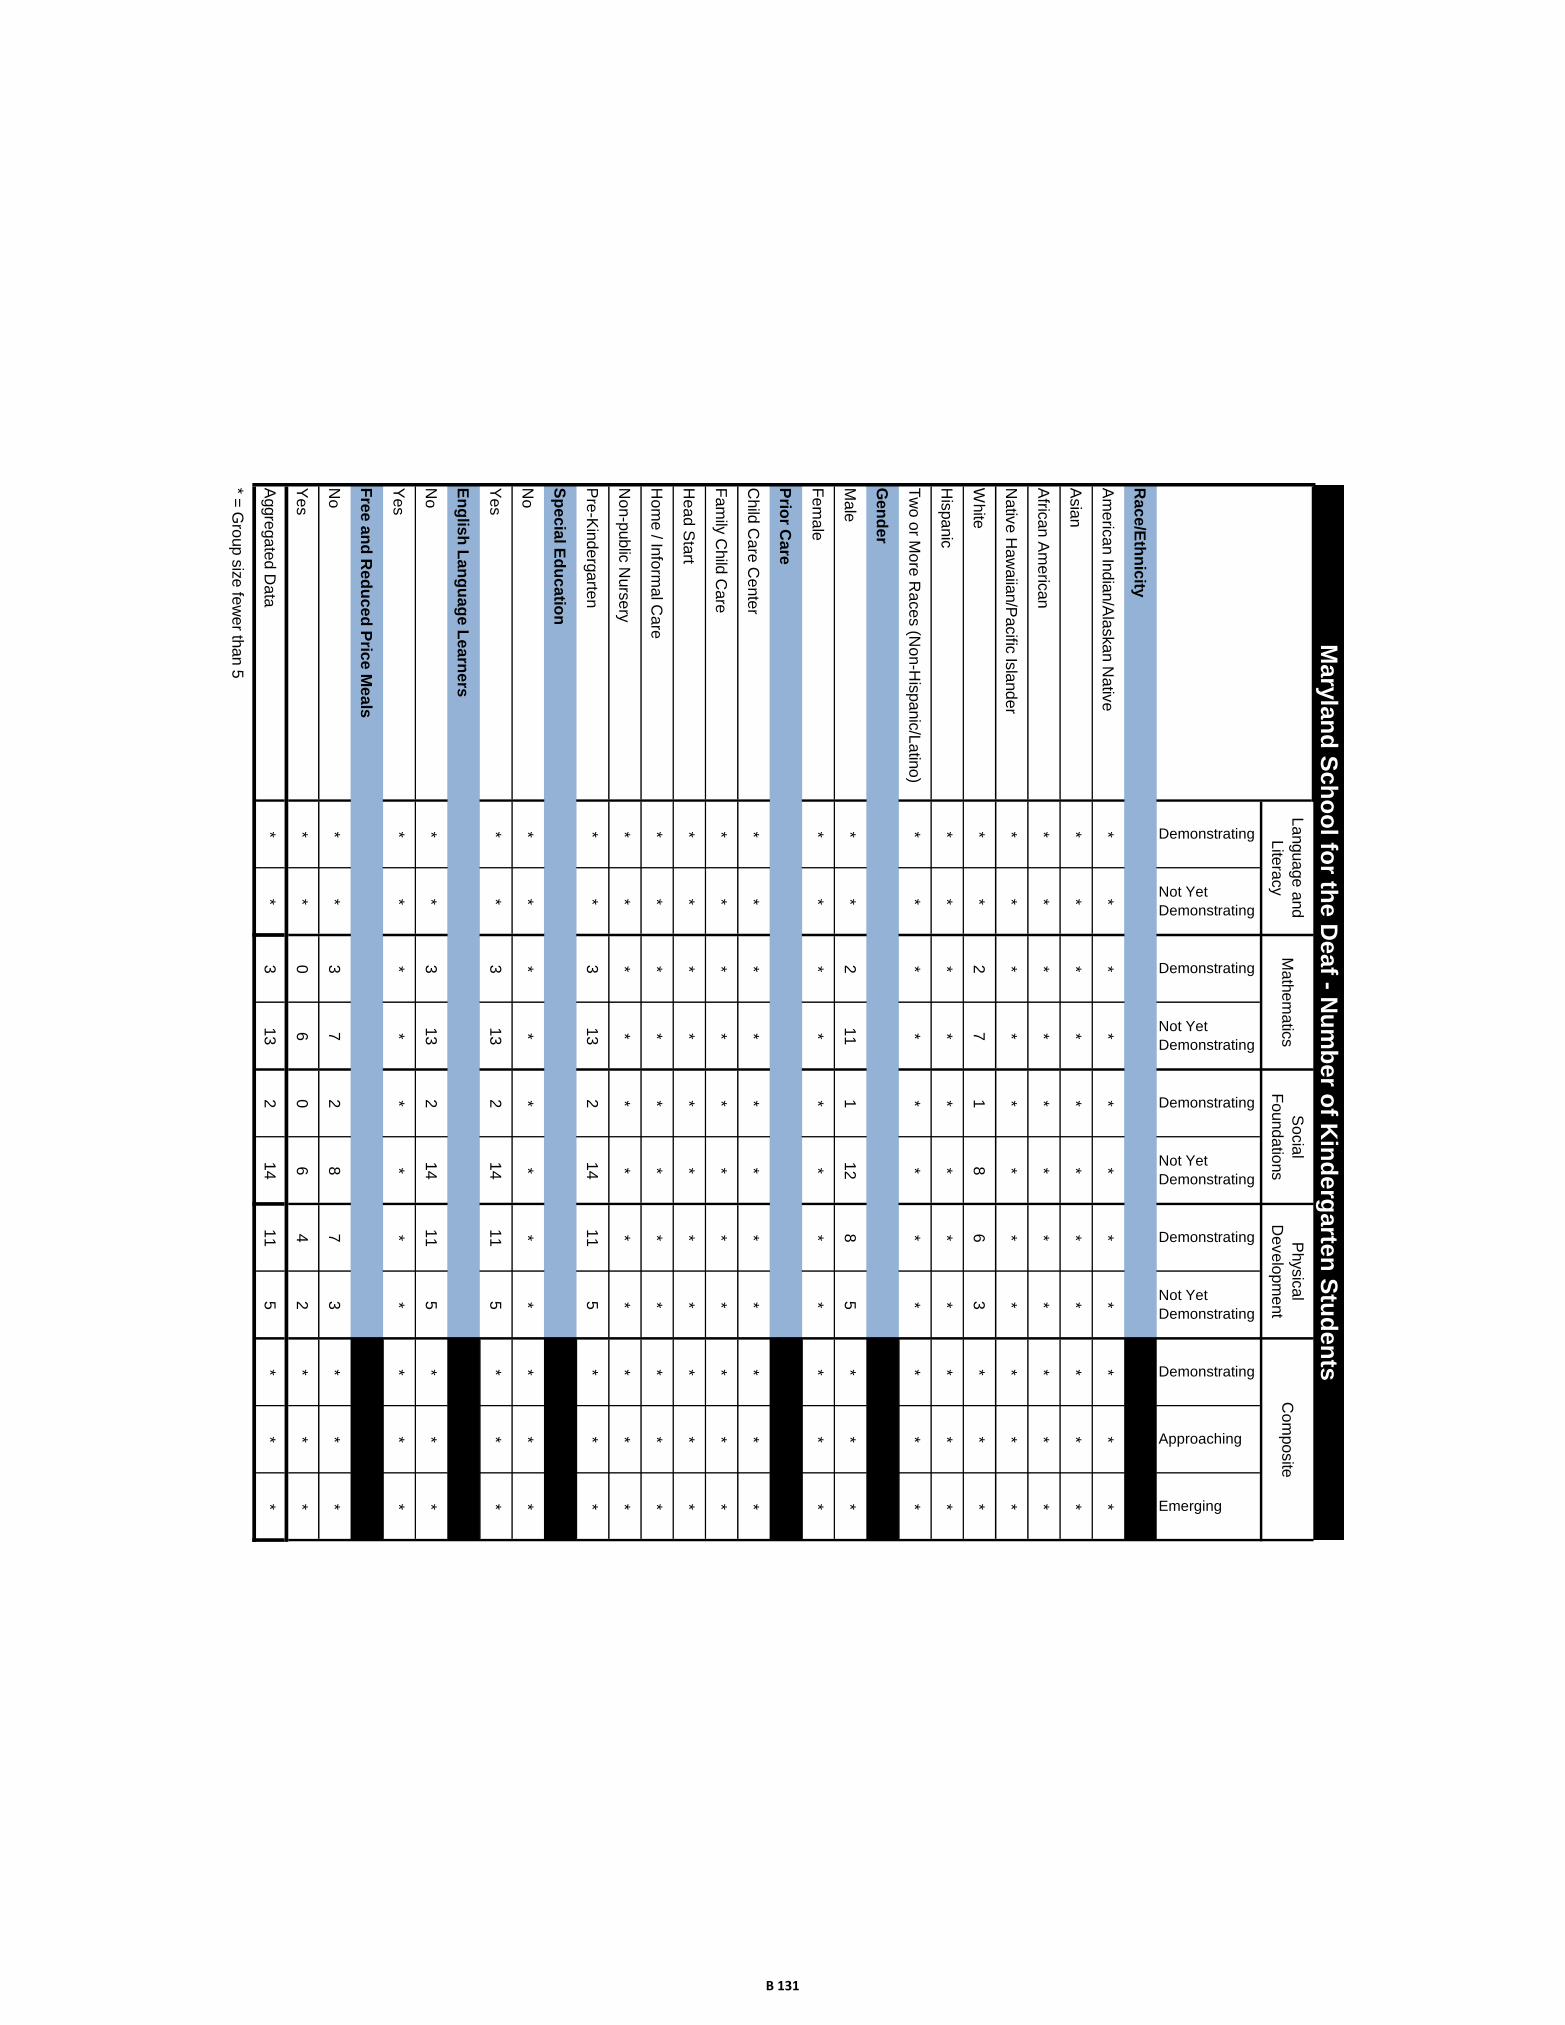
Demonstrating
Not Yet
Demonstrating
Demonstrating
Not Yet
Demonstrating
Demonstrating
Not Yet
Demonstrating
Demonstrating
Not Yet
Demonstrating
Demonstrating
Approaching
Emerging
Rac
e/E
thn
icity
Am
eric
an In
dia
n/A
laskan N
ativ
e*
**
**
**
**
**
Asia
n*
**
**
**
**
**
Afric
an A
meric
an
**
**
**
**
**
*
Nativ
e H
aw
aiia
n/P
acific
Isla
nde
r*
**
**
**
**
**
White
**
27
18
63
**
*
His
panic
**
**
**
**
**
*
Tw
o o
r More
Race
s (N
on-H
ispanic
/La
tino)
**
**
**
**
**
*
Gen
der
Male
**
21
11
12
85
**
*
Fem
ale
**
**
**
**
**
*
Prio
r Care
Child
Care
Cente
r*
**
**
**
**
**
Fam
ily C
hild
Care
**
**
**
**
**
*
Hea
d S
tart
**
**
**
**
**
*
Hom
e / In
form
al C
are
**
**
**
**
**
*
Non-p
ublic
Nurs
ery
**
**
**
**
**
*
Pre
-Kin
de
rgarte
n*
*3
13
21
41
15
**
*
Sp
ec
ial E
du
ca
tion
No
**
**
**
**
**
*
Yes
**
31
32
14
11
5*
**
En
glis
h L
an
gu
ag
e L
ea
rne
rs
No
**
31
32
14
11
5*
**
Yes
**
**
**
**
**
*
Fre
e a
nd
Red
uce
d P
rice
Mea
ls
No
**
37
28
73
**
*
Yes
**
06
06
42
**
*
Aggre
gate
d D
ata
**
31
32
14
11
5*
**
* = G
roup s
ize fe
wer th
an 5
Mary
lan
d S
ch
oo
l for th
e D
eaf - N
um
ber o
f Kin
derg
arte
n S
tud
en
ts
Socia
l
Founda
tions
Physic
al
Develo
pm
ent
La
nguage a
nd
Lite
racy
Math
em
atic
sC
om
posite
B 131

Demonstrating
Not Yet
Demonstrating
Demonstrating
Not Yet
Demonstrating
Demonstrating
Not Yet
Demonstrating
Demonstrating
Not Yet
Demonstrating
Demonstrating
Approaching
Emerging
Rac
e/E
thn
icity
Am
eric
an In
dia
n/A
laskan N
ativ
e*
**
**
**
**
**
Asia
n*
**
**
**
**
**
Afric
an A
meric
an
**
**
**
**
**
*
Nativ
e H
aw
aiia
n/P
acific
Isla
nde
r*
**
**
**
**
**
White
**
22
78
11
89
67
33
**
*
His
panic
**
**
**
**
**
*
Tw
o o
r More
Race
s (N
on-H
ispanic
/La
tino)
**
**
**
**
**
*
Gen
der
Male
**
15
85
89
26
23
8*
**
Fem
ale
**
**
**
**
**
*
Prio
r Care
Child
Care
Cente
r*
**
**
**
**
**
Fam
ily C
hild
Care
**
**
**
**
**
*
Hea
d S
tart
**
**
**
**
**
*
Hom
e / In
form
al C
are
**
**
**
**
**
*
Non-p
ublic
Nurs
ery
**
**
**
**
**
*
Pre
-Kin
de
rgarte
n*
*1
98
11
38
86
93
1*
**
Sp
ec
ial E
du
ca
tion
No
**
**
**
**
**
*
Yes
**
19
81
13
88
69
31
**
*
En
glis
h L
an
gu
ag
e L
ea
rne
rs
No
**
**
**
**
**
*
Yes
**
**
**
**
**
*
Fre
e a
nd
Red
uce
d P
rice
Mea
ls
No
**
30
70
20
80
70
30
**
*
Yes
**
01
00
01
00
67
33
**
*
Aggre
gate
d D
ata
**
19
81
13
88
69
31
**
*
* = P
erc
enta
ge c
ould
not b
e re
porte
d d
ue to
gro
up s
ize fe
wer th
an 5
Socia
l
Founda
tions
Physic
al
Develo
pm
ent
Com
posite
Mary
lan
d S
ch
oo
l for th
e D
eaf - P
erc
en
tag
e o
f Kin
derg
arte
n S
tud
en
ts
La
nguage a
nd
Lite
racy
Math
em
atic
s
B 132
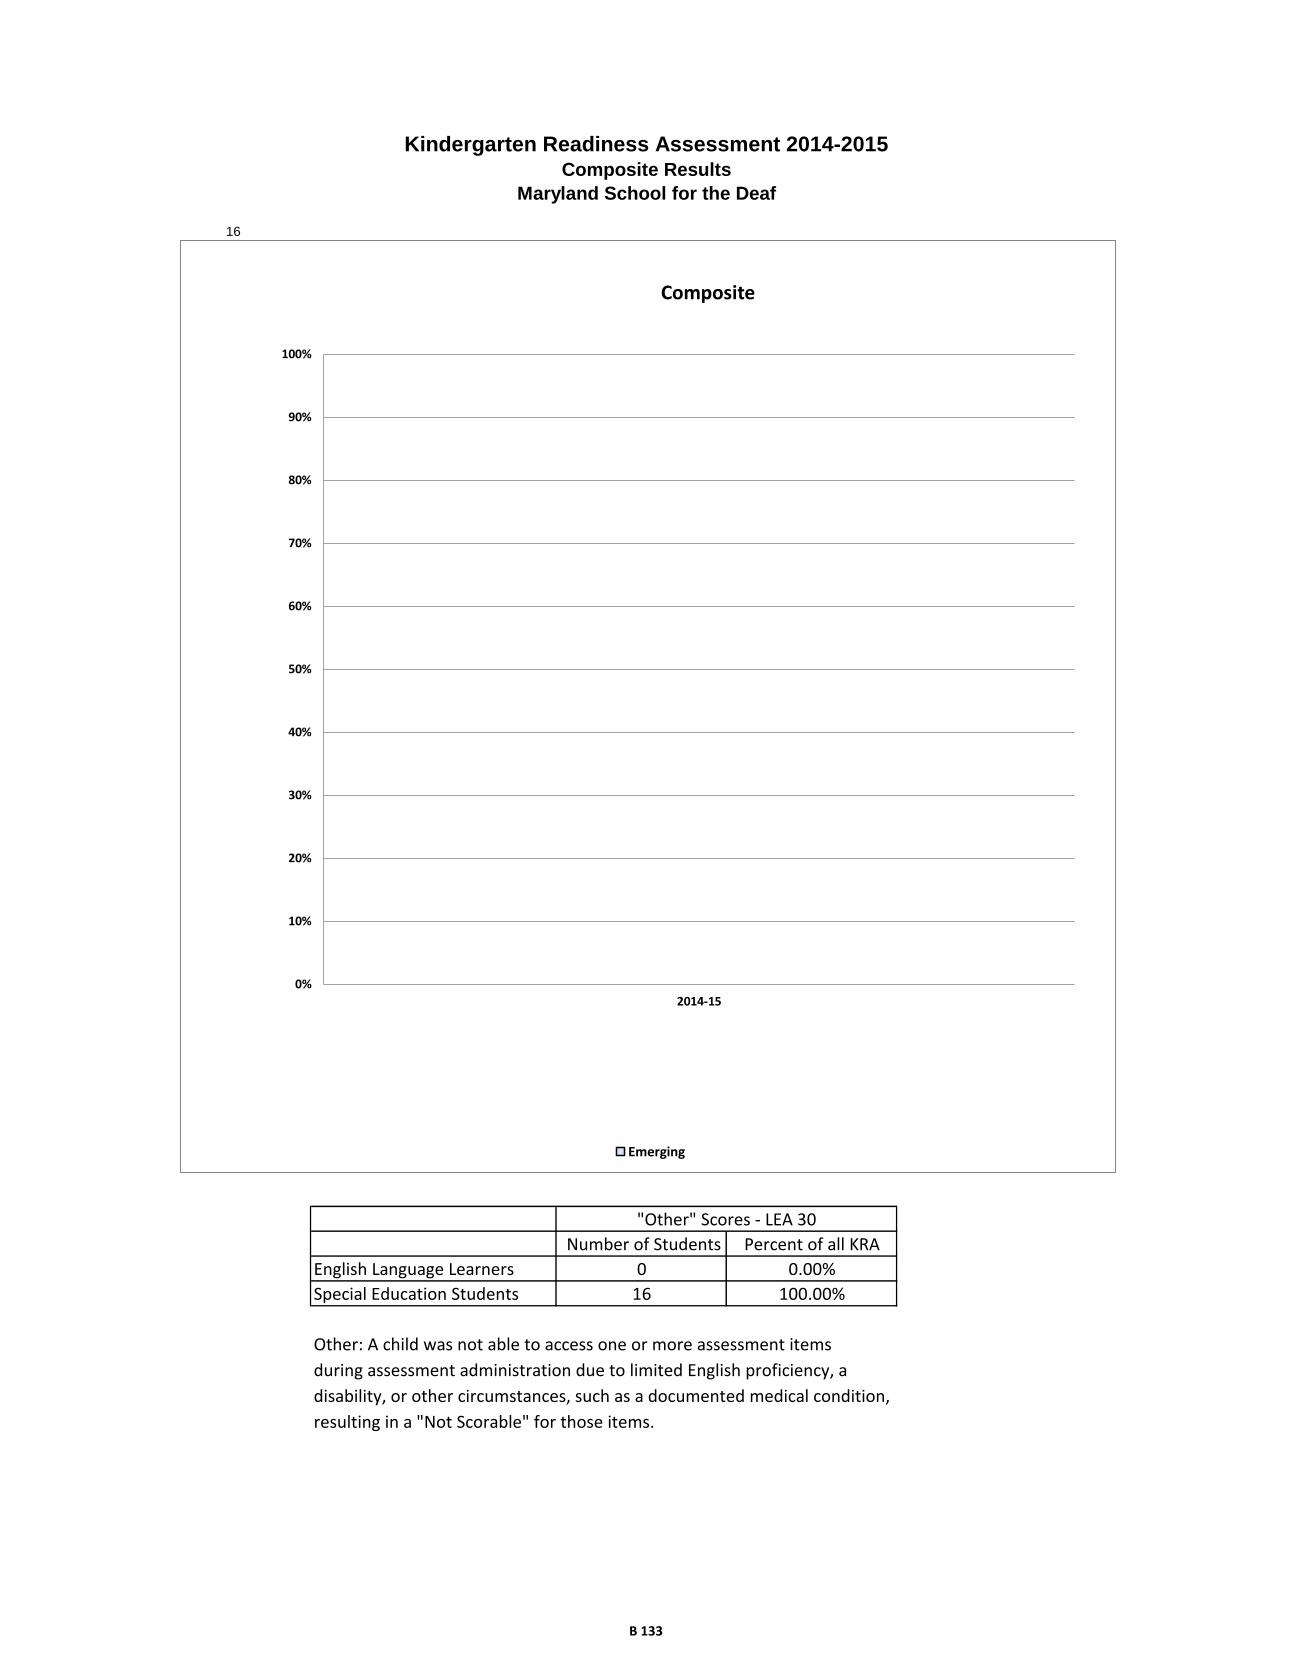
16
Other: A child was not able to access one or more assessment items
during assessment administration due to limited English proficiency, a
disability, or other circumstances, such as a documented medical condition,
resulting in a "Not Scorable" for those items.
100.00%
"Other" Scores - LEA 30
Number of Students Percent of all KRA
Kindergarten Readiness Assessment 2014-2015Composite Results
Maryland School for the Deaf
English Language Learners 0 0.00%
Special Education Students 16
0%
10%
20%
30%
40%
50%
60%
70%
80%
90%
100%
2014-15
Composite
Emerging
B 133
Kindergarten Readiness Assessment 2014-2015Domain Results
Maryland School for the Deaf
Pe
rce
nt
of
Stu
de
nts
19
81
0%
10%
20%
30%
40%
50%
60%
70%
80%
90%
100%
2014-15
Mathematics
Demonstrating Not Yet Demonstrating
13
88
0%
10%
20%
30%
40%
50%
60%
70%
80%
90%
100%
2014-15
Social Foundations
Demonstrating Not Yet Demonstrating
Pe
rce
nt
of
Stu
de
nts
69
31
0%
10%
20%
30%
40%
50%
60%
70%
80%
90%
100%
2014-15
Physical Development
Demonstrating Not Yet Demonstrating
B 134
C1
Appendix C
Individual Stakeholders, Group Participants and Testing Sites

C2
C3
National Technical Advisory Committee (facilitated by the Council of Chief State School Officers):
Jerry West, Ph.D., TAC Chair Senior Fellow, Mathematica Policy Research
Clancy Blair, Ph.D.
Professor of Applied Psychology, Steinhardt School of Culture Education and Human Development
Linda Espinosa, Ph.D.
Lead Consultant, Best practices for young dual language learners California State Department of Education
Daryl B. Greenfield, Ph.D
Professor of Psychology & Pediatrics, Department of Psychology University of Miami
Dr. Ilonca Hardy
Department of Education, Goethe University Kathleen Hebbeler, Ph.D.
Program Manager, Community Services and Strategies SRI International
Nancy Jordan, Ed.D.
Professor of Education, University of Delaware Laura Justice, Ph.D.
Lab Director, Preschool Language and Literacy Research Lab Ohio State University
Sharon Lynn Kagan, Ed.D.
Professor of Early Childhood and Family Policy Co-Director of the National Center for Children and Families, Teachers College, Columbia University
Robert Lissitz, Ph.D.
Professor of Education, University of Maryland Catherine Scott-Little, Ph.D.
Associate Professor, Human Development and Family Studies School of Human and Environmental Sciences, University of North Carolina at Greensboro
C. Cybele Raver, Ph.D.
Professor of Applied Psychology Steinhardt School of Culture Education and Human Development
Ross Thompson, Ph.D.
Distinguished Professor University of California, Davis
C4
State and Local Advisory Council Members:
NAME ORGANIZATION
Ader-Soto, Chris Vice President , Children and Family Services and Community Development YMCA of Central Maryland
Albertsen, Randi Owner, Innovations in Education LLC
Bacquie, Janine Director of Early Childhood, Montgomery County Public Schools
Blank, Dee Supervisor of Early Childhood, Allegany County Public Schools
Bonanni, Diane Coordinating Supervisor, Early Childhood, Prince George’s County Public Schools
Brown, Laura MMSR Trainer
Burroughs-Campbell, Shannon
Executive Director, Baltimore City Head Start Mayor’s Office of Human Services
Claros, Renata Executive Director, Centronia
Clark, Georgia Executive Director for Elementary School Education, Cecil County Public Schools
Cockey, Michael Independent Consultant
Coleman, Leslie Kiddie Academy
Corwin, Louise Ready At Five
Davis, Lisa Coordinator, Early Childhood Programs, Howard County Public School system
Franklin, Althea MMSR Trainer
Gee, Flora Director, Greenbelt Children’s Center
Grafwallner, Rolf (Dr.) MSDE, Assistant State Superintendent, DECD
Holman, Kay (Dr.) Assistant Professor, Department of Special Education, Towson University
Huffman, Sharon Director, Project ACT, Abilities Network
Hussey-Gardner, Brenda (Dr.)
Assistant Professor, School of Medicine, University of Maryland
Iannone-Campbell, Charlene
Director of Early Learning, Baltimore City Public Schools
C5
NAME ORGANIZATION
Jones, Vanessa MSDE/Credentialing Branch
Jost, Tracy MD Association for the Education of Young Children
McGinnity, Mark Licensing Supervisor, Office of Child Care
Nelson, Cathy EC Consultant – ELL
Nizer, Jennifer Director, Child Development Center, Johns Hopkins Bayview Medical Center
Otto, Tamara Sr. Program Coordinator/Instructor, JHU/CTE
Owens-Burton, Nadine Acting Executive Director, Maryland Head Start Association
Rice-Doran, Patricia (Dr.)
Assistant Professor of Special Education, College of Education, Towson University
Richman, Laila (Dr.) Assistant Professor, Department of Special Education, Towson University
Rohde, Steve Deputy Director, Maryland Family Network
Schultz , David (Dr.) Associate Professor, University of Maryland Baltimore County
Singleton, Alicia MSDE/DECD, Research Analyst
Smith, Jena MSDE/Credentialing Branch
Smith, Jenaya MSDE/Early Learning Branch, Early Learning Specialist
Suguiyama, Laura Director, Calvary Weekday School
Taru, Nira C. (Dr.) Associate Professor, Morgan State University
Teat, Regina Early Childhood/Elementary Supervisor, Dorchester County Public Schools
Treakle, Janice MSDE/Early Learning Branch, MMSR Coordinator
Vacca, Monica MMSR Trainer
Vorobey, Nancy Section Chief, Early Education, Division of Special Education/Early Intervention Services
Walker, Judy MSDE/Early Learning Branch, Early Learning Specialist
C6
Multi-partner Leadership Teams:
Sophie Hubbell Asst. Director, Early Learning Ohio State Dept. of Education Wendy Grove Director, Early Learning Ohio State Dept. of Education Stephanie Siddens Senior Executive Director Ohio State Dept. of Education Rolf Grafwallner Assist. State Superintendent Maryland State Dept. of Education
Judy Walker Early Learning Branch Chief Maryland State Dept. of Education Candy Miller Assessment Specialist Maryland State Dept. of Education Robert Wagner Education Program Specialist Maryland State Dept. of Education Marcella Franczkowski Assist. State Superintendent Maryland State Dept. of Education
Nancy Vorobey Section Chief Maryland State Dept. of Education Jackie Nunn Director, JHU-CTE John’s Hopkins University, CTE Christopher Sessums R4K Program Manager John’s Hopkins University, CTE Tamara Swanson-Otto Research Coordinator John’s Hopkins University, CTE
Angela Vann Program Administrator, Prof. Dev. John’s Hopkins University, CTE Dave Peloff Senior Program Director, Tech John’s Hopkins University, CTE Linda Carling Program Director, Online Learning John’s Hopkins University, CTE Kristen Thompson Technology Program Coordinator John’s Hopkins University, CTE
Andrew Latham Director (WestEd – ASDS) WestEd Matt Brunetti Project Manager (WestEd – ASDS) WestEd Joanne Jensen Associate Director of Assessment WestEd Ann Appert Associate Director, Planning & Resource WestEd
Jessica Goldstein Assistant Professor in Residence Connecticut Depart. of Education Harriet Feldlaufer Director, CT Office of Early Childhood Connecticut Depart. of Education Michelle Levy Consultant, CT Office of Early Childhood Connecticut Depart. of Education
Accessibility and Accommodations Workgroups for Special Populations:
Students with Disabilities
Jackie Nunn (John’s Hopkins University, Center for Technology in Education)
Amy Nicholas (John’s Hopkins University, Center for Technology in Education)
Kristie Pretti-Frontczak (John’s Hopkins University, Center for Technology in Education
Consultant)
Marcella Franczkowski (Maryland State Department of Education)
Nancy Vorobey (Maryland State Department of Education)
Trinell Bowman (Maryland State Department of Education)
Karen Andrews (former Maryland State Department of Education)
Sophie Hubbell (Ohio State Department of Education)
C7
Barbara Weinberg (former Ohio State Department of Education)
Katrina Bush (Ohio DODD)
Cathy Nelson (Maryland State Department of Education Consultant ELL Specialist)
Stakeholder and Expert Ad Hoc Committee Members:
Maryland Bias and Sensitivity Review Committee Members
Ellen Abramson (MMSR, VIOLETS, SEFEL, Preschool Sp Ed Trainer)
Margo Sipes, Downtown Baltimore Child Care, Inc.
Diane Bonanni, Prince George’s County Public Schools
Fiora Gee, Greenbelt Children’s Center
Cathy Nelson, Maryland State Department of Education Consultant ELL Specialist
Michelle Daley, Maryland State Department of Education
Sharon Huffman, Abilities Network
Maria del Rosario Basterra, The Mid Atlantic Equity Center
Maryland Item Content Review Committee Members
Diana Latane, Carroll County Public Schools, Kindergarten Teacher
Lisa Davis, Howard County Public Schools
Tina Diaduk, the Promise Resource Center, Previous Preschool Teacher
Bonnie Belsinger, Baltimore County Public Schools, Early Childhood Resource Teacher
Laura Brown, Howard County Public Schools, Kindergarten Teacher
Tracy Jost. MDAEYC, President/Owner Kid’s Campus Early Learning
Laila Richman, Towson University
Amy Nicholas, John’s Hopkins/CTE
Mike Mason, Maryland State Department of Education
Brad Weiner, Prince George’s County
Beth Chalk, St. Mary’s County, Pre-K Teacher
Assessment Implementation, Professional Development, & Technology Subgroup Committee
Members
Laura Brown, Howard County Public Schools, Kindergarten Teacher & MMSR Trainer
Bonnie Belsinger, Baltimore Co. EL, Resource Teacher & MMSR Trainer
Dianne Hann, Robert Mot. Elementary
Flora Gee, Director, Greenbelt Children’s Center
C8
Stacie Burch, Assistant Director TEACH Institute,
Karla Bressant, Division of Assessment, Maryland State Department of Education
Christina Peusch, MSCA
Terry Bridger, Prince George’s County Community College
Kathleen Mooney, Division of Instruction, Maryland State Department of Education
Jenaya Smith, Division of Early Childhood Development, Maryland State Department of Education
Maryland Special Populations Committee Subgroup Members
Cathy Nelson, MSDE, Specialist ELL, Division of Instruction
Diana Latane, Kindergarten Teacher, Carroll County Public Schools
Maria del Rosario Basterra, Deputy Director, The Mid Atlantic Equity Center
Pam Mesta, Carroll County
Michelle Daley, MSDE, Special Education
Nancy Vorobey, MSDE, Special Education
Amy Nicholas, John’s-Hopkins Center for Technology in Education
Diane Bonanni, Coordinating Supervisor, Early Childhood, PGCPS
Sonia Hernandez, Montgomery County Community College
Candy Miller, Assessment Specialist, MSDE, Division of Early Childhood Development
Maryland KRA Pilot Test Schools:
Baltimore Montessori Public Charter School Baltimore
Moravia Park Elementary Baltimore City
Cool Spring Elementary Prince George’s
Rose Valley Elementary Prince George’s
Clinton Grove Elementary Prince George’s
Glenn Dale Elementary Prince George’s
Funkstown Elementary Washington
Waverly Elementary Howard
Talbot County Judy Center Easton Elementary Talbot
Accident Elementary Garrett
Broad Ford Elementary Garrett
Crellin Elementary Garrett
Friendsville Elementary Garrett
Grantsville Elementary Garrett
C9
Route 40 Elementary Garrett
Yough Glades Elementary Garrett
Maryland KRA Field Test Schools:
Beall Elementary (Title 1) Allegany
Beaver Run Elementary (Title 1) Wicomico
Bester Elementary (Title 1) Washington
Bradbury Heights ES Prince George's
Carter G Woodson Elementary (Title 1) Somerset
Cecil Elementary (Title 1) Baltimore City
Centenial Lane Howard
Centreville Elementary Queen Anne's
Deal Island Elementary (Title 1) Somerset
Deep Run Elementary (Title 1) Howard
Eva Turner Elementary (Title 1) Charles
Ferndale Early Education Center (Title 1) Anne Arundel
Grasonville Elementary (Title 1) Queen Anne's
Greensboro Elementary (Title 1) Caroline
Greenwood Elementary (Title 1) Somerset
Hawthorne Elementary (Title 1) Baltimore County
Hurlock Elementary (Title 1) Dorchester
Lexington Park Elementary (Title 1) St. Mary's
Mary Ann Winterling Elementary (Title 1) Baltimore City
Park Hall Elementary (Title 1) St. Mary's
Parr's Ridge Elementary Carroll
Prince Street Elementary (Title 1) Wicomico
Rockledge ES Prince George's
South Penn Elementary (Title 1) Allegany
Spring Ridge Elementary Frederick
Villa Cresta Elementary Baltimore County
Waverly Elementary Howard
Winter Street Elementary (Title 1) Washington
C10
Maryland KRA VPA Field Test Sites:
Villa Cresta Baltimore County
Hurlock Elementary Dorchester
Park Hall Elementary St. Mary’s
Rockledge Elementary Prince George’s
Waverly Elementary Howard
Bester Elementary Washington
Beall Elementary Allegany
Spring Ridge Elementary Frederick
Eva Turner Elementary Charles
Maryland KRA Teacher Standard Setting and Focus Group Members:
Chelsea Massa (Anne Arundel County) – Kindergarten teacher
Sharon Mattoon (Anne Arundel County) – Kindergarten teacher
Rachel Pasko (Baltimore City) – Kindergarten teacher
April Terrell (Baltimore City) – Academic Content Liaison
Jacqueline Dye (Baltimore County) – Kindergarten teacher
Allyson Sealfon (Carroll County) – Kindergarten teacher
Donna Greenleaf (Dorchester County) – Early Childhood Supervisor
Laura Brown (Howard County) – Kindergarten teacher
Carol Cavanaugh (Howard County) – Kindergarten teacher
Kendra Sarris (Prince George’s County) – Kindergarten teacher
Andreia Searcy (Prince George’s County) – Early Childhood Supervisor
Maryland KRA Work Group:
Lauren Blackmon (Frederick County) – Kindergarten teacher
Kember Kane (Montgomery County) – Kindergarten teacher
Sandy Grulich (Cecil County) – Early Childhood Supervisor
Cathy Nusbaum (Frederick County) – Early Childhood Supervisor
Michele Baisey (Frederick County) – Teacher Specialist for Early Childhood
Kathy Griffin (Harford County) – Early Childhood Supervisor
Carol Cavanaugh (Howard County) – Kindergarten teacher
Erinn Eifler Hull (Baltimore City) – Educational Associate
April Terrell (Baltimore City) – Academic Content Liaison
C11
Emmajane Olinde (Wicomico County) – Lead Teacher for Early Childhood Programs
Allyson Sealfon (Carroll County) – Kindergarten teacher
Chelsea Massa (Anne Arundel County) – Kindergarten teacher
Jackie Dye (Baltimore County) – Kindergarten teacher
Sharon Mattoon (Anne Arundel County) – Kindergarten teacher
Deborah Marquez (Maryland School for the Deaf) – Early Childhood Supervisor
Kendra Sarris (Prince George’s County) – Kindergarten teacher
Laura Brown (Howard County) – Kindergarten teacher
Bonnie Belsinger (Baltimore County) – Langauge Arts Resource Teacher
Andreia Searcy (Prince George’s County) – Early Childhood Supervisor
Robert Wagner (Maryland State Department of Education) – Education Program Specialist
D1
Appendix D
Frequently Asked Questions

D2
D3
FREQUENTLY ASKED QUESTIONS
Kindergarten Readiness Assessment (KRA) Q&A ASSESSMENT OVERVIEW Why is assessment important? Understanding children’s developmental characteristics as they enter school, and the types of early experiences that are linked to school success, is vital to all of Maryland’s education stakeholders, including early care and education providers, teachers, policymakers, community leaders, and families, among others. Assessing students at the start of kindergarten is one way to understand children’s individual developmental strengths and challenges. It can also help stakeholders strategically address the preparedness of all children for the challenges of subsequent grades.
Who is assessed with the Kindergarten Readiness Assessment? Maryland is requiring all kindergarten students in public schools to participate. (COMAR 13A.08.01.02-3) Who can be trained to administer the KRA? All public elementary schools in Maryland are responsible for administering the KRA. It is required that the KRA be administered by teachers who are employees of the school system and hold a teaching license/certificate/permit issued by the MSDE. The following categories of teachers are trained (certified) to administer the KRA:
General education K educators: General education kindergarten educators.
Self-contained specialized educators: Specialized educators who teach in self-contained
classrooms exclusive to kindergarten students or may contain kindergarten students.
K inclusion specialized educators: Specialized educators who co-teach in a
kindergarten classroom the entire day.
It is important to note that specialized educators who provide supports to Kindergarten students on an IEP are not being certified in the administration of the KRA for Fall 2014.
What training is required to administer the KRA? Prior to the administration of the KRA Field Test, every teacher that administered the test participated in professional development that reviewed the administration procedures, including a review of the item types, navigation and use of the Online Reporting System (ORS), and use of the allowable student supports for administration. Further, the Electronic Learning Community (ELC), developed by JHU-CTE, and Help Desk were available throughout the administration window to provide additional support to the teachers, if needed.
D4
Any teacher who assesses children using the KRA must participate in the required MSDE training. The required training consists of the following components:
• 2 days of face-to-face training or blended face-to-face training with online modules;
• Additional online training modules that may include technology updates;
• Access to the http://maryland.kready.org
After completion of the required training components, teachers must take two assessments, one related to content and one related directly to administration and delivered via simulation activities. Teachers must pass both assessments with a score of 80 percent or better to be certified to administer the KRA to students.
When is the KRA administered? The assessment window begins at the beginning of the school year and closes November 1st. 1 Can parents opt out of having their child take the KRA? No. This is a statewide assessment given to all kindergarten students as part of the instructional program.
What is the purpose of the Kindergarten Readiness Assessment (KRA)? The purpose of the KRA is to support and advance children’s early learning and academic achievement. The data collected will be used to:
• Inform prior education and care stakeholders • Identify individual children’s needs and direct teachers recommended supports for
children • Assist teachers in data-driven instructional decision making at the school and classroom
level • Provide families with information about their children’s learning and development
How many standards are assessed in the KRA? The KRA assesses 28 standards in four domains of learning: Social Foundations, Language and Literacy, Mathematics, and Physical Development and Well-Being. How does the KRA compare with the prior kindergarten assessment used in the State (MMSR – Maryland)? The KRA is based on a set of common language standards which are aligned with the Maryland College and Career-Ready Standards for kindergarten. The MMSR was based on the Maryland
1 Due to delays in the beginning of the school year, the test window for the 2014-2015 administration was moved to November 8th.
D5
State Curriculum. The new standards are more challenging and hold higher curricular expectations compared to the old standards. How does the KRA differ from the MMSR? The KRA builds on the strengths of the MMSR – namely observations and portfolios of children’s work but also incorporates direct or performance-based assessments. It includes child-friendly technologies, such as touchscreen technology, with the intent to make the activities as appealing to young children as possible. Teachers also have flexibility about when they carry out KRA assessments as long as they do so during the assessment window.
What type of assessment formats are included in the KRA? There are three item types on the KRA: selected response, performance tasks, and observational rubrics. Teachers have the ability to add comments and upload artifacts to document students’ growth in learning and to facilitate communication with parents and families. With a seven to eight week assessment window for the KRA, does it matter when teachers assess the students? The assumption of an assessment window is that the first day of assessment equals the last one. The need for incoming kindergarteners’ adjustment to the school routine, their developmental range, and the nature of the assessment are the main reasons for such a long assessment window. Will schools be held accountable for children who do poorly on the KRA? No. School systems receive kindergartners with a variety of previous learning experiences. The KRA results will inform not only teachers, but also policymakers and program administrators about general trends of incoming kindergarteners’ school readiness skills and help create policies and programs that support children before they start kindergarten. The information will be part of the state’s longitudinal data system. TECHNOLOGY What was used to administer the KRA? All data entry is electronic. The assessment can be accessed through wired internet connections on Maryland.kready.org/olms/R4K.
A hard copy version of the assessment was made available, via kits, to teachers who had no computer or similar devices for internet access. While the hard copy versions could be used with students in the classroom, all teachers were responsible for entering data electronically, including transferring data from hard copy versions of the assessment to the KRA system online.
D6
IMPLEMENTATION Who administers the KRA? The KRA is a standardized assessment that requires a qualified teacher to administer the assessment to students. The teacher must be fully trained by someone who successfully completed the training given by Johns Hopkins University-Center for Technology in Education. How long does the KRA take to administer? The KRA takes approximately one (1) hour per student to administer over a 7-8 week period. What type of data will teachers, schools, and districts receive from the KRA? The assessment technology features a reporting system that provides teachers with in Individual Student Report (ISR). Assessment information is being reported overall and by domain at the school, class, student level. How are teachers trained to administer the KRA? Teachers receive online and/or face-to-face training on the administration of the KRA. The training modules are organized around pre-administration, administration, and post-administration topics. How will teachers find out what students know and are able to do? Interpreting assessment data is included in the administration and post-administration training modules. Teachers receive information and resources on using the Online site to gather student performance data as part of the administration module. Using the data to inform instruction forms the basis of the post-administration module. How will teachers share assessment information with parents? Post-administration training modules will guide teachers in communicating assessment results to parents and families, including helping families understand their child’s performance on the KRA.2
Observations can be subjective. How does the KRA fix that? With the KRA, the assessment information of groups of students is shared with others and requires, therefore, a set of objective criteria for observing. The KRA includes three features that increase the objectivity of rating items in accordance with standard assessment practices:
• A required simulation test as part of the teacher training to establish inter-rater reliability; • Selective response and performance task items; • Observational rubrics that define learning situations.
2 Teachers inform parents about the KRA during the regular parent-teacher conferences. This process is more streamlined after standard setting is completed.
D7
SPECIAL EDUCATION Does Maryland require the participation of all students with disabilities on the Kindergarten Readiness Assessment (KRA)? Yes. Maryland is requiring all students to participate, following the decision-making process, to be implemented by the child’s instructional team, for item administration outlined in the Guidelines on Allowable Supports (Guidelines) document. A quick guide version of the Guidelines document is also included in the KRA kit. Will all items be administered to students with disabilities? When following the decision-making process for administering the KRA to a student with a disability, there may be instances when the teacher is advised to pause the administration of a domain. This is advised when the student is not able to access three items in a domain given allowable supports (e.g., three items are “Not Scorable;” not necessarily three consecutive items). In such cases, the student’s instructional team should review the remaining items in the domain and determine whether or not any of them could be administered with allowable supports (e.g., UDAs or “Level the Field” supports) that would result in a score. Which members of the student’s instructional team can be trained on the KRA to provide input on decision-making? Currently, the following categories of teachers are being certified in administering the Kindergarten Readiness Assessment (KRA). KRA online modules will be made available for the student’s instructional team to access for additional information related to administration procedures and the Guidelines document.
• General education Kindergarten educators. • Self-contained specialized educators: Specialized educators who teach in self-contained
classrooms exclusive to Kindergarten students or may contain Kindergarten students. • K inclusion specialized educators: Specialized educators who co-teach in a Kindergarten
classroom the entire day.
It is important to note that specialized educators who provide supports to Kindergarten students on an IEP are not being certified in the administration of the KRA for Fall 2014.
Are supports available to all students? Which supports are unique to students with disabilities? All students, including students with disabilities and English language learners (ELL), can benefit from accessing Universally Designed Allowances (UDAs). The basic premise of the UDAs is to support all learners accessing and responding to the KRA, and to eliminate the greatest number of barriers possible, while maintaining valid and reliable results that can be interpreted confidently. These allowances are aligned to best practices for access to instruction and assessment for all young learners. Even with the use of UDAs, a student’s instructional team may decide to provide additional individualized supports to students with disabilities. For the purposes of the KRA administration,
D8
the use of such individualized strategies has been identified as “Level the Field” supports. “Level the Field” supports provide equal access and opportunity for participation in the assessment without substantially altering what the student is expected to do or impacting the validity or reliability of assessment results. “Level the Field” supports are unique to students with disabilities and ELLs. What constitutes "not within a student's abilities" to access the KRA items? Some items may not be within a student’s abilities given any allowable support. Therefore, the item is “Not Scorable.” Will the “Not Scorable” option be available to observational items? Yes, a student can receive a score of “Not Scorable” on all items, including observational items. What is the difference between the score of “0” and “Not Scorable”? “No Score” means the teacher was not able to score the item because the student could not access it given allowable supports. A score of “0” means the student was able to access the item, but did not demonstrate the skill according to the scoring criteria. Teachers are not advised to pause administration of a domain after three scores of “0,” unless there are other reasons to do so (e.g., student fatigue, scheduling/time constraints). ENGLISH LANGUAGE LEARNERS How are entering kindergarten students identified as English language learners (ELLs)? If a language other than or in addition to English is spoken in the home, the student’s English proficiency is measured based on the results of the listening and speaking portions of the KWAPT created by the WIDA Consortium. Typically, the KWAPT is the screening instrument used for kindergarten students as they were registered in order to identify students who potentially qualify for ESOL services in kindergarten.
• If the student attended a public pre-K during the previous school year, he/she may have been screened during the spring of their pre-K year.
• If you do not know who your ESOL teacher or contact is, check with your school’s principal, testing coordinator, or the person in the school systems ESOL Office.
• If you are an ESOL teacher assigned to an elementary school, collaborate with the school’s staff to schedule the administration of the listening and speaking portions of the KWAPT to potential ELLs. Meet with the kindergarten teacher(s) in order to share the KWAPT results.
Who should receive Level the Field support? (Level the Field supports should be considered for each student and each assessment item separately. It is quite possible that a student may need the support in some but not all items.)
• ELLs with Beginning (Low) English Language Proficiency –corresponds to a raw score of 0-10 on the KWAPT Listening and Speaking Conversion Table that is used for
D9
screening to determine a student’s eligibility for ESOL services. ELLs at the beginning (low) level of English language proficiency tend to have the greatest need for supports. These students may be able to respond with gestures to songs, chants, or stories modeled by teachers and typically are able, at most, to answer questions with only one or two words in English.
• ELLs with Intermediate (Mid) English Language Proficiency –corresponds to a raw score of 11-18 on the KWAPT Listening and Speaking Conversion Table. ELLs at the intermediate (mid)level typically have developed some proficiency in English (e.g., able to act out songs and stories using gestures and possibly retell short narrative stories through pictures; repeat sentences from rhymes and patterned stories).
Who should not receive Level the Field supports? • ELLs with Advanced (High) English Language Proficiency -corresponds to a raw
score of 19-28 on the KWAPT Listening and Speaking Conversion Table. ELLs at the advanced (high) English language proficiency level would be expected to have less of a need for assistance with understanding the assessment items. For example, these students are able to order pictures of events using sequential language, arrange objects or pictures according to descriptive oral discourse, and tell original stories with emerging detail.
How does the KWAPT raw score relate to the Oral Proficiency Score?
Listening and Speaking Conversion Table on the KWAPT
Raw Score Oral Proficiency Score 0 – 10 Low - Beginning 11 – 18 Mid - Intermediate 19 – 28 High - Advanced 29 – 30 Exceptional – Not considered an
ELL How should we interpret the results of the KRA for an ELL? It is important to consider the results of the KRA in the context of each ELL’s English proficiency level at the time the assessment is given. The lower the student’s proficiency in English the more difficult it is to measure what skills the student may already have acquired in his or her home language. If a school team determines the need for an ELL to be placed in an intervention, it is important that it is appropriate for his/her level of English proficiency level and the student has sufficient English skills to benefit from the intervention. Decisions can be addressed by a team of educators that includes the student’s teacher and an ESOL professional as well as the student’s family.
D10
Should the student’s family be involved? It would be very helpful to have input from the student’s family regarding the development of the student’s home language as well as input from the classroom teacher on how the student is adapting to the kindergarten setting. Many families of ELLs are not familiar with the United States’ educational system; it’s critical to provide outreach to these families so they understand what the assessment is measuring and how the results will be used.
Can an ESOL teacher administer the KRA? Yes, an ESOL teacher can administer the KRA as long as he/she has received training by the local school system’s staff trained by Johns Hopkins University Center for Technology in Education. This training provides all details necessary for administering, scoring, and interpreting the KRA’s results.


![Building Institutional Learning Outcomes Readiness › overview › ... · Faculty Retreat Spring. 5 Readiness on the ground: ... Result of Gen Ed Reflection Process: 1] Confirmation](https://img.pdfslide.us/doc/110x75/5f266be306c7df1d533c6cc6/building-institutional-learning-outcomes-readiness-a-overview-a-faculty.jpg)

![Cody Critical Audit Matters MacroedCODY_CRITICAL_AUDIT_MATTERS_MACROED.DOCX (DO NOT DELETE) 5/21/2018 5:58 PM Ed 2] Critical Audit Matters: Improving Disclosure Through Auditor Insight](https://img.pdfslide.us/doc/110x75/60092f958166892de3744eb1/cody-critical-audit-matters-macroed-codycriticalauditmattersmacroeddocx-do.jpg)