Embed Size (px)
Citation preview

Polyolefins Journal, Vol. 2 No. 2 (2015) 89-97IPPI
Reaction dynamics during the testing of polymerization catalyst
N.M. Ostrovskii* and L. Fekete
HIPOL a.d., Gračački put b.b., Odžaci 25250, Serbia
Received: 11 February 2015 Accepted: 8 April 2015
ABSTRACT
The olefins polymerization process in a slurry reactor is discussed. The reaction rate dynamics was analyzed and the contributions of feed flow, gas-liquid mass transfer, polymerization reaction, and catalyst deactivation
were estimated. The propylene solubility in a solvent mixture “heptane” was calculated using Soave-Redlich-Kwong equation of state. These data were then approximated by Henry-like equation and the results were verified in experiments. The influence of propylene dissolving in ”heptane which was examined in special experiments without catalyst has provided the independent estimation of gas-liquid mass transfer coefficient. It has been shown that the reaction rate during the first 20-30 min of test is much lower (or higher) than total monomer consumption, depending on reactant addition sequence. The method of kinetic experiments interpretation and corresponding mathematical model are proposed. The method enables to estimate the kinetic parameter of monomer dissolution, the reaction rate constant of polymerization, as well as the parameters of active centers transformation – activation, deactivation and self-regeneration. An adequacy of model was proved by the description of experiments at two different pressures but with the same parameters values. Polyolefins J (2015) 2: 89-97
Keywords: reaction dynamics; propylene polymerization; catalyst testing
* Corresponding Author - E-mail: [email protected]
INTRODUCTIONIndustrial plants for polypropylene (PP) production by propylene polymerization are mainly based on Ziegler-Natta catalysts. The active component is titanium chloride (TiCl4) supported on magnesium chloride (MgCl2). An aluminium alkyl (typically triethylaluminium – AlEt3) is used as a cocatalyst, together with the titanium catalyst and different internal donors. These catalytic systems offer polymerization process in conventional slurry (with solvent), as
well as in monomer bulk (liquid) or gas phase [1]. In these processes, small catalyst particles (10–100 µm), together with cocatalyst and donor, are continuously fed into the reactor along with monomer and solvent (if is used). The monomer reacts with the catalyst to form polymer particles, growing around the catalyst up to the size range of 50–3000 µm [1].
The most popular models of polymer particle growth are “Multigrain model” [2], “Double grain model” [3], and their farther development [4]. The polymer formed
ORIGINAL PAPER

90Polyolefins Journal, Vol. 2, No. 2 (2015)
Ostrovskii N.M. and Fekete L. IPPI
inside the catalyst pores, at the very early stages of polymerization, results in catalyst fragmentation and the formation of a large number of micro-particles. As the reaction proceeds, the dispersed catalyst micro-particles are encapsulated by the growing polymer chains, leading to the formation of pseudo-homogeneous polymer particles [5]. Figuratively, growing polymer particle can be imaged as a small “pomegranate fruit” without peel (Fig. 1). Such a polymer “fruit” (macro-particle) consists of numerous “grains” (micro-particles) with “seed” (catalyst crystallite) inside each grain [6].
In Figure 1, ri are radii of catalyst crystallite (rc), polymer microparticles (rS), and macroparticles (rP). Because of polymer growth, rS and rP are increased during the reaction, changing the ratio of the reaction rate and rates of intra-particle diffusion and mass transfer. Using particle growth factor (f = rS/rc) [7, 8], one can express particle radius (rP), reaction rate related to the volume of polymer particle (Rv, g/cm3
min), and specific outer surface area of the particle (SP, cm2/cm3) [8, 9] :
(1)
( )( )1/3
1/3 3
11 3, ,1
Pc PP V P P
cP
rr R R Sr
εf εf fε
−−= = =
−
where RP – the reaction rate of polymerization related to the catalyst volume; and εP – the macroparticle porosity also depend on f [8].
It is seen from Eq(1) that olefins polymerization is a non-stationary process by nature, because the rate of each process stage (reaction, diffusion, mass transfer) is changing with time, due to the increasing of f [7-10]. Hence, this process is also some kind of topochemical reaction.
Another reason for the non-stationary process is the activation and deactivation of catalyst during its
residence time in the reactor [6, 11, 12]. Since the catalyst becomes a part of the polymer, the operation time of the catalyst is equal to the residence time of suspension in the reactor. During this time (usually 2–4 hours) the catalyst “lives entire its life”.
All these peculiarities make difficult the catalyst testing and especially the prediction of its behaviour in an industrial reactor. In polymerization kinetic experiments (as distinct from other catalytic processes), it is impossible to separate the chemical stage from physical stages of the process. Because the polymer remains on a catalyst (and a catalyst remains inside polymer), the testing of polymerization is usually carried out in a semi-batch reactor.
It makes considerably easier the experiments, but complicates their mathematical treatment and interpretation. The polymer accumulates in the reactor, so the suspension properties and also the monomer consumption at the reactor entrance become unsteady.
In such experiments, the monomer flow rate is controlled in order to sustain the intended pressure
(P) in the reactor. Thus, this flow rate equals with the rate of monomer absorption by suspension. Usually, this flow rate (W) is considered as a rate of reaction (RP). But in fact, the rate of monomer consumption represents a total monomer flux, which becomes equals to the reaction rate only in quasi-steady state. Dumas and Hsu [13] were probably firsts who have tried to calculate the reaction rate from a mass balance in the reactor:
[ ] / ,P propyleneR Vd M dt F= − + (2)
where F – the measured propylene flow rate; V – the volume of reaction mixture; and [M] – the monomer concentration in a solvent.
Unfortunately, they adopted an empirical approach to determine a correlation relating [M] as a function of flow rate and temperature [13]. Nevertheless, they have correctly evaluated that RP should be considerably higher (from 2 to 5 times) than F at the beginning of experiment.
As a matter of fact, strong relation between monomer flow rate (absorbed by suspension) and the polymerization rate depends on a sequence of reactant addition. This fact was verified in [14], where propylene polymerization was studied using metallocene catalysts with methyl-aluminoxane (MAO) as cocatalyst. Four reactant addition strategies
Figure 1. Elementary processes in micro- and macro-particles of polymer.
91 Polyolefins Journal, Vol. 2, No. 2 (2015)
Reaction dynamics during the testing of polymerization catalyst IPPI
were examined (Fig. 2), and a distinction of the kind of process dynamics was demonstrated when the catalyst was inserted before (case 1) or after (cases 2,3) solvent saturation by monomer.
The first procedure is used more often in factory laboratories, whereas in research laboratories the second sequence is prevailing. Nevertheless, in both cases the reaction rate differs from the monomer flow rate. This complicates the prediction of catalyst behaviour in an industrial reactor on the basis of laboratory testing.
In this article the experimental procedure and mathematical model are presented, that provide an interpretation of a catalyst dynamic testing. The method enables to estimate the kinetic parameters of monomer dissolution, polymerization reaction, and catalyst deactivation.
ExPERIMENTAlMaterialsPropylene, heptane, nitrogen, hydrogen, triethyl-aluminium (TEA) and the external donors were got from Hipol polypropylene plant and were used without additional purification. Propylene of polymer grade was used, with at least 99.5 vol.% purity.
Pre-treatment of the reactorA 3.7 L jacketed steel reactor was blown at 80°C by
repeated evacuation and flushing with nitrogen. The evacuated reactor was then charged with 1400 mL of heptane and stirred at 500 rpm. Then, the reactor jacket was connected to a water bath maintained at a constant temperature of 20°C in order to prepare for pre-polymerization.
Catalyst activationThe catalyst components were prepared in the glove box under purified nitrogen. The catalyst used was a commercially available TiCl4/ID/MgCl2 type of Ziegler–Natta catalyst (ID = internal donor), with following characteristics: bulk density (rcat) = 0.48 g/mL, d50 = 10-12 µm, [Ti] = 1.5-2.0 wt%.
Triethylaluminum (TEA) was used as co-catalyst and cyclohexyl-methyl-dimethoxy-silane (donor C) or dicyclopentyl-dimethoxy-silane (donor D) as an external donor (ED). The dry catalyst (20 mg) was weighed into a vial. The required amount of TEA for molar ratio Al/Ti = 500 and ED for specified Si/Ti molar ratio were contacted in the presence of 100 mL of heptane in a burette. The catalyst was then transferred into the burette with TEA/ED complex. The resulting activated catalyst slurry was then injected into the reactor under vacuum. The quantity of added hydrogen was determined to obtain the desired melt flow index of polymer.
Pre-polymerizationThis procedure was typically performed during 30 min at 20°C. It was started by injecting a fixed quantity of propylene from the inlet pipe into the reactor filled with slurry of activated catalyst.
Propylene polymerizationFirst, the reactor temperature was elevated up to 75°C. Then, the mass flow meter (MFM, Bronkhorst Cori-Flow meter) was fully opened to start the charging of propylene into the reactor. This moment was taken as the start of polymerization. The polymerization temperature (70°C) and pressure (10 bar) usually were reached after 15–18 min. The propylene consumption was measured automatically by MFM during polymerization. After targeted polymerization time, the reaction was terminated by venting the reactor. The product was filtered of, shortly dried under IR lamp and then dried under vacuum at 80°C for 2 h. The average size of polymer particles and particle size
Figure 2. Propylene flow in polymerization made with different reactant addition sequences [14]. M* – saturating the heptane with propylene; M – propylene feed to keep constant pressure.(○) – Solvent + MAO + Catalyst + M(●) – Solvent + M* + MAO + Catalyst + M(□) – Solvent + MAO+ M* + Catalyst + M(■) – Solvent + Catalyst + M* + MAO + M
92Polyolefins Journal, Vol. 2, No. 2 (2015)
Ostrovskii N.M. and Fekete L. IPPI
distribution are presented in Figs. 3a,b.
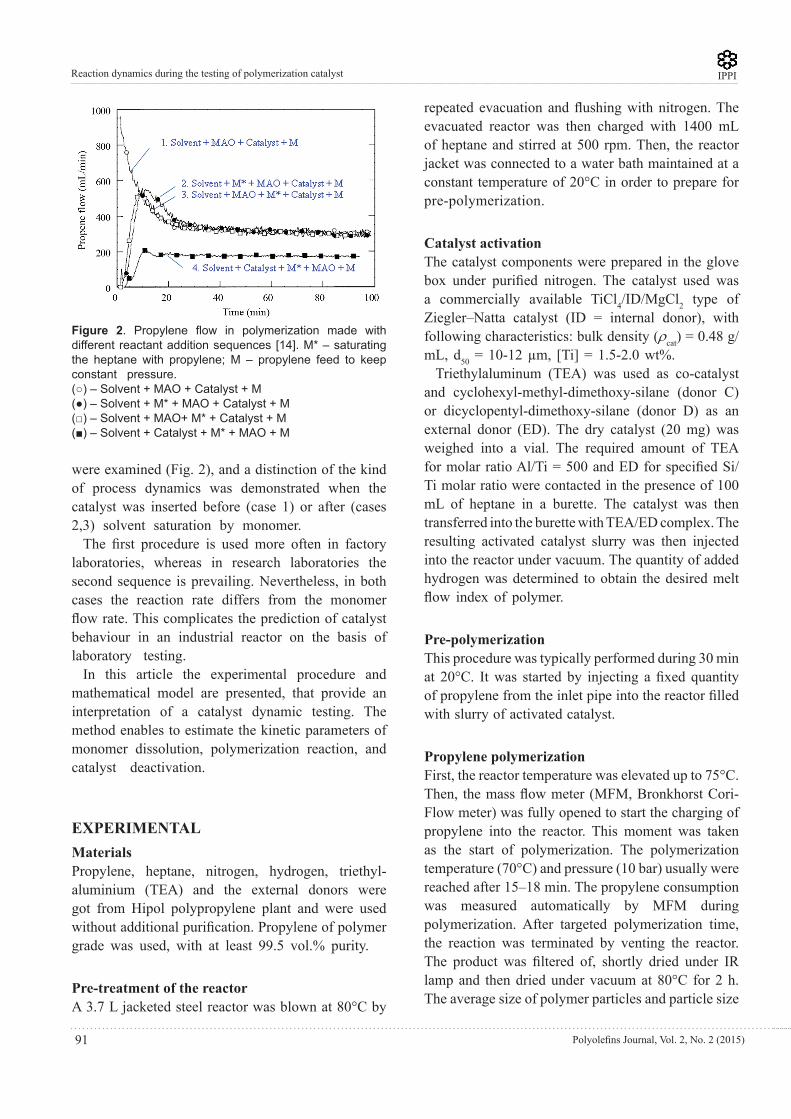
RESUlTS AND DISCUSSIONPropylene solubility in heptane The solvent “heptane” consists of more than 20 C7–hydrocarbons (Table 1). The propylene solubility in that mixture was calculated using Soave-Redlich-Kwong equation of state [15] and is presented in Fig. 4. These data were then approximated by Henry-like equation:
( )* , exp /n om m m m m mC H P H H Q RT= = (3)
where *mC – equilibrium concentration of propylene,
g/g; Pm – propylene partial pressure, bar;T – temperature, K; Qm – heat of dissolution; R – universal gas constant;Hm – Henry coefficient for propylene; n – constant.Qm = 23.0 kJ/mol, o
mH = 4.5e-06 g/g barn, n = 1.3.
The propylene solubility was verified in several experiments at different temperature and pressure, and
the validity of Eq. (3) was confirmed. Farther, Eq. (3) was used for the calculation of monomer equilibrium concentration.
An analogous dependence for hydrogen solubility ( *
HC ) in heptane-propylene mixture was obtained with the following parameters:
QH = 8.4 kJ/mol, oHH = 0.85 mmol/L barm, m = 1.2.
Propylene dissolution dynamicsThe propylene dissolution into heptane can control the overall process at the beginning of test, when its concentration in slurry-phase is low. That is why it
Figure 3. Characteristics of polypropylene particles (powder). (a)– bulk density as a function of particle average size, (b)– particle size distribution.
(a)
Table 1. The solvent composition.Component % wt.
n-HeptaneMethyl-hexanesEthyl-pentanesCyclohexaneMethyl-cyclohexaneAlkyl-cyclopentanes
33.022.08.03.024.010.0
(b)
Figure 4. Propylene solubility in “heptane” having composition as in Table 1. Points – calculation using Soave-Redlich-Kwong equation. Lines – approximation by Eq. (3).

93 Polyolefins Journal, Vol. 2, No. 2 (2015)
Reaction dynamics during the testing of polymerization catalyst IPPI
was estimated in special experiments without catalyst. An example of experimental curve of propylene absorption by heptan is shown at Fig. 5.
The propylene flow (W) was calculated by equation follows from Hagen-Poiseuille law:
( )( ), ( ) 1 exp( / )hZ R
Z
kW P P t t t tP
ϕ ϕ a= − = − − (4)
Propylene partial pressure in a gas phase (Pm = P ym ) and its concentration in a liquid phase (Cm ) depend on gas–liquid mass transfer and equilibrium conditions:
( )* ,m Lm m
G G
dP VRTW C C RTdt MV V
b= − − (5)
( )*mm m
dC C Cdt
b= − (6)
where W – total propylene flow, g/min; kh – constant (depends on apparatus); φ(t) – transient response function; P, Pz – current and desirable pressure; tR – time constant of regulator; M – molecular weight; VL, VG – volumes of liquid and gas, L; b – mass transfer coefficient, min–1.Two parameters of kh and b *
mC in Eqs. (4–6) were estimated from the experiments on dissolution dynamics:
- The apparatus constant kh = 50-55 g/min, - The mass transfer coefficient b *
mC = 2.0-2.2 min–1
With these parameters the model fits excellently the experimental data for dynamics of flow rate –W (Fig. 5), total pressure – P, and propylene amount in the reactor – G.
Propylene polymerization dynamicsIn the presence of catalyst, the flow rate constant (kh) and mass transfer coefficient (b) should remain the same. Also, the flow rate equation (Eq.(4)) and the equation for propylene in gas phase (Eq.(5)) are the same. The only equation for propylene concentration in liquid phase (Eq.(6)) must be modified by expressions for the reaction rate (RP) and for the catalyst deactivation (da/dt):
( )*,
mm m P
dC C C Rdt
b= − − (7)
2,(1 )
A A H HP P c m
A A H H
b C b CR k G C ab C b C
y y += =
+ + (8)
(9)
(1 ), ia A m i d m p s A a A m i
dada k C C a k C a k C a k C C adt dt
χ= − + − = −
where RP – reaction rate of polymerization, g/g min; kP – reaction rate constant, 1/gcat min; GC – weight of the catalyst, g; y – co-catalyst and hydrogen function; CA, CH – Al(Et)3 and H: concentrations in liquid, mmol/L; bA, bH – adsorption coefficients; a – relative activity; ai – fraction of initial (potential) active centers; ka, kd , ks – rate constants of catalyst activation, deactivation, and self-regeneration; xp – concentration of catalytic poisons in propylene, ppm.
The first order reaction rate (RP) with respect to monomer concentration (Cm) and catalyst active centers (Cc or GC) is established in many publications [16-18]. The function of co-catalyst and hydrogen concentrations (y) was substantiated by Keii [19]. The equation of catalyst deactivation (Eq.(9)) is based on the investigations of different authors [6, 11, 20]. This
Figure 5. Propylene dissolution in “heptane” at T = 70°C and P = 10 bar. Points – experimental flow; Lines – calculated by model (Eqs.3-6).
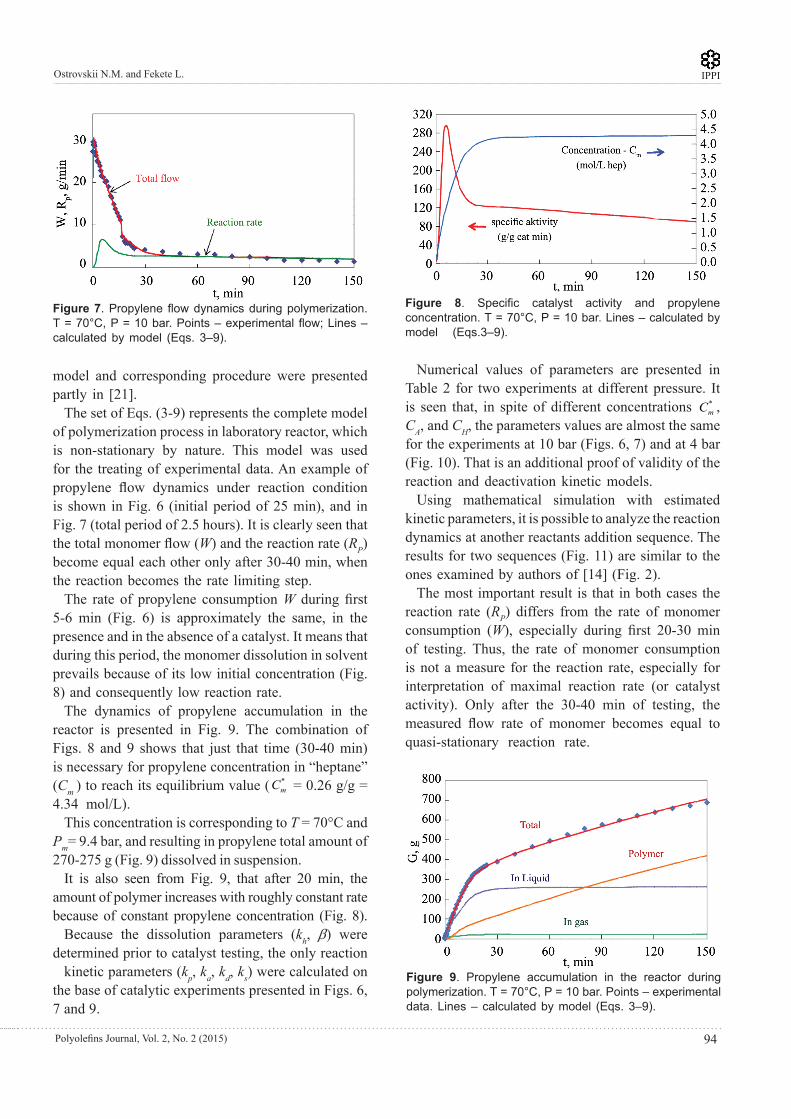
Figure 6. Propylene flow dynamics during polymerization at pressure growth period. T = 70°C. Points – experimental flow; Lines – calculated by model (Eqs.3–9).
94Polyolefins Journal, Vol. 2, No. 2 (2015)
Ostrovskii N.M. and Fekete L. IPPI
model and corresponding procedure were presented partly in [21].
The set of Eqs. (3-9) represents the complete model of polymerization process in laboratory reactor, which is non-stationary by nature. This model was used for the treating of experimental data. An example of propylene flow dynamics under reaction condition is shown in Fig. 6 (initial period of 25 min), and in Fig. 7 (total period of 2.5 hours). It is clearly seen that the total monomer flow (W) and the reaction rate (RP) become equal each other only after 30-40 min, when the reaction becomes the rate limiting step.
The rate of propylene consumption W during first 5-6 min (Fig. 6) is approximately the same, in the presence and in the absence of a catalyst. It means that during this period, the monomer dissolution in solvent prevails because of its low initial concentration (Fig. 8) and consequently low reaction rate.
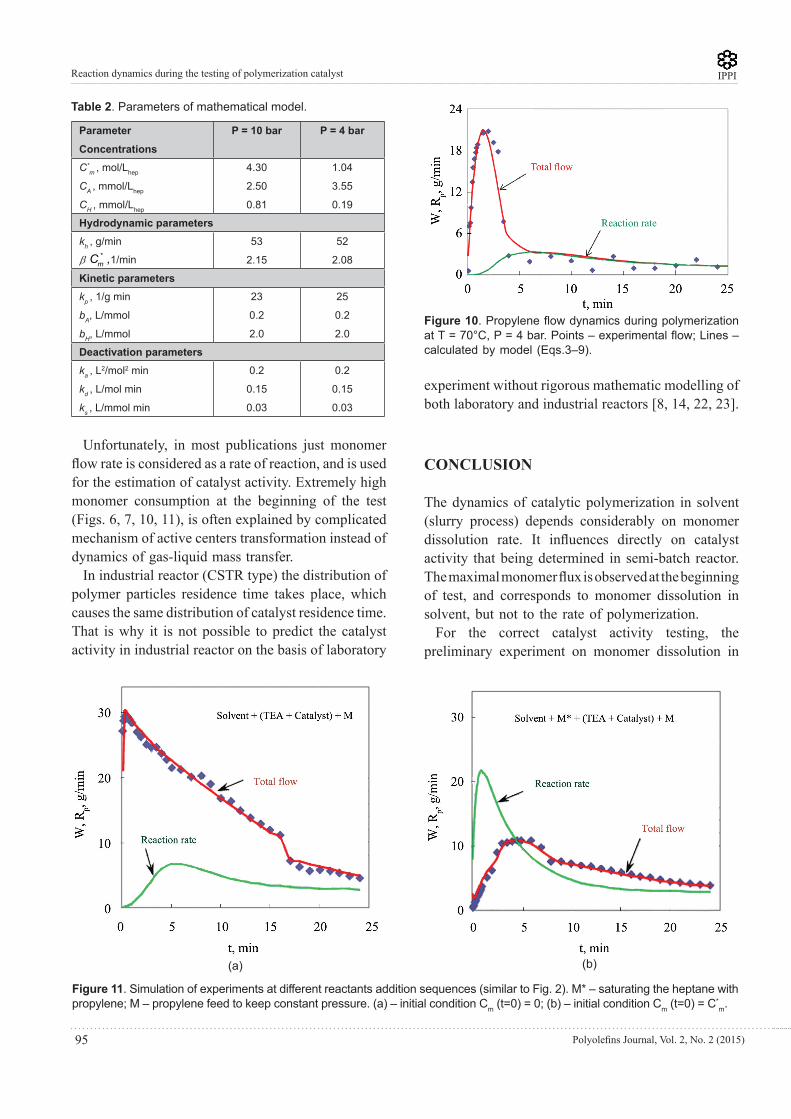
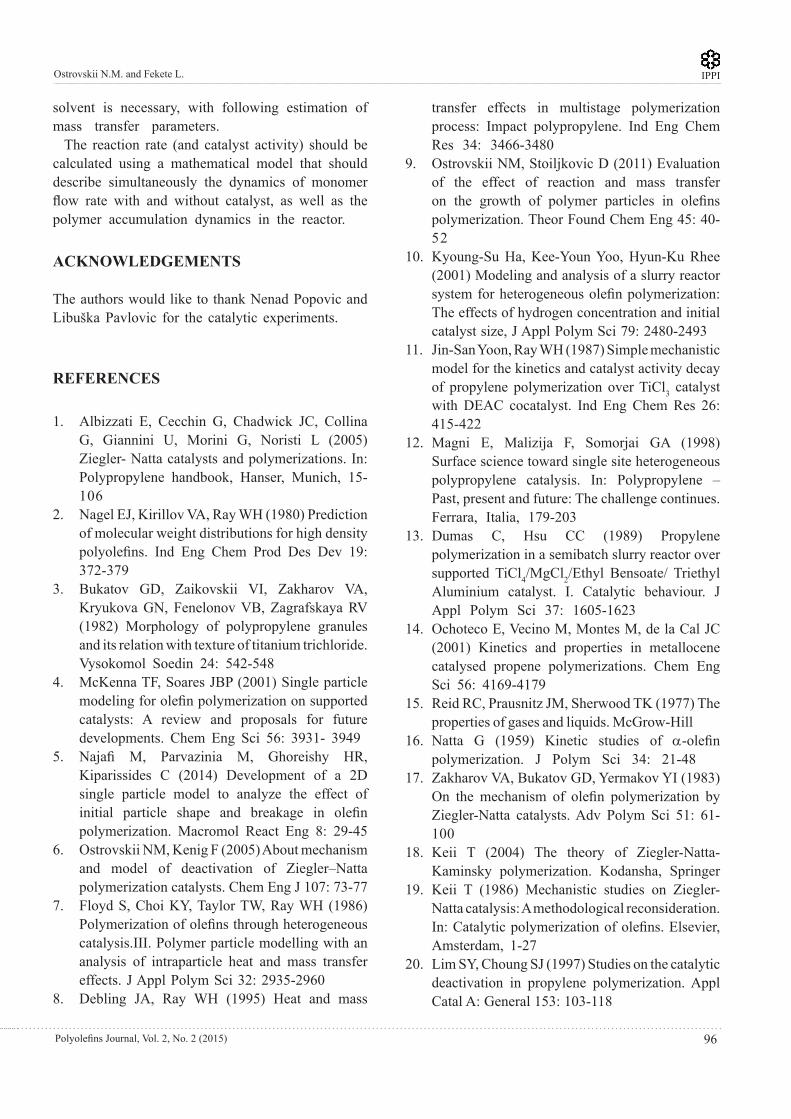
The dynamics of propylene accumulation in the reactor is presented in Fig. 9. The combination of Figs. 8 and 9 shows that just that time (30-40 min) is necessary for propylene concentration in “heptane” (Cm ) to reach its equilibrium value ( *
mC = 0.26 g/g = 4.34 mol/L).
This concentration is corresponding to T = 70°C and Pm= 9.4 bar, and resulting in propylene total amount of 270-275 g (Fig. 9) dissolved in suspension.
It is also seen from Fig. 9, that after 20 min, the amount of polymer increases with roughly constant rate because of constant propylene concentration (Fig. 8).
Because the dissolution parameters (kh, b) were determined prior to catalyst testing, the only reaction
kinetic parameters (kp, ka, kd, ks) were calculated on the base of catalytic experiments presented in Figs. 6, 7 and 9.
Numerical values of parameters are presented in Table 2 for two experiments at different pressure. It is seen that, in spite of different concentrations *
mC , CA, and CH, the parameters values are almost the same for the experiments at 10 bar (Figs. 6, 7) and at 4 bar (Fig. 10). That is an additional proof of validity of the reaction and deactivation kinetic models.
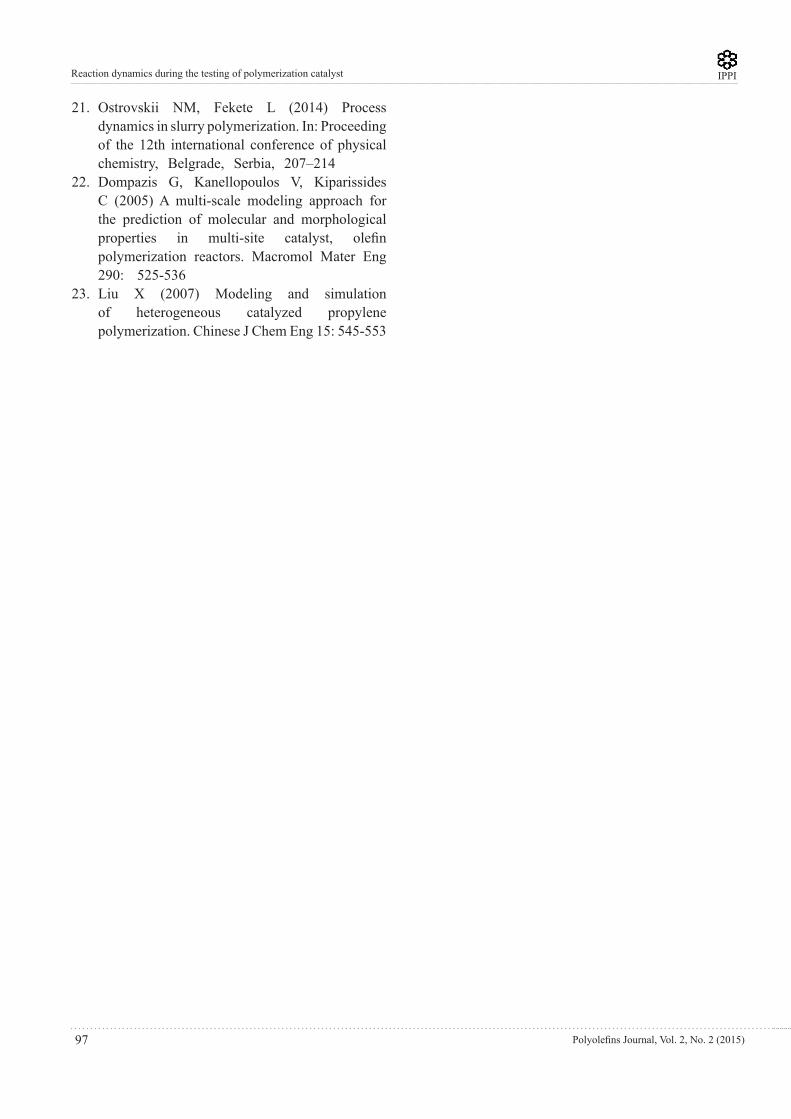
Using mathematical simulation with estimated kinetic parameters, it is possible to analyze the reaction dynamics at another reactants addition sequence. The results for two sequences (Fig. 11) are similar to the ones examined by authors of [14] (Fig. 2).
The most important result is that in both cases the reaction rate (RP) differs from the rate of monomer consumption (W), especially during first 20-30 min of testing. Thus, the rate of monomer consumption is not a measure for the reaction rate, especially for interpretation of maximal reaction rate (or catalyst activity). Only after the 30-40 min of testing, the measured flow rate of monomer becomes equal to quasi-stationary reaction rate.
Figure 7. Propylene flow dynamics during polymerization. T = 70°C, P = 10 bar. Points – experimental flow; Lines – calculated by model (Eqs. 3–9).
Figure 8. Specific catalyst activity and propylene concentration. T = 70°C, P = 10 bar. Lines – calculated by model (Eqs.3–9).
Figure 9. Propylene accumulation in the reactor during polymerization. T = 70°C, P = 10 bar. Points – experimental data. Lines – calculated by model (Eqs. 3–9).
95 Polyolefins Journal, Vol. 2, No. 2 (2015)
Reaction dynamics during the testing of polymerization catalyst IPPI
Unfortunately, in most publications just monomer flow rate is considered as a rate of reaction, and is used for the estimation of catalyst activity. Extremely high monomer consumption at the beginning of the test (Figs. 6, 7, 10, 11), is often explained by complicated mechanism of active centers transformation instead of dynamics of gas-liquid mass transfer.
In industrial reactor (CSTR type) the distribution of polymer particles residence time takes place, which causes the same distribution of catalyst residence time. That is why it is not possible to predict the catalyst activity in industrial reactor on the basis of laboratory
experiment without rigorous mathematic modelling of both laboratory and industrial reactors [8, 14, 22, 23].
CONClUSION
The dynamics of catalytic polymerization in solvent (slurry process) depends considerably on monomer dissolution rate. It influences directly on catalyst activity that being determined in semi-batch reactor. The maximal monomer flux is observed at the beginning of test, and corresponds to monomer dissolution in solvent, but not to the rate of polymerization.
For the correct catalyst activity testing, the preliminary experiment on monomer dissolution in
Parameter
Concentrations
P = 10 bar P = 4 bar
C*m , mol/Lhep
CA , mmol/Lhep
CH , mmol/Lhep
4.30
2.50
0.81
1.04
3.55
0.19
Hydrodynamic parameterskh , g/min
*mb C ,1/min
53
2.15
52
2.08
Kinetic parameterskp , 1/g min
bA, L/mmol
bH, L/mmol
23
0.2
2.0
25
0.2
2.0
Deactivation parameterska , L
2/mol2 min
kd , L/mol min
ks , L/mmol min
0.2
0.15
0.03
0.2
0.15
0.03
Table 2. Parameters of mathematical model.
Figure 10. Propylene flow dynamics during polymerization at T = 70°C, P = 4 bar. Points – experimental flow; Lines – calculated by model (Eqs.3–9).
Figure 11. Simulation of experiments at different reactants addition sequences (similar to Fig. 2). M* – saturating the heptane with propylene; M – propylene feed to keep constant pressure. (a) – initial condition Cm (t=0) = 0; (b) – initial condition Cm (t=0) = C*
m.
(a) (b)
96Polyolefins Journal, Vol. 2, No. 2 (2015)
Ostrovskii N.M. and Fekete L. IPPI
solvent is necessary, with following estimation of mass transfer parameters.
The reaction rate (and catalyst activity) should be calculated using a mathematical model that should describe simultaneously the dynamics of monomer flow rate with and without catalyst, as well as the polymer accumulation dynamics in the reactor.
ACKNOWlEDGEMENTS
The authors would like to thank Nenad Popovic and Libuška Pavlovic for the catalytic experiments.
REFERENCES
1. Albizzati E, Cecchin G, Chadwick JC, Collina G, Giannini U, Morini G, Noristi L (2005) Ziegler- Natta catalysts and polymerizations. In: Polypropylene handbook, Hanser, Munich, 15-106
2. Nagel EJ, Kirillov VA, Ray WH (1980) Prediction of molecular weight distributions for high density polyolefins. Ind Eng Chem Prod Des Dev 19: 372-379
3. Bukatov GD, Zaikovskii VI, Zakharov VA, Kryukova GN, Fenelonov VB, Zagrafskaya RV (1982) Morphology of polypropylene granules and its relation with texture of titanium trichloride. Vysokomol Soedin 24: 542-548
4. McKenna TF, Soares JBP (2001) Single particle modeling for olefin polymerization on supported catalysts: A review and proposals for future developments. Chem Eng Sci 56: 3931- 3949
5. Najafi M, Parvazinia M, Ghoreishy HR, Kiparissides C (2014) Development of a 2D single particle model to analyze the effect of initial particle shape and breakage in olefin polymerization. Macromol React Eng 8: 29-45
6. Ostrovskii NM, Kenig F (2005) About mechanism and model of deactivation of Ziegler–Natta polymerization catalysts. Chem Eng J 107: 73-77
7. Floyd S, Choi KY, Taylor TW, Ray WH (1986) Polymerization of olefins through heterogeneous catalysis.III. Polymer particle modelling with an analysis of intraparticle heat and mass transfer effects. J Appl Polym Sci 32: 2935-2960
8. Debling JA, Ray WH (1995) Heat and mass
transfer effects in multistage polymerization process: Impact polypropylene. Ind Eng Chem Res 34: 3466-3480
9. Ostrovskii NM, Stoiljkovic D (2011) Evaluation of the effect of reaction and mass transfer on the growth of polymer particles in olefins polymerization. Theor Found Chem Eng 45: 40-52
10. Kyoung-Su Ha, Kee-Youn Yoo, Hyun-Ku Rhee (2001) Modeling and analysis of a slurry reactor system for heterogeneous olefin polymerization: The effects of hydrogen concentration and initial catalyst size, J Appl Polym Sci 79: 2480-2493
11. Jin-San Yoon, Ray WH (1987) Simple mechanistic model for the kinetics and catalyst activity decay of propylene polymerization over TiCl3 catalyst with DEAC cocatalyst. Ind Eng Chem Res 26: 415-422
12. Magni E, Malizija F, Somorjai GA (1998) Surface science toward single site heterogeneous polypropylene catalysis. In: Polypropylene – Past, present and future: The challenge continues. Ferrara, Italia, 179-203
13. Dumas C, Hsu CC (1989) Propylene polymerization in a semibatch slurry reactor over supported TiCl4/MgCl2/Ethyl Bensoate/ Triethyl Aluminium catalyst. I. Catalytic behaviour. J Appl Polym Sci 37: 1605-1623
14. Ochoteco E, Vecino M, Montes M, de la Cal JC (2001) Kinetics and properties in metallocene catalysed propene polymerizations. Chem Eng Sci 56: 4169-4179
15. Reid RC, Prausnitz JM, Sherwood TK (1977) The properties of gases and liquids. McGrow-Hill
16. Natta G (1959) Kinetic studies of a-olefin polymerization. J Polym Sci 34: 21-48
17. Zakharov VA, Bukatov GD, Yermakov YI (1983) On the mechanism of olefin polymerization by Ziegler-Natta catalysts. Adv Polym Sci 51: 61-100
18. Keii T (2004) The theory of Ziegler-Natta-Kaminsky polymerization. Kodansha, Springer
19. Keii T (1986) Mechanistic studies on Ziegler-Natta catalysis: A methodological reconsideration. In: Catalytic polymerization of olefins. Elsevier, Amsterdam, 1-27
20. Lim SY, Choung SJ (1997) Studies on the catalytic deactivation in propylene polymerization. Appl Catal A: General 153: 103-118
97 Polyolefins Journal, Vol. 2, No. 2 (2015)
Reaction dynamics during the testing of polymerization catalyst IPPI
21. Ostrovskii NM, Fekete L (2014) Process dynamics in slurry polymerization. In: Proceeding of the 12th international conference of physical chemistry, Belgrade, Serbia, 207–214
22. Dompazis G, Kanellopoulos V, Kiparissides C (2005) A multi-scale modeling approach for the prediction of molecular and morphological properties in multi-site catalyst, olefin polymerization reactors. Macromol Mater Eng 290: 525-536
23. Liu X (2007) Modeling and simulation of heterogeneous catalyzed propylene polymerization. Chinese J Chem Eng 15: 545-553