Embed Size (px)
Citation preview
Knowledge. Experience. Integrity.
CALLAN INSTITUTE
Research
August 2017
Reaching for Higher Ground
Progress and Pitfalls in the Continued Evolution of Target Date Funds
Target date funds (TDFs) represent a dramatic improvement over former common defaults such as
stable value or money market funds, but they need to evolve.
Plan sponsors are examining whether TDFs can do a better job insulating participants, particularly
those near retirement, against random fluctuations in the markets that can hurt financial outcomes.
The solutions include using uncorrelated asset classes (e.g., alternatives); in-plan annuities; “dynamic”
qualified default investment alternatives; or guaranteed income products. All have benefits, but plan
sponsors also need to understand the potential drawbacks.
“I’m so glad that I know more than I knew thenGonna keep on tryin’Till I reach my highest ground”
—Stevie Wonder, “Higher Ground”
Through better plan design, innovative investment solutions, and efforts to increase savings rates, the
defined contribution (DC) industry has devoted tremendous amounts of time and effort to improve the like-
lihood of successful retirement outcomes. But much like the ancient Roman goddess Fortuna capriciously
interfering in the lives of mortals, random economic or market forces largely drive retirement outcomes.
Can target date funds, which have become the dominant savings vehicle in DC plans, be improved to
mitigate those risks?
Callan believes they can be. The DC industry knows more than it did when TDFs first gained traction
after the 2006 Pension Protection Act, giving it a head start on trying to improve them and get partici-
pants to their “highest ground.”

2
The Trouble With Sequence of ReturnsA key market peril that participants face is sequence-of-returns risk. To illustrate its impact, Callan exam-
ined hypothetical participant outcomes for various time periods, beginning at the height of the Roaring ‘20s
(Exhibit 1). Our study assumed:
• A participant saves 8.8%1 of income every year for 40 years beginning at age 25
• The participant realized real investment returns and salary inflation (based on the Consumer Price
Index (CPI)) from 1928 to 2016
• The same nominal starting salary, which grows based on the observed CPI from 1928 to 2016
• The plan used a glide path that follows the Callan Consensus equity roll-down, invested in large cap
U.S. stocks2 and the 10-Year Treasury
Here is how our participants did:
Start RetireEstimated Balance
(in 2016 dollars)1928 1968 $740,300
1933 1973 $911,300
1938 1978 $696,100
1943 1983 $683,4001948 1988 $764,100
1953 1993 $952,600
1958 1998 $1,577,300
1963 2003 $1,640,500
1968 2008 $1,572,800
1973 2013 $1,731,7001976 2016 $1,381,800
The fickle nature of randomness gave (the participant who retired in 2013) and took away (the investor
retiring in 1983). The participant who retired in 1983 faced high inflation (and low real returns) during and
immediately after World War II as well as the “stagflation” of the 1970s. The investor who retired in 2013
experienced the tech boom and had largely moved to fixed income
by the time of the Global Financial Crisis. By virtue of external fac-
tors—in this case, when one began saving and retired—the out-
comes can vary tremendously (by a factor of 2.5x!). People can
choose to work longer, but few people work as long as they expect.3
This analysis only looks at the level and sequence of historical
returns. We can broaden it to take a look at other random factors
that affect outcomes. By incorporating salary growth (using CPI as a proxy for wage inflation) and prevailing
interest rates, we can examine the link between capital (the balance at retirement) and income (as measured
Exhibit 1
Timing Is Everything, as Final Retirement Balances Vary Widely
1 The median total savings rate, according to Vanguard’s How America Saves report.
2 The study used the S&P 500 Index as a proxy for stocks and, before 1957, its previous incarnation, the “Composite Index”; in 1928 (where we begin this experiment) it tracked 90 stocks.
3 EBRI Retirement Confidence Survey (March 21, 2017, EBRI Issue Brief) shows that while 38% of workers expect to retire at 70 or beyond, only 4% of retirees report this was the case.
According to the Employee Benefit Research Institute’s Retirement Confidence Survey, many who retired earlier than planned cite hard-ships for leaving the workforce, including health problems or disabil-ity (41%), changes at their company (26%), and having to care for a spouse or another family member (14%). Others say changes in the skills required for their job (4%) or other work-related reasons (16%) played a role. Positive reasons for retiring early include being able to afford it (24%) or wanting to do something else (10%).
Source: Callan
3Knowledge. Experience. Integrity.
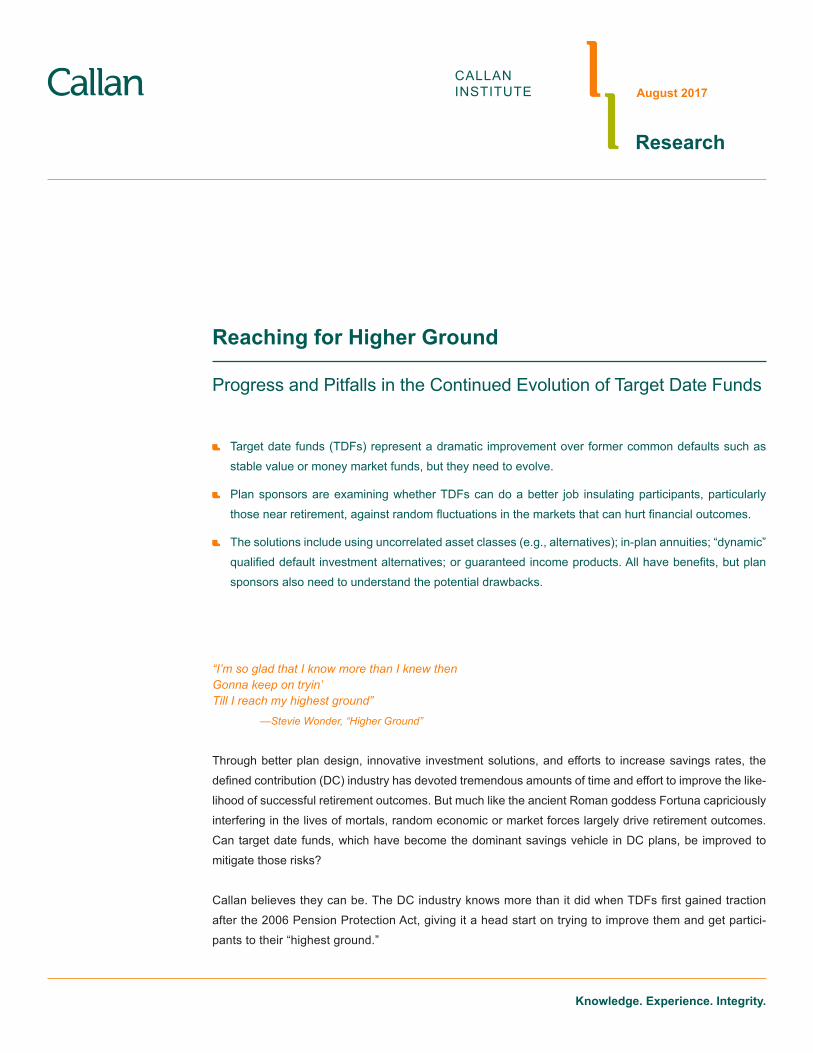
by annuity equivalent value).4 That value is the percentage of final income which can be provided by an
annuity purchased using the accumulated balance. For example, a value of 50% indicates a person making
$100,000 at retirement could purchase an annuity paying $50,000 a year during retirement. In theory, a
larger balance should correspond to a larger income stream. However, due to the impact of interest rates
when one retires (and in this case annuitizes) and the effect of wage inflation, the link between capital and
income is not as clear-cut.
Each dot in Exhibit 2 represents one of the final balances from Exhibit 1 (horizontal axis) and the annuity
equivalent value based on interest rates at the hypothetical retirement date. As illustrated, a big final bal-
ance does not necessarily translate into high income replacement due to both interest rates at retirement
and the path of salary growth.
Although the capital-income connection is useful in illustrating the dispersion of outcomes, the analysis
has shortcomings. According to Callan’s 2017 DC Trends Survey, only 12% of plans offer an annuity as
a distribution option for retirees. EBRI’s Retirement Confidence Survey finds that only 7% of workers are
very interested in purchasing longevity insurance.
Further, the annuity equivalent value depends largely on final salary as well as interest rates at the time of
retirement. Consider the participant who started saving in 1928. Despite a low balance, this person was
able to replace over 63% of final salary through an annuity. But this is largely due to a low ending salary
(thanks to disinflation during the Great Depression). A higher replacement ratio does not always imply a
successful retirement.
Exhibit 2
Timing Is Everything, Version 2.0
4 The use of annuity equivalent value follows the approach taken in Anup K. Basu and M.E. Drew, “Portfolio Size Effect in Retirement Accounts: What Does It Imply for Lifecycle Asset Allocation Funds?” Journal of Portfolio Management (2009), Vol. 35, No. 3, pp. 61-72.
$500,000 $875,000 $1,250,000 $1,625,000 $2,000,000
0%
20%
40%
60%
80%
Ann
uity
Equ
ival
ent V
alue
Estimated Final BalanceSource: Callan
4
Having seen the strong effects that external forces have on participant outcomes, are there ways to
moderate them?
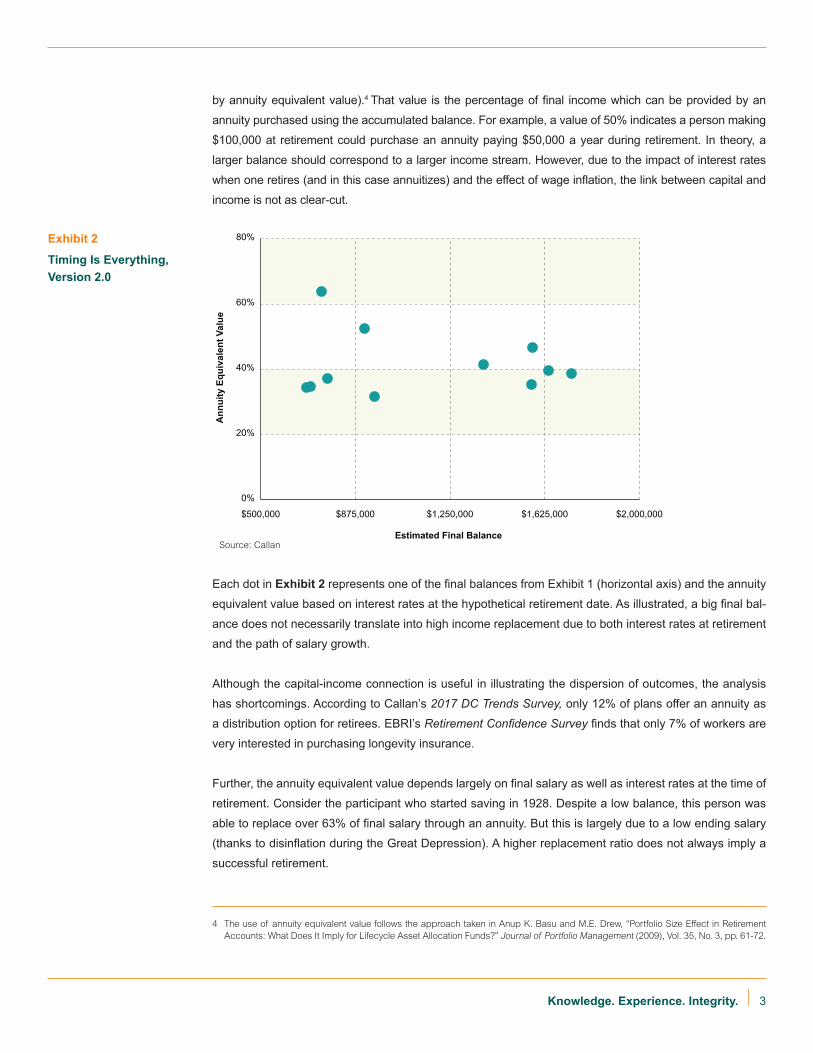
Improving the Accumulation Phase: Expand the Selection SetOur glide path in the study only included two asset classes: U.S. government bonds and U.S. large cap
equity. If diversification is an investor’s one free lunch, it follows that the diversification of TDFs should
lead to superior, less varied outcomes. But with target date funds, the free lunch remains quite bland
compared to the fare that is served to endowments, foundations, defined benefit (DB) plans, and other
large institutional pools (Exhibit 3).
Long Government
Natural Resource Equity
Stable Value
Leveraged-Bank Loans
Real Estate
Extended Maturity
Non-U.S. Small Cap
Non-U.S. Fixed Hedged
Hedge Funds/Absolute Return
Emerging Market Debt
U.S. REITs
Non-U.S. Fixed Income
Defensive Fixed Income
Global REITs
Cash Equivalents
High Yield
Commodities
TIPS
Small/Mid Cap Equity
Emerging Market Equity
Core Fixed Income
Non-U.S. Equity
Large Cap Equity
Equity Fixed Income Other
100%
100%
100%
98%
95%
73%
49%
45%
45%
36%
36%
33%
24%
22%
18%
15%
9%
9%
7%
5%
4%
2%
2%
Source: Callan
Exhibit 3
TDFs Are Not as Diverse as They Could Be
Prevalence of Asset Classes Within Off-the-Shelf Target Date Funds
5Knowledge. Experience. Integrity.
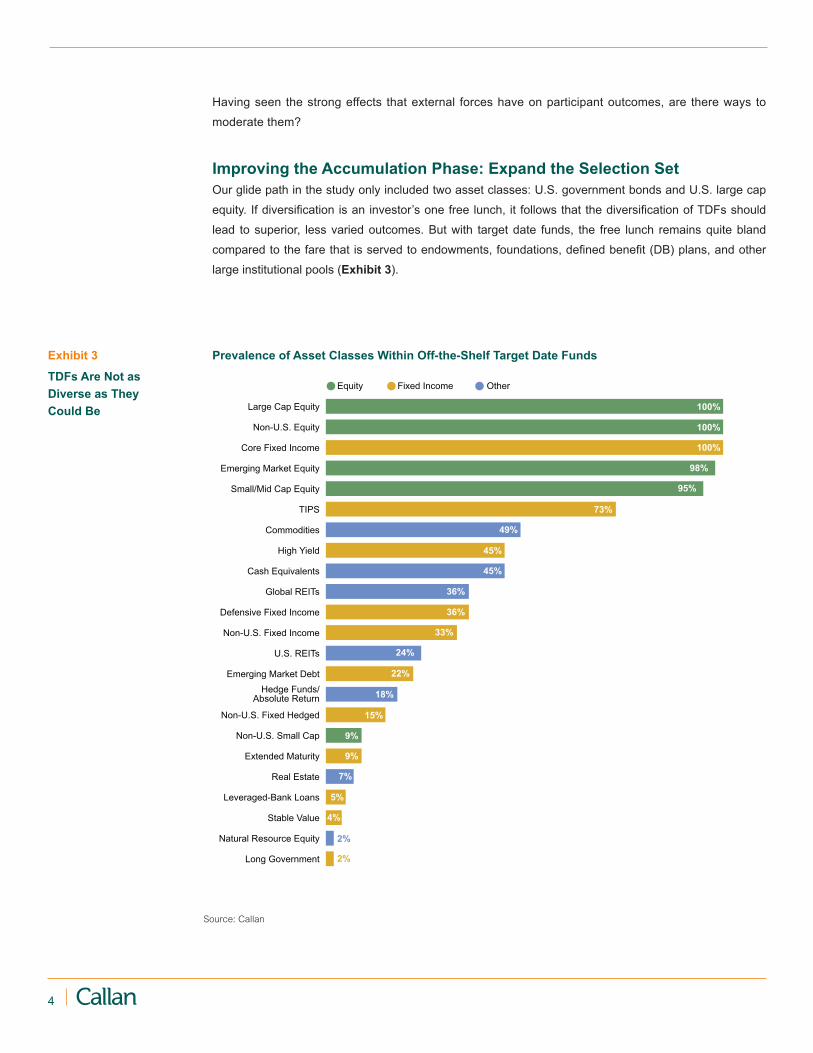
The diversification within TDFs rarely extends outside mainstream asset classes. For instance, fewer
than half of TDFs even offer access to a wide range of nontraditional asset classes, such as commodities,
hedge funds, and private real estate, that are widely used by other institutional pools (Exhibit 4). This is
largely due to cost and operational considerations.
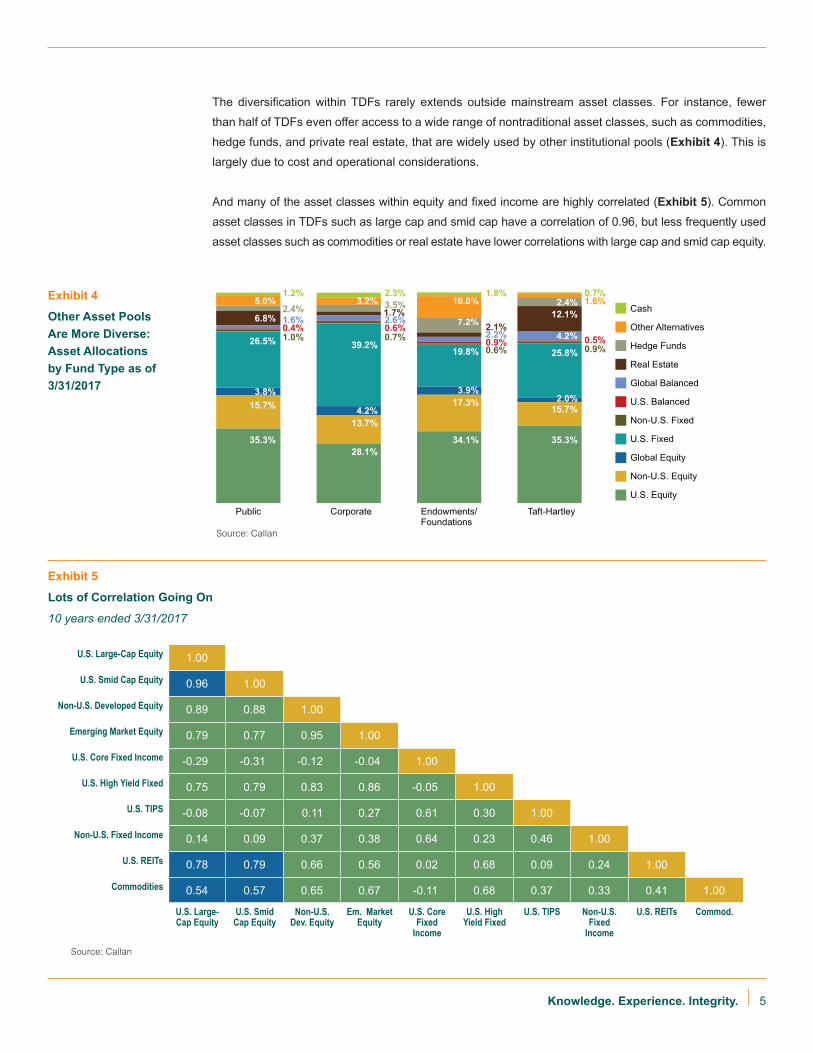
And many of the asset classes within equity and fixed income are highly correlated (Exhibit 5). Common
asset classes in TDFs such as large cap and smid cap have a correlation of 0.96, but less frequently used
asset classes such as commodities or real estate have lower correlations with large cap and smid cap equity.
Exhibit 4
Other Asset Pools Are More Diverse: Asset Allocations by Fund Type as of 3/31/2017
U.S. Large-Cap Equity 1.00
U.S. Smid Cap Equity 0.96 1.00
Non-U.S. Developed Equity 0.89 0.88 1.00
Emerging Market Equity 0.79 0.77 0.95 1.00
U.S. Core Fixed Income -0.29 -0.31 -0.12 -0.04 1.00
U.S. High Yield Fixed 0.75 0.79 0.83 0.86 -0.05 1.00
U.S. TIPS -0.08 -0.07 0.11 0.27 0.61 0.30 1.00
Non-U.S. Fixed Income 0.14 0.09 0.37 0.38 0.64 0.23 0.46 1.00
U.S. REITs 0.78 0.79 0.66 0.56 0.02 0.68 0.09 0.24 1.00
Commodities 0.54 0.57 0.65 0.67 -0.11 0.68 0.37 0.33 0.41 1.00
U.S. Large-Cap Equity
U.S. Smid Cap Equity
Non-U.S. Dev. Equity
Em. Market Equity
U.S. Core Fixed
Income
U.S. High Yield Fixed
U.S. TIPS Non-U.S. Fixed
Income
U.S. REITs Commod.
Exhibit 5
Lots of Correlation Going On
10 years ended 3/31/2017
Cash
Other Alternatives
Hedge Funds
Real Estate
Global Balanced
U.S. Balanced
Non-U.S. Fixed
U.S. Fixed
Global Equity
Non-U.S. Equity
U.S. Equity
Public Corporate Endowments/Foundations
Taft-Hartley
35.3%
15.7%3.8%
26.5%
6.8%
5.0%1.2%2.4%1.6%0.4%1.0%
28.1%
13.7%4.2%
39.2%
1.7%3.2%
2.3%3.5%2.6%0.6%0.7%
34.1%
17.3%3.9%
19.8%
10.0%1.8%
7.2%2.2%2.1%0.9%0.6%
35.3%
15.7%2.0%
25.8%
12.1%
0.7%1.6%2.4%
4.2% 0.5%0.9%
Source: Callan
Source: Callan
6
Given this, why are target date managers not offering non-correlated asset classes in their glide paths?
While adding more diversification, with reduced correlation, could cut the sensitivity of participant out-
comes to the overall sequence of returns, such asset classes also tend to increase fees. Managers
incorporating alternatives would likely need to adjust the overall cost structure by implementing passive
management elsewhere to keep total fee levels competitive. And when adding any alternative asset
class, the expected improvements to outcomes must clearly outweigh any potential increase in fees.
Consider the case of a TDF adding a direct real estate fund with a fee of 100 basis points. Absent other
changes (decreasing allocations elsewhere to make the allocation to real estate), a 10% allocation
would add 10 bps in fees compared to what the TDF had been paying before. While changes to the
existing asset allocation (going passive elsewhere) could help offset that increase, those suggesting this
approach should bear in mind that plan sponsors are tremendously sensitive to fees in an atmosphere
of rampant litigation.
When looking at private assets (e.g., real estate, private equity, or hedge funds), barriers go beyond fees to
the operational side. Daily valuation (and to a lesser degree daily liquidity) remains the price of admission to
the DC market, so managers of such products must get creative. For example, managers in the private real
estate or private equity space may add public REITs or public equity (such as S&P 500 Index exposure) to
help reduce liquidity concerns. But in doing so, they must take care not to water down the strategies to the
point where their benefits no longer exist.
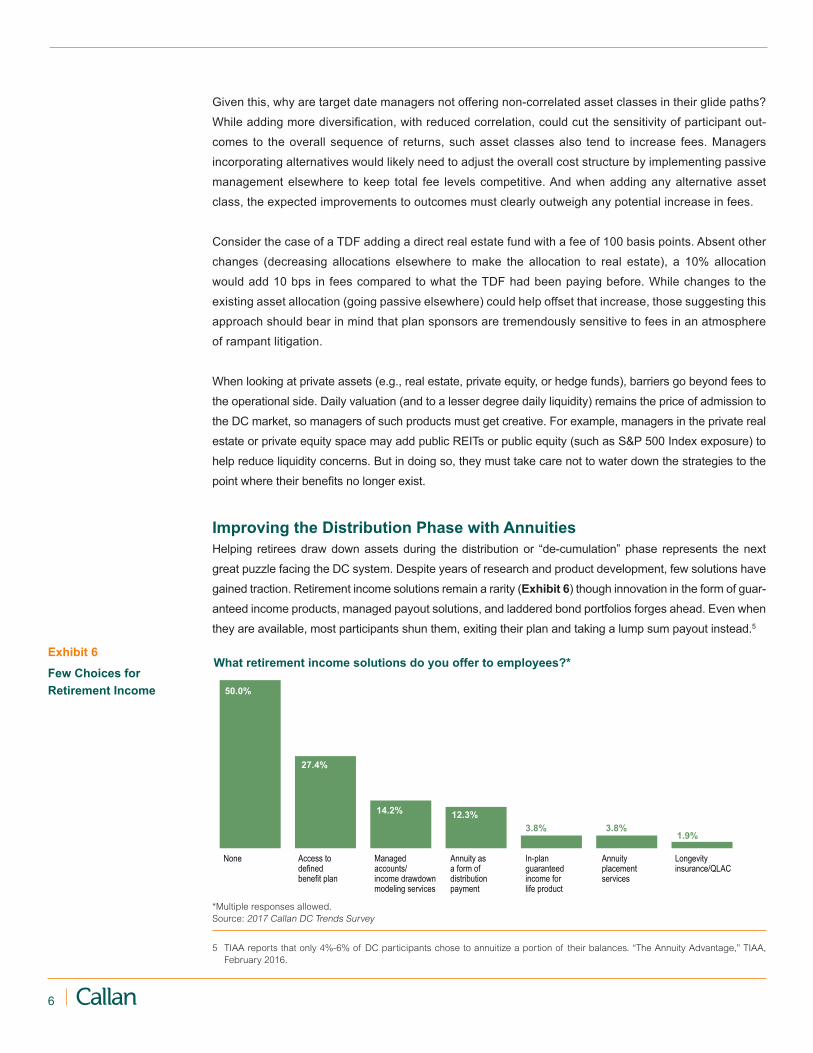
Improving the Distribution Phase with AnnuitiesHelping retirees draw down assets during the distribution or “de-cumulation” phase represents the next
great puzzle facing the DC system. Despite years of research and product development, few solutions have
gained traction. Retirement income solutions remain a rarity (Exhibit 6) though innovation in the form of guar-
anteed income products, managed payout solutions, and laddered bond portfolios forges ahead. Even when
they are available, most participants shun them, exiting their plan and taking a lump sum payout instead.5
Exhibit 6
Few Choices for Retirement Income
Access to defined benefit plan
Annuity as a form of distribution payment
Managed accounts/income drawdown modeling services
In-plan guaranteed income for life product
Annuity placement services
Longevity insurance/QLAC
None
50.0%
27.4%
14.2% 12.3%3.8% 3.8%
1.9%
What retirement income solutions do you offer to employees?*
*Multiple responses allowed.Source: 2017 Callan DC Trends Survey
5 TIAA reports that only 4%-6% of DC participants chose to annuitize a portion of their balances. “The Annuity Advantage,” TIAA, February 2016.

7Knowledge. Experience. Integrity.
Already some providers of off-the-shelf TDFs offer versions with guaranteed income streams. Realizing
the role such solutions could play, the Treasury Department in 2014 issued guidance that cleared the
way for deferred annuities within TDFs designated as the plan’s QDIA. While the move from the Treasury
Department is helpful, many are waiting on the Department of Labor to issue more prescriptive safe harbor
provisions around the use of annuities.
With these versions of TDFs, a portion of the underlying assets is invested in a sleeve that contains an
annuity payout. As an example, some products begin shifting assets into a guaranteed minimum with-
drawal benefit (GMWB). The guarantee is based on an account high-water mark that resets periodically.
Like many other annuity-based solutions, such products have yet to gain traction, and may not be the right
choice for participants (Exhibit 7).
Another area of potential innovation involves connecting the target date fund to a qualified longevity annuity
contract (QLAC). A QLAC is a deferred annuity that begins payoffs once (and if) a participant reaches some
0
5
10
Year
s
$0
$250,000
$500,000
$750,000
$1,000,000
$1,250,000
$1,500,000
45 50 55 60 65 70 75 80 85 90 95 100Age
Balance with annuity fee Balance without annuity fee Fee gap in years (right axis)Exhibit 7
Modeling How a GMWB Might Work
To illustrate the potential value of these products, Callan modeled a GMWB with the following features: • Starting account balance of $100,000 at age 45
• Contributing $3,000 annually toward retirement
• Investment in the GMWB target date fund
begins at age 55
• GMWB adds 90 basis points in fees for the
annuity feature
• Retirement begins at age 65, with 4% annual
withdrawals
• Callan’s Capital Market Projections are used to
forecast long-term returns and volatility
Results:• At age 65, a participant has paid 10 years of
annuity fees and needs 2 years of annuity pay-
ments to break even
• By age 85, a participant has paid 30 years of
fees, and needs nearly 6 years of payments—to
age 91—to break even
• Participant actions (e.g., large withdrawals) can
eliminate the value of the guarantee
• Fees can be raised by the annuity provider with
just 30 days’ notice, in many cases
Source: Callan
8
predetermined age. For example, a 65-year-old could purchase a QLAC that begins to pay out when, and
if, the participant reaches age 80. The beauty of a QLAC is that it creates a “longevity safety net” and also
allows those in retirement to define a specific drawdown period—the time between when they retire and the
age when the QLAC provides annuity income (e.g., 80 – 85). QLACs can also address the issue of cognitive
decline by providing a guaranteed stream of income later in life, when participants may have trouble making
financial decisions. Realizing the role QLACs could play, the IRS in 2014 exempted them from the calcula-
tions for minimum required distributions (provided certain criteria are met).6
However, under existing regulations the amount one can annuitize is limited to 25% of the applicable
retirement account assets or $100,000, whichever is lower. And with many participants underestimating
their longevity,7 the appeal of a solution that only pays off if they live to an advanced age could be limited.
As with many innovative financial products, cost and operational issues present difficulties. With inter-
est rates stubbornly low, annuities may not be appealing given the level of fees. Consider a balance of
$100,000. Fees for existing guaranteed withdrawal products are around 100 bps. For those looking to
purchase an immediate annuity upon retirement, a balance of $100,000 translates into a paltry figure of
roughly $523 a month.8 Given the sticker shock, the lack of interest in annuities should come as no sur-
prise. There is hope that renewed emphasis on mandating annual income disclosures9 to participants will
reframe their focus from accumulation (total balance) to income in retirement and in turn brace participants
for the annuity sticker shock.
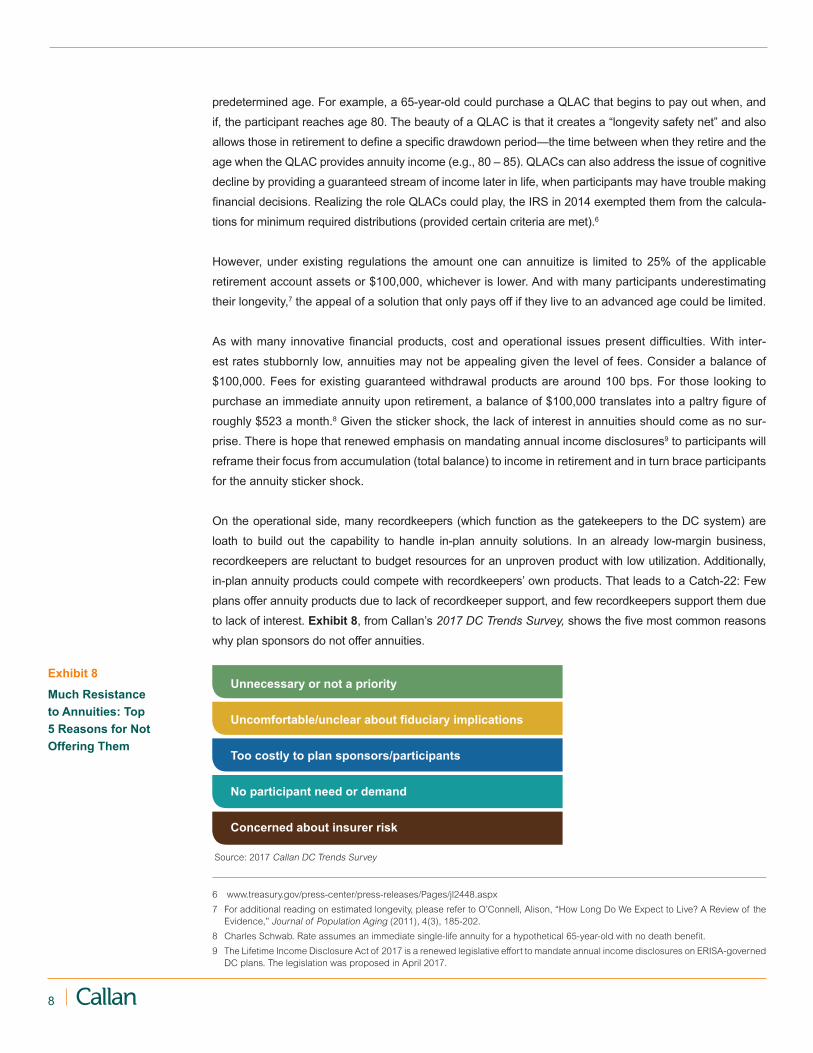
On the operational side, many recordkeepers (which function as the gatekeepers to the DC system) are
loath to build out the capability to handle in-plan annuity solutions. In an already low-margin business,
recordkeepers are reluctant to budget resources for an unproven product with low utilization. Additionally,
in-plan annuity products could compete with recordkeepers’ own products. That leads to a Catch-22: Few
plans offer annuity products due to lack of recordkeeper support, and few recordkeepers support them due
to lack of interest. Exhibit 8, from Callan’s 2017 DC Trends Survey, shows the five most common reasons
why plan sponsors do not offer annuities.
6 www.treasury.gov/press-center/press-releases/Pages/jl2448.aspx
7 For additional reading on estimated longevity, please refer to O’Connell, Alison, “How Long Do We Expect to Live? A Review of the Evidence,” Journal of Population Aging (2011), 4(3), 185-202.
8 Charles Schwab. Rate assumes an immediate single-life annuity for a hypothetical 65-year-old with no death benefit.
9 The Lifetime Income Disclosure Act of 2017 is a renewed legislative effort to mandate annual income disclosures on ERISA-governed DC plans. The legislation was proposed in April 2017.
Exhibit 8
Much Resistance to Annuities: Top 5 Reasons for Not Offering Them
Unnecessary or not a priority
Uncomfortable/unclear about fiduciary implications
Too costly to plan sponsors/participants
No participant need or demand
Concerned about insurer risk
Source: 2017 Callan DC Trends Survey
9Knowledge. Experience. Integrity.
Despite these issues, the de-cumulation phase represents another area where we may see continued
evolution in the retirement market generally and the target date market more specifically.
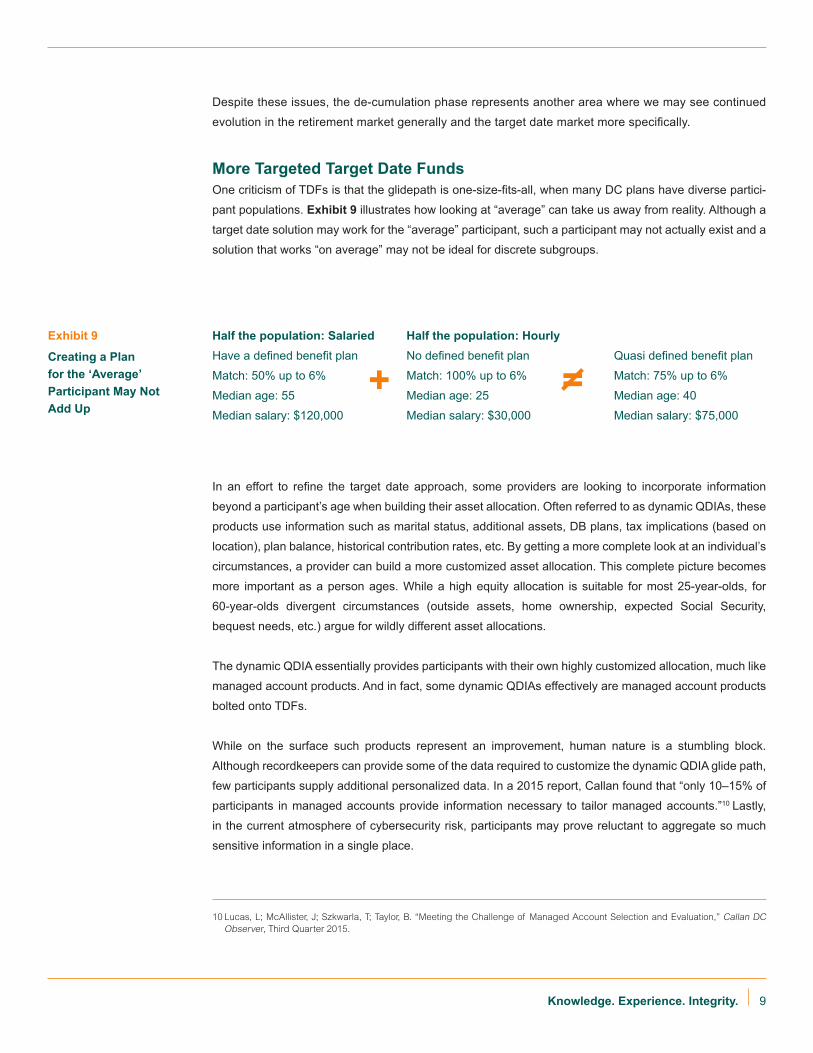
More Targeted Target Date FundsOne criticism of TDFs is that the glidepath is one-size-fits-all, when many DC plans have diverse partici-
pant populations. Exhibit 9 illustrates how looking at “average” can take us away from reality. Although a
target date solution may work for the “average” participant, such a participant may not actually exist and a
solution that works “on average” may not be ideal for discrete subgroups.
Half the population: Salaried Half the population: HourlyHave a defined benefit plan No defined benefit plan Quasi defined benefit plan
Match: 50% up to 6% Match: 100% up to 6% Match: 75% up to 6%
Median age: 55 Median age: 25 Median age: 40
Median salary: $120,000 Median salary: $30,000 Median salary: $75,000
+ =
In an effort to refine the target date approach, some providers are looking to incorporate information
beyond a participant’s age when building their asset allocation. Often referred to as dynamic QDIAs, these
products use information such as marital status, additional assets, DB plans, tax implications (based on
location), plan balance, historical contribution rates, etc. By getting a more complete look at an individual’s
circumstances, a provider can build a more customized asset allocation. This complete picture becomes
more important as a person ages. While a high equity allocation is suitable for most 25-year-olds, for
60-year-olds divergent circumstances (outside assets, home ownership, expected Social Security,
bequest needs, etc.) argue for wildly different asset allocations.
The dynamic QDIA essentially provides participants with their own highly customized allocation, much like
managed account products. And in fact, some dynamic QDIAs effectively are managed account products
bolted onto TDFs.
While on the surface such products represent an improvement, human nature is a stumbling block.
Although recordkeepers can provide some of the data required to customize the dynamic QDIA glide path,
few participants supply additional personalized data. In a 2015 report, Callan found that “only 10–15% of
participants in managed accounts provide information necessary to tailor managed accounts.”10 Lastly,
in the current atmosphere of cybersecurity risk, participants may prove reluctant to aggregate so much
sensitive information in a single place.
10 Lucas, L; McAllister, J; Szkwarla, T; Taylor, B. “Meeting the Challenge of Managed Account Selection and Evaluation,” Callan DC Observer, Third Quarter 2015.
Exhibit 9
Creating a Plan for the ‘Average’ Participant May Not Add Up
10
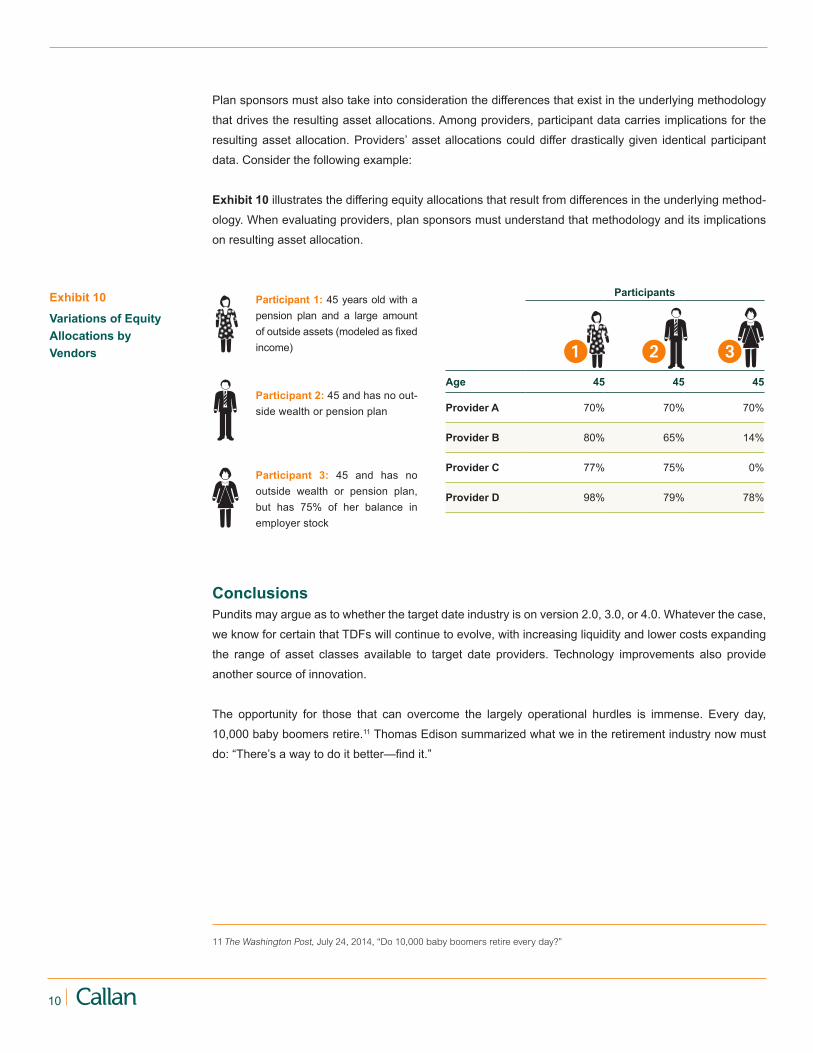
Plan sponsors must also take into consideration the differences that exist in the underlying methodology
that drives the resulting asset allocations. Among providers, participant data carries implications for the
resulting asset allocation. Providers’ asset allocations could differ drastically given identical participant
data. Consider the following example:
Exhibit 10 illustrates the differing equity allocations that result from differences in the underlying method-
ology. When evaluating providers, plan sponsors must understand that methodology and its implications
on resulting asset allocation.
11 The Washington Post, July 24, 2014, “Do 10,000 baby boomers retire every day?”
Participants
Age 45 45 45
Provider A 70% 70% 70%
Provider B 80% 65% 14%
Provider C 77% 75% 0%
Provider D 98% 79% 78%
1 2 3
Participant 1: 45 years old with a pension plan and a large amount of outside assets (modeled as fixed income)
Participant 2: 45 and has no out-side wealth or pension plan
Participant 3: 45 and has no outside wealth or pension plan, but has 75% of her balance in employer stock
ConclusionsPundits may argue as to whether the target date industry is on version 2.0, 3.0, or 4.0. Whatever the case,
we know for certain that TDFs will continue to evolve, with increasing liquidity and lower costs expanding
the range of asset classes available to target date providers. Technology improvements also provide
another source of innovation.
The opportunity for those that can overcome the largely operational hurdles is immense. Every day,
10,000 baby boomers retire.11 Thomas Edison summarized what we in the retirement industry now must
do: “There’s a way to do it better—find it.”
Exhibit 10
Variations of Equity Allocations by Vendors

11Knowledge. Experience. Integrity.
About the Author
James Veneruso, CFA, CAIA, is a Senior Vice President and defined contribution
consultant in Callan’s Fund Sponsor Consulting group based in the Summit, New
Jersey office. Jimmy joined Callan in 2007 and is responsible for providing analytical
support to Callan’s DC clients and consultants. He is responsible for research and
analysis of target date strategies and assists plan sponsor clients with target date
manager searches and suitability studies. In this role, Jimmy meets regularly with
investment managers to develop an understanding of their asset allocation, philosophy, investment poli-
cies, and organizational structures. He is a regular speaker at the “Callan College” and various investment
forums, and his views have been featured in numerous publications. Jimmy is a shareholder of the firm.
Prior to joining Callan, Jimmy served over two years as a United States Peace Corps Volunteer in the
Kingdom of Tonga. He served as project manager for the Future Farmers of Tonga program and taught at
Queen Salote College.
Jimmy received his Master’s in Economics from the University of Illinois and graduated with departmental
honors earning a BS in Computer Science and Economics at Vanderbilt University. He has earned the
right to use the Chartered Financial Analyst designation and the CAIA designation. Jimmy is a member of
the New York Society of Security Analysts.
12
Certain information herein has been compiled by Callan and is based on information provided by a variety of sources believed to be reliable for which Callan has not necessarily verified the accuracy or completeness of or updated. This report is for informational purposes only and should not be construed as legal or tax advice on any matter. Any investment decision you make on the basis of this report is your sole responsibility. You should consult with legal and tax advisers before applying any of this information to your particular situation. Reference in this report to any product, service or entity should not be construed as a recommendation, approval, affiliation or endorsement of such product, service or entity by Callan. Past performance is no guarantee of future results. This report may consist of statements of opinion, which are made as of the date they are expressed and are not statements of fact. The Callan Institute (the “Institute”) is, and will be, the sole owner and copyright holder of all material prepared or developed by the Institute. No party has the right to reproduce, revise, resell, disseminate externally, disseminate to subsidiaries or parents, or post on internal web sites any part of any material prepared or developed by the Institute, without the Institute’s permission. Institute clients only have the right to utilize such material internally in their business.
If you have any questions or comments, please email [email protected].
About Callan AssociatesCallan was founded as an employee-owned investment consulting firm in 1973. Ever since, we have
empowered institutional clients with creative, customized investment solutions that are backed by pro-
prietary research, exclusive data, and ongoing education. Today, Callan advises on more than $2 tril-
lion in total fund sponsor assets, which makes it among the largest independently owned investment
consulting firms in the U.S. Callan uses a client-focused consulting model to serve pension and defined
contribution plan sponsors, endowments, foundations, independent investment advisers, investment
managers, and other asset owners. Callan has five offices throughout the U.S. For more information,
please visit www.callan.com.
About the Callan InstituteThe Callan Institute, established in 1980, is a source of continuing education for those in the institutional
investment community. The Institute conducts conferences and workshops and provides published research,
surveys, and newsletters. The Institute strives to present the most timely and relevant research and educa-
tion available so our clients and our associates stay abreast of important trends in the investments industry.
© 2017 Callan Associates Inc.

Corporate Headquarters
Callan Associates600 Montgomery Street Suite 800San Francisco, CA 94111800.227.3288415.974.5060
www.callan.com
Regional Offices
Atlanta800.522.9782
Chicago800.999.3536
Denver855.864.3377
New Jersey800.274.5878
@CallanAssoc Callan Associates


![Callan Book 2 [Stage 3]](https://img.pdfslide.us/doc/110x75/55cf8f7c550346703b9ce040/callan-book-2-stage-3-564765e022b75.jpg)


![Callan Book 1 [Stage 1]](https://img.pdfslide.us/doc/110x75/544744d2b1af9f800a8b4c46/callan-book-1-stage-1-558445bb7681f.jpg)
