Embed Size (px)
Citation preview

Re-entrainment correlations for demisting
cyclones acting at elevated pressures on a
range of fluids
Trond Austrheim and Lars H. Gjertsen
Statoil ASA
7005 Trondheim, Norway
and
Alex C. Ho!mann
Dept. of Physics and Technology, University of Bergen
Allegt. 55, 5007 Bergen, Norway
May 21, 2007
Key words: Gas scrubber; axial-flow cyclone; high pressure; re-entrainment;
hydrocarbon fluids;
Abstract
In this paper separation e!ciency results for three di"erent demisters
acting on three di"erent fluid systems: Exxsol D60/nitrogen, a syn-
1
thetic natural gas and a real natural gas at a range of pressures up
to 114 bara are brought together using two dimensionless parameters:
1) a re-entrainment parameter and 2) the Weber number. The fact
that this can be achieved shows that demisting cyclones limited by
re-entrainment can be modeled by adapting re-entrainment concepts
derived for liquid films in a gravity film.
1 Introduction
Much research literature has been dedicated over the years to predict the
performance of cyclone dedusters and demisters acting on particles/droplets
close to their cut size. Both analytical models and CFD models have been
presented. While the former are still often superior in predicting the separa-
tion performance of a given cyclone, the latter can be valuable in revealing
details of the flow pattern in the separator that would otherwise not be rec-
ognized. In CFD, a very exiting development is that of large eddy turbulence
modelling (LES), which is very computationally intensive, but avoids much
of the empiricism in other types of turbulence models (see e.g. the recent
articles by Derksen et al. [1, 2]). However, CFD remains mainly useful for
studying the flow of pure gas or for low solids or liquid loadings; for high
loadings, with siginificant two-way coupling, CFD simulations becomes in-
creasingly unreliable and inaccurate.
However, in reality, for a separator acting at high liquid loading, the separa-
tion performance may well be dominated by re-entrainment of liquid rather
than penetration of liquid droplets under the separator’s cut size.
2
In particular in a commonly used gas scrubber configuration the last sep-
aration step, after an inlet vane and a mist mat, is a bank of axial-flow
cyclones and re-entrainment from the cyclones may well limit the separation
performance.
Only little research literature on high liquid loading in, and re-entrainment
from, demisting cyclones has been published. Ng et al. [3] studied flood-
ing and re-entrainment phenomena in once-through swirl tubes with upflow.
They installed and tested design improvements to the swirl vanes, using vanes
with peripheral rather than axial inflow, to delay the onset of flooding and
entrainment.
This paper describes how re-entrainment from a cyclone bank, acting as
the final separation internal in natural gas scrubbers, influences separation
e"ciency.
2 Re-entrainment mechanisms and two exist-
ing models
In this section an outline of the two dominating re-entrainment mechanisms
is given.
2.1 Mechanisms
Di!erent mechanisms of entrainment are dominant in di!erent flow regimes.
Ishii and Grolmes [4] summarize four basic mechanisms for entrainment from
3
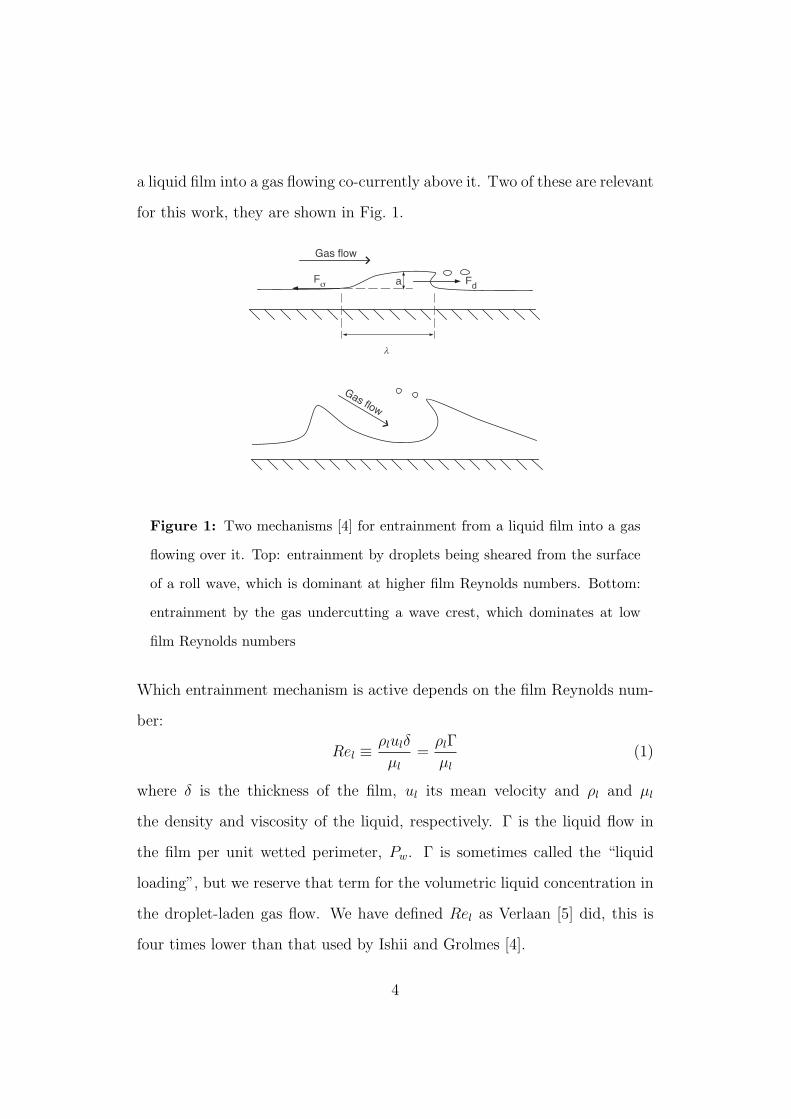
a liquid film into a gas flowing co-currently above it. Two of these are relevant
for this work, they are shown in Fig. 1.
Gas flow
Gas flow
a FdFσ
λ
Figure 1: Two mechanisms [4] for entrainment from a liquid film into a gas
flowing over it. Top: entrainment by droplets being sheared from the surface
of a roll wave, which is dominant at higher film Reynolds numbers. Bottom:
entrainment by the gas undercutting a wave crest, which dominates at low
film Reynolds numbers
Which entrainment mechanism is active depends on the film Reynolds num-
ber:
Rel !!lul"
µl=
!l#
µl(1)
where " is the thickness of the film, ul its mean velocity and !l and µl
the density and viscosity of the liquid, respectively. # is the liquid flow in
the film per unit wetted perimeter, Pw. # is sometimes called the “liquid
loading”, but we reserve that term for the volumetric liquid concentration in
the droplet-laden gas flow. We have defined Rel as Verlaan [5] did, this is
four times lower than that used by Ishii and Grolmes [4].
4
The paper of Ishii and Grolmes [4] states that there exists a lower limit of Rel,
whereunder roll-wave entrainment will not take place no matter how high the
gas velocity over the film. In the other extreme, at high Rel, where the film
is fully turbulent, the gas velocity necessary for the inception of entrainment
becomes independent of Rel. The two limits are not firmly quantified, but
the lower limit may be from 2 to 160 dependent on whether the flow is upward
or downward in the gravity field, and the upper limit may be in the range
1500–1750.
2.2 Higher liquid film Reynolds numbers, roll-wave en-
trainment
Ishii and Grolmes derived a criterion for the onset of roll-wave entrainment
by considering a force balance between the drag force Fd , from the gas acting
on a wave crest on the film, and the retaining force of the surface tension F!
as indicated in Fig. 1. They assumed that roll wave entrainment was possible
when the drag forces exceeded the retaining force of the surface tension #:
Fd " F!. (2)
They derived as criterion for the inception of entrainment:
µlug
#
!!g
!l" 11.78N0.8
µ Re!1/3l for Nµ #
1
15
µlug
#
!!g
!l" 1.35Re!1/3
l for Nµ "1
15
. (3)
In these equations, ug is the superficial gas velocity, µl and !l the liquid
viscosity and density, respectively, and !g the gas density.
5
Nµ is a ’viscosity number’, which originally was used by Hinze [6] to analyze
the problem of droplet disintegration in a gas flow. This number compares
the viscous force induced by an internal flow to the surface tension force,
and, when used for droplet entrainment, is defined as:
Nµ !µl!
!l#"
!g!"
, (4)
where $! is the di!erence between the liquid and gas densities.
The expression"
!g!" has the dimension of length and is proportional to the
critical wavelength of a Taylor instability. The dependence on the accelera-
tion of gravity, g, is explained by the stabilising e!ect of the gravity force on
the wavy interface.
2.3 Low film Reynolds numbers, undercut entrainment
When Rel becomes very low, the evidence is that the roll-wave entrainment
no longer occurs. However, entrainment is still possible at high gas velocities,
as found by van Rossum [7], through the undercut mechanism shown in the
lower figure in Fig. 1.
Van Rossum carried out entrainment experiments for nine di!erent fluids
with interfacial tension ranging from 30 to 78 mN/m. In his study, van
Rossum analyzed the onset of entrainment in terms of two dimensionless
numbers, the film Weber number, We, with the liquid film thickness as
length scale, and a ‘correlation parameter’, S:
We !!gv2
g"
#S ! ugµl
#. (5)
6

For velocities higher than 25 m/s he found that the critical Weber number for
inception of entrainment was practically independent of S for S > 5, while
it became dependent on S for lower S-values.
3 Experimental facilities
We are in this paper analyzing the results from three di!erent experimental
rigs. The rigs and the results have been described in three other articles [8–
10].
Each of the rigs have specific advantages and limitations. They are:
– A low-pressure rig. This rig could operate up to 7 bara, and two fluid
systems were used: air/water and air/Exxsol D60.
– A high-pressure rig, capable of operating up to 100 bara. Two fluid
systems were used: nitrogen/Exxsol D60 and a live natural gas synthe-
sized from methane, ethane and N-pentane.
– A large-scale test installation at an on-shore gas processing facility.
This rig could operate at pressures up to 150 bara. A real, live nat-
ural gas, obtained by recombining dry natural gas with natural gas
condensates, was used as fluid system.
The range of physical fluid properties are given in Table 1. Note that in
the “live” natural gas systems in the high-pressure and large-scale rigs the
physical properties of the liquid phase change so drastically with pressure
due to their changing composition, governed by the phase equilibria at the
7

given pressures. The interfacial tensions were calculated using the simple
method that Weinaug and Katz [11] used for methane-propane mixtures.
Fig. 2 shows a 3-D diagram of the test scrubber in the large-scale rig. The
configuration of the other two test scrubbers are similar, except that the
cross-sectional areas—and therefore the number of cyclones in the cyclone
banks—are di!erent. There are 7 cyclones in the scrubber in the low-pressure
rig, 2 in the high-pressure rig and 31 in the large-scale rig.
Figure 2: The test scrubber configuration in the large-scale rig. Lowest is
the inlet vane, in the middle the mist-mat and on top is the cyclone deck
The drainpipes and manifolds under the cyclones were arranged such that
they did not block the cyclones significantly. In the high-pressure and low-
pressure rigs, where there were only a few cyclones in the decks, the drain-
pipes were positioned at the side of the deck and did not interfere with the
cyclones at all. The arrangement in the large-scale rig is shown in Fig. 3.
Although the pipes can be seen to block part of the cross-sectional area, they
8

Table 1: Overview of the physical fluid properties, where relevant the pres-
sures in bara are given in parentheses
Density
(kg m!3)
Viscosity
(kg m!1 s!1)
Interfacial
tension
(mN m!1)
Low-pressure rig
Air 1.19 1.84$ 10!5
Exxsol D60 785 1.4$ 10!3 24.3
Water 1000 0.89$ 10!3 72.8
High-pressure rig, N2/Exxsol D60
Gas 1.14 (1)
113.7 (100)
1.78$ 10!5 (1)
2.03$ 10!5 (100)
Liquid % 788 % 1.58$ 10!3 22.7 (1)
16.0 (100)
High-pressure rig, synthetic natural gas
Gas 17.2 (20.1)
97.0 (92)
1.1$ 10!5 (20.1)
1.5$ 10!5 (92)
Liquid 602.2 (20.1)
496.5 (92)
2.07$ 10!3 (20.1)
0.96$ 10!3 (92)
11.4 (20.1)
2.2 (92)
Large-scale rig
Gas 22.0 (28)
104.0 (113)
1.2$ 10!5 (28)
1.6$ 10!5 (113)
Liquid 704 (28)
640 (113)
4.5$ 10!3 (28)
2.6$ 10!3 (113)
14.5 (28)
5.0 (113)
9
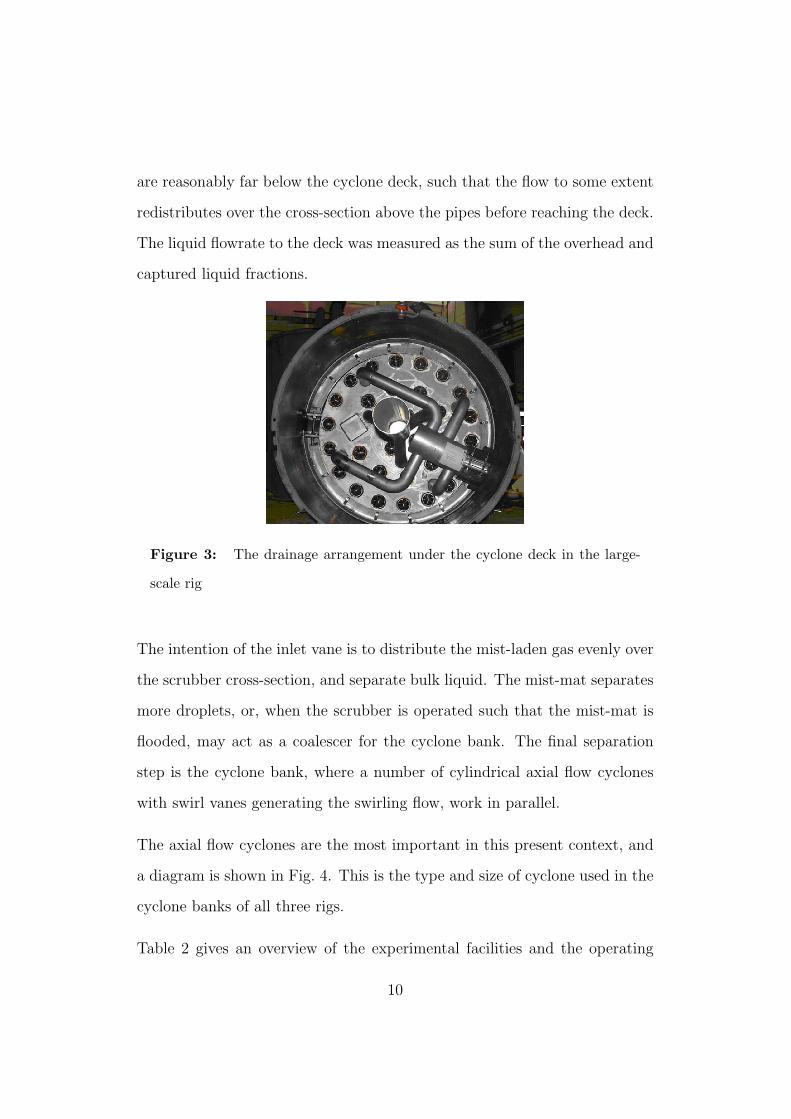
are reasonably far below the cyclone deck, such that the flow to some extent
redistributes over the cross-section above the pipes before reaching the deck.
The liquid flowrate to the deck was measured as the sum of the overhead and
captured liquid fractions.
Figure 3: The drainage arrangement under the cyclone deck in the large-
scale rig
The intention of the inlet vane is to distribute the mist-laden gas evenly over
the scrubber cross-section, and separate bulk liquid. The mist-mat separates
more droplets, or, when the scrubber is operated such that the mist-mat is
flooded, may act as a coalescer for the cyclone bank. The final separation
step is the cyclone bank, where a number of cylindrical axial flow cyclones
with swirl vanes generating the swirling flow, work in parallel.
The axial flow cyclones are the most important in this present context, and
a diagram is shown in Fig. 4. This is the type and size of cyclone used in the
cyclone banks of all three rigs.
Table 2 gives an overview of the experimental facilities and the operating
10

4 cm
25 cm
5 cm
Vortexfinder
Secondaryoutlet
Figure 4: A diagram of an axial flow cyclone constructed in accordance
with the cyclones used by Verlaan [5]. The cyclone is equipped with vertical
drainage slits as shown, and, in contrast to that of Verlaan, with a vortex
finder to reduce re-entrainment
11
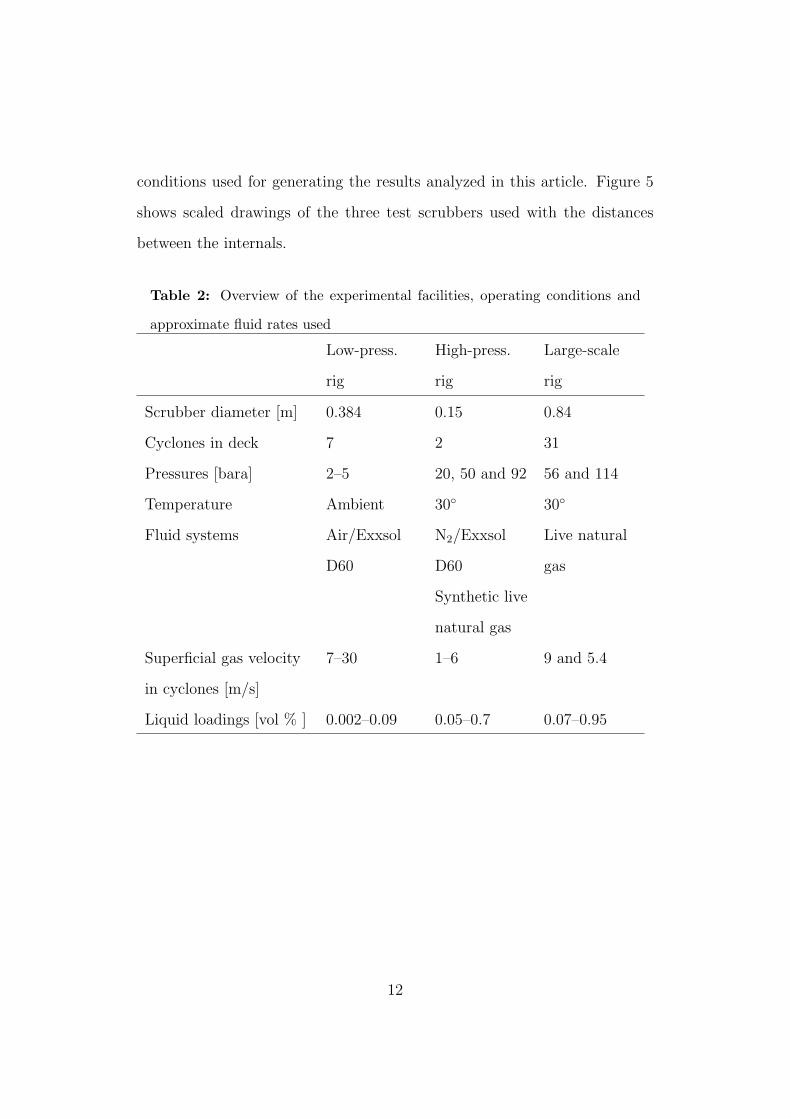
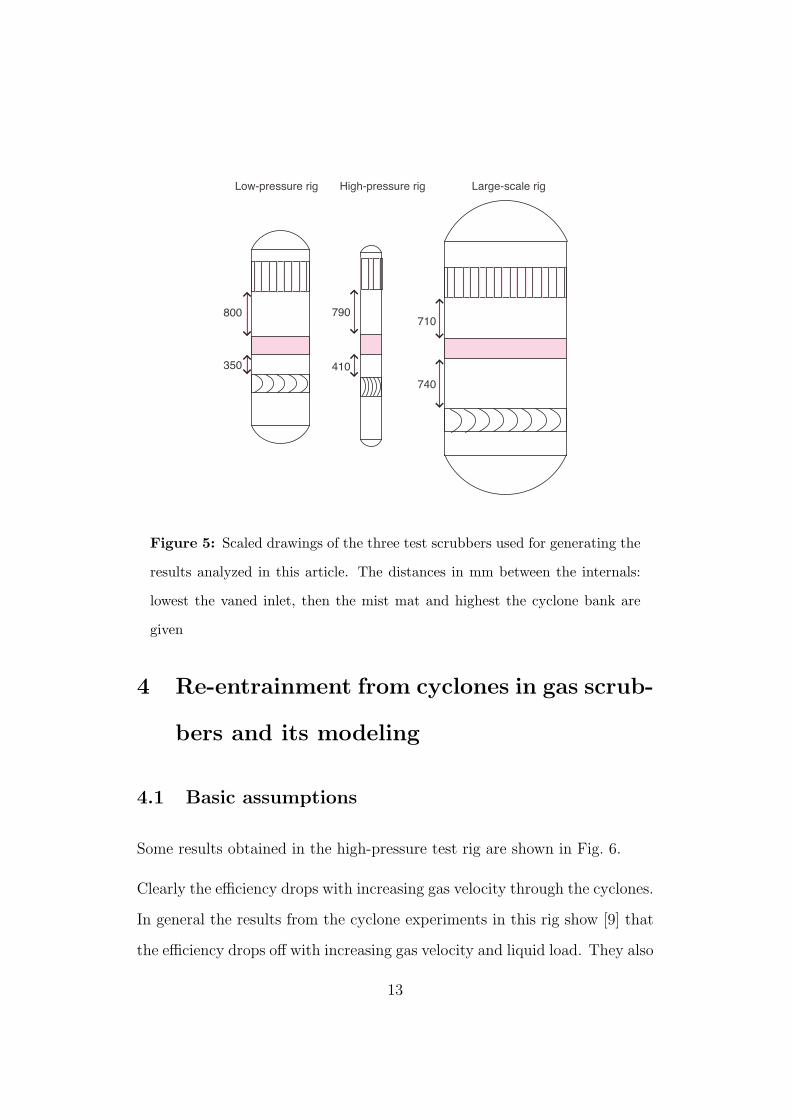
conditions used for generating the results analyzed in this article. Figure 5
shows scaled drawings of the three test scrubbers used with the distances
between the internals.
Table 2: Overview of the experimental facilities, operating conditions and
approximate fluid rates used
Low-press.
rig
High-press.
rig
Large-scale
rig
Scrubber diameter [m] 0.384 0.15 0.84
Cyclones in deck 7 2 31
Pressures [bara] 2–5 20, 50 and 92 56 and 114
Temperature Ambient 30" 30"
Fluid systems Air/Exxsol
D60
N2/Exxsol
D60
Synthetic live
natural gas
Live natural
gas
Superficial gas velocity
in cyclones [m/s]
7–30 1–6 9 and 5.4
Liquid loadings [vol % ] 0.002–0.09 0.05–0.7 0.07–0.95
12
800
350 410
790
740
710
Low-pressure rig High-pressure rig Large-scale rig
Figure 5: Scaled drawings of the three test scrubbers used for generating the
results analyzed in this article. The distances in mm between the internals:
lowest the vaned inlet, then the mist mat and highest the cyclone bank are
given
4 Re-entrainment from cyclones in gas scrub-
bers and its modeling
4.1 Basic assumptions
Some results obtained in the high-pressure test rig are shown in Fig. 6.
Clearly the e"ciency drops with increasing gas velocity through the cyclones.
In general the results from the cyclone experiments in this rig show [9] that
the e"ciency drops o! with increasing gas velocity and liquid load. They also
13
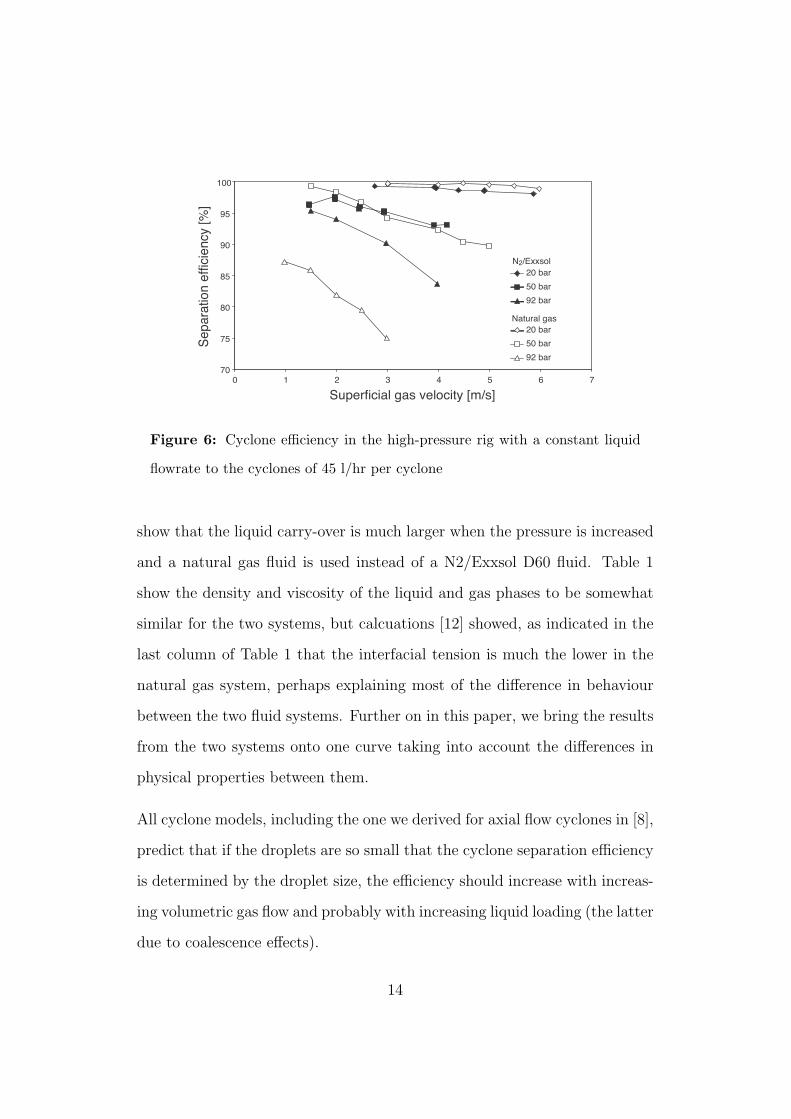
70
75
80
85
90
95
100
0 1 2 3 4 5 6 7
Superficial gas velocity [m/s]
Sepa
ratio
n ef
ficie
ncy
[%]
20 bar50 bar92 bar
20 bar50 bar92 bar
N2/Exxsol
Natural gas
Figure 6: Cyclone e!ciency in the high-pressure rig with a constant liquid
flowrate to the cyclones of 45 l/hr per cyclone
show that the liquid carry-over is much larger when the pressure is increased
and a natural gas fluid is used instead of a N2/Exxsol D60 fluid. Table 1
show the density and viscosity of the liquid and gas phases to be somewhat
similar for the two systems, but calcuations [12] showed, as indicated in the
last column of Table 1 that the interfacial tension is much the lower in the
natural gas system, perhaps explaining most of the di!erence in behaviour
between the two fluid systems. Further on in this paper, we bring the results
from the two systems onto one curve taking into account the di!erences in
physical properties between them.
All cyclone models, including the one we derived for axial flow cyclones in [8],
predict that if the droplets are so small that the cyclone separation e"ciency
is determined by the droplet size, the e"ciency should increase with increas-
ing volumetric gas flow and probably with increasing liquid loading (the latter
due to coalescence e!ects).
14
However, if re-entrainment is the determining factor, the e"ciency would
be expected to drop o! with higher volumetric gas flow and liquid loadings.
Since this is the case in the results from the three rigs, we assume that the
liquid carry-over from the cyclones is dominated by re-entrainment of liquid
that has already settled on the cyclone wall.
We now attempt to derive a parameter that will unify the results on the basis
of Ishii and Grolmes’ [4] work. While they were only focusing on the inception
of re-entrainment, this study also focuses on the the rate of re-entrainment.
Near the point of inception of droplet entrainment, the entrainment rate
increases quite slowly with increasing gas velocity, but at relatively high
entrainment fraction the entrainment rate increases faster and appears to
be linearly correlated with the superficial gas velocity. Since the droplets
that are re-entrained inside a cyclone are exposed to a centrifugal force one
can think of liquid carry-over as a dynamic equilibrium between capture and
re-entrainment at the inner wall or the outlet of the cyclone.
We propose that this dynamic equilibrium can be described as a function of
the ratio of the two forces used by Ishii and Grolmes, the drag force and the
retaining force:
$cycl = f
#Fd
F!
$when re-entrainment dominates. (6)
We are aware that re-entrainment may well take place to a large extent
from edges in the separator. For instance, Verlaan [5] states that rivulets
formed at the edges of the slits in his separators, and that this limited the
separation e"ciency. However, he used liquids with higher interfacial tension,
and generally lower liquid loading, which will give rise to di!erent creep flows
15
than we are likely to encounter in our systems. We assume, moreover, that
re-entrainment from edges in the equipment will be governed by the same
physical parameters as from liquid films.
We need, however, to adapt this theory to the present situation: a film
moving on the wall of a cyclone in a strongly swirling flow.
4.2 Adaptation of the theory
The first task is to determine Rel, the liquid film Reynolds number in Eq. (1).
Under the influence of the upward swirling gas flow, the film moves upward
on the cyclone wall at an an angle, %, to the horizontal. We can therefore take
the wetted perimeter as Pw = &D/ cos %, if we define the wetted perimeter as
the width of the film measured normal to the direction of flow (a consequence
is that the wetted area cannot be calculated as PwH, with H the cyclone
height). The gas moves at an angle ' to the horizontal, where ' is the exit
angle from the swirl vanes, and as an approximation we assume that the
liquid moves at the same angle, i.e. % = '.
If we further assume that the captured fraction $ of the total liquid flow to
the cyclone Q̇ moves in the liquid film, i.e. that most of the droplets entering
the cyclone are so large that they are slung to the wall almost immediately,
we obtain for Rel:
Rel =Q̇l$!l
Pwµl. (7)
Ishii and Grolmes found that the transition from low Reynolds number
entrainment to transition regime entrainment occurred at approximately
16
Rel = 160 (their definition) for horizontal flow or vertical up-flow and Rel = 2
for vertical down-flow. The transition to a rough turbulent regime occurred
when Rel exceeded 1500–1750. When Rel is calculated for the experiments
in the high-pressure rig, most of the N2/Exxsol D60 results are found to be in
the low Reynolds number regime, while most of the natural gas experiments
are found to be within the transition regime. If transition regime theory is
used for experiments that are calculated to be within low Reynolds number
regime, the results will become increasingly inaccurate as the velocity is de-
creased. However, on balance it was thought best to use the same theory
for all the results avoiding an anomalous jump in prediction when changing
from one theory to the other. All the results from the high-pressure rig are
therefore treated as if they were within the transition regime in this analysis.
The theory of Ishii and Grolmes is based on two fundamental assumptions:
1. The initiation of roll-wave entrainment depends on a balance between
the gas drag force and the surface tension retaining force acting on the
liquid in a wavelet.
2. To calculate the amplitude, a, of a wavelet, it was assumed that the
flow in the wavelet is simple shear flow, while flow in the film as such
may be turbulent, and that the shear stresses above and below the wave
are the same as those for the rest of the film (the shear stress acting
on the film from the gas and that acting on the wall from the film have
to be equal, since the film is not accelerating).
This paper is not discussing the merits of these assumptions but adapting
this model, that has stood the test of time, to our system, which di!ers from
17
theirs in that it involves a centrifugal field rather than the gravitational one.
We also note here that Verlaan [5] handles two criteria for re-entrainment
to take place: that droplets are created by shear, and that these droplets
are transported in the surrounding gas flow. Consistent with the work of
Ishii and Grolmes, we focus on the creation of droplets here, but, as stated
above, consider that a model must describe the dynamic equilibrium between
re-entrainment and capture at the cyclone wall.
The length scale chosen for Nµ,"
!g!" is the critical wavelength of a Taylor
instability, and therefore characteristic for the length of waves on the film.
This length scale involves the gravitational constant, g. We replace this
by the centrifugal force acting on the liquid film, u2l,#/R, where ul,# is the
tangential component of the liquid velocity, and R the cyclone radius.
This makes it necessary to find ul,# = ul cos %, which we do in a way similar
to Ishii and Grolmes, as follows.
If we call the tangential components of the shear stresses acting on the film
due to the gas and on the wall due to the film (i,# and (w,#, respectively, we
can say:
(i,# = fg,i
!gu2r,#
2% fg,i
!gu2g,#
2(w,# = fl,w
!lu2l,#
2= (i,#, (8)
where ur is the relative velocity between the liquid and the gas, assumed to
be approximately equal to the gas velocity, since ug & ul.
Solving these two equations for ul,# gives:
ul,# =
%fg,i!gu2
g,#
fl,w!l(9)
18
We need the friction factor for the gas flow over the liquid film, fg,i. Wallis [13]
proposed for the rough wavy regime in a tube of diameter D:
fg,i = 0.005
#1 + 300
"
D
$.
For the present case of flow swirling with an angle of about 45", we propose
to replace D by R, the radius of the cyclone:
fg,i = 0.005
#1 + 300
"
R
$.
The liquid friction factor, fl,w, can, following Ishii and Grolmes, be obtained
from the empirical correlation for a liquid film given by Hughmark [14]
&fl,w = K · Rem
l where:
'(
)K = 3.73; m = '0.47 for 2 < Rel < 100
K = 1.96; m = '1/3 for 100 < Rel < 1000
The gas friction factor requires information about the liquid film thickness.
Obviously:
" =Q̇l
Pwul=
Q̇l cos %
Pwul,#=
Q̇l cos2 %
&Dul,#(10)
We now have two expressions for the two unknown variables " and ul,#.
ug,# is the last parameter we need to find ul,# from Eq. (9) in order to evaluate
the “centrifugal force” acting on the rotating liquid film. Clearly:
ug,# =uz
tan %.
Measurements [15] have shown that the mean axial velocity in the cyclone
(uz) is approximately 0.8 times that at the wall, and that the axial flowpat-
tern is fairly uniform throughout the cyclone, so that:
ug,# =(uz)
0.8 tan %(11)
19
4.3 The re-entrainment number
Based on the calculated Rel for the experiments in the high-pressure rig,
most experiments seem to be within the transition regime, where entrainment
depends on Rel as explained above. For all experiments in that rig, Nµ <
1/15.
Assuming that transition regime is the dominant liquid film regime on the
inner cyclone wall, the top criterion in Eq. (3) can be used in the force ratio
in Eq. (6) and, hence, we get the re-entrainment number:
Rent(a) =
µlug
!
""g
"l
NaµRe!1/3
l
(12)
where, as discussed above, g is replaced by u2l,#/R in Eq. (4) for the evaluation
of Nµ. The argument a signifies that the power of the viscosity number is
as yet undetermined. We can thus say that the cyclone e"ciency, $cycl is a
function of Rent(a):
$cycl (Rent(a)) = f
*
+µlug
!
""g
"l
NaµRe!1/3
l
,
- . (13)
Ishii and Grolmes adjusted the power, a, of the viscosity number, Nµ, to fit
their data for the inception of the entrainment. The power should there-
fore be adjusted to the cyclone experiments. The power of Nµ is important
when experiments with di!erent physical fluid properties like natural gas and
N2/Exxsol are scaled.
The re-entrainment number for all experiments that have been carried out in
the high-pressure rig have been calculated in accordance with Eq. (13) and
20

are plotted in Fig. 7. Since many of the experiments with low liquid loading
showed increasing e"ciency with increasing gas flow, it was assumed that
droplet size played an essential role for the e"ciency at these low loadings.
Therefore only experiments were the liquid load exceeded 9 l/hr have been
included in the plot.
0 0.5 1 1.5 2 2.5 3
Reentrainment Number [-]
Sepa
ratio
n ef
ficie
ncy
[%]
20 bar50 bar92 bar
20 bar50 bar92 bar
N2/Exxsol Natural gas
70
75
80
85
90
95
100
Figure 7: The cyclone e!ciency in the high-pressure rig as function of the
re-entrainment number ([µlug/!]["g/"l]0.5)/(N0.4µ Re!1/3
l ). The plot includes
superficial gas velocities of 1–6 m/s, and liquid loads of 0.0009–0.007 vol%
Although these results and the ones shown in the following figure cover a
wide range of operating conditions and also di!erent fluid systems, they are
all obtained in one type of cyclone and may well be geometry dependent.
However, the general mechanisms governing reentrainment in other types of
cyclones are likely to be the same.
The power a = 0.4 gives a good fit between the natural gas and Exxsol
D60 data as seen in the figure. However, the pressure scaling, although
good, could be even better. One may therefore think that the gas and liquid
21

densities could be accounted for more precisely. For this reason the power of
the gas to liquid density ratio was subjected to regression and a good scaling
was found with a power of 0.8, as seen in Fig. 8.
0 0.5 1 1.5 2 2.5 3
Reentrainment Number [-]
Sepa
ratio
n ef
ficie
ncy
[%]
20 bar50 bar92 bar
20 bar50 bar92 bar
N2/Exxsol Natural gas
70
75
80
85
90
95
100
Figure 8: The data from Fig. 7 plotted against the modified re-entrainment
number ([µlug/!]["g/"l]0.8)/(N0.4µ Re!1/3
l )
The excellent correlation between the cyclone e"ciency and the re-entrainment
number confirms that the cyclone e"ciency is dominated by liquid film re-
entrainment rather than the penetration of fine droplets. The plot in Fig. 8
can be regarded as the maximum achievable e"ciency due to limitations
caused by re-entrainment for this particular geometry. However, if a signifi-
cant amount of droplets comparable to the cut size of the cyclone are present
in the inlet liquid loading, an extra contribution will be added to the liquid
carry-over of the cyclone. Experiments with such contributions will have
lower e"ciency than predicted by the re-entrainment number solely.
There is still some scatter in the results in Fig. 8, but with all the simplifi-
22

cations done and the complex process of gas-liquid interactions involved, the
correlation is still remarkably good. Some of the scatter might also be caused
by liquid carry-over due to the presence of small droplets, especially for the
high-pressure natural gas case. Some of the most important simplifications
are:
– Gradual drainage of liquid film through the slits in the cyclone wall has
not been accounted for
– The film is assumed to be evenly distributed on the wall
– Transition regime entrainment is assumed even though some of the
experiments appear to have a liquid Reynolds number smaller than the
limit given by Ishii and Grolmes
Finally, it is possible that wavelet behaviour in a centrifugal field, where the
centripetal acceleration varies with the radius, is somewhat di!erent from
that in a gravity field.
4.4 Re-entrainment at low pressures, the Weber num-
ber
As in the high-pressure rig, the cyclone e"ciency from the low-pressure rig
shows a general tendency of decreasing e"ciency with increasing gas and
liquid flow, consistent with re-entrainment limitation. Figure 9 shows sep-
aration e"ciency data from the low-pressure rig plotted against superficial
velocity in the cyclones. The physical properties of the fluids are given in
23

Table 1. The pressure was not varied independently in this rig, but was
always in the range 2–7 bara.
Superficial gas velocity [m/s]
Effic
ienc
y [%
]
70
75
80
85
90
95
100
6 8 10 12 14 16 18 20 22 24 26 28 30
0.068-0.094 Vol%0.02-0.024 Vol% 0.002-0.003 Vol%
0.02-0.06 Vol%0.028-0.036 Vol%0.0018-0.0026 Vol%
Exxsol: Water:
Figure 9: Separation e!ciency in the low-pressure rig plotted against the
superficial velocity in the cyclones. The liquid loadings are given in the legends
However, at low pressure the calculated values for Rel indicate that the
liquid film is below the regime where roll-wave entrainment is possible. If
these results are plotted against the re-entrainment number the decrease in
performance is much faster than in the high-pressure rig, as seen in Fig. 10.
However, the re-entrainment number appears to bring also the low-pressure
rig results, which were obtained [8] under a wide range of gas and liquid
flows, and with two di!erent fluid systems, onto one curve.
Since the velocity is considerably higher in the low-pressure rig, re-entrainment
is still possible by the undercut mechanism. However, as we also mentioned
above, at these low values of Rel, the film Weber number can better be used
24

0 0.5 1 1.5 2 2.5 3
Reentrainment Number [-]
Sepa
ratio
n ef
ficie
ncy
[%]
20 bar50 bar92 bar
20 bar50 bar92 bar
N2/Exxsol Natural gas
70
75
80
85
90
95
100
Results from low-pressure rig with Exxsol D60
Figure 10: A comparison between the cyclone e!ciency in the high-pressure
and the low-pressure rigs in terms of the modified re-entrainment number
([µlug/!]["g/"l]0.8)/(N0.4µ Re!1/3
l ). The data from the low-pressure rig include
cyclone superficial gas velocities in the range 6–30 m/s and liquid loads in the
range 0.002–0.09 vol%
25
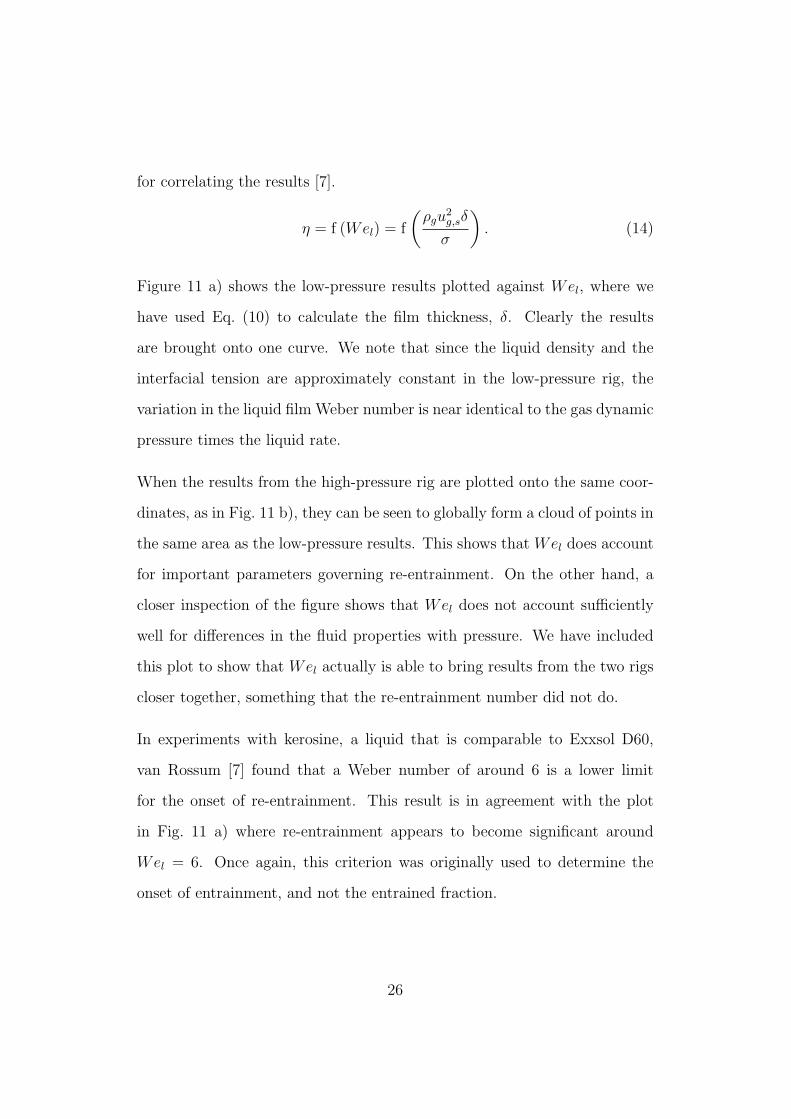
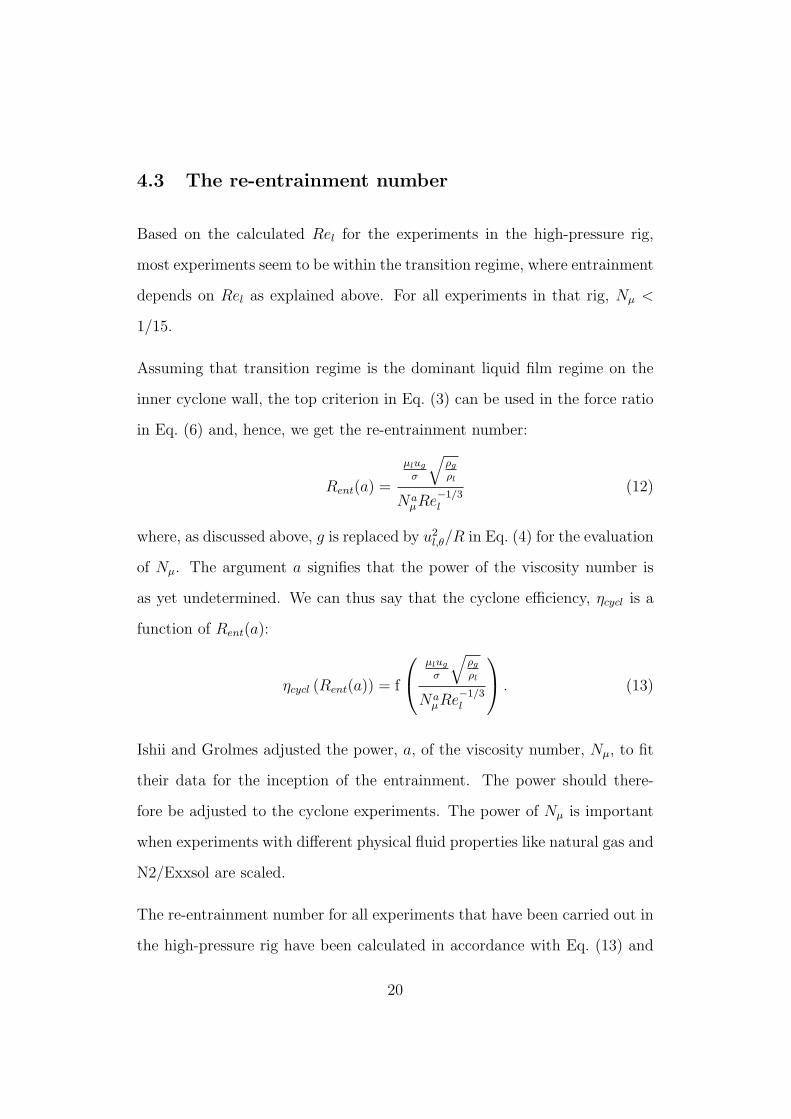
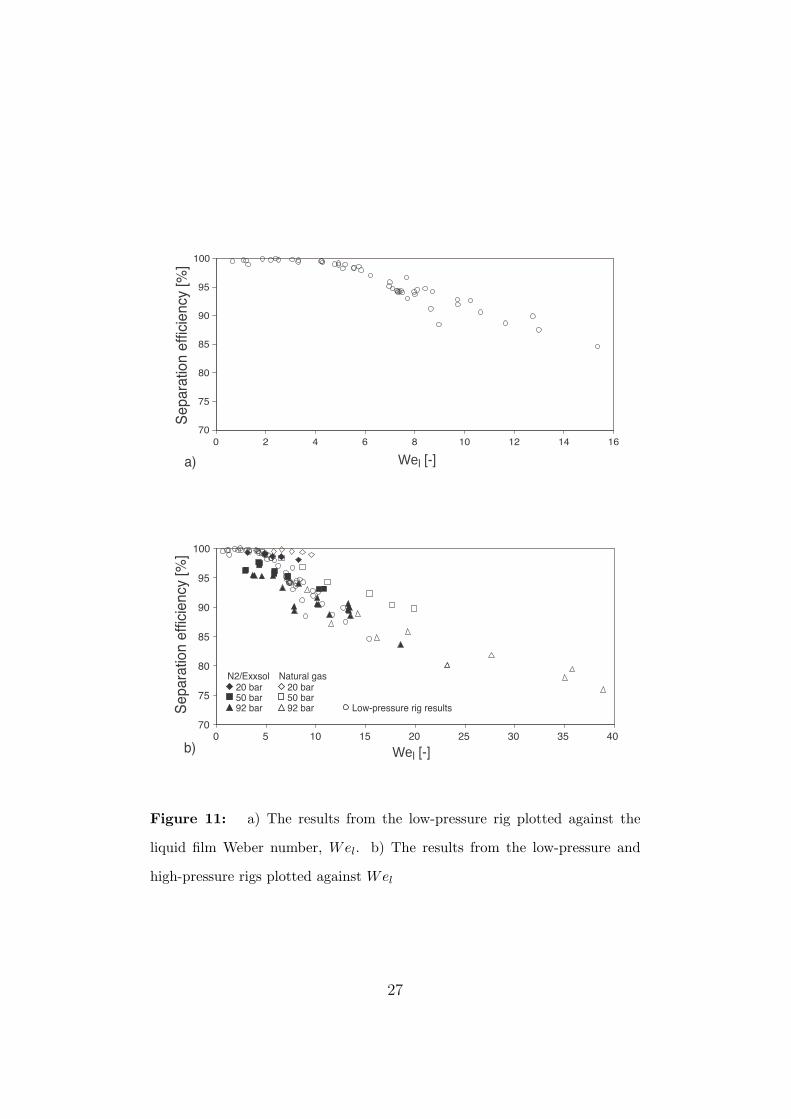
for correlating the results [7].
$ = f (Wel) = f
#!gu2
g,s"
#
$. (14)
Figure 11 a) shows the low-pressure results plotted against Wel, where we
have used Eq. (10) to calculate the film thickness, ". Clearly the results
are brought onto one curve. We note that since the liquid density and the
interfacial tension are approximately constant in the low-pressure rig, the
variation in the liquid film Weber number is near identical to the gas dynamic
pressure times the liquid rate.
When the results from the high-pressure rig are plotted onto the same coor-
dinates, as in Fig. 11 b), they can be seen to globally form a cloud of points in
the same area as the low-pressure results. This shows that Wel does account
for important parameters governing re-entrainment. On the other hand, a
closer inspection of the figure shows that Wel does not account su"ciently
well for di!erences in the fluid properties with pressure. We have included
this plot to show that Wel actually is able to bring results from the two rigs
closer together, something that the re-entrainment number did not do.
In experiments with kerosine, a liquid that is comparable to Exxsol D60,
van Rossum [7] found that a Weber number of around 6 is a lower limit
for the onset of re-entrainment. This result is in agreement with the plot
in Fig. 11 a) where re-entrainment appears to become significant around
Wel = 6. Once again, this criterion was originally used to determine the
onset of entrainment, and not the entrained fraction.
26
Wel [-]0 2 4 6 8 10 12 14 16
Sepa
ratio
n ef
ficie
ncy
[%]
20 bar50 bar92 bar
N2/Exxsol
Low-pressure rig results
20 bar50 bar92 bar
Natural gas
b)0 5 10 15 20 25 30 35 40
Sepa
ratio
n ef
ficie
ncy
[%]
a)
70
75
80
85
90
95
100
70
75
80
85
90
95
100
Wel [-]
Figure 11: a) The results from the low-pressure rig plotted against the
liquid film Weber number, Wel. b) The results from the low-pressure and
high-pressure rigs plotted against Wel
27
4.5 The influence of scale
The e"ciency in the high-pressure rig is totally dominated by re-entrainment,
at least for liquid flows per cyclone above 9 l/hr. However, in the experiments
at K-lab it was seen that outer cyclones in the cyclone deck handled up to 2.5
times the amount of liquid that the inner cyclones handled [10], due to cross-
sectionally uneven liquid distribution. Since the cyclone e"ciency generally
drops o! with increasing liquid load the outer cyclones might su!er from
poorer e"ciency. If, in addition, some of the cyclones in the middle of the
cyclone deck receive a small amount of liquid but distributed as a fine mist,
this might also have a negative impact on the e"ciency. Based on earlier
experience [16] we believe that the uneven distribution to some extent is due
to the vaned inlet not distributing the liquid and gas ideally over the column
cross-section.
In the small scale high-pressure rig only two cyclones where installed and
obviously, little liquid mal-distribution could have occurred. Therefore, the
e"ciency in the this rig can be regarded as the maximum e"ciency when the
e"ciency is limited by re-entrainment.
In Figure 12 the measured cyclone e"ciency at the large scale rig is compared
to the maximum e"ciency found in the high-pressure rig. The results are
plotted as function of the re-entrainment number and the average liquid load
per cyclone has been used as input in the calculations.
The figure shows that the cyclone deck in the K-lab tests is very influenced
by the poor liquid distribution. In fact, in one case the e"ciency drops from
an expected maximum e"ciency of more than 80% down to approximately
28

Sepa
rarti
on e
ffici
ency
[%]
3035404550556065707580859095
100
0 0.5 1 1.5 2 2.5 3
55 barg113 barg
Maximum efficiency due to reentrainment
Reentrainment Number [-]
20 bar50 bar92 bar
20 bar50 bar92 bar
N2/Exxsol Natural gasHigh-pressure rig
K-lab
Figure 12: The cyclones in the large scale rig su"er from reduced e!ciency
compared to the results from the high-pressure rig. The maximum e!ciency
found in the high-pressure rig is indicated and extrapolated. The large-scale
rig results include cyclone superficial gas velocities of 9 m/s and 4.3–5.4 m/s
(at 56 and 114 bara, respectively) and liquid loadings in the approximate range
0.06–0.095 vol%
29
40%.
This e!ect of severely reduced e"ciency at larger scale has, to the authors’
knowledge, never before been documented. The result is very important,
since it demonstrates how much the e"ciency of a large scale scrubber can
deviate from the e"ciency found in a small scale lab—even when the gas
velocity, the liquid concentration and the fluid properties are identical. The
re-entrainment number o!ers an analysis tool to quantify the impact of liquid
mal-distribution.
5 Concluding Remarks
– A first step in the direction of modelling and scaling cyclone e"ciency
when this is limited by re-entrainment rather than by separation e"-
ciency for small droplets has been outlined
– Results with di!erent fluid systems and spanning wide ranges of pres-
sures, gas flowrates and liquid loadings have been brought to collapse on
one curve by plotting them against a modified re-entrainment number
derived on basis of the theory for the onset of roll-wave re-entrainment
of Ishii and Grolmes [4]. All the results were obtained under conditions
such that the Reynolds number of the liquid film on the cyclone wall,
Rel was moderate or high.
– Results generated at lower pressures, where Rel is lower, but also for
two di!erent fluid systems, and at a wide range of gas and liquid flows,
were brought to collapse on one curve when plotted against the liq-
30
uid film Weber number, agreeing with the work on the onset of re-
entrainment at low Rel of van Rossum [7].
– An important e!ect of scale in reducing the e"ciency of cyclone banks,
probably due to mal-distribution of liquid between the cyclones, has
been documented.
– For further understanding of the phenomena taking place, measure-
ments of the droplet sizes throughout the equipment are desirable, and
achieving this will have a high priority in the future.
Acknowledgment
Financial support from the Research Council of Norway through the HiPGaS
programme, and the industrial sponsors Statoil AS, ConocoPhillips, Norsk
Hydro AS, Vetco, FMC Kongsberg Subsea and Aker-Kværner is highly ap-
preciated.
References
[1] J. J. Derksen. Separation performance predictions of a Stairmand high-
e"ciency cyclone. AIChE Journal, 49:1359–1371, 2003.
[2] J. J. Derksen, S. Sundaresan, and H. E. A. van den Akker. Simulation of
mass-loading e!ects in gas-solid cyclone separators. Powder Technology,
163:59–68, 2006.
31

[3] S. Y. Ng, G. H. Priestman, and R. W. K. Allen. Investigation of flooding,
re-entrainment and grade e"ciency in axial flow cyclones. Chem. Eng.
Res. & Des., 84:884–894, 2006.
[4] M. Ishii and M. A. Grolmes. Inception criteria for droplet entrainment
in two-phase concurrent film flow. AIChE Journal, 21:308–318, 1975.
[5] C. C. J. Verlaan. Performance of novel mist eliminators. PhD thesis,
Delft University of Technology, 1991. ISBN 90-370-0054-1.
[6] J. O. Hinze. Fundamentals of the hydrodynamic mechanism of splitting
in dispersion processes. AIChE Journal, 1:289–295, 1955.
[7] J. J. van Rossum. Experimental investigation of horizontal liquid films :
Wave formation, atomization, film thickness. Chem. Eng. Sci., 11:35–52,
1959.
[8] T. Austrheim, L. H. Gjertsen, and A. C. Ho!mann. An experimental
investigation of scrubber internals at conditions of low pressure, 2006.
submitted.
[9] T. Austrheim, L. H. Gjertsen, and A. C. Ho!mann. Experimental in-
vestigation of the performance of a large-scale scrubber operating at
elevated pressure on live natural gas, 2006. submitted.
[10] T. Austrheim, L. H. Gjertsen, and A. C. Ho!mann. Is the Souders-
Brown equation su"cient for scrubber design? An experimental inves-
tigation at elevated pressure with hydrocarbon fluids, 2006. submitted.
[11] C. F. Weinaug and D. L. Katz. Surface tension of methane-propane
mixtures. Industrial & Engineering Chemistry, 35:239–246, 1943.
32

[12] T. Austrheim. Experimental characterization of high-pressure natural
gas scrubbers. PhD thesis, University of Bergen, 2006.
[13] G. B. Wallis. One-dimensional two-phase flow. McGraw-Hill, New York,
1969.
[14] G. A. Hughmark. Film thickness, entrainment, and pressure-drop in
upward annular and dispersed flow. AIChE Journal, 5:1062–1065, 1973.
[15] S. Jacobsson. Single-phase characterization of the verlaan cyclone. Mas-
ter’s thesis, University of Bergen, Dept. of Physics and Technology, 2005.
[16] L. H. Gjertsen, K. V. Lokken, N. Marheim, and J. Ophaug. Separation
e"ciency of the Troll Kollsnes separators and the improvment in their
perfomance. In GPA 82nd Annual Convention, New Orleans, 2003.
33


![Demisting using an ultrasonic standing wave fieldjsaylor/paperPdfs/jasa.v141...[MRH] Pages: 172–182 I. INTRODUCTION A. Motivation Demisting, the removal of liquid drops from a gas](https://img.pdfslide.us/doc/110x75/611b6401ccc59210d9068579/demisting-using-an-ultrasonic-standing-wave-field-jsaylorpaperpdfsjasav141.jpg)