Embed Size (px)
Citation preview

RD 14 Nursing Sensitive Quality Indicators
Maintenance of Skin Integrity
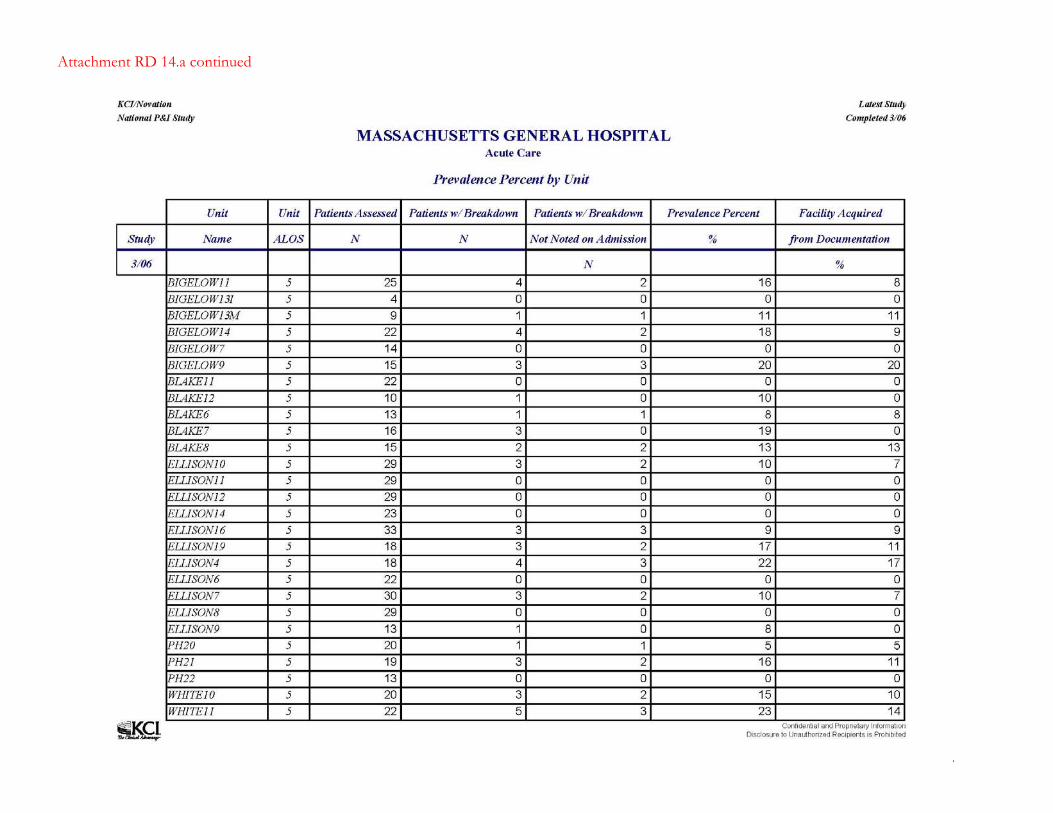
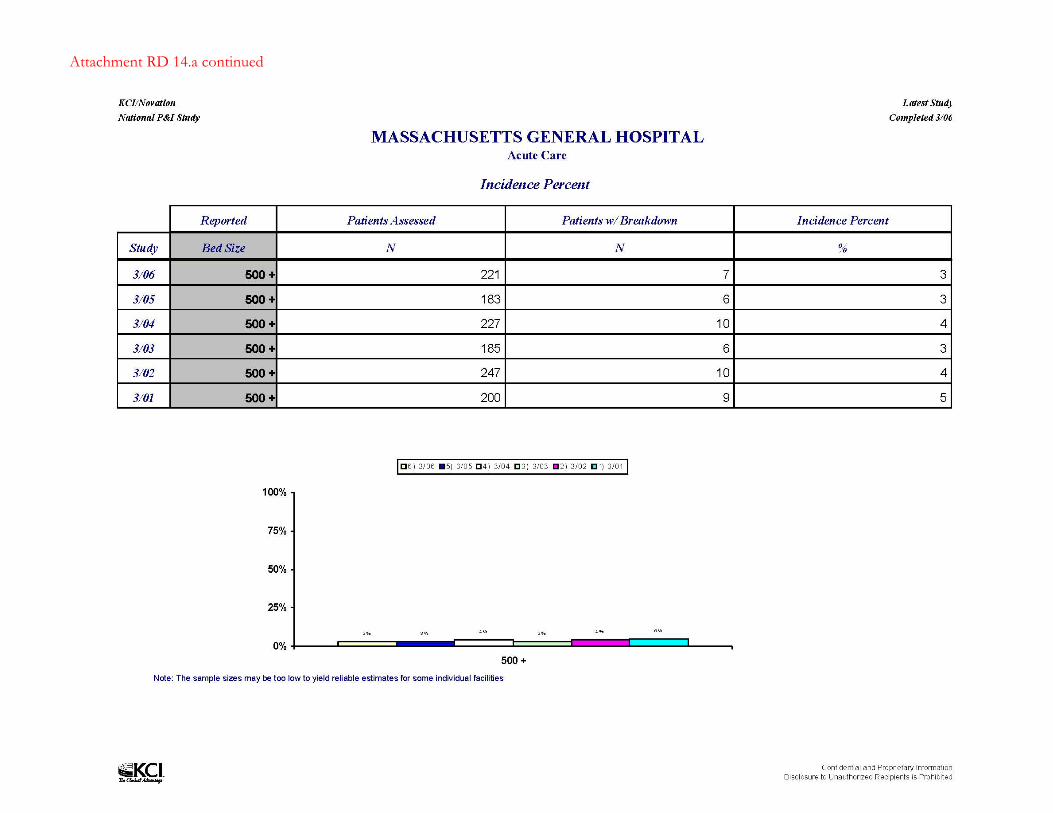
Massachusetts General Hospital (MGH) participated in the KCI/Novation National
Prevalence and Incidence (P&I) study from 2003 through 2006. The survey is conducted annually
and involves data collection and submission for 31 patient care units. The results for these years
consistently demonstrated that the prevalence and incidence rates for pressure ulcers at MGH were
below national benchmarks.
2003 2004 2005 2006KCI/Novation* 15% 16% 16% 15%
MGH 11% 14% 14% 10%
2003 2004 2005 2006KCI/Novation* 7% 7% 8% 7%
MGH 3% 4% 3% 3%
# Participating Facilities 232 240 246 260
* Facilities with 500+ beds
KCI/Novation Prevalence Study (Pre-existing and Hospital-Acquired)
KCI/Novation Incidence Study (Hospital Acquired)
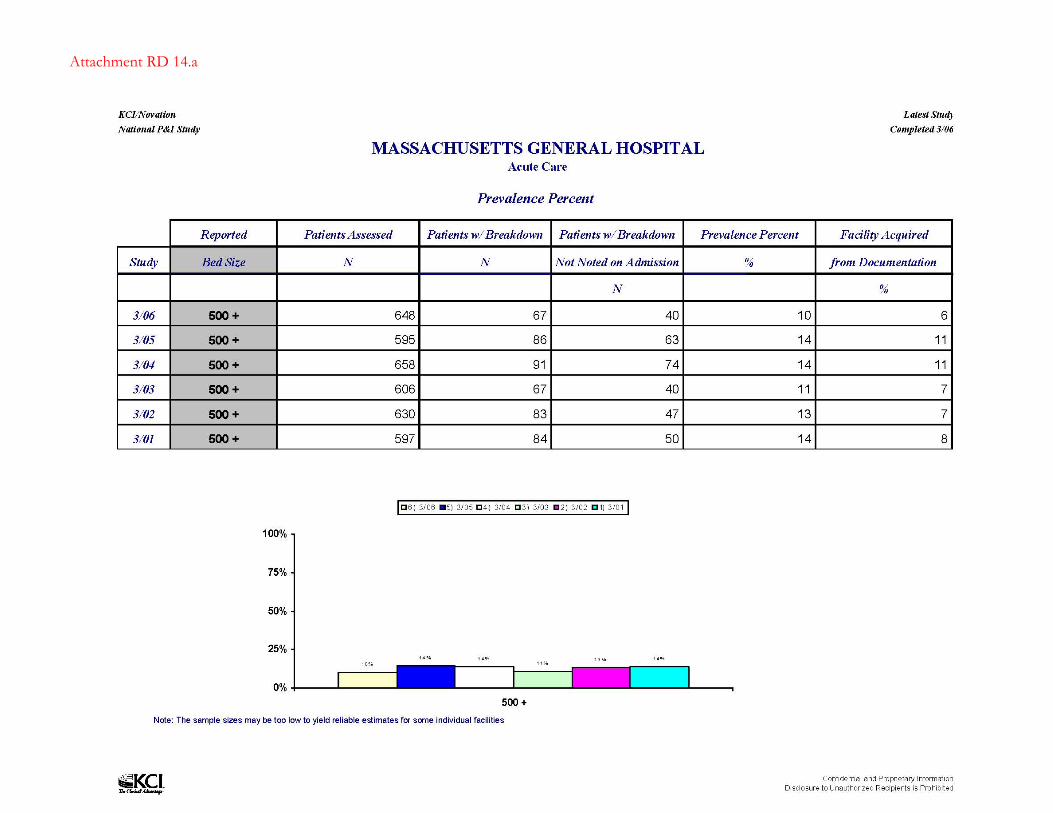
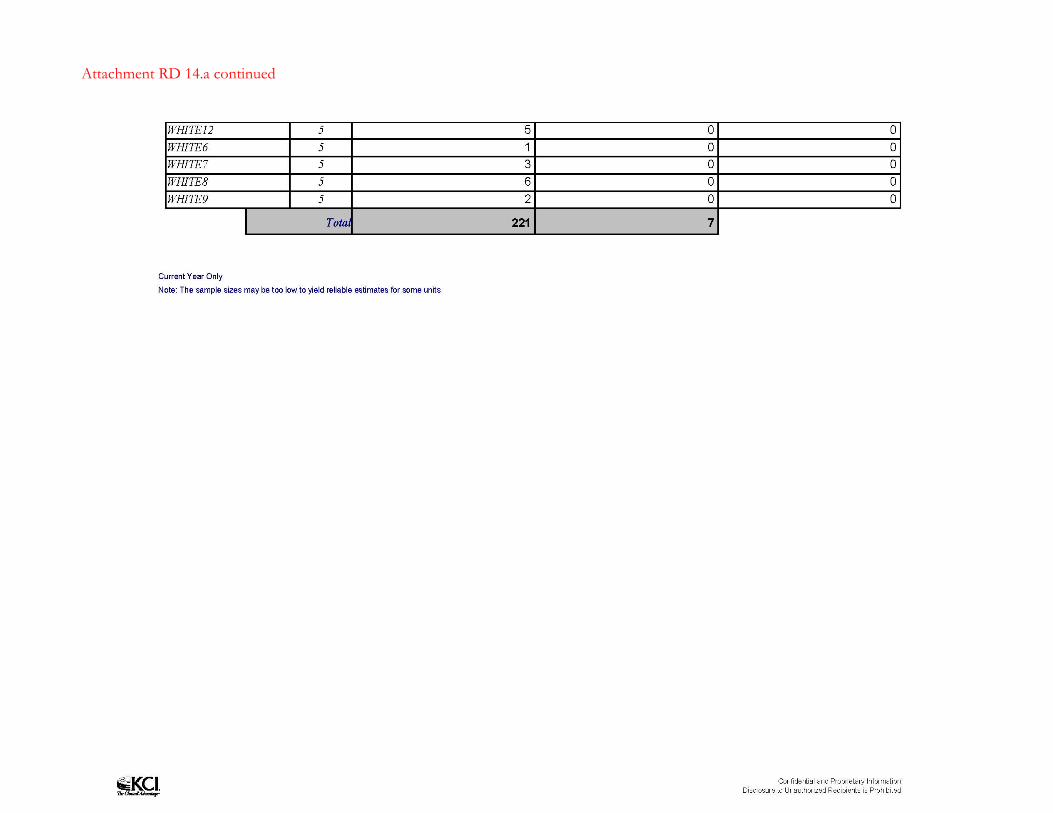
The data submitted in 2006 for each unit, the resulting rates for pressure ulcer prevalence
and incidence, and the benchmarks for that year are provided as attachment RD.14.a.
In late 2006, the Massachusetts Patients First Initiative (attachment RD 14.b) selected
Pressure Ulcer Incidence as a quality indicator that would be monitored and reported for all
hospitals in the state. The National Quality Forum (NQF) endorsed methodology was selected for
the study, which differed significantly from the KCI/Novation data collection. In March 2007, a
decision was made to no longer participate in the KCI/Novation study and data was collected for
the first time using the NQF methodology. The Patients First Initiative provided participating
hospitals with their rates for hospital acquired pressure ulcers and state-wide benchmarks, however
discussions with facilities throughout the state indicated problems adapting to the NQF data
collection requirements and resulting concerns regarding data integrity. Hospitals were provided
1

with additional guidance and education regarding data collection. At MGH, Clinical Nurse
Specialists conducted two additional surveys in an effort to assure consistent data collection for all
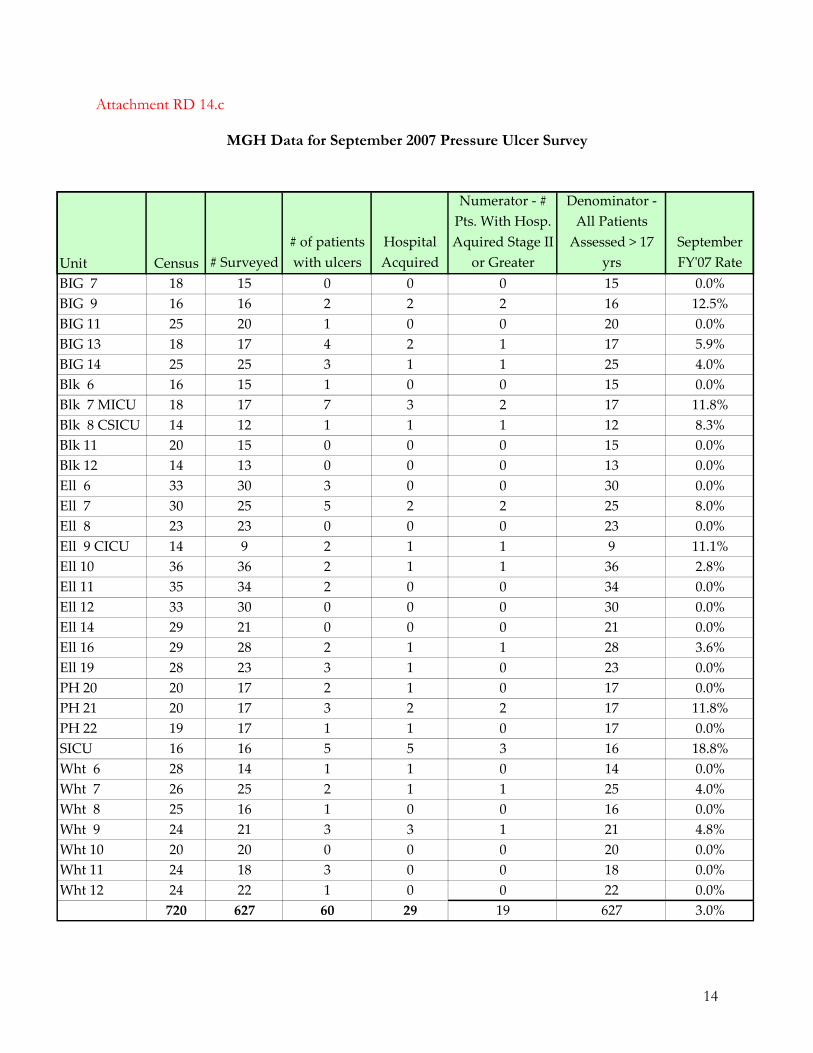
patients. The Pressure Ulcer survey was repeated on September 27, 2007. Attachment RD.14.c
includes the unit level data that was submitted to the Patients First Initiative in October 2007. The
rates by unit type for the September 2007 study and the most recent National Database of Nursing
Quality Indicators (NDNQI) benchmarks (i.e. April-June 2007) are as follows:
Pressure Ulcer Study (September 2007) Critical Care Medical Surgical Med/SurgHospital Acquired Ulcers 7 5 5 2Patients Surveyed 67 248 206 91MGH Rate 10.45% 2.02% 2.43% 2.20%
NDNQI (500+ Beds Apr-Jun 07) 10.42% 4.10% 3.10% 2.57%
The rates for Hospital Acquired Pressure Ulcers for all hospitals in Massachusetts will be
made available to the public by the end of 2007.
Prior to 2007, the decision to continue with the KCI/Novation Pressure Ulcer study was
based primarily on the value of the trended data over time. The findings that indicated favorable
performance and concern regarding the considerable workload involved the data collection helped
to reinforce the decision. The change to the NQF methodology has raised this issue again, since the
data could easily be adapted for NDNQI data submission. The decision regarding submitting NQF
data for pressure ulcer prevalence to NDNQI, along with other issues related to NDNQI
participation, are planned topics to be addressed by the Nursing Executive Operations group in late
Fall 2007. Performance improvement activities related to the prevention of hospital acquired
pressure ulcers are included in OOD 20.
Nursing Care Hours Provided Per Patient Day
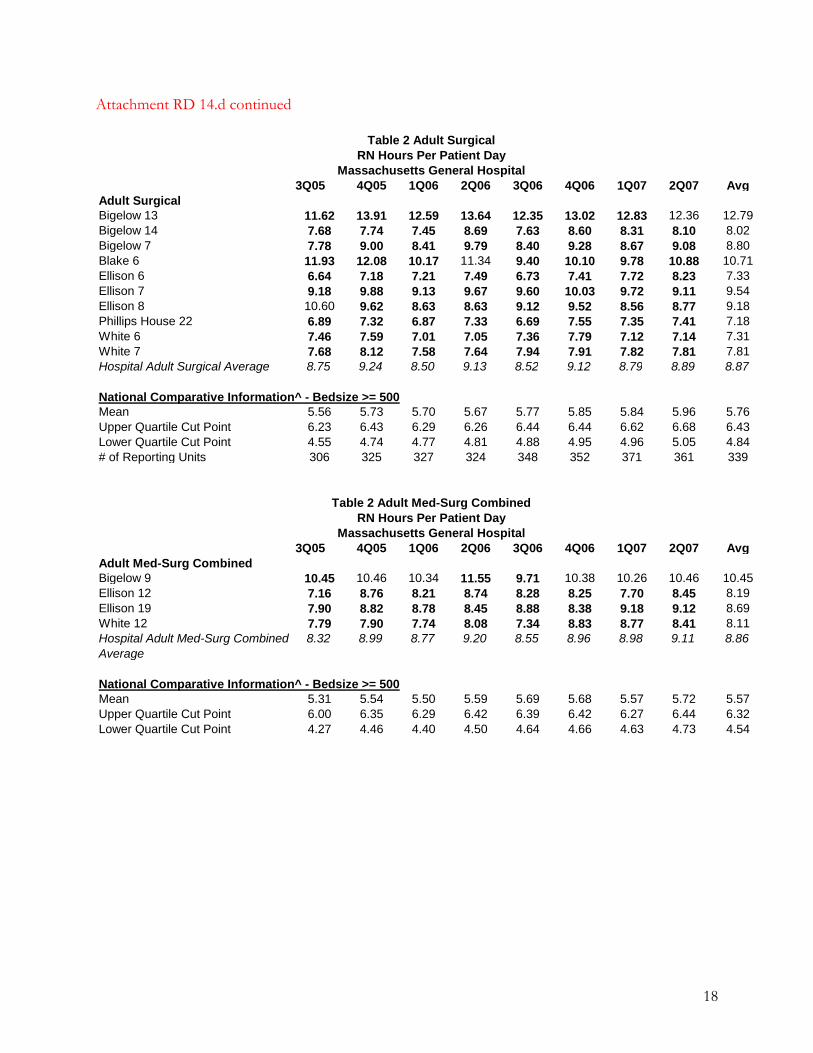
The MGH Department of Nursing submits data for nursing care hours provided per patient
day (NHPPD) to the NDNQI. This participation provides a five-year history of performance with
comparative benchmarks for hospitals of comparable size (i.e. greater than 500 beds) for 30
inpatient units. Attachment RD14.d includes data from the most recent NDNQI quarterly report
containing the last 8 quarters of performance data for Total Nursing Hours Per Patient day and RN
Hours Per Patient Day.
2

MGH’s performance in these areas is favorable when compared to NDNQI benchmarks.
The NDNQI model of unit groupings has provided the benchmarks by unit type, which has
enhanced our unit-level analysis, as described in OOD 20.
In addition to the NDNQI, MGH submits data for NHPPD to the Massachusetts Patients
First Initiative, which provides a state-wide benchmark, and nursing care hours are submitted to the
QuadraMed® company as a component of Hours Per Workload Index (HPWI), an indicator that
includes a measure of staffing in a ratio with census and acuity (Force 4.3; Force 7.6; OOD 15).
Nursing Staff Satisfaction
MGH Patient Care Services evaluates Staff Nurse satisfaction every eighteen months using
the Staff Perceptions of the Professional Practice Environment Survey (SPPPE). The specific tools
used in the survey are included as OOD 16.a and 16.b. A thorough description of the survey, the
processes involved, and findings for the 2006 survey are depicted in Force 1.8.
At this time, benchmarking data is not available for this internally developed survey,
however, a trend of data using this tool is available from 1999 through 2006. Four years of trend
data is included as RD 6.
Patient Injury Rates (Falls Occurrence)
The MGH Department of Nursing has submitted data for patient falls, including falls that
result in injury, to NDNQI for the past five years. As with NHPPD, data is submitted for 30
inpatient units and reports provide comparative benchmarks for hospitals with greater than 500
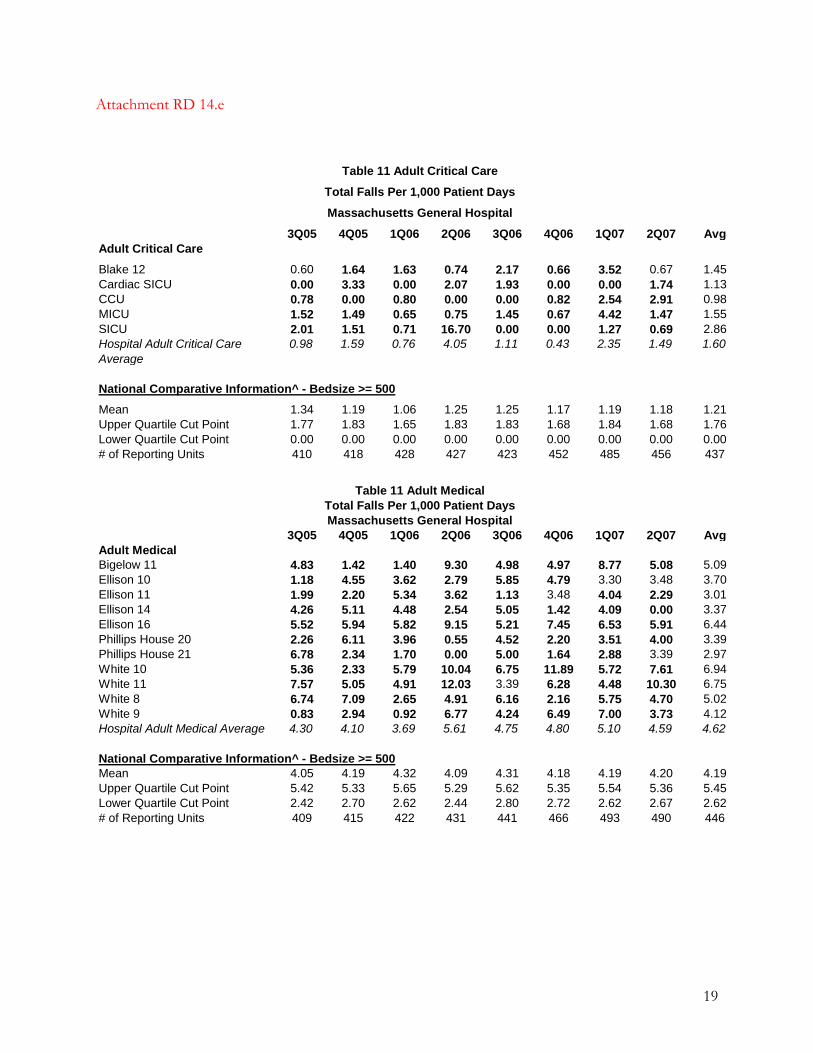
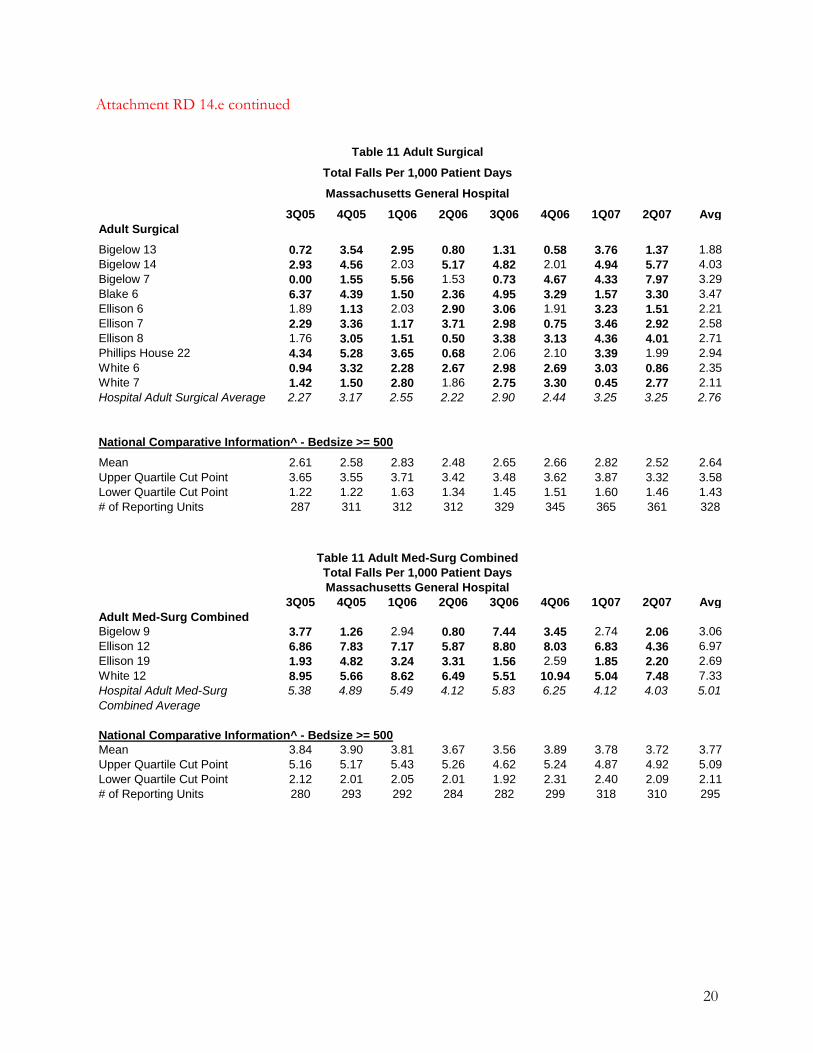
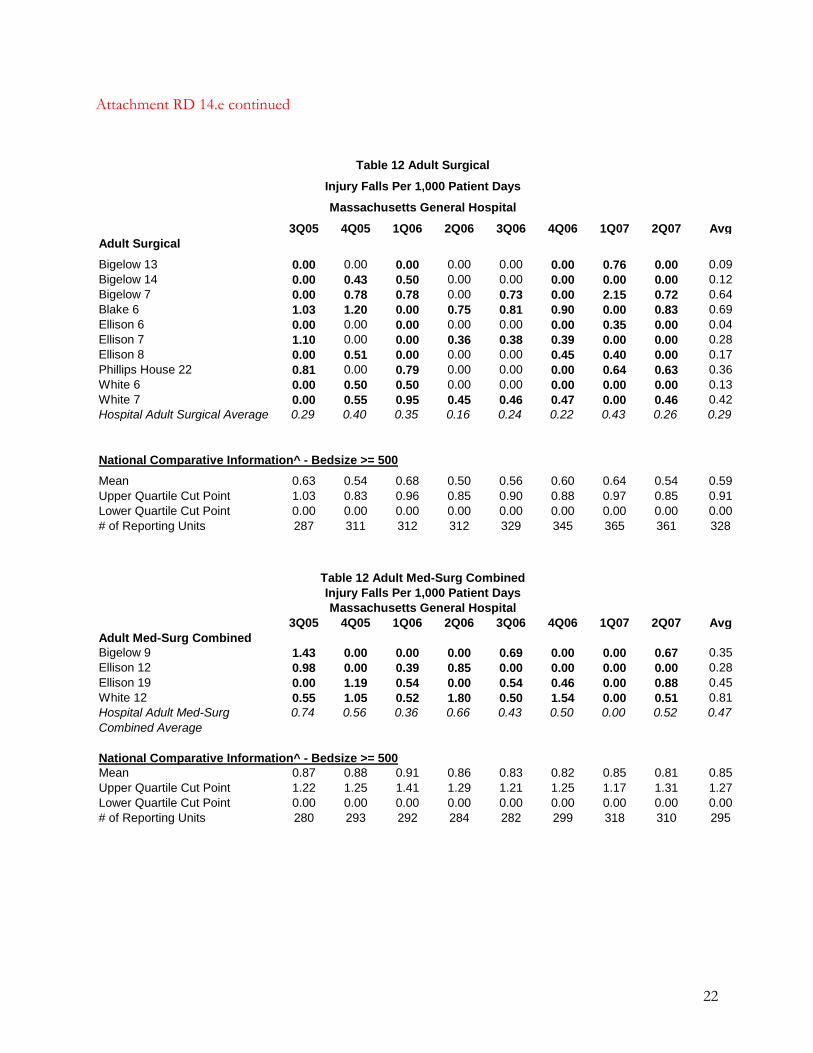
beds. Attachment RD 14.e includes data from the most recent NDNQI quarterly report containing
the last 8 quarters of performance data for Fall Rates and Fall with Injury Rates.
The data for MGH’s performance is fairly consistent and indicates some areas of favorable
performance and some areas presenting opportunities for improvement. Fall rates for Adult Critical
Units are usually favorable to the NDNQI mean and rates for Adult Surgical Units are often very
close to the benchmarks. Fall rates for Adult Medical Critical Care Units and Adult Medical/
Surgical Units are frequently unfavorable compared to NDNQI benchmarks. Considering the Fall
with Injury Rates for these areas, however, indicates that MGH performance for all four unit types
are favorable to benchmark. This issue has been discussed in several forums. The quality initiative
of “keeping patients safe”, i.e. preventing falls, also coincides with other initiatives such as restraint
reduction and the ongoing commitment to patient’s rights and independence. In addition, some of
3

the MGH efforts around fall prevention are actually directed toward preventing injury in case a fall
occurs, such as using floor mats, hip protectors and renting “low” beds. This may account for the
seeming discrepancy when comparing the findings for the two indicators.
The NDNQI model of unit groupings has provided the benchmarks by unit type, which has
enhanced our unit-level analysis. This enhancement and performance improvement activities related
to fall prevention are described in OOD 20.
Patient Satisfaction
MGH has an on-going program to evaluate patient satisfaction. From 2001 through 2006,
the hospital contracted with Press Ganey for patient satisfaction surveys. A description of the
survey tool, the processes involved, and the quarterly hospital level reports for calendar years 2004
through 2006 are included in RD 5. Attachment RD 14.f includes a sample section of the unit-level
report for October – December 2006 for a group of patient care units, and demonstrating the
findings for the four nursing sensitive indicators of Overall Care, Nursing Care, Pain Management,
and Patient Education. Unit level reports for calendar years 2004 through 2006 are also included in
RD 5.
In these surveys, MGH patients expressed loyalty to the hospital and a high likelihood of
recommending the hospital to others, moreover patients rated their doctors and nurses highly
(compared to other 600+ bed hospitals). At the same time the surveys indicated opportunities for
improvement in areas such as satisfaction with meals, response to calls, rooms and waiting times for
tests and treatments. Performance improvement efforts related to these issues are discussed in RD
5.
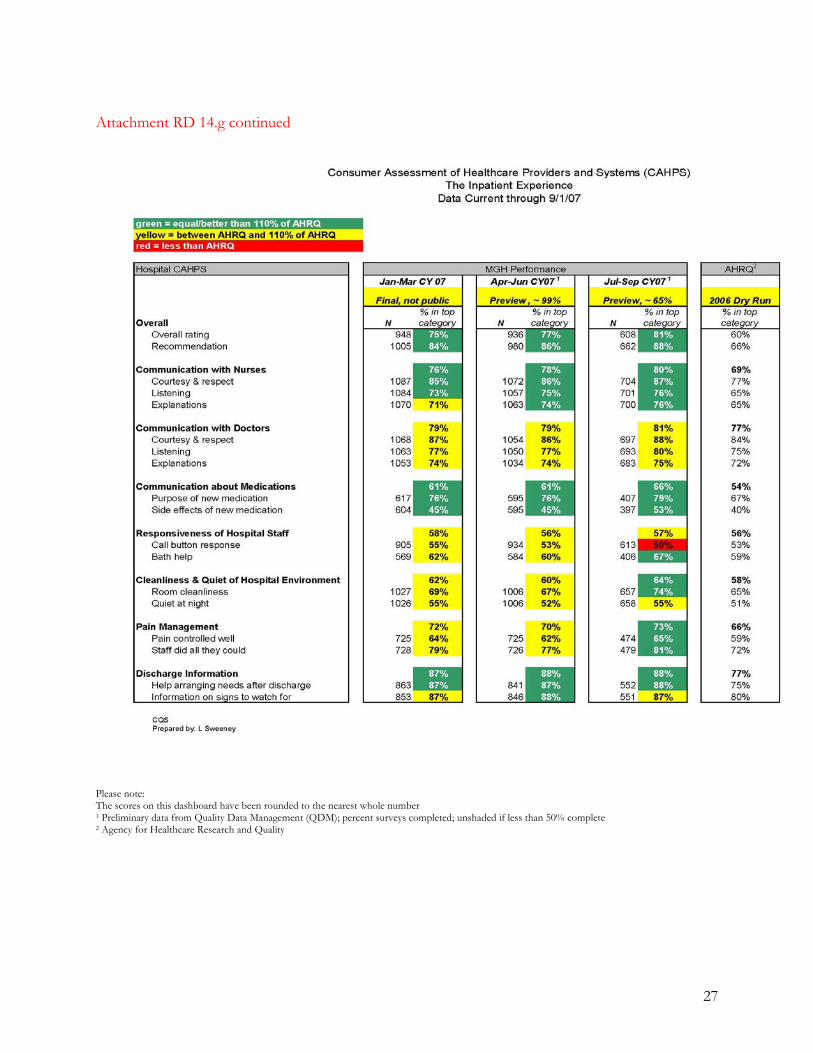
Starting in January 2007, MGH began using the Consumer Assessment of Healthcare
Providers and Systems (CAHPS) tool, as required for acute care hospitals for 2008 by the Centers
for Medicare and Medicaid (CMS). It is the first national, standardized survey of adult hospital
patients. Results from this survey, with comparative benchmarks, will be publicly reported
beginning March 2008. MGH has contracted with Quality Data Management (QDM) to administer
the survey and provide ongoing reports. An internal hospital report with three quarters of data for
2007 is included as attachment RD 14.g. As this program is evolving throughout 2007, national
benchmarks are not yet available for comparison. During this transitional period MGH has elected
to use the results from the HCAHPS 2006 pilot of hospitals + 10% as a target for performance until
national means are available. It should be noted that the findings for the two different surveys vary
4

significantly (i.e. percentile rating for Press Ganey and percent of respondents selecting the highest
rating for HCAHPS) and as such, the results for the two cannot be compared.
Skill Mix of Registered Nurses, Licensed Practical Nurses, and Unlicensed Staff
The MGH Department of Nursing has submitted data for skill mix to NDNQI for the past
five years. As with NHPPD, data is submitted for 30 inpatient units and reports provide
comparative benchmarks for hospitals with greater than 500 beds. Attachment RD 14.h. includes
data from the most recent NDNQI quarterly report containing the last 8 quarters of performance
data for Percent of Nursing Hours Supplied by RNs.
When compared to NDNQI benchmarks, MGH’s performance in this area is favorable for
Adult Medical Units, Adult Surgical Units, and Adult Medical/Surgical Units. Findings for Adult
Critical Care Units is usually very close to or slightly below the NDNQI mean. The NDNQI model
of unit groupings, providing benchmarks by unit type, has helped to highlight this particular issue
and has resulted in further analysis to better understand the issue. At MGH, Adult Critical Care
Units are budgeted for a 90% RN mix. Analysis of actual performance has indicated that, for four
of the five units, the issue contributing to the discrepancy in Percent of Nursing Hours Supplied by
RNs is use of unlicensed personnel beyond budget. The high percentage of unlicensed personnel
hours is related to using student nurses as Patient Care Associates, which is a long-term recruitment
strategy frequently used by Nursing Directors. Further discussion of this issue will occur in OOD
20.
5
6
Attachment RD 14.a
Attachment RD 14.a continued
7

8
Attachment RD 14.a continued
9
Attachment RD 14.a continued

10
Attachment RD 14.a continued
11
Attachment RD 14.a continued

Attachment RD 14.a.continued
Confidential and Proprietary Information
Disclosure to Unauthorized Recipients is Prohibited
Novation / KCI
National P&I Study
Latest Study Completed
March 2006
Novation /KCI National P&I Study
Acute Summary
March 2006
2006
2005
2004
2003
2002
2001
2000
1999 172,71017,510
163,50122,455
143,44524,026
144,42730,559
154,77931,717
164,95631,969
164,95732,815
154,82633,327
Avg%BreakdownAssessed
Prevalence
83865,455
95246,719
75027,545
86249,026
763910,080
76399,643
867310,049
76189,953
Avg%BreakdownAssessed
Incidence
12
Attachment RD 14.b
Endorsed by the Massachusetts Hospital Association and the Massachusetts Organization of
Nurse Executives in January 2005, the Patients First initiative is a quality and safety initiative to
create a work environment in hospitals that supports caregivers and promotes patient safety; help
assure effective staffing; advance best practices in patient care; and involve both patients and the
public in improving that care. All hospitals in the commonwealth adopted the voluntary initiative
by signing a Patients First pledge that committed hospital leaders to specific actions that advance
patient safety and to carry them out in a way that allows patients, caregivers and the public to be
informed and involved.
Massachusetts Hospitals have agreed too participate in the five-part Patients First Agenda
by:
• Demonstrating a commitment to providing nurse staffing that meets patient needs
• Promoting a safe and supportive work environment, with safety and quality as top
priorities
• Providing the public with hospital performance measures for informed decisions about
care
• Building a plentiful and committed workforce
• Educating the public about safe care and creating partnerships to promote access to safe,
high-quality care
To demonstrate the commitment to providing adequate nurse staffing, all hospitals have
made unit-based staffing plans available to the public on the Patients First website
(patientsfirstma.org). Staffing plan data are provided by unit, role group and shift and Worked
Hours Per Patient Day (WHPPD) are calculated based on the number of shifts. On an annual basis,
hospitals provide actual staffing data and WHPPD, which is also posted for the public.
To provide the public with hospital performance measures, all hospitals have agreed to
submit data for fall rates, falls resulting in injury rates, and pressure ulcer rates. Data for these
outcome measures will also be made available to the public on the website by the end of 2007.
13
Attachment RD 14.c
MGH Data for September 2007 Pressure Ulcer Survey
Unit Census # Surveyed# of patients with ulcers
Hospital Acquired
Numerator - # Pts. With Hosp. Aquired Stage II
or Greater
Denominator - All Patients
Assessed > 17 yrs
September FY'07 Rate
BIG 7 18 15 0 0 0 15 0.0%BIG 9 16 16 2 2 2 16 12.5%BIG 11 25 20 1 0 0 20 0.0%BIG 13 18 17 4 2 1 17 5.9%BIG 14 25 25 3 1 1 25 4.0%Blk 6 16 15 1 0 0 15 0.0%Blk 7 MICU 18 17 7 3 2 17 11.8%Blk 8 CSICU 14 12 1 1 1 12 8.3%Blk 11 20 15 0 0 0 15 0.0%Blk 12 14 13 0 0 0 13 0.0%Ell 6 33 30 3 0 0 30 0.0%Ell 7 30 25 5 2 2 25 8.0%Ell 8 23 23 0 0 0 23 0.0%Ell 9 CICU 14 9 2 1 1 9 11.1%Ell 10 36 36 2 1 1 36 2.8%Ell 11 35 34 2 0 0 34 0.0%Ell 12 33 30 0 0 0 30 0.0%Ell 14 29 21 0 0 0 21 0.0%Ell 16 29 28 2 1 1 28 3.6%Ell 19 28 23 3 1 0 23 0.0%PH 20 20 17 2 1 0 17 0.0%PH 21 20 17 3 2 2 17 11.8%PH 22 19 17 1 1 0 17 0.0%SICU 16 16 5 5 3 16 18.8%Wht 6 28 14 1 1 0 14 0.0%Wht 7 26 25 2 1 1 25 4.0%Wht 8 25 16 1 0 0 16 0.0%Wht 9 24 21 3 3 1 21 4.8%Wht 10 20 20 0 0 0 20 0.0%Wht 11 24 18 3 0 0 18 0.0%Wht 12 24 22 1 0 0 22 0.0%
720 627 60 29 19 627 3.0%
14

Attachment RD 14.d
3Q05 4Q05 1Q06 2Q06 3Q06 4Q06 1Q07 2Q07 Avg
Blake 12 22.64 23.36 23.90 25.44 23.17 23.02 22.54 22.44 23.31Cardiac SICU 30.03 24.88 22.72 24.44 26.82 26.12 25.60 27.55 26.02CCU 20.00 21.47 18.43 18.34 20.69 18.37 18.34 20.83 19.56MICU 21.23 21.23 20.33 20.71 22.29 19.84 22.54 21.31 21.18SICU 26.39 25.88 25.74 28.50 26.77 24.34 25.92 27.93 26.43Hospital Adult Critical Care Average
24.06 23.36 22.22 23.49 23.95 22.34 22.98 24.01 23.30
Mean 17.68 17.83 17.70 17.80 18.02 17.87 17.93 18.30 17.89Upper Quartile Cut Point 19.30 19.42 19.48 19.26 19.29 19.09 19.31 19.73 19.36Lower Quartile Cut Point 15.54 15.71 15.53 15.62 16.11 15.87 15.88 15.96 15.78# of Reporting Units 438 447 445 444 456 469 498 476 459
3Q05 4Q05 1Q06 2Q06 3Q06 4Q06 1Q07 2Q07 Avg
Bigelow 11 8.34 8.39 7.66 7.75 8.61 8.68 9.69 9.28 8.55Ellison 10 11.41 11.59 10.60 10.50 10.47 10.18 10.36 10.83 10.74Ellison 11 10.48 10.16 9.28 9.64 10.48 10.50 9.78 10.25 10.07Ellison 14 11.49 11.86 11.25 12.00 12.15 12.62 13.01 13.25 12.20Ellison 16 8.74 8.85 8.54 9.12 8.83 8.88 9.26 9.49 8.96Phillips House 20 8.59 8.29 8.43 8.64 9.40 9.07 9.35 8.90 8.83Phillips House 21 9.16 9.03 9.55 10.17 10.18 10.45 10.41 10.78 9.97White 10 9.69 10.57 9.35 9.85 9.64 11.32 10.81 10.26 10.19White 11 9.54 9.27 9.30 9.74 9.62 9.26 9.94 9.77 9.55White 8 8.52 9.14 8.80 9.21 9.71 9.71 9.91 10.05 9.38White 9 7.47 7.91 7.50 8.84 9.07 8.96 8.76 8.75 8.41Hospital Adult Medical Average 9.40 9.55 9.12 9.59 9.83 9.97 10.12 10.15 9.71
Mean 8.11 8.24 8.08 8.18 8.36 8.36 8.35 8.53 8.28Upper Quartile Cut Point 8.97 9.02 8.80 9.05 9.11 9.14 9.26 9.37 9.09Lower Quartile Cut Point 7.20 7.34 7.09 7.16 7.37 7.42 7.45 7.61 7.33# of Reporting Units 419 425 438 442 464 467 495 487 455
National Comparative Information^ - Bedsize >= 500
Table 1 Adult MedicalTotal Nursing Hours Per Patient Day
Massachusetts General Hospital
National Comparative Information^ - Bedsize >= 500
Adult Medical
Table 1 Adult Critical Care
Total Nursing Hours Per Patient Day
Massachusetts General Hospital
Adult Critical Care
15

Attachment RD 14.d continued
3Q05 4Q05 1Q06 2Q06 3Q06 4Q06 1Q07 2Q07 Avg
Bigelow 13 12.97 15.64 14.45 15.60 14.00 14.48 14.26 14.25 14.46Bigelow 14 9.47 9.54 9.38 10.83 9.68 10.33 10.20 10.28 9.97Bigelow 7 9.63 11.11 10.41 11.70 10.06 11.14 10.50 10.95 10.69Blake 6 14.44 14.60 12.31 13.88 12.00 12.53 12.06 13.34 13.15Ellison 6 8.28 8.96 8.92 9.23 8.36 9.52 9.72 10.20 9.15Ellison 7 10.81 11.59 10.91 11.62 11.60 12.01 11.62 10.85 11.38Ellison 8 13.09 11.96 10.68 10.88 10.92 11.74 10.70 11.15 11.39Phillips House 22 8.36 8.90 8.63 9.13 8.23 9.18 9.02 9.33 8.85White 6 9.10 9.31 8.53 8.77 9.39 9.53 8.77 9.05 9.06White 7 9.36 9.84 9.22 9.38 9.86 9.89 9.83 9.66 9.63Hospital Adult Surgical Average 10.55 11.14 10.34 11.10 10.41 11.04 10.67 10.91 10.77
Mean 8.35 8.50 8.41 8.42 8.52 8.60 8.51 8.69 8.50Upper Quartile Cut Point 9.02 9.22 9.14 9.09 9.03 9.16 9.20 9.39 9.16Lower Quartile Cut Point 7.28 7.41 7.30 7.32 7.46 7.65 7.55 7.69 7.46# of Reporting Units 306 325 327 324 348 352 371 361 339
3Q05 4Q05 1Q06 2Q06 3Q06 4Q06 1Q07 2Q07 Avg
Bigelow 9 12.42 12.44 12.24 13.21 11.54 12.29 12.17 12.39 12.34Ellison 12 8.80 10.66 9.88 10.75 10.38 9.98 9.30 10.20 9.99Ellison 19 9.46 10.56 10.51 10.27 10.85 9.83 10.62 10.45 10.32White 12 9.72 9.73 9.79 10.33 9.84 10.88 10.72 10.60 10.20Hospital Adult Med-Surg Combined Average
10.10 10.85 10.60 11.14 10.65 10.74 10.70 10.91 10.71
Mean 8.30 8.40 8.24 8.46 8.58 8.56 8.37 8.59 8.44Upper Quartile Cut Point 8.99 9.17 9.06 9.18 9.49 9.36 9.26 9.46 9.25Lower Quartile Cut Point 7.19 7.22 7.10 7.29 7.31 7.42 7.21 7.51 7.28# of Reporting Units 303 305 288 292 290 304 321 306 301
Total Nursing Hours Per Patient DayMassachusetts General Hospital
Adult Med-Surg Combined
National Comparative Information^ - Bedsize >= 500
Massachusetts General Hospital
Adult Surgical
National Comparative Information^ - Bedsize >= 500
Table 1 Adult Med-Surg Combined
Table 1 Adult SurgicalTotal Nursing Hours Per Patient Day
16

Attachment RD 14.d continued
Table 2 Adult Critical Care
3Q05 4Q05 1Q06 2Q06 3Q06 4Q06 1Q07 2Q07 Avg
Blake 12 18.28 18.62 18.93 20.55 18.21 18.27 17.89 17.98 18.59Cardiac SICU 26.92 22.29 20.39 21.71 23.79 23.09 22.74 24.14 23.13CCU 18.50 20.31 17.37 17.03 18.50 17.33 17.34 19.29 18.21MICU 18.40 19.72 18.50 18.36 18.71 17.62 20.02 18.47 18.72SICU 23.33 23.24 22.60 24.97 23.47 21.92 23.12 24.47 23.39Hospital Adult Critical Care Average
21.08 20.84 19.55 20.53 20.54 19.65 20.22 20.87 20.41
Mean 15.57 15.83 15.78 15.77 15.88 15.87 15.92 16.22 15.86Upper Quartile Cut Point 17.17 17.20 17.43 17.33 17.34 17.24 17.40 17.61 17.34Lower Quartile Cut Point 13.69 13.89 13.74 13.71 13.98 13.84 13.86 13.88 13.82# of Reporting Units 438 447 445 444 456 469 498 476 459
3Q05 4Q05 1Q06 2Q06 3Q06 4Q06 1Q07 2Q07 Avg
Bigelow 11 8.25 8.29 7.61 7.65 8.54 8.63 9.67 9.24 8.48Ellison 10 9.51 9.85 8.87 8.88 8.83 8.52 8.75 9.19 9.05Ellison 11 8.68 8.41 7.82 7.94 8.39 9.09 8.52 8.72 8.45Ellison 14 9.71 10.51 9.93 10.50 10.43 10.84 11.29 11.27 10.56Ellison 16 7.14 7.19 7.22 7.59 7.33 7.46 7.74 7.74 7.43Phillips House 20 6.76 6.50 6.39 6.62 7.39 6.87 7.11 6.82 6.81Phillips House 21 7.24 6.95 7.13 7.58 8.04 8.34 8.32 8.63 7.78White 10 7.71 8.76 8.11 8.05 7.83 8.97 8.52 8.17 8.27White 11 7.96 7.83 7.95 8.44 8.05 8.00 8.56 8.21 8.12White 8 6.85 7.36 7.30 7.44 7.88 7.82 7.97 8.08 7.59White 9 6.20 6.17 5.75 6.97 7.23 7.26 7.10 7.00 6.71Hospital Adult Medical Average 7.82 7.98 7.64 7.97 8.18 8.35 8.50 8.46 8.11
Mean 5.36 5.52 5.47 5.46 5.56 5.62 5.67 5.80 5.56Upper Quartile Cut Point 6.17 6.38 6.27 6.23 6.35 6.42 6.41 6.64 6.36Lower Quartile Cut Point 4.34 4.51 4.47 4.50 4.63 4.65 4.69 4.82 4.58# of Reporting Units 419 425 438 442 464 467 495 487 455
National Comparative Information^ - Bedsize >= 500
Table 2 Adult MedicalRN Hours Per Patient Day
Massachusetts General Hospital
National Comparative Information^ - Bedsize >= 500
Adult Medical
RN Hours Per Patient Day
Massachusetts General Hospital
Adult Critical Care
17
Attachment RD 14.d continued
Table 2 Adult Surgical
3Q05 4Q05 1Q06 2Q06 3Q06 4Q06 1Q07 2Q07 Avg
Bigelow 13 11.62 13.91 12.59 13.64 12.35 13.02 12.83 12.36 12.79Bigelow 14 7.68 7.74 7.45 8.69 7.63 8.60 8.31 8.10 8.02Bigelow 7 7.78 9.00 8.41 9.79 8.40 9.28 8.67 9.08 8.80Blake 6 11.93 12.08 10.17 11.34 9.40 10.10 9.78 10.88 10.71Ellison 6 6.64 7.18 7.21 7.49 6.73 7.41 7.72 8.23 7.33Ellison 7 9.18 9.88 9.13 9.67 9.60 10.03 9.72 9.11 9.54Ellison 8 10.60 9.62 8.63 8.63 9.12 9.52 8.56 8.77 9.18Phillips House 22 6.89 7.32 6.87 7.33 6.69 7.55 7.35 7.41 7.18White 6 7.46 7.59 7.01 7.05 7.36 7.79 7.12 7.14 7.31White 7 7.68 8.12 7.58 7.64 7.94 7.91 7.82 7.81 7.81Hospital Adult Surgical Average 8.75 9.24 8.50 9.13 8.52 9.12 8.79 8.89 8.87
Mean 5.56 5.73 5.70 5.67 5.77 5.85 5.84 5.96 5.76Upper Quartile Cut Point 6.23 6.43 6.29 6.26 6.44 6.44 6.62 6.68 6.43Lower Quartile Cut Point 4.55 4.74 4.77 4.81 4.88 4.95 4.96 5.05 4.84# of Reporting Units 306 325 327 324 348 352 371 361 339
3Q05 4Q05 1Q06 2Q06 3Q06 4Q06 1Q07 2Q07 Avg
Bigelow 9 10.45 10.46 10.34 11.55 9.71 10.38 10.26 10.46 10.45Ellison 12 7.16 8.76 8.21 8.74 8.28 8.25 7.70 8.45 8.19Ellison 19 7.90 8.82 8.78 8.45 8.88 8.38 9.18 9.12 8.69White 12 7.79 7.90 7.74 8.08 7.34 8.83 8.77 8.41 8.11Hospital Adult Med-Surg Combined Average
8.32 8.99 8.77 9.20 8.55 8.96 8.98 9.11 8.86
Mean 5.31 5.54 5.50 5.59 5.69 5.68 5.57 5.72 5.57Upper Quartile Cut Point 6.00 6.35 6.29 6.42 6.39 6.42 6.27 6.44 6.32Lower Quartile Cut Point 4.27 4.46 4.40 4.50 4.64 4.66 4.63 4.73 4.54
RN Hours Per Patient DayMassachusetts General Hospital
Adult Med-Surg Combined
National Comparative Information^ - Bedsize >= 500
Massachusetts General Hospital
Adult Surgical
National Comparative Information^ - Bedsize >= 500
Table 2 Adult Med-Surg Combined
RN Hours Per Patient Day
18
Attachment RD 14.e
3Q05 4Q05 1Q06 2Q06 3Q06 4Q06 1Q07 2Q07 Avg
Blake 12 0.60 1.64 1.63 0.74 2.17 0.66 3.52 0.67 1.45Cardiac SICU 0.00 3.33 0.00 2.07 1.93 0.00 0.00 1.74 1.13CCU 0.78 0.00 0.80 0.00 0.00 0.82 2.54 2.91 0.98MICU 1.52 1.49 0.65 0.75 1.45 0.67 4.42 1.47 1.55SICU 2.01 1.51 0.71 16.70 0.00 0.00 1.27 0.69 2.86Hospital Adult Critical Care Average
0.98 1.59 0.76 4.05 1.11 0.43 2.35 1.49 1.60
Mean 1.34 1.19 1.06 1.25 1.25 1.17 1.19 1.18 1.21Upper Quartile Cut Point 1.77 1.83 1.65 1.83 1.83 1.68 1.84 1.68 1.76Lower Quartile Cut Point 0.00 0.00 0.00 0.00 0.00 0.00 0.00 0.00 0.00# of Reporting Units 410 418 428 427 423 452 485 456 437
3Q05 4Q05 1Q06 2Q06 3Q06 4Q06 1Q07 2Q07 Avg
Bigelow 11 4.83 1.42 1.40 9.30 4.98 4.97 8.77 5.08 5.09Ellison 10 1.18 4.55 3.62 2.79 5.85 4.79 3.30 3.48 3.70Ellison 11 1.99 2.20 5.34 3.62 1.13 3.48 4.04 2.29 3.01Ellison 14 4.26 5.11 4.48 2.54 5.05 1.42 4.09 0.00 3.37Ellison 16 5.52 5.94 5.82 9.15 5.21 7.45 6.53 5.91 6.44Phillips House 20 2.26 6.11 3.96 0.55 4.52 2.20 3.51 4.00 3.39Phillips House 21 6.78 2.34 1.70 0.00 5.00 1.64 2.88 3.39 2.97White 10 5.36 2.33 5.79 10.04 6.75 11.89 5.72 7.61 6.94White 11 7.57 5.05 4.91 12.03 3.39 6.28 4.48 10.30 6.75White 8 6.74 7.09 2.65 4.91 6.16 2.16 5.75 4.70 5.02White 9 0.83 2.94 0.92 6.77 4.24 6.49 7.00 3.73 4.12Hospital Adult Medical Average 4.30 4.10 3.69 5.61 4.75 4.80 5.10 4.59 4.62
Mean 4.05 4.19 4.32 4.09 4.31 4.18 4.19 4.20 4.19Upper Quartile Cut Point 5.42 5.33 5.65 5.29 5.62 5.35 5.54 5.36 5.45Lower Quartile Cut Point 2.42 2.70 2.62 2.44 2.80 2.72 2.62 2.67 2.62# of Reporting Units 409 415 422 431 441 466 493 490 446
National Comparative Information^ - Bedsize >= 500
Table 11 Adult MedicalTotal Falls Per 1,000 Patient DaysMassachusetts General Hospital
Adult Medical
National Comparative Information^ - Bedsize >= 500
Table 11 Adult Critical Care
Total Falls Per 1,000 Patient Days
Massachusetts General Hospital
Adult Critical Care
19
Attachment RD 14.e continued
3Q05 4Q05 1Q06 2Q06 3Q06 4Q06 1Q07 2Q07 Avg
Bigelow 13 0.72 3.54 2.95 0.80 1.31 0.58 3.76 1.37 1.88Bigelow 14 2.93 4.56 2.03 5.17 4.82 2.01 4.94 5.77 4.03Bigelow 7 0.00 1.55 5.56 1.53 0.73 4.67 4.33 7.97 3.29Blake 6 6.37 4.39 1.50 2.36 4.95 3.29 1.57 3.30 3.47Ellison 6 1.89 1.13 2.03 2.90 3.06 1.91 3.23 1.51 2.21Ellison 7 2.29 3.36 1.17 3.71 2.98 0.75 3.46 2.92 2.58Ellison 8 1.76 3.05 1.51 0.50 3.38 3.13 4.36 4.01 2.71Phillips House 22 4.34 5.28 3.65 0.68 2.06 2.10 3.39 1.99 2.94White 6 0.94 3.32 2.28 2.67 2.98 2.69 3.03 0.86 2.35White 7 1.42 1.50 2.80 1.86 2.75 3.30 0.45 2.77 2.11Hospital Adult Surgical Average 2.27 3.17 2.55 2.22 2.90 2.44 3.25 3.25 2.76
Mean 2.61 2.58 2.83 2.48 2.65 2.66 2.82 2.52 2.64Upper Quartile Cut Point 3.65 3.55 3.71 3.42 3.48 3.62 3.87 3.32 3.58Lower Quartile Cut Point 1.22 1.22 1.63 1.34 1.45 1.51 1.60 1.46 1.43# of Reporting Units 287 311 312 312 329 345 365 361 328
3Q05 4Q05 1Q06 2Q06 3Q06 4Q06 1Q07 2Q07 Avg
Bigelow 9 3.77 1.26 2.94 0.80 7.44 3.45 2.74 2.06 3.06Ellison 12 6.86 7.83 7.17 5.87 8.80 8.03 6.83 4.36 6.97Ellison 19 1.93 4.82 3.24 3.31 1.56 2.59 1.85 2.20 2.69White 12 8.95 5.66 8.62 6.49 5.51 10.94 5.04 7.48 7.33Hospital Adult Med-Surg Combined Average
5.38 4.89 5.49 4.12 5.83 6.25 4.12 4.03 5.01
Mean 3.84 3.90 3.81 3.67 3.56 3.89 3.78 3.72 3.77Upper Quartile Cut Point 5.16 5.17 5.43 5.26 4.62 5.24 4.87 4.92 5.09Lower Quartile Cut Point 2.12 2.01 2.05 2.01 1.92 2.31 2.40 2.09 2.11# of Reporting Units 280 293 292 284 282 299 318 310 295
National Comparative Information^ - Bedsize >= 500
Table 11 Adult Med-Surg CombinedTotal Falls Per 1,000 Patient DaysMassachusetts General Hospital
Adult Med-Surg Combined
National Comparative Information^ - Bedsize >= 500
Table 11 Adult Surgical
Total Falls Per 1,000 Patient Days
Massachusetts General Hospital
Adult Surgical
20

Attachment RD 14.e continued
3Q05 4Q05 1Q06 2Q06 3Q06 4Q06 1Q07 2Q07 Avg
Blake 12 0.00 0.00 0.00 0.74 0.00 0.00 0.00 0.00 0.09Cardiac SICU 0.00 0.86 0.00 0.00 0.00 0.00 0.00 0.87 0.22CCU 0.00 0.00 0.00 0.00 0.00 0.00 0.00 0.00 0.00MICU 0.00 0.00 0.65 0.00 0.72 0.00 0.80 0.00 0.27SICU 0.00 0.75 0.00 2.57 0.00 0.00 0.00 0.00 0.42Hospital Adult Critical Care Average
0.00 0.32 0.13 0.66 0.14 0.00 0.16 0.17 0.20
Mean 0.32 0.30 0.32 0.25 0.31 0.30 0.28 0.27 0.29Upper Quartile Cut Point 0.00 0.00 0.17 0.00 0.00 0.49 0.00 0.00 0.08Lower Quartile Cut Point 0.00 0.00 0.00 0.00 0.00 0.00 0.00 0.00 0.00# of Reporting Units 410 418 428 427 423 452 485 456 437
3Q05 4Q05 1Q06 2Q06 3Q06 4Q06 1Q07 2Q07 Avg
Bigelow 11 0.51 0.40 0.00 1.79 0.90 1.81 0.00 0.46 0.73Ellison 10 0.00 0.81 0.74 0.33 1.47 0.00 0.36 0.81 0.57Ellison 11 0.83 0.00 1.07 0.38 0.00 0.36 0.38 0.71 0.47Ellison 14 0.53 1.49 0.49 0.00 0.50 0.91 2.05 0.00 0.75Ellison 16 0.75 1.09 0.68 0.96 0.32 1.64 0.00 0.67 0.76Phillips House 20 0.61 0.00 0.55 0.00 1.15 0.55 0.60 0.00 0.43Phillips House 21 1.14 0.60 0.00 0.00 1.14 0.00 0.00 0.00 0.36White 10 2.17 0.63 0.55 1.72 0.00 1.70 0.00 0.00 0.85White 11 1.69 1.07 1.45 0.48 0.00 0.47 0.98 0.50 0.83White 8 0.38 0.49 0.42 0.42 0.89 0.43 0.86 0.00 0.49White 9 0.00 0.00 0.46 0.00 0.47 0.46 0.45 0.00 0.23Hospital Adult Medical Average 0.78 0.60 0.58 0.55 0.62 0.76 0.52 0.29 0.59
Mean 1.10 1.06 1.15 0.96 1.09 1.00 0.99 1.01 1.05Upper Quartile Cut Point 1.57 1.53 1.53 1.39 1.57 1.47 1.44 1.53 1.50Lower Quartile Cut Point 0.35 0.36 0.35 0.28 0.37 0.33 0.34 0.00 0.30# of Reporting Units 409 415 422 431 441 466 493 490 446
National Comparative Information^ - Bedsize >= 500
Table 12 Adult MedicalInjury Falls Per 1,000 Patient DaysMassachusetts General Hospital
Adult Medical
National Comparative Information^ - Bedsize >= 500
Table 12 Adult Critical Care
Injury Falls Per 1,000 Patient Days
Massachusetts General Hospital
Adult Critical Care
21
Attachment RD 14.e continued
3Q05 4Q05 1Q06 2Q06 3Q06 4Q06 1Q07 2Q07 Avg
Bigelow 13 0.00 0.00 0.00 0.00 0.00 0.00 0.76 0.00 0.09Bigelow 14 0.00 0.43 0.50 0.00 0.00 0.00 0.00 0.00 0.12Bigelow 7 0.00 0.78 0.78 0.00 0.73 0.00 2.15 0.72 0.64Blake 6 1.03 1.20 0.00 0.75 0.81 0.90 0.00 0.83 0.69Ellison 6 0.00 0.00 0.00 0.00 0.00 0.00 0.35 0.00 0.04Ellison 7 1.10 0.00 0.00 0.36 0.38 0.39 0.00 0.00 0.28Ellison 8 0.00 0.51 0.00 0.00 0.00 0.45 0.40 0.00 0.17Phillips House 22 0.81 0.00 0.79 0.00 0.00 0.00 0.64 0.63 0.36White 6 0.00 0.50 0.50 0.00 0.00 0.00 0.00 0.00 0.13White 7 0.00 0.55 0.95 0.45 0.46 0.47 0.00 0.46 0.42Hospital Adult Surgical Average 0.29 0.40 0.35 0.16 0.24 0.22 0.43 0.26 0.29
Mean 0.63 0.54 0.68 0.50 0.56 0.60 0.64 0.54 0.59Upper Quartile Cut Point 1.03 0.83 0.96 0.85 0.90 0.88 0.97 0.85 0.91Lower Quartile Cut Point 0.00 0.00 0.00 0.00 0.00 0.00 0.00 0.00 0.00# of Reporting Units 287 311 312 312 329 345 365 361 328
3Q05 4Q05 1Q06 2Q06 3Q06 4Q06 1Q07 2Q07 Avg
Bigelow 9 1.43 0.00 0.00 0.00 0.69 0.00 0.00 0.67 0.35Ellison 12 0.98 0.00 0.39 0.85 0.00 0.00 0.00 0.00 0.28Ellison 19 0.00 1.19 0.54 0.00 0.54 0.46 0.00 0.88 0.45White 12 0.55 1.05 0.52 1.80 0.50 1.54 0.00 0.51 0.81Hospital Adult Med-Surg Combined Average
0.74 0.56 0.36 0.66 0.43 0.50 0.00 0.52 0.47
Mean 0.87 0.88 0.91 0.86 0.83 0.82 0.85 0.81 0.85Upper Quartile Cut Point 1.22 1.25 1.41 1.29 1.21 1.25 1.17 1.31 1.27Lower Quartile Cut Point 0.00 0.00 0.00 0.00 0.00 0.00 0.00 0.00 0.00# of Reporting Units 280 293 292 284 282 299 318 310 295
National Comparative Information^ - Bedsize >= 500
Table 12 Adult Med-Surg CombinedInjury Falls Per 1,000 Patient DaysMassachusetts General Hospital
Adult Med-Surg Combined
National Comparative Information^ - Bedsize >= 500
Table 12 Adult Surgical
Injury Falls Per 1,000 Patient Days
Massachusetts General Hospital
Adult Surgical
22

Attachment RD 14.f
23

Attachment RD 14.f continued
24

Attachment RD 14.f continued
25

Attachment RD 14.g
26
Attachment RD 14.g continued
Please note: The scores on this dashboard have been rounded to the nearest whole number 1 Preliminary data from Quality Data Management (QDM); percent surveys completed; unshaded if less than 50% complete 2 Agency for Healthcare Research and Quality
27

Attachment RD 14.h
3Q05 4Q05 1Q06 2Q06 3Q06 4Q06 1Q07 2Q07
Avg
Blake 12 80.81 79.72 79.20 80.71 78.58 79.38 79.40 80.13Cardiac SICU 89.49 89.63 89.70 88.78 88.69 88.37 88.88 87.63CCU 92.44 94.59 94.26 92.92 89.42 94.41 94.52 92.77MICU 86.34 92.76 90.97 88.57 83.97 88.80 88.81 86.65SICU 88.32 89.70 87.78 87.54 87.67 90.07 89.21 87.65Hospital Adult Critical Care Avera
79.7488.9093.1688.3688.49
ge87.48 89.28 88.38 87.70 85.67 88.21 88.16 86.96
Mean 88.44 89.16 89.46 88.74 88.29 88.93 88.94 88.71Upper Quartile Cut Point 93.13 94.53 94.72 93.30 92.56 93.37 93.48 93.72Lower Quartile Cut Point 84.33 84.47 84.53 84.43 83.97 84.49 84.40 83.79# of Reporting Units 445 453 446 447 458 473 502 484
3Q05 4Q05 1Q06 2Q06 3Q06 4Q06 1Q07 2Q07
87.73
88.8393.6084.30464
Avg
Bigelow 11 98.85 98.87 99.24 98.65 99.17 99.52 99.85 99.53Ellison 10 83.32 85.00 83.67 84.52 84.41 83.73 84.46 84.82Ellison 11 82.74 82.76 84.29 82.32 80.14 86.57 87.12 85.20Ellison 14 84.37 88.71 88.25 87.41 85.79 85.91 86.73 84.87Ellison 16 81.93 81.19 84.55 83.16 83.02 84.01 83.60 81.53Phillips House 20 78.65 78.46 75.82 76.60 78.55 75.72 75.96 76.66Phillips House 21 78.78 76.99 74.65 74.53 78.99 79.76 79.89 80.03White 10 79.45 82.72 86.73 81.75 81.20 79.32 78.86 79.64White 11 83.20 84.43 85.45 86.72 83.67 86.39 85.94 83.98White 8 80.22 80.45 82.98 80.78 81.16 80.57 80.50 80.46White 9 83.16 78.20 76.62 78.79 79.62 80.96 81.14 80.01Hospital Adult Medical Avera
99.2184.2483.8986.5082.8777.0577.9581.2184.9780.8979.81
ge 83.15 83.43 83.84 83.20 83.25 83.86 84.00 83.34
Mean 65.76 66.54 67.36 66.21 66.32 66.91 67.54 67.69Upp r Quartile Cut Point 73.02 73.16 73.73 72.86 72.90 73.56 74.10 73.69Low Cut Point 58.69 59.61 60.53 59.43 59.82 60.18 60.90 60.53# of Re 443 464 471 506 497
Nati nal Comparative Information^ - Bedsize >= 500
83.51
66.7973.3859.96458
o
Table 5 Adult MedicalPercent of Total Nursing Hours Supplied By RNs
Massachusetts General Hospital
Adult Medical
National Comparative Information^ - Bedsize >= 500
Table 5 Adult Critical Care
Percent of Total Nursing Hours Supplied By RNs
Massachusetts General Hospital
Adult Critical Care
eer Quartile
porting Units 422 426 438
28

29
Attachment RD 14.h continued
073Q05 4Q05 1Q06 2Q06 3Q06 4Q06 1Q07 2Q Avg
Bigelow 13 89.39 88.97 87.13 87.44 88.17 89.89 89.89 86.78Bi
88.46gelow 14 80.80 81.13 79.33 80.20 78.77 83.23 81.46 78.75
Bi80.46
gelow 7 80.74 80.76 80.85 83.67 83.48 83.37 82.42 82.80Blake 6 82.76 82.79 82.58 81.37 78.37 80.56 81.02 81.60Ellison 6 79.95 80.14 80.78 81.10 80.56 77.85 79.44 80.73Ellison 7 85.02 85.20 83.69 83.29 82.73 83.52 83.62 83.99Ellison 8 80.81 80.50 80.74 79.16 83.50 81.10 80.00 78.67Phillips House 22 82.20 82.45 79.64 80.36 81.23 82.15 81.42 79.46White 6 82.10 81.45 82.27 80.22 78.34 81.70 81.04 78.96White 7 81.96 82.64 82.21 81.34 80.52 79.92 79.51 80.90Hospital Adult Sur
82.2681.3880.0783.8880.5681.1180.7681.13
gical Average 82.57 82.60 81.92 81.82 81.57 82.33 81.98 81.26
Mean 66.29 67.19 67.64 67.25 67.91 68.15 68.47 68.60Upper Quartile Cut Point 72.37 72.94 73.06 73.02 73.96 73.54 74.40 73.85Lower Quartile Cut Point 59.94 61.21 61.95 61.29 62.14 62.17 62.61 62.16# of Reportin
82.01
67.6973.3961.69
g Units 310 326 328 325 349 356 379 365
3Q05 4Q05 1Q06 2Q06 3Q06 4Q06 1Q07 2Q
342
07 Avg
Bigelow 9 84.10 84.07 84.53 87.40 84.11 84.43 84.27 84.41Ellison 12 81.04 82.14 83.11 81.07 79.79 82.75 82.75 82.87Ellison 19 83.57 83.38 83.53 82.20 81.84 85.23 86.48 87.31White 12 79.95 81.31 79.05 78.15 74.41 81.21 81.78 79.39Hospital Adult Med-Surg Combined Avera
84.6681.9484.1979.41
ge82.17 82.73 82.55 82.20 80.04 83.41 83.82 83.49
Mean 63.60 65.78 66.55 65.73 65.98 66.24 66.49 66.37Upper Quartile Cut Point 70.47 72.69 73.08 72.59 72.84 73.52 74.03 73.17Lower Quartile Cut Point 56.87 58.39 59.82 58.71 59.01 59.06 59.43 59.24# of Reportin
82.55
65.8472.8058.82
g Units 306 306 289 292 291 309 321 310
National Comparative Information^ - Bedsize >= 500
303
Table 5 Adult Med-Surg CombinedPercent of Total Nursing Hours Supplied By RNs
Massachusetts General Hospital
Adult Med-Surg Combined
National Comparative Information^ - Bedsize >= 500
Table 5 Adult Surgical
Percent of Total Nursing Hours Supplied By RNs
Massachusetts General Hospital
Adult Surgical