Embed Size (px)
Citation preview
RCRA Toxicity Characterization of Computer CPUs and Other Discarded Electronic Devices
Prepared By:
Timothy G. Townsend, Principal Investigator Kevin Vann, Graduate Research Assistant Sarvesh Mutha, Graduate Research Assistant Brian Pearson, Graduate Research Assistant Yong-Chul Jang, Post-Doctoral Associate Stephen Musson, Graduate Research Assistant Aaron Jordan, Student Assistant Department of Environmental Engineering Sciences University of Florida Gainesville, Florida Sponsored By:
United States Environmental Protection Agency, Region 4 and Region 5 July 15, 2004

ii
This report was prepared by the Department of Environmental Engineering Sciences at the University of Florida under the direction of Dr. Timothy Townsend. Please direct questions to him at [email protected].

i
Table of Contents
EXECUTIVE SUMMARY .............................................................................VIII
1 INTRODUCTION.................................................................... 1-1
1.1 THE MANAGEMENT OF DISCARDED ELECTRONICS..... 1-1 1.2 THE NEED FOR TOXICITY CHARACTERISTIC
TESTING.................................................................................... 1-2 1.3 RESEARCH SCOPE AND REPORT DESCRIPTION ............. 1-5
2 FACTORS AFFECTING TOXICITY CHARACTERISTIC LEACHING PROCEDURE LEAD LEACHABILITY FROM COMPUTER CPUS..................................................... 2-1
2.1 INTRODUCTION ...................................................................... 2-1 2.2 MATERIALS AND METHODS................................................ 2-1
2.2.1 Sample Collection and Processing............................. 2-1 2.2.2 Leaching and Analysis Methods................................ 2-2 2.2.3 TCLP on Printed Wire Boards................................... 2-3 2.2.4 TCLP on Synthetic Computer CPU Mix/Particle
Size Study .................................................................. 2-4 2.2.5 Component Impact..................................................... 2-4 2.2.6 Impact of Head Space ................................................ 2-5
2.3 RESULTS AND DISCUSSION................................................. 2-6 2.3.1 Lead Leachability from PWBs................................... 2-6 2.3.2 Predicting the TC of an Electronic Device ................ 2-7 2.3.3 Synthetic Computer CPU Mix................................... 2-7 2.3.4 Component Impact..................................................... 2-8 2.3.5 Effects of Particle Size............................................. 2-10 2.3.6 Impact of Head Space .............................................. 2-10 2.3.7 Comparison of Filtered vs. Nonfiltered Samples..... 2-11
2.4 DISCUSSION........................................................................... 2-12 2.4.1 TCLP of PWBs vs. Whole CPUs............................. 2-12 2.4.2 Impact of CPU Components .................................... 2-13 2.4.3 Impact of Extraction Vessel Headspace .................. 2-14
ii
3 EVALUATION OF A LARGE-SCALE MODIFIED TCLP FOR RCRA TOXICITY CHARACTERIZATION OF COMPUTER CPUS................................................................. 3-1
3.1 INTRODUCTION ...................................................................... 3-1 3.2 MATERIALS AND METHODS................................................ 3-1
3.2.1 Research Approach .................................................... 3-1 3.2.2 Sample Collection and Processing............................. 3-2 3.2.3 Large-Scale Leaching Procedure ............................... 3-2 3.2.4 Impact of Extractor Speed ......................................... 3-2 3.2.5 Time Studies .............................................................. 3-3 3.2.6 Methodology Comparison ......................................... 3-3
3.3 RESULTS................................................................................... 3-5 3.3.1 Impact of Extractor Speed ......................................... 3-5 3.3.2 Time Studies .............................................................. 3-5 3.3.3 Methodology Comparison ......................................... 3-9
3.4 DISCUSSION........................................................................... 3-14
4 LEACHING RESULTS FOR VARIOUS ELECTRONIC DEVICES................................................................................. 4-1
4.1 OVERVIEW OF TESTING PERFORMED .............................. 4-1 4.2 PERSONAL COMPUTER CPUS.............................................. 4-2 4.3 COMPUTER MONITORS......................................................... 4-5 4.4 LAPTOP COMPUTERS ............................................................ 4-7 4.5 PRINTERS ................................................................................. 4-9 4.6 COLOR TELEVISIONS .......................................................... 4-11 4.7 VCRS........................................................................................ 4-13 4.8 CELLULAR PHONES............................................................. 4-15 4.9 KEYBOARDS.......................................................................... 4-18 4.10 COMPUTER MICE.................................................................. 4-20 4.11 REMOTE CONTROLS............................................................ 4-21 4.12 SMOKE DETECTORS ............................................................ 4-23 4.13 FLAT PANEL MONITORS..................................................... 4-25
5 SUMMARY OF RESULTS..................................................... 5-1
6 REFERENCES......................................................................... 6-1

iii
List of Tables
Table 1-1. TC Concentrations for Heavy Metals........................................................................ 1-3
Table 2-1. Ferrous Metal Impact Sample Compositions ............................................................ 2-4
Table 2-2. Impact of Vessel Headspace Sample Composition ................................................... 2-5
Table 2-3. Average TCLP Leachate Concentrations from PWBs .............................................. 2-7
Table 2-4. Component Impact TCLP Results............................................................................. 2-9
Table 2-5. TCLP Results of Synthetic Computer CPU Mixture .............................................. 2-10
Table 2-6. Impact of Head Space Results................................................................................. 2-11
Table 3-1. Testing Methodologies .............................................................................................. 3-4
Table 3-2. Methodology Comparison Results .......................................................................... 3-11
Table 4-1. Electronic Devices Tested ......................................................................................... 4-1
Table 4-2. TCLP Results for CPUs............................................................................................. 4-3
Table 4-3. TCLP Results for Computer Monitors ....................................................................... 4-6
Table 4-4. TCLP Results for Laptops ......................................................................................... 4-8
Table 4-5. TCLP Results for Printers ....................................................................................... 4-10
Table 4-6. TCLP Results for Color TV .................................................................................... 4-12
Table 4-7. TCLP Results for VCRs ......................................................................................... 4-13
Table 4-8. TCLP Results for Cell Phones.................................................................................. 4-16
iv
Table 4-9. TCLP Results for Keyboards ................................................................................... 4-19
Table 4-10. TCLP Results for Mice.......................................................................................... 4-21
Table 4-11. TCLP Results for Remote Controls....................................................................... 4-22
Table 4-13. TCLP Results for Flat Panel Displays................................................................... 4-26
Table 5-1. Summary of TCLP Pb Leaching Results................................................................... 5-1
Table A-1. Additional CPU Metals Analysis ............................................................................. 6-1

v
List of Figures
Figure 2-1. Average CPU Composition of 29 Computer CPUs by Weight ............................... 2-2
Figure 2-2. Effects of Component Mixture on Lead Leachability ............................................. 2-8
Figure 2-3. Dissolved Oxygen and ORP Results from Head Space Impact Study................... 2-11
Figure 2-4. Lead Results from Head Space Impact Study........................................................ 2-12
Figure 3-1. Impact of Rotation Speed Results ............................................................................ 3-5
Figure 3-2. Comparison of Metals Results from TCLP Time Study Experiments..................... 3-7
Figure 3-3. Sample 2 Filtered vs. Nonfiltered Metals Concentrations. ...................................... 3-9
Figure 3-4. Metal Concentrations from Methodology Comparison for CPU #1...................... 3-12
Figure 3-5. Laboratory Measurements from Methodology Comparison for CPU #1. ............. 3-13
Figure 4-1. Average CPU Composition of 29 Computer CPUs by Weight ............................... 4-2
Figure 4-2. Average Composition of Computer Monitors Tested.............................................. 4-5
Figure 4-3. Average Composition of Laptops Tested................................................................. 4-7
Figure 4-5. Average Composition of Color TVs Tested .......................................................... 4-11
Figure 4-6. Average Composition of VCRs Tested.................................................................. 4-13
Figure 4-7. Average Composition of Cell Phones Tested ........................................................ 4-15
Figure 4-8. Average Composition of Keyboards Tested .......................................................... 4-18
Figure 4-9. Average Composition of Mice Tested ................................................................... 4-20

vi
Figure 4-10. Average Composition of Remote Controls Tested .............................................. 4-22
Figure 4-11. Average Composition of Smoke Detectors Tested .............................................. 4-23
Figure 4-12. Average composition of Flat Panels .................................................................... 4-25
vii
List of Abbreviations
CPU – Computer Processing Unit
CRT – Cathode Ray Tube
DO – Dissolved Oxygen
HDPE – High Density Polyethylene
MSW – Municipal Solid Waste
PWB – Printed Wire Board
RCRA – Resource Conservation and Recovery Act
RMV – Relative Millivolts
TC – Toxicity Characteristic
TCLP – Toxicity Characteristic Leaching Procedure
US EPA – United States Environmental Protection Agency
WTE – Waste to Energy
viii
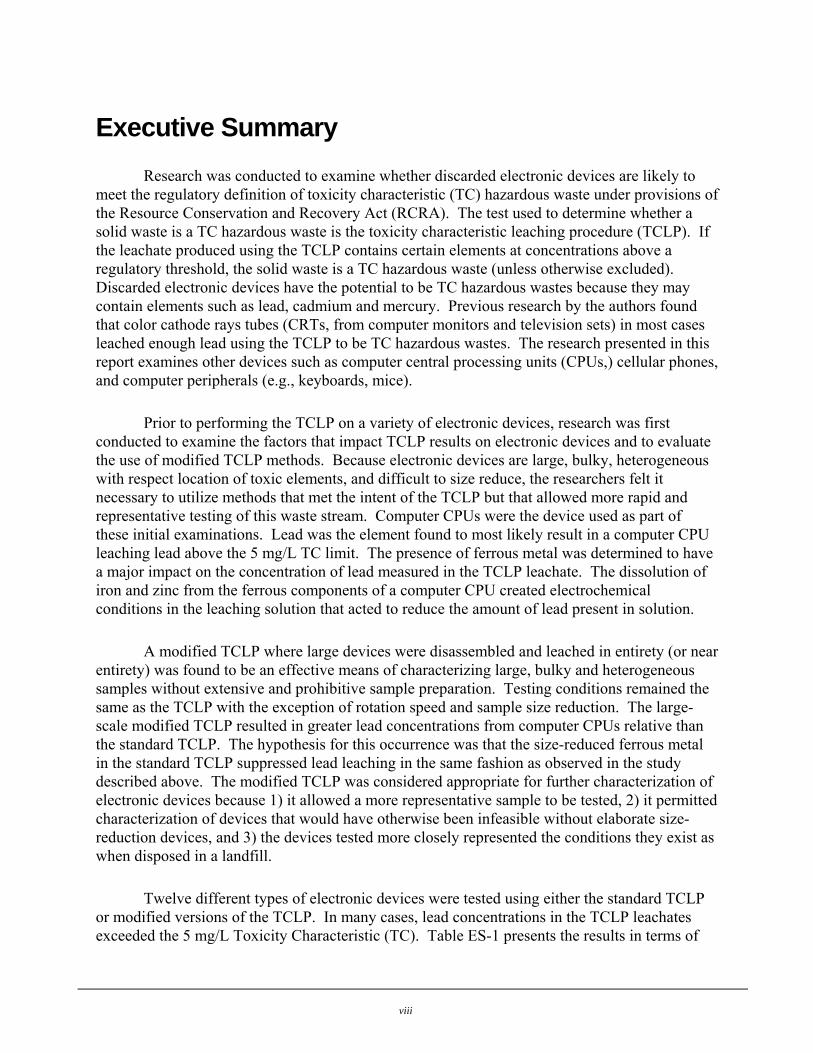
Executive Summary Research was conducted to examine whether discarded electronic devices are likely to
meet the regulatory definition of toxicity characteristic (TC) hazardous waste under provisions of the Resource Conservation and Recovery Act (RCRA). The test used to determine whether a solid waste is a TC hazardous waste is the toxicity characteristic leaching procedure (TCLP). If the leachate produced using the TCLP contains certain elements at concentrations above a regulatory threshold, the solid waste is a TC hazardous waste (unless otherwise excluded). Discarded electronic devices have the potential to be TC hazardous wastes because they may contain elements such as lead, cadmium and mercury. Previous research by the authors found that color cathode rays tubes (CRTs, from computer monitors and television sets) in most cases leached enough lead using the TCLP to be TC hazardous wastes. The research presented in this report examines other devices such as computer central processing units (CPUs,) cellular phones, and computer peripherals (e.g., keyboards, mice).
Prior to performing the TCLP on a variety of electronic devices, research was first conducted to examine the factors that impact TCLP results on electronic devices and to evaluate the use of modified TCLP methods. Because electronic devices are large, bulky, heterogeneous with respect location of toxic elements, and difficult to size reduce, the researchers felt it necessary to utilize methods that met the intent of the TCLP but that allowed more rapid and representative testing of this waste stream. Computer CPUs were the device used as part of these initial examinations. Lead was the element found to most likely result in a computer CPU leaching lead above the 5 mg/L TC limit. The presence of ferrous metal was determined to have a major impact on the concentration of lead measured in the TCLP leachate. The dissolution of iron and zinc from the ferrous components of a computer CPU created electrochemical conditions in the leaching solution that acted to reduce the amount of lead present in solution.
A modified TCLP where large devices were disassembled and leached in entirety (or near entirety) was found to be an effective means of characterizing large, bulky and heterogeneous samples without extensive and prohibitive sample preparation. Testing conditions remained the same as the TCLP with the exception of rotation speed and sample size reduction. The large-scale modified TCLP resulted in greater lead concentrations from computer CPUs relative than the standard TCLP. The hypothesis for this occurrence was that the size-reduced ferrous metal in the standard TCLP suppressed lead leaching in the same fashion as observed in the study described above. The modified TCLP was considered appropriate for further characterization of electronic devices because 1) it allowed a more representative sample to be tested, 2) it permitted characterization of devices that would have otherwise been infeasible without elaborate size-reduction devices, and 3) the devices tested more closely represented the conditions they exist as when disposed in a landfill.
Twelve different types of electronic devices were tested using either the standard TCLP or modified versions of the TCLP. In many cases, lead concentrations in the TCLP leachates exceeded the 5 mg/L Toxicity Characteristic (TC). Table ES-1 presents the results in terms of
ix
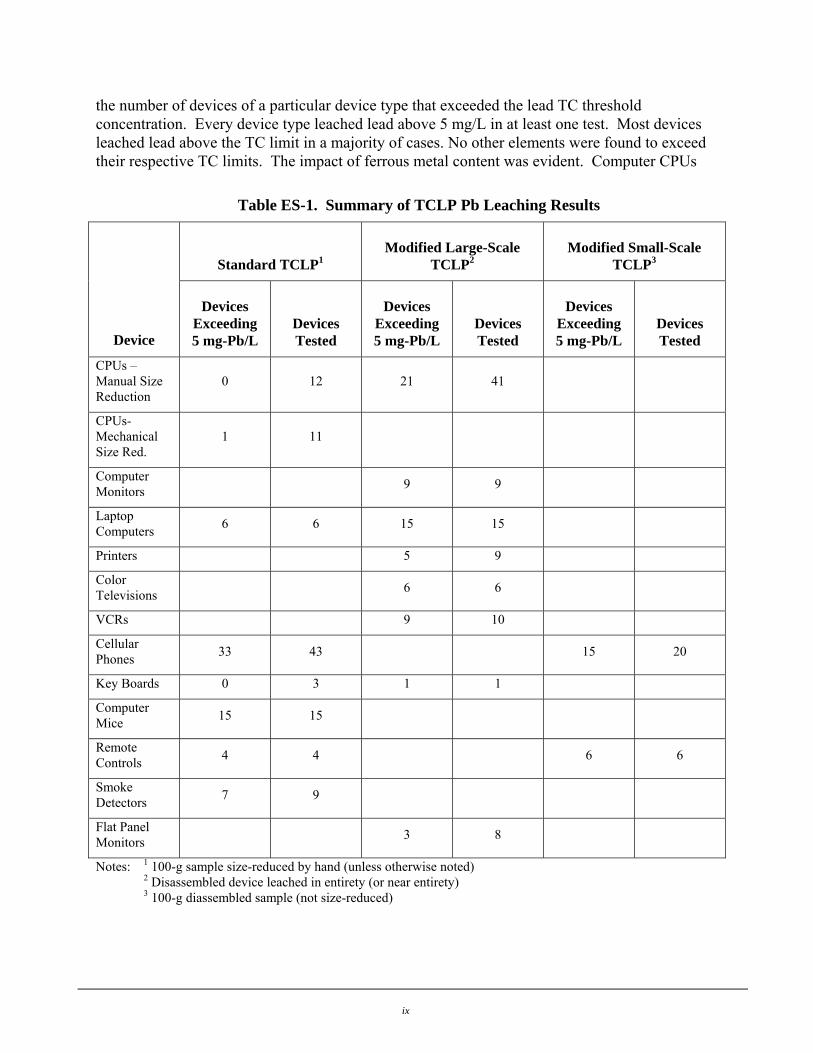
the number of devices of a particular device type that exceeded the lead TC threshold concentration. Every device type leached lead above 5 mg/L in at least one test. Most devices leached lead above the TC limit in a majority of cases. No other elements were found to exceed their respective TC limits. The impact of ferrous metal content was evident. Computer CPUs
Table ES-1. Summary of TCLP Pb Leaching Results
Standard TCLP1 Modified Large-Scale
TCLP2 Modified Small-Scale
TCLP3
Device
Devices Exceeding 5 mg-Pb/L
Devices Tested
Devices Exceeding 5 mg-Pb/L
Devices Tested
Devices Exceeding 5 mg-Pb/L
Devices Tested
CPUs – Manual Size Reduction
0 12 21 41
CPUs- Mechanical Size Red.
1 11
Computer Monitors 9 9
Laptop Computers 6 6 15 15
Printers 5 9
Color Televisions 6 6
VCRs 9 10
Cellular Phones 33 43 15 20
Key Boards 0 3 1 1
Computer Mice 15 15
Remote Controls 4 4 6 6
Smoke Detectors 7 9
Flat Panel Monitors 3 8
Notes: 1 100-g sample size-reduced by hand (unless otherwise noted) 2 Disassembled device leached in entirety (or near entirety) 3 100-g diassembled sample (not size-reduced)

x
tended not to leach lead above the TC limit using the standard approach, while they leached above the TC limit just over 50% of the time using the large-scale modified TCLP. Laptop computers on the other hand leached lead above the TC limit in all cases using both approaches. The difference between the two devices was attributed to the greater ferrous metal content of the computer CPUs (68%) relative to the laptops (7%). Smaller devices that contained larger amounts of plastic and smaller amounts of ferrous metal (e.g., cellular phones, remote controls) tended to leach lead above the TC limit at a greater frequency than devices with more ferrous metal (e.g., printers).
Because of the large and expanding universe of electronic devices, no single study can hope to characterize every device type, let alone every make and model. The results presented here do, however, provide sufficient evidence that discarded electronic devices that contain a color CRT or printer wiring boards with lead-bearing solder have a potential to be RCRA TC hazardous wastes for lead (unless otherwise excluded) and that generators should assume such devices are hazardous or should conduct specific testing to determine otherwise.
CHAPTER 1 INTRODUCTION
1-1
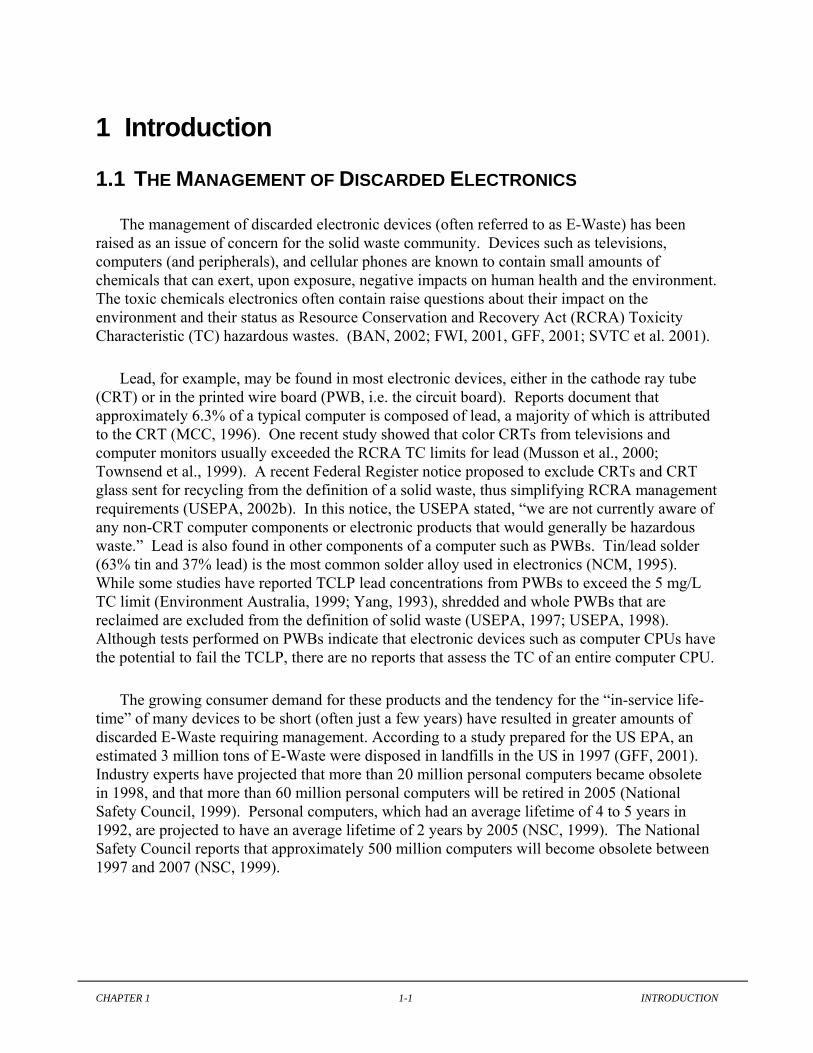
1 Introduction
1.1 THE MANAGEMENT OF DISCARDED ELECTRONICS
The management of discarded electronic devices (often referred to as E-Waste) has been raised as an issue of concern for the solid waste community. Devices such as televisions, computers (and peripherals), and cellular phones are known to contain small amounts of chemicals that can exert, upon exposure, negative impacts on human health and the environment. The toxic chemicals electronics often contain raise questions about their impact on the environment and their status as Resource Conservation and Recovery Act (RCRA) Toxicity Characteristic (TC) hazardous wastes. (BAN, 2002; FWI, 2001, GFF, 2001; SVTC et al. 2001).
Lead, for example, may be found in most electronic devices, either in the cathode ray tube (CRT) or in the printed wire board (PWB, i.e. the circuit board). Reports document that approximately 6.3% of a typical computer is composed of lead, a majority of which is attributed to the CRT (MCC, 1996). One recent study showed that color CRTs from televisions and computer monitors usually exceeded the RCRA TC limits for lead (Musson et al., 2000; Townsend et al., 1999). A recent Federal Register notice proposed to exclude CRTs and CRT glass sent for recycling from the definition of a solid waste, thus simplifying RCRA management requirements (USEPA, 2002b). In this notice, the USEPA stated, “we are not currently aware of any non-CRT computer components or electronic products that would generally be hazardous waste.” Lead is also found in other components of a computer such as PWBs. Tin/lead solder (63% tin and 37% lead) is the most common solder alloy used in electronics (NCM, 1995). While some studies have reported TCLP lead concentrations from PWBs to exceed the 5 mg/L TC limit (Environment Australia, 1999; Yang, 1993), shredded and whole PWBs that are reclaimed are excluded from the definition of solid waste (USEPA, 1997; USEPA, 1998). Although tests performed on PWBs indicate that electronic devices such as computer CPUs have the potential to fail the TCLP, there are no reports that assess the TC of an entire computer CPU.
The growing consumer demand for these products and the tendency for the “in-service life-time” of many devices to be short (often just a few years) have resulted in greater amounts of discarded E-Waste requiring management. According to a study prepared for the US EPA, an estimated 3 million tons of E-Waste were disposed in landfills in the US in 1997 (GFF, 2001). Industry experts have projected that more than 20 million personal computers became obsolete in 1998, and that more than 60 million personal computers will be retired in 2005 (National Safety Council, 1999). Personal computers, which had an average lifetime of 4 to 5 years in 1992, are projected to have an average lifetime of 2 years by 2005 (NSC, 1999). The National Safety Council reports that approximately 500 million computers will become obsolete between 1997 and 2007 (NSC, 1999).

Chapter 1 Introduction
CHAPTER 1 INTRODUCTION
1-2
Some have speculated that the disposal of discarded electronic devices with the rest of the municipal solid waste (MSW) stream will result in measurable impacts on human health and the environment (Yang, 1993; BAN, 2002; Schmidt 2002), or at the very least may pose operational or permit problems for waste facilities (e.g. elevated metal concentrations in waste-to-energy (WTE) ash, thereby limiting ash reuse options). Others argue that no evidence exists that management of E-waste via traditional waste management systems such as landfills causes any impact on the environment (Akatiff, 2002). The debate over the true effects of discarded computers, televisions, and cellular phones remains alive and active. Those charged with managing solid waste are faced with a very real question: are discarded electronic devices classified as hazardous wastes under RCRA regulations developed by the United States Environmental Protection Agency (US EPA)?
1.2 THE NEED FOR TOXICITY CHARACTERISTIC TESTING
A cornerstone of the federal solid waste regulations in the US is that certain types of solid wastes possess physical and/or chemical properties that warrant additional management requirements beyond that required for other household or commercial wastes. Solid wastes identified as hazardous (either through listing or by expressing a characteristic) are subjected to a greater degree of control, from the point of generation to the point of final disposition. The added regulatory requirements for hazardous wastes result in greater management costs. In some cases, these added costs provide incentives for generators of the waste to alter their process or product in such a fashion that the wastes produced are no longer classified as hazardous. Also, some types of solid wastes are excluded from being hazardous wastes at the federal level; household waste is a notable example since substantial electronic device wastes are generated by individuals at home.
Discarded electronic devices are not listed as hazardous wastes. The known presence of several heavy metals in E-waste raises the potential that these devices might be toxicity characteristic (TC) hazardous wastes. The test for determining whether a solid waste is hazardous because of the TC (40 CFR 261.34) is the Toxicity Characteristic Leaching Procedure (TCLP). The EPA publication SW-846, entitled Test Methods for Evaluating Solid Waste, Physical/Chemical Methods, is the EPA’s official compendium of analytical and sampling methods that have been evaluated and approved for use in complying with the RCRA regulations. SW-846 Method 1311, the TCLP, is an 18-hour batch-leaching test in which 100 grams of solid waste are leached in the presence of a prescribed leaching fluid designed to simulate the conditions that might occur in a MSW landfill as the waste decomposes. The TCLP fluid used depends on the alkalinity of the waste material. Very alkaline waste materials are leached with a fixed amount of glacial acetic acid without an added buffer (pH 2.88 ± 0.05), while other waste materials are leached with glacial acetic acid buffered at pH 4.93 ± 0.05 with 1-N sodium hydroxide. Particle size reduction of solid waste is required so that the waste material is capable of passing through a 9.5-mm standard sieve. Two liters of the leaching fluid are placed in a container with the 100g sample. The container is placed in a rotary extraction vessel and leached for 18 ± 2 hours at 30 ± 2 rpm. After rotation, the leachate is filtered and then

Chapter 1 Introduction
CHAPTER 1 INTRODUCTION
1-3
analyzed for a number of chemicals. Eight heavy metals are on the TC list. They are presented along with their appropriate TC concentrations in Table 1-1. If the leachate concentration exceeds the TC concentration, the solid waste is classified as a TC hazardous waste.
Table 1-1. TC Concentrations for Heavy Metals
METAL TC REGULATED CONCENTRATION
Arsenic 5 mg/l
Barium 100 mg/l
Cadmium 1 mg/l
Chromium 5 mg/l
Lead 5 mg/l
Mercury 0.2 mg/l
Selenium 1 mg/l
Silver 5 mg/l
Several of the elements listed in Table 1-1 are found in electronic devices. Most notable are lead, cadmium, chromium and mercury. If these elements are present in an electronic device, the device could potentially be classified as a TC hazardous waste when discarded. TCLP results on manufactured articles like electronic devices are not common, however. This stems from several factors, including the relatively recent recognition of electronic devices as a possible concern, and the difficulty of conducting the TCLP on such devices.
While the TCLP is performed routinely in laboratories across the country, the analysis of wastes like electronic devices poses several problems. The TCLP methodology requires 100 g of sample sized-reduced to pass a 0.95-cm sieve. A whole device such as a computer must therefore be ground, shred or cut to the appropriate particle size. Unlike most wastes that either inherently meet the size requirement (e.g., ash, sludge) or exist in a homogenous physical state that can be crushed or cut (e.g., cement-stabilized forms, wood), electronic devices do not lend themselves to ready size reduction. Electronic devices are composed of different material types each with distinct physical properties (e.g., printed wire boards, plastic, ferrous and non-ferrous metal, glass). Each of these materials may respond differently to different size reduction equipment. Common laboratory grinders or mills that are sometimes used in the preparation of samples for the TCLP are of little use for size reducing something on the scale and heterogeneity of a printer.
Larger-scale equipment (e.g. shear shredders) that is sometimes used in scrap electronic debris-processing facilities does not size reduce the material to the necessary size, and is designed for processing large amounts of material (as opposed to a single device). Without the

Chapter 1 Introduction
CHAPTER 1 INTRODUCTION
1-4
acquisition of specialized equipment or the use of multiple size reduction units, those performing the test are often left with manual size reduction (e.g., cutting by hand) as the only reasonable option. In addition to being very labor intensive (and very difficult for metal housings and components such as hard drives), manual reduction methods may introduce human bias into the sample collection process as the technician in charge of producing the sample may have to select which part of a large device should be size-reduced.
One possible approach to determine the TCLP results for a heterogeneous manufactured device is to use TCLP results from the suspected hazardous component of the device and assume that the rest of the device does not impact leaching. The first is to calculate a predicted TCLP concentration for the entire device based on the TCLP results from the hazardous components only. For example, the suspected hazardous component in a computer CPU is the PWB; therefore, the TCLP can be performed on the PWB only. A predicted TCLP lead concentration for the entire CPU can then be calculated based upon the fraction of PWB in the CPU and the results from the TCLP performed on the PWB. The equation that to calculate a predicted TCLP concentration for a computer CPU is:
Total
PWBPWB
MM TCLP
TCLP =
The TCLPPWB term represents the TCLP lead concentration from the PWB, MPWB is the mass of PWB in the CPU, and MTOTAL is the total mass of the CPU. As an example, research showed that the PWB comprised 15.8% of the weight of a typical CPU. Therefore this method would require multiplying the results of the 100g PWB sample by 0.158 to determine the TCLP results expected from the CPU.
A second method of predicting the TC of an electronic device is to perform the TCLP on the relative fraction of the suspected hazardous component only. For example, research showed that the PWB comprised 15.8% of the weight of a typical CPU. Performance of the TCLP on a sample of only 15.8 grams of the PWB could predict the lead leachability from a CPU. However, each of these methods neglects the potential chemical and physical effects of other components of the CPU in the TCLP
The magnitude of electronic devices in the waste stream, their potential to be a TC hazardous waste, and the lack of TCLP data for these devices, provide ample incentive for a RCRA TC study of electronic devices. The objective of the research presented in this report was to examine the propensity of electronic devices to be characterized as TC hazardous wastes under RCRA. In some cases, the difficulties encountered in performing the TCLP on large devices prompted the researchers to conduct modified leaching tests that were designed to meet the intent of the TCLP testing. As such, some work was conducted to examine the impacts of these modifications on testing results. The goal of this research was not to characterize all electronic devices for TC status – that would be unrealistic because of the great variety of devices sold and
Chapter 1 Introduction
CHAPTER 1 INTRODUCTION
1-5
in use. Instead, the goal was to provide the regulators and the regulated community with some understanding of the likelihood of such devices being TC hazardous wastes.
1.3 RESEARCH SCOPE AND REPORT DESCRIPTION
This report presents the results of TCLP testing of electronic devices. This research was funded by US EPA Regions 4 and 5 to assist state regulators in making hazardous waste determinations. The research started with a focus on computer CPUs, but evolved to examine other devices as well. Much of the research was also devoted to evaluating the parameters that impact TCLP leaching results from discarded electronic devices and to examine modified leaching procedures. Modified leaching procedures were designed in an effort to meet the intent of the TCLP while overcoming some of the obstacles that greatly limited the number of tests that could be performed. This report does not attempt to interpret the TCLP results with respect to environmental impacts.
Chapter 2 presents the result of several experiments conducted to examine the factors that impact lead leaching from computer CPUs during the TCLP. Specifically, Chapter 2 presents the following test results:
- TCLP testing of PWBs
- TCLP tests of a mixture representative of CPU composition
- TCLP tests of PWBs with each CPU component individually to determine if each component can affect TCLP lead leachability from PWBs
- TCLP tests of PWBs with varying quantities of the iron metal components to further characterize its effects on lead leachability
- TCLP tests of a representative CPU sample with varying head space above the leaching solution to determine the effects of head space upon the TCLP applied to electronics.
Finally, Chapter 2 concludes with a comparison of the toxic metal levels contained in the filtered TCLP solution to those present in the solution prior to filtering (unfiltered).
Chapter 3 presents the results of research utilizing a new large-scale modified TCLP for leaching whole devices such as computer CPUs. This method was performed to provide a potential alternative method to performing the TCLP on electronics and other devices not amenable to size reduction. By testing the whole device, the errors and difficulties discussed earlier may be avoided. However in designing the new method several parameters required

Chapter 1 Introduction
CHAPTER 1 INTRODUCTION
1-6
testing:
- Does the speed of rotation of the device impact TCLP results?
- Does the large-scale method reach the equilibrium level intended in the TCLP methodology over the same period of time, 18+2 hours?
- What results are achieved by placing smaller devices such as computer mice and remote controls into TCLP extraction vessels not size reduced, but only disassembled?
Chapters 2 and 3 were conducted and presented as the major part of a master of engineering thesis (Vann, 2003).
Chapter 4 presents all of the TCLP results for the 12 types of electronic devices examined in this research. The devices examined included:
• Personal Computer CPUs
• Computer Monitors
• Laptop Computers
• Printers
• Color Televisions
• VCRs
• Cellular Phones
• Key Boards
• Computer Mice
• Remote Controls
• Smoke Detectors
• Flat Panel Monitors
The average composition of each of the devices is presented, as well as the concentrations of several elements detected within the TCLP leachates. The results are summarized and compared in Chapter 5.

CHAPTER 2 FACTORS AFFECTING TOXICITY CHARACTERISTIC LEACHING PROCEDURE LEAD LEACHABILITY FORM COMPUTER CPUS
2-1
2 Factors Affecting Toxicity Characteristic Leaching Procedure Lead Leachability from Computer CPUs
2.1 INTRODUCTION
Research was performed to examine the factors that affect lead leachability from computer CPUs. Computer CPUs consist of several distinct materials with different physical and chemical properties. An understanding of the processes affecting heavy metal leaching is useful for developing the appropriate testing procedures and for understanding how results may differ among devices. Slight changes in the TCLP methodology, which still meet the requirements of the method, can also affect results. For example, Meng et al. (2001) found that changing the head space above the TCLP leaching fluid during the test greatly impacted the amount of arsenic that leached from water treatment sludges.
This chapter provides the details of an experiment that sampled, size-reduced, and mixed several personal computer CPUs to create a composite CPU mixture that was leached under a variety of conditions. Lead, iron, copper, and zinc results are presented. Although lead is the primary chemical of interest, the analysis of iron, copper, and zinc can be used to describe the processes (reduction by metallic iron and zinc and sorption by hydrous ferric oxide) that have been documented to impact lead leachability (Kendall, 2003). The objective of the research was to investigate the factors that impact lead leachability from computer CPUs during the TCLP, not to provide a definitive study on the hazardous waste characterization of computer CPUs.
2.2 MATERIALS AND METHODS
2.2.1 Sample Collection and Processing
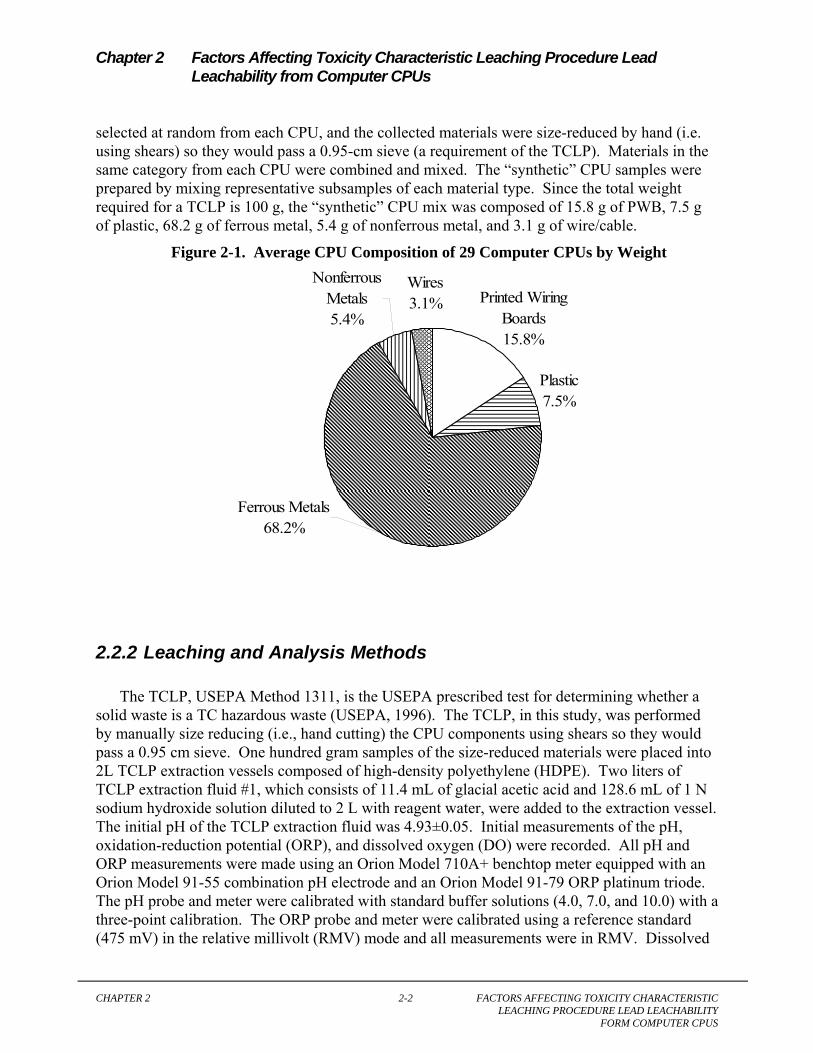
Computer CPUs were collected from a variety of sources including electronics demanufacturing facilities, individuals, and a local household hazardous waste collection center. Twenty-nine computer CPUs were completely disassembled and separated into five material categories: PWBs, ferrous metals, nonferrous metals, wires/cables, and plastics. The weight of material for each of these categories was measured. Figure 2-1 presents the average composition (by weight) of all the CPUs.
From the twenty-nine CPUs, five were selected at random to create a synthetic CPU mixture to be used in TCLP testing. The synthetic CPU mixture was created to match the average composition depicted in Figure 2-1. To provide enough material for all the desired tests, approximately 500 g of PWB, 240 g of plastic, 2,200 g of ferrous metal, 170 g of nonferrous metal, and 100 g of wires were collected from each of the five CPUs. These pieces were
Chapter 2 Factors Affecting Toxicity Characteristic Leaching Procedure Lead Leachability from Computer CPUs
CHAPTER 2 FACTORS AFFECTING TOXICITY CHARACTERISTIC LEACHING PROCEDURE LEAD LEACHABILITY FORM COMPUTER CPUS
2-2
selected at random from each CPU, and the collected materials were size-reduced by hand (i.e. using shears) so they would pass a 0.95-cm sieve (a requirement of the TCLP). Materials in the same category from each CPU were combined and mixed. The “synthetic” CPU samples were prepared by mixing representative subsamples of each material type. Since the total weight required for a TCLP is 100 g, the “synthetic” CPU mix was composed of 15.8 g of PWB, 7.5 g of plastic, 68.2 g of ferrous metal, 5.4 g of nonferrous metal, and 3.1 g of wire/cable.
Figure 2-1. Average CPU Composition of 29 Computer CPUs by Weight
Plastic7.5%
Ferrous Metals68.2%
Printed Wiring Boards15.8%
Nonferrous Metals5.4%
Wires3.1%
2.2.2 Leaching and Analysis Methods
The TCLP, USEPA Method 1311, is the USEPA prescribed test for determining whether a solid waste is a TC hazardous waste (USEPA, 1996). The TCLP, in this study, was performed by manually size reducing (i.e., hand cutting) the CPU components using shears so they would pass a 0.95 cm sieve. One hundred gram samples of the size-reduced materials were placed into 2L TCLP extraction vessels composed of high-density polyethylene (HDPE). Two liters of TCLP extraction fluid #1, which consists of 11.4 mL of glacial acetic acid and 128.6 mL of 1 N sodium hydroxide solution diluted to 2 L with reagent water, were added to the extraction vessel. The initial pH of the TCLP extraction fluid was 4.93±0.05. Initial measurements of the pH, oxidation-reduction potential (ORP), and dissolved oxygen (DO) were recorded. All pH and ORP measurements were made using an Orion Model 710A+ benchtop meter equipped with an Orion Model 91-55 combination pH electrode and an Orion Model 91-79 ORP platinum triode. The pH probe and meter were calibrated with standard buffer solutions (4.0, 7.0, and 10.0) with a three-point calibration. The ORP probe and meter were calibrated using a reference standard (475 mV) in the relative millivolt (RMV) mode and all measurements were in RMV. Dissolved
Chapter 2 Factors Affecting Toxicity Characteristic Leaching Procedure Lead Leachability from Computer CPUs
CHAPTER 2 FACTORS AFFECTING TOXICITY CHARACTERISTIC LEACHING PROCEDURE LEAD LEACHABILITY FORM COMPUTER CPUS
2-3
oxygen measurements were collected using an YSI Inc. Model 55 handheld dissolved oxygen meter.
All samples were performed in triplicate and a TCLP blank was included for each set of leaching extractions. The samples were rotated at 30±2 rpm for 18±2 hours in a 12-vessel rotary extractor (Analytical Testing Corporation). After rotation, the final pH, DO, and ORP of the leachates were recorded. The TCLP leachates were filtered through a glass fiber filter (0.7 µm pore size) using pressure filtration and preserved by adding concentrated nitric acid until the pH of the filtrate was below 2. In addition to collecting the filtered leachate, samples of nonfiltered leachates were also collected and preserved. All samples were then stored in HDPE bottles until acid digestion. Specific experimental details of the TCLP methodologies performed will be described in the following sections.
Ferrous iron (Fe2+) analysis was performed prior to preserving the samples using a HACH Model DR/4000 spectrophotometer using the 1,10 phenanthroline method (HACH program 2150). The spectrophotometer was zeroed with reagent water and a 1-mg/L standard was used to verify the machine calibration. Samples placed in glass vials were allowed to react for three minutes with ferrous iron reagent powder pillows added to the sample. The glass vials were cleaned to remove any surface contamination and then placed in the spectrophotometer. The ferrous iron (Fe2+) concentration was recorded. Readings were taken before and after the addition of the ferrous iron reagent powder pillows for the nonfiltered samples to account for any absorbance caused by particulates in the sample. Lead, iron, copper, and zinc analyses were performed by digesting the samples using the hotplate acid digestion procedure, USEPA Method 3010A. The digested samples were then analyzed using USEPA Method 6010B (Inductively Coupled Plasma-Atomic Emissions Spectrometry) on a Thermo Terrell Ash Trace Analyzer ICP (USEPA, 1996).
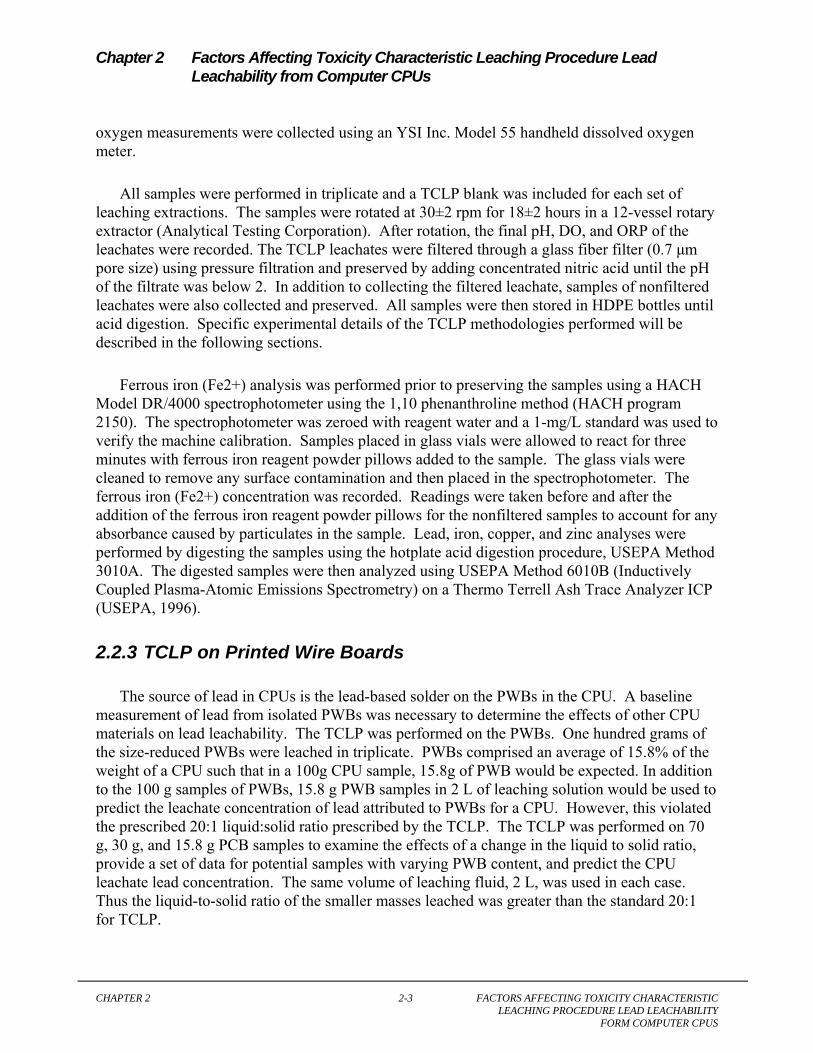
2.2.3 TCLP on Printed Wire Boards
The source of lead in CPUs is the lead-based solder on the PWBs in the CPU. A baseline measurement of lead from isolated PWBs was necessary to determine the effects of other CPU materials on lead leachability. The TCLP was performed on the PWBs. One hundred grams of the size-reduced PWBs were leached in triplicate. PWBs comprised an average of 15.8% of the weight of a CPU such that in a 100g CPU sample, 15.8g of PWB would be expected. In addition to the 100 g samples of PWBs, 15.8 g PWB samples in 2 L of leaching solution would be used to predict the leachate concentration of lead attributed to PWBs for a CPU. However, this violated the prescribed 20:1 liquid:solid ratio prescribed by the TCLP. The TCLP was performed on 70 g, 30 g, and 15.8 g PCB samples to examine the effects of a change in the liquid to solid ratio, provide a set of data for potential samples with varying PWB content, and predict the CPU leachate lead concentration. The same volume of leaching fluid, 2 L, was used in each case. Thus the liquid-to-solid ratio of the smaller masses leached was greater than the standard 20:1 for TCLP.
Chapter 2 Factors Affecting Toxicity Characteristic Leaching Procedure Lead Leachability from Computer CPUs
CHAPTER 2 FACTORS AFFECTING TOXICITY CHARACTERISTIC LEACHING PROCEDURE LEAD LEACHABILITY FORM COMPUTER CPUS
2-4
2.2.4 TCLP on Synthetic Computer CPU Mix/Particle Size Study
The TCLP was also performed on a 100-g sample of the “synthetic” CPU mixture prepared in Section 2.2.1 to evaluate lead leachability from a complete CPU. It is noted that the TCLP does not limit the extent of size reduction of the solid sample. To address the issue of how size reduction affects lead leachability from CPUs, a second sample of the “synthetic” CPU mixture was collected and size reduced to pass through a 0.2-cm sieve. This was achieved manually using shears. The TCLP was then performed to evaluate the impact of sample size on lead leachability.
2.2.5 Component Impact
An investigation of the effects of computer CPU composition on lead leachability during the TCLP was performed by leaching different mixtures of the CPU components. Samples were prepared with 50g of size-reduced PWBs only and 50g of PWBs with 50g of ferrous metal, 50 g of nonferrous metal, and 50g plastic to examine the individual impact of each material on lead leachability from the PWBs. The materials were obtained from the CPU components described in Section 2.2.1.
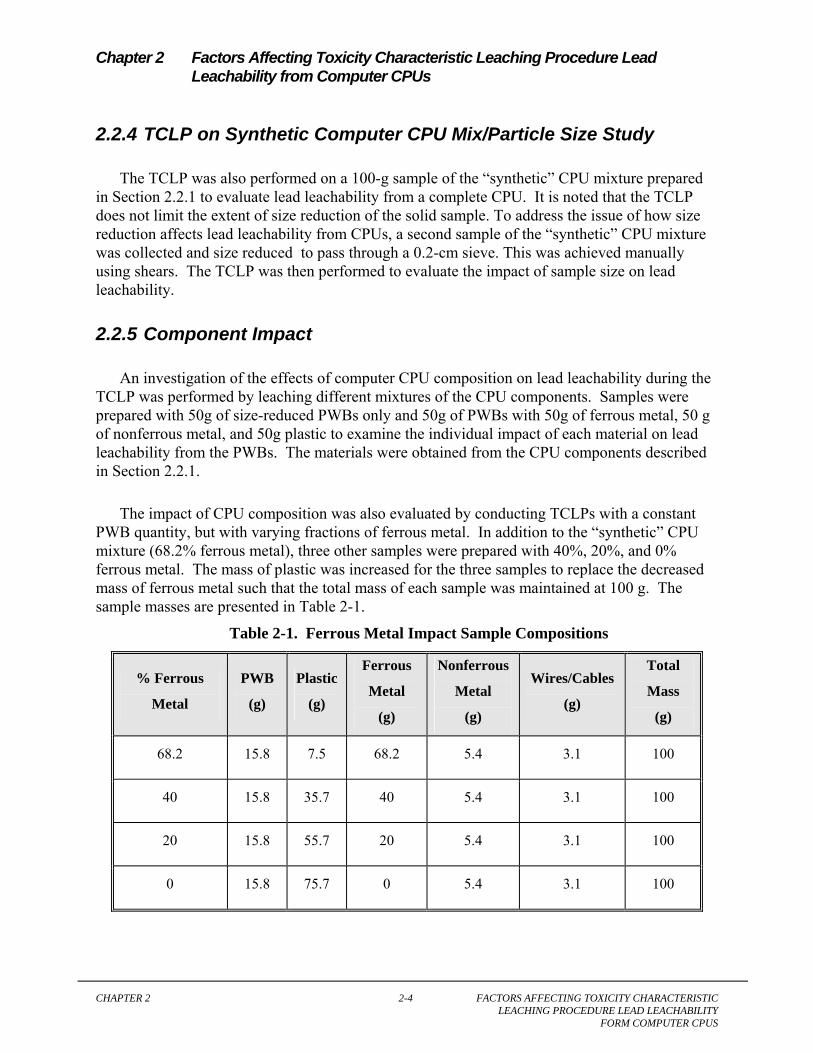
The impact of CPU composition was also evaluated by conducting TCLPs with a constant PWB quantity, but with varying fractions of ferrous metal. In addition to the “synthetic” CPU mixture (68.2% ferrous metal), three other samples were prepared with 40%, 20%, and 0% ferrous metal. The mass of plastic was increased for the three samples to replace the decreased mass of ferrous metal such that the total mass of each sample was maintained at 100 g. The sample masses are presented in Table 2-1.
Table 2-1. Ferrous Metal Impact Sample Compositions
% Ferrous
Metal
PWB
(g)
Plastic
(g)
Ferrous
Metal
(g)
Nonferrous
Metal
(g)
Wires/Cables
(g)
Total
Mass
(g)
68.2 15.8 7.5 68.2 5.4 3.1 100
40 15.8 35.7 40 5.4 3.1 100
20 15.8 55.7 20 5.4 3.1 100
0 15.8 75.7 0 5.4 3.1 100
Chapter 2 Factors Affecting Toxicity Characteristic Leaching Procedure Lead Leachability from Computer CPUs
CHAPTER 2 FACTORS AFFECTING TOXICITY CHARACTERISTIC LEACHING PROCEDURE LEAD LEACHABILITY FORM COMPUTER CPUS
2-5
2.2.6 Impact of Head Space
As discussed in Section 2.1, slight changes in the TCLP methodology can affect results. An investigation was conducted to evaluate whether the headspace above the TCLP leaching fluid impacted lead leachability from computer CPUs during the TCLP. The extraction vessel used during the standard TCLP method had an actual volume of 2.34 L, leaving approximately 0.34 L of headspace above the 2L of TCLP extraction fluid. The volume occupied by the 100-g CPU sample itself was 0.023 L. The actual volume of headspace (Va) and extraction fluid (Vl) in the vessel was 0.317 L and 2.023 L, respectively, resulting in an air-to-liquid ratio (volume of air to volume of liquid (Va/Vl)) of 0.16.
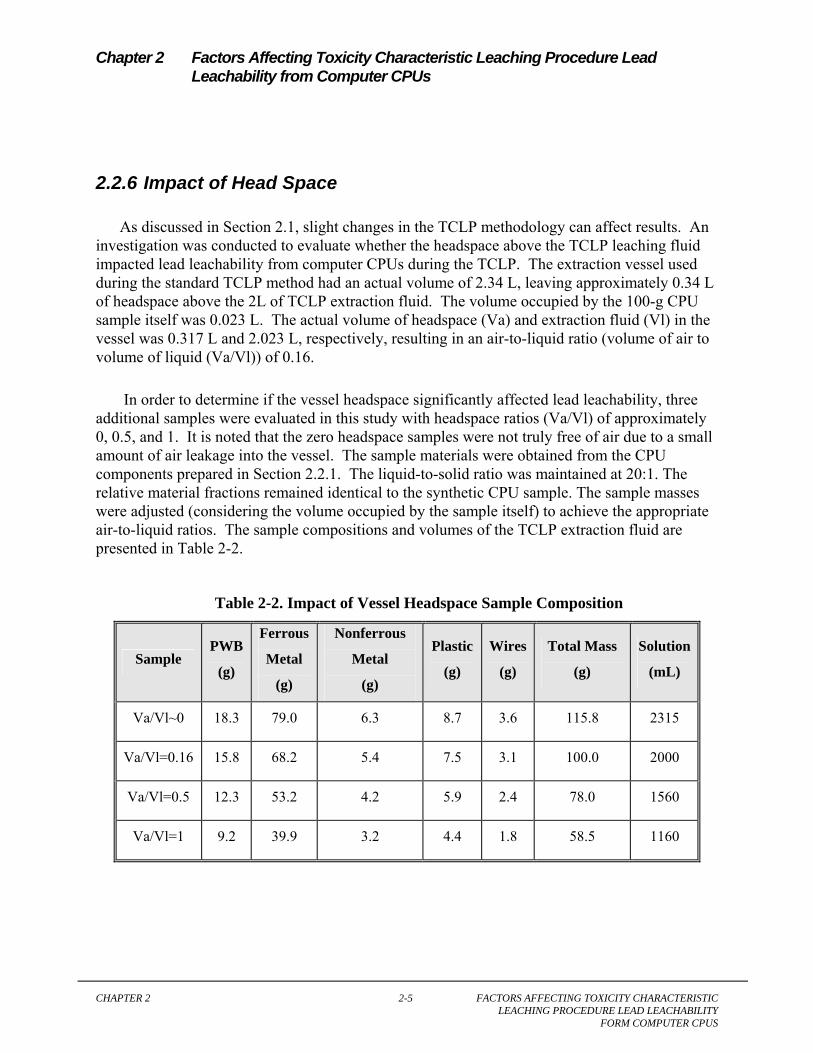
In order to determine if the vessel headspace significantly affected lead leachability, three additional samples were evaluated in this study with headspace ratios (Va/Vl) of approximately 0, 0.5, and 1. It is noted that the zero headspace samples were not truly free of air due to a small amount of air leakage into the vessel. The sample materials were obtained from the CPU components prepared in Section 2.2.1. The liquid-to-solid ratio was maintained at 20:1. The relative material fractions remained identical to the synthetic CPU sample. The sample masses were adjusted (considering the volume occupied by the sample itself) to achieve the appropriate air-to-liquid ratios. The sample compositions and volumes of the TCLP extraction fluid are presented in Table 2-2.
Table 2-2. Impact of Vessel Headspace Sample Composition
Sample PWB
(g)
Ferrous
Metal
(g)
Nonferrous
Metal
(g)
Plastic
(g)
Wires
(g)
Total Mass
(g)
Solution
(mL)
Va/Vl~0 18.3 79.0 6.3 8.7 3.6 115.8 2315
Va/Vl=0.16 15.8 68.2 5.4 7.5 3.1 100.0 2000
Va/Vl=0.5 12.3 53.2 4.2 5.9 2.4 78.0 1560
Va/Vl=1 9.2 39.9 3.2 4.4 1.8 58.5 1160
Chapter 2 Factors Affecting Toxicity Characteristic Leaching Procedure Lead Leachability from Computer CPUs
CHAPTER 2 FACTORS AFFECTING TOXICITY CHARACTERISTIC LEACHING PROCEDURE LEAD LEACHABILITY FORM COMPUTER CPUS
2-6
2.3 RESULTS AND DISCUSSION
2.3.1 Lead Leachability from PWBs
The average TCLP lead concentration from the 100g samples of PWBs was 151 mg/L. Other studies have reported TCLP lead concentrations for PWBs to range from 56 mg/L to 1,350 mg/L (Environment Australia, 1999; Yang, 1993). Typical PWB TCLP lead concentrations measured in other studies range from 100 mg/L to 200 mg/L (Jang, Y. and T. Townsend, 2003 “Leaching of Lead from Computer Printed Wire Boards and Cathode Ray Tubes by Municipal Solid Waste Landfill Leachates,” Submitted for publication; Townsend et al., 2001). All of the PWB samples tested in this study exceeded the RCRA TC limit for lead of 5.0 mg/L. However, the USEPA excludes PWBs that are being recycled from the definition of a solid waste; they are exempt from the RCRA hazardous waste regulations.
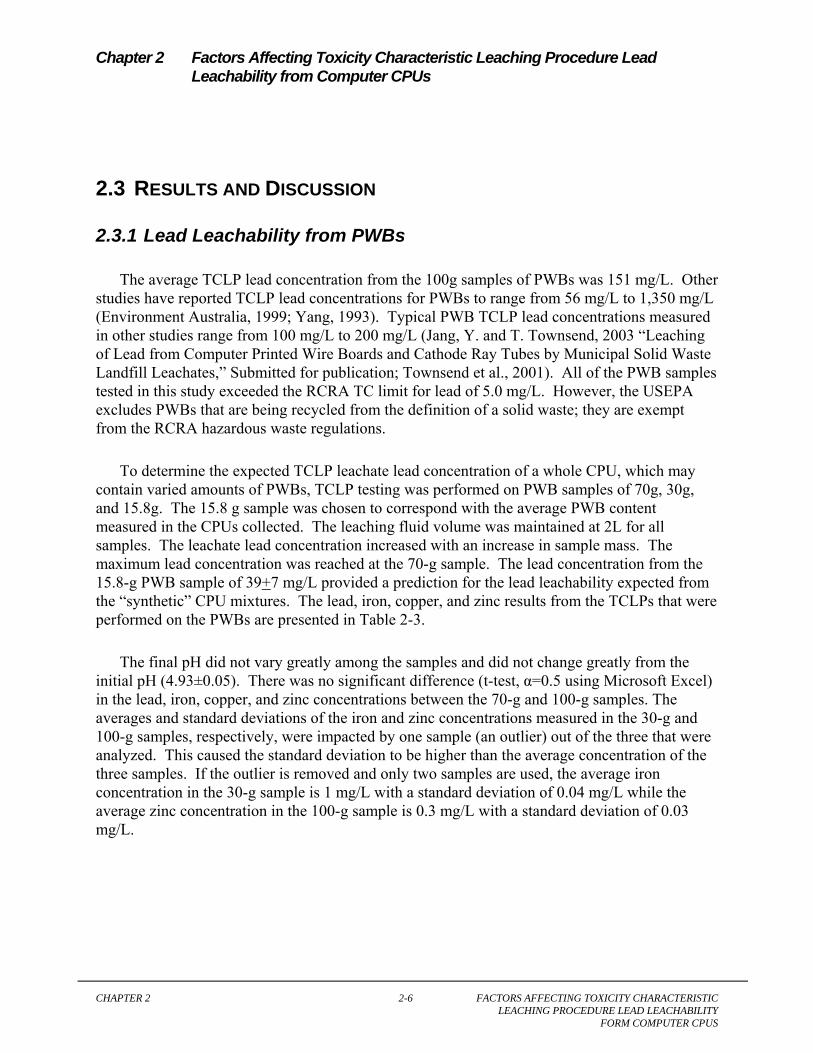
To determine the expected TCLP leachate lead concentration of a whole CPU, which may contain varied amounts of PWBs, TCLP testing was performed on PWB samples of 70g, 30g, and 15.8g. The 15.8 g sample was chosen to correspond with the average PWB content measured in the CPUs collected. The leaching fluid volume was maintained at 2L for all samples. The leachate lead concentration increased with an increase in sample mass. The maximum lead concentration was reached at the 70-g sample. The lead concentration from the 15.8-g PWB sample of 39+7 mg/L provided a prediction for the lead leachability expected from the “synthetic” CPU mixtures. The lead, iron, copper, and zinc results from the TCLPs that were performed on the PWBs are presented in Table 2-3.
The final pH did not vary greatly among the samples and did not change greatly from the initial pH (4.93±0.05). There was no significant difference (t-test, α=0.5 using Microsoft Excel) in the lead, iron, copper, and zinc concentrations between the 70-g and 100-g samples. The averages and standard deviations of the iron and zinc concentrations measured in the 30-g and 100-g samples, respectively, were impacted by one sample (an outlier) out of the three that were analyzed. This caused the standard deviation to be higher than the average concentration of the three samples. If the outlier is removed and only two samples are used, the average iron concentration in the 30-g sample is 1 mg/L with a standard deviation of 0.04 mg/L while the average zinc concentration in the 100-g sample is 0.3 mg/L with a standard deviation of 0.03 mg/L.
Chapter 2 Factors Affecting Toxicity Characteristic Leaching Procedure Lead Leachability from Computer CPUs
CHAPTER 2 FACTORS AFFECTING TOXICITY CHARACTERISTIC LEACHING PROCEDURE LEAD LEACHABILITY FORM COMPUTER CPUS
2-7
Table 2-3. Average TCLP Leachate Concentrations from PWBs (Average of 3 samples)
Mass
(g)
Liquid/Solid
Ratio
Final
pH
Lead
(mg/L)
Iron (mg/L) Copper
(mg/L)
Zinc
(mg/L)
15.8 126.6:1 4.91±0.01 39±7 1±0.5 0.3±0.1 0.14±0.1
30 66.7:1 4.92±0.01 61±3 3±4 0.5±0.1 0.2±0.05
70 28.6:1 4.93±0.01 161±6 8±2 0.7±0.2 0.3±0.18
100 20:1 4.91±0.01 151±10 5±0.6 0.5±0.2 3±4
2.3.2 Predicting the TC of an Electronic Device
With the results from Table 2-3, it is possible to predict the TCLP lead concentration from synthetic CPU samples. As discussed in Chapter 1, two approaches are possible. The first is to calculate a predicted TCLP concentration for the entire CPU based on the TCLP results from the PWBs alone using the equation:
Total
PWBPWB
MM TCLP
TCLP =
Using this procedure, the TCLP lead concentration from the PWBs of 151 mg/L, and PWBs composing 15.8% (MPWB/MTotal=0.158) of the CPU, results in a predicted TCLP lead concentration of 24 mg/L, which exceeds the TC limit for lead.
The second method to predict the TC of an electronic device is to perform the TCLP on the relative fraction of the suspected hazardous component only. The results showed that the TCLP lead concentration from the 15.8-g PWB samples was 39 mg/L. The predicted lead leachability from the “synthetic” CPU mixture during the TCLP would be expected to be 39 mg/L, assuming the other components did not impact lead leaching.
2.3.3 Synthetic Computer CPU Mix
The TCLP was performed on a “synthetic” CPU, a mixture of CPU components representative of the average composition of the CPUs collected. The TCLP leachates from the synthetic CPU mixture contained an average of 0.3mg/L lead, 19 mg/L iron, and 136 mg/L zinc. Copper was not detected (MDL=0.05 mg/L). The results are presented in Table 2-4.

Chapter 2 Factors Affecting Toxicity Characteristic Leaching Procedure Lead Leachability from Computer CPUs
CHAPTER 2 FACTORS AFFECTING TOXICITY CHARACTERISTIC LEACHING PROCEDURE LEAD LEACHABILITY FORM COMPUTER CPUS
2-8
As dicussed in section 2.3.2, tests of samples containing only PWBs predicted lead levels of 39 mg/L and 24 mg/L. The 0.3 mg/L of lead leached from the “synthetic” CPU mixture sample indicate that other components of the CPU affected lead leachability from the PWBs. Figure 2-2 illustrates a comparison of the average lead concentration from the “synthetic” CPU mixture samples and the predicted TCLP lead concentrations based on PWB testing only. This confirmed that there was an impact on lead leachability during the TCLP when the other components of the CPU were mixed with the PWBs. This comparison also demonstrated that testing the PWBs alone did not accurately predict the lead leachability from a representative sample of the “synthetic” CPU mixture. A Student’s t-test (α=0.5 using Microsoft Excel) performed on the results shows that the two methods of predicting the TCLP lead concentration were significantly different for this sample. Predicting the TC of an entire device by testing the hazardous component only may not be the most reliable option.
0.01
0.1
1
10
100
TCLP <0.95 cm TCLP <0.20 cm Predicted TCLP(Method 1)
Predicted TCLP(Method 2)
Pb C
once
ntra
tion
(mg/
L)
Figure 2-2. Effects of Component Mixture on Lead Leachability
2.3.4 Component Impact
Table 2-4 presents a summary of an investigation of material impact on lead leachability during the TCLP. The TCLP lead, iron, copper, and zinc concentrations from samples comprised solely of 50g PWB averaged 83 mg/L, 6 mg/L, 0.3 mg/L, and 1 mg/L, respectively. The lead concentration in the sample that contained 50g of PWB mixed with 50g of ferrous metal was significantly less (Student’s t-test, α=0.5 using Microsoft Excel) (3 mg/L vs. 83 mg/L). This indicated that lead leachability was affected by the ferrous metal component during the TCLP. Other studies have also documented that iron impacts lead leachability during the TCLP. Kendall (2003) reported that adding iron metal shavings to brass foundry casting sand

Chapter 2 Factors Affecting Toxicity Characteristic Leaching Procedure Lead Leachability from Computer CPUs
CHAPTER 2 FACTORS AFFECTING TOXICITY CHARACTERISTIC LEACHING PROCEDURE LEAD LEACHABILITY FORM COMPUTER CPUS
2-9
significantly decreased lead leachability during the TCLP. This explains the prior observations that lead leachability from the “synthetic” CPU mixture was significantly lower than the results predicted from the 15.8-g PWB sample and the calculated weighted average TCLP concentration. Lead leachability was not greatly impacted by the addition of nonferrous metal. The lead concentration measured in the TCLP leachate was significantly higher (Student’s t-test, α=0.05 using Microsoft Excel) in the sample that contained PWB and plastic. Copper leachability was also decreased by the addition of ferrous metal. In addition, the final pH of the PWB/Ferrous metal samples did not differ greatly from the samples of PWB alone. However, the pH was higher in the samples that contained nonferrous metal and plastic.
Table 2-4. Component Impact TCLP Results
Sample Composition Lead
(mg/L)
Iron
(mg/L)
Copper
(mg/L)
Zinc
(mg/L) pH
Material Impact
50g PWB 83±5 6±4 0.3±0.02 1±2 4.74±0.01
50g PWB/50g Ferrous 3±2 21±9 <0.05 110±3 4.78±0.01
50g PWB /50g
Nonferrous 69±8 10±7 <0.05 0.2±0.3 5.10±0.07
50g PWB/50g Plastic 113±6 8±7 1±0.4 0.3±0.1 5.01±0.01
Ferrous Impact
0% Ferrous 44±5 5±9 2±0.2 1±2 4.87±0.02
20% Ferrous 7±2 69±7 BDL 57±4 4.97±0.002
40% Ferrous 2±1 40±9 0.1±0.01 101±10 4.99±0.02
68.2% Ferrous 0.3±0.
2 19±9 BDL 136±24 5.16±0.01
A further investigation of ferrous metal impact on lead leachability during the TCLP was conducted. The results of this investigation are also presented in Table 2-4. The results showed that as the fraction of ferrous metal in the “synthetic” CPU mixture decreased the lead concentration in the TCLP leachate increased. The lead concentrations in these samples ranged from 0.3 mg/L in the standard “synthetic” CPU mixture (68.2% ferrous metal) to 44 mg/L in the zero ferrous “synthetic” CPU mixture (0% ferrous). The pH was observed to slightly increase while the DO and ORP decreased with an increase in the fraction of ferrous metal in the sample. This indicated that there was some relationship between the redox potential of the solution and

Chapter 2 Factors Affecting Toxicity Characteristic Leaching Procedure Lead Leachability from Computer CPUs
CHAPTER 2 FACTORS AFFECTING TOXICITY CHARACTERISTIC LEACHING PROCEDURE LEAD LEACHABILITY FORM COMPUTER CPUS
2-10
lead and iron leachability during the TCLP.
2.3.5 Effects of Particle Size
Particle size can affect the amount of metals that leach from a waste. As particle size decreases, the surface area of the sample increases, the time to reach equilibrium is shortened, and lead results typically increase in time limited tests such as the TCLP . This was observed for CRT glass (Musson et al. 2000). Two sample sizes (<0.95 cm and <0.20 cm) of the “synthetic” CPU mixture were tested to evaluate the impact of particle size on lead leachability from CPUs. No significant difference (Student’s t-test, α=0.05 using Microsoft Excel) was observed in the TCLP lead and zinc concentrations among the particle sizes used to test the “synthetic” CPU mixture. Iron concentrations, however, were significantly greater in the smaller sample.
The heterogeneity of a device such as a computer CPU often makes obtaining a representative sample difficult. Size reducing the device helps to increase the surface area for leaching, homogenize the material, and obtain a representative sample. Size reduction had little impact, however, on the surface area of the lead in computer CPUs since the lead typically only exists in small amounts as tin/lead solder used on the surface of the PWBs. Size reduction of the sample did increase the surface area of the ferrous metal component and, as a result, higher iron concentrations were measured in the small (<0.20 cm) sample. As seen in the component testing, the presence of iron in the sample affected lead leachability. Additionally, any increase in lead leachability in the smaller particle size sample may have been counteracted by the higher iron concentrations, resulting in a concentration nearly the same as the larger sample. The final pH, DO, and ORP of the leachate did not differ greatly between the two samples. Table 2-5 summarizes the results.
Table 2-5. TCLP Results of Synthetic Computer CPU Mixture (Average of 3 Samples)
Size
(cm) PH
Lead
(mg/L)
Iron
(mg/L)
Copper
(mg/L)
Zinc
(mg/L)
<0.95 5.16±0.01 0.3±0.2 19±9 BDL 136±24
<0.20 5.20±0.02 0.3±0.03 52±6 BDL 144±3
2.3.6 Impact of Head Space
Table 2-6 presents the results from an investigation of the impact of headspace above the leaching fluid on lead leachability. The headspace was measured as a ratio of the volume of air

Chapter 2 Factors Affecting Toxicity Characteristic Leaching Procedure Lead Leachability from Computer CPUs
CHAPTER 2 FACTORS AFFECTING TOXICITY CHARACTERISTIC LEACHING PROCEDURE LEAD LEACHABILITY FORM COMPUTER CPUS
2-11
to the volume of liquid in the extraction vessel (Va/Vl). Testing was performed using samples of the “synthetic” CPU mixture. In general, the pH, DO, and ORP increased as the headspace above the leaching fluid increased. The DO and ORP data are presented in Figure 2-3. The results showed that the leachability of lead and iron increased as the headspace in the leaching vessel increased. Copper was not detected (MDL=0.05 mg/L). Additionally, an increase in the percentage of Fe2+ within the total iron was observed as the headspace above the leaching fluid increased.
Table 2-6. Impact of Head Space Results (Average of 3 samples)
Va/Vl PH Lead
(mg/L)
Iron
(mg/L)
Copper
(mg/L)
Zinc
(mg/L)
0 5.05±0.01 0.6±0.03 7±0.2 BDL 112±5
0.17 5.16±0.01 0.3±0.2 19±9 BDL 136±24
0.5 5.37±0.01 0.9±0.2 200±15 BDL 138±8
1 5.36±0.03 2.5±0.7 217±39 BDL 134±11
Figure 2-3. Dissolved Oxygen and ORP Results from Head Space Impact Study
0.00
0.20
0.40
0.60
0.80
0.00 0.17 0.50 1.00Va/Vl
DO
(mg/
L)
-600
-400
-200
0
200
RM
V
DO ORP
2.3.7 Comparison of Filtered vs. Nonfiltered Samples
Lead, copper, and zinc have been reported to adsorb to hydrous ferric oxide (Kendall, 2003). Kendall reported that as solution pH increased, concentrations of lead, copper, and zinc decreased and sorption increased, lead being the most strongly adsorbed. Sorption to hydrous ferric oxide would cause the adsorbed lead, copper, and zinc to be filtered out during the filtration process thus resulting in lower concentrations being measured in the leachates of the
Chapter 2 Factors Affecting Toxicity Characteristic Leaching Procedure Lead Leachability from Computer CPUs
CHAPTER 2 FACTORS AFFECTING TOXICITY CHARACTERISTIC LEACHING PROCEDURE LEAD LEACHABILITY FORM COMPUTER CPUS
2-12
filtered samples. Samples of filtered and nonfiltered leachate were collected during TCLP tests of the “synthetic” CPU mixtures. An evaluation of the difference in lead, iron, copper, and zinc concentrations between the filtered and nonfiltered samples was conducted to determine if these metals were filtered out during the filtration process.
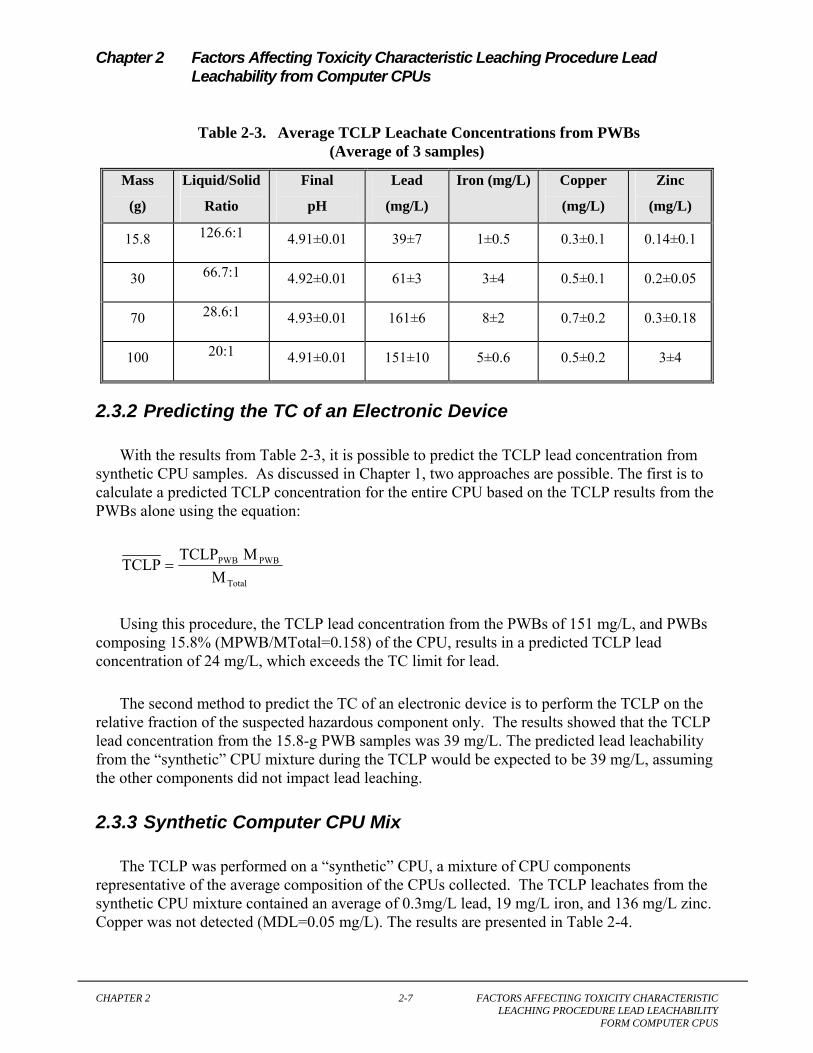
Overall, iron and zinc concentrations differed little between all filtered and nonfiltered samples. However, during the headspace studies, when the headspace above the leaching fluid exceeded a headspace ratio (Va/Vl) of 0.5, the lead concentrations in the nonfiltered samples were significantly higher than filtered samples (Student’s t-test, α=0.5 using Microsoft Excel), as presented in Figure 2-4. Although copper was not detected in the filtered samples, the copper concentrations in the nonfiltered samples increased from 2.5 mg/L in the Va/Vl=0 to 4.3 mg/L in the Va/Vl=1 sample.
Figure 2-4. Lead Results from Head Space Impact Study
0.01
0.10
1.00
10.00
100.00
0 0.16 0.5 1Va/Vl
Pb C
once
ntra
tion
(mg/
L)
FilteredNonfiltered
2.4 DISCUSSION
2.4.1 TCLP of PWBs vs. Whole CPUs
Results of this study indicated that lead leachability from computer CPUs depended on several factors: mass of PWB in the sample, composition of the CPU, and the headspace above the leaching fluid in the extraction vessel. Lead leachability from PWBs during the TCLP was generally in the range of 100 mg/L to 200 mg/L and decreased as the percentage of PWB in the sample decreased. This indicates that CPUs that contain a high fraction of PWB by weight tend to leach more lead.
Chapter 2 Factors Affecting Toxicity Characteristic Leaching Procedure Lead Leachability from Computer CPUs
CHAPTER 2 FACTORS AFFECTING TOXICITY CHARACTERISTIC LEACHING PROCEDURE LEAD LEACHABILITY FORM COMPUTER CPUS
2-13
However, the mass of PWB in the CPU was not the only factor that affected lead leachability during the TCLP. The components of the CPU impact the lead concentration in the leachate during the TCLP. For example, the TCLP lead concentration from the “synthetic” CPU mixture was 0.3 mg/L. However, tests performed on PWBs solely had predicted results of 39 mg/L and 24 mg/L. This comparison demonstrated that the composition of the CPU did indeed impact the lead leachability from the computer CPU.
2.4.2 Impact of CPU Components (Ferrous Metal)
Because CPUs consist of several components (PWBs, ferrous metals, nonferrous metals, plastics, and wires/cables), it was important to determine how each component impacted lead leachability during the TCLP. Results indicated that the ferrous metal component of the CPU significantly decreased lead leachability. Other studies have documented that iron impacts lead leachability during the TCLP. Kendall found that adding iron or zinc metal shavings to brass foundry casting sand significantly decreased lead leachability during the TCLP (Kendall, 2003). Kendall explains that the iron metal caused the TCLP leaching fluid to become more reducing therefore decreasing lead leachability. In addition, lead and copper ions that are in solution will be reduced by the zinc and iron, which will cause the concentrations of lead and copper measured in the TCLP leachate to remain low if metallic zinc or iron is present (Kendall, 2003). Results of the material impact also indicated that plastic increased lead leachability from the PWBs. This is believed, however, to be a physical process rather than a chemical reaction since plastic is generally considered chemically inert with respect to lead leachability.
Further investigation of ferrous metal impact on lead leachability from CPUs indicated that the fraction of ferrous metal (i.e., steel) in the sample significantly impacted the lead concentration in the leachate. The galvanic series shows that the greater the difference in electrode potential the greater the potential for corrosion to occur (Snoeyink et al. 1980). Zinc, which has an electrode potential of +0.76 with respect to oxidation of the metal to the divalent ion, reduced the lead that was leached into solution. The source of zinc in the samples is from the thin layer of zinc applied to the steel during the galvanizing process. This caused lead to plate out onto the metallic zinc as zinc ions were released into solution. However, the minor amount of zinc present became depleted.
Iron has a greater electrode potential (+0.44 V) than lead (+0.126 V) with respect to oxidation of the metal to the divalent ions, but less than zinc. As the zinc was delpleted and iron dissolved from the steel, Fe2+ ions were released into solution and a negative charge was produced on the steel by the remaining electrons. The Pb2+ ions that leached into solution were attracted to the negatively charged steel, which resulted in lead plating out onto the steel.
Lead and copper leachability decreased as the fraction of ferrous metal in the sample increased. As the fraction of ferrous metal in the sample increased, pH increased and the DO and ORP of the TCLP leachates decreased. As iron was released into the leachate, DO and H+

Chapter 2 Factors Affecting Toxicity Characteristic Leaching Procedure Lead Leachability from Computer CPUs
CHAPTER 2 FACTORS AFFECTING TOXICITY CHARACTERISTIC LEACHING PROCEDURE LEAD LEACHABILITY FORM COMPUTER CPUS
2-14
were consumed as Fe2+ ions were released. This confirmed Kendall’s findings that the ferrous metal (i.e., steel) in the sample made TCLP leaching fluid more reducing. Furthermore, metallic iron and zinc reduced some of the lead and copper ions that were in solution, which also attributed to the lower concentrations being measured in the leachate as the fraction of ferrous metal increased.
Zinc leachability was observed to increase as the fraction of ferrous metal in the sample increased. Based on the electrode potentials, zinc (+0.76 V) can reduce iron (+0.44 V), lead (+0.126 V), and copper (-0.345 V) (Snoeyink et al. 1980). This explained why the iron concentration decreased from 69 mg/L in the 20% ferrous sample to 19 mg/L in the 68.2% ferrous sample. Increasing the amount of ferrous metal (i.e., steel) in the sample also increased the amount of zinc since the steel was coated with a thin layer of zinc for galvanic protection. It is believed the metallic zinc prevented the Fe2+ ions from leaching into solution, which resulted in a decrease in the iron concentrations measured in the leachate as the fraction of steel in the sample increased. This also confirmed Kendall’s findings that zinc was not reduced by iron and remained at high concentrations in the TCLP leachate (Kendall, 2003).
2.4.3 Impact of Extraction Vessel Headspace
The third factor that can impact lead leachability from computer CPUs during the TCLP is the headspace above the leaching fluid in the extraction vessel. The results indicated that as the headspace to liquid ratio (Va/Vl) increased, the pH, DO, and ORP generally tended to increase. The TCLP leaching fluid became more oxidizing as Va/Vl increased resulting in an increased leaching of lead and iron. An analysis of the samples showed that as Va/Vl increased the difference in the lead, iron, and copper concentrations between the filtered and nonfiltered samples increased. Zinc was not greatly impacted by a change in the headspace above the leaching fluid. This was expected since prior experiments indicated that all zinc was oxidized under most conditions.
Although more lead was being leached as Va/Vl increased, more of the lead was sorbed or precipitated as Va/Vl increased. Lead leachability has been reported to adsorb to hydrous ferric oxide (Kendall, 2003). Kendall reported that solution concentrations of lead, copper, and zinc decreased and that sorption increased as pH increased and that lead was the most strongly adsorbed. These results can be explained by the formation of hydrous ferric oxide. The TCLP solution, which is oxygenated, is believed to have caused the Fe2+ ions to further oxidize to Fe3+, which then formed ferric hydroxide. Through hydrolysis, the ferric hydroxide was then converted to hydrous ferric oxide. The pH values measured during the evaluation of the impact of headspace ranged from 5.05 to 5.36. This is below the pH at which zinc is expected to adsorb, explaining why zinc concentrations between filtered and nonfiltered samples were not impacted by the change in Va/Vl. It appears that the lead and copper adsorbed to the hydrous ferric oxide and were removed during the filtration process thus resulting in the difference in the lead and copper concentrations between the filtered and nonfiltered samples.

CHAPTER 3 EVALUATION OF A LARGE-SCALE MODIFIED TCLP FOR RCRA TOXICITY CHARACTERIZATION OF COMPUTER CPUS
3-1
3 Evaluation of a Large-Scale Modified TCLP for RCRA Toxicity Characterization of Computer CPUs
3.1 INTRODUCTION
As noted previously, the collection of a representative sample from heterogenous materials such as CPUs and other electronics is very difficult. Chapter 3 assesses an alternative methodology that would resolve some of the issues faced when conducting a TCLP on a device such as a CPU. A large-scale TCLP method was developed in which an entire electronic device, such as a CPU, is placed into a large extraction vessel and leached while maintaining the TCLP requirements for the liquid-to-solid ratio and the extraction fluid. Size reduction is not performed in this method; the CPU is simply disassembled and placed into the extraction vessel and rotated for 18 hours. Leaching the entire device eliminates any human bias that is introduced during sample processing and collection.
3.2 MATERIALS AND METHODS
3.2.1 Research Approach
In this method, CPUs were completely disassembled and leached using a methodology similar to the TCLP. The procedure was modified to allow the entire computer CPU to be tested. The large-scale extractor rotated at half the speed (13 rpm) of the standard TCLP rotary extractor. Therefore, a preliminary investigation was conducted to evaluate the impact of the rotation speed on lead leachability during the TCLP.
A series of experiments that evaluated the leachability of lead, iron, copper, and zinc as a function of time during both the standard TCLP and the large-scale TCLP methods was performed. The purpose of these experiments was to provide a set of data that would be used to evaluate the chemical properties of the leaching solution and metal concentrations measured in the leachate. This data would then be used to determine if the time requirement of the TCLP (18 hours) was sufficient to achieve chemical equilibrium in the large-scale method and if any physical or chemical differences existed between the standard TCLP method and the proposed large-scale TCLP method
Results of this study were used to assess the applicability of a large-scale TCLP for the hazardous waste determination of computer CPUs. Lead, iron, copper, and zinc results are presented. Although lead is the primary chemical of interest, the analysis of iron, copper, and zinc can be used to describe the processes that have been documented to impact lead leachability: reduction by metallic iron and sorption by hydrous ferric oxide (Kendall, 2003). An

Chapter 3 Evaluation of a Large-Scale Modified TCLP for RCRA Toxicity Characterization of Computer CPUs
CHAPTER 3 EVALUATION OF A LARGE-SCALE MODIFIED TCLP FOR RCRA TOXICITY CHARACTERIZATION OF COMPUTER CPUS
3-2
evaluation was conducted to determine the similarities (or lack thereof) between the results of the large-scale TCLP and standard TCLP methods.
3.2.2 Sample Collection and Processing
Computer CPUs were collected from a demanufacturing facility and a local household hazardous waste collection center. Forty-three personal computer CPUs were collected. Each CPU was completely disassembled and separated into five material categories as in Chapter 2: printed wire boards (PWBs), ferrous metals, nonferrous metals, plastics, and wires/cables. Each category was weighed to determine the CPU composition and total weight.
3.2.3 Large-Scale Leaching Procedure
The large-scale TCLP was performed by leaching an entire disassembled CPU using a large-scale version of the TCLP. A 55-gallon extraction vessel (high density polyethylene (HDPE) drum) was placed on a Morse 1-300 Series, Endover Drum Rotator (Morse Manufacturing). TCLP extraction fluid #1 was mixed in the extraction vessel by adding 114 mL of glacial acetic acid and 129 mL of 10 N sodium hydroxide solution diluted to 20 L. The amount of extraction fluid was dependent on the mass of the solid sample. The TCLP requires a liquid to solid ratio of 20:1. For example, a 10-kg CPU requires 200 L of extraction fluid. The maximum sample mass for the large-scale TCLP was 10 kg due to the volume required by the extraction fluid. CPUs weighing more than 10 kg required representative fractions of each material type for that particular CPU to be chosen at random to obtain a 10-kg sample. The CPUs were not size reduced but were disassembled. The extraction fluid was mixed by rotating the solution on the drum rotator. Initial measurements of the pH, ORP and DO were recorded. The initial pH of TCLP extraction fluid #1 was 4.93±0.05. Measurements of pH, ORP, and DO, were made using the same equipment as described in Chapter 2. A blank sample of the TCLP extraction fluid was collected for each leaching extraction.
The disassembled computer CPU was placed into the extraction fluid and rotated end-over-end at a speed of 13 rpm for 18 hours. After rotation, the samples were drained from the bottom of the extraction drum and the final pH, DO, and ORP of the leachates were recorded. As in the studies described in chapter 2, samples of nonfiltered and filtered leachate were collected. The TCLP leachates were filtered through a glass fiber filter (0.7 µm pore size) using pressure filtration and preserved by adding concentrated nitric acid until the pH of the filtrate was below 2. Analysis of lead, iron, zinc, and copper concentrations as well as ferrous ion analysis was performed on the filtered and nonfiltered leachate using the methods described in Chapter 2.
3.2.4 Impact of Extractor Speed
The TCLP requires that the rotary extractor rotate the samples at 30±2 rpm. However, the

Chapter 3 Evaluation of a Large-Scale Modified TCLP for RCRA Toxicity Characterization of Computer CPUs
CHAPTER 3 EVALUATION OF A LARGE-SCALE MODIFIED TCLP FOR RCRA TOXICITY CHARACTERIZATION OF COMPUTER CPUS
3-3
rotator used in the large-scale TCLP was only rated at 13 rpm. To evaluate the impact of the extractor speed on lead leachability during the TCLP three samples of “synthetic” CPU mixture were leached at 0, 13, and 28 rpm, respectively. The TCLP was performed by manually size reducing (i.e., hand cutting with shears) 100-g samples of the “synthetic” CPU mixture so they were capable of passing a 0.95-cm sieve (USEPA, 1996). The reader is referred to Chapter 2 for a description of the preparation of the “synthetic” CPU mixture. The samples were placed into a 2L extraction vessel. Two liters of TCLP extraction fluid #1 were added to each sample and the samples were placed on a rotary extractor (Analytical Testing Corporation). The samples were performed in triplicate and a TCLP blank was included for each set of leaching extractions. The TCLP leachates were filtered through a glass fiber filter of 0.7 µm pore size using the pressure filtration procedure and preserved by adding concentrated nitric acid until the pH of the filtrate was below 2. In addition to collecting the filtered leachate, samples of nonfiltered leachates were also collected. The samples were then placed in HDPE bottles and stored until acid digestion.
3.2.5 Time Studies
A series of time studies were conducted to investigate lead leachability from computer CPUs as a function of time using the large-scale TCLP method. Three CPUs (2 different models) were tested in this series of time studies. Throughout the period of the time study (approximately 90 hours), 2 L of the leachate were collected approximately every 9 hours for metals analysis. Fresh extraction fluid was not added to the sample to maintain the 20:1 liquid-to-solid ratio, thus the liquid-to-solid ratio of the sample gradually decreased over the period of the experiment.
3.2.6 Methodology Comparison
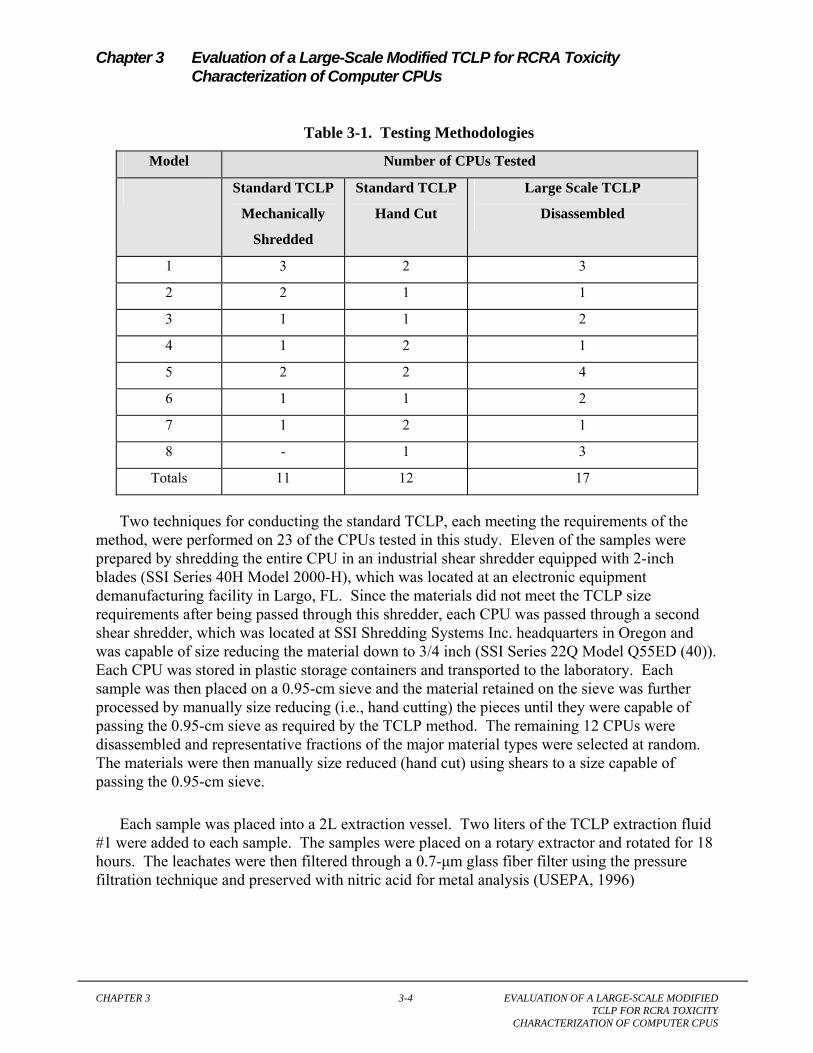
Forty CPUs were tested to compare the results between the TCLP and the large-scale TCLP. The CPUs were comprised of eight model types. Three testing methodologies were performed on each CPU model: large-scale TCLP on disassembled CPUs, standard TCLP on mechanically shredded CPUs, and standard TCLP on manually size-reduced (i.e., hand cut) samples of selected CPU components. Table 3-1 summarizes the testing methodologies. The large-scale TCLP was performed, as described in Section 3.2.3, on 17 of the CPUs.
Chapter 3 Evaluation of a Large-Scale Modified TCLP for RCRA Toxicity Characterization of Computer CPUs
CHAPTER 3 EVALUATION OF A LARGE-SCALE MODIFIED TCLP FOR RCRA TOXICITY CHARACTERIZATION OF COMPUTER CPUS
3-4
Table 3-1. Testing Methodologies
Model Number of CPUs Tested
Standard TCLP
Mechanically
Shredded
Standard TCLP
Hand Cut
Large Scale TCLP
Disassembled
1 3 2 3
2 2 1 1
3 1 1 2
4 1 2 1
5 2 2 4
6 1 1 2
7 1 2 1
8 - 1 3
Totals 11 12 17
Two techniques for conducting the standard TCLP, each meeting the requirements of the method, were performed on 23 of the CPUs tested in this study. Eleven of the samples were prepared by shredding the entire CPU in an industrial shear shredder equipped with 2-inch blades (SSI Series 40H Model 2000-H), which was located at an electronic equipment demanufacturing facility in Largo, FL. Since the materials did not meet the TCLP size requirements after being passed through this shredder, each CPU was passed through a second shear shredder, which was located at SSI Shredding Systems Inc. headquarters in Oregon and was capable of size reducing the material down to 3/4 inch (SSI Series 22Q Model Q55ED (40)). Each CPU was stored in plastic storage containers and transported to the laboratory. Each sample was then placed on a 0.95-cm sieve and the material retained on the sieve was further processed by manually size reducing (i.e., hand cutting) the pieces until they were capable of passing the 0.95-cm sieve as required by the TCLP method. The remaining 12 CPUs were disassembled and representative fractions of the major material types were selected at random. The materials were then manually size reduced (hand cut) using shears to a size capable of passing the 0.95-cm sieve.
Each sample was placed into a 2L extraction vessel. Two liters of the TCLP extraction fluid #1 were added to each sample. The samples were placed on a rotary extractor and rotated for 18 hours. The leachates were then filtered through a 0.7-µm glass fiber filter using the pressure filtration technique and preserved with nitric acid for metal analysis (USEPA, 1996)
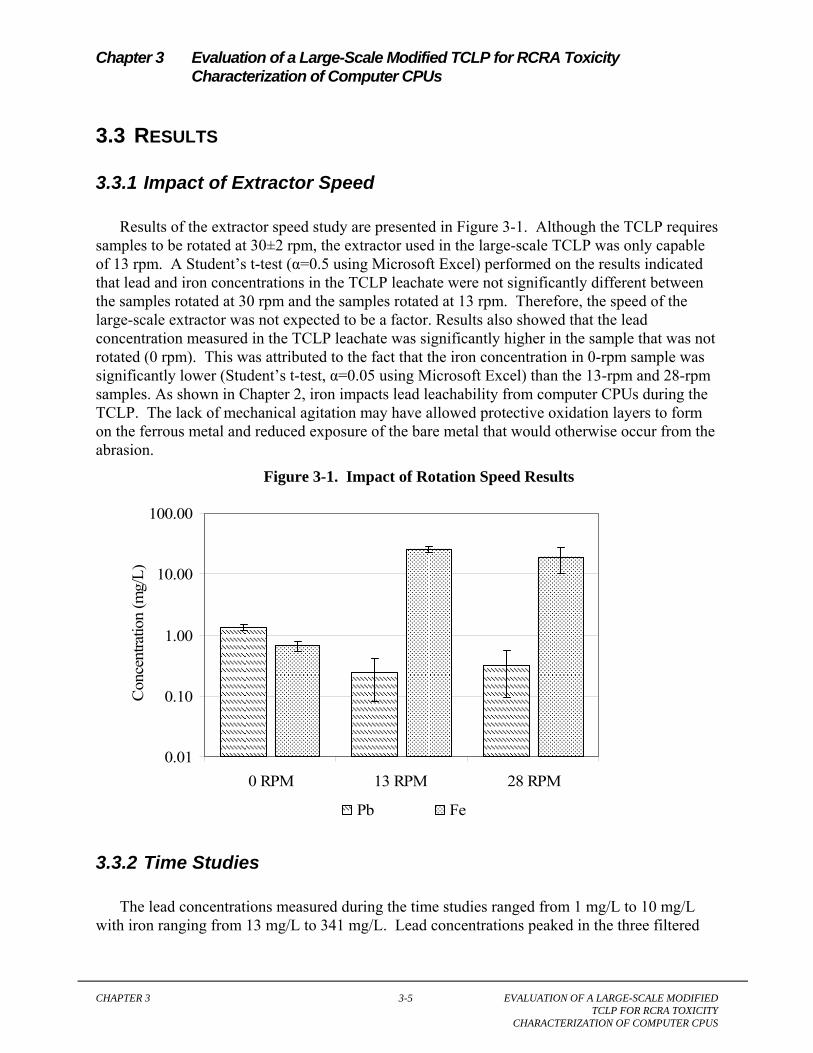
Chapter 3 Evaluation of a Large-Scale Modified TCLP for RCRA Toxicity Characterization of Computer CPUs
CHAPTER 3 EVALUATION OF A LARGE-SCALE MODIFIED TCLP FOR RCRA TOXICITY CHARACTERIZATION OF COMPUTER CPUS
3-5
3.3 RESULTS
3.3.1 Impact of Extractor Speed
Results of the extractor speed study are presented in Figure 3-1. Although the TCLP requires samples to be rotated at 30±2 rpm, the extractor used in the large-scale TCLP was only capable of 13 rpm. A Student’s t-test (α=0.5 using Microsoft Excel) performed on the results indicated that lead and iron concentrations in the TCLP leachate were not significantly different between the samples rotated at 30 rpm and the samples rotated at 13 rpm. Therefore, the speed of the large-scale extractor was not expected to be a factor. Results also showed that the lead concentration measured in the TCLP leachate was significantly higher in the sample that was not rotated (0 rpm). This was attributed to the fact that the iron concentration in 0-rpm sample was significantly lower (Student’s t-test, α=0.05 using Microsoft Excel) than the 13-rpm and 28-rpm samples. As shown in Chapter 2, iron impacts lead leachability from computer CPUs during the TCLP. The lack of mechanical agitation may have allowed protective oxidation layers to form on the ferrous metal and reduced exposure of the bare metal that would otherwise occur from the abrasion.
Figure 3-1. Impact of Rotation Speed Results
0.01
0.10
1.00
10.00
100.00
0 RPM 13 RPM 28 RPM
Con
cent
ratio
n (m
g/L)
Pb Fe
3.3.2 Time Studies
The lead concentrations measured during the time studies ranged from 1 mg/L to 10 mg/L with iron ranging from 13 mg/L to 341 mg/L. Lead concentrations peaked in the three filtered
Chapter 3 Evaluation of a Large-Scale Modified TCLP for RCRA Toxicity Characterization of Computer CPUs
CHAPTER 3 EVALUATION OF A LARGE-SCALE MODIFIED TCLP FOR RCRA TOXICITY CHARACTERIZATION OF COMPUTER CPUS
3-6
leachate samples from 6 mg/L to 10 mg/L at 18 hours to 27 hours. After 27 hours, the lead concentration decreased below the 5 mg/L TC limit. The lead concentration increased again after 80 hours of rotation. Iron concentrations in the filtered leachates increased with time and peaked between 45 hours and 60 hours at concentrations ranging from 292 mg/L to 341 mg/L. After approximately 60 hours, the iron concentrations in all three filtered samples decreased with time. The lead and iron results of the large-scale TCLP time study samples are presented in Figure 3-2. This figure provides a comparison of the filtered and nonfiltered results.
The TCLP leachate of all of the samples was visually observed to change from a gray color initially to an orange (rust) color as time progressed, which indicated that the iron was being oxidized. The copper concentrations measured in the leachate of all of the filtered samples generally were not detected (MDL=0.1 mg/L). The zinc concentration measured in the filtered and nonfiltered leachate of the large-scale TCLP time study samples varied between 114mg/L and 181 mg/L and did not change greatly with time.
The pH of the TCLP leachate of the large-scale samples ranged from 5.01 to 5.47 with the highest values of each of the three samples (5.47, 5.42, and 5.44) occurring between 45 hours and 60 hours. After 60 hours, the pH decreased with time to values ranging from 5.22 to 5.30 at approximately 90 hours. The ORP of the leaching solution tended to fluctuate throughout the time of the study and peaked between 9 hours and 27 hours. Results of these samples indicated that the TCLP leaching fluid in the large-scale TCLP remained oxidizing during the duration of the experiment.

Chapter 3 Evaluation of a Large-Scale Modified TCLP for RCRA Toxicity Characterization of Computer CPUs
CHAPTER 3 EVALUATION OF A LARGE-SCALE MODIFIED TCLP FOR RCRA TOXICITY CHARACTERIZATION OF COMPUTER CPUS
3-7
Figure 3-2. Comparison of Metals Results from TCLP Time Study Experiments
A
Hours
0 20 40 60 80 100
Con
cent
ratio
n (m
g/L)
0.1
1
10
100
1000
10000 B
Hours
0 20 40 60 80 100
Con
cent
ratio
n (m
g/L)
0.1
1
10
100
1000
10000
C
Hours
0 20 40 60 80 100
Con
cent
ratio
n (m
g/L)
0.1
1
10
100
1000
10000
Pb Concentration Filtered SamplesPb Concentration Nonfiltered SamplesFe Concentration Filtered SamplesFe Concentration Nonfiltered Samples
A) Sample 1. B) Sample 2. C) Sample 3.
Results presented in Figure 3-2 indicate lead leachability was limited by an oxidation-
Pb Pb
Pb
Fe Fe
Fe
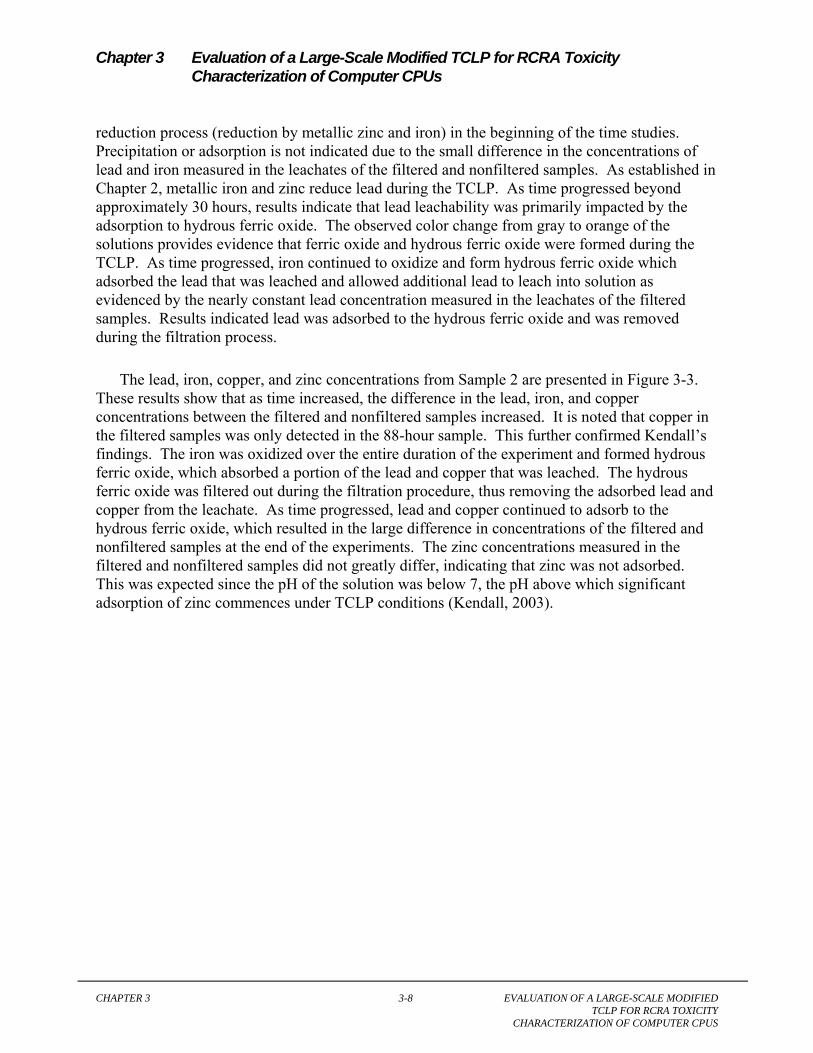
Chapter 3 Evaluation of a Large-Scale Modified TCLP for RCRA Toxicity Characterization of Computer CPUs
CHAPTER 3 EVALUATION OF A LARGE-SCALE MODIFIED TCLP FOR RCRA TOXICITY CHARACTERIZATION OF COMPUTER CPUS
3-8
reduction process (reduction by metallic zinc and iron) in the beginning of the time studies. Precipitation or adsorption is not indicated due to the small difference in the concentrations of lead and iron measured in the leachates of the filtered and nonfiltered samples. As established in Chapter 2, metallic iron and zinc reduce lead during the TCLP. As time progressed beyond approximately 30 hours, results indicate that lead leachability was primarily impacted by the adsorption to hydrous ferric oxide. The observed color change from gray to orange of the solutions provides evidence that ferric oxide and hydrous ferric oxide were formed during the TCLP. As time progressed, iron continued to oxidize and form hydrous ferric oxide which adsorbed the lead that was leached and allowed additional lead to leach into solution as evidenced by the nearly constant lead concentration measured in the leachates of the filtered samples. Results indicated lead was adsorbed to the hydrous ferric oxide and was removed during the filtration process.
The lead, iron, copper, and zinc concentrations from Sample 2 are presented in Figure 3-3. These results show that as time increased, the difference in the lead, iron, and copper concentrations between the filtered and nonfiltered samples increased. It is noted that copper in the filtered samples was only detected in the 88-hour sample. This further confirmed Kendall’s findings. The iron was oxidized over the entire duration of the experiment and formed hydrous ferric oxide, which absorbed a portion of the lead and copper that was leached. The hydrous ferric oxide was filtered out during the filtration procedure, thus removing the adsorbed lead and copper from the leachate. As time progressed, lead and copper continued to adsorb to the hydrous ferric oxide, which resulted in the large difference in concentrations of the filtered and nonfiltered samples at the end of the experiments. The zinc concentrations measured in the filtered and nonfiltered samples did not greatly differ, indicating that zinc was not adsorbed. This was expected since the pH of the solution was below 7, the pH above which significant adsorption of zinc commences under TCLP conditions (Kendall, 2003).
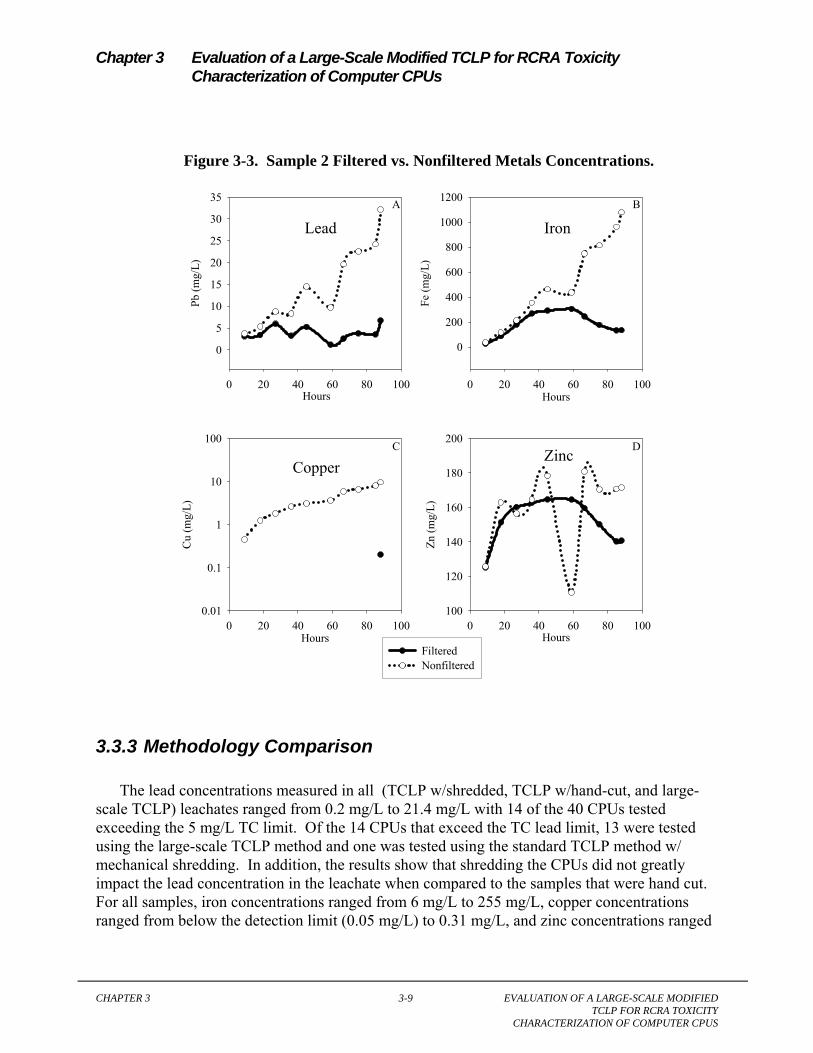
Chapter 3 Evaluation of a Large-Scale Modified TCLP for RCRA Toxicity Characterization of Computer CPUs
CHAPTER 3 EVALUATION OF A LARGE-SCALE MODIFIED TCLP FOR RCRA TOXICITY CHARACTERIZATION OF COMPUTER CPUS
3-9
Figure 3-3. Sample 2 Filtered vs. Nonfiltered Metals Concentrations.
A
Hours0 20 40 60 80 100
Pb (m
g/L)
0
5
10
15
20
25
30
35 B
Hours0 20 40 60 80 100
Fe (m
g/L)
0
200
400
600
800
1000
1200
C
Hours0 20 40 60 80 100
Cu
(mg/
L)
0.01
0.1
1
10
100
FilteredNonfiltered
D
Hours0 20 40 60 80 100
Zn (m
g/L)
100
120
140
160
180
200
3.3.3 Methodology Comparison
The lead concentrations measured in all (TCLP w/shredded, TCLP w/hand-cut, and large-scale TCLP) leachates ranged from 0.2 mg/L to 21.4 mg/L with 14 of the 40 CPUs tested exceeding the 5 mg/L TC limit. Of the 14 CPUs that exceed the TC lead limit, 13 were tested using the large-scale TCLP method and one was tested using the standard TCLP method w/ mechanical shredding. In addition, the results show that shredding the CPUs did not greatly impact the lead concentration in the leachate when compared to the samples that were hand cut. For all samples, iron concentrations ranged from 6 mg/L to 255 mg/L, copper concentrations ranged from below the detection limit (0.05 mg/L) to 0.31 mg/L, and zinc concentrations ranged
Lead Iron
CopperZinc
Chapter 3 Evaluation of a Large-Scale Modified TCLP for RCRA Toxicity Characterization of Computer CPUs
CHAPTER 3 EVALUATION OF A LARGE-SCALE MODIFIED TCLP FOR RCRA TOXICITY CHARACTERIZATION OF COMPUTER CPUS
3-10
from 27 mg/L to 156 mg/L. Ferrous ion analysis was limited to 32 of the 40 filtered samples and 15 unfiltered samples. Based on the ferrous iron (Fe2+) analysis, the iron that was measured in the leachate ranged from 2% Fe2+ to 100% Fe2+ and on a majority of the samples was greater than 50% Fe2+. Results of the TCLP methodology comparison are presented in Table 3-2.
The pH measurements of the leachate from the standard TCLP ranged from 4.99 to 5.26 and from 5.03 to 5.32 in the large-scale TCLP. The ORP and DO measurements indicated that the large-scale TCLP produced a more oxidizing environment than the standard TCLP method. The ORP measurements of the leachate from the standard TCLP ranged from 20.3 to -387 RMV and the DO from 0.14 mg/L to 1.22 mg/L. The ORP measurements from the large-scale TCLP ranged from 170 RMV to -84 RMV and the DO from 2.95 mg/L to 4.92 mg/L. The ORP measurements from the large-scale TCLP were positive in a majority of occasions.
The lead, iron, and zinc data from CPU #1 are presented in Figure 3-4. These figures represent a typical example of the data from the TCLP methodology comparison. The lead concentrations measured in the leachate of samples that were leached using the large-scale TCLP method were higher than those leached using the standard TCLP method. The iron and zinc concentrations measured in the leachate from the large-scale TCLP were equal to or greater than the standard TCLP methods in a majority of occasions. Copper was not detected (MDL=0.05) in any of the filtered samples for CPU #1. The zinc concentrations varied among all of the samples that were tested and was not impacted by the testing methodology.
The pH, ORP, and DO data from CPU #1 are presented in Figure 3-5. The pH measured in the leachates from CPU #1 ranged from 5.04 to 5.19 and did not greatly differ between the testing methods. However, DO and ORP were impacted by the testing methodology. The DO measurements for CPU #1 from the large-scale TCLP ranged from 2.95 mg/L to 3.85 mg/L, while the DO from the standard TCLP tests ranged from 0.18 mg/L to 0.67 mg/L. The ORP ranged from 14.5 RMV to 124.1 RMV in the large-scale TCLP and from -90 RMV to -310 RMV in the standard TCLP tests. These results indicated that the leaching solution in the large-scale TCLP test was more oxidizing than the leachate of the standard TCLP.

Chapter 3 Evaluation of a Large-Scale Modified TCLP for RCRA Toxicity Characterization of Computer CPUs
CHAPTER 3 EVALUATION OF A LARGE-SCALE MODIFIED TCLP FOR RCRA TOXICITY CHARACTERIZATION OF COMPUTER CPUS
3-11
Table 3-2. Methodology Comparison Results (Filtered)
CPU Model Processing/ TCLP MethodLead
(mg/L)
Iron
(mg/L)
Copper
(mg/L)
Zinc
(mg/L)
1 1 Shredded/ Standard 1.4 92 BDL 112 2 1 Shredded/ Standard 6.0 38 BDL 107 3 1 Shredded/ Standard 1.00 86 BDL 103 4 1 Disassembled/ Large 9.0 104 BDL 143 5 1 Disassembled/ Large 9.0 94 BDL 153 6 1 Disassembled/ Large 8.0 93 BDL 156 7 1 Manual/ Standard 0.5 50 BDL 105 8 1 Manual/ Standard 0.4 11 BDL 118 9 2 Shredded/ Standard 1.1 106 BDL 84
10 2 Shredded/ Standard 0.9 85 BDL 122 11 2 Disassembled/ Large 5.5 255 BDL 128 12 2 Manual/ Standard 0.3 18 BDL 147 13 3 Shredded/ Standard 3.2 84 BDL 128 14 3 Disassembled/ Large 21.4 117 0.05 81 15 3 Disassembled/ Large 16.4 132 0.2 92 16 3 Manual/ Standard 2.3 20 BDL 147 17 4 Shredded/ Standard 1.0 119 BDL 99 18 4 Disassembled/ Large 9.5 127 BDL 103 19 4 Manual/ Standard 0.4 24 BDL 130 20 4 Manual/ Standard 0.5 31 BDL 122 21 5 Shredded/ Standard 3.6 96 BDL 43 22 5 Shredded/ Standard 1.5 136 BDL 52 23 5 Disassembled/ Large 5.3 65 BDL 21 24 5 Disassembled/ Large 3.1 24 0.06 33 25 5 Disassembled/ Large 15.5 131 0.08 27 26 5 Disassembled/ Large 4.0 62 0.05 34 27 5 Manual/ Standard 0.3 5 BDL 172 28 5 Manual/ Standard 3.1 59 0.06 115 29 6 Shredded/ Standard 1.3 111 BDL 111 30 6 Disassembled/ Large 0.6 44 BDL 99 31 6 Disassembled/ Large 0.5 50 BDL 101 32 6 Manual/ Standard 0.3 35 BDL 106 33 7 Shredded/ Standard 0.5 147 BDL 111 34 7 Disassembled/ Large 9.1 189 0.07 114 35 7 Manual/ Standard 0.2 6 BDL 168 36 7 Manual/ Standard 0.1 19 0.32 129 37 8 Disassembled/ Large 8.4 201 0.08 215 38 8 Disassembled/ Large 7.1 253 0.13 160
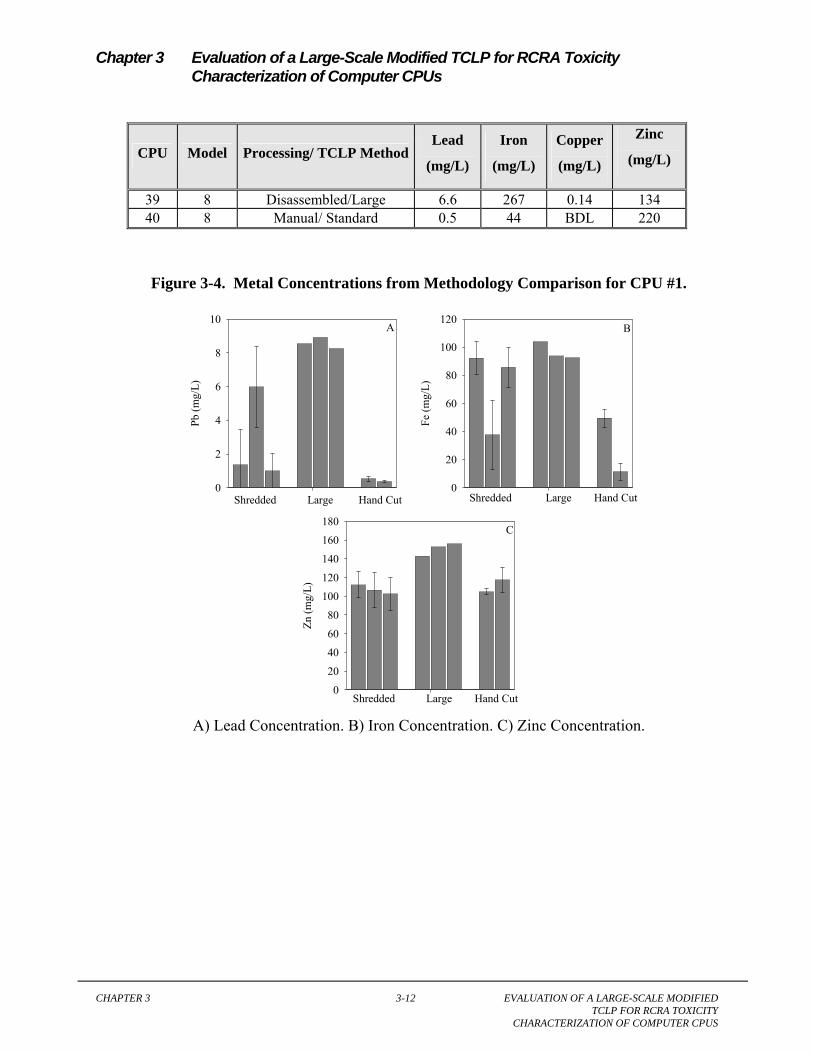
Chapter 3 Evaluation of a Large-Scale Modified TCLP for RCRA Toxicity Characterization of Computer CPUs
CHAPTER 3 EVALUATION OF A LARGE-SCALE MODIFIED TCLP FOR RCRA TOXICITY CHARACTERIZATION OF COMPUTER CPUS
3-12
CPU Model Processing/ TCLP MethodLead
(mg/L)
Iron
(mg/L)
Copper
(mg/L)
Zinc
(mg/L)
39 8 Disassembled/Large 6.6 267 0.14 134 40 8 Manual/ Standard 0.5 44 BDL 220
Figure 3-4. Metal Concentrations from Methodology Comparison for CPU #1.
A
Shredded Large Hand Cut
Pb (m
g/L)
0
2
4
6
8
10B
Shredded Large Hand Cut
Fe (m
g/L)
0
20
40
60
80
100
120
C
Shredded Large Hand Cut
Zn (m
g/L)
0
20
40
60
80
100
120
140
160
180
A) Lead Concentration. B) Iron Concentration. C) Zinc Concentration.

Chapter 3 Evaluation of a Large-Scale Modified TCLP for RCRA Toxicity Characterization of Computer CPUs
CHAPTER 3 EVALUATION OF A LARGE-SCALE MODIFIED TCLP FOR RCRA TOXICITY CHARACTERIZATION OF COMPUTER CPUS
3-13
Figure 3-5. Laboratory Measurements from Methodology Comparison for CPU #1.
A
Shredded Large Hand Cut
pH
5.00
5.05
5.10
5.15
5.20B
Shredded Large Hand Cut
OR
P (R
MV
)
-300
-200
-100
0
100
C
Shredded Large Hand Cut
DO
(mg/
L)
0
1
2
3
4
A) Final pH. B) Final ORP. C) Final DO.
Previous work (Chapter 2) evaluating the factors that affect lead leachability from computer CPUs during the TCLP showed that the headspace above the leaching fluid can impact lead leachability from computer CPUs. Results from that study showed that as the head space-to-liquid ratio (Va/Vl) increased, the pH, DO, and ORP increased, thus indicating that the TCLP leaching fluid became more oxidizing as Va/Vl increased. The leachability of lead and iron increased as the environment of the leaching fluid became more oxidizing. However, the Va/Vl ratio in the large-scale TCLP method was not greatly different from the standard Va/Vl ratio of 0.16. For example, the mass of CPU #1 was 8,418 g, which resulted in 168.4 L of the TCLP leaching fluid being used in the extraction based on a 20:1 liquid-to-solid ratio. The Va/Vl ratio of the large-scale TCLP method was then estimated assuming the total volume of the extraction drum to be 55 gallons (208 L) and the volume taken up by the CPU itself to be 1.85 L. This resulted in a Va/Vl ratio of approximately 0.22.
In the TCLP methodology, the CPU components are size reduced so that they are capable of passing through a 0.95-cm sieve, while the components of the large-scale modified TCLP are not size reduced. Size reduction of the components greatly increased the surface area of the iron that was exposed to the leaching solution, which would otherwise have been galvanically protected
Chapter 3 Evaluation of a Large-Scale Modified TCLP for RCRA Toxicity Characterization of Computer CPUs
CHAPTER 3 EVALUATION OF A LARGE-SCALE MODIFIED TCLP FOR RCRA TOXICITY CHARACTERIZATION OF COMPUTER CPUS
3-14
by the zinc coating. Exposing the raw iron to the leaching solution allowed it to dissolve more readily than the non-size reduced components. In this study, metallic iron appears to have caused the leachate of the TCLP to become more reducing. This was evident by the negative ORP measurements and the relatively low DO concentrations in the samples that were tested using the TCLP. The leachates of the large-scale modified TCLP, however, were more oxidizing than the standard TCLP as evidenced by the positive ORP measurements and relatively high DO concentrations. This may be attributed to the fact that the components were not size reduced, which limited the amount of exposed iron. An evaluation of the impact of size reduction on lead and iron leachability during the large-scale modified TCLP would be beneficial.
Analysis of the nonfiltered samples indicated that the lead, iron, and zinc concentrations did not greatly differ, on the majority of occasions, from the concentration measured in the filtered samples during both TCLP methods evaluated in this study. Copper, on the other hand, tended to be present only in the nonfiltered samples. This indicated that although the large-scale modified TCLP produced a more oxidizing environment, lead leachability appears to not have been impacted by adsorption by hydrous ferric oxide. This was expected since the time study results indicated that adsorption by hydrous ferric oxide did not occur until after 30 hours of rotation.
3.4 DISCUSSION
A large-scale TCLP approach was examined because of the inherent difficulties in performing the TCLP on manufactured articles such as electronic devices. A major difficulty is obtaining a representative size-reduced sample. Size reduction of electronic devices can be difficult because of the bulky nature of the components. For example, computer CPUs are composed of a high percentage of steel and other metals that are difficult to cut. The use of industrial shredders for processing electronic devices is not practical because they often lead to sample loss and cross contamination in addition to not meeting the size requirements. Manual size reduction (i.e., hand cutting) using small-scale laboratory equipment is the only reasonable option but is very time consuming. It is often left to the technician performing the test to select the components and process them for testing, which can introduce human bias into the results.
The large-scale approach offers several advantages. It permits an entire electronic device to be tested, eliminating human bias introduced when collecting the sample and processing it. Obtaining a 100-g representative sample (as required by the TCLP) that contains representative fractions of the components is not easily accomplished. The lack of size reduction also offers the advantage of time efficiency. The test was designed to meet the intent of the TCLP in terms of measuring the maximum equilibrium concentration occurring with the TCLP fluid at a 20:1 liquid to solid ratio. It was originally hypothesized that the modified procedure would result in an underestimation of lead leaching because of the larger particle sizes. The lead was at greater concentrations than expected because of the factors described earlier. It is noted that the large-scale method requires the use of special equipment (a drum rotator) and requires more chemicals.

LEACHING RESULTS FOR VARIOUS ELECTRONIC DEVICES
4-1
4 Leaching Results for Various Electronic Devices
4.1 OVERVIEW OF TESTING PERFORMED
This chapter presents data for the testing of several common electronic devices. In the preceding chapters, two leaching methods were explored: The standard TCLP and a large-scale TCLP. A third method, the modified small scale method, was also employed in this chapter where small electronic devices were disassembled and placed in their entirety (not size reduced) into the 2-L extraction vessels. With the exception of size reduction, all other parameters of the TCLP remained the same. This third method was used to measure lead leachate levels in computer mice and remote controls. A total of 12 devices were leached in some fashion. Table 4-1 shows the type and number of each device tested and the test performed on those devices.
Table 4-1. Electronic Devices Tested
Device
Standard TCLP (True)
Large-Scale TCLP
(L)
Modified Small-Scale TCLP (MS)
Personal Computer CPUs 23 41
Computer Monitors 9
Laptop Computers 6 9
Printers 9
Color Televisions 6
VCRs 8
Cellular Phones 38 14
Key Boards 3 1
Computer Mice 15
Remote Controls 4 6
Smoke Detectors 9
Flat Panel Monitors 8
The results are presented in separate sections and include the average composition of the materials tested and the TCLP concentrations for several predominant elements. Mercury was analyzed in the laptops since their composition includes a fluorescent light. Of all RCRA regulated metals, only lead was found to have exceeded the TC levels at any time, as demonstrated in Table A-1 of the Appendix for CPUs. Therefore each section presents the leachate levels for lead and for the components presented earlier that affected lead leachability from electronic devices: zinc, iron, and copper. In each of the following tables, the method of testing used for each sample is indicated as “True” (standard TCLP), “L” (large-scale TCLP), or
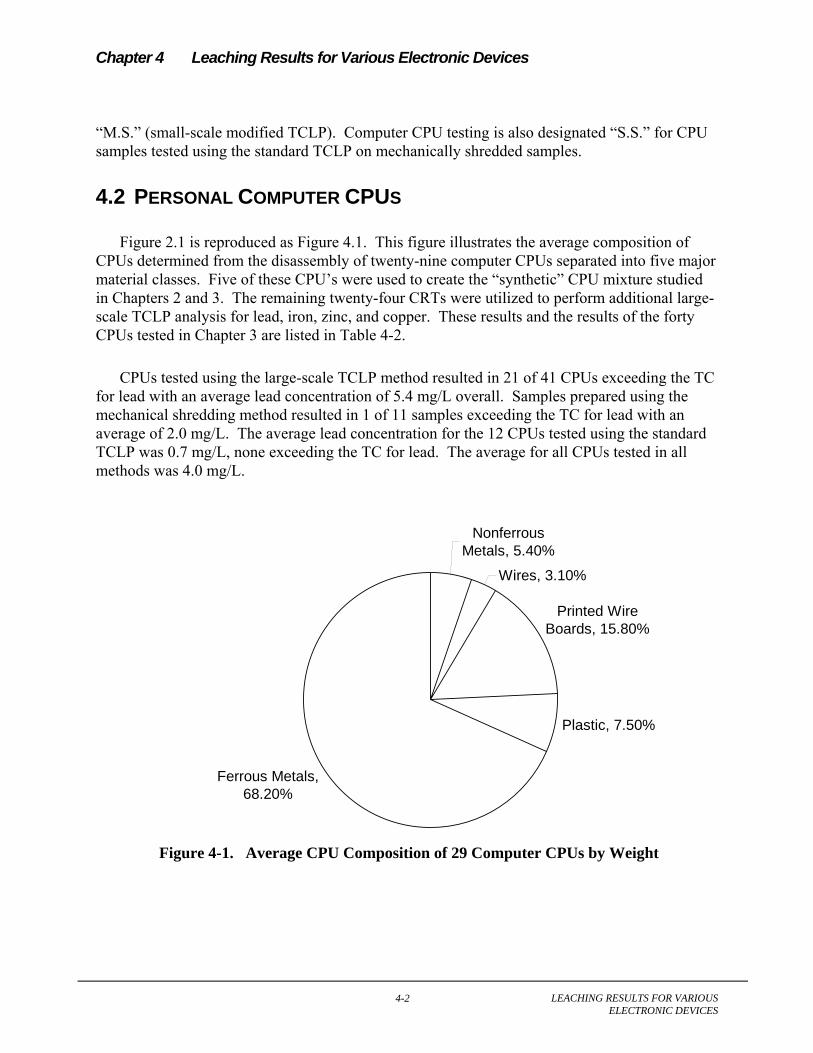
Chapter 4 Leaching Results for Various Electronic Devices
LEACHING RESULTS FOR VARIOUS ELECTRONIC DEVICES
4-2
“M.S.” (small-scale modified TCLP). Computer CPU testing is also designated “S.S.” for CPU samples tested using the standard TCLP on mechanically shredded samples.
4.2 PERSONAL COMPUTER CPUS
Figure 2.1 is reproduced as Figure 4.1. This figure illustrates the average composition of CPUs determined from the disassembly of twenty-nine computer CPUs separated into five major material classes. Five of these CPU’s were used to create the “synthetic” CPU mixture studied in Chapters 2 and 3. The remaining twenty-four CRTs were utilized to perform additional large-scale TCLP analysis for lead, iron, zinc, and copper. These results and the results of the forty CPUs tested in Chapter 3 are listed in Table 4-2.
CPUs tested using the large-scale TCLP method resulted in 21 of 41 CPUs exceeding the TC for lead with an average lead concentration of 5.4 mg/L overall. Samples prepared using the mechanical shredding method resulted in 1 of 11 samples exceeding the TC for lead with an average of 2.0 mg/L. The average lead concentration for the 12 CPUs tested using the standard TCLP was 0.7 mg/L, none exceeding the TC for lead. The average for all CPUs tested in all methods was 4.0 mg/L.
Nonferrous Metals, 5.40%
Wires, 3.10%
Printed Wire Boards, 15.80%
Plastic, 7.50%
Ferrous Metals, 68.20%
Figure 4-1. Average CPU Composition of 29 Computer CPUs by Weight

Chapter 4 Leaching Results for Various Electronic Devices
LEACHING RESULTS FOR VARIOUS ELECTRONIC DEVICES
4-3
Table 4-2. TCLP Results for CPUs
Sample
Number
Make Model/Year Method pH Metal Concentration in
Leachate (mg/L)
Cu Fe Pb Zn
1 Sun Microsystems SPARK Station 2/ (S.S.) 5.1 0.02 92 1.4 112 2 Sun Microsystems SPARK Station 2/ (S.S.) 5.1 0.01 38 6.0 107 3 Sun Microsystems SPARK Station 2/ (S.S.) 5.1 0.02 86 1.0 103 4 Sun Microsystems SPARK Station 2/ (L) 5.2 0.02 104 9.0 143 5 Sun Microsystems SPARK Station 2/ (L) 5.1 0.02 94 9.0 153 6 Sun Microsystems SPARK Station 2/ (L) 5.1 0.02 93 8.0 156 7 Sun Microsystems SPARK Station 2/ (True) 5.1 0.01 50 0.5 105 8 Sun Microsystems SPARK Station 2/ (True) 5.0 0.01 11 0.4 118 9 Compaq ProLinea 4/66 (S.S.) 5.1 0.02 106 1.1 84
10 Compaq ProLinea 4/66 (S.S.) 5.2 0.01 85 1.0 122 11 Compaq ProLinea 4/66/ 1995 (L) 5.3 0.03 255 5.5 128 12 Compaq ProLinea 4/66/ 1994 (True) 5.2 0.01 18 0.3 147 13 IBM PS2 55SX/ 1987 (S.S.) 5.2 0.03 84 3.2 128 14 IBM PS2 55SX/ 1989 (L) 5.1 0.05 117 21 81 15 IBM PS2 55SX/ 1991 (L) 5.1 0.20 132 16 92 16 IBM PS2 55SX (True) 5.3 0.01 20 2.3 147 17 NCR 6020 (S.S.) 5.2 0.03 119 1.0 99 18 NCR 6020/ 1994 (L) 5.1 0.04 127 10 103 19 NCR 6020/ 1993 (True) 5.1 0.01 24 0.4 130 20 NCR 6020 (True) 5.1 0.01 31 0.5 122 21 Oli M4 Module 464/ 1994 (S.S.) 5.1 0.01 96 3.6 43 22 Oli M4 Module 464/ 1995 (S.S.) 5.1 0.01 136 1.5 52 23 Oli M4 Module 464/ 1994 (L) 5.0 0.02 65 5.3 21 24 Oli M4 Module 464/ 1995 (L) 5.0 0.06 24 3.1 33 25 Oli M4 Module 464/ 1994 (L) 5.1 0.08 131 16 27 26 Oli M4 Module 464/ 1994 (L) 5.1 0.05 62 4.0 34 27 Oli M4 Module 464/ 1994 (True) 5.2 0.01 5 0.3 172 28 Oli M4 Module 464/ 1994 (True) 5.1 0.06 59 3.1 115 29 Network General Sniffer Server/ 1995 (S.S.) 5.1 0.02 111 1.3 111 30 Network General Sniffer Server/ 1991 (L) 5.0 0.02 44 0.6 99 31 Network General Sniffer Server/ 1996 (L) 5.1 0.02 50 0.5 101 32 Network General Sniffer Server/ 1995 (True) 5.2 0.01 35 0.3 106 33 ATT Globalyst 550 9011/ 1994 (S.S.) 5.2 0.02 147 0.5 111 34 ATT Globalyst 550 9011/ 1994 (L) 5.2 0.07 189 9 114 35 ATT Globalyst 550 9011/ 1994 (True) 5.0 0.04 6 0.2 168 36 ATT Globalyst 550 9011/ 1994 (True) 5.0 0.32 19 0.1 129 37 Compaq Prolinea 4/33 1994 (L) 5.3 0.08 201 8 215

Chapter 4 Leaching Results for Various Electronic Devices
LEACHING RESULTS FOR VARIOUS ELECTRONIC DEVICES
4-4
Sample
Number
Make Model/Year Method pH Metal Concentration in
Leachate (mg/L)
Cu Fe Pb Zn
38 Compaq Prolinea 4/33 1993 (L) 5.2 0.13 253 7 160 39 Compaq Prolinea 4/33 1994 (L) 5.2 0.14 267 6.6 134 40 Compaq Prolinea 4/33 1994 (True) 5.1 0.05 44 0.5 220 41 Fortiva 5000 CPC-2803/1994 (L) 5.0 0.02 6 0.7 95 42 Digital DEC pc 806WW/1994 (L) 5.0 0.04 3 2.8 82 43 IBM 55SX/1989 (L) 5.1 0.08 131 13 70 44 IBM 55SX/1990 (L) 5.1 0.21 155 13 101 45 NCR 1993 (L) 5.2 0.04 150 6.5 120 46 e Machines 366i2/1999 (L) 5.2 0.05 14 0.2 181 47 Gateway 4DX33/1993 (L) 5.0 0.02 25 0.2 127 48 Dimension XPS MM8/1996 (L) 5.1 0.01 68 5.0 76 49 Dimension XPS MM8/1997 (L) 5.2 0.04 5 0.4 85 50 Dimension XPS MM8/1996 (L) 5.0 0.01 5 0.3 82 51 Dimension XPS MM8/1997 (L) 5.0 0.02 9 0.3 8752 Compaq PS-5151-4A/1996 (L) 5.0 0.00 11 0.2 89 53 Compaq PS-5151-4A/1996 (L) 5.0 0.01 35 0.2 87 54 Dell 450-L/1993 (L) 5.2 0.14 135 5.0 106 55 Gateway 4D X2-66/1994 (L) 5.1 0.01 62 1.8 113 56 Apple M3098/1995 (L) 5.0 0.03 122 10.0 55 57 Dell DCS/1998 (L) 5.1 0.01 11 0.2 191 58 NEC 1996 (L) 5.3 0.03 201 9.0 133 59 Dell Optiplex GL (L) 5.1 0.01 73 1.9 98 60 Dell Optiplex GL (L) 5.2 1.12 121 11.2 114 61 Dell Optiplex GN/1998 (L) 5.2 0.01 13 0.3 204 62 Gateway E 3000/1997 (L) 5.1 0.02 50 1.6 117 63 Dell Optiplex GN/1998 (L) 5.2 0.01 8 0.3 202 64 Dell Optiplex GS/1997 (L) 5.1 0.02 8 0.4 199

Chapter 4 Leaching Results for Various Electronic Devices
LEACHING RESULTS FOR VARIOUS ELECTRONIC DEVICES
4-5
4.3 COMPUTER MONITORS
One recent study showed that color CRTs from televisions and computer monitors usually exceeded the RCRA TC limits for lead (Musson et al., 2000; Townsend et al., 1999). However, this study tested only the CRT glass and did not include the monitor as a whole. Nine computer monitors were tested using the large scale testing methodology. All of the monitors tested exceeded the TC limit for lead with an average concentration of 47.7 mg/L. This was expected since the CRT glass accounted for over 60 percent of the weight of the monitors. Ferrous metal was not a factor, comprising only 3% of the total weight.
Ferrous Metal 3%
Nonferrous Metal 0%
Plastic Casing 17%
Other Plastic 1%
Metal Casing 1%
Wires 4%
CRT 62%
Printed Wire Boards 12%
Figure 4-2. Average Composition of Computer Monitors Tested
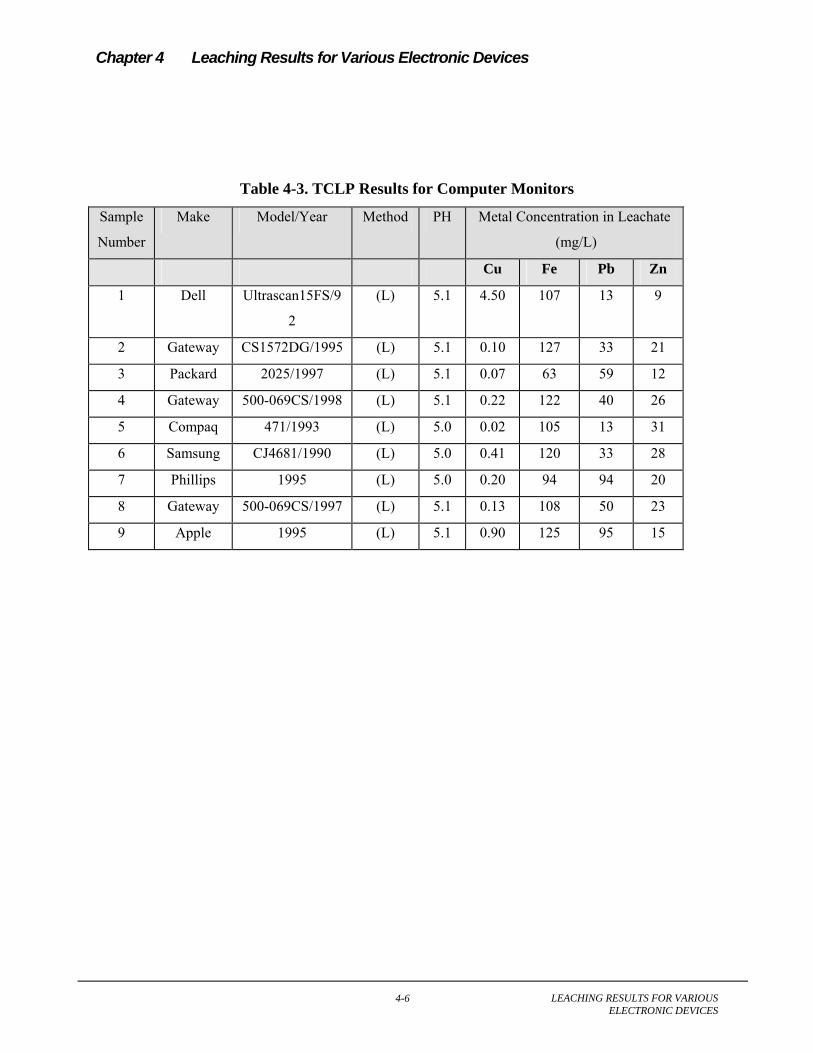
Chapter 4 Leaching Results for Various Electronic Devices
LEACHING RESULTS FOR VARIOUS ELECTRONIC DEVICES
4-6
Table 4-3. TCLP Results for Computer Monitors
Sample
Number
Make Model/Year Method PH Metal Concentration in Leachate
(mg/L)
Cu Fe Pb Zn
1 Dell Ultrascan15FS/9
2
(L) 5.1 4.50 107 13 9
2 Gateway CS1572DG/1995 (L) 5.1 0.10 127 33 21
3 Packard 2025/1997 (L) 5.1 0.07 63 59 12
4 Gateway 500-069CS/1998 (L) 5.1 0.22 122 40 26
5 Compaq 471/1993 (L) 5.0 0.02 105 13 31
6 Samsung CJ4681/1990 (L) 5.0 0.41 120 33 28
7 Phillips 1995 (L) 5.0 0.20 94 94 20
8 Gateway 500-069CS/1997 (L) 5.1 0.13 108 50 23
9 Apple 1995 (L) 5.1 0.90 125 95 15
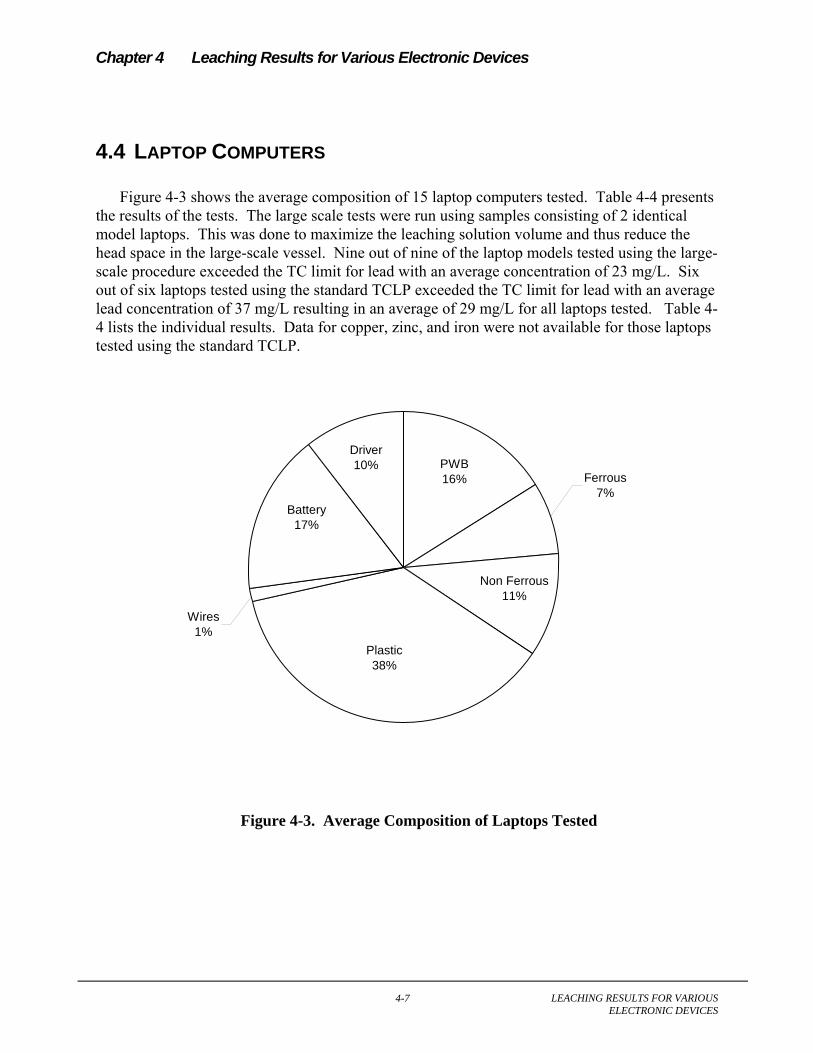
Chapter 4 Leaching Results for Various Electronic Devices
LEACHING RESULTS FOR VARIOUS ELECTRONIC DEVICES
4-7
4.4 LAPTOP COMPUTERS
Figure 4-3 shows the average composition of 15 laptop computers tested. Table 4-4 presents the results of the tests. The large scale tests were run using samples consisting of 2 identical model laptops. This was done to maximize the leaching solution volume and thus reduce the head space in the large-scale vessel. Nine out of nine of the laptop models tested using the large-scale procedure exceeded the TC limit for lead with an average concentration of 23 mg/L. Six out of six laptops tested using the standard TCLP exceeded the TC limit for lead with an average lead concentration of 37 mg/L resulting in an average of 29 mg/L for all laptops tested. Table 4-4 lists the individual results. Data for copper, zinc, and iron were not available for those laptops tested using the standard TCLP.
Figure 4-3. Average Composition of Laptops Tested
Wires1%
Driver10%
Non Ferrous11%
Ferrous7%
PWB16%
Battery17%
Plastic38%

Chapter 4 Leaching Results for Various Electronic Devices
LEACHING RESULTS FOR VARIOUS ELECTRONIC DEVICES
4-8
Table 4-4. TCLP Results for Laptops
Sample
Number
Make Model/Year Method pH Metal Concentration in Leachate
(mg/L)
Cu Fe Pb Zn Hg 1 Compa Compaq LTE 5000 (series (L) 5.2 2.9 54 17 47 <0.03 2 IBM IBM Thinkpad 9545/1995 (L) 5.1 0.3 67 26 16 <0.03 3 NEC NEC Versa m/100 (L) 5.0 2.0 100 35 21 <0.03 4 Compa Compaq LTE Lite 4/25E (L) 5.0 1.1 82 26 15 <0.03 5 Compa Compaq LTE 5280 (Series (L) 5.0 2.2 81 21 42 <0.03 6 Zenith Zenith ZWL-184-97 (L) 5.0 0.0 17 18 53 <0.03 7 Toshib Toshiba T1200 System Unit # (L) 5.1 0.1 80 15 55 <0.03 8 Zenith Zenith ZWL-371-A (L) 5.1 0.1 182 25 28 <0.03 9 Zenith Zenith ZWL-371-A (L) 5.0 0.2 206 28 38 <0.03
10 IBM Thinkpad 9545 (True) 5.0 0.1 0.8 32 0.5 <0.03 11 Compa Contura Series, 4/25C (2820) (True) 5.2 .03 73 42 11 <0.03 12 NEC VERSA m/100 (PC-580-6552) (True) 5.0 1.9 46 86 1 <0.03 13 IBM Thinkpad 350c (True) 5.0 .01 116 11 51 <0.03 14 Dell 325N (True) 5.0 .04 91 27 42 <0.03 15 AST Premium Exec 386 SX/20 (True) 5.0 .03 39 19 152 <0.03
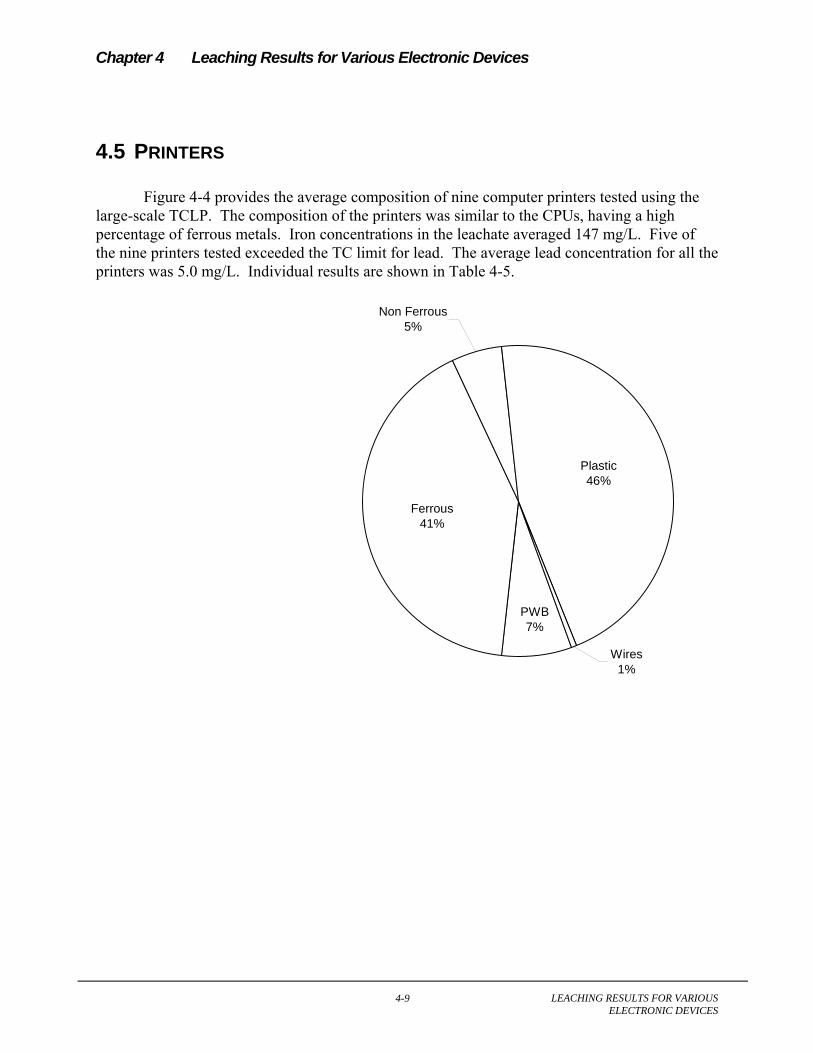
Chapter 4 Leaching Results for Various Electronic Devices
LEACHING RESULTS FOR VARIOUS ELECTRONIC DEVICES
4-9
4.5 PRINTERS
Figure 4-4 provides the average composition of nine computer printers tested using the large-scale TCLP. The composition of the printers was similar to the CPUs, having a high percentage of ferrous metals. Iron concentrations in the leachate averaged 147 mg/L. Five of the nine printers tested exceeded the TC limit for lead. The average lead concentration for all the printers was 5.0 mg/L. Individual results are shown in Table 4-5.
Non Ferrous5%
Wires1%
PWB7%
Ferrous41%
Plastic46%

Chapter 4 Leaching Results for Various Electronic Devices
LEACHING RESULTS FOR VARIOUS ELECTRONIC DEVICES
4-10
Table 4-5. TCLP Results for Printers Sample
Number
Make Model/Year Method pH Metal Concentration in Leachate
(mg/L)
Cu Fe Pb Zn
1 OKIDATA EN2700A (L) 5.0 0.40 114 6.0 49
2 HP Deskjet C4567A/1996 (L) 5.1 0.15 48 0.8 98
3 HP office jet C3801/1999 (L) 5.1 0.46 231 6.6 54
4 HP Deskjet
890C
C5876A/
1998
(L) 5.0 0.12 176 3.6 43
5 HP Desk writer 2279A/1993 (L) 5.0 0.06 101 3.6 54
6 HP Deskjet
550C
C2121A/1993 (L) 5.1 0.22 196 5.8 35
7 HP Deskjet
500C
C2106A (L) 5.1 0.10 131 6.6 61
8 HP Deskjet
672C
C2164A/1995 (L) 5.0 0.13 7 0.3 46
9 Panasonic Quiet 1991 (L) 5.1 0.05 174 5.5 64
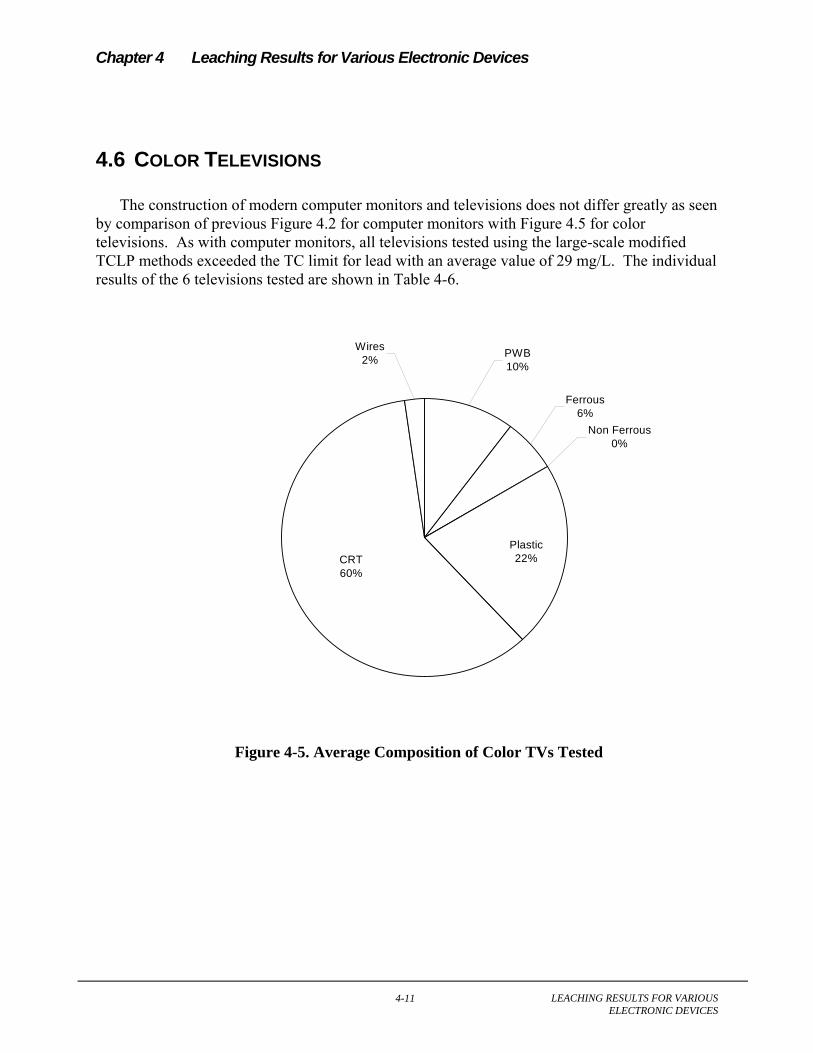
Chapter 4 Leaching Results for Various Electronic Devices
LEACHING RESULTS FOR VARIOUS ELECTRONIC DEVICES
4-11
4.6 COLOR TELEVISIONS
The construction of modern computer monitors and televisions does not differ greatly as seen by comparison of previous Figure 4.2 for computer monitors with Figure 4.5 for color televisions. As with computer monitors, all televisions tested using the large-scale modified TCLP methods exceeded the TC limit for lead with an average value of 29 mg/L. The individual results of the 6 televisions tested are shown in Table 4-6.
Figure 4-5. Average Composition of Color TVs Tested
Wires2% PWB
10%
Non Ferrous0%
Ferrous6%
Plastic22%CRT
60%

Chapter 4 Leaching Results for Various Electronic Devices
LEACHING RESULTS FOR VARIOUS ELECTRONIC DEVICES
4-12
Table 4-6. TCLP Results for Color TV
Sample
Number
Make Model/Year Method pH Metal Concentration in
Leachate (mg/L)
Cu Fe Pb Zn 1 JVC C-13WL5/1994 (L) 5.1 0.05 68 31 23 2 Panasonic CT 216-A/1987 (L) 5.3 0.03 40 15 54 3 Philips RAX 150 WA02/1990 (L) 5.2 0.01 95 15 21 4 Sanyo 1999 (L) 5.1 0.01 124 12 13 5 RCA 2001 (L) 5.0 0.07 140 43 18 6 Zenith D1312W, 1987 (L) 5.1 0.10 135 29 15

Chapter 4 Leaching Results for Various Electronic Devices
LEACHING RESULTS FOR VARIOUS ELECTRONIC DEVICES
4-13
4.7 VCRS
Eight VCRs were tested using the large-scale TCLP. The average composition of the VCRs is shown in Figure 4.6. The VCRs, like the CPUs and printers, contained a higher percentage of ferrous metal, 45%, with an average of 162 mg/L of iron in the leachate. The average leachate concentration of lead was 9.49 mg/L with 7 of the 8 VCRs exceeding the TC limit for lead.
Figure 4-6. Average Composition of VCRs Tested
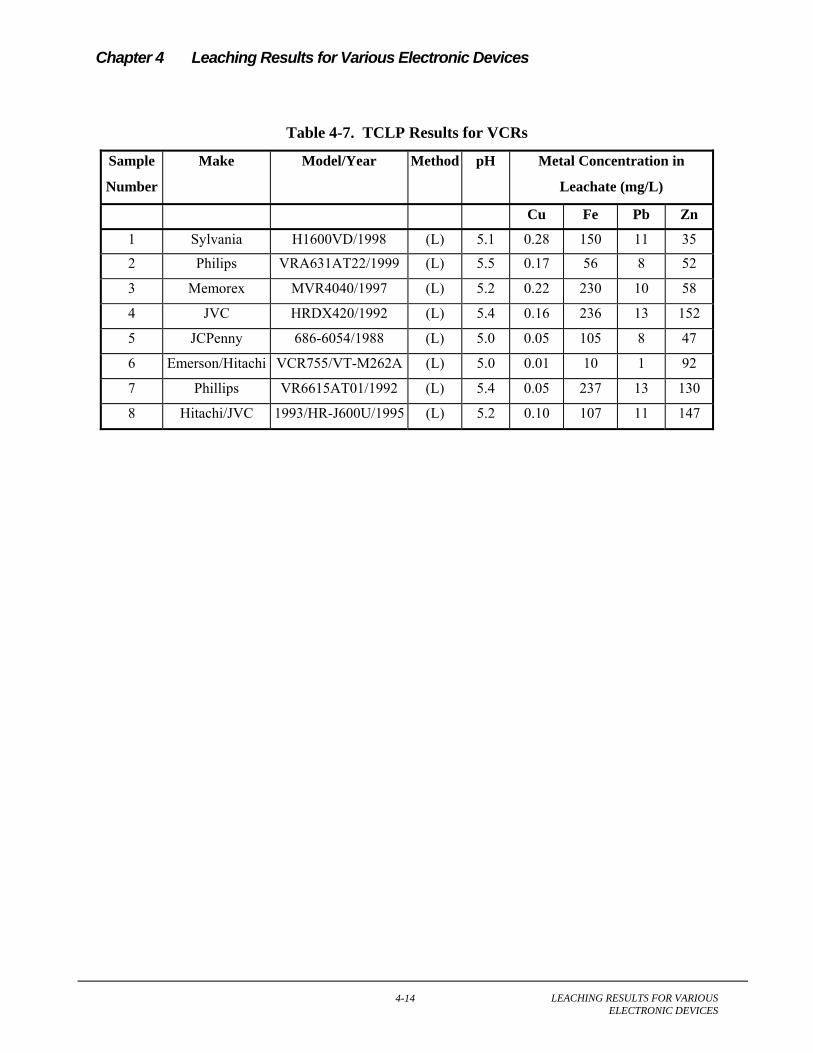
Chapter 4 Leaching Results for Various Electronic Devices
LEACHING RESULTS FOR VARIOUS ELECTRONIC DEVICES
4-14
Table 4-7. TCLP Results for VCRs
Sample
Number
Make Model/Year Method pH Metal Concentration in
Leachate (mg/L)
Cu Fe Pb Zn
1 Sylvania H1600VD/1998 (L) 5.1 0.28 150 11 35
2 Philips VRA631AT22/1999 (L) 5.5 0.17 56 8 52
3 Memorex MVR4040/1997 (L) 5.2 0.22 230 10 58
4 JVC HRDX420/1992 (L) 5.4 0.16 236 13 152
5 JCPenny 686-6054/1988 (L) 5.0 0.05 105 8 47
6 Emerson/Hitachi VCR755/VT-M262A (L) 5.0 0.01 10 1 92
7 Phillips VR6615AT01/1992 (L) 5.4 0.05 237 13 130
8 Hitachi/JVC 1993/HR-J600U/1995 (L) 5.2 0.10 107 11 147

Chapter 4 Leaching Results for Various Electronic Devices
LEACHING RESULTS FOR VARIOUS ELECTRONIC DEVICES
4-15
4.8 CELLULAR PHONES
Cell phones, without their battery, were tested using the standard TCLP and a modified TCLP procedure. The typical mass of a cell phone without its battery averages nearly 100g. Therefore, it was not necessary to use the large-scale TCLP extraction vessel as done for TVs, computer monitors, keyboards, and VCRs. Whole, disassembled cell phones were placed in the 2L TCLP extraction vessels prescribed in the regulatory procedure. These are designated as (M.S.) in Table 4-8. The average lead leachate concentration using the modified procedure was 34 mg/L with 10 of 14 samples exceeding the TC limit for lead. In addition to the modified procedure, the standard procedure using samples reduced in size to less than 0.95 cm was performed on 38 cell phones. These are designated as (True) in Table 4-8. The average concentration of lead in the leachate was 20 mg/L with 28 of the 38 samples exceeding the TC limit for lead. The average composition by weight of the cell phones is shown in Figure 4-7.
Figure 4-7. Average Composition of Cell Phones Tested
Plastics45%
PC Board40%
Metals8%
Magnessium Plate3%
LCD4%
Solar Cell0%

Chapter 4 Leaching Results for Various Electronic Devices
LEACHING RESULTS FOR VARIOUS ELECTRONIC DEVICES
4-16
Table 4-8. TCLP Results for Cell Phones
Sample
Number
Make Model/Year Method pH Metal Concentration in
Leachate (mg/L)
Cu Fe Pb Zn 1 Motorola SWF4018DF J 160017B (M.S.) 4.9 0.01 43 141 6 2 Motorola 80148WNBEA (M.S) 5.0 0.11 87 115 0.4
3 Sprint QCP-2700 (M.S) 5.0 0.00 5 1.5 17.34 Motorola SWF2049A H7 41843A4C (M.S) 4.9 0.01 6 1.6 3.0 6 Ericsson CF768 (M.S) 5.0 1.16 44 115 19.07 Nokia 2120 (M.S) 6.3 0.00 2 0.1 12.08 Nokia (b) 5160 (M.S) 4.9 0.03 9 11 20.39 Nokia (p) 5160 (M.S) 5.0 0.01 2 2 18.3
10 Motorola Piper 34106NNDPA/1996 (M.S) 4.9 0.00 107 14 4.5 11 Motorola Piper 34106NNDPA/1996 (M.S) 4.9 0.00 93 15 4.0 12 Motorola Piper 34106NNDPA/1996 (M.S) 4.9 0.00 119 17 4.1 13 Motorola Piper 34106NNDPA/1996 (M.S) 4.9 0.00 113 17 2.7 14 Motorola Piper 34106NNDPA/1996 (M.S) 4.9 0.00 125 15 3.1 15 Motorola Piper 34106NNDPA/1996 (M.S) 4.9 0.00 111 16 0.3 16 Motorola Piper 34106NNDPA/1996 (True) 4.9 0.00 109 20 3.5 17 Motorola Piper 34106NNDPA/1996 (True) 4.9 0.01 109 21 4.1 18 Motorola Piper 34106NNDPA/1996 (True) 4.9 0.01 97 16 3.1 19 Motorola Piper 34106NNDPA/1996 (True) 4.9 0.01 94 17 3.1 20 Motorola Piper 34106NNDPA/1996 (True) 4.9 0.00 105 20 3.3 21 Motorola Piper 34106NNDPA/1996 (True) 4.9 0.00 83 18 2.5 22 Ericsson DF688/1997 (True) 5.5 0.01 7 4 4.0 23 NEC MP5G1A1A-1A/1996 (True) 5.4 0.02 4 3 7.0 24 Nokia 2160 EFR (True) 8.8 0.00 0.1 0.0 0.2 25 Ericsson KH668(2)/1997 (True) 5.6 0.08 14 16 7.7 26 Nokia 3390 (True) 5.0 0.82 56 60 18.927 NEC DM2100 MP5G1B1-1A (True) 8.4 0.01 0.1 0.0 0.0
28 Nokia 5120i (True) 5.0 0.08 56 16 16.029 Motorola Piper 76362NNDBA/1995 (True) 5.1 0.00 121 30 3.1 30 Mitsubishi G100e/1996 (True) 5.1 0.00 20 21 15.431 Qualcomm QCP-820(2) (True) 5.2 0.03 147 12 25.1
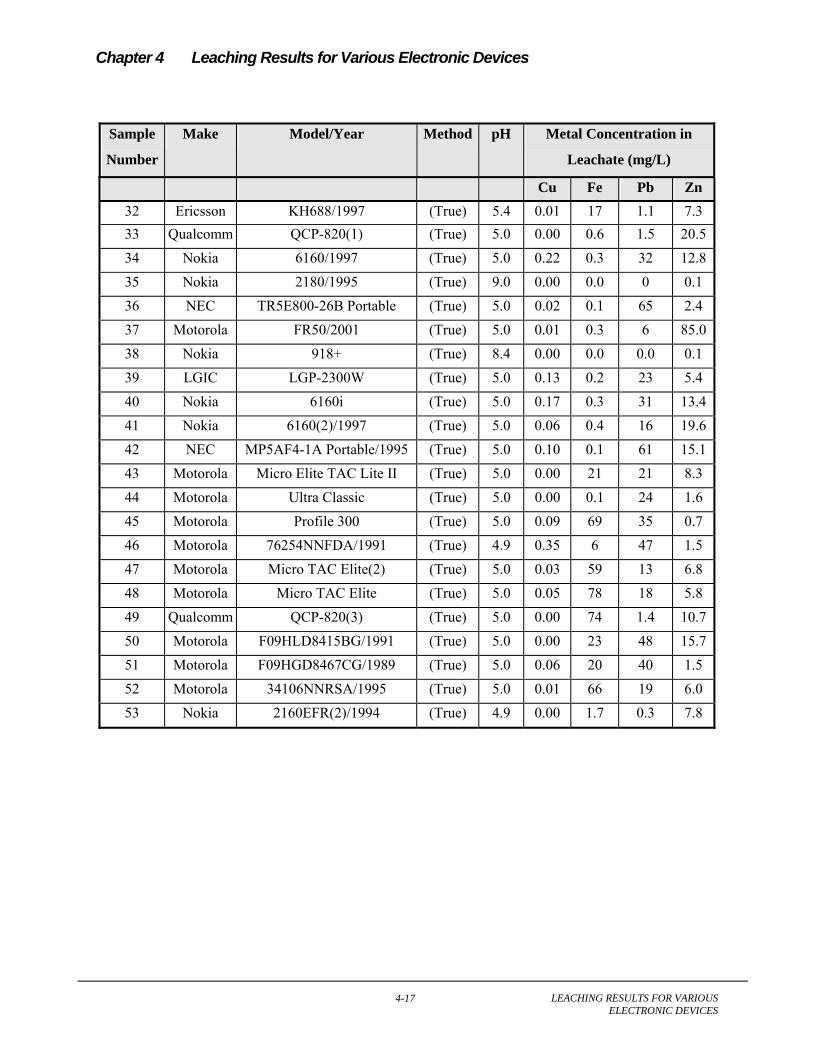
Chapter 4 Leaching Results for Various Electronic Devices
LEACHING RESULTS FOR VARIOUS ELECTRONIC DEVICES
4-17
Sample
Number
Make Model/Year Method pH Metal Concentration in
Leachate (mg/L)
Cu Fe Pb Zn 32 Ericsson KH688/1997 (True) 5.4 0.01 17 1.1 7.3 33 Qualcomm QCP-820(1) (True) 5.0 0.00 0.6 1.5 20.534 Nokia 6160/1997 (True) 5.0 0.22 0.3 32 12.835 Nokia 2180/1995 (True) 9.0 0.00 0.0 0 0.1 36 NEC TR5E800-26B Portable (True) 5.0 0.02 0.1 65 2.4 37 Motorola FR50/2001 (True) 5.0 0.01 0.3 6 85.038 Nokia 918+ (True) 8.4 0.00 0.0 0.0 0.1 39 LGIC LGP-2300W (True) 5.0 0.13 0.2 23 5.4 40 Nokia 6160i (True) 5.0 0.17 0.3 31 13.441 Nokia 6160(2)/1997 (True) 5.0 0.06 0.4 16 19.642 NEC MP5AF4-1A Portable/1995 (True) 5.0 0.10 0.1 61 15.143 Motorola Micro Elite TAC Lite II (True) 5.0 0.00 21 21 8.3 44 Motorola Ultra Classic (True) 5.0 0.00 0.1 24 1.6 45 Motorola Profile 300 (True) 5.0 0.09 69 35 0.7 46 Motorola 76254NNFDA/1991 (True) 4.9 0.35 6 47 1.5 47 Motorola Micro TAC Elite(2) (True) 5.0 0.03 59 13 6.8 48 Motorola Micro TAC Elite (True) 5.0 0.05 78 18 5.8 49 Qualcomm QCP-820(3) (True) 5.0 0.00 74 1.4 10.750 Motorola F09HLD8415BG/1991 (True) 5.0 0.00 23 48 15.751 Motorola F09HGD8467CG/1989 (True) 5.0 0.06 20 40 1.5 52 Motorola 34106NNRSA/1995 (True) 5.0 0.01 66 19 6.0 53 Nokia 2160EFR(2)/1994 (True) 4.9 0.00 1.7 0.3 7.8

Chapter 4 Leaching Results for Various Electronic Devices
LEACHING RESULTS FOR VARIOUS ELECTRONIC DEVICES
4-18
Plastic17%
PWB11%
Wires7%
Ferrous27%
Plastic Cover38%
4.9 KEY BOARDS
Keyboards were tested using both the large-scale and standard TCLP procedures. The large-scale procedure was performed by combining four keyboards into a single extraction. Three individual keyboards were disassembled, separated into their corresponding components, and size reduced to less than 0.95 cm. A 100g sample was then generated using the relative weight percentage of each component. The 100 g samples were tested using the standard TCLP. The large-scale TCLP test exceeded the 5 mg/L leachate concentration limit for lead. None of the three keyboards tested using the standard TCLP exceeded the TC limit for lead with an average lead concentration of 2.4 mg/L. The average composition of the keyboards and the test results are shown in Figure 4-8 and Table 4-9 respectively.
Figure 4-8. Average Composition of Keyboards Tested
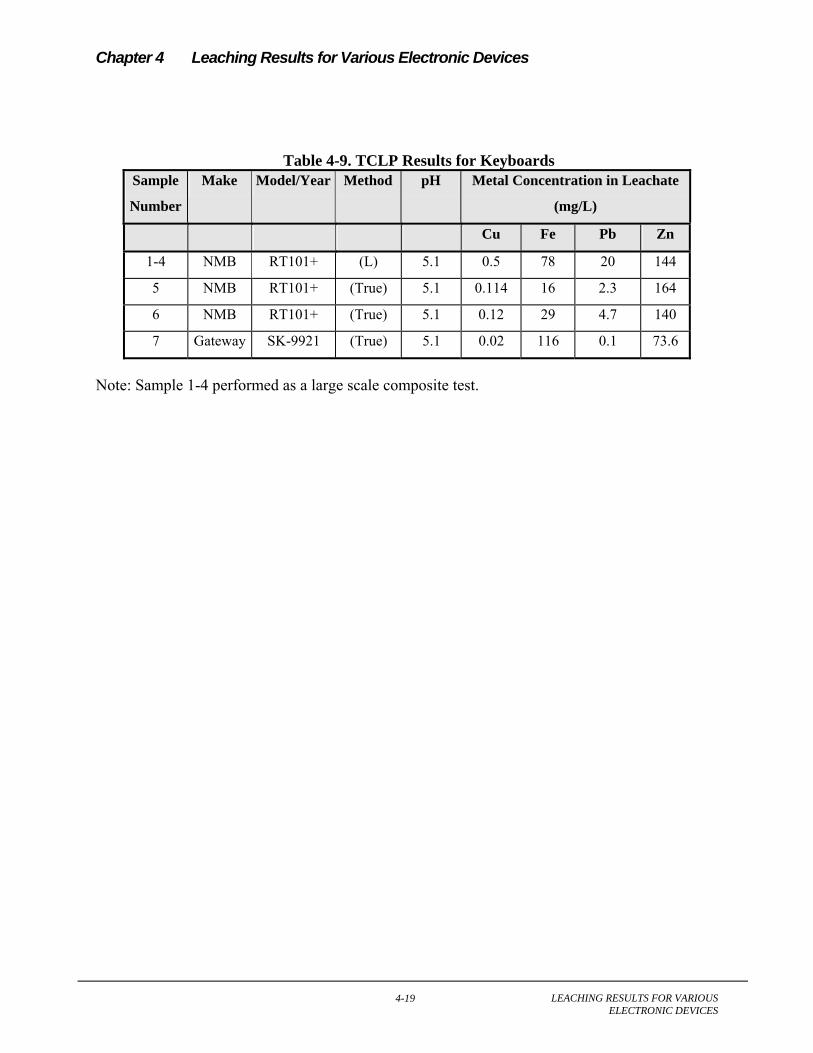
Chapter 4 Leaching Results for Various Electronic Devices
LEACHING RESULTS FOR VARIOUS ELECTRONIC DEVICES
4-19
Table 4-9. TCLP Results for Keyboards Sample
Number
Make Model/Year Method pH Metal Concentration in Leachate
(mg/L)
Cu Fe Pb Zn
1-4 NMB RT101+ (L) 5.1 0.5 78 20 144
5 NMB RT101+ (True) 5.1 0.114 16 2.3 164
6 NMB RT101+ (True) 5.1 0.12 29 4.7 140
7 Gateway SK-9921 (True) 5.1 0.02 116 0.1 73.6
Note: Sample 1-4 performed as a large scale composite test.
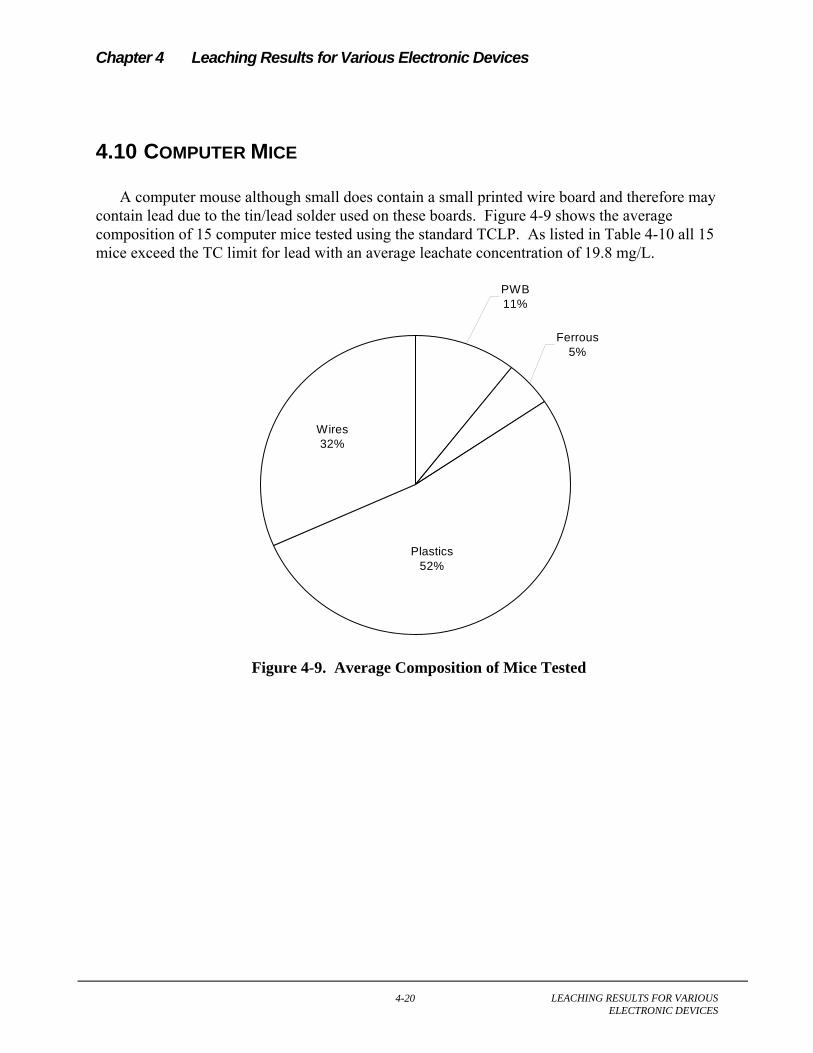
Chapter 4 Leaching Results for Various Electronic Devices
LEACHING RESULTS FOR VARIOUS ELECTRONIC DEVICES
4-20
4.10 COMPUTER MICE
A computer mouse although small does contain a small printed wire board and therefore may contain lead due to the tin/lead solder used on these boards. Figure 4-9 shows the average composition of 15 computer mice tested using the standard TCLP. As listed in Table 4-10 all 15 mice exceed the TC limit for lead with an average leachate concentration of 19.8 mg/L.
Figure 4-9. Average Composition of Mice Tested
Ferrous5%
PWB11%
Wires32%
Plastics52%
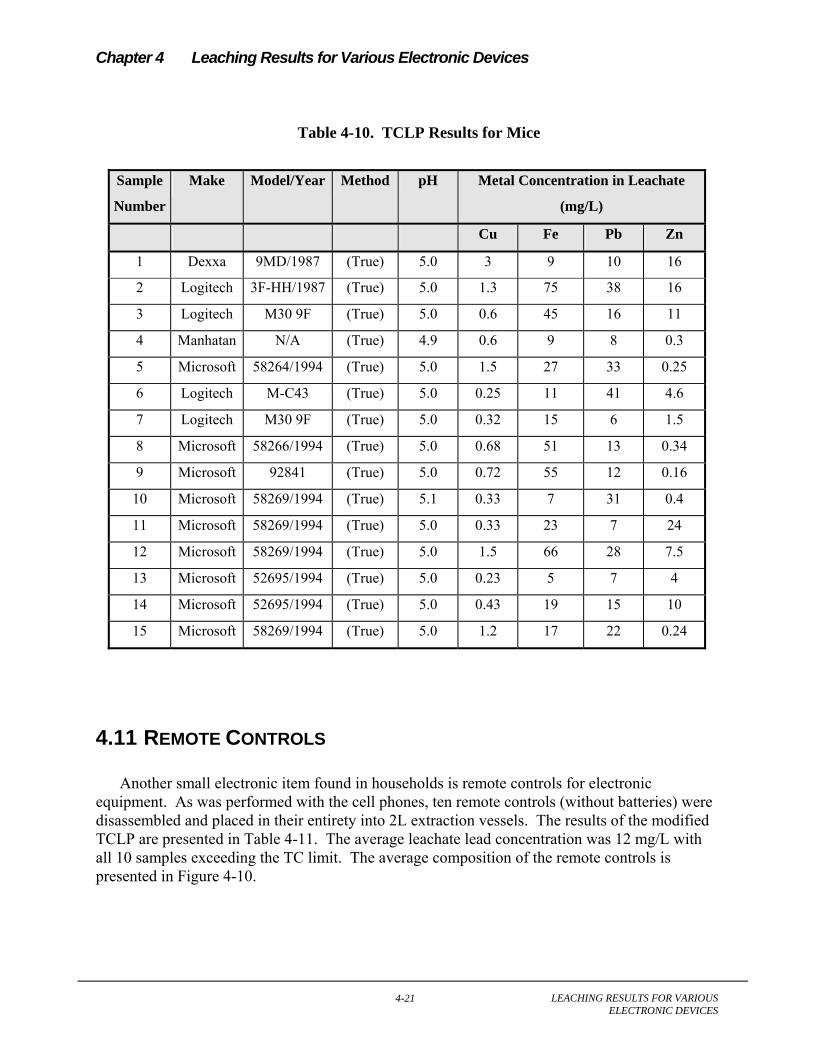
Chapter 4 Leaching Results for Various Electronic Devices
LEACHING RESULTS FOR VARIOUS ELECTRONIC DEVICES
4-21
Table 4-10. TCLP Results for Mice
Sample
Number
Make Model/Year Method pH Metal Concentration in Leachate
(mg/L)
Cu Fe Pb Zn
1 Dexxa 9MD/1987 (True) 5.0 3 9 10 16
2 Logitech 3F-HH/1987 (True) 5.0 1.3 75 38 16
3 Logitech M30 9F (True) 5.0 0.6 45 16 11
4 Manhatan N/A (True) 4.9 0.6 9 8 0.3
5 Microsoft 58264/1994 (True) 5.0 1.5 27 33 0.25
6 Logitech M-C43 (True) 5.0 0.25 11 41 4.6
7 Logitech M30 9F (True) 5.0 0.32 15 6 1.5
8 Microsoft 58266/1994 (True) 5.0 0.68 51 13 0.34
9 Microsoft 92841 (True) 5.0 0.72 55 12 0.16
10 Microsoft 58269/1994 (True) 5.1 0.33 7 31 0.4
11 Microsoft 58269/1994 (True) 5.0 0.33 23 7 24
12 Microsoft 58269/1994 (True) 5.0 1.5 66 28 7.5
13 Microsoft 52695/1994 (True) 5.0 0.23 5 7 4
14 Microsoft 52695/1994 (True) 5.0 0.43 19 15 10
15 Microsoft 58269/1994 (True) 5.0 1.2 17 22 0.24
4.11 REMOTE CONTROLS
Another small electronic item found in households is remote controls for electronic equipment. As was performed with the cell phones, ten remote controls (without batteries) were disassembled and placed in their entirety into 2L extraction vessels. The results of the modified TCLP are presented in Table 4-11. The average leachate lead concentration was 12 mg/L with all 10 samples exceeding the TC limit. The average composition of the remote controls is presented in Figure 4-10.
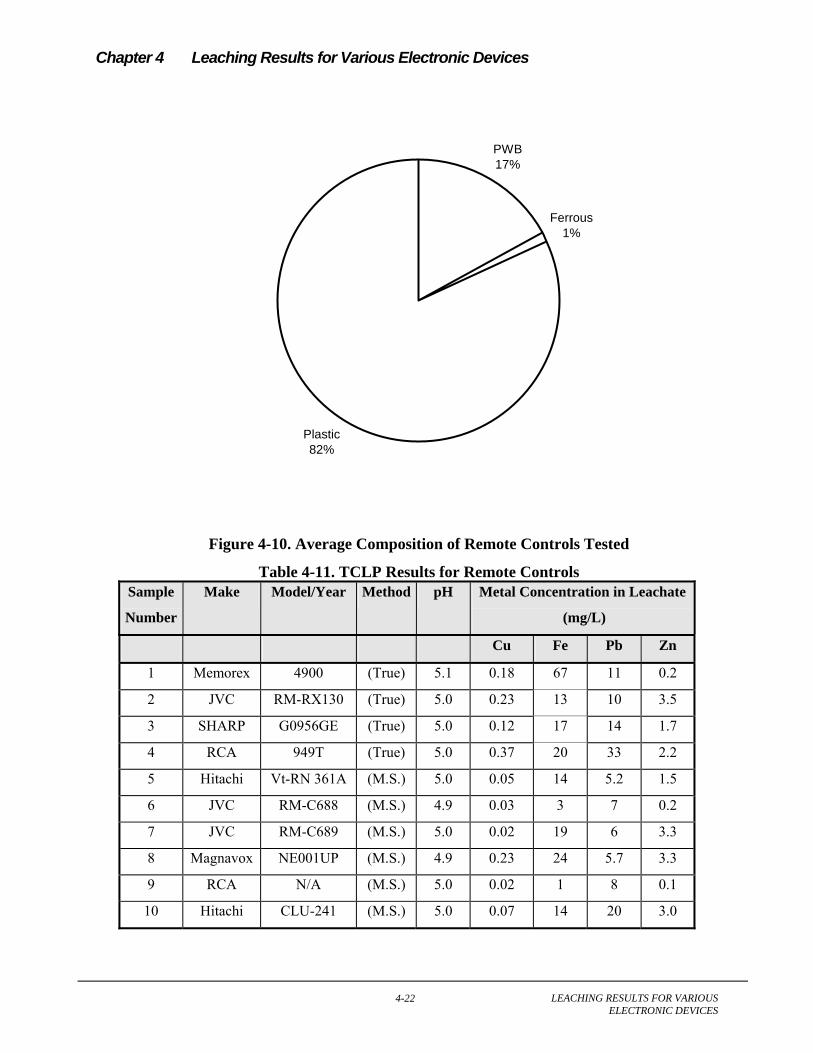
Chapter 4 Leaching Results for Various Electronic Devices
LEACHING RESULTS FOR VARIOUS ELECTRONIC DEVICES
4-22
PWB17%
Ferrous1%
Plastic82%
Figure 4-10. Average Composition of Remote Controls Tested
Table 4-11. TCLP Results for Remote Controls Sample
Number
Make Model/Year Method pH Metal Concentration in Leachate
(mg/L)
Cu Fe Pb Zn
1 Memorex 4900 (True) 5.1 0.18 67 11 0.2
2 JVC RM-RX130 (True) 5.0 0.23 13 10 3.5
3 SHARP G0956GE (True) 5.0 0.12 17 14 1.7
4 RCA 949T (True) 5.0 0.37 20 33 2.2
5 Hitachi Vt-RN 361A (M.S.) 5.0 0.05 14 5.2 1.5
6 JVC RM-C688 (M.S.) 4.9 0.03 3 7 0.2
7 JVC RM-C689 (M.S.) 5.0 0.02 19 6 3.3
8 Magnavox NE001UP (M.S.) 4.9 0.23 24 5.7 3.3
9 RCA N/A (M.S.) 5.0 0.02 1 8 0.1
10 Hitachi CLU-241 (M.S.) 5.0 0.07 14 20 3.0

Chapter 4 Leaching Results for Various Electronic Devices
LEACHING RESULTS FOR VARIOUS ELECTRONIC DEVICES
4-23
4.12 SMOKE DETECTORS
Smoke detectors are widely used in both businesses and households. Smoke detectors contain PWBs and other materials as outlined in Figure 4-11. Nine smoke detectors (without batteries) were tested, all using the standard TCLP procedure. The results are presented in Table 4-12. The average leachate concentration for lead was 23 mg/L with 7 of the 9 smoke detectors exceeding the TC limit for lead.
PWB53%
Ferrous41%
Non Ferrous6%
Figure 4-11. Average Composition of Smoke Detectors Tested
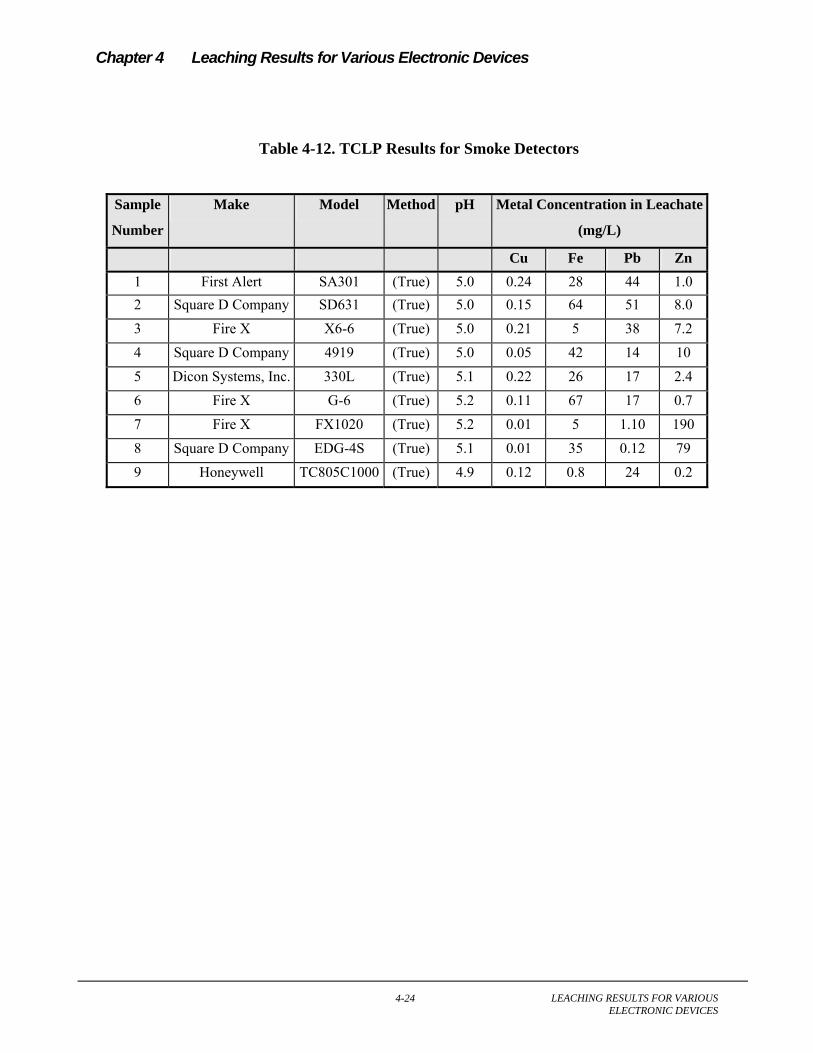
Chapter 4 Leaching Results for Various Electronic Devices
LEACHING RESULTS FOR VARIOUS ELECTRONIC DEVICES
4-24
Table 4-12. TCLP Results for Smoke Detectors
Sample
Number
Make Model Method pH Metal Concentration in Leachate
(mg/L)
Cu Fe Pb Zn 1 First Alert SA301 (True) 5.0 0.24 28 44 1.0 2 Square D Company SD631 (True) 5.0 0.15 64 51 8.0 3 Fire X X6-6 (True) 5.0 0.21 5 38 7.2 4 Square D Company 4919 (True) 5.0 0.05 42 14 10 5 Dicon Systems, Inc. 330L (True) 5.1 0.22 26 17 2.4 6 Fire X G-6 (True) 5.2 0.11 67 17 0.7 7 Fire X FX1020 (True) 5.2 0.01 5 1.10 190 8 Square D Company EDG-4S (True) 5.1 0.01 35 0.12 79 9 Honeywell TC805C1000 (True) 4.9 0.12 0.8 24 0.2

Chapter 4 Leaching Results for Various Electronic Devices
LEACHING RESULTS FOR VARIOUS ELECTRONIC DEVICES
4-25
4.13 FLAT PANEL MONITORS
Eight different flat panel displays were tested. These devices were difficult to obtain as they are relatively new on the market. Thus, six of the eight devices tested were of the same model and manufacturer. All the devices were tested using the large-scale modified methodology. Table 4-13 summarizes the results of the flat panel displays tested. Three of the eight devices tested exceeded the TC limit for lead. The average lead concentration was 3.75 mg/L.
Plastic casing16.8%
Ferrous Metal25.1%
Glass18.8%
PWB9.8%
Non ferrous metal9.4%
Wires4.1%
Mercury Tubes0.3% Plastics
6.7%
Screen9.1%
Figure 4-12. Average composition of Flat Panels
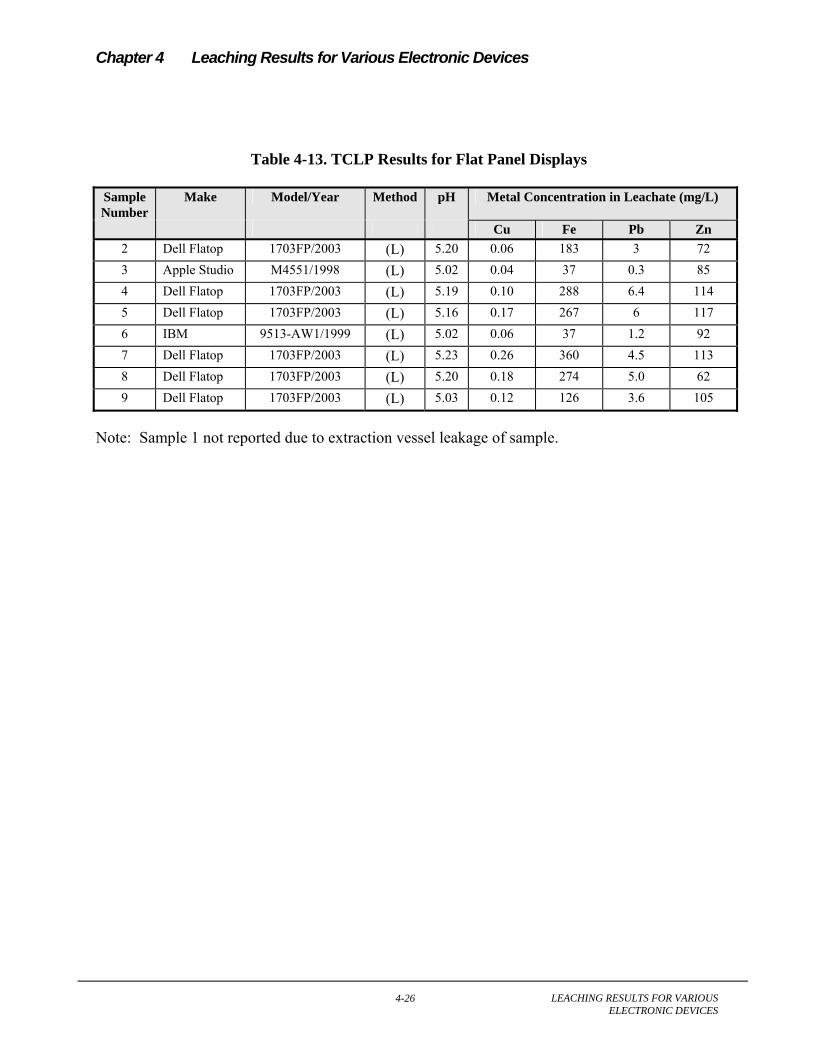
Chapter 4 Leaching Results for Various Electronic Devices
LEACHING RESULTS FOR VARIOUS ELECTRONIC DEVICES
4-26
Table 4-13. TCLP Results for Flat Panel Displays
Sample Number
Make Model/Year Method pH Metal Concentration in Leachate (mg/L)
Cu Fe Pb Zn 2 Dell Flatop 1703FP/2003 (L) 5.20 0.06 183 3 72 3 Apple Studio M4551/1998 (L) 5.02 0.04 37 0.3 85 4 Dell Flatop 1703FP/2003 (L) 5.19 0.10 288 6.4 114 5 Dell Flatop 1703FP/2003 (L) 5.16 0.17 267 6 117 6 IBM 9513-AW1/1999 (L) 5.02 0.06 37 1.2 92 7 Dell Flatop 1703FP/2003 (L) 5.23 0.26 360 4.5 113 8 Dell Flatop 1703FP/2003 (L) 5.20 0.18 274 5.0 62 9 Dell Flatop 1703FP/2003 (L) 5.03 0.12 126 3.6 105
Note: Sample 1 not reported due to extraction vessel leakage of sample.
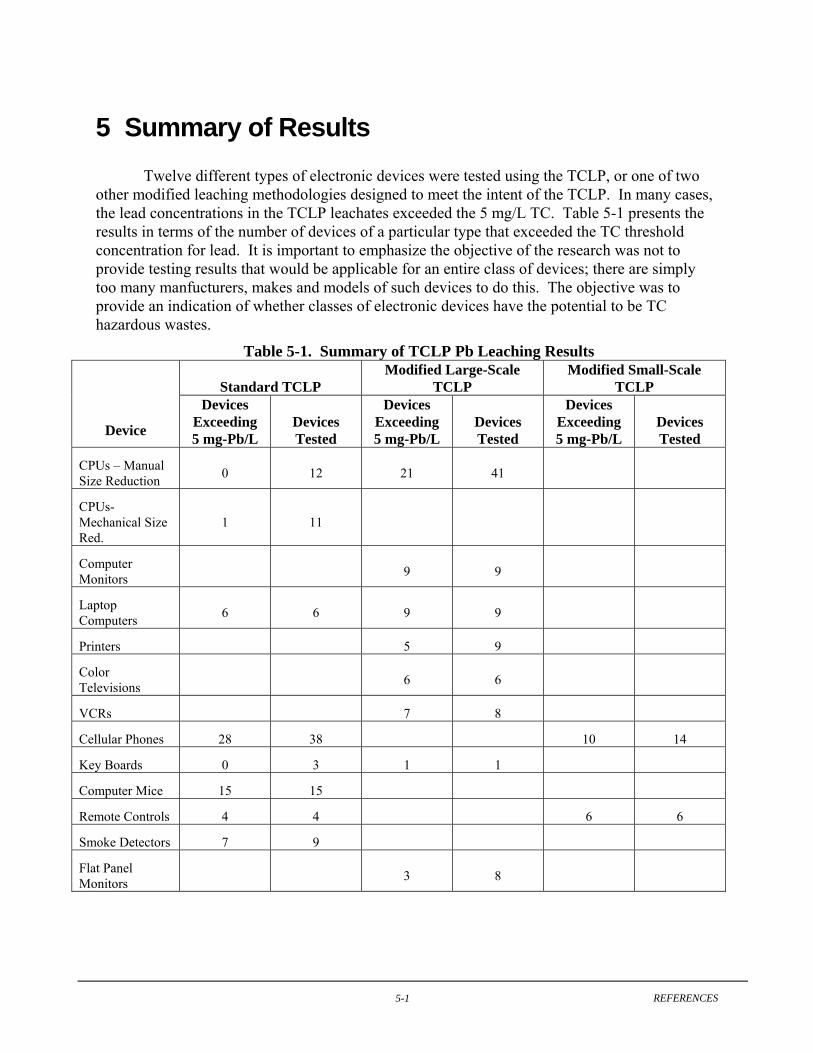
REFERENCES
5-1
5 Summary of Results Twelve different types of electronic devices were tested using the TCLP, or one of two
other modified leaching methodologies designed to meet the intent of the TCLP. In many cases, the lead concentrations in the TCLP leachates exceeded the 5 mg/L TC. Table 5-1 presents the results in terms of the number of devices of a particular type that exceeded the TC threshold concentration for lead. It is important to emphasize the objective of the research was not to provide testing results that would be applicable for an entire class of devices; there are simply too many manfucturers, makes and models of such devices to do this. The objective was to provide an indication of whether classes of electronic devices have the potential to be TC hazardous wastes.
Table 5-1. Summary of TCLP Pb Leaching Results
Standard TCLP Modified Large-Scale
TCLP Modified Small-Scale
TCLP
Device
Devices Exceeding 5 mg-Pb/L
Devices Tested
Devices Exceeding 5 mg-Pb/L
Devices Tested
Devices Exceeding 5 mg-Pb/L
Devices Tested
CPUs – Manual Size Reduction 0 12 21 41
CPUs- Mechanical Size Red.
1 11
Computer Monitors 9 9
Laptop Computers 6 6 9 9
Printers 5 9
Color Televisions 6 6
VCRs 7 8
Cellular Phones 28 38 10 14
Key Boards 0 3 1 1
Computer Mice 15 15
Remote Controls 4 4 6 6
Smoke Detectors 7 9
Flat Panel Monitors 3 8

Chapter 5 Summary of Results
REFERENCES
5-2
The results in Table 5-1 show that electronic devices containing lead do have the potential to leach lead concentrations above the toxicity characteristic limit of 5 mg/L when leached using the TCLP extraction solution. Every device type leached lead above 5 mg/L in at least one test. It is important to note that the size and heterogeneity of many of the devices tested precluded the use of the standard TCLP under the constraints of the project scope and budget. Thus modified testing procedures were used for many of the devices. These modified tests were designed in an effort to meet the intent of the TCLP. The same leaching solution and the same liquid to solid ratio were used. These modified tests are not, however, the TCLP as defined in 40 CFR 261. In the case of the large-scale modified TCLP, the samples were not size reduced. During method development it was thought that this approach would tend to underestimate the amount of pollutant leached, as the purpose of the size reduction step is to reach equilibrium concentrations more quickly. Lead may leach more when the materials are not size reduced because of chemical conditions resulting from the other components of the device.
The testing of entire color computer monitors and color televisions confirms previous experiments that show color CRTs to leach lead above the toxicity characteristic concentration. Small electronic devices that contain a PWB with lead solder often leach above 5 mg/L of lead using the standard TCLP. When the larger devices were tested using the modified large-scale method, they often exceeded the TC limit for lead. The amount of ferrous metal present in some of these devices may result in less lead being leached if the standard TCLP were to be performed. In the detailed study of computer CPUs (see Chapter 3), size-reduced computer CPUs leached less lead that the same model of CPU leached with the large-scale modified method (it should be noted that this particular model did not fail TCLP even for the large method, while many of the other CPU models tested did). On the other hand, in limited testing of laptops using the standard approach and the modified approach, the TC limit was always exceeded for lead. The difference between leaching results for the two devices likely resulted from the greater ferrous metal content (68%) of the computer CPUs relative to the laptops (7%).
The utility of the modified test results will have to be determined by the regulatory agencies. One could argue that the modified test procedures are not true TCLP results and thus are not applicable. However, the modified testing procedures meet the intent of the TCLP which is to provide a conservative estimate of the amount of pollutant that leaches from a waste in the simulated landfill leachate designed for the TCLP. At the very least, this research contributes to the debate regarding the appropriate utilization of leach testing of solid wastes. Finally, it is noted that this report does not attempt to interpret the TCLP results with respect to environmental impacts, such as impact on leachate quality at landfills. The authors are conducting other research to address this issue.
REFERENCES
6-1
6 References Akatiff, C., 2002, “Is this Ban Really Necessary? A Critical Investigation of the CRT Ban,”
Lake Tahoe, Nevada, Solid Waste Association of North American (SWANA) Western Regional Symposium.
Basel Action Network (BAN), 2002, “Exporting Harm: The High-Tech Trashing of Asia,” Seattle, Washington, (PDF copy available at: http://www.ban.org/E-waste/technotrashfinalcomp.pdf), March, 2002.
Bromine Science and Environmental Forum (BSEF), 2000, “An Introduction to Brominated Flame Retardants,” Brussels, Belgium, (PDF copy available at: http://www.ebfrip.org/download/weeeqa.pdf), August, 2001.
Environment Australia, 1999, “Hazardous Status of Waste Electrical and Electronic Assembles or Scrap,” Guidance Paper, Department of the Environment and Heritage, Commonwealth of Australia, (PDF copy available at: http://www.ea.gov.au/industry/hwa/pubs/scrap.pdf), November 2002.
Five Winds International (FWI), 2001, “Toxic and Hazardous Materials in Electronics: An Environmental Scan of Toxic and Hazardous Materials in IT and Telecom Products and Waste,” Final Report, submitted to Environment Canada, National Office of Pollution Prevention and Industry Canada, Computers for Schools Program, 219 ch. Vanier, Aylmer, Quebec J9H IY5, Canada, (PDF copy at: http://www.epsc.ca/pdfs/IT_Telecom_Haz_Mats_ENG.pdf), September 2001.
Global Futures Foundation (GFF), 2001, “Computer E-Waste and Product Stewardship: Is California Ready for the Challenge?” Report for the US Environmental Protection Agency Region IX, San Francisco, California, (PDF copy available at: http://www.globalfutures.org/e-waste.pdf), November 2002.
Kendall, D., 2003, “Toxicity Characteristic Leaching Procedure and Iron Treatment of Brass Foundry Waste,” Environmental Science and Technology, Vol. 37, pp. 367-371.
Meng, X., G. Korfiatis, C. Jing, C. Christodoulatos, 2001, “Redox Transformations of Arsenic and Iron in Water Treatment Sludge During Aging and TCLP Extraction,” Environmental Science and Technology, Vol. 35, pp. 3476-3481.
Microelectronics and Computer Technology Corporation (MCC), 1996, Electronics Industry Environmental Road Map, Document No. MCC-ECESM-001-96, pp. 249, Austin, Texas.
Musson, S., Y. Jang, T. Townsend, I. Chung, 2000, “Characterization of Lead Leachability from Cathode Ray Tubes Using the Toxicity Characteristic Leaching Procedure,” Environmental
Chapter 6 References
REFERENCES
6-2
Science and Technology, Vol. 34, pp. 4376-4381.
National Safety Council (NSC), 1999, “Electronic Product Recovery and Recycling Baseline Report: Recycling of Selected Electronic Products in the United States,” National Safety Council’s Environmental Health Center, Washington, D.C.
Nordic Council of Ministers (NCM), 1995, “Waste from Electrical and Electronic Products: A Survey of the Contents of Materials and Hazardous Substances in Electric and Electronic Products,” TemaNord 1995:554, pp. 9-52, Copenhagen, Denmark.
Silicon Valley Toxics Coalition (SVTC), Californians Against Waste (CAW), and The Materials for the Future Foundation, 2001, “Poison PCs and Toxic TVs: California’s Biggest Environmental Crisis That You’ve Never Heard Of,” pp. 2-14, San Jose, California, (PDF copy available at: http://www.svtc.org/cleancc/pubs/ppc-ttv1.pdf), June, 2001.
Schmidt, C.W., 2002, e-Junk Explosion, Environ Health Perspect, Vol. 110(4), pp. A188-94.
Snoeyink, V, D. Jenkins, 1980, Water Chemistry, John Wiley & Sons, Inc., New York, pp. 363-378.
Townsend, T., Y. Jang, T. Tolaymat, J. Jambeck, 2001, “Leaching Tests for Evaluating Risk in Solid Waste Management Decision Making: Year 1,” Florida Center for Solid and Hazardous Waste Management, Gainesville, FL, (PDF copy available at: http://www.ees.ufl.edu/homepp/townsend/Research/Leach/Leach_Yr1.PDF), March, 2003.
Townsend, T., S. Musson, Y. Jang, I. Chung, 1999, “Characterization of Lead Leachability from Cathode Ray Tubes Using the Toxicity Characterization Leaching Procedure,” Florida Center for Solid and Hazardous Waste Management. Report # 99-5, pp. 10-16, Gainesville, FL, (PDF copy available at: http://www.floridacenter.org/publications/lead_leachability_99-5.pdf), January, 2001.
United States Environmental Protection Agency (USEPA), 1996, “Test Methods for Evaluating Solid Waste,” SW-846, 3rd Ed., Office of Solid Waste and Emergency Response, Washington, DC.
United States Environmental Protection Agency (USEPA), 1997, Rules and Regulations, Federal Register, Vol. 62, No. 91, The Code of Federal Regulations, Title 40, Part 261, pp. 25998-26040, Office of the Federal Register, National Archives and Records Administration, Washington, DC.
United States Environmental Protection Agency (USEPA), 1998, Rules and Regulations, Federal Register, Vol. 63, No. 100, The Code of Federal Regulations, Title 40, Part 261, pp. 28556-28604, Office of the Federal Register, National Archives and Records Administration, Washington, DC.
United States Environmental Protection Agency (USEPA), 1999, “Identification and Listing of Hazardous Waste,” The Code of Federal Regulations, Title 40, Ch. 1, Part 261, Office of the
Chapter 6 References
REFERENCES
6-3
Federal Register, National Archives and Records Administration, Washington, DC.
United States Environmental Protection Agency (USEPA), 2001, “Land Disposal Restrictions: Summary Requirements,” EPA530-R-01-007, Offices of Solid Waste and Emergency Response & Enforcement and Compliance Assurance, Washington, DC (PDF copy available at: http://www.epa.gov/epaoswer/hazwaste/ldr/ldr-sum.pdf), October, 2001.
United States Environmental Protection Agency (USEPA), 2002a, “Municipal Solid Waste in the United States: 2000 Facts and Figures,” EPA530-R-02-001, Office of Solid Waste and Emergency Response, Washington, DC.
United States Environmental Protection Agency (USEPA), 2002b, Proposed Rules, Federal Register, Vol. 67, No. 113, pp. 40508-40528, Office of the Federal Register, National Archives and Records Administration, Washington, DC.
Vann, Kevin N., 2003, Leaching behavior of personal computer central processing units (CPUs) using standardized and modified toxicity characteristic leaching procedure (TCLP) tests. [Unpublished Master’s Thesis]. Gainesville, Florida: University of Florida.
Yang, G., 1993, “Environmental Threats of Discarded Picture Tubes and Printed Circuit Boards,” Journal of Hazardous Materials, Vol. 34, pp. 235-243.

Appendix A
A-1
Appendix A
Table A-1. Additional CPU Metals Analysis (ppm)
Sample Number
Ag As Ba Cd Cr Se
1 <0.06 <.011 1.456 0.0166 0.056 <0.008 2 <0.06 <.011 2.036 0.0117 0.036 <0.008 3 <0.06 <.011 1.051 0.0158 0.052 <0.008 4 <0.06 <.011 0.070 0.0153 0.061 <0.008 5 <0.06 <.011 0.080 0.0148 0.060 <0.008 6 <0.06 <.011 0.057 0.0142 0.056 <0.008 7 <0.06 <.011 0.078 0.0126 0.020 <0.008 8 <0.06 <.011 0.109 0.0085 0.024 <0.008 9 <0.06 <.011 1.582 0.0171 0.046 <0.008
10 <0.06 <.011 1.964 0.0142 0.037 <0.008 11 <0.06 <.011 1.636 0.1701 0.058 <0.008 12 <0.06 <.011 0.377 0.0188 0.017 <0.008 13 <0.06 <.011 1.291 0.0115 0.038 <0.008 14 <0.06 <.011 0.162 0.0137 0.037 <0.008 15 <0.06 <.011 0.121 0.0136 0.045 <0.008 16 <0.06 <.011 0.479 0.0052 0.182 <0.008 17 <0.06 <.011 1.908 0.0145 0.044 <0.008 18 <0.06 <.011 0.860 0.0215 0.041 <0.008 19 <0.06 <.011 0.352 0.0053 0.017 <0.008 20 <0.06 <.011 0.369 0.0029 0.015 <0.008 21 <0.06 <.011 1.747 0.0225 0.039 <0.008 22 <0.06 <.011 1.918 0.0171 0.052 <0.008 23 <0.06 <.011 1.231 0.0057 0.020 <0.008 24 <0.06 0.1076 1.323 0.0375 0.023 0.022 25 <0.06 0.1036 2.332 0.0048 0.032 0.027 26 <0.06 0.1351 1.505 0.0024 0.032 0.022 27 <0.06 <.011 0.511 0.0008 0.028 <0.008 28 <0.06 <.011 1.366 0.0050 0.058 <0.008 29 <0.06 <.011 1.655 0.0174 0.047 <0.008 30 <0.06 <.011 0.213 0.0061 0.019 <0.008 31 <0.06 <.011 0.452 0.0176 0.030 <0.008 32 <0.06 <.011 0.489 0.0043 0.028 <0.008 33 <0.06 <.011 2.197 0.0186 0.050 <0.008 34 <0.06 <.011 1.185 0.0241 0.029 <0.008 35 <0.06 <.011 0.491 <0.0003 0.027 <0.008 36 <0.06 <.011 0.721 0.0017 0.018 <0.008 37 <0.06 0.0656 1.210 0.0088 0.033 0.036 38 <0.06 0.0930 1.477 0.0073 0.022 0.028 39 <0.06 0.1097 0.312 0.0125 0.025 0.045 40 <0.06 0.0200 1.026 0.0089 0.029 0.020

Appendix A
Appendix A
A-2
Sample Number
Ag As Ba Cd Cr Se
41 <0.06 <.011 2.342 0.0013 0.050 <0.008 42 <0.06 <.011 0.087 0.0025 0.008 <0.008 43 <0.06 <.011 1.452 0.0155 0.044 <0.008 44 <0.06 <.011 1.186 0.0275 0.064 <0.008 45 <0.06 <.011 0.890 0.0176 0.018 <0.008 46 <0.06 <.011 0.482 0.0025 0.011 <0.008 47 <0.06 <.011 0.193 0.0085 0.021 <0.008 48 <0.06 <.011 <0.001 0.0079 0.015 <0.008 49 <0.06 0.0033 0.099 0.0019 0.037 <0.008 50 <0.06 0.0035 0.062 0.0022 0.009 <0.008 51 <0.06 -0.0008 0.094 0.0094 0.009 <0.008 52 <0.06 -0.0009 0.624 0.0014 0.012 <0.008 53 <0.06 -0.0007 1.046 0.0037 0.011 <0.008 54 0.24 -0.0094 0.184 0.0087 0.026 <0.008 55 <0.06 -0.0061 0.179 0.0045 0.025 <0.008 56 <0.06 -0.015 0.593 0.0078 0.021 <0.008 57 <0.06 -0.0011 0.314 0.0007 0.014 <0.008 58 <0.06 -0.0163 0.262 0.0131 0.024 <0.008 59 <0.06 -0.0056 0.141 0.0056 0.025 <0.008 60 <0.06 -0.0091 0.324 0.0079 0.031 <0.008 61 <0.06 0.0011 0.298 0.0014 0.017 <0.008 62 <0.06 -0.0027 0.234 0.0052 0.087 <0.008 63 <0.06 0.0009 0.243 0.0009 0.017 <0.008 64 <0.06 0.0014 0.151 0.0011 0.050 <0.008