Embed Size (px)
Citation preview

BY THE U.S. GENERAL ACCOUNTING OFFICE
Report To The Honorable Arlen Specter United States Senate
Natural Gas In Philadelphia: qources, Uses, And Prices
Natural gas prices Increased substantrally bath at the natronal level and In Phrl- adelphra during the past 8 years.
To provide Information on the natural gas situation In Phrladelphra from 1975 to 1983, G a R
0 focused on the munrcrpally owned d regulated drstrrbutron company, the
Phrladelphra Gas Works GAO obtained information on
--average revenue and expense of the Gas Works’ two major prpelrne company suppliers,
--average revenue and expense of the Gas Works Itself,
/ --prices paid by the Gas Works retarl ~ customers, and
--assistance to help the Gas Works’ resrdentral customers pay their bills
~ and conserve energy
124481
GAO/RCED-84-136
MAY 23. 1984

Request for copies of GAO reports should be sent to:
U.S. General Accountmg Offlce Document Handling and lnformatlon
Services Facility P.O. Box 6015 Galthersburg, Md. 20760
Telephone (202) 275-6241
The first five copies of mdivldual reports are free of charge. AddItIonal copies of bound audit reports are $3.25 each. Additional copses of unbound report (i.e., letter reports) and most other publications are $1.00 each. There will be a 25% discount on all orders for 100 or more copies mailed to a single address. Sales orders must be prepaid on a cash, check, or money order basis. Check should b&dade out to the “Superintendent of Docut#ents”.

UNITED STATES GENERAL ACCOUNTING OFFICE WASHINGTON, D.C. 20548
WiSOURhS. COMMUNITY. AND FlCONdMlC DEVLLOWENT
OWlSION
B-21 0099
The Honorable Arlen Specter United States Senate
Dear Senator Specter:
This report responds to your request for information on the I natural gas situation in Philadelphia, Pennsylvania.
As arranged with your office, unless you publicly announce its contents earlier, we plan no further distribution of this re- port until 30 days from the date of this report. At that time, we will send copies of this report to the Secretary of Energy; the Chairman, Federal Energy Regulatory Commission; and officials of Philadelphia Gas Works, Texas Eastern Transmission Corporation, and Transcontinental Gas Pipe Line Corporation. We will also make copies available to others upon request.
Sincerely yours,

, ,.

GENERAL ACCOUNTING OFFICE REPORT TO THE HONORABLE ARLEN SPECTER UNITED STATES SENATE
NATURAL GAS IN PHILADELPHIA: SOURCES, USES, AND PRICES
DIGEST ---w-e
Natural gas prices in the city of Philadel- phia, Pennsylvania, increased substantially in recent years. Gas users paid an average of $2.01 per thousand cubic feet of gas in the year ending June 30, 1975, and $7.16 in the year ending August 31, 1983. (See p. 22.)
Retail customers in the city are supplied by the Philadelphia Gas Works, a municipally owned company, which is regulated by the Philadelphia Gas Commission. Surrounding areas are served by other companies. The Gas Works is supplied primarily by two interstate natural gas transmission companies, Texas Eastern Transmission Corporation and Transcon- tinental Gas Pipe Line Corporation, which are regulated by the Federal Energy Regulatory Commission. (See p. 2.)
WHY THE REVIEW WAS MADE
At the request of Senator Arlen Specter, GAO analyzed reasons for price increases to the Gas Works' customers, as well as sources of gas for Philadelphia, uses of gas in Philadelphia, and programs to assist gas consumers there. GAO compiled and analyzed data from the Gas Works, its two major suppliers, and the government agencies that regulate these three companies. (See pp. 4 and 5.)
GAS USES IN PHILADELPHIA
The Gas Works had about 518,400 customers for the year ending August 31, 1983, and total sales of about 72.5 billion cubic feet. Most of its customers were residential. However, the relatively few industrial customers used large amounts of gas. (See pp. 7 through 9.)
Total sales and the number of customers fluc- tuated between 1975 and 1983, due to economic conditions, population trends, and the com- pany's policies on accepting new customers. Due to supply limits, the Gas Works restricted new sales during part of the period. However, the company now accepts new customers who meet its energy-efficiency standards. (See pp. 9 and 10.)
i GAO/RCED-84-135 Tear Sheet MAY 23, 1984

The company's sales rise and fall considerably during the course of a year. This is due largely to the high proportion of residential customers and their reliance on gas largely for heating. Thus, the winter,
sales are much higher in than in the summer. For example,
for the 12 months ending August 1983, the total sales level in the highest month (Febru- ary) was more than four times the sales level in the lowest month (July). (See pp. 10 and 11.)
GAS SOURCES FOR PHILADELPHIA
The Gas Works obtained nearly all of its sup- plies from Texas Eastern and Transcontinental pipeline companies between 1975 and 1983. The two companies supplied about 97 percent of the total in 1983. The Gas works also used sup- plemental gas sources , primarily to meet peak demand during the winter, when pipeline com- pany supplies were not sufficient to serve all customers. (See pp. 11 and 12.)
The pipeline companies, in turn, secured their supplies from various sources. Texas Eastern obtained gas in 1982 (the most recent year for which data are available) primarily from natural gas producers and other pipeline com- panies. primarily
Transcontinental obtained gas in 1982 from producers. (See we 16 through
18.)
GAS PRICES IN PHILADELPHIA
Gas prices increased to all types of users between 1975 and 1983. As noted, the overall average price per thousand cubic feet in- creased from $2.01 in 1975 to $7.16 in 1983. However, the average price per thousand cubic feet varied by type of customer. For example, in 1983 residential customers--whose supply is assured --paid an average of $7.56; businesses whose gas may be curtailed paid an average of $5.35. (See pp. 21 and 22.)
Prices to the company's customers increased to keep pace with the company's higher operating expenses. These expenses included (1) the cost of natural gas purchased from the two pipeline companies and other sources and (2) the cost of processing, distributing, and marketing the gas within Philadelphia; admin- istrative expenses; taxes; and depreciation. (See p. 19.)
ii
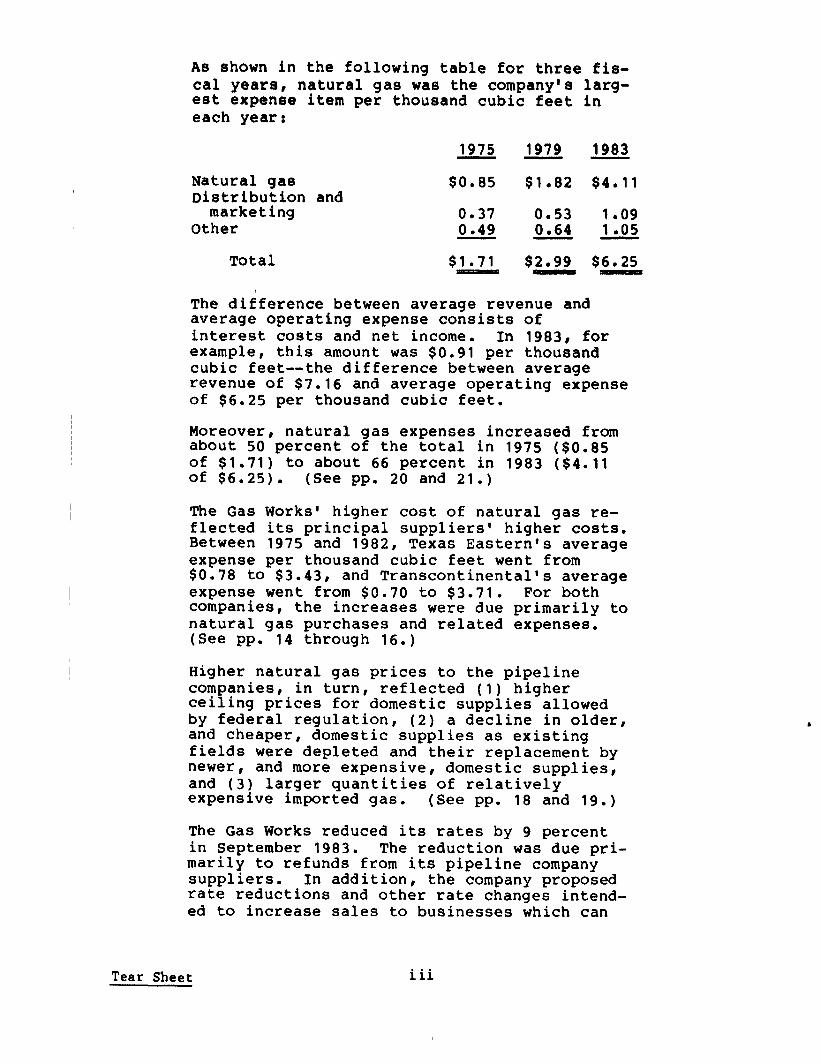
As shown in the following table for three fis- cal years, natural gas was the company's larg- est expense item per thousand cubic feet in each year:
Natural gas Distribution
marketing Other
Total
and
1975 1979 1983 - - -
$0.85 $1.82 $4.11
0.37 0.53 1.09 0.49 0.64 1.05 - -
$1.71 $2.99 $6.25
The difference between average revenue and average operating expense consists of interest costs and net income. In 1983, for example, this amount was $0.91 per thousand cubic feet --the difference between average revenue of $7.16 and average operating expense of $6.25 per thousand cubic feet.
Moreover, natural gas expenses increased from about 50 percent of the total in 1975 ($0.85 of $1.71) to about 66 percent in 1983 ($4.11 of $6.25). (See pp. 20 and 21.)
The Gas Works' higher cost of natural gas re- flected its principal suppliers' higher costs. Between 1975 and 1982, Texas Eastern's average expense per thousand cubic feet went from $0.78 to $3.43, and Transcontinental's average expense went from $0.70 to $3.71. For both companies, the increases were due primarily to natural gas purchases and related expenses. (See pp. 14 through 16.)
Higher natural gas prices to the pipeline companies, in turn, reflected (1) higher ceiling prices for domestic supplies allowed by federal regulation, (2) a decline in older, and cheaper, domestic supplies as existing fields were depleted and their replacement by newer, and more expensive, domestic supplies, and (3) larger quantities of relatively expensive imported gas. (See pp. 18 and 19.)
The Gas Works reduced its rates by 9 percent in September 1983. The reduction was due pri- marily to refunds from its pipeline company suppliers. In addition, the company proposed rate reductions and other rate changes intend- ed to increase sales to businesses which can
Tear Sheet iii

use other fuels. The Philadelphia Gas Sornyt;;ion approved these proposals on April
I . (See p. 23.)
ASSISTANCE TO GAS CONSUMERS
At the same time that natural gas prices were increasing, more customers had difficulty in paying their gas bills. Various federally funded or mandated and company-sponsored pro- grams were available to assist gas consumers. These included : (1) local restrictions on when service could be disconnected and provi- sions for restoration of service, (2) assist- ance to help customers pay their current bills, and (3) assistance in conserving en- ergy, to help lower future bills. (See pp. 25 through 29. )
AGENCY COMMENTS
GAO did not seek comments on the report from any federal agency. GAO offered the Gas Works an opportunity to comment on the draft report. The company did not submit any comments on the report, according to its representative, be- cause it had no objection to the analysis pre- sented. (See pp. 5 and 6.)
iv

Contents m----e--
DIGEST
Page
i
CHAPTER
1 INTRODUCTION Overview of the natural gas industry Distribution of natural gas in
Philadelphia Objectives, scope, and methodology
, Agency comments
2
3
4
Bcf
Btu
FERC
GAO I Mcf
Mmcf
NGPA
PGW
Tcf
NATURAL GAS USE AND SOURCES IN PHILADELPHIA 7 Gas use in Philadelphia 7 Gas sources for Philadelphia 11 Summary 12
NATURAL GAS PRICES IN PHILADELPHIA Prices paid by Philadelphia Gas Works'
pipeline suppliers Prices paid by Philadelphia Gas Works Prices paid by Philadelphia Gas Works'
customers Recent rate changes Summary
PROGRAMS TO ASSIST ENERGY USERS 25 Justification for assistance 25 Programs to provide assistance 26 Summary 29
ABBREVIATIONS
billion cubic feet
British thermal unit
Federal Energy Regulatory Commission
General Accounting Office
thousand cubic feet
million cubic feet
Natural Gas Policy Act of 1978
Philadelphia Gas Works
trillion cubic feet
1 1
14
14 19
2: 23


CHAPTER 1
INTRODUCTION
Substantial recent increases in natural gas prices and uncer- tainty about future prices have focused considerable congressional and public attention on natural gas issues. There has been con- tinuing debate involving the Congress, the administration, and the industry generally over what the national policy toward natural gas prices should be. The Congress is currently considering proposals to change federal regulation of natural gas pricing.
Increases in natural gas prices have significantly affected the consumers of gas, the companies that supply them, and the government agencies that regulate sales of natural gas. Consumers seek relief from higher fuel bills, the companies face declining consumption because of higher prices, and the regulatory agencies try to balance the interests of gas suppliers and users.
Natural gas accounted for nearly 26 percent of the energy consu ed in the united States in 1982, or 17.9 trillion cubic feet. T Overall, about 95 percent of this gas was produced domes- ticallyt the remainder was imported from Canada, Mexico, and Algeria.
Gas is used throughout the economy. Nationwide, industry accounted for about 38 percent of all gas use in 1982, and resi- dences accounted for about 26 percent. The other sectors are electric utilities (about 18 percent); commercial establishments (about 15 percent); and transportation uses (about 3 percent).
In Philadelphia, Pennsylvania, the pattern of gas use is much different. Residences consumed 64 percent of the gas sold in the year ending August 31, 1983, industrial establishments (in- cluding some large commercial users) accounted for 21 percent; commercial establishments accounted for 9 percent; and other gas users accounted for the remaining 6 percent.
OVERVIEW OF THE NATURAL GAS INDUSTRY
The natural gas industry is comprised of three sectors-- production, transmission, and distribution --that are physically
1Quantities of natural gas are often measured on the basis of volume . Frequently used measures include thousand cubic feet (Mcf), million cubic feet (Mmcf), billion cubic feet (Bcf), and trillion cubic feet (Tcf). Alternatively, gas may be measured on the basis of heat content, in terms of British thermal units gJ’s) l A million Btu’s are approximately equivalent to a
.
1 .

interconnected by a network of pipes throughout the United States. Companies in the three sectors may also be related to each other through corporate affiliations.
Producers include thousands of small, medium, and large firms that explore for, drill for, and produce gas. Texas, Louisiana, Oklahoma, New Mexico, and Kansas--in descending order--accounted for 87 percent of production in 1982.2 Gas produced in Pennsylvania accounted for less than 1 percent of total 1982 domestic production, or about 121 Ref. All domestic production is subject to federal price regulation, which is administered by the Federal Energy Regulatory Commission (FERC).3
Producers usually sell the new reserves they have developed to transmission, or pipeline, companies. They also sell some gas directly to distributors or end-users. Pipeline companies gener- ally purchase the gas-- under in the field,
negotiated contracts--from producers transport it to market, and sell it either to dis-
tribution companies or directly to large industrial and electric utility end-users.4
There were 139 interstate pipeline companies regulated by FERC as of February 1983, Included among these are the two com- panies that supply the city of Philadelphia: Texas Eastern Trans- mission Corporation (Texas Eastern) and Transcontinental Gas Pipe Line Corporation (Transco). Intrastate pipeline companies in the producing states are generally subject to state regulation.
Finally, there are almost 1,600 distribution companies throughout the nation. They are usually local public utilities, serving a specific market area, and under the jurisdiction of a state or local regulatory body. The distribution company for the city of Philadelphia is the Philadelphia Gas Works (PGW). It is regulated by the Philadelphia Gas Commission.
I 2Derived from Energy Information Administration, Natural Gas
=iY Nov* 1983, pp. 13-15. Data are estimates. Volumes of
non y rocarbon gases were excluded.
3Federal ceilings limit the prices that may be paid for almost all domestic production, but prices for a small proportion are
I not controlled. Production may also be subject to regulation at the state level, with respect to prices and levels of production.
lPipeline companies may produce some gas themselves and pur- chase gas from and resell to other pipelines. Some pipeline companies also provide a transportation service for customers that have their own gas supply.
2

Distributors purchase gas from pipeline companies and resell it to residential, commercial, and industrial customers. Prices paid by a distributor to a pipeline (known as wholesale or "city- gate" prices) depend on (1) field prices that are negotiated by the pipeline companies within regulatory limits and passed on to the customer and (2) delivery charges for transportation of the gas from the wellhead to the distributor.5 Distributors then deliver gas to the final consumer and charge a markup over their wholesale purchase price for their delivery services.
Different end-users may pay a distribution company various prices for natural gas, depending on the type of end-use (for example, residential, commercial, or industrial) and the type of service (for example, firm or interruptible supply).
DISTRIBUTION OF NATURAL GAS IN PHILADELPHIA
PGW is the gas distribution company for the city of Philadel- phia: the surrounding suburbs are served by other distributors. It is owned by the city and is operated by the Philadelphia Facilities Management Corporation (the Corporation)--a nonprofit corporation-- under the oversight and direction of the Philadelphia Gas Commission (the Commission). According to PGW, in its year ending August 31, 1983, it served over 518,000 customers, of which about 96 percent were residential, and had 2,630 employees and a total utility plant with a net value of about $407.4 million. The plant is comprised of facilities for the manufacture, storage, processing, and distribution of gas. PGW is the largest munici- pally owned gas distribution company in the country, according to an independent August 1980 management audit of PGW.
Under the agreement between Philadelphia and the Corporation, which became effective January 1, 1973, the city authorizes the Corporation to manage, operate
6 and maintain PGW for the sole and
exclusive benefit of the city. The management fee to the Cor- poration is equal to the actual cost of managing PGW but cannot exceed $300,000 annually. This limit has been in effect since
5Markup prices for interstate pipelines are generally deter- mined by the historical average cost of transmission and by the transportation profit margins allowed under FERC regulation.
6Prior to 1973, PGW was managed by the following: from 1841 to 1887, by a board of trustees appointed by the city; from 1887 to 1897, by the Director of Public Works; and from 1897 to 1972, by a private company, the United Gas Improvement Company.
3
January 1, 1979. The agreement also provides that all authority not specifically granted to the Corporation shall reside in the Commission.
The Commission is a quasi-judicial city agency responsible for regulating PGW. The Commission’s five members consist of the city controller, two members appointed by the city council, and two members appointed by the mayor. The Commission exercises such powers and performs such duties as provided in contracts between the city and the operator of PGW, or in the absence of a contract, as may be provided by ordinance. Some of the Commission’s powers and duties include access to and review of all PGW’s books, rec- ords, and accounts; approval of the annual operating budget; and approval of certain loans. In addition, the Commission has the power to fix rates and charges-- other than charges to the city and to the board of education, which are subject to city council approval. The rates fixed by the Commission are not subject to the jurisdiction of the Pennsylvania Public utility Commission, which regulates other gas distributors in the state.
Under the agreement with the Corporation, the city government retains the right to exercise a measure of control over certain of the actions related to the operation and management of PGW. For example, whereas the Commission reviews or approves gas supply contracts, the capital budget, and real property acquisitions for PGW, the city council has the final approval authority.
The agreement provides for PGW to make annual payments to the city out of its operating revenues. In PGW’s fiscal years 1975 through 1979, the company made yearly payments of $15.5 million; in fiscal year 1980 it paid $20 million; and in fiscal years 1981 through 1983, it paid $18 million annually.
The city government estimated that its ownership of the gas utility results in savings to gas consumers of about $36 million per year. These savings result from PGW’S exemption from certain federal and state taxes and generally from municipal entities* ability to borrow capital at a lower interest rate.
OBJECTIVES, SCOPE, AND METHODOLOGY
Based on a request from Senator Arlen Specter and subsequent discussions with his office, we obtained information on the nat- ural gas situation in Philadelphia, Pennsylvania. Specifically, we obtained information on gas consumption and supplies in Phila- delphia, the pricing of gas, and programs to assist energy consum- ers. We did not assess the economy, efficiency, or effectiveness of the activities of any government or private organization.

We conducted our review at PGW and the Commission. We ob- tained data from PGW on gas sales, revenues, and expenses for the period between July 1974 and August 1983. These data are present- ed in terms of PGW's fiscal year, which ran from July 1 to June 30 of the following year until fiscal year 1983. Fiscal year 1983 ran from September 1, 1982 to August 31, 1983. In addition, we obtained information on recent changes in PGW's rate structure.
We also held discussions with PGW officials and obtained documents on PGW's organization and operation and its relationship with the Commission and the city of Philadelphia. PGW designated the Manager of the Energy Planning and Forecasting Department to be its principal representative. Statements attributed to a PGW official refer to him. In addition, we contacted officials from the two pipeline companies serving PGW--Texas Eastern and Transco.
Data on pipeline gas purchases in general and on the pur- chases of Texas Eastern and Transco in particular were obtained from the Department of Energy's Energy Information Administration
head Purchase Several Alter Activities of Data on pipe1
nublications, An Analysis of-Pos #t-NGPA Interstate Pipeline 5: An Analysis of the Natural Gas Policy Act natives, Part III, September 1982, and Recen~t
Major Interstate P lipeline Companies, Jm ine operatinq revenues and expenses were obtained
Well and Mark
1984 Iet - .
from ann;ai Energy-Information Administration publications, en- titled Statistics of Interstate Natural Gas Pipeline Companies for the Years 1975 to 1982. These publications are based on the FERC Form-2, "Annual Report of Natural Gas Companies (Class A and B)," as filed by the company. These data are presented on a calendar year basis.
In addition, this report contains information from our previ- ous work in the natural gas area, specifically reports on Natural r,a?fi Price Tncreases: A Preliminarv Analvsis, (GAO/Rcnn-n?-76. w-W ----- ____- -_- - - _
1 .YIY VI ,“,
Dec. 9, 1982); Information on Contracts Between Natural Gas Producers and Pipeline Companies, (GAO/RCED-83-5, Feb. 22, 1983); and S ;tate and Local Responses to Natural Gas Price I ncreases, (GAG6
The financial data in this report are not adjusted for infla- tion. We did not independently verify any of the data obtained from PGW or from the Energy Information Administration publica- tions. Except as noted, this review was conducted in accordance with generally accepted government auditing standards.
AGENCY COMMENTS
Because the report does not relate directly to any federal agency8 we did not seek comments from any federal agency. We did, however, send the draft report to PGW for comment. The PGW official noted a few items that needed to be updated, which we did
5
where appropriate. According to PGW’s representative, PGW did not submit any overall written comments on the report, because it had no objection to the analysis presented.
Also, we discussed relevant portions of the report with representatives of Texas Eastern and Transco to verify the aCCUIIB- cy of information relating to each company. The representatives suggested a few clarifications, which we made.
CHAPTER 2
NATURAL GAS USE AND SOURCES IN PHILADELPHIA
PGW served about half a million customers and sold about 72 Bcf of gas in its fiscal year 1983. Although the volume of sales fluctuated between 1975 and 1983, the number of customers de- clined. Residential customers accounted for 96 percent of the total number of customers, but only 64 percent of total sales. Because of heating requirements, PGW's sales are much greater in the winter months than the summer months.
PGW obtains most of its gas from two interstate pipelines. To meet peak demand in the winter, it also relies on several sup- plemental sources. This chapter discusses where PGW obtains its gas supplies and how they are used. use patterns are discussed first because they affect PGW's choice of supply sources.
GAS USE IN PHILADELPHIA
PGW's sales fluctuated between 69.8 Bcf and 87.2 Bcf between its fiscal years 1975 and 1983, as shown in table 1. Most of the gas was sold to "firm" customers whose supply is assured regard- less of weather conditions. The balance of the sales was to "interruptible" customers whose supply can be interrupted when all available gas is needed by firm service customers, usually on extremely cold days.
Firm sales were as low as 59.8 Bcf in 1983 and as high as 71.3 Bcf in 1981. Interruptible sales were as low as 5.1 Bcf in 1977 and as high as 21.0 Bcf in 1980. As a proportion of total sales, firm sales accounted for as little as 76 percent in 1980 and as much as 93 percent in 1977. Interruptible sales ranged from 7 percent to 24 percent between 1975 and 1983 as a percentage of total sales.
Residential users bought most of the firm gas sold by PGW. They accounted for between 77 and 79 percent of the sales each year between 1975 and 1983. Commercial and industrial sales comprised about 15 percent of firm sales; municipal facilities and the housing authority comprised the remaining approximately 7 percent.
Total sales reflect both the number of customers and the average use per customer. Residential customers comprised about 96 percent of the total number in 1983; commercial customers, about 3 percent; and industrial customers, less than one-half of 1 percent. However, sales to residential customers represented about 64 percent of PGW's total sales; to industrial customers, about 21 percent; and to commercial customers, (including municipal and public housing authority) about 14 percent.
7
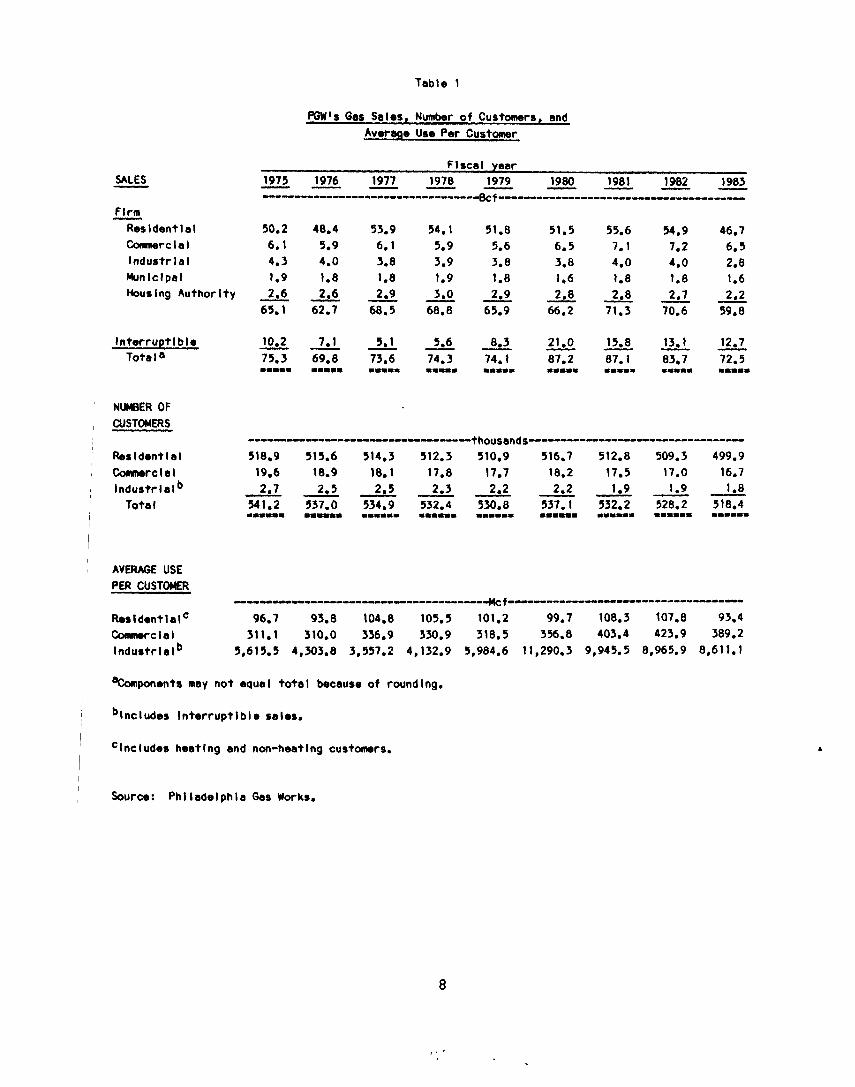
Table 1
POW's Gas Solos, Number of Customers, and
Average Use Per Customer
SALES
Firm ~sldentlsl
Gxmnerclal lndustrlal Flunlclpal HousIng Authority
Interruptible Total8
NUMBER OF CUSTOMERS
Rasldentlal cknnmwclsl Industrlslb
Total
AVERAGE USE PER CUSTOMER
ResldentlslC Ccnmwclal Industrlslb
Fiscal year 1975 1976 1977 1978 1979 1980 1981 -w-m- 1982 1983 - m m -
---------------,,-,,,,,,,,,-,,,,,,&f --------------------------------------
50.2 48.4 53.9 54.1 51.8 91.5 55.6 54.9 46.7
6.1 5.9 6.1 5.9 5.6 6.5 7.1 7.2 6.5 4.3 4.0 3.8 3.9 3.8 3.8 4.0 4.0 2.8 1.9 1.8 1.8 1.9 1.8 1.6 1.8 1.8 1.6
J-9$2,6 2.9 3.0 2.9 65.1 62.7 iic? 68.8
2.7 CT
2.8 2,8 2.2 66.2 71.3 70.6 755
10,2x 3.1 5.6 8.3 21.0 15.8 7J.6
13.1 12.7 7!5.3 69.8 74,3 74.1 87.2 87.1 TKF 72.5 1.1.. 1.1.. . . . . . 1.1.. 1.1.. 1.1.. 1.1.. 1.1.. 1.1..
-----------------------------thousands _--------------I-----------------
518.9 515.6 514.3 512.3 510.9 516.7 512.8 509.3 499.9 19.6 18.9 18.1 17.8 17.7 18.2 17.5 17.0 16.7 2.7 2.5 2.s 2.3 2.2 2.2 1.9 1.9 1.8
541.2 537.0 534.9 532.4 530.8 537.1 532.2 528.2 518.4 1.1.". 1.11.. . . . . . . 1.11.. 1.1. . . . . . . . . . . . . . . 111.111.. . . . . . .
--------------rr----------------------~f (111------------------C----------------
96.7 93.8 104.8 105.5 101.2 99.7 108.3 107.8 93.4 311.1 310.0 336.9 330.9 318.5 356.8 403.4 423.9 389.2
5,615.S 4,303.a 3,557.2 4,132.g 5,984.6 11,290.3 9,945.5 8,965.g 8,611.l
%mponents may not equal total because of roundlng.
blncludes Intwruptlbls sales.
I Clncludes haatlng and non-heatlng customers.
I Source: Phlladelphla GaS WOrkh
8
/’ ’ .

The number of PGW'S customers generally declined between 1975 and 1983. PGW had about 541,000 customers in 1975, and about 518,000 customers in 1983.
Fluctuations in the number of customers applied to residen- tial, commercial, and industrial customers alike, and reflected such factors as population changes, economic conditions, and hookup moratoriums, according to a PGW official. The overall decline in the number of residential customers was consistent with the city's population trends. According to census data, the city's population dropped from about 1.9 million in 1970 to about 1.7 million in 1980. According to a report' prepared for PGW, this decline in the city's population was expected to continue, with a resulting impact on the number of customers served by PGW. Another trend that may affect the number of PGW'S residential customers is the decline in the number of occupied dwellings, and thus, the number of potential gas customers. In 1970, there were 642,000 occupied dwellings; by 1980, the number of occupied dwellings had dropped to 620,000 units.
The decline in the number of commercial and industrial cus- tomers also reflected overall economic trends affecting the city, according to a PGW official. These included the shutting down of firms or their relocation to suburban areas, and--in the case of some industrial firms --switching to another fuel, such as residual fuel oil.
Year-to-year changes in the number of customers in part re- flect PGW's policies toward new customers. PGW imposed restric- tions on new customer service connections in November 1973 because of natural gas supply shortages. These shortages affected not only Philadelphia but many other gas-consuming areas. Until 1978, PGW allowed new gas sales only for new home construction custo- mers, and increases in usage were not permitted for current indus- trial and commercial customers.
In March 1978, PGW modified its policy on restricting new sales because of the increased availability of natural gas. Gas became available for all domestic and space heating requirements of residential customers, including the replacement of other heat- ing fuels. Gas also became available to meet processing or space heating requirements of commercial customers, as well as directly fired process requirements--up to 300 Mcf per day--of industrial customers.
During the period when the moratorium on gas hookups was suspended --March 1978 through December 1980--there were 38,568 conversions to gas service. Of these, 94 percent were conversions by existing, non-heating PGW residential customers who switched to
lReport by Gilbert Associates, Inc., to PGW, June 30, 1980, in connection with a proposed bond issuance.
9

gas primarily from oil or coal. This rate of conversion to gas far exceeded the rate prior to the imposition of the moratorium in November 1973. The average number of conversions in the 2 years prior to that date was about 4,000 per year.
Because the large increase in the residential demand from consumers wanting to switch to gas threatened to outstrip available gas supplies, PGW reimposed the restrictions on new gas sales in January 1981. Some relief from these restrictions was granted from May 1982 to early July 1982 when gas heating service was offered only to residential and small commercial customers converting from other energy sources to natural gas. In March 1983, the Commission approved PGW's plan to again offer gas heating service to residential and small commercial customers that wanted to convert to gas heat. New customers were required to have their buildings and homes inspected by PGW to be sure they comply with the company's energy efficiency standards. These standards include, among other things, insulated roofs, and caulking and weatherstripping in good condition.
Although there was a general decline in all customer groups since fiscal year 1975, there were some year-to-year increases. For example, the number of residential customers increased from about 511,000 in 1979 to about 517,000 in 1980.
Average use by customers in each class varied during the period from 1975 to 1983. Average residential use ranged from about 93 Mcf to about 108 Mcf, average commercial use ranged from 310 Mcf to about 424 Mcf, and average industrial use ranged from about 3,557 Mcf to about 11,290 Mcf. The wide variation in the average industrial use reflects the quantity of interruptible sales in a given year.
In addition to fluctuating somewhat from year to year, PGW's sales vary considerably during the course of a year. This is due largely to the high proportion of residential customers and their reliance on gas largely for heating. Highest monthly sales in fiscal year 1983 were recorded in February and totaled about 11,200 Mmcf as shown in table 2. Lowest sales in 1983 were rec- orded in July, and totaled about 2,400 Mmcf. Thus, the level of sales in the highest month was over four times the level in the lowest month. Residential sales varied much more than commercial and industrial sales. The level of residential sales in 1983 in the highest month was almost six times the level in the lowest month compared to about four and one-half times for commercial and about three times for industrial sales.
10
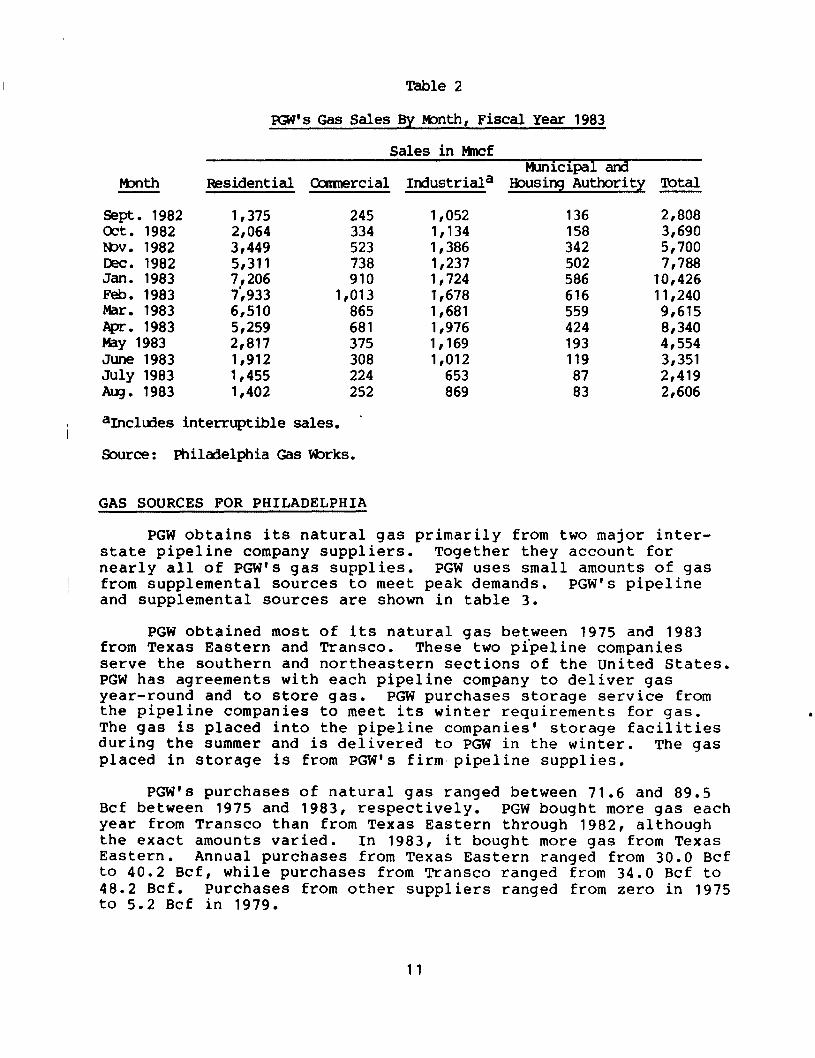
Table 2
#kJ's Gas Sales By lvbnth, Fiscal Year 1983
Month
Sales in Mncf Municipal and
Residential Cusnercial Industriala Housing Authority Total
Sept. 1982 1,375 Oct. 1982 2,064 NDV. 1982 3,449 Dec. 1982 5,311 Jan. 1983 Feb. 1983
7,206 7,933
Mar. 1983 6,510 Apr. 1983 5,259 May 1983 2,817 June 1983 1,912 July 1983 1,455 Aug. 1983 1,402
245 1,052 136 2,808 334 1,134 158 3,690 523 1,386 342 5,700 738 1,237 502 7,788 910 1,724 586 10,426
1,013 1,678 616 11,240 865 1,681 559 9,615 681 1,976 424 8,340 375 1,169 193 4,554 308 1,012 119 3,351 224 653 87 2,419 252 869 83 2,606
I aIncludes interruptible sales. '
Source: Philadelphia Gas mrks.
GAS SOURCES FOR PHILADELPHIA
PGW obtains its natural gas primarily from two major inter- state pipeline company suppliers. Together they account for nearly all of PGW's gas supplies. PGW uses small amounts of gas ~ from supplemental sources to meet peak demands. PGW's pipeline and supplemental sources are shown in table 3.
PGW obtained most of its natural gas between 1975 and 1983 from Texas Eastern and Transco. These two pipeline companies serve the southern and northeastern sections of the United States. PGW has agreements with each pipeline company to deliver gas year-round and to store gas. PGW purchases storage service from the pipeline companies to meet its winter requirements for gas. The gas is placed into the pipeline companies' storage facilities during the summer and is delivered to PGW in the winter. The gas placed in storage is from PGW's firmmpipeline supplies.
PGW's purchases of natural gas ranged between 71.6 and 89.5 Bcf between 1975 and 1983, respectively. PGW bought more gas each year from Transco than from Texas Eastern through 1982, although the exact amounts varied. In 1983, it bought more gas from Texas Eastern. Annual purchases from Texas Eastern ranged from 30.0 Bcf to 40.2 Bcf, while purchases from Transco ranged from 34.0 Bcf to 48.2 Bcf. Purchases from other suppliers ranged from zero in 1975 to 5.2 Bcf in 1979.
11
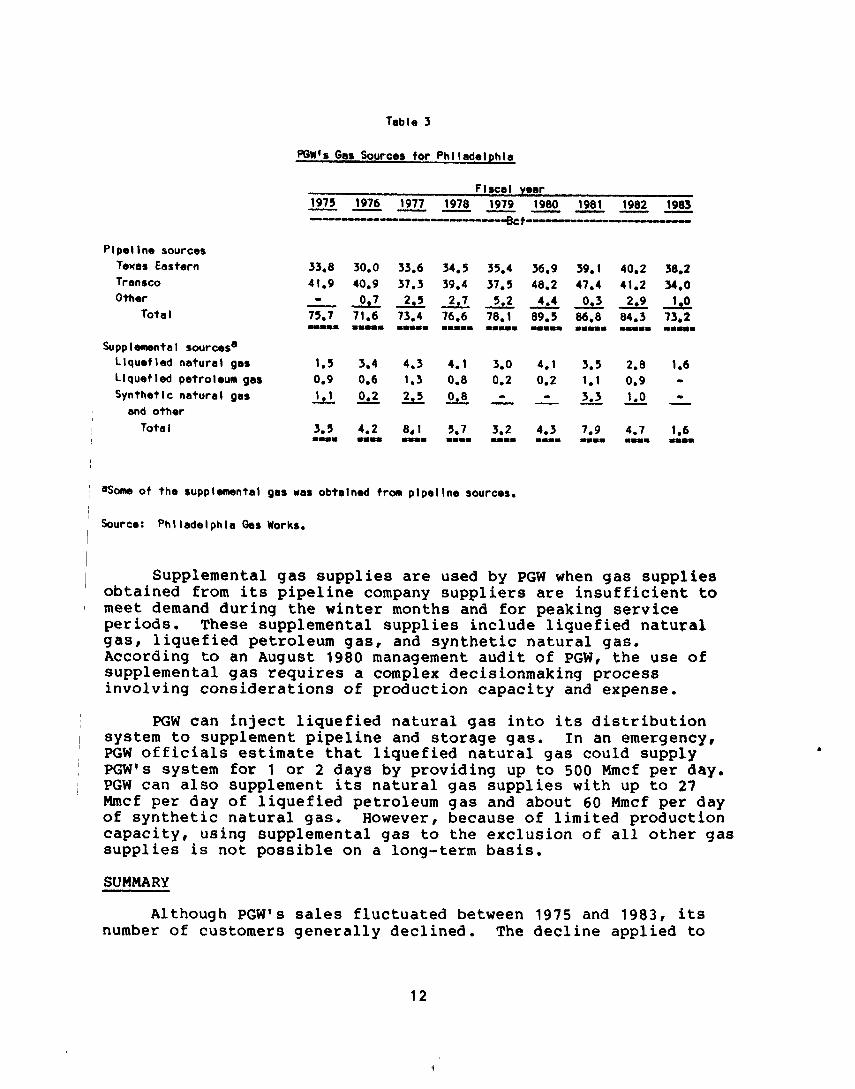
Table 3
p[iW'% gas Source8 for Phlladelphla
Plpellnb sources Taues Eastern Trsnrco Other
Total
Supplmental sourcesa Llpuefled natural gas Liquefied pstroleum gsr Synthetic natural gas
and othw I Total
Flscal war 1975 1976 1977 1978 1979 1980 m-m--- 1981 1982 1985 --- -------------------~f----~--=~
33.8 30.0 33.6 34.5 35.4 36.9 39.1 41.9 40.9 37.3 39.4 37.!5 40.2 47.4 F 0,7 71.6 2,s 2.7 73.4 76.6 78.1 5.2 G86.8 4.4 0.3
1.1. 11.1. 111.1 1111. 11.1. 11.1. 1.1111
1.9 3.4 4.3 4.1 3.0 4.1 3.9 0.9 0.6 1.3 0.8 0.2 0.2 1.1 .!d 22 L.2 Q --e - - 3.3
3.5 4.2 8,l 5.7 3.2 4.3 7.9 4.7 1.6 11.1. . . . . 1... 11.1 11.1 1.1. 1.1. . . . . 11.1
40.2 36.2 41.2 34.0
2,9 2 04.3 73.2 11.1. .."I
2.8 0.9 I 0 A
1.6 w
A
( %BIIO of the supplemental gas was obtalned from plpellne sourcese
i Source: Phlladelphla &s Works.
1 Supplemental gas supplies are used by PGW when gas supplies obtained from its pipeline company suppliers are insufficient to meet demand during the winter months and for peaking service periods. These supplemental supplies include liquefied natural gas, liquefied petroleum gas, and synthetic natural gas. According to an August 1980 management audit of PGW, the use of supplemental gas requires a complex decisionmaking process involving considerations of production capacity and expense.
PGW can inject liquefied natural gas into its distribution system to supplement pipeline and storage gas. In an emergency, PGW officials estimate that liquefied natural gas could supply PGW’s system for 1 or 2 days by providing up to 500 Mmcf per day. PGW can also supplement its natural gas supplies with up to 27 Mmcf per day of liquefied petroleum gas and about 60 Mmcf per day of synthetic natural gas. However, because of limited production capacity, using supplemental gas to the exclusion of all other gas supplies is not possible on a long-term basis.
SUMMARY
Although PGW’s sales fluctuated between 1975 and 1983, its number of customers generally declined. The decline applied to
12
all customer classes alike and reflected such factors as popula- tion changes and economic conditions.
PGW’s large proportion of residential customers and their reliance on gas for heating was reflected in much greater sales during the winter months. During peak winter use, PGW may supple- ment natural gas purchases from its pipeline suppliers--Texas Eastern and Transco-with liquefied natural gas, liquefied petro- leum gas, and synthetic natural gas.
13
CHAPTER 3
NATURAL GAS PRICES IN PHILADELPHIA
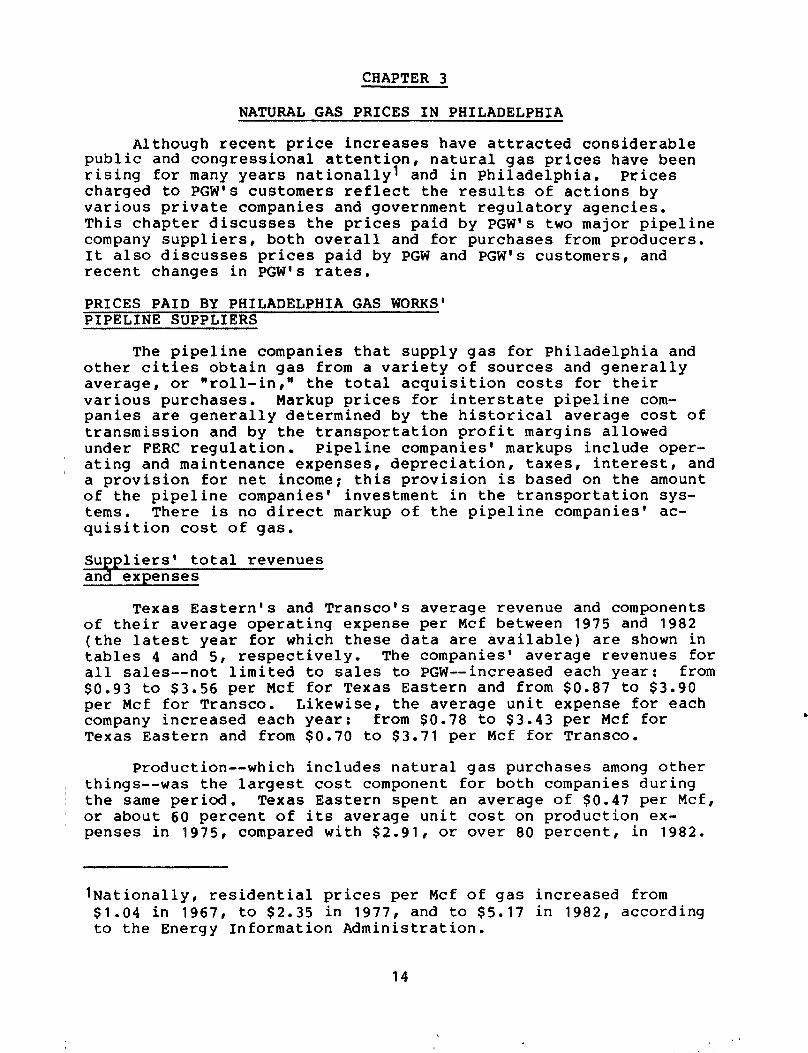
Although recent price increases have attracted considerable public and congressional attention, natural gas prices have been rising for many years nationally' and in Philadelphia. Prices charged to PGW's customers reflect the results of actions by various private companies and government regulatory agencies. This chapter discusses the prices paid by PGW's two major pipeline company suppliers, both overall and for purchases from producers. It also discusses prices paid by PGW and PGW's customers, and recent changes in PGW's rates.
PRICES PAID BY PHILADELPHIA GAS WORKS' PIPELINE SUPPLIERS
The pipeline companies that supply gas for Philadelphia and other cities obtain gas from a variety of sources and generally average, or "roll-in," the total acquisition costs for their various purchases. Markup prices for interstate pipeline com- panies are generally determined by the historical average cost of transmission and by the transportation profit margins allowed under FERC regulation. Pipeline companies' markups include oper- ating and maintenance expenses, depreciation, taxes, interest, and a provision for net income; this provision is based on the amount of the pipeline companies' investment in the transportation sys- tems. There is no direct markup of the pipeline companies' ac- quisition cost of gas.
Suppliers' total revenues and exwenses
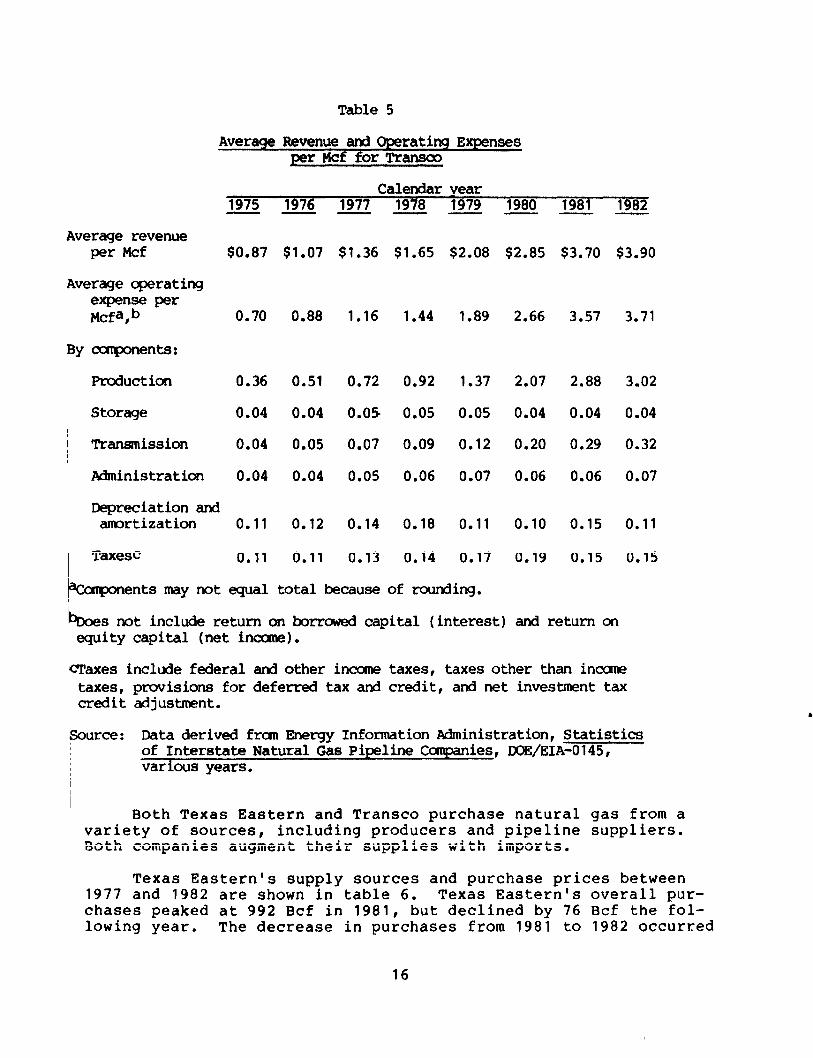
Texas Eastern's and Transco's average revenue and components of their average operating expense per Mcf between 1975 and 1982 (the latest year for which these data are available) are shown in tables 4 and 5, respectively. The companies' average revenues for all sales-- not limited to sales to PGW--increased each year: from $0.93 to $3.56 per Mcf for Texas Eastern and from $0.87 to $3.90 per Mcf for Transco. Likewise, the average unit expense for each company increased each year: from $0.78 to $3.43 per Mcf for Texas Eastern and from $0.70 to $3.71 per Mcf for Transco.
Production --which includes natural gas purchases among other things--was the largest cost component for both companies during the same period. Texas Eastern spent an average of $0.47 per Mcf, or about 60 percent of its average unit cost on production ex- penses in 1975, compared with $2.91, or over 80 percent, in 1982.
INationally, residential prices per Mcf of gas increased from $1.04 in 1967, to $2.35 in 1977, and to $5.17 in 1982, according to the Energy Information Administration.
14
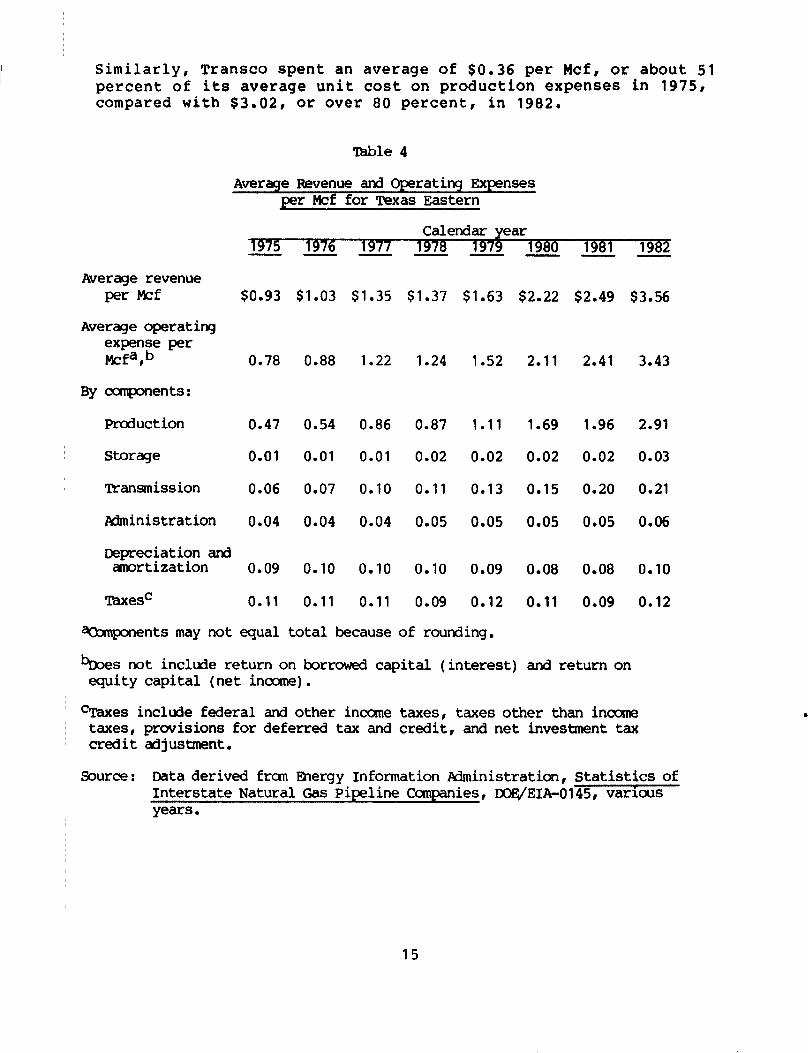
Similarly, Transco Spent an average of $0.36 per Mcf, or about 51 percent of its average unit cost on production expenses in 1975, compared with $3.02, or over 80 percent, in 1982.
Average revenue per Mcf
Average operating expense per Mcfa,n
By ccmponents:
Production
Storage
Transmission
Administration
Tbble 4
Average Revenue and Operating Expenses per Mcf for Texas Eastern
1976 1977 v-p--
$0.93
0.78
0.47
0.01
0.06
0.04
Depreciation and amortization 0.09
mxesC 0.11
$1.03
0.88
0.54
0.01
0.07
0.04
0.10
0.11
$1.35
1.22
0.86
0.01
0.10
0.04
0.10
0.11
$1.37 $1.63 $2.22 $2.49 $3.56
1.24 1.52 2.11 2.41 3.43
0.87
0.02
0.11
0.05
1.69 1.96 2.91
0.02 0.02 0.03
0.15 0.20 0.21
0.05 0.05 0.06
0.10
0.09
1.11
0.02
0.13
0.05
0.09
0.12
0.08 0.08
0.11 0.09
0.10
0.12
vents may not equal total because of rounding.
bs not include return on borrowed capital (interest) and return on equity capital (net income).
?Taxes include federal and other income taxes, taxes other than incans taxes, provisions for deferred tax and credit, and net investment tax credit adjustment.
Source : Data derived fran Energy Information Administration, Statistics of Interstate Natural Gas Pipeline Companies, DOE/EIA-0145, various years.
15
Average revenue per Mcf
Average -rating expense per Mcfa,b
By cupnents:
Production
Storage
Transmission
Administration
Table 5
Average Revenue and Operating Expenses per Mcf for Transoo
Calendar year 1975 1976 1977 1978 1979 1980 e-- ---
$0.87
0.70
0.36
0.04
0.04
0.04
Depreciation and amortization 0.11
Taxesc 0.11
bents may not equal
$1.07
0.88
0.51
0.04
0.05
0.04
0.12
0.11
$1.36 $1.65 $2.08 $2.85 $3.70 $3.90
1.16 1.44 1.89 2.66 3.57 3.71
0.72 0.92
0.05 0.05
0.07 0.09
0.05 0.06
2.07 2.88 3.02
0.04 0.04 0.04
0.20 0.29 0.32
0.06 0.06 0.07
0.14
0.13
0.18
0.14
1.37
0.05
0.12
0.07
0.11
0.17
0.10
0.19
0.15
0.15
0.11
0.15
total because of rounding.
1981 191Jz
bDoe s not include return on borrowed capital (interest) and return on eguity capital (net inccme).
lcraxes include federal and other incane taxes, taxes other than incane taxes, provisions for deferred tax and credit, and net investment tax crdit adjustment.
Source: Data derived fran Bnergy Information Administration, Statistics of Interstate Natural Gas Pipeline Canpanies, BOB/EIA-0145, various years.
Both Texas Eastern and Transco purchase natural gas from a variety of sources, including producers and pipeline suppliers. Both companies augment their supplies with imports.
Texas Eastern's supply sources and purchase prices between 1977 and 1982 are shown in table 6. Texas Eastern's overall pur- chases peaked at 992 Bcf in 1981, but declined by 76 Bcf the fol- lowing year. The decrease in purchases from 1981 to 1982 occurred
16

in all categories except company-owned production, which remained the same. In 1981 and 1982, purchases from producers represented about half of Texas Eastern's total purchases and purchases from other sources about 46 percent. Natural gas imports increased to 33 Bcf in 1981, but decreased slightly the next year.
The average unit price Texas Eastern paid for all purchases ~increased from $0.84 per Mcf in 1977 to $2.63 in 1982. In the !same time period, the average price of its domestic purchases rose 'from $0.61 to $1.57 per Mcf, and the average price of imports and other sources rose from $1.25 to $3.77 per Mcf.
Table 6
TRxas Eastern's Pipeline Supplies and,~urchase Prices
Calendar year category P 1977 - 1978 - 1979 - 1980 1981 1982 - -
~ supply volunes (Bcf) Producer contracts 566 571 573 543 493 470 Imports 2 - - 19 33 29 Owned production 30: 3 3703 393 2 2 Other purchases 296 464 415
lbtal 880 870 946 962 992 916 - - - - -
Aver-e prices (per Mcf) Producer contracts $0.61 $0.62 $0.78 $1.03 $1.20 $1.57 Imports and other
sources 1.25 1.33 1.89 2.37 3.00 3.77
Tbtala 0.84 0.86 1.21 1.60 2.11 2.63
aWeighted average.
Source: Energy Information Administration, An Analysis of Post-NGPA Interstate Pipeline Wellhead Purchases, DOUEIA-0357, Sept. 1982, p. 125 and Becent Market Activities of Major Interstate Pipeline Cci&nies, DOE;/EIA-0440, Jan. 1984, p. 213.
Transco's supply sources and purchase prices between 1977 and 1982 are shown in table 7. Transco's purchases increased stead- ily, reaching a total of 986 Bcf in 1982. During this time iperiod, Transco bought about 95 percent of its gas directly from producers. The remaining purchases were from other sources, such as pipeline suppliers. Transco had no company-owned production.
The average unit price Transco paid for all purchases in- creased from $0.65 per Mcf in 1977 to $3.20 in 1982. In the same period, its domestic prices rose from $0.64 to $3.16 per Mcf, and imports and other sources rose from $0.78 to $4.06 per Mcf.
17

.
range of prices exists. For example, in December 1978, 1 month after enactment of NGPA, the price for certain old gas was about $0.34 per million Btu's-- roughly equivalent to an Mcf--and for certain categories of new natural gas, about $2.08 per million Btu's. In March 1984, the NGPA prices for these categories were ~$0.50 and $3.63 per million Btu's, respectively.
The effect of rising ceiling prices is magnified by the con- tinuing depletion of old and low-priced gas, and its replacement by new, more expensive gas. To maintain a stable supply, the con- tinuing depletion of existing gas reservoirs is balanced by the addition of new reservoirs. This turnover can lead to higher average prices because production from the newer reservoirs gener- ally commands a higher price.
Another factor affecting increasing natural gas prices is imported gas purchases , primarily from Canada but also from Mexico and Algeria. Imports have constituted about 5 percent of total national supplies in the last few years, and a higher or lower proportion for some pipelines and distributors. However, PGW's pipeline suppliers relied on imports for about 3 percent of their ~sales since 1981. Although quantities of imported gas on the ~national level changed little between 1978 and 1982, the prices increased significantly. The price of imports was above the average wellhead price of domestic gas during these years.2
,PRICES PAID BY PHILADELPHIA GAS WORKS
Prices paid by a distributor to a pipeline company depend on (1) field prices that are negotiated, within regulatory limits, between producers and pipeline companies and passed through to the distributor and (2) delivery charges for transporting the gas from Jthe wellhead to the distributor. FERC regulates the setting of itariffs, or rates, that may be charged by interstate pipeline com- panies. Pipeline companies are generally allowed to charge their Icustomers a rate that enables them to recover operating expendi- itures and to earn a fair and reasonable rate of return on their pipelines and other investments.
Distributors deliver gas to the final consumer and charge a tyrkup over their wholesale purchase price for their delivery ser-
bP ces. Like the pipeline companies, distributors' markups include erating and maintenance expenses, depreciation, taxes, interest,
pnd a provision for net income; this provision is based on the /amount of distributors' investment in their delivery systems.
2Additional details on the reasons for recent increases are pro- vided in Natural Gas Price Increases: A Preliminary Analysis (GAO/RCED-83-76, Dec. 9, 1982). Information presented in that report generally relates to the nation as a whole and is not di- rectly related to the pipelines and distributor serving Philadel- phia.
19

The purchase of natural gas was the largest component of PGW's operating expenses and increased from an average of $0.85 per Mcf in 1975 to $4.11 per Mcf in 1983. Natural gas purchases represented about 50 percent of PGWls total operating expenses in 1975 ($0.85 of $1.71) and 66 percent in 1983 ($4.11 of $6.25). The next largest expense components in 1983 were distribution, administrative and general, and marketing.
Data for average unit expense indicate only general trends and not exact expenditures. Although sales volumes may expand or contract, certain distribution costs remain relatively unchanged. For example, administrative and general expenses do not increase much if sales increase, nor do they decrease much if sales de- crease. Moreover, the average cost per unit of gas sold varies according to the volume of gas sold. Decreased sales mean fewer units over which a company is able to recover its costs, and thus a higher unit cost. Conversely, increased sales volumes mean more units over which a company recovers its costs, and thus a lower unit cost.
PRICES PAID BY PHILADELPHIA GAS WORKS' CUSTOMERS
PGW offers various types of natural gas service to its customers. As explained on page 7, service to firm customers is assured, while service to interruptible customers may be inter- rupted when gas is needed for firm service. Firm gas sales to residential, commercial, and industrial customers for heating and non-heating uses are sold under a general service rate. This rate applied to about 95 percent of PGWls customers and accounted for about 82 percent of the gas sold in 1983. The rate is a declining block rate structure, whereby the unit cost decreases as usage increases. There is also a minimum monthly charge for heating only customers regardless of the amount of gas used.
PGW also offers several interruptible services. Large volume industrial and commercial customers using over 5,000 Mcf per day must switch to an alternate fuel if the average daily temperature drops below 10 degrees Fahrenheit and no gas is available. Boiler and power plant use is interrupted when the temperature falls be- low 18 degrees Fahrenheit and restored when the temperature rises to 23 degrees Fahrenheit. A PGW official estimated that these customers are typically curtailed for about 5 days each winter. The rate for the large volume customers is 90 percent of the charge applicable to the lowest step of the general service rate; for boiler and power plant users, it is 94 percent of the lowest step of the general service rate.
Another interruptible service-- the load balancing service-- is available to multi-family residential, commercial, and indus- trial customers. These customers receive gas only when PGW's firm and other priority requirements are met, usually only during the warmer months of the year, from April through October. The rate for load balancing service is set each month and based on the
21

RECENT RATE CHANGES
PGW received approval from the Commission to reduce its rates by about 9 percent beginning September 1, 1983. PGW officials attributed this reduction primarily to a refund from its pipeline company suppliers.
In November 1983, PGW proposed four rate changes with the Philadelphia Gas Commission which were approved on April 6, 1984. According to a PGW news release, these changes were designed to retain large volume commercial and industrial customers and to attract new customers.
PGW offerbd an economic development discount of 15 percent for up to 3 years to new and existing large volume users that ex- pand their facilities. Such customers must agree to use a minimum 1,500 Mcf of gas per month. In addition to this discount, PGW made three changes in its gas service tariff. For large volume commercial and industrial customers, PGW effected a 5-percent reduction in the rate currently paid by such customers.
PGW also began to use a flexible rather than a fixed rate for its boiler and power plant users. The flexible rate is linked to the price of distillate (No. 2) fuel oil, the alternate fuel that many large customers can switch to when the energy-equivalent price is lower than that of natural gas. Lastly, PGW made perma- nent its industrial rate to customers using a minimum 6,000 Mcf per month.
( SUMMARY
PGW's primary suppliers-- Texas Eastern and Transco--obtain I their gas from a variety of sources and generally average their
acquisition costs. Both pipeline companies' average price from all of their purchases increased steadily between 1977 and 1982. Among Texas Eastern's and Transco's expenses, production--which includes natural gas purchases-- was the largest cost component. For both pipeline companies, it represented over 80 percent of their average unit cost in 1982. These higher prices reflect changing federal regulation, depleted older and cheaper gas reser-
~ voirs, and other reasons. PGW also paid more for the gas it ~ bought from Texas Eastern and Transco, and the purchase of natural ~ gas represented about 66 percent of PGW's total operating expenses I in 1983.
I I All of PGW's customers on both firm and interruptible service
experienced higher retail prices for natural gas. Municipal cus- tomers experienced the highest percentage increases in prices bet- ween 1975 and 1983; users on interruptible service, the lowest.
PGW reduced its rates by about 9 percent beginning Septem- ber 1, 1983, primarily because of refunds from its pipeline
23

CHAPTER 4
PROGRAMS TO ASSIST ENERGY USERS
The average PGW residential heating customer's gas bill increased more on a percentage basis than did the income of an average Philadelphia resident in recent years. During this period, growing numbers of customers did not pay their bills in full, and some of them had their service disconnected.
A variety of PGW and federally funded programs are availa- ble to address these problems. These include: (1) regulations on when service may be disconnected and when it is to be recon- nected, (2) assistance to customers to help them pay their cur- rent bills, and (3) assistance in conserving energy, to help lower future bills.
JUSTIFICATION FOR ASSISTANCE
The annual gas bill for the average heating only residen- tial customer of PGW increased from $288 in 1975 to $869 in 1983, as shown in table 10. This average increase of about 15 percent a year was not due to an increase in the use of gas, but rather to the higher per unit cost for gas. Average annual con- sumption ranged from 111 to 142 Mcf between 1975 and 1983.
During this period, the average personal income of Phila- delphia residents increased as well, but not as fast as gas bills. Annual per person income increased from $5,732 in 1975 to $9,901 in 1981 --the most recent year for which data are available, or about 9.5 percent a year. (These income data refer to all sources of personal income--including salaries, wages, transfer payments, interest, and dividends--and to all city residents-- not just to PGW customers.)
During these years, PGW customers encountered greater difficulty in paying their gas bills. The number of delinquent accounts increased overall from approximately 173,000 in 1975 to 293,000 in 1983, and peaked at about 353,000 in 1981. The total amount owed also increased from about $7.7 million to $35.1 million from 1975 through 1983, and reached a high of $41.3 million in 1982. PGW increased its provision for uncollectible accounts (an accounting reserve) from about $2.4 million in 1975 to $24.6 million in 1983. It reached a high of $32.1 million in 1982.
25

Service terminations and reconnections
Each year, PGW terminates service to a number of customers who did not pay their bills. However, according to regulations approved by the Commission, PGW must first properly notify and afford the customer the right to a review. Moreover, PGW is not to terminate service on (1) Friday, Saturday, or Sunday, (2) a bank holiday or the day preceding a bank holiday, (3) a holiday observed by PGW or the day preceding such holiday, or (4) a working day when the forecasted low temperature is 32 degrees Fahrenheit or lower.
A customer'whose service has been disconnected can have service restored, according to the regulations, when the cus- tomer pays the past due balance or agrees to pay the bill in installments. Such an agreement requires a down payment and repayment of the balance over a specified number of months. In addition, PGW may require a security deposit equal to two times the average monthly bill.
In September 1983, the Commission authorized PGW to offer a Limited Service Program to former gas heating customers whose service was terminated for non-payment. Although eligible cus- tomers are not required to pay already delinquent gas bills, they must agree to pay for gas used under the S-month program. Customers must also agree to maintain an indoor temperature no higher than 55 degrees Fahrenheit, use only one burner on a gas range, and operate no other gas appliances.
Assistance in paying bills
Both PGW and the federal government help some customers pay their gas bills. PGW offers lower prices to elderly customers, while the federal government provides payments to certain low- income persons.
The Philadelphia City Council amended the management agree- ment with PGW in 1973 to provide for a 20-percent discount to ~a11 PGW residential customers aged 65 years or older. According to PGW, this discount policy was instituted in response to the need of many elderly customers who were living on limited in- comes and were having difficulties meeting their bills because of rising gas prices.
This program grew substantially. In 1973, the total amount of discount allowed was $0.5 million. In fiscal year 1983, the total discount allowed was about $13.9 million, and over 104,000 residential accounts benefited from the discount policy. Ac- cording to PGW, this discount is funded by a small increase in other customers' bills.
realized through the purchase and installation of conservation measures.
PGW announced its program in June 1981 and by the end of June 1983 had received requests for 1,925 audits and had com- pleted 1,850 audits. PGW estimates that the cost of each audit is $135, but the federal law as amended allows a utility to charge a customer no more than $15-which is the amount PGW charges. The remaining costs are added to PGW’s operating costs and recovered from all customers.
Moreover, PGW and cooperating neighborhood agencies sponsor home energy “workshops” at three locations in the city. These workshops serve as training centers where consumers are taught the skills needed to use low-cost materials and no-cost techni- ques to reduce energy consumption, including weatherstripping around windows and doors, caulking, and insulating water heaters. The instructors are PGW-trained volunteers.
Further, PGW started a "Winterwise" program in June 1980. Under this program PGW sells and installs blown-in roof insula- tion, vent dampers for gas heaters and water heaters, and set-
~ back clock thermostats. PGW offers a S-year, no-interest ~ financing plan to buyers. Through August 1983, PGW had ~ installed over 9,400 conservation measures with an aggregate
value of $2.6 million.
Finally, federal funding has been available through the Energy Conservation and Production Act (Public Law 94-385) to help “weatherize” the homes of low-income families. About 4,700 homes in the city received such improvements as roof or attic insulation, weatherstripping, caulking, and storm doors and windows during fiscal year 1983.
SUMMARY
To help energy customers cope with rising prices, PGW and ~ the federal government provide various forms of assistance. To
help customers pay their bills, PGW provides a discount for ~ elderly customers and federal grants are given to PGW to help
defray the bills of certain low-income households. To help cus- tomers reduce their future bills, PGW offers energy audits, in- struction on installing low-cost conservation measures, and help in financing conservation measures, and federal funding pays for
~ certain fuel-saving improvements.
(308535)
29

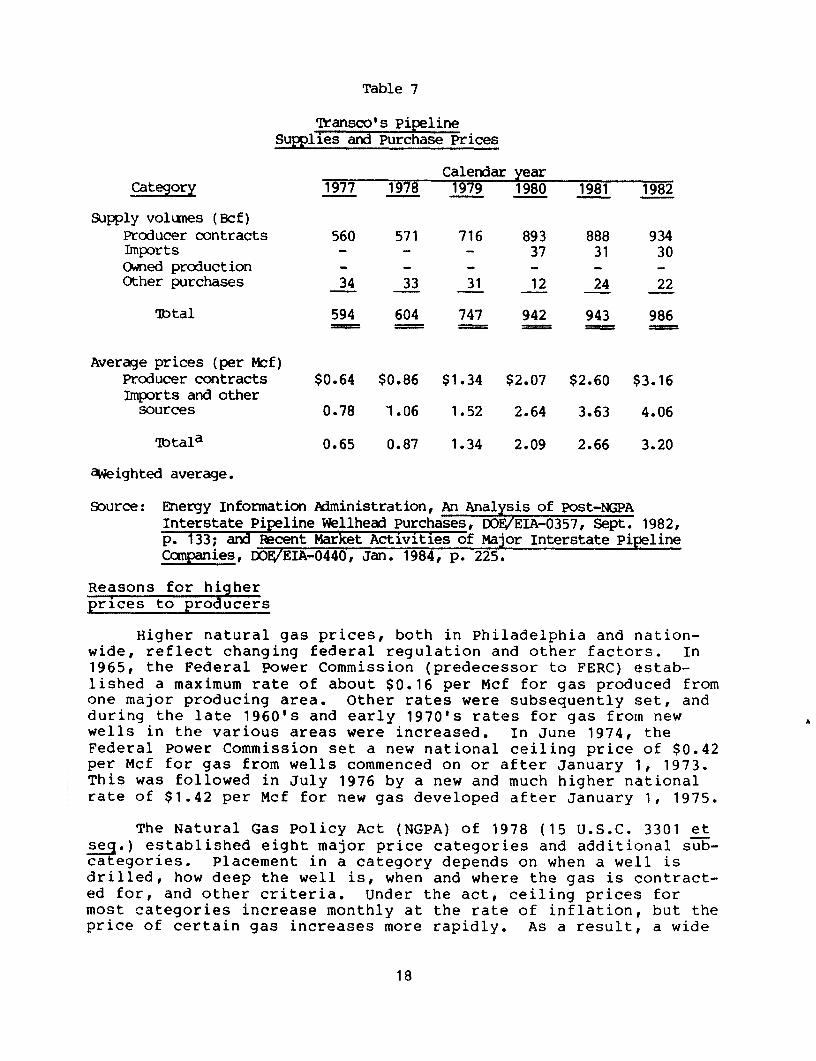
Table 7
Transco's Pipeline Supplies and Purchase Prices
category
Supply volumes (Hcf) Producer contracts Imports Owned production Other purchases
Tbtal
Average prices (per Mcf) Producer contracts Imports and other
sources
Tbtala
Calendar year 1977 1979 1979 1980 1981 1982 - - - -
560 571 716 893 888 934 37 31 30
33 31 12 24 22
604 747 942 943 986
$0.64 $0.86 $1.34 $2.07 $2.60 $3.16
0.78 1.06 1.52 2.64 3.63 4.06
0.65 0.87 1.34 2.09 2.66 3.20
Weighted average.
Source: Energy Information AdminiStratiOn, An Analysis Of Post-NGpA Interstate Pipeline Wellhead Purchases, DOE/EIA-0357, Sept. 1982,
133; and Recent Market Activities of Major Interstate Pipeline &npanies, DOVEIA-0440, Jan. 1984, p. 225.
Reasons for hiaher prices to producers
Higher natural gas prices, both in Philadelphia and nation- wide, reflect changing federal regulation and other factors. In 1965, the Federal Power Commission (predecessor to FERC) estab- lished a maximum rate of about $0.16 per Mcf for gas produced from one major producing area. Other rates were subsequently set, and during the late 1960's and early 1970's rates for gas from new wells in the various areas were increased. In June 1974, the Federal Power Commission set a new national ceiling price of $0.42 per Mcf for gas from wells commenced on or after January 1, 1973. This was followed in July 1976 by a new and much higher national rate of $1.42 per Mcf for new gas developed after January 1, 1975.
The Natural Gas Policy Act (NGPA) of 1978 (15 U.S.C. 3301 et seq.) established eight major price categories and additional sz- categories. Placement in a category depends on when a well is drilled, how deep the well is, when and where the gas is contract- ed for, and other criteria. Under the act, ceiling prices for most categories increase monthly at the rate of inflation, but the price of certain gas increases more rapidly. As a result, a wide
18

There is no direct markup of the distributors* acquisition price of gas.
By agreement between the city of Philadelphia and the Phila- delphia Facilities Management Corporation, PGW’s annual revenues must be sufficient to pay for all expenses incurred in the operation and maintenance of PGW; make annual payments to the city of Philadelphia; and meet other financial obligations, such as interest and amortization payments on its debt.
PGW’s average operating expense per Mcf increased steadily, from $1.71 in 1975 to $6.25 in 1983, as shown in table 8.
Table 8
PGW’S Average Cperating Dxpense, By Canponent
Fiscal 3975
year 1976 1977 1978 1979 1980 1981 1982 1983 w---v----
lberage operating expense per &f”,b
By ccmponents:
Natural gas Other raw
materials Gas processing EhrketingC Distributiond Wministrative
and generale Taxes Depreciation
$1.71 $2.01 $2.56 $2.56 $2.99 $3.26 $4.66 $5.23 $6.25
0.85 1.04 1.31 1.42 1.82 2.15 2.83 3.25 4.11
0.12 0.07 0.21 0.10 0.02 0.02 0.43 0.21 0.07 0.11 0.13 0.15 0.16 0.18 0.18 0.25 0.24 0.24 0.22 0.26 0.26 0.27 0.30 0.28 0.30 0.35 0.43 0.15 0.19 0.28 0.22 0.23 0.22 0.36 0.58 0.66
0.15 0.18 0.21 0.25 0.29 0.26 0.31 0.40 0.48 0.02 0.03 0.03 0.03 0.04 0.04 0.05 0.05 0.06 0.09 0.10 0.11 0.10 0.11 0.11 0.13 0.15 0.19
aOamponents may not equal total due to rounding.
bax?s not include interest cost and net in-.
CIncludes custaner service, customer relations, custaner accounting, ard marketing.
dIncludes collection and meter reading.
eIncludes pensions.
Sxnxe: Philadelphia Gas Works.
20
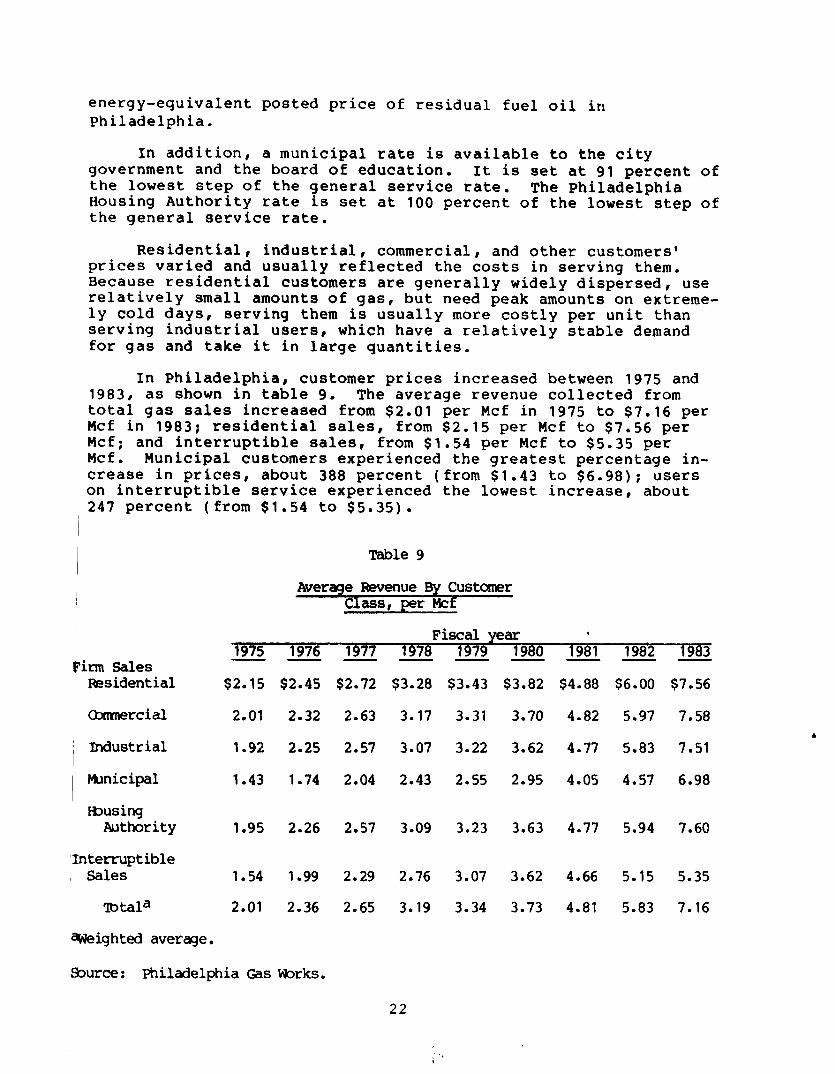
energy-equivalent posted price of residual fuel oil in Philadelphia.
In addition, a municipal rate is available to the city government and the board of education. It is set at 91 percent of the lowest step of the general service rate. The Philadelphia Housing Authority rate is set at 100 percent of the lowest step of the general service rate.
Residential, industrial, commercial, and other customers’ prices varied and usually reflected the costs in serving them. Because residential customers are generally widely dispersed, use relatively small amounts of gas, but need peak amounts on extreme- ly cold days, serving them is usually more costly per unit than serving industrial users, which have a relatively stable demand for gas and take it in large quantities.
In Philadelphia, customer prices increased between 1975 and 1983, as shown in table 9. The average revenue collected from total gas sales increased from $2.01 per Mcf in 1975 to $7.16 per Mcf in 1983; residential sales, from $2.15 per Mcf to $7.56 per Hcf; and interruptible sales, from $1.54 per Mcf to $5.35 per Mcf, Municipal customers experienced the greatest percentage in- crease in prices, about 388 percent (from $1.43 to $6.98); users on interruptible service experienced the lowest increase, about
~ 247 percent (from $1.54 to $5.35).
Table 9
Average Revenue By Cust0ner Class, per Mcf
Fiscal year 1975 1976 1977 1978 1979 1980 1981 1982 1983
Pirm Sales - - A
Residential $2.15 $2.45 $2.72
Umnercial 2.01 2.32 2.63
~ Industrial 1.92 2.25 2.57
Municipal 1.43 1.74 2.04
musing Authority 1.95 2.26 2.57
‘Interruptible ( Sales 1.54 1.99 2.29
Ibtala 2.01 2.36 2.65
Weighted average.
Surce: Philadelphia Gas Works.
$3.28
3.17
3.07
2.43
4
$3.43
3.31
3.22
2.55
$3.82 $4.88 $6.00 $7.56
3.70 4.82 5.97 7.58
3.62 4.77 5.83 7.51
2.95 4.05 4.57 6.98
3.09 3.23 3.63 4.77 5.94 7.60
2.76 3.07
3.34
3.62 4.66 5.15 5.35
3.19 3.73 4.81 5.83 7.16
22
company eupplicrrs, Additional rate reductionr and other changer deeignsd to rstain large volume commrrcial and industrial curto- mere and to attract new cuetomers wara approved by the Commieeion on April 6, 1984,
24
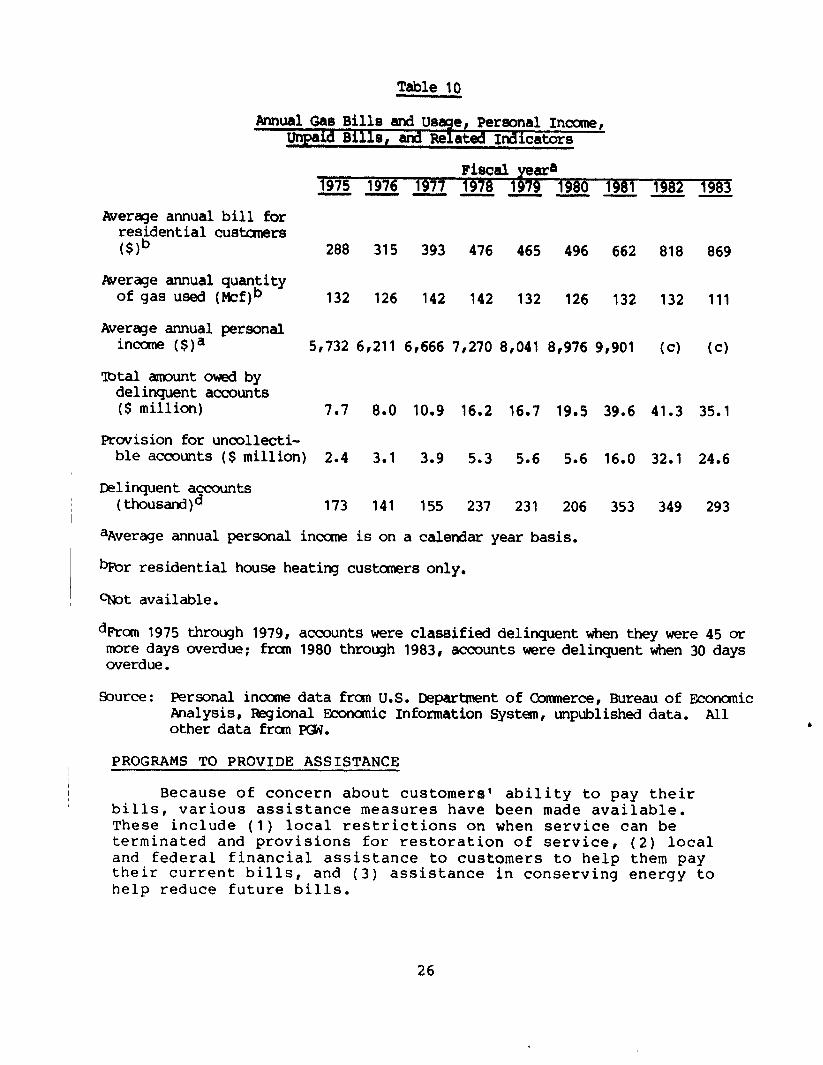
Table 10
PJvlual Gas Bills and Usage, Personal Incune, Unpaid Bills, and Related Indicators
Fiscal yeara 1975 1976 -- 1977 1978 1979 --- 1980 1981 1982 1983 --VP
Average annual bill for residential custaners wb
Alverage annual quantity of gas used (Pkf)b
Average annual personal income ($)a
Tbtal amount owed by de1 inquent accounts ($ million)
288 315 393 476 465 496 662 818 869
132 126 142 142 132 126 132 132 111
5,732 6,211 6,666 7,270 8,041 8,976 9,901 (c) (cl
7.7 8.0 10.9 16.2 16.7 19.5 39.6 41.3 35.1
hrovision for uncollecti- ble accounts ($ million) 2.4 3.1 3.9 5.3 5.6 5.6 16.0 32.1 24.6
Delinquent accounts (thousand)~ 173 141 155 237 231 206 353 349 293
=Average annual personal inccme is on a calendar year basis.
bbr residential house heating custaners only.
%ot available.
dFrcm 1975 through 1979, accounts were classified delinquent when they were 45 or more days overdue; fran 1980 through 1983, accounts were delinquent when 30 days overdue.
Source: Personal incune data frcan U.S. Department of Commerce, Bureau of Economic Analysis, Regional Emnanic Information System, unpublished data. All other data fran PGW. .
PROGRAMS TO PROVIDE ASSISTANCE
Because of concern about customers1 ability to pay their bills, various assistance measures have been made available. These include (1) local restrictions on when service can be terminated and provisions for restoration of service, (2) local and federal financial assistance to customers to help them pay their current bills, and (3) assistance in conserving energy to help reduce future bills.
26

Also, the federal government provides funding to help cer- tain low-income persons pay their energy bills. under the Low Income Home Energy Assistance Program, households are eligible for energy assistance if they contain one or more individuals receiving certain income transfer paym nts or if the household's income is less than a specified level. 7
In Pennsylvania, the Department of Public Welfare is the designated state agency responsible for administering the pro- gram. A state may elect to use up to 15 percent of its authori- zation for low cost weatherization or other energy related home repair. The authorization of federal funds for Pennsylvania in fiscal year 1983 was almost $135 million. Of this amount, about $114 million was budgeted for energy assistance benefits; the remainder was to be used for weatherization and crisis assistance.
In Philadelphia, 56,464 households were assisted during PGW'S 1983 fiscal year, over 8,000 more households than the pre- vious year. According to PGW data, it received fuel a sistance payments from the state on behalf of eligible househol a9 s in its service area totaling about $13.8 million in 1983, and $10.2 million in 1982. These funds represented an annual average of about $243 and $213, respectively, for each eligible customer.
Energy conservation
Both the federal government and PGW have programs to help PGW's residential customers conserve energy. The programs (1) identify energy-saving opportunities, (2) teach customers how to install low-cost conservation measures, (3) help cus- tomers finance insulation and conservation equipment, and (4) help pay the cost of certain fuel-saving improvements.
Federal law2 requires that most gas and electric utili- ties, such as PGW, offer "energy audits" to their residential customers. These audits, conducted by trained specialists, are designed to identify the energy and cost savings likely to be
'This assistance was authorized by Title xxv1 of the Omnibus Budget Reconciliation Act of 1981 (Public Law 97-35). The act limited eligibility to households who were recipients of Aid to Families with Dependent Children, Supplemental Security Income, food stamps, or certain needs-tested veterans' benefits, or whose income did not exceed the greater of 150 percent of the poverty income guidelines (as prescribed by the Office of Management and Budget) or 60 percent of the state's median income (as promulgated by the Secretary of Health and Human Services).
2National Energy Conservation Policy Act (Public Law 95-619) (42 U.S.C. 8201).
28


AN EQUAL OPPORTUNITY EMPLOYER
UNITED STATES QENERALACCOUNTlNG OFFICE
WASHINOTON, DC ZOfM8
OYPlc!lAt BUllNUll PENALTY FOR PRIVATB UBE.SMJ
POSTAGE AND FEES PAM U S OCNERAL ACCOUNTING OFFICE
THIRD CLASS