Embed Size (px)
Citation preview
United States General Accounting Office
GAO Report to Congressional Committees
September 1999 TRANSPORTATIONINFRASTRUCTURE
Better Data Needed toRate the Nation’sHighway Conditions
GAO/RCED-99-264

GAO United States
General Accounting Office
Washington, D.C. 20548
Resources, Community, and
Economic Development Division
B-281731
September 27, 1999
The Honorable John H. ChafeeChairmanThe Honorable Max S. BaucusRanking Minority MemberCommittee on Environment and Public WorksUnited States Senate
The Honorable Bud ShusterChairmanThe Honorable James L. OberstarRanking Democratic MemberCommittee on Transportation and InfrastructureHouse of Representatives
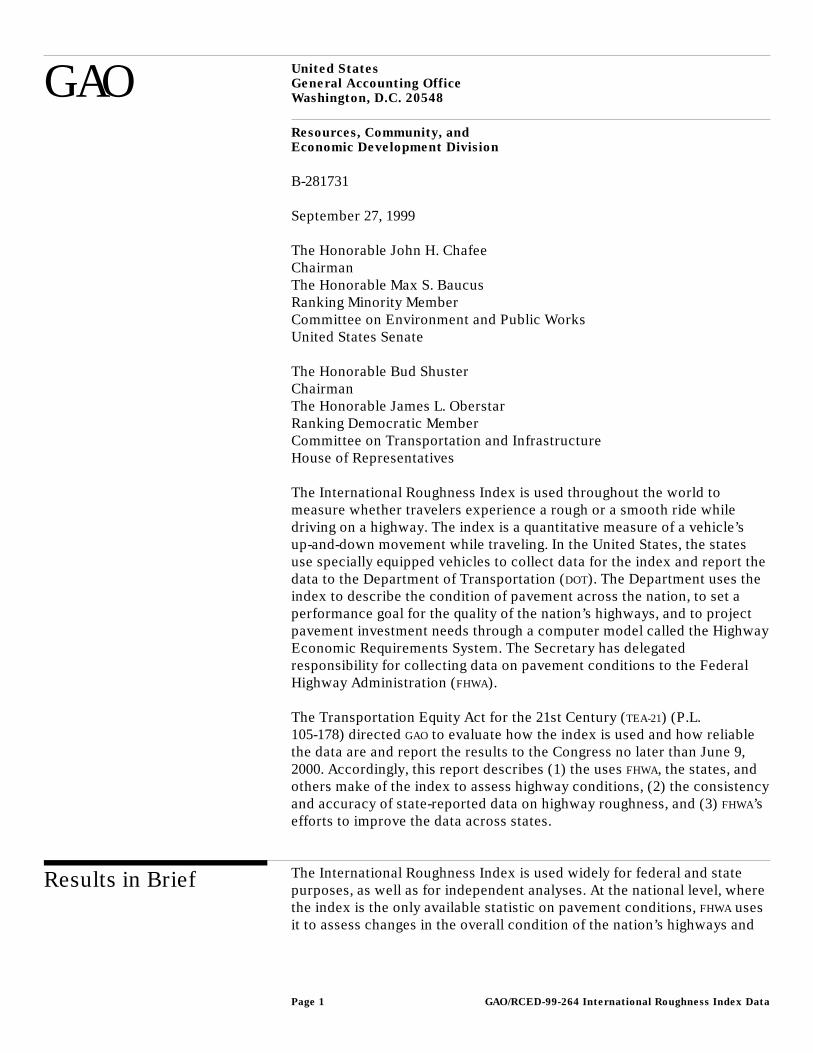
The International Roughness Index is used throughout the world tomeasure whether travelers experience a rough or a smooth ride whiledriving on a highway. The index is a quantitative measure of a vehicle’sup-and-down movement while traveling. In the United States, the statesuse specially equipped vehicles to collect data for the index and report thedata to the Department of Transportation (DOT). The Department uses theindex to describe the condition of pavement across the nation, to set aperformance goal for the quality of the nation’s highways, and to projectpavement investment needs through a computer model called the HighwayEconomic Requirements System. The Secretary has delegatedresponsibility for collecting data on pavement conditions to the FederalHighway Administration (FHWA).
The Transportation Equity Act for the 21st Century (TEA-21) (P.L.105-178) directed GAO to evaluate how the index is used and how reliablethe data are and report the results to the Congress no later than June 9,2000. Accordingly, this report describes (1) the uses FHWA, the states, andothers make of the index to assess highway conditions, (2) the consistencyand accuracy of state-reported data on highway roughness, and (3) FHWA’sefforts to improve the data across states.
Results in Brief The International Roughness Index is used widely for federal and statepurposes, as well as for independent analyses. At the national level, wherethe index is the only available statistic on pavement conditions, FHWA usesit to assess changes in the overall condition of the nation’s highways and
GAO/RCED-99-264 International Roughness Index DataPage 1
B-281731
to forecast future highway investment needs. For example, in 1997, FHWA
projected that repairing deficiencies on the nation’s highways would cost$70.3 billion annually. Actual expenditures for highways by all levels ofgovernment in 1995 were about $29.2 billion, or about $41 billion less thanFHWA had projected as needed to repair the deficiencies. In addition, FHWA
uses the index to measure progress toward a goal for ride quality in itsstrategic plan and publishes data from the index for use by the public. Atthe state level, where other types of data on pavement conditions areavailable, reliance on the index varies. While some states rely on it tomake highway maintenance decisions, others do not consider it animportant decision-making tool. The states that rely on the index use it toproject highway investment needs and report on pavement performance atthe state or district levels. In addition, some states use the index to setstandards for construction projects. Independent analysts have used thedata to compare pavement conditions across states and to develop “reportcards” of state performance.
Critics contend that state comparisons based on the index are flawedbecause the pavement roughness data reported to FHWA by the states arenot consistent or accurate. These problems with consistency and accuracyhave occurred for two reasons. First, the states use different methods togather data and compute the results. The states differ in the devices theyuse to measure the pavement, the part of the road they measure, and theirchoice of an appropriate mathematical simulation. As a result,state-to-state comparisons are not valid. Second, the type ofsurface—asphalt or concrete—influences the results. Concrete roads mayproduce rougher readings than asphalt roads, even if the concrete road isof very high quality. Features such as joints between sections cancontribute to the roughness of concrete highways.
While FHWA has tried to improve the data, these efforts have not beencompletely successful. The agency developed detailed guidelines forcollecting the data and asked the states to apply these guidelines beforereporting the data. However, FHWA accepts any data that the states submit,even if they do not meet its data collection guidelines. Accordingly, we arerecommending that FHWA revise its data collection guidelines to limit thetechnology and procedures the states may use in collecting InternationalRoughness Index data and work with the states to seek compliance withthese guidelines. Such action will help to ensure the reliability of the indexdata that the Department uses for several critical activities, including theestimation of the nation’s highway investment needs.
GAO/RCED-99-264 International Roughness Index DataPage 2
B-281731
Background In 1993, FHWA adopted the International Roughness Index as a measure forthe states to use in assessing and reporting highway conditions in theUnited States. FHWA viewed the index as an improvement over an earlier,more subjective method that permitted ride and visual evaluations ofhighways by state inspectors. In adopting the index, FHWA believed itwould improve the reliability of national data on pavement conditions. Inaddition, the index was accepted worldwide and was used by foreigncountries and the World Bank as a measure of pavement conditions. FHWA
wanted the nation’s system of measuring pavement conditions to beconsistent with international guidelines.
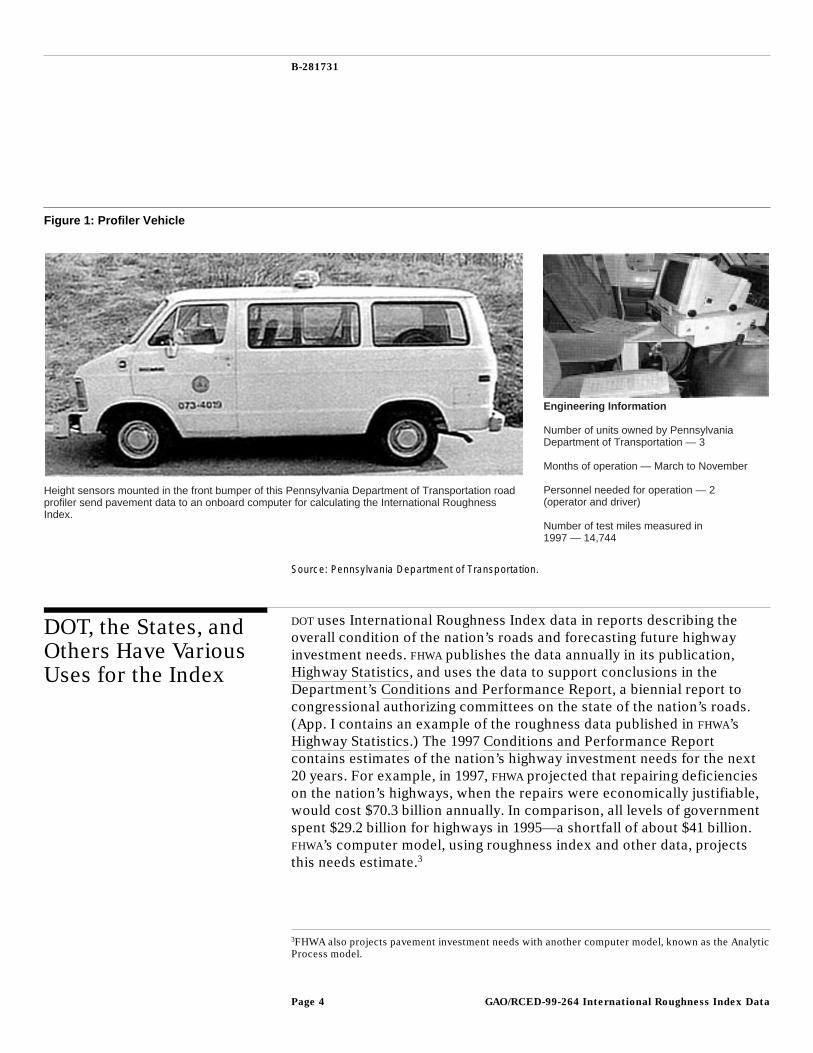
The index is a quantitative measure of a vehicle’s up-and-down motionwhile the vehicle is traveling at a specific speed. Most states collect andmeasure the data with specially equipped vans, called profilers (see fig. 1).The vans can operate at highway speeds and can cost from $75,000 to$1,500,000.1 However, these costs are dropping as the costs of computersand sensors decline. A profiler has sensors attached underneath the vanthat quickly gauge the surface, or “profile,” of the road as the van travelsat normal speeds in traffic. The vehicle typically has a computer and threetypes of sensing equipment: a height sensor,2 an acceleration sensor, and aspeed/distance device connected to the profiler’s speedometer or to awheel. Height sensors measure the up-and-down movement of the van,acceleration sensors detect changes in the speed of the van’s up-and-downmovement, and speed/distance sensors measure how fast the van istraveling and how far it has traveled. All of these measurements areneeded to compute an International Roughness Index statistic. On asmooth road, the up-and-down movements are small and the road’s indexis low, but on a rough road with large cracks and potholes, up-and-downmovements are more noticeable and the index is higher. The index ismeasured in inches per mile; smooth roads have an index of up to 60inches per mile, while rough roads have an index of about 170 inches permile or greater.
1Most profilers cost under $200,000. The more expensive devices cited here often perform additionalfunctions, such as videotaping and measuring the depth of ruts.
2Height sensors use a wide variety of technologies, including laser, infrared, optical, and ultrasonictypes.
GAO/RCED-99-264 International Roughness Index DataPage 3
B-281731
Figure 1: Profiler Vehicle
Height sensors mounted in the front bumper of this Pennsylvania Department of Transportation road profiler send pavement data to an onboard computer for calculating the International Roughness Index.
Engineering Information
Number of units owned by PennsylvaniaDepartment of Transportation — 3
Months of operation — March to November
Personnel needed for operation — 2(operator and driver)
Number of test miles measured in 1997 — 14,744
Source: Pennsylvania Department of Transportation.
DOT, the States, andOthers Have VariousUses for the Index
DOT uses International Roughness Index data in reports describing theoverall condition of the nation’s roads and forecasting future highwayinvestment needs. FHWA publishes the data annually in its publication,Highway Statistics, and uses the data to support conclusions in theDepartment’s Conditions and Performance Report, a biennial report tocongressional authorizing committees on the state of the nation’s roads.(App. I contains an example of the roughness data published in FHWA’sHighway Statistics.) The 1997 Conditions and Performance Reportcontains estimates of the nation’s highway investment needs for the next20 years. For example, in 1997, FHWA projected that repairing deficiencieson the nation’s highways, when the repairs were economically justifiable,would cost $70.3 billion annually. In comparison, all levels of governmentspent $29.2 billion for highways in 1995—a shortfall of about $41 billion.FHWA’s computer model, using roughness index and other data, projectsthis needs estimate.3
3FHWA also projects pavement investment needs with another computer model, known as the AnalyticProcess model.
GAO/RCED-99-264 International Roughness Index DataPage 4
B-281731
FHWA also uses the data as a performance indicator for the nation’shighways. Under the Government Performance and Results Act of 1993,FHWA and the Department use the data to set a goal for ride quality in theirperformance plans. The performance plans call for 93 percent of theNational Highway System4 to have an index of below 170 inches per mileby 2008. Using 1997 data (the most recent data available), FHWA reported in1999 that 91.7 percent of the National Highway System had alreadyachieved this goal, and therefore officials believe the goal is achievable.However, FHWA noted that since the index measures only pavementroughness, other measurements of pavement distress would be needed tofully assess the overall condition of the nation’s highways.
The states we reviewed vary in the extent to which they rely on the indexto make maintenance decisions or manage their construction schedules.For example, three of the seven states we reviewed—Ohio, Pennsylvania,and South Dakota—believe the index is helpful in managing the conditionof their pavement and use the data in determining their pavementinvestment needs. These states use the data as an indicator of pavementperformance statewide or at the highway district level. Four of the sevenstates—Georgia, Pennsylvania, South Dakota, and Texas—currently use orplan to use the index as a construction specification for new pavementconstruction. For example, in Georgia, contractors must construct newhighways with an index reading below 47 inches per mile. GeorgiaDepartment of Transportation officials claim that this requirementexplains the low roughness of their roads. These officials also stated thatcontractors in Georgia rarely deliver new pavement that fails to meet thisrequirement. On the other hand, New York does not use the index for anystate purpose; it collects the data only to fulfill FHWA’s requirement that thestates report index measurements.
Outside analysts also use roughness index data for studies of pavementconditions and performance. Nonprofit organizations and academicinstitutions occasionally publish “report cards” comparing pavementconditions among the states. For example, the Surface TransportationPolicy Project issued reports in 1997 and 1998 based, in part, on FHWA’sindex data. (App. II contains an example of a Surface TransportationPolicy Project report card.) These reports ranked the states on thecondition of their roads and estimated how much the condition of theroads cost drivers in repair bills. The Surface Transportation PolicyProject report uses FHWA’s data to categorize a state’s roads as good, fair,
4The National Highway System is a federally designated portion of the nation’s roads consisting mainlyof interstate highways and other arterial roads.
GAO/RCED-99-264 International Roughness Index DataPage 5
B-281731
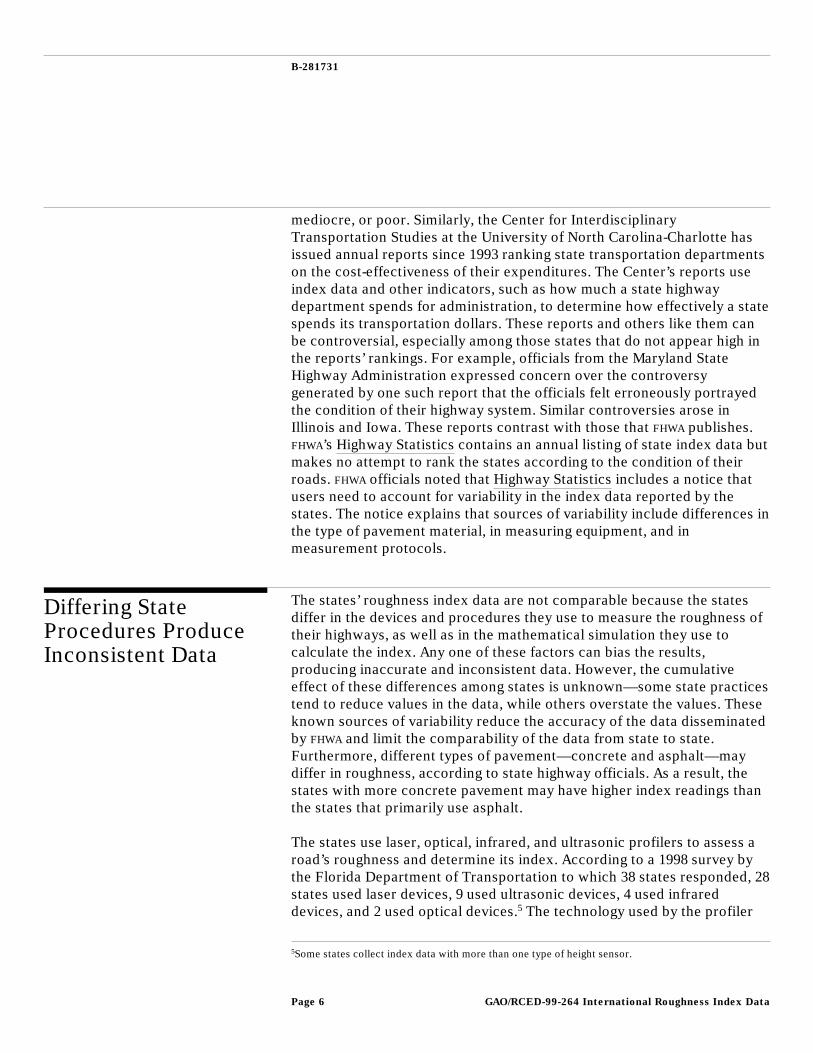
mediocre, or poor. Similarly, the Center for InterdisciplinaryTransportation Studies at the University of North Carolina-Charlotte hasissued annual reports since 1993 ranking state transportation departmentson the cost-effectiveness of their expenditures. The Center’s reports useindex data and other indicators, such as how much a state highwaydepartment spends for administration, to determine how effectively a statespends its transportation dollars. These reports and others like them canbe controversial, especially among those states that do not appear high inthe reports’ rankings. For example, officials from the Maryland StateHighway Administration expressed concern over the controversygenerated by one such report that the officials felt erroneously portrayedthe condition of their highway system. Similar controversies arose inIllinois and Iowa. These reports contrast with those that FHWA publishes.FHWA’s Highway Statistics contains an annual listing of state index data butmakes no attempt to rank the states according to the condition of theirroads. FHWA officials noted that Highway Statistics includes a notice thatusers need to account for variability in the index data reported by thestates. The notice explains that sources of variability include differences inthe type of pavement material, in measuring equipment, and inmeasurement protocols.
Differing StateProcedures ProduceInconsistent Data
The states’ roughness index data are not comparable because the statesdiffer in the devices and procedures they use to measure the roughness oftheir highways, as well as in the mathematical simulation they use tocalculate the index. Any one of these factors can bias the results,producing inaccurate and inconsistent data. However, the cumulativeeffect of these differences among states is unknown—some state practicestend to reduce values in the data, while others overstate the values. Theseknown sources of variability reduce the accuracy of the data disseminatedby FHWA and limit the comparability of the data from state to state.Furthermore, different types of pavement—concrete and asphalt—maydiffer in roughness, according to state highway officials. As a result, thestates with more concrete pavement may have higher index readings thanthe states that primarily use asphalt.
The states use laser, optical, infrared, and ultrasonic profilers to assess aroad’s roughness and determine its index. According to a 1998 survey bythe Florida Department of Transportation to which 38 states responded, 28states used laser devices, 9 used ultrasonic devices, 4 used infrareddevices, and 2 used optical devices.5 The technology used by the profiler
5Some states collect index data with more than one type of height sensor.
GAO/RCED-99-264 International Roughness Index DataPage 6
B-281731
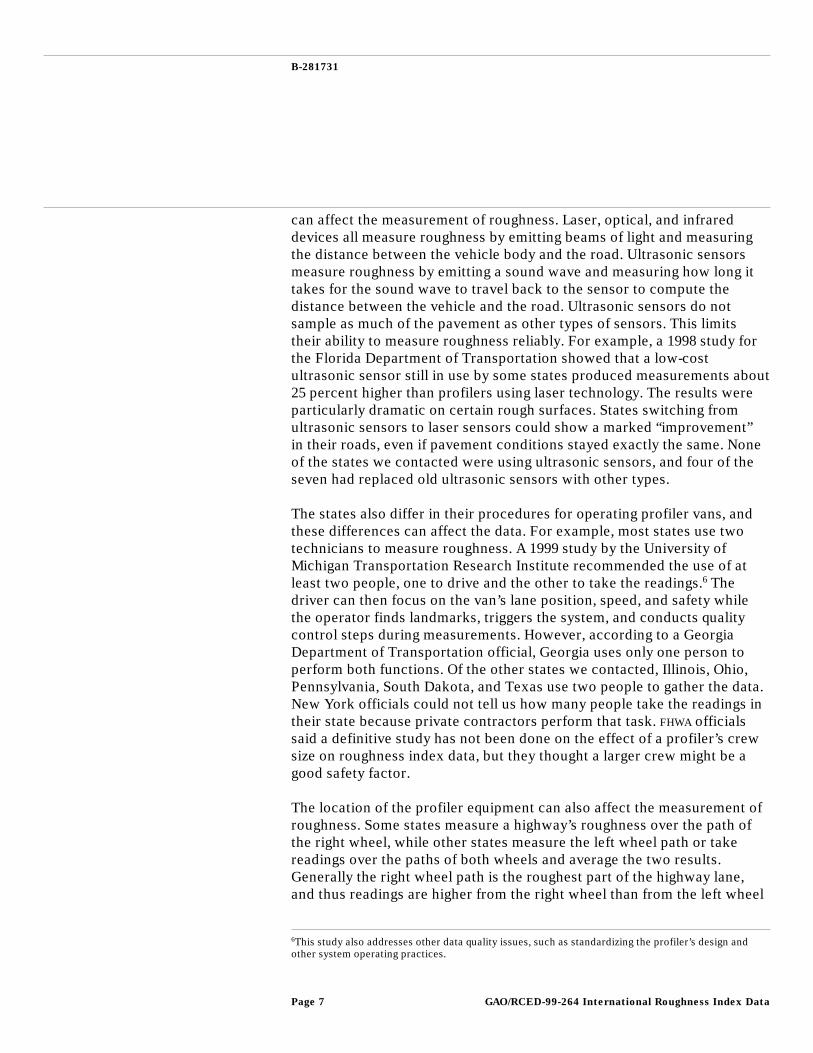
can affect the measurement of roughness. Laser, optical, and infrareddevices all measure roughness by emitting beams of light and measuringthe distance between the vehicle body and the road. Ultrasonic sensorsmeasure roughness by emitting a sound wave and measuring how long ittakes for the sound wave to travel back to the sensor to compute thedistance between the vehicle and the road. Ultrasonic sensors do notsample as much of the pavement as other types of sensors. This limitstheir ability to measure roughness reliably. For example, a 1998 study forthe Florida Department of Transportation showed that a low-costultrasonic sensor still in use by some states produced measurements about25 percent higher than profilers using laser technology. The results wereparticularly dramatic on certain rough surfaces. States switching fromultrasonic sensors to laser sensors could show a marked “improvement”in their roads, even if pavement conditions stayed exactly the same. Noneof the states we contacted were using ultrasonic sensors, and four of theseven had replaced old ultrasonic sensors with other types.
The states also differ in their procedures for operating profiler vans, andthese differences can affect the data. For example, most states use twotechnicians to measure roughness. A 1999 study by the University ofMichigan Transportation Research Institute recommended the use of atleast two people, one to drive and the other to take the readings.6 Thedriver can then focus on the van’s lane position, speed, and safety whilethe operator finds landmarks, triggers the system, and conducts qualitycontrol steps during measurements. However, according to a GeorgiaDepartment of Transportation official, Georgia uses only one person toperform both functions. Of the other states we contacted, Illinois, Ohio,Pennsylvania, South Dakota, and Texas use two people to gather the data.New York officials could not tell us how many people take the readings intheir state because private contractors perform that task. FHWA officialssaid a definitive study has not been done on the effect of a profiler’s crewsize on roughness index data, but they thought a larger crew might be agood safety factor.
The location of the profiler equipment can also affect the measurement ofroughness. Some states measure a highway’s roughness over the path ofthe right wheel, while other states measure the left wheel path or takereadings over the paths of both wheels and average the two results.Generally the right wheel path is the roughest part of the highway lane,and thus readings are higher from the right wheel than from the left wheel
6This study also addresses other data quality issues, such as standardizing the profiler’s design andother system operating practices.
GAO/RCED-99-264 International Roughness Index DataPage 7
B-281731
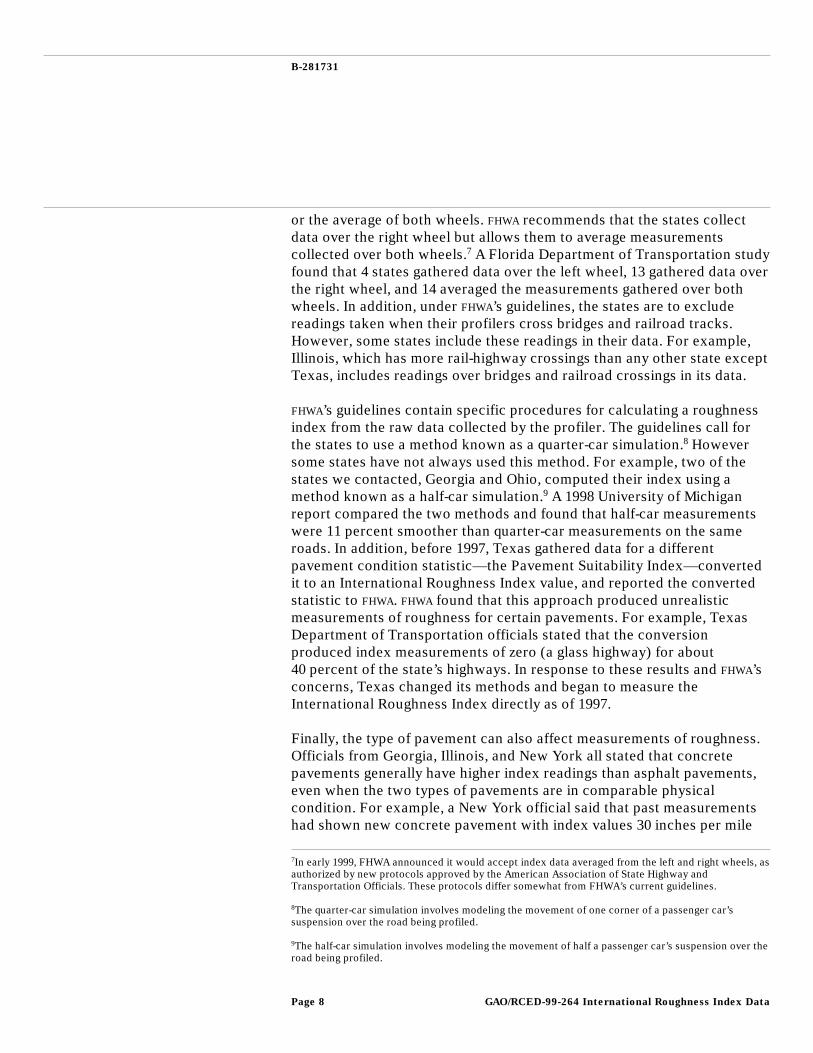
or the average of both wheels. FHWA recommends that the states collectdata over the right wheel but allows them to average measurementscollected over both wheels.7 A Florida Department of Transportation studyfound that 4 states gathered data over the left wheel, 13 gathered data overthe right wheel, and 14 averaged the measurements gathered over bothwheels. In addition, under FHWA’s guidelines, the states are to excludereadings taken when their profilers cross bridges and railroad tracks.However, some states include these readings in their data. For example,Illinois, which has more rail-highway crossings than any other state exceptTexas, includes readings over bridges and railroad crossings in its data.
FHWA’s guidelines contain specific procedures for calculating a roughnessindex from the raw data collected by the profiler. The guidelines call forthe states to use a method known as a quarter-car simulation.8 Howeversome states have not always used this method. For example, two of thestates we contacted, Georgia and Ohio, computed their index using amethod known as a half-car simulation.9 A 1998 University of Michiganreport compared the two methods and found that half-car measurementswere 11 percent smoother than quarter-car measurements on the sameroads. In addition, before 1997, Texas gathered data for a differentpavement condition statistic—the Pavement Suitability Index—convertedit to an International Roughness Index value, and reported the convertedstatistic to FHWA. FHWA found that this approach produced unrealisticmeasurements of roughness for certain pavements. For example, TexasDepartment of Transportation officials stated that the conversionproduced index measurements of zero (a glass highway) for about40 percent of the state’s highways. In response to these results and FHWA’sconcerns, Texas changed its methods and began to measure theInternational Roughness Index directly as of 1997.
Finally, the type of pavement can also affect measurements of roughness.Officials from Georgia, Illinois, and New York all stated that concretepavements generally have higher index readings than asphalt pavements,even when the two types of pavements are in comparable physicalcondition. For example, a New York official said that past measurementshad shown new concrete pavement with index values 30 inches per mile
7In early 1999, FHWA announced it would accept index data averaged from the left and right wheels, asauthorized by new protocols approved by the American Association of State Highway andTransportation Officials. These protocols differ somewhat from FHWA’s current guidelines.
8The quarter-car simulation involves modeling the movement of one corner of a passenger car’ssuspension over the road being profiled.
9The half-car simulation involves modeling the movement of half a passenger car’s suspension over theroad being profiled.
GAO/RCED-99-264 International Roughness Index DataPage 8
B-281731
rougher than new asphalt pavement. This difference may have occurred, inpart, because some concrete pavement, unlike asphalt, has joints betweenthe concrete sections, and each concrete section has a slight natural curvein it. FHWA does not distinguish between pavement types when it publishesits data, so direct comparisons cannot be made between states that mainlyuse asphalt and states that mainly use concrete. FHWA officials noted thatpavement contractors have developed ways of building concrete highwaysthat can match asphalt highways in terms of roughness.
FHWA Has NotRequired the States toComply With ItsGuidelines forCollectingInternationalRoughness Index Data
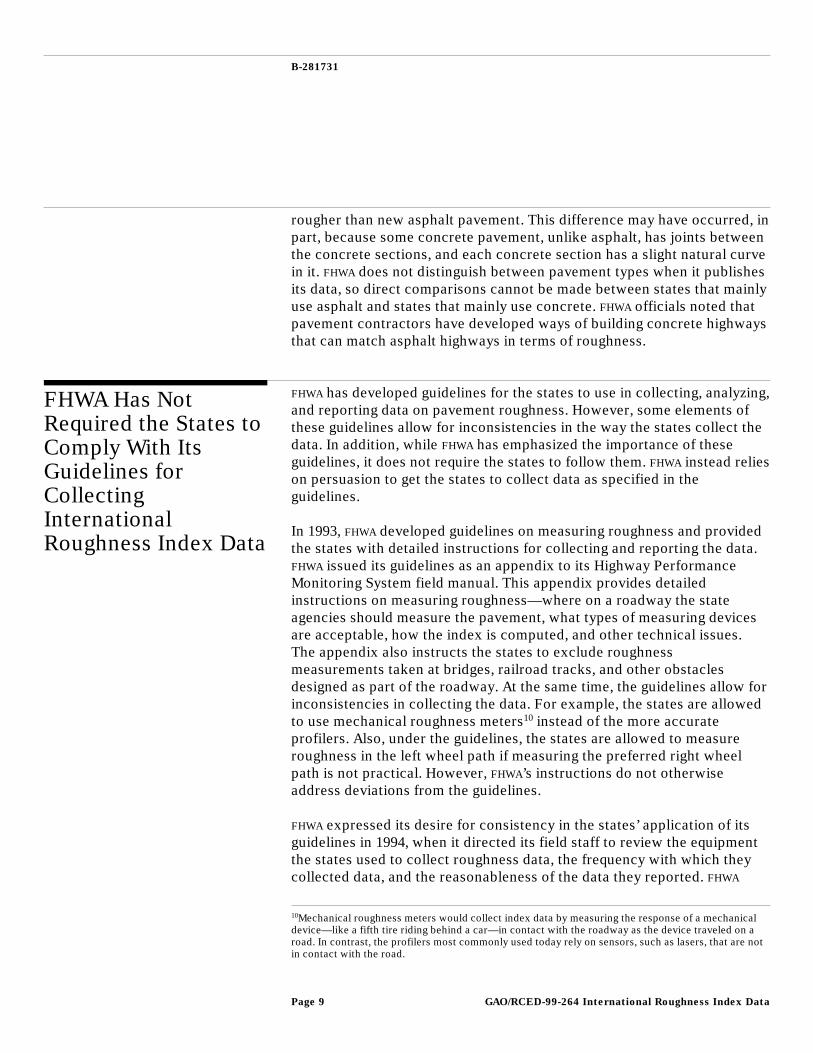
FHWA has developed guidelines for the states to use in collecting, analyzing,and reporting data on pavement roughness. However, some elements ofthese guidelines allow for inconsistencies in the way the states collect thedata. In addition, while FHWA has emphasized the importance of theseguidelines, it does not require the states to follow them. FHWA instead relieson persuasion to get the states to collect data as specified in theguidelines.
In 1993, FHWA developed guidelines on measuring roughness and providedthe states with detailed instructions for collecting and reporting the data.FHWA issued its guidelines as an appendix to its Highway PerformanceMonitoring System field manual. This appendix provides detailedinstructions on measuring roughness—where on a roadway the stateagencies should measure the pavement, what types of measuring devicesare acceptable, how the index is computed, and other technical issues.The appendix also instructs the states to exclude roughnessmeasurements taken at bridges, railroad tracks, and other obstaclesdesigned as part of the roadway. At the same time, the guidelines allow forinconsistencies in collecting the data. For example, the states are allowedto use mechanical roughness meters10 instead of the more accurateprofilers. Also, under the guidelines, the states are allowed to measureroughness in the left wheel path if measuring the preferred right wheelpath is not practical. However, FHWA’s instructions do not otherwiseaddress deviations from the guidelines.
FHWA expressed its desire for consistency in the states’ application of itsguidelines in 1994, when it directed its field staff to review the equipmentthe states used to collect roughness data, the frequency with which theycollected data, and the reasonableness of the data they reported. FHWA
10Mechanical roughness meters would collect index data by measuring the response of a mechanicaldevice—like a fifth tire riding behind a car—in contact with the roadway as the device traveled on aroad. In contrast, the profilers most commonly used today rely on sensors, such as lasers, that are notin contact with the road.
GAO/RCED-99-264 International Roughness Index DataPage 9
B-281731
field office staff at one of the states we visited found large-scale errors intheir state’s reports of roughness data. The state subsequently revised itsdata collection process to satisfy FHWA.
When the states deviated from FHWA’s guidelines, they generally had anengineering reason for doing so. For example, Georgia and Ohio preferredmeasurements based on half-car simulations rather than quarter-carsimulations because they had been collecting pavement roughness databefore FHWA introduced its guidelines and the data from half-carsimulations better matched their data from prior years. Pennsylvania andSouth Dakota left the measurements taken over bridges and railroad gradecrossings in their data because they considered the information potentiallyuseful in identifying trouble spots.
In general, FHWA has not strictly imposed its data collection guidelines onthe states, and it accepts the data the states submit. FHWA has legalauthority to impose and enforce requirements for accurate data. FHWA
officials stated that the sanction for noncompliance could be for theagency to withhold planning and research funds. However, officials notedthat the states use these funds to pay for many other data elements theyreport for FHWA’s Highway Performance Monitoring System field manual,as well as for other planning and research activities, includingmetropolitan planning, statewide planning, and clean air requirements.FHWA officials also told us that persuasion was their preferred tool forencouraging the states to report roughness index data as specified in theagency’s guidelines.
New protocols on measuring pavement roughness issued in early 1999 bythe American Association of State Highway and Transportation Officials(AASHTO) could help address the problem of inconsistencies in the states’application of FHWA’s guidelines. FHWA supported the development ofAASHTO’s protocols,11 believing they would help standardize state datacollection practices. FHWA officials told us they plan to issue a newHighway Performance Monitoring System field manual by the end of 1999that incorporates AASHTO’s new protocols, called provisional standards. Inaddition, to obtain closer compliance with its reporting requirements,
11AASHTO’s protocols differ from FHWA’s guidelines in that they call for the states to measurepavement roughness in both the right and left wheel paths and average the measurement to calculate aroughness index statistic. While FHWA recently agreed to accept data averaged according toAASHTO’s protocols, FHWA’s current guidelines call for taking measurements from only one wheelpath, preferably the right wheel path. Furthermore, AASHTO’s protocols do not address what types ofprofilers the states should use to collect data, whether the states should exclude data collected overbridges and railroad crossings, or how many technicians the states should use to collect index data.
GAO/RCED-99-264 International Roughness Index DataPage 10
B-281731
FHWA will include revised instructions on gathering roughness data in theappendix to its new field manual.
Finally, recognizing the importance of consistent roughness data as aperformance indicator for FHWA’s strategic planning process and as afactor in estimating highway investment requirements for the Congress,FHWA officials said they plan to examine several issues related to collectingmore consistent roughness data. Specifically, FHWA plans to
• evaluate the effects of different data collection and analysis protocols onthe roughness data,
• assess current practices to identify where changes could significantlyimprove roughness data, and
• work with its field offices and the state highway agencies to implementchanges that would make roughness data more consistent.
Conclusions The International Roughness Index is a more consistent tool for measuringpavement conditions than the subjective system FHWA previously used.However, the data on pavement roughness that FHWA receives from thestates need to be more consistent and accurate. Differences in the states’data collection methods and the resulting lack of comparable data becomeimportant when FHWA aggregates the data to the national level, such aswhen the data are used in the Department’s model for projecting thenation’s highway investment needs. Unreliable statistics result fromaggregating data that are not comparable. For example, FHWA will not beable to determine with confidence that it has met the Department’sperformance goal for pavement condition set under the Results Act—that93 percent of the National Highway System have an index below 170inches per mile by 2008. Without accurate data on pavement roughness,FHWA cannot reliably assess the current condition of the highways relativeto the goal or determine whether progress is being made toward the goal.In addition, meaningful comparisons among the states cannot be drawnusing the data because the states use different procedures and calculationmethods. While FHWA has given the states wide latitude in how they reportpavement roughness data, FHWA also has the authority to require that theyuse accurate equipment and consistent techniques to collect the data.
GAO/RCED-99-264 International Roughness Index DataPage 11
B-281731
Recommendations tothe Secretary ofTransportation
To enable the Federal Highway Administration to reliably report on thecondition of the nation’s highways and accurately estimate the nation’shighway investment needs, we recommend that the Secretary ofTransportation direct the Administrator, Federal Highway Administration,to revise the agency’s guidelines to exclude profiling technologies knownto produce significant errors and achieve consistency with the AmericanAssociation of State Highway and Transportation Officials’ protocols. Wefurther recommend that the Administrator work with the states toimplement the revised guidelines.
Agency Commentsand Our Response
We provided a copy of a draft of this report to the Department ofTransportation for review and comment. We discussed the draft reportwith Department officials, including the Federal Highway Administration’sDirector, Office of Highway Policy Information, and Acting Director,Office of Pavement Technology. FHWA generally agreed with the findingsand our conclusion that the roughness data reported by the states could bemore consistent. However, FHWA disagreed with part of therecommendation in our draft report, which said that FHWA should directthe states to comply with its own and AASHTO’s guidelines on reportingdata. FHWA believed that it could obtain more consistent roughness indexdata by working cooperatively with the states rather than by requiringthem to comply with a federal mandate. According to FHWA, such amandate was unwarranted. FHWA further stated that because the Congressin the National Highway System Designation Act of 1995 overturned earlierlegislation that mandated state Pavement Management Systemrequirements, FHWA did not believe it was appropriate to impose criteriafor measuring roughness. FHWA believes it has worked effectively with thestates to obtain better roughness data and that the states have alreadymade great strides in improving their collection and reporting of the data.
FHWA also noted that it has planned several actions to obtain moreconsistent roughness data from the states. First, it said it plans to adoptAASHTO’s recently developed roughness standards as its own. FHWA believesthat these new standards will substantially address our concern about thequality of the data. In addition, to obtain closer compliance with itsreporting requirements, FHWA said it will include revised instructions ongathering roughness data in the appendix to its new Highway PerformanceMonitoring System field manual. This appendix contains the guidelinesthat states use. Finally, FHWA said it plans to evaluate the effects ofdifferent data collection and analysis protocols on the roughness data,assess current practices to identify where changes could significantly
GAO/RCED-99-264 International Roughness Index DataPage 12
B-281731
improve the data, and work with its field offices and the state highwayagencies to implement changes that will improve the consistency ofreported roughness data.
FHWA believes that adopting AASHTO’s protocols, along with taking theactions it has planned, will address our concerns without imposing afederal mandate. We are encouraged by FHWA’s recently statedcommitment to work with the states on these issues and agree that afederal mandate may not be necessary. Nevertheless, we believe thatfollowing through on plans such as this is often just as difficult asdeveloping them. Accordingly, we have revised our recommendation toreflect FHWA’s new plan and this continuing need.
FHWA made a number of additional technical comments on the report,which we incorporated as appropriate.
Scope andMethodology
We contacted FHWA and state transportation department officials todetermine how they use International Roughness Index data. Weexamined state and federal reports based on these data anddocumentation concerning FHWA’s Highway Performance MonitoringSystem database and the related models for projecting future highwayinvestment needs. Furthermore, to assess independent uses of roughnessindex data, we reviewed reports by the Surface Transportation PolicyProject and the Center for Interdisciplinary Transportation Studies at theUniversity of North Carolina-Charlotte. To obtain information about thereliability of the data, we interviewed FHWA and state transportationdepartment officials about data collection practices and reliability. Inparticular, we interviewed state transportation department officials fromseven states about their experience and concerns with the reliability of theroughness data. The seven states—Georgia, Illinois, New York, Ohio,Pennsylvania, South Dakota, and Texas—were selected to give us a broadcross section of opinions about the reliability and collection of the data.We also spoke with officials from Maryland about applications of the data.In addition, we interviewed experts in the field of pavement monitoringfrom the University of Michigan, the University of NorthCarolina-Charlotte, and a profiler manufacturer. We also analyzedpavement data from the Highway Performance Monitoring Systemdatabase and reviewed reports on the reliability of roughness index datathat were presented before the Road Profiler Users Group and theTransportation Research Board. We performed our review from
GAO/RCED-99-264 International Roughness Index DataPage 13
B-281731
August 1998 through September 1999 in accordance with generallyaccepted government auditing standards.
We will make copies of this report available to cognizant congressionalcommittees; the Honorable Rodney E. Slater, Secretary of Transportation,the Honorable Kenneth R. Wykle, Administrator, Federal HighwayAdministration; and other interested parties. We will make copiesavailable to others on request. Please call me at (202) 512-2834 if you oryour staff have any questions. Major contributors to this report wereRichard Calhoon, Joseph Christoff, Robert Ciszewski, and RaymondSendejas. Sincerely yours,
Phyllis F. ScheinbergAssociate Director, Transportation Issues
GAO/RCED-99-264 International Roughness Index DataPage 14

GAO/RCED-99-264 International Roughness Index DataPage 15
Contents
Letter 1
Appendix I Pavement DataPublished by theFederal HighwayAdministration
18
Appendix II Pavement DataPublished by theSurfaceTransportation PolicyProject
20
Figure Figure 1: Profiler Vehicle 4
Abbreviations
AASHTO American Association of State Highway and TransportationOfficials
DOT Department of TransportationFHWA Federal Highway AdministrationTEA-21 Transportation Equity Act for the 21st Century
GAO/RCED-99-264 International Roughness Index DataPage 16

GAO/RCED-99-264 International Roughness Index DataPage 17
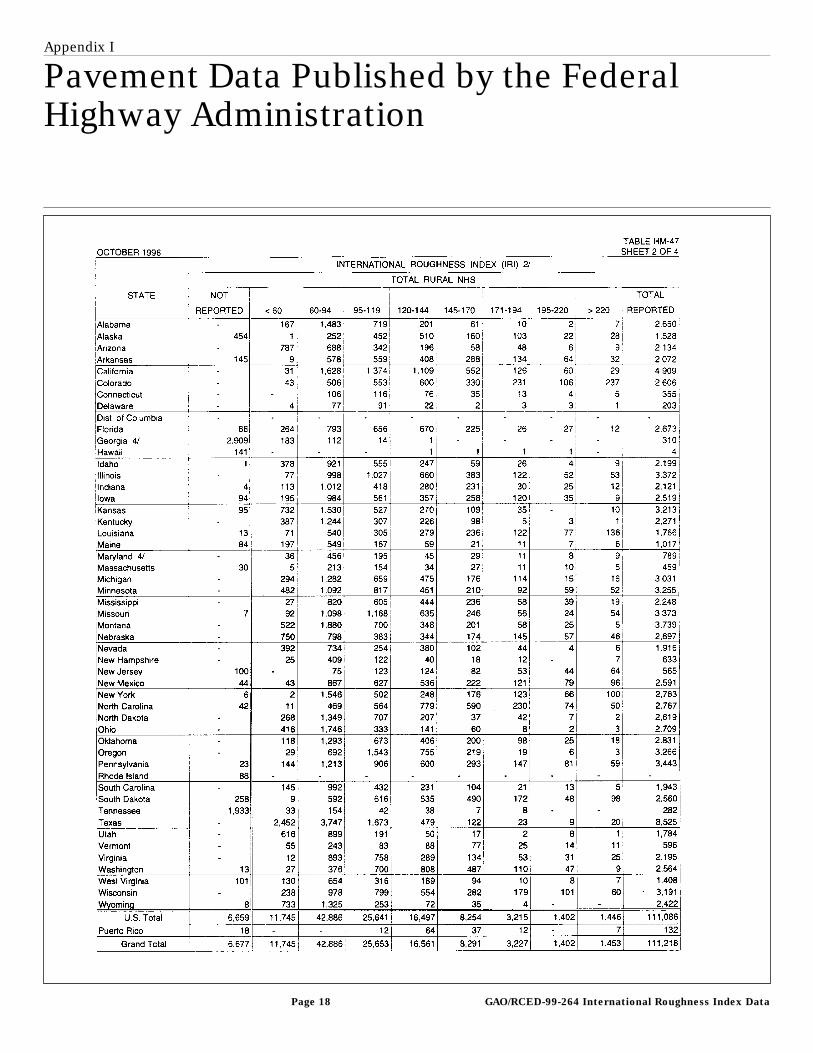
Appendix I
Pavement Data Published by the FederalHighway Administration
GAO/RCED-99-264 International Roughness Index DataPage 18
Appendix I
Pavement Data Published by the Federal
Highway Administration
Note: In this Federal Highway Administration table on the roughness of rural pavement, the statesare listed alphabetically.
Source: Highway Statistics 1997, Federal Highway Administration.
GAO/RCED-99-264 International Roughness Index DataPage 19
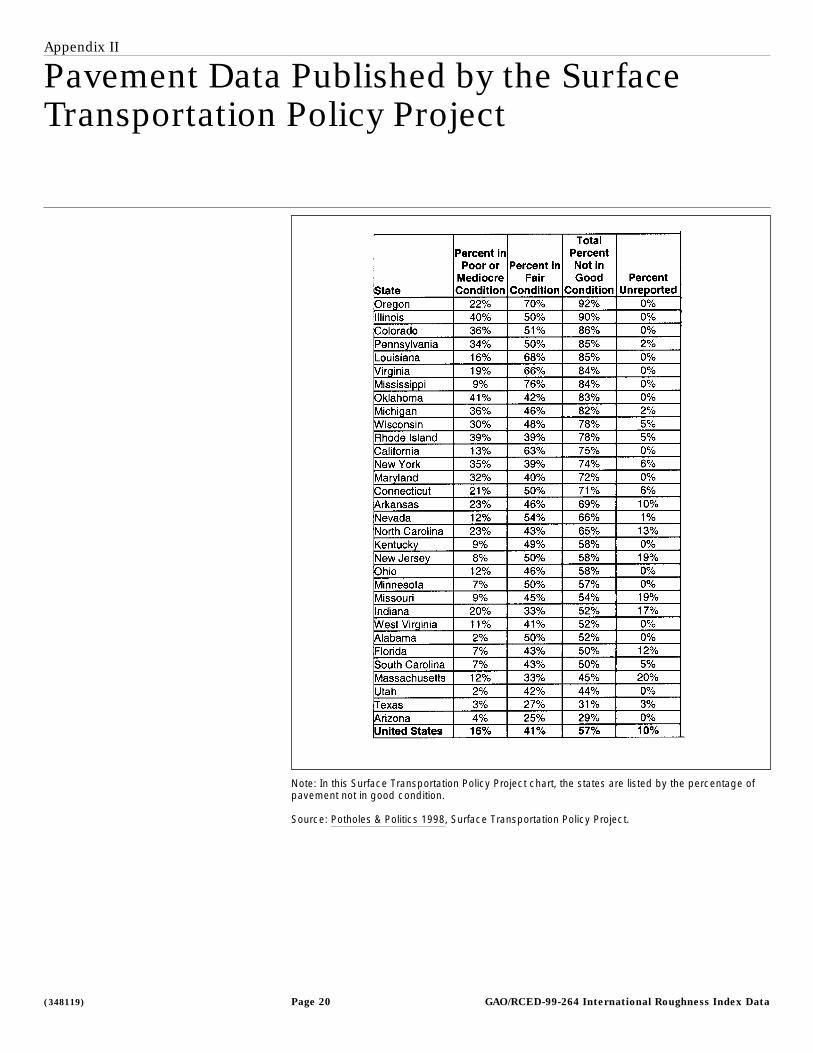
Appendix II
Pavement Data Published by the SurfaceTransportation Policy Project
Note: In this Surface Transportation Policy Project chart, the states are listed by the percentage ofpavement not in good condition.
Source: Potholes & Politics 1998, Surface Transportation Policy Project.
(348119) GAO/RCED-99-264 International Roughness Index DataPage 20
Ordering Information
The first copy of each GAO report and testimony is free.
Additional copies are $2 each. Orders should be sent to the
following address, accompanied by a check or money order
made out to the Superintendent of Documents, when
necessary. VISA and MasterCard credit cards are accepted, also.
Orders for 100 or more copies to be mailed to a single address
are discounted 25 percent.
Orders by mail:
U.S. General Accounting Office
P.O. Box 37050
Washington, DC 20013
or visit:
Room 1100
700 4th St. NW (corner of 4th and G Sts. NW)
U.S. General Accounting Office
Washington, DC
Orders may also be placed by calling (202) 512-6000
or by using fax number (202) 512-6061, or TDD (202) 512-2537.
Each day, GAO issues a list of newly available reports and
testimony. To receive facsimile copies of the daily list or any
list from the past 30 days, please call (202) 512-6000 using a
touchtone phone. A recorded menu will provide information on
how to obtain these lists.
For information on how to access GAO reports on the INTERNET,
send an e-mail message with "info" in the body to:
or visit GAO’s World Wide Web Home Page at:
http://www.gao.gov
PRINTED ON RECYCLED PAPER

United StatesGeneral Accounting OfficeWashington, D.C. 20548-0001
Official BusinessPenalty for Private Use $300
Address Correction Requested
Bulk RatePostage & Fees Paid
GAOPermit No. G100