Embed Size (px)
Citation preview

Raza asno de los Encartaciones
5. DISCUSIÓN GENERAL

DISCUSIÓN GENERAL
130
En este apartado pretendemos realizar una discusión global de
los capítulos de resultados y discusiones plasmados anteriormente,
todo ello enmarcado en la caracterización molecular de las razas
asnales españolas.
El objetivo último de esta tesis es poder brindarle a los
interesados (criadores, investigadores y estudiantes) en las razas
asnales, cierta información que, en conjunción con los demás trabajos
de caracterización morfológica, hematológica, bioquímica y citogenética,
permita establecer un Plan de Conservación in situ de estas poblaciones
que actualmente se encuentran en peligro de extinción.
La excelente adecuación y amplificación de los marcadores de
caballos en los asnos (pertenecientes ambos al mismo género Equus)
nos permitió hacer esta primera aproximación del estudio a nivel del
ADN en estas razas. Claro está, después de realizar algunas ligeras
modificaciones, en especial en las condiciones de PCR, ajustando tanto
cantidades de los productos utilizados (Taq, Oligos, MgCl2, etc) como
temperaturas de anneling y combinaciones de los marcadores (para
evitar solapamientos, que en principio no se presentan en los análisis
de muestras originarias de caballos), logrando la completa amplificación
en 14 de los 15 microsatélites de caballos utilizados en muestras de
asnos.
En trabajos previos, Breen y col. (1994) ya habían demostrado
que ciertos microsatélites de caballos lograban amplificar en individuos
del mismo género Equus, y que había la posibilidad del uso de estos
para estudios poblacionales en especies relacionas y en especial en las
razas minoritarias donde la investigación es bastante limitada. Más
tarde, en los primeros trabajos de esta Unidad (Unidad de Genética y
Mejora Animal de la UAB), se lograban amplificar estos y otros
microsatélites equinos en muestras de asnos (Jordana y col., 1999).

DISCUSIÓN GENERAL
131
Es así que, los microsatélites utilizados, salvo la excepción del
marcador ASB2 que no logró amplificar y el HMS1 que fue monomórfico
(165 pb.), fueron exitosamente polimórficos y con valores de PIC
aceptables, lo que los hace altamente informativos para este tipo de
estudios.
El principal objetivo de un programa de conservación “in situ” es
el mantenimiento de animales vivos que retengan la máxima cantidad
de variabilidad genética posible (bajo la hipótesis de existencia de
correlación con la viabilidad de la población) con el mínimo incremento
de consanguinidad por generación. Esto repercute principalmente en
nuestro caso en una depresión consanguínea, una reducción de los
caracteres reproductivos y la inevitable disminución del número efectivo
de la población, llegando inclusive a la extinción de no tomarse
medidas. Así que discutiremos cómo la aportación de esta investigación,
contribuye a dar respuesta a esta problemática.
En este orden de ideas, podemos indicar que con respecto a la
diversidad de las razas asnales españolas, las cinco razas estudiadas
(AND, CAT, ENC, MALL y ZAM) mostraron unos niveles similares y
aceptables de variabilidad genética, con valores promedios de HE y HO
de 0.654 y 0.546 respectivamente, y un número promedio de alelos por
locus de 7.2, sin presentarse diferencias estadísticamente significativas
entre ellas.
Así mismo, podemos indicar que tanto para cada una de las razas
individuales como a nivel global, la probabilidad de exclusión (PE) fue
del 99,99%, lo cuál nos permite contar con una herramienta eficaz a la
hora de realizar pruebas de paternidades o descartar una asignación
errónea de paternidad. Esto puede ser de gran interés si tenemos en
cuenta que en la mayoría de las razas no se dispone de información
genealógica. La identificación de alelos y sus respectivas frecuencias,

DISCUSIÓN GENERAL
132
revelaron pocas o nulas diferencias entre las razas. A pesar de que se
presentaron algunos alelos privados, su baja frecuencia no permite
utilizarlos como alelos marcadores de raza.
En cuanto al estudio de la estructura genética de las razas, se
realizó en primer lugar un análisis global de las mismas y en segundo
lugar, y después de detectar un significativo déficit de heterocigotos en
la población, se realizó un exhaustivo análisis jerárquico, subdividiendo
a cada una de las razas en subpoblaciones (básicamente por su
proximidad geográfica) y que nos permitiera de ese modo explicar ese
déficit.
A nivel global se presentó una aparente diferenciación racial, del
4.1% (P< 0.001), contribuyendo todos los loci a ella, por lo que el
remanente 95.9% correspondería a diferencias entre los individuos.
Como promedio las razas presentaron un déficit de heterocigotos del
17.8%; mientras que en la población total ese déficit fue del 21.1 % (P <
0.001).
Este bajo aunque significativo valor de diferenciación genética
(4.1%), también nos da indicios de un elevado flujo de genes entre estas
razas; siendo mayor entre las razas CAT, MALL y ENC por un lado, y
por otro, entre AND y ZAM y mucho menores entre AND y CAT-MALL al
igual que entre las razas CAT y ZAM.
El análisis jerárquico mostró, tal y como era de esperar, que las
mayores diferencias se presentaran entre razas con respecto al total,
más que entre las subpoblaciones dentro de razas y dentro de las
subpoblaciones 6.4% vs. 3.5% y 3.0%, respectivamente.
El déficit de heterocigotos en todas las razas osciló entre el 13.0%
y el 23.2% para las razas del asno de las Encartaciones y la raza

DISCUSIÓN GENERAL
133
Andaluza, respectivamente. La principales causas de este déficit
podrían variar por raza; atribuyéndose principalmente en las razas
AND, CAT y ZAM a la consanguinidad, dado que más del 75% de los loci
se encontraron en déficit; aunque en estas razas también se presentó
un significativo valor de diferenciación genética (FST) dentro de razas, lo
que indica además una cierta subestructuración reproductiva. Mientras
que, en las razas ENC y MALL, el déficit podría ser explicable,
primordialmente, por la subestructuración reproductiva (efecto
Wahlund), más que por consanguinidad, ya que tan solo 6 y 5 de los
marcadores, respectivamente, mostraron déficit significativo.
Otro efecto que no podemos olvidar como posible causante de
déficit de heterocigotos es el derivado de los alelos nulos, los cuáles, a
pesar de no haber podido ser verificados (dada la carencia de
información genealógica en la mayoría de las razas), no deberían ser
obviados, ya que nos podrían ayudar a explicar parte del déficit
presente en todas las razas, en especial la de los marcadores HTG4 y
HMS7, estando este último ya reportado en caballos de la raza “Quarter
horse” (Bozzini y col., 1997).
La divergencia genética existente entre las razas queda reflejada
gráficamente en los árboles (dendrogramas) generados en el estudio de
las relaciones filogenéticas. Dependiendo de la distancia utilizada, las
mayores divergencias se presentaron entre las razas AND y CAT para
todas las distancias evaluadas; mientras que las menores fueron entre
AND y ZAM, cuando las distancias fueron la DA y DS, y las razas MALL-
ENC en la evaluación con la distancia de Reynolds.
Sin embargo, los árboles generados y evaluados por
permutaciones bootstrap nos produjeron dos claros patrones de
organización: en primer lugar una estrecha relación entre las razas CAT
y MALL las cuáles siempre formaron una agrupación más o menos

DISCUSIÓN GENERAL
134
sólida, y por otro lado, la separación o cierto distanciamiento de la raza
AND con el resto de las razas españolas, llegando al caso inclusive, que
utilizando la distancia de Reynolds, esta raza clusterizó con el asno de
Marruecos, dando indicios de un posible origen común.
Las divergencias genéticas entre las razas, desde un punto de
vista general, parecería que por si sola no aportan mucho a un
programa de conservación; sin embargo, si tomamos en cuenta que
estas poblaciones son de un número efectivo reducido, dichas
relaciones podrían servirnos, en casos extremos, a la hora de decidir
sobre la utilización de otra raza cercana o próxima a la que está en
peligro a la hora de buscar incrementar su Ne y así evitar su extinción.
Las representaciones gráficas, tanto de la metodología PCA como
DAS, nos dio una distribución más o menos similar a la obtenida
previamente con las distancias genéticas, agrupando por un lado de
forma más próxima a las razas CAT y MALL y más retirada o distante la
raza AND. Con respecto al análisis de Weitzman, el patrón de variación
genética o aporte de cada una de las razas al pool genético osciló entre
el 19.9% del asno de las Encartaciones y el 29.11% para la raza
Catalana; por lo cuál resulta obvio que la pérdida de la raza CAT
causaría una mayor pérdida que la extinción de la raza ENC o inclusive
la MALL. Este último análisis presenta otra utilidad práctica para la
conservación de razas, ya que en situaciones cuando los recursos
económicos son reducidos o limitados, nos permite establecer
prioridades en base al aporte genético de ciertas razas a la diversidad
genética en una población. Pudiendo por lo tanto, elegir para conservar,
aquélla (s) raza (s) que nos aporten un mayor nivel de variabilidad
genética a la población.
Dado que otro de los puntos a discutir es el mínimo incremento
de consanguinidad por generación, obviamente lo ideal sería contar con
DISCUSIÓN GENERAL
135
los registros genealógicos de las razas y a partir de allí programar
aquellos apareamientos que resultasen con una descendencia menos
consanguínea; sin embargo, conocida la falta de esta información,
podemos, a partir de la información generada por los microsatélites
estimar estas relaciones y así poder, mediante las combinaciones
haplotípicas de los diferentes marcadores y la proporción de alelos
compartidos, programar los apareamientos de mínima consanguinidad.
En este punto podemos citar el trabajo recientemente publicado
por Eding y Meuwiseen (2001). En él se realiza el cálculo de un índice
de parentesco a partir de la información generada por los microsatélites,
denominado “Índice de Similitud”, bastante parecido al índice de
parentesco calculado a partir de los registros genealógicos (elevada
correlación entre ambos). En dicho trabajo se concluye que en casos de
poblaciones con falta de pedigrí (como las aquí plasmadas), la
información molecular puede sustituir las estimaciones genealógicas de
parentesco y así poder tomar decisiones acertadas para los planes de
conservación.
Es así que, la información generada en este trabajo, puede ser
utilizada para el cálculo del índice de parentesco (índice de similitud) y
así poder programar aquel apareamiento más óptimo entre un macho y
una hembra que maximice el llamado Índice de Conservación Genética
y minimice la Consanguinidad (F) de un hipotético hijo de la pareja, con
lo cuál podemos mantener al máximo la variabilidad genética de las
poblaciones.
Por otra parte, los resultados obtenidos a partir de los estudios
con el mtDNA, además de proveer las primeras evidencias de estudios
moleculares a este nivel, nos permitió observar que las razas asnales
presentan un bajo nivel de variación genética mitocondrial. Con
respecto a las relaciones filogenéticas los resultados parecen indicar

DISCUSIÓN GENERAL
136
que el origen evolutivo del asno español podría derivarse de un único y
común tronco ancestral con las razas africanas estudiadas y que desde
entonces han ido evolucionando de acuerdo a las preferencias de los
criadores y al ambiente en el cual se han desarrollando; o bien que,
procediendo de dos troncos ancestrales, las actuales razas españolas
serían producto de una mezcla de diferentes líneas maternas como
consecuencia de la gran afluencia africana que ha tenido España,
directa o indirectamente, ya sea a través de los movimientos
poblacionales e intercambios que han producido un verdadero trasiego
de asnos africanos que se han cruzados con asnos españoles y
viceversa (Romagosa, 1959).
En segundo lugar, efectos del tipo “cuellos de botella” o “efectos
fundadores” explicarían la inesperada separación de la raza ENC del
resto de las razas estudiadas, y en tercer lugar, cabe destacar la gran
similitud presentada entre las razas AND y MAJ, ya que estas
comparten la mayoría de los haplotipos encontrados (tanto del
citocromo b como del D-loop) lo que nos sugiere un posible origen
ancestral común o bien que ha existido un gran intercambio de
reproductores entre ellas.
Y para finalizar podemos corroborar que el tiempo de divergencia
del asno y el caballo a partir del fragmento del D-loop, correspondió a
cerca de 9 millones de años, coincidiendo con lo referido por Xu y col.
(1996); aunque más temprano que lo citado por otros autores (Lindsay
y col., 1980; George y Ryder, 1986; Kim y col., 1999) de tan solo 1.5 a
3.5 millones. La diferencia entre las aproximaciones de la divergencia,
están relacionadas en primer lugar con la región o fragmento utilizado
para el cálculo, y en segundo lugar, por las tasas evolutivas de estos.

Raza Majorera
6. CONCLUSIONES

CONCLUSIONES
138
De acuerdo a los resultados obtenidos las principales
conclusiones de este trabajo son las siguientes:
1. La utilización de marcadores de caballos resultó exitosa y de gran
utilidad para los estudios en poblaciones de asnos. Salvo la
excepción del microsatélite ASB2 que no amplificó y el HMS1 que fue
monomórfico, los demás fueron altamente polimórficos.
2. Las razas asnales españolas no mostraron diferencias
estadísticamente significativas entre ellas en cuanto a sus niveles de
variabilidad genética.
3. La probabilidad de exclusión (PE) obtenida con este conjunto de
marcadores de 99.99%, resulta de gran utilidad para futuras
pruebas de paternidades. El polimorfismo encontrado nos sirve
además para la identificación individual de los animales, al igual que
la asignación de individuos a raza, la cuál es pieza clave para la
gestión del programa de conservación.
4. La diferenciación genética entre las razas asnales fue del 4.1%,
siendo como promedio el déficit de heterocigotos por raza del 17.8%.
El mayor déficit correspondió a las razas AND, CAT y ZAM, en las
cuáles la consanguinidad y la subestructuración reproductiva juegan
un papel muy importante. Este último fenómeno parece ser la
principal causa de déficit en las razas ENC y MALL.
5. Según el análisis de Weitzman, las razas que aportan mayor
diversidad a la población son la CAT con el 29.11% y la AND con el
27.53%, siendo la que menos aporta el asno de las Encartaciones
con tan solo un 19.19%. La agrupación AND, CAT y ENC aporta un
78.20% al total de la variabilidad.
CONCLUSIONES
139
6. Las relaciones genéticas mostraron que las razas más próximas
fueron siempre la CAT y MALL, estando la AND siempre más alejada
de la razas del norte de España y más próxima a la del asno de
Marruecos.
7. El análisis del mtDNA permitió detectar tan solo 6 haplotipos a partir
del citocromo b y 7 a partir de la región D-loop, mostrando por tanto
un bajo nivel de variabilidad en las razas asnales analizadas.
8. Los resultados del mtDNA permiten indicar que el estado actual de
las razas asnales españolas parece corresponder al producto de una
mezcla de líneas maternas debido posiblemente a un elevado flujo de
genes entre ellas, o bien qué, el origen evolutivo del asno español
podría derivarse de un único y común tronco ancestral con las razas
africanas.
9. El tiempo de divergencia entre el asno y el caballo, correspondió a 9
MYA, similar a otros reportes.

Raza Andaluza
7. BIBLIOGRAFÍA CONSULTADA

BIBLIOGRAFÍA CONSULTADA
141
ADAMETZ, L. (1943). Zootecnia General, Ed. Labor, Madrid, España.
ALDERSON, G.W., GIBBS, H.L., SEALY, S.G. (1999). Parentage andKinship studies in an obligate brood parasitic bird, the Brown-headed cowbird (Molothrus ater), using microsatellite DNA markers.The Journal of Heredity, 90, 182-190.
ANONYMOUS. (1992). Recommendations of the FAO expertconsultation. En: Hodges J. (Ed.), The Management of Global AnimalGenetics Resources. Food and Agriculture Organisation of theUnited Nations, Rome, pp. 1-24.
APARICIO, G. (1960). Zootecnia Especial. Etnología compendiada.Imprenta Moderna Córdoba.
ARANGUREN-MENDEZ, J.A., JORDANA, J., GOMEZ, M. (2001).Genetic diversity in Spanish donkey breeds using microsatellite DNAmarkers. Genetics Selection and Evolution. 33, 433-442.
ARMOUR, J.A., NEUMANN, R., GOBERT, S., JEFFREYS A.J. (1994).Isolation of human simple repeat loci by hybridization selection.Human Molecular Genetics 3, 599-605.
ARRANZ, J.J. BAYON, Y., SAN PRIMITIVO, F. (2001). Geneticvariation at microsatellite loci in Spanish sheep. Small RuminantResearch, 39, 3-10.
AUSUBEL, F.M., BRENT, R., KINGSTON, R.E., MOORE, D.D.,SEIDMAN, G.G., SMITH, J.A., STRUHL, K. (1987). CurrentProtocols in Molecular Biology, Green Publishing Associates andWiley-Interscience, New York.
AVISE, J.C., LANSMAN, R.A., SHADE, R.O. (1979). The use ofrestriction endonucleases to measure mitochondrial DNA sequencerelatedness in natural populations. I. Population structure andevolution in the genus Peromyscus. Genetics, 92, 279-295.
AVISE, J.C., ARNOLD, J. BALL, M.B., BERMINGHAM, E. LAMB, T.,NEIGEL, J.E., REB, C.A., SAUNDERS, N.C. (1987). Intraespecifphylogeography: the mitocondrial DNA bridge between populationgenetics and systematics. Annual Reviews Ecological Systematic,18, 459-522.
BAILEY, E., GRAVES, K.T., COTHRAN, E.G., REID, R., LEAR, T.L.,ENNIS, R.B. (1995). Synteny-mapping horse microsatellite markersusing a heterohybridoma panel. Animal Genetics. 26, 80-111.

BIBLIOGRAFÍA CONSULTADA
142
BARKER, J.S.F. (1999) Conservation of livestock diversity. AnimalGenetic Resources Information. 25, 33-43.
BARKER, J.S.F., BRADLEY, D.G., FRIES, R., HILL, W.G. NEI, M.,WAYNE , R.K. (1993). An integrated global programme to establishthe genetic relationships among the breeds of each domestic animalspecies. FAO Animal Production and Health Division, Rome Italy.
BARKER, J.S.F., MOORE, S.S., HETZEL, D.J.S., EVANS, S., TAN,S.G., BYRNE, K. (1997). Genetic diversity of Asian water buffalo(Bubalus bubalis): microsatellite variation and a comparison withprotein-coding loci. Animal Genetics. 28, 103-115.
BEAUMONT, M.A., BRUFORD, M.W. (1999). Microsatellites inconservation genetics. En: Goldstein, D. and Schötterer, C. (eds.)Microsatellites Evolution and Applications. Cap. 13, pp.165-182.Oxford University Press, New York.
BELLONE, R.R., COTHRAN, E.G., KETCHUM, M.S. (1998). Geneticvariation in the rare donkey breed, Baudet du Poitou. AnimalGenetics. 29, (Suppl. 1), 17.
BINNS, M.M., HOLMES, N.G., HOLLIMAN, A., SCOTT A.M. (1995).The identification of polymorphic microsatellite loci in the horse andtheir use Thoroughbred parentage testing. British VeterinaryJournal. 151, 9-15.
BJØRNSTAD, G., GUNBY, E., RØED, K.H. (2000). Genetic structure ofNorwegian horse breeds. Journal of Animal Breeding and Genetics.117, 307-317.
BLOTT, S.C., WILLIAMS, J.L., HALEY, C.S. (1998). Geneticsrelationships among European cattle breeds. Animal Genetics. 29,273-282.
BODO, I. (1992). The minimum number of preserved populations. En:Hodges, J. (ed.) The management of global animal genetic resources.Paper 104, 91-105. Rome: FAO Animal Production and Health.
BOTSTEIN, D., WHITE R.L., SKOLNICK, M., DAVIS, R.W. (1980).Construction of a genetic linkage map in man using restrictionfragment length polymorphisms. American Journal of HumanGenetics. 32, 314-331.

BIBLIOGRAFÍA CONSULTADA
143
BOWCOCK, A.M., RUIZ-LINARES, A., TOMFOHRDE, J., MINC, E.,KIDD, J.R., CAVALLI-SFORZA, L.L. (1994). High resolution ofhuman evolutionary trees with polymorphic microsatellites. Nature.368, 455-457.
BOWLING, A.T, CLARK, R.S. (1985). Blood group and proteinpolymorphism gene frequencies for seven breeds of horses of UnitedStates. Anim. Blood Gr. and Biochem. Genet. 16, 93-108.
BOWLING, A.T., EGGLESTON-STOTT, M.L., BYRNS, G., CLARK,R.S., DILEANIS, S., WICTUM, E. (1997). Validation of microsatellitemarkers for routine horse parentage testing. Animal Genetics. 28,247-252.
BOWLING, A.T., DEL VALLE, A., BOWLING, M. (1998). Verification ofhorse maternal lineage based on derived mitochondrial DNAséquense. Journal of Animal Breeding and Genetics. 115, 351-355.
BOWLING, A.T. (2001). Historical development and application ofmolecular genetic tests for horse identification and parentagecontrol. Livestock Production Science. 72, 11-116.
BOZZINI, M., EGGLESTON-STOTT, M., DEL VALLE, A., ZIEGLE, Y.(1997). Addition of degenerate primer in multiplex PCR,s correctsthe equine microsatellite locus HMS7 null allele in the Quarterhorse. Abstracts P50. Plant & Animal Genome V Conference.
BREEN, M., DOWNS, P., IRVIN, Z., BELL, K. (1994). Intragenericamplification of horse microsatellite markers with emphasis on thePrzewalski’s horse (E. przewalskii). Animal Genetics. 25, 401-405.
BREEN, M., LINDGREN, G., BINNS, M.M. (1997). Genetical andphysical assignments of equine microsatellites –First integration ofanchored markers in horse genome mapping. Mammalian Genome.8, 267-273.
BROWN, W.M., GEORGE, M.Jr., WILSON, A.C. (1979). Rapid evolutionof mitochondrial DNA. Proceedings of the National Academy ofSciences of USA. 76, 1967-1971.
CABALLERO, A., TORO, M.A. (2002). Analysis of genetic diversity forthe management of conserved subdivided populations. ConservationGenetics. (In Press).
CAMAC, R.O (1989). Introduction and Origins of the Donkey. En:Svendsen E. D. (Ed.), The professional handbook of the Donkey, 2ndedn., The Donkey Sanctuary, Sidmouth, Devon, pp. 1-10.

BIBLIOGRAFÍA CONSULTADA
144
CAÑON, J., CHECA, M.L., CARLEOS, C., VEGA-PLA, J.L., VALLEJO,M., DUNNER S. (2000). The genetic structure of Spanish Celtichorse breeds inferred from microsatellite data. Animal Genetics. 31,39-48.
CAVALLI-SFORZA, L.L., EDWARDS, W.F. (1967). Phylogeneticanalysis: Models and estimation procedures. American Journal ofHuman Genetics. 19, 233-257.
CAVALLI-SFORZA, L.L., MENOZZI, P., PIAZZA, A. (1994). The historyand geography of human genes. Princeton University Press,Princeton, NJ.
CHAKRABORTY, R., JIN, L. (1993). A unified approach to studyhypervariable polymorphisms: Statistical considerations ofdetermining relatedness ans population distance. En: PENA, S.D.J.,CHAKRABORTY, R., EPPLENJ, J.T., JEFFREYS, A.J. (eds.). DNAfinger-printing: state and the science. Birkhäuser Verlag, Basel.Switzerland. pp. 153-175.
CHENG, H.H., CRITTENDEN, L.B. (1994). Microsatellite markers forgenetic mapping in the chicken. Poultry Science. 73, 539-546.
CHENG, H.H., LEVIN, I., VALLEJO, R.L., KHATIB, H., DODGSON,J.B., CRITTENDEN, L.B., HILLEL, J. (1995). Development of agenetic map of the chicken with markers of high utility. PoultryScience. 74, 1855-1874.
CHESSER, R.K. (1983). Genetic variability within and amongpopulations of the black-tailed prairie dog. Evolution. 37, 320-331.
CLUTTON-BROCK, J. (1987). A natural history of domestic mammals,Vol. 2. Cambridge University Press, Cambridge.
COTHRAN, E.G., KOVAC, M. (1997). Genetic analysis of the CroatianTrakehner and Posavina horse breeds. Zivocišna Výroba. 42, 207-212.
CORNUET, J.M., PIRY, S., LUIKART, G., ESTOUP, A., SOLIGNAC, M.(1999). New methods employing multilocus genotypes to select orexclude populations as origins of individuals. Genetics. 153, 1989-2000.
CROW, J.F., KIMURA, M. (1970). An introduction to populationgenetics theory. New York, Evanston and London. Harper and RowPublishers.

BIBLIOGRAFÍA CONSULTADA
145
DAWSON, R.J.G., GIBBS, H.L., HOBSON, K.A., YEZERINAC, S.M.(1997). Isolation of microsatellite DNA markers from a passerinebird, Dendroica petechia (the yellow warbler), and their use inpopulation studies. Heredity. 79, 506-514.
DI RIENZO, A. PETERSON, A.C., GARZA, J.C., VALDES, A.M.,SLATKIN, M., FREIMER, N.B. (1994). Mutational processes ofsimple-sequence repeat loci in human populations. Proceedings ofthe National Academy of Sciences of USA. 91, 3166-3170.
DELGADO, J.V., FRESNO, M.R., BARBA, C., HERNANDEZ, J.,RODERO, E., SIERRA, A.C. (1998). El burro Majorero decripciónetnogenética y funcional. 3er Coloquio Internacional sobre equidosde trabajo. Mexico, Univ. Nacional Autonoma de Mexico. pp. 343-348.
DODGSON, J.B., CHENG, H.H., OKIMOTO, R. (1997). DNA markertechnology: a revolution in animal genetics. Poultry Science. 76,1108-1114.
EDING, H. LAVAL, G. (1999). Measuring genetic uniqueness inlivestock. En: OLDENBROEK, K. (ed.) Genebanks and themanagement of farm animal genetic resources, IDO-DL press. TheNetherlands, pp. 33-58.
EDING, H., MEUWISEEN, T.H.E. (2001). Marker-based estimates ofbetween and within population kinships for the conservation ofgenetic diversity. Journal of Animal Breeding and Genetics. 118,141-159.
EISEN, J.A. (1999). Mechanistic basis for microsatellite instability. En:Goldstein, D. and Schötterer, C. (eds.) Microsatellites Evolution andApplications. Cap. 4, pp.34-48. Oxford University Press, New York
ELLEGREN, H., JOHANSSON, M., SANDBERG, K., ANDERSSON, L.(1992). Cloning of highly polymorphic microsatellite in the horse.Animal Genetics. 23, 133-142.
EPSTEIN, H. (1984). Ass, mule and onager. En: Mason, I. L. (ed.)Evolution of domesticated animals. pp 174-184. Longman, Londonand New York.
ESTOUP, A., GARNERY, L., SOLIGNAC, M., CORNUET, J.M. (1995).Microsatellite variation in honey bee (Apis mellifera L.) populations:hierarchical genetic structure and test of the infinite allele andstepwise mutation models. Genetics. 140, 679-695.

BIBLIOGRAFÍA CONSULTADA
146
ESTOUP, A., COURNET, J-M. (1999). Microsatellite evolution :inferences from population data. En: Goldstein, D. and Schlötterer,C. (eds.) Microsatellites Evolution and Applications. Cap. 5, pp.49-65. Oxford University Press, New York.
FALK, D.A. (1991). Joining biological and economic models forconserving plant genetic diversity. En: Falk DA et al (ed.,).Geneticsand conservation of rare plants. pp 209-224. Oxford UniversityPress, New York.
FAO. (1995). World watch list for Domestic Animal Diversity. 2nd Ed.FAO, Rome.
FARID, A., O`REALLY, E., DOLLARD, C., KELSEY, Jr. C.R. (2000).Genetic analysis of ten sheep breeds using microsatellite markers.Canadian Journal of Animal Science. 80, 9-17.
FELSENSTEIN, J. (1995). Phylip (Phylogeny Inference package),Version 3.57c. University of Washington, Seattle, WA.
FOLCH, P. (1998). Programa de conservació i manteniment de recursosgenètics animals en la raça asinina Catalana. Tesis Doctoral,Universidad Autònoma de Barcelona. España.
FORBES, S.H., HOGG, J.T., BUCHANAN, F.C., CRAWFORD, A.M.,ALLENDORF, F.W. (1995). Microsatellite evolution in congenericmammals: Domestic and Bighorn sheep. Molecular Biology andEvolution. 12, 1106-1113.
GARCÍA-DORY, M.A., MARTÍNEZ, S., OROZCO, F. (1990). Guía decampo de las razas autóctonas españolas, Alianza Editorial, Madrid.
GEORGE, M.Jr., RYDER, O.A. (1986). Mitochondrial DNA evolution inthe gene Equus. Molecular Biology and Evolution. 3, 535-546.
GOLDSTEIN, D.B., RUIZ-LINARES, A., CAVALLI-SFORZA, L.L.,FELDMAN, M.W. (1995). Genetic absolute dating based onmicrosatellites and the origin of modern humans. Proceedings of theNational Academy of Sciences of USA. 92, 6723-6727.
GOLDSTEIN, B.D., SCHLÖTTERER C. (1999). Microsatellites:evolution and applications. Oxford University Press, New York;352pp.
GÓMEZ, M. (1997). Razas autóctonas Vascas. Catálogo etnológico. Ed.Mesa técnica de Recursos Genéticos Animales. Fondo decooperación Euskadi-Aquitania. Vitoria-Gasteiz. pp. 43.

BIBLIOGRAFÍA CONSULTADA
147
GONZÁLEZ-CANDELAS, F., MONTOLIO, A. (2000). Geneticdifferentiation and structure of Hippocrepis valentina (Leguminosae)populations. The Journal of Heredity. 91, 134-141.
GOUDET, J. (2000). FSTAT Ver. 2.9.1. Computer package for PCs.Institute of ecology, Biology building, UNIL, CH-1015 Lausane,Switzerland.
GROSSMANN, L.I., SHOUBRIDGE, E.A. (1996). Mitochondrial geneticsand human disease. BioEssays. 18, 983-991.
GUERIN G., BERTAUD M., AMIGUES Y. (1994). Characterisation ofseven new horse microsatellites: HMS1, HMS2, HMS3, HMS4,HMS5, HMS6, HMS7, and HMS8. Animal Genetics. 25, 62.
GUIFFRA, E., KIJAS, J., AMARGER, V., CARLBORG, J., JEON, T.ANDERSON, L. (2000). The origin of domestic pig: Independentdomestication and subsequent introgression. Genetics. 154, 1785-1791.
GUO, S.W., THOMPSON, E.A. (1992). Performing the exact of Hardy-Weinberg proportions for multiple alleles. Biometrics. 48, 361-372.
HALL, S.J.G. (1993).Strategies for genetic improvement of locallivestock and their consequence for conservation. En:CARTWRIGHT, A. (ed.) World Agriculture. Sterling Publishing GroupPLC, London. pp. 75-77.
HANCOCK, J. (1999). Microsatellites and other simple sequence:genomic context and mutational mechanisms. En: Goldstein D.,Schlotterer C. (Eds.), Microsatellites. Evolution and Applications,Oxford University Press, New York, pp. 1-10.
HARDY, G.H. (1908). Mendelian proportion in a mixed population.Science. 28, 49-50.
HIENDLEDER, S., MAINZ, K., PLANTE, Y. LEWASLSKI, H. (1998).Analysis of mitochondrial DNA indicates that domestic sheep arederived from two different ancestral maternal sources: no evidencefor contributions from urial and argali sheep. The Journal ofHeredity . 89, 113-120.
HORIN, P., COTHRAN, E. G., TRTKOVA, K., MARTI, E., GLASNAK,V., HENNEY, P., VYSKOCIL, M., LAZARY, S. (1998). Polymorphismof Old Kladruber horses, a surviving but endangered baroque breed.Eur. J. Immunogenet. 25, 357-363.

BIBLIOGRAFÍA CONSULTADA
148
HUTCHISON, C.A., NEWBOLD, J.E., POTTER, S.S., HALL, E.M.(1974). Maternal inheritance of mammalian mitochondrial DNA.Nature. 251, 535-546.
ISHIDA, N., HASEGAWA, T., TAKEDA, K., SAKAGAMI, M., ONISHI,A., INUMARU, S., KOMATSU, M., MUKOYAMA, H. (1994).Polymorphic sequence in the D-loop region of equine mitochondrialDNA. Animal Genetics. 25, 215-221.
ISHIDA, N., OYUNSUREN, T., MASHIMA, S., MUKOYAMA, H.SAITOU, N. (1995). Mitochondrial DNA sequences of various speciesof the genus Equus with special reference to the phylogeneticrelationship between Przewalski´s wild horse and domestic horse.Journal of Molecular Evolution. 41, 180-188.
JAMIESON, A. (1994). The effectiveness of using codominantpolymorphic allelic series for (1) checking pedigrees and (2)distinguishing full-sib pair members. Animal Genetics. 25, (Suppl.1), 37-44.
JEFFREYS, A.J., WILSON, V., THEIN, S.L. (1985). Hypervariable“minisatelite” regions in human DNA. Nature. 314, 67-73.
JONES, A.G., ÖSTLUND-NILSSON, S., AVISE, J.C. (1998). Amicrosatellite assessment of sneaked fertilizations and eggs thieveryin the fifteenspines stickelback. Evolution. 52, 848-858.
JORDANA, J., PIEDRAFITA, J., SANCHEZ, A., PUIG, P. (1992).Comparative F statistics analysis of the genetic structure of tenSpanish dog breeds. The Journal of Heredity . 83, 367-374.
JORDANA, J., FOLCH, P. (1997). The Catalonia donkey breed: programof conservation and improvement of an endangered breed. Archivosde Zootecnia. 47, 403-409.
JORDANA, J., FOLCH, P., SANCHEZ, A. (1999). Genetic variation(protein markers and microsatellites) in endangered Cataloniandonkeys. Biochemical System Ecology. 27, 791-798.
JORDANA, J., FOLCH, P., ARANGUREN, J.A. (2001). Microsatelliteanalysis of genetic diversity in the Catalonian donkey breed. Journalof Animal Breeding and Genetics. 118, 57-63.

BIBLIOGRAFÍA CONSULTADA
149
KANTANEN, J., OLSAKER, I., HOLM, L.-E., LIEN, S., VIKKI, J.,BRUSGAARD, K., EYTHORSDOTTIR, E., DANELL, B.,ADALSTEINSSON, S. (2000). Genetic diversity and populationstructure of 20 North European cattle breeds. Journal of Heredity .91, 446-457.
KIM, K.L., YANG, Y.H., LEE, S.S., PARK, C., MA, R., BOUZAT, J.L.,LEWIN, H.A. (1999). Phylogenetic relationships of Cheju horse toother horse breeds as determined by mtDNA D-loop sequencepolymorphism. Animal Genetics. 30, 102-108.
KUMAR, S. TAMURA, K., JOKOBSEN, I.B., NEI, M. (2001). MEGA2:Molecular Evolutionary Genetics Análisis software. Arizona StateUniversity. Tempe, Arizona, USA.
LAND, R.B. (1986). Genetic resources requirements under favourableproduction marketing systems: priorities and organization. En: 3rd
World Congress on Genetics Applied to Livestock Production.Lincoln (USA), Univ. of Nebraska. Vol XII, pp 486-491.
LAU, C.H., DRINWATER, R.D., YUSOFF, K., TAN, S.G., HETZEL,D.J.S., BARKER, J.S.F. (1998). Genetic diversity of Asian waterbuffalo (Bubalus bubalis): Mitochondrial DNA Dloop andcytochrome b sequence variation. Animal Genetics. 29, 253-264.
LAVAL, G., IANNUCCELLI, N., LEGAULT, C., ET AL. (2000). Geneticdiversity of eleven European pig breeds. Genetics Selection andEvolution. 32, 187-203.
LEVIN, I., SANTAGELO, L., CHENG, H., CRITTENDEN, B.,DODGSON, B. (1994). An autosomal genetic linkage map of thechicken. The Journal of Heredity. 85, 79-85.
LINDSAY, E.H., OPDYKE, N.D., JOHNSON, N.M. (1980). Pliocenedispersal of the horse Equus and late Cenozoic mammaliandispersal events. Nature. 287,135-138.
LITT, M., LUTY, J.A. (1989). A hypervariable microsatellite revealed byin vitro amplification of a dinucleotide repeat within the cardiacmuscle actin gene. American Journal of Human Genetics. 44, 397-401.
LITTAUER, M.A., CROUWEL, J.H. (1979). Wheeled vehicles and riddenanimals in the ancient near east. Brill, Leiden and Köln.

BIBLIOGRAFÍA CONSULTADA
150
LOFTUS, R.T., MACHUGH, D.E., BRADLEY, D.G., SHARP, P.M.,CUNNINGHAM, P. (1994). Evidence for two independentdomestications of cattle. Proceedings of the National Academy ofSciences of USA.. 91, 2757-2761.
LORENZO, J. (1997). Conocimiento y conservación de las razasautóctonas: "El asno Zamorano-Leonés" estudio del estado actual dela raza en la provincia de Zamora; valoración general: Aspectosbiopatológicos y funcionales, Tesis Doctoral, Universidad de León,España.
MACHUGH, D.E., LOFTUS, R.T., CUNNINGHAM, P., BRADLEY, D.G.(1998). Genetic structure of seven European cattle breeds assessedusing 20 microsatellites markers Animal Genetics 29, 333-340.
MAIJALA, K., CHEREKAEV, A.V., DEVILLARD, J.M., REKLEWSKI,Z., ROGNONI, G., SIMON, D.L., STEANE, D.E. (1984).Conservation of animal genetic resources in Europe. Final of anE.A.A.P., working party. Livestock Production Science. 11, 3-22.
MANNEN, H., TSUJI, S., LOFTUS, R.T., BRADLEY, D.G. (1998).Mitochondrial DNA variation and evolution of Japanese black cattle(Bos taurus). Genetics. 150, 1169-1175.
MARKLUND, S., ELLEGREN, H., ERIKSSON, S., SANDBERG, K.,ANDERSSON, L. (1994). Parentage testing and linkage analysis inthe horse using a set of highly polymorphic microsatellites. AnimalGenetics. 25, 19-23.
MASON, I.L. (1974). Introduction to round table a: The conservation ofanimal genetic resources. Proceedings of the 1st World Congress ofApplied Livestock Production. 2, 13-21.
MINCH, E., RUIZ-LINARES, A., GOLDSTEIN, D.B., FELDMAN, M.W.,CAVALLI-SFORZA L.L. (1995). MICROSAT (version 1.4): a computerprogram for calculating various statics on microsatellite allele data.www: http://lotka.stanford.edu/research/distance.html.
MOAZAMI-GOUDARZI, K., LALOË, D., FURET, J.P., GROSCLAUDE,F. (1997). Analysis of genetic relationship between 10 cattle breedswith 17 microsatellites. Animal Genetics. 28, 338-345.
MULLIS, K.B., FALOONA, F., SCHARF, S., SAIKI, R., HORN, G.,ERLICH, H. (1986) Specific enzymatic amplification of DNA in vitro:the polymerase chain reaction. Cold Spring. Harb. Symp.Quant.Biol.51, 263-273.

BIBLIOGRAFÍA CONSULTADA
151
MUNDY, N.I., WOODRUFF, D.S. (1996) Polymorphic microsatellitemarkers in the loggerhead shrike, Lanius ludovicianus, isolated froma library enriched for CA repeats. Molecular Ecology. 5, 811-813.
MURRAY, B.W. (1996). The estimation of genetic distance andpopulation substructure from microsatellite allele frequency data.Http://www.helix.biology.mcmaster.ca/brent/brent.html
NAGAMINE, Y., HIGUCHI, M. (2001). Genetic distance andclassification of domestics animals using genetic markers. Journal ofAnimal Breeding and Genetics. 118, 101-109.
NAUTA, M.J., WEISSING, F.J. (1996). Constrains on allele size atmicrosatellite loci: implications for genetic differentiation. Genetics.143, 1021-1032.
NAVERO, L.M . (1987). Aportación al conocimiento y la problemática delgarañon Andaluz-Cordobes. (ADEBO).
NEI, M . (1972). Genetic distances between populations. AmericanNaturalist. 106, 283-292.
NEI, M. (1973). Analysis of gene diversity in subdivided populations.Proceedings of the National Academy of Sciences of USA. 70, 3321-3323.
NEI, M. (1977). F-statistics and analysis of gene diversity in subdividedpopulations. Ann. Hum. Genet. 41, 225-233.
NEI, M. (1978). Estimation of average heterozygosity and geneticdistance from a small number of individuals. Genetics. 89, 583-590.
NEI, M., LI, S. (1979). Mathematical model for studying geneticvariation in terms of restriction endonucleases. Proceedings of theNational Academy of Sciences of USA. 76, 5269-5273.
NEI, M., TAJIMA, F. (1981). DNA polymorphism detectable byrestriction endonucleases. Genetics. 97, 145-163.
NEI, M., TAJIMA, F., TATENO, T. (1983). Accuracy of estimatedphylogenetic trees from molecular data. Journal Molecular andEvolution. 19, 153-170.
NEI, M. (1987). Molecular evolutionary genetics. Columbia UniversityPress. New York.

BIBLIOGRAFÍA CONSULTADA
152
NEUMAN, K., WETTON, J.H. (1996). Highly polymorphicmicrosatellites in the house sparrow, Passer domesticus. MolecularEcology. 5, 307-309.
NOZOWA, K., SHOTAKE, T., KAWAMOTO, Y. (1998). Phylogeneticrelationship among Japanese native and alien horses estimated byprotein polymorphisms. Journal of Equine Science. 9, 53-69.
OTA, T. (1993). DISPAN: Genetic Distance and Phylogenetic Analysis,Pennsylvania State University, University Park, PA.
PAETKAU, D., CALVERT, W., STIRLING, I., STROBECK, C. (1995).Microsatellite analysis of population structure in Canadian polarbears. Molecular Ecology. 4, 347-354.
PAYERAS, L. FALCONER, J. (1998). Races autóctones de les IllesBaleares. Govern Balear. Palma de Mallorca, España. pp 445.
PEELMAN, L.J., MORTIAUX, F., VAN ZEVEREN, A., DANSERCOER,A., MOMMENS, G., COOPMAN, F., BOUQUET, Y., BURNY, A.,RENAVILLE, R., PORTETELLE, D. (1998). Evaluation of the geneticvariability of 23 bovine microsatellite markers in four Belgian cattlebreeds. Animal Genetics. 29, 161-167.
PONSUKSILI, S., WIMMERS, K., SCHMOLL, F., HORST, P.,SCHELLANDER, K. (1999). Comparison of multilocus DNAfingerprints and microsatellites in an estimate of genetic distance inChicken. The Journal of Heredity. 90, 656-659.
PREVOSTI, A., OCANA, J., ALONZO, G. (1975). Distances betweenpopulation for Drosophila subobscura based on chromosomearrangement frequencies. Theorical Applied Genetics. 45, 231-241.
PRIM, R.C. (1957). Shortest connection networs and somegeneralizations. Bell System Technical Journal. 36, 1389-1401.
PRIMMER, C.R., ELLEGREN, H. (1998) Patterns of molecular evolutionin avian microsatellites. Molecular Biology and Evolution. 15, 997-1008.
RAMÍREZ de la FE, A.R., SOTILLO, F., SOTILLO, J.L. (1996). Razasasnales. En: BUXADÉ, C. (ed.), Producciones equinas y de ganadode lidia. Zootecnia, Tomo XII. Bases de Producción Animal.Capítulo X. Ediciones Mundi-Prensa. España, pp. 152-163.

BIBLIOGRAFÍA CONSULTADA
153
RANNALA, B., MOUNTAIN, J. (1997) Detecting immigration by usingmultilocus genotypes. Proceedings of the National Academy ofSciences of USA. 94, 9197-9201.
RAYMOND, M., ROUSSET, F. (1995). GENEPOP (Version 3.1):Population genetics software for exact test and ecumenicism, TheJournal of Heredity. 86, 248-249.
RENWICK, A., DAVINSON, L., SPRATT, H., PATRICK KING, J.,KIMMEL, M. (2001). DNA Dinucleotide evolution in Humans: fittingtheory to facts. Genetics. 159, 737-747.
REYNOLDS, J., WEIR, B.S., COCKERHAM, C.C. (1983) Estimation ofthe coancestry coefficient: Basis for a short-term genetic distance.Genetics. 105, 767-769.
ROCHAMBEAU, H., FOURNET-HANOCQ, F., VU TIEN KHANG, J.(2000). Measuring and managing genetic variability in smallpopulations. Ann. Zootech. 49, 77-93.
RODERO, E., VALERA, M., HERRERA, M., Y GÓMEZ, M. (1998)Situación actual de la población asnal autóctona española. Archivosde Zootecnia , 179, 523-528.
ROGERS, J.S. (1972). Measures of genetic similarity and geneticdistance. En: Studies in Genetics VII. University of TexasPublication 7213, pp. 145-153.
ROHLF, F.J. (2001). NTSYS-pc Numeral Taxonomy and MultivariateAnalysis System. Ver. 2.10j. Exeter publications, New York, USA.
ROMAGOSA, J.A. (1959). El Garañón Catalán, Tesis Doctoral,Universidad de Madrid, España.
RUANE, J. (1999). A critical review of the value of genetic distancestudies in conservation of animal genetic resources. Journal ofAnimal Breeding and Genetics. 116, 317-323.
SAITBEKOVA, N., GAILLARD, C., OBEXER-RUFF, G., DOLF, G.(1999). Genetic diversity in Swiss goat breeds based onmicrosatellite analysis. Animal Genetics. 30, 36-41.
SAITOU, N., NEI, M. (1987) The neighbor-joining method: a newmethod for reconstructing phylogenetic trees. Molecular Biology andEvolution. 4, 406-425.

BIBLIOGRAFÍA CONSULTADA
154
SALVANS, L., TORRENS, M. (1959). Ganado asnal y ganado mular.Editorial Salvat. Barcelona. España.
SAS. (1996). Institute Inc., SAS User’s Guide: Statistics. Version6.12. Cary, NC, USA.
SCHLÖTTERER, C., TAUTZ, D. (1992). Slippage synthesis of simplesequence DNA. Nucleic Acids Research. 20, 211-215.
SCHMID, M., SAITBEKOVA, C., DOLF, G. (1999). Genetic diversity inSwiss cattle breeds, Journal of Animal Breeding and Genetics. 116,1-8.
SCHNEIDER, S., ROESSLI, D. EXCOFFIER, L. (2000). Arlequin ver.2000: A software for population genetics data analysis. Genetics andBiometry Laboratory, University of Geneva, Switzerland.
SELANDER, R.B., KAUFMAN, D.W . 1975. Genetic structure ofpopulations of the brown snail (Helix apersa): I. Microgeographicvariation. Evolution. 29, 385-401.
SIMONS, D.L. (1984). Conservation of animal genetic resources. Areview. Livestock Production Science. 11, 23-36
SLATKIN, M. (1993). Isolation by distance in equilibrium and non-equilibrium populations. Evolution. 47, 264-279.
SOTILLO, J.L., SERRANO, V. (1985). Producción animal 1, EtnologíaZootecnia, Tebar-Flores, Madrid.
STAHLBERGER-SAITBEKOVA, N., SCHLÄPFER, J., DOLF, G.,GAILLARD, C. (2001). Genetic relationships in Swiss sheep breedsbased on microsatellite analysis. Journal of Animal Breeding andGenetics. 118: 379-387.
SWOFFORD, D.L., SELANDER, R. (1999). BIOSYS-2: A computerprogram for the analysis of allelic variation in population geneticsand biochemical systematics (Release 2.0). University of Illinois,Urbana, Champaign, IL.
TAKAHATA, N., NEI, M. (1985). Gene genealogy and variance ofinterpopulational nucleotide differences. Genetics. 110, 325-344.
TAKEZAKI, N., NEI, M., (1996). Genetic distance and reconstruction ofphylogenetic trees from microsatellite DNA. Genetics. 144, 389-399.

BIBLIOGRAFÍA CONSULTADA
155
TAMURA, K., NEI, M. (1993). The control region of mitochondrial DNAin humans and chimpanzees. Molecular Biology and Evolution. 10,512-526.
TAUTZ, D. (1989). Hypervariability of simple sequences as a generalsource for polymorphism markers. Nucleic Acids Research 12, 4127-4138.
TAUTZ, D., SCHLÖTTERER, C. (1994). Simple sequences. CurrentOpinion in Genetics and Development. 4, 832-837.
THAON D’ARNOLDI, C., FOULLEY, J.L., OLLIVER, L. (1998). Anoverview of the Weitzman approach to diversity. Genetics Selectionand Evolution. 30, 149-161.
THOMPSON, J.D., GIBSON, T.J., PLEWNIAK, F., JEANMOUGIN, F.,HIGGINS, D.G. (1997). The Clustal X windows interface: flexiblestrategies for multiple sequence alignment aided by qualityanalysis tools. Nucleic Acids Research. 24, 4876-4882.
TIVANG, J.G., NIENHUIS, J., SMITH, O.S. (1994). Estimation ofsampling variance of molecular data using the bootstrap procedure.Theoretical and Applied Genetics. 89, 259-264.
VAN HAERINGEN, H., BOWLING, A.T., STOTT, M.L., LENSTRA, J.A.,ZWAAGSTRA, K.A. (1994). A highly polymorphic horsemicrosatellite locus: VHL20, Animal Genetics. 25, 207.
VANCE, J.F., OTHMANE, K.M. (1998). Methods of genotyping. InHaines, J.L., Pericak-Vance, M.A. (eds.) Approaches to genemapping in complex human diseases. Cap. 9. pp 213-228. A JohnWiley & Son, Inc., Publication. NY.
VANHALA, T., TUISKULA-HAAVISTO, M., ELO, K., VILKKI, J., MÄKI-TANILA, A. (1998). Evaluation of genetic variability and geneticdistances between eight chicken lines using microsatellite markers.Poultry Science. 77, 783-790.
VIGILANT, L. STONEKING, M., HARPENDING, H., HAWKES, K.,WILSON, A.C. (1991). African population and evolution of humanmitochondrial DNA. Science. 253, 1503-1507.
VILA, C., AMORIM, I.R., LEONARD, J.A., POSADA, D.,CASTROVIEJO, S.J., PETRUCCI-FONSECA, F., CRANDALL, K.A.,ELLERGREEN, S.H. WAYNE, R.K. (1999). Mitochondrial DNAphylogeography and population history of the grey wolf Canis lupus.Molecular Ecology. 8, 2089-2103.

BIBLIOGRAFÍA CONSULTADA
156
WEBER, J,L., MAY, P.E. (1989). Abundant class of human DNApolymorphism which can be typed using the polymerase chaindreaction. Am. J. Hum. Genet. 44, 388-396.
WEBER, J.L., WONG, C. (1993). Mutation of human short tandemrepeats. Human Molecular Genetics. 2, 1123-1128.
WEIMBERG, W. (1908). Über den Nachweis der Vererbung beimMenschem. Jh. Ver. Vaterl Naturk. 64, 369-382.
WEIR, B.S. COCKERHAM, C.C. (1984). Estimating F-statistics for theanalysis of population structure. Evolution. 38, 1358-1370.
WEIR, B.S. (1990). Genetic data analysis. Methods for discretepopulation genetic data. Sinauer Associates, INC. Publishers,Sunderland, Masachusetts. 377 p.
WEIR, B.S. (1996). Genetic data analysis II. Methods for discretepopulation genetic data. Sinauer Associates, INC. Publishers,Sunderland, Masachusetts.
WEITZMAN, M.L. (1992). On diversity. The Quarterly Journal ofEconomics. 107, 363-405.
WEITZMAN, M.L. (1993). What to preserve? An application of diversitytheory to crane conservation. The Quarterly Journal of Economics.108, 157-183.
WRIGHT, S. (1965). Interpretation of population structure by F-statistics with special regard to system of mating. Evolution. 19,395-420.
XU, X., GULLBERG, A., ARNANSON, U. (1996). The completemitochondrial DNA (mtDNA) of the donkey and mtDNA comparisonsamong four closely related mammalian species-pairs. JournalMolecular and Evolution. 43, 438-446.
YANES, G.J. (1999). El asno Zamorano-Leonés, una gran razaautóctona. Diputación de Zamora, España.
ZAPATA, C. (1987). La variabilidad genética de las poblaciones. En: J.ESPINOSA de los MONTEROS y U. LABARTA (eds.). Genética de laacuicultura. pp. 33-57. Caicyt-Feuga, Madrid.

Raza Catalana
8. ANEXOS

Anexos
158
Anexo 1. Secuencias haplotípicas del citocromo b en las razas asnales españolas. La región marcada correspondeal primer CITB-F.

Anexos
159
Anexo 2. Secuencias haplotípicas del D-loop en las razas asnales españolas. La región marcada corresponde alprimer DONK-A.

Anexos
160
SubPoblaciones
A1 A2 A3 C1 C2 C3 M1 M2 M3 M4 E1 E2 E3 Z1 Z2
AND2 .072
AND3 .051 .049
CAT1 .084 .119 .042
CAT2 .078 .099 .041 .023
CAT3 .118 .188 .084 .035 .057
MALL1 .097 .121 .043 .037 .060 .075
MALL2 .075 .110 .057 .040 .073 .085 .007
MALL3 .081 .124 .057 .040 .073 .085 .045 .037
MALL4 .055 .076 .028 .029 .050 .088 .033 .013 .014
ENC1 .065 .114 .049 .053 .071 .084 .062 .052 .033 .041
ENC2 .040 .082 .041 .039 .047 .068 .058 .046 .035 .018 .014
ENC3 .053 .078 .029 .036 .036 .071 .043 .045 .036 .022 .012 .012
ZAM1 .047 .070 .034 .056 .077 .091 .054 .044 .041 .016 .054 .031 .037
ZAM2 .046 .070 .034 .059 .060 .106 .065 .064 .071 .037 .070 .040 .026 .015
ZAM3 .076 .118 .043 .053 .074 .092 .059 .072 .090 .006 .084 .067 .058 .047 .052
Anexo 3. Distancias FST entre las subpoblaciones de los asnos españoles (en negritas distancias dentro de razas).
Anexos
161
ANEXO 4
Genetic diversity in Spanish donkey breeds usingmicrosatellite DNA markers.
Manuscrito publicado en la Revista Genetics, Selection and Evolution
(Volumen 33 (2001) 433-442)

Genet. Sel. Evol. 33 (2001) 433–442© INRA, EDP Sciences, 2001
Original article
Genetic diversity in Spanish donkeybreeds using microsatellite DNA markers
José ARANGUREN-MÉNDEZa,b, Jordi JORDANAa,∗,Mariano GOMEZc
a Unitat de Genètica i Millora Animal, Departament de Ciència Animal i delsAliments, Facultat de Veterinària, Universitat Autònoma de Barcelona,
08193-Bellaterra, Barcelona, Spainb Universidad del Zulia, Facultad de Ciencias Veterinarias, Departamento de
Producción Animal, Maracaibo 4001-A, Venezuelac Servicio de Ganadería, Diputación Foral de Bizkaia, Avda. Lehendakari Aguirre,
9, 2 ◦, 48014 Bilbao, Spain
(Received 27 November 2000; accepted 23 April 2001)
Abstract – Genetic diversity at 13 equine microsatellite loci was compared in five endangeredSpanish donkey breeds: Andaluza, Catalana, Mallorquina, Encartaciones and Zamorano-Leonesa. All of the equine microsatellites used in this study were amplified and werepolymorphic in the domestic donkey breeds with the exception of HMS1, which was mono-morphic, and ASB2, which failed to amplify. Allele number, frequency distributions and meanheterozygosities were very similar among the Spanish donkey breeds. The unbiased expectedheterozygosity (HE) over all the populations varied between 0.637 and 0.684 in this study.The low GST value showed that only 3.6% of the diversity was between breeds (P < 0.01).Significant deviations from Hardy-Weinberg equilibrium were shown for a number of locus-population combinations, except HMS5 that showed agreement in all analysed populations. Thecumulative exclusion probability (PE) was 0.999 in each breed, suggesting that the loci wouldbe suitable for donkey parentage testing. The constructed dendrogram from the DA distancematrix showed little differentiation between Spanish breeds, but great differentiation betweenthem and the Moroccan ass and also with the horse, used as an outgroup. These results confirmthe potential use of equine microsatellite loci as a tool for genetic studies in domestic donkeypopulations, which could also be useful for conservation plans.
donkey / endangered breed / microsatellite / diversity / genetic variability
1. INTRODUCTION
The local Spanish donkey breeds (Equus asinus) Andaluza, Catalana,Encartaciones, Mallorquina and Zamorano-Leonesa have suffered a substan-tial decrease in population size which might cause high levels of inbreeding
∗ Correspondence and reprintsE-mail: [email protected]

J. Aranguren-Méndez et al.
resulting in inbreeding depression and increasing the risk of breed extinc-tion. The principal cause of the great reduction in population size of up to80% has been the intense mechanisation of agriculture which took place inSpain during the 60s and the 70s. These Spanish donkey breeds have beenofficially recognised as breeds for a long time. Currently, the number ofanimals recorded among these five breeds is very low, and they are includedin the FAO (Food and Agriculture Organisation of the United Nations) list ofdomestic animal breeds to be conserved (FAO, DAD-IS http://fao.org/dad-is). At present, the Spanish donkey breeds comprise approximately 100to 200 females each (Breed Associations personal communications). Thesefigures fit into the category of an endangered breed as proposed by the FAOExpert Consultation [2]. Without immediate action, the effective populationsize of these five Spanish breeds will be inadequate to prevent constant geneticloss at each generation [8].
The origin of the modern Spanish donkey breeds remains uncertain. Accord-ing to several authors [1,12,13,15] current Spanish donkeys seem to derivedfrom two ancestral sources: the Nubian ass (Equus asinus africanus), whichgave rise to the Andaluza breed [3,16,40], and secondly, the Somalian ass(Equus asinus somaliensis) which gave rise to the donkeys of SouthwestAsia and probably also to the majority of European breeds, among whichthe Catalana, Mallorquina, Encartaciones and Zamorano-Leonesa breeds [15].
Notwithstanding this, Dechambre and Sanson, as cited by several authors [3,24,37,40], support the theory of two different ancestral sources: one whichwould correspond to the Equus asinus africanus, originating from NortheastAfrica, and the other one, the Equus asinus europeus, whose area of origin is theMediterranean Basin, in particular the Balearic Isles, which would have givenrise to the majority of European donkey breeds, including the four Spanishbreeds mentioned in the previous paragraph.
The conservation of genetic variation found in these minor livestock breedsis a growing world-wide concern due to the increasing risk of breed loss.Recently, many studies of breed conservation have used allele frequencies forseveral DNA markers, such as microsatellites [19,26,36].
Very little literature reporting microsatellite data in domestic donkeys exists;only Breen et al. [10], using a set of 13 microsatellite loci isolated fromthe domestic horse, verified that they were well-amplified in eight individu-als. In addition, Bellone and co-workers [7] reported studies in one Frenchdonkey breed (Baudet du Poitou) with nine microsatellite loci. Finally, wealso performed studies with the Catalonian donkey breed [22,23]. In thepresent work, 15 equine microsatellite loci were analysed in 5 Spanish donkeybreeds, in order to study the genetic variability both within and between thesebreeds.
Genetic diversity in Spanish donkey breeds
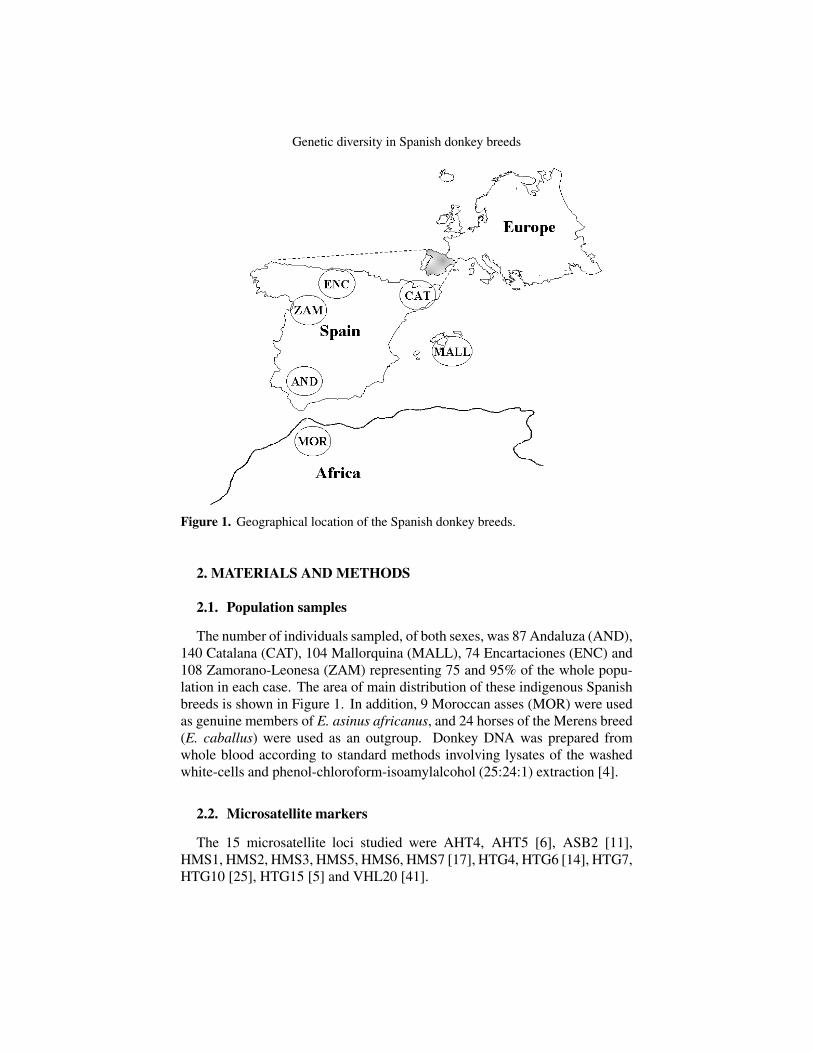
Figure 1. Geographical location of the Spanish donkey breeds.
2. MATERIALS AND METHODS
2.1. Population samples
The number of individuals sampled, of both sexes, was 87 Andaluza (AND),140 Catalana (CAT), 104 Mallorquina (MALL), 74 Encartaciones (ENC) and108 Zamorano-Leonesa (ZAM) representing 75 and 95% of the whole popu-lation in each case. The area of main distribution of these indigenous Spanishbreeds is shown in Figure 1. In addition, 9 Moroccan asses (MOR) were usedas genuine members of E. asinus africanus, and 24 horses of the Merens breed(E. caballus) were used as an outgroup. Donkey DNA was prepared fromwhole blood according to standard methods involving lysates of the washedwhite-cells and phenol-chloroform-isoamylalcohol (25:24:1) extraction [4].
2.2. Microsatellite markers
The 15 microsatellite loci studied were AHT4, AHT5 [6], ASB2 [11],HMS1, HMS2, HMS3, HMS5, HMS6, HMS7 [17], HTG4, HTG6 [14], HTG7,HTG10 [25], HTG15 [5] and VHL20 [41].
J. Aranguren-Méndez et al.
2.3. Multiplex PCR conditionsThe 15 microsatellites were amplified in three multiplexes using
fluorescently-labelled primers. The first multiplex included microsatellitesASB2, HMS3, HMS6, HTG6, HTG10, and VHL20. The second was composedof AHT4, AHT5, HMS2, HMS7 and HTG7, while the third contained HMS1,HMS5, HTG15 and HTG4. Multiplex PCRs were carried out in 15 µL reactionscontaining 30 ng of genomic DNA, 200 µM of dNTP, 0.5 µL of AmpliTaqGold (5 U · µL−1), 1.5 mM of MgCl2 and 0.5 µL of each primer (AHT4,ASB2, HMS2, HMS3, HTG6, HTG7, HTG10), 0.4 µL of the primer (AHT5,HMS6 and HMS7) while 0.3 µL of primer VHL20 (StockMarks
�R for Horses,
Equine Paternity PCR Typing Kit, PE Applied Biosystems, Foster City, CA),and finally, 0.20 µM of primers HMS1, HMS5, HTG4 and HTG15. PCRwas carried out in a 9 700 GeneAmp PCR system (Perkin Elmer) by an initialdenaturation at 95 ◦C for 10 min, followed by 30 cycles at 95 ◦C for 30 s, 60 ◦Cfor 30 s and 72 ◦C for 60 s. The thermal profile ended with a final extensionat 72 ◦C for 60 min. PCR products were detected by capillary electrophoresisusing an Applied Biosystems 310 DNA Sequencer with GENESCAN Analysissoftware (ABI), using the ROX 350 bp internal-size standard.
2.4. Statistical analysesAllele frequencies (available from the authors on request) and mean hetero-
zygosity values for each polymorphic locus were obtained using the BIOSYS-2computer programme [38]. The test of genotype frequencies for deviation fromthe Hardy-Weinberg Equilibrium (HWE) was calculated using the exact testof the GENEPOP 3.1d computer programme [32], using the Markov-chainmethod [18]. Polymorphic information content (PIC) was calculated for eachmicrosatellite locus according to Botstein et al. [9], and the probability ofexclusion (PE) was determined for all informative markers [20].
The average expected heterozygosity for each population (HS), the genediversity in the total population (HT), and the coefficient of gene differentiationGST [27] were estimated using the computer programme DISPAN [30], andtested by permutation test. Differences in average heterozygosities amongbreeds were assessed using the ANOVA test of the SAS
�R package [35].
Genetic distances and phylogenetic trees among populations were obtainedwith the distance measure DA [29]. Takezaki and Nei [39] suggested the DA
distance for making phylogenetic trees when the interest of the study mainlyfocused on the topology rather than evolutionary time. Distance data wasanalysed with the neighbour-joining (NJ) method of clustering [34]. The NJmethod produces only unrooted trees. For this reason we included the data forthe Merens breed population as an outgroup to root the tree. The robustness ofthe dendrogram was evaluated by bootstrap resampling of loci (1 000 replic-ates). All these calculations were carried out using the DISPAN package [30].

Genetic diversity in Spanish donkey breeds
Table I. Total number and range of observed alleles, average heterozygosity HS andHT, coefficient of differentiation GST, PIC and PE, in Spanish donkey breeds.
Microsatellite No.A. 1 S. Range 2 HT HS GST PIC 3 PE 4
AHT4 15 126–160 0.773 0.753 0.031∗∗∗ 0.71 0.55AHT5 14 126–156 0.907 0.852 0.037∗∗∗ 0.85 0.74ASB2 – – – – – – –HMS1A 1 165 – – – – –HMS2 10 229–247 0.709 0.714 0.016∗∗∗ 0.65 0.47HMS3 7 152–170 0.618 0.603 0.044∗∗∗ 0.51 0.32HMS5 3 105–109 0.278 0.336 0.109∗∗∗ 0.20 0.10HMS6 6 151–167 0.649 0.613 0.041∗∗∗ 0.54 0.33HMS7 7 165–177 0.626 0.601 0.031∗∗∗ 0.53 0.33HTG4 5 167–175 0.495 0.439 0.048∗∗∗ 0.40 0.21HTG6 11 76–102 0.817 0.714 0.053∗∗∗ 0.73 0.55HTG7 13 134–164 0.843 0.800 0.030∗∗∗ 0.80 0.65HTG10 12 85–107 0.837 0.790 0.035∗∗∗ 0.78 0.63HTG15 7 116–136 0.751 0.746 0.014∗∗∗ 0.70 0.51VHL20 4 75–99 0.579 0.597 0.035∗∗∗ 0.50 0.31All loci 0.683 0.658 0.036∗∗∗ 0.999
(±0.170) (±0.147) (±0.023)∗∗∗ P < 0.001.1 Total number of observed alleles. –: Failed to amplify.2 Size range of the observed allele in bp.3 Polymorphism information content.4 Exclusion probability.A: Monomorphic.
3. RESULTS
The equine microsatellites were all well-amplified in the donkey, with theexception of locus ASB2, which failed to amplify. All amplified loci werepolymorphic except HMS1, which was monomorphic (165 bp) in all breeds.The number of alleles varied between 3 (HMS5) and 15 (AHT4) (Tab. I), withgenerally little difference between the breeds (data not shown). The averagegene diversity HT [27] over all loci was 0.683 ± 0.170 while, for individualloci, it ranged from 0.278 (HMS5) to 0.907 (AHT5).
The average expected heterozygosity HS across all loci in the total samplewas 0.658 ± 0.147 and ranged from 0.336 (HMS5) to 0.852 (AHT5). Theaverage coefficient of gene differentiation (GST) over the 13 loci was 0.036±0.023 (P < 0.01). The GST values for single loci ranged from 0.014 for HTG15to 0.109 for HMS5. The PIC and the exclusion probability (PE) are given inTable I. The combined probability of exclusion was 0.999, across the wholesample as well as for each breed.
J. Aranguren-Méndez et al.
Table II. Sample size, number of alleles per locus and heterozygosity (± standarderrors) averaged over 13 microsatellites in 5 donkey populations.
Mean heterozygosity
Population Mean samplesize per locus
Mean No. ofalleles per locus
Observed Expected∗
Andaluza 87 7.0± 1.0 0.532± 0.052 0.679± 0.034Catalana 140 7.1± 1.0 0.528± 0.062 0.663± 0.055Mallorquina 104 7.5± 0.9 0.570± 0.063 0.637± 0.054Encartaciones 74 7.4± 1.0 0.564± 0.066 0.646± 0.059Zamorano-Leonesa 108 7.3± 1.1 0.539± 0.058 0.684± 0.044Means 7.2± 1.0 0.546± 0.060 0.654± 0.048∗ Unbiased estimate [28].
Among Spanish donkeys the mean number of alleles per locus ranged from7.0 in the Andaluza breed to 7.5 in the Mallorquina breed (Tab. II). Themean observed heterozygosity (HO) showed a range of values from 0.528in the Catalana breed to 0.570 in the Mallorquina breed. Average expectedheterozygosities (HE) ranged from 0.637 in the Mallorquina breed to 0.684in the Zamorano-Leonesa breed, and were not significantly different. Thenumber of private alleles varied among the five breeds: 1 in Andaluza (HMS6:151 bp), 4 in Encartaciones (one in HTG4: 175 bp; AHT4: 146 bp; andtwo in HTG6: 98 and 100 bp), 2 in Mallorquina (HMS3: 160 bp; HTG15:136 bp) and one in Zamorano-Leonesa (HTG4: 173 bp). Only one privateallele showed a frequency > 5% (HTG6; 100 bp with a frequency of 10.8%,in the Encartaciones breed).
HWE was tested for all breed-locus combinations. Of the 65 contrasts,48 tests gave significant deviations from HWE showing a significant hetero-zygote deficit. Only 17 tests showed agreement with HWE, corresponding tothe Andaluza, Encartaciones and Mallorquina breeds for four microsatellites(HMS3, HMS5, HTG6 and VHL20; HMS3, HMS5, HTG10 and VHL20; andAHT4, HMS3, HMS5 and HMS6, respectively), the Zamorano-Leonesa breedfor three microsatellites (HMS5, HTG10 and VHL20) and the Catalana breedfor two microsatellites (HMS5 and HTG15). Only one of the microsatellites(HMS5) showed agreement with H-W proportions in all analysed populations.
The DA distance, using 13 microsatellites, ranged between 0.057 and 0.093for the Spanish donkey breeds (Tab. III). A neighbour-joining tree was con-structed, and the reliability of the obtained tree was examined by 1000 bootstrapreplicates (Fig. 2). The most robust features of the topology were the Catalana-Mallorquina cluster (70% support) and the cluster (77% support) formed byAndaluza and the four black coated breeds (CAT, ENC, MALL and ZAM)which are all from the North of Spain.

Genetic diversity in Spanish donkey breeds
Table III. Matrix of DA genetic distance among five Spanish donkey breeds (Moroccanass and horse).
AND CAT MALL ENC ZAM Horse
Moroccan 0.119 0.197 0.154 0.136 0.123 0.685Andaluza 0.093 0.078 0.063 0.057 0.629Catalana 0.069 0.071 0.079 0.665Mallorquina 0.067 0.062 0.649Encartaciones 0.059 0.640Zamorano-Leonesa 0.644
Figure 2. Dendrogram showing the genetic relationships among donkey breedsusing the neighbour-joining method and the DA genetic distance, measured with13 microsatellite loci. The number at the forks indicate the percentage of groupoccurrence in a bootstrap resampling of 1 000 trees.
The low genetic distances among Spanish breeds indicated a close relation-ship among these populations. The phylogenetic tree was constructed basedon the matrix of DA values using the Merens horse breed as an outgroup, andthe Moroccan ass breed as the reference population for the Spanish breeds.
4. DISCUSSION
The average number of alleles and the expected heterozygosities (HE) weresimilar for all breeds, indicating that there are no appreciable differences inthe level of genetic variability among the Spanish breeds. These results arecomparable to the previous values reported in Catalonian donkeys [23] and theBaudet du Poitou breed [7].

J. Aranguren-Méndez et al.
Average genetic differentiation (GST) among the breeds was 3.6%, a rel-atively low but significant (P < 0.01) value. All loci were contributing tothat differentiation. The global PE value of 0.999 for each breed makesit extremely unlikely that false parentage would not be recognised. Thesemarkers are therefore an effective tool in donkey parentage verification. Thegenetic relationships among the populations correspond with the geographicaldistribution of the breeds studied. The dendrogram (Fig. 2) groups all of theSpanish donkeys into one cluster (59% support).
Within the Spanish breeds, the four black coated populations (CAT, ENC,MALL and ZAM) form a cluster (77% support), supporting the hypothesisof a common ancestral past from E. a. europeus. The Catalana and Mallor-quina breeds are the most closely related, supporting both the historic and thearchaeological evidence that they show common ancestry [31,33].
All sources agree that the Andaluza breed descended from the primitive ass ofNorth Africa (E. a. africanus) which could have been introduced into the Southof the Iberian Peninsula through the Straits of Gibraltar [3,13,15,37]. However,our data fails to clearly position the Andaluza breed within our tree. Furtherinvestigations involving more European and African donkey populations, aswell as the analysis of mtDNA, which could show a possible introgression ofAfrican haplotypes into European populations would be useful to clarify thispoint. Nevertheless, we have concluded that the analyses of genetic markerssuch as microsatellite sequences are very valuable for the study of geneticvariability in donkey populations and to contribute to the establishment of theirown conservation plans [21].
ACKNOWLEDGEMENTS
This study was made possible by the financial support of the CICYT (projectAGF98–0503) and the DARP (Generalitat de Catalunya) ; we are also gratefulto the Breed Associations of Spanish donkeys for their helpful co-operationand assistance during sample collection. Furthermore, we would like to thankChuck Simmons for the English revision and A. Clop, H. Yahyaoui and R.Pena for suggestions on the manuscript.
REFERENCES
[1] Adametz L., Zootecnia General, Ed. Labor, Madrid, 1943.[2] Anonymous, Recommendations of the FAO expert consultation, in: Hodges J.
(Ed.), The management of global animal genetics resources, Food and Agricul-ture Organisation of the United Nations, Rome, 1992, pp. 1–24.
[3] Aparicio G., Zootecnia Especial. Etnología compendiada. Imprenta Moderna,Córdoba, 1960.

Genetic diversity in Spanish donkey breed
[4] Ausubel F.M., Brent R., Kingston R.E., Moore D.D., Seidman G.G., Smith J.A.,Struhl K., Current protocols in molecular biology, Green Publishing Associatesand Wiley-Interscience, New York, 1987.
[5] Bailey E., Graves K.T., Cothran E.G., Reid R., Lear T.L., Ennis R.B., Synteny-mapping horse microsatellite markers using a heterohybridoma panel, Anim.Genet. 26 (1995) 80–111.
[6] Binns M.M., Holmes N.G., Holliman A., Scott A.M., The identification of poly-morphic microsatellite loci in the horse and their use Thoroughbred parentagetesting, Brit. Vet. J. 151 (1995) 9–15.
[7] Bellone R.R., Cothran E.G., Ketchum M.S., Genetic variation in the rare donkeybreed, Baudet du Poitou, Anim. Genet. 29, (Suppl. 1) (1998) 17.
[8] Bodó I., The minimum number of preserved populations, in: Hodges J. (Ed.),The management of global animal genetic resources, Food and AgricultureOrganisation of the United Nations, Rome, 1992, pp. 91–105
[9] Botstein D., White R.L., Skolnick M., Davis R.W., Construction of a geneticlinkage map in man using restriction fragment length polymorphisms, Am. J.Hum. Genet. 32 (1980) 314–331.
[10] Breen M., Downs P., Irvin Z., Bell K., Intrageneric amplification of horsemicrosatellite markers with emphasis on the Przewalski’s horse (E. przewalskii),Anim. Genet. 25 (1994) 401–405.
[11] Breen M., Lindgren G., Binns M.M., Genetical and physical assignments ofequine microsatellites – First integration of anchored markers in horse genomemapping, Mamm. Genome 8 (1997) 267–273.
[12] Camac R.O., Introduction and Origins of the Donkey, in: Svendsen E.D. (Ed.),The professional handbook of the Donkey, 2nd edn., The Donkey Sanctuary,Sidmouth, Devon, 1989, pp. 1–10.
[13] Clutton-Brock J., A natural history of domestic mammals, Vol. 2. CambridgeUniversity Press, Cambridge, 1987.
[14] Ellegren H., Johansson M., Sandberg K., Andersson L., Cloning of highlypolymorphic microsatellite in the horse, Anim. Genet. 23 (1992) 133–142.
[15] Epstein H., Ass, mule and onager, in: Mason I.L. (Ed.), Evolution of domesticatedanimals, Longman, London and New York, 1984, pp. 174–184.
[16] García Dory M.A., Martínez S., Orozco F., Guía de campo de las razas autóctonasespañolas, Alianza Editorial, Madrid, 1990.
[17] Guerin G., Bertaud M., Amigues Y., Characterisation of seven new horsemicrosatellites: HMS1, HMS2, HMS3, HMS4, HMS5, HMS6, HMS7, andHMS8, Anim. Genet. 25 (1994) 62.
[18] Guo S.W., Thompson E.A., Performing the exact test of Hardy-Weinberg pro-portions for multiple alleles, Biometrics 48 (1992) 361–372.
[19] Hancock J., Microsatellites and other simple sequences: genomic context andmutational mechanisms, in: Goldstein D., Schlotterer C. (Eds.), Microsatellites.Evolution and applications, Oxford University Press, New York, 1999, pp. 1–10.
[20] Jamieson A., The effectiveness of using codominant polymorphic allelic seriesfor (1) checking pedigrees and (2) distinguishing full-sib pair members, Anim.Genet. 25 (1994) (Suppl. 1), 37–44.
[21] Jordana J., Folch P., The Catalonian donkey breed: program of conservation andimprovement of an endangered breed, Arch. Zootec. 47 (1997) 403–409.

J. Aranguren-Méndez et al.
[22] Jordana J., Folch P., Sánchez A., Genetic variation (protein markers andmicrosatellites) in endangered Catalonian donkeys, Bioch. Syst. Ecol. 27 (1999)791–798.
[23] Jordana J., Folch P., Aranguren J.A., Microsatellite analysis of genetic diversityin the Catalonian donkey breed, J. Anim. Breed. Genet. 118 (2001) 57–63.
[24] Lorenzo J., Conocimiento y conservación de las razas autóctonas: “El asnoZamorano-Leonés”estudio del estado actual de la raza en la provincia de Zamora;valoración general: Aspectos biopatológicos y funcionales, Tesis Doctoral, Uni-versidad de León, Spain, 1997.
[25] Marklund S., Ellegren H., Eriksson S., Sandberg K., Andersson L., Parentagetesting and linkage analysis in the horse using a set of highly polymorphicmicrosatellites, Anim. Genet. 25 (1994) 19–23.
[26] Moazami-Goudarzi K., Laloë D., Furet J.P., Grosclaude F., Analysis of geneticrelationship between 10 cattle breeds with 17 microsatellites, Anim. Genet. 28(1997) 338–345.
[27] Nei M., Analysis of gene diversity in subdivided populations, Proc. Natl. Acad.Sci., USA 70 (1973) 3321–3323.
[28] Nei M., Estimation of average heterozygosity and genetic distance from a smallnumber of individuals, Genetics 89 (1978) 583–590.
[29] Nei M., Tajima F., Tateno T., Accuracy of estimated phylogenetic trees frommolecular data, J. Mol. Evol. 19 (1983) 153–170.
[30] Ota T., DISPAN: Genetic Distance and Phylogenetic Analysis, PennsylvaniaState University, University Park, PA, 1993.
[31] Payeras L., Falconer J., Races Autòctones de les Illes Balears, Govern Balear,Palma de Mallorca, 1998.
[32] Raymond M., Rousset F., GENEPOP (Version 3.1): Population genetics softwarefor exact test and ecumenicism, J. Hered. 86 (1995) 248–249.
[33] Romagosa J.A., El Garañón Catalán, Tesis Doctoral, Universidad de Madrid,Spain, 1959.
[34] Saitou N., Nei M., The neighbor-joining method: a new method for reconstruct-ing phylogenetic trees, Mol. Biol. Evol. 4 (1987) 406–425.
[35] SAS�R Institute Inc., SAS
�R User’s Guide: Statistics. Version 6.12. Cary, NC,
USA, 1996.[36] Schmid M., Saitbekova C., Dolf G., Genetic diversity in Swiss cattle breeds, J.
Anim. Breed. Genet. 116 (1999) 1–8.[37] Sotillo J.L., Serrano V., Producción Animal 1. Etnología Zootécnica. Tebar-
Flores, Madrid, 1985.[38] Swofford D.L., Selander R.B., BIOSYS-2: A computer program for the analysis
of allelic variation in population genetics and biochemical systematics (Release2.0), University of Illinois, Urbana, Champaign, IL., 1999.
[39] Takezaki N., Nei M., Genetic distance and reconstruction of phylogenetic treesfrom microsatellite DNA, Genetics 144 (1996) 389–399.
[40] Yanes G. J., El asno Zamorano-Leonés, una gran raza autóctona. Diputación deZamora, Spain, 1999.
[41] Van Haeringen H., Bowling A.T., Stott M.L., Lenstra J.A., Zwaagstra K.A., Ahighly polymorphic horse microsatellite locus: VHL20, Anim. Genet. 25 (1994)207.

Anexos
172
ANEXO 5.12
Hierarchical analysis of genetic structure in Spanish donkey3breeds using microsatellite markers.4
5
Manuscrito enviado a publicar a la revista Heredity6789
1011121314151617181920212223242526272829303132333435363738394041
Anexos
173
Hierarchical analysis of genetic structure in Spanish donkey breeds1using microsatellite markers.2
3
JOSE ARANGUREN-MENDEZ 1,2 JORDI JORDANA 1 MARIANO GOMEZ 34
5
6
7
1Unitat de Genètica i Millora Animal. Departament de Ciència Animal i dels Aliments.8
Facultat de Veterinària, Universitat Autònoma de Barcelona, 08193-Bellaterra,9
Barcelona, Spain.10
2Universidad del Zulia. Facultad de Ciencias Veterinarias. Departamento de Producción11
Animal. Maracaibo 4001-A. Venezuela.12
3Servicio de Ganadería. Diputación Foral de Bizkaia. Avda. Lehendakari Aguirre, 9, 2º,13
48014 Bilbao. Spain.14
15
16
Correspondence: J. Jordana (Fax: 34-93-5812006; e-mail: [email protected])17
18
Keywords : Donkey, extinction danger, population structure, F-statistics, hierarchical19
analysis, microsatellite.20
21
Short running title : Hierarchical population structure in Spanish donkey breeds.22
23
24
25

Anexos
174
Summary1
2
The hierarchical population structure of five, native-Spanish donkey breeds (Andaluza,3
Catalana, Mallorquina, Encartaciones and Zamorano-Leonesa) has been studied by4
using F-statistics. In addition, 9 Moroccan asses and 24 Merens breed horses were5
included. Data came from 15 DNA microsatellites. The analysis showed that Spanish6
donkeys are substructured at both hierarchical levels studied, among breeds and within7
breed (subpopulations). In the whole population, the deficit of heterozygotes estimated8
was about 21%. The proportion of genetic variability attributable to differences between9
breeds, subpopulations within breeds, and within subpopulations was estimated to be10
6.4%, 3.5% and 3.0%, respectively. The dendrogram obtained clearly showed that the11
Andaluza-Moroccan ass forms a separate cluster from the Northern-Spain breeds12
(Catalana, Encartaciones, Mallorquina and Zamorana-Leonesa). These racial groupings13
coincide with the groupings obtained from historical and archaeological data.14
15
Introduction16
The ass (Equus asinus), is a herbivorous animal of the order Perissodactyla,17
family Equidae. Was domesticated about 6,000 years ago, probably in either Egypt or18
Mesopotamia (Littauer & Crouwel, 1979). In Spain, the development of donkey19
populations was influenced by their extensive use for riding and as a beast of burden; it20
is useful as a pack animal. It is capable of carrying over 100 kg a day with little food.21
Another useful domestic animal, the mule, the hybrid offspring of a male donkey and22
female horse, is used for vineyard cultivation for which it is suitable (Aparicio, 1960).23

Anexos
175
The Spanish donkey breeds: Andaluza, Catalana, Mallorquina, Encartaciones1
and Zamorano-Leonesa have suffered a substantial decrease in population size (Jordana2
& Folch, 1998) which might create high levels of inbreeding which may result in3
inbreeding depression, increasing the risk of breed extinction. Currently, the census4
population size of these five breeds is very low, and they are included in the Food and5
Agricultural Organization of the United Nation’s (FAO) list of domestic animals to be6
preserved (FAO, DAD-IS http://fao.org/dad-is).7
The objective of the present study is to characterize the genetic structure of five8
Spanish donkey populations in danger of extinction by using F-statistics analysis9
(Wright, 1965; Nei, 1977; Weir & Cockerham, 1984). F-statistics have proven to be a10
very useful tool in elucidating the pattern and extent of genetic variation residing within11
and among natural populations of animal and plant species.12
Genetic characterisation is the first step in breed conservation programs and may13
have implications for future breeding strategies (Bjørnstad et al., 2000). Very little14
literature reporting microsatellite data in domestic donkeys exists (Breen et al., 1994;15
Bellone et al., 1998; Jordana et al., 1999, 2001; Aranguren-Méndez et al., 2001); for16
these reasons is understood the importance of this study.17
The results of this analysis are expected to provide us with some insight for18
making decisions about the conservation of these breeds. These results will allow us to19
acquire knowledge about the degree of genetic differentiation that exists between breeds20
and subpopulations and of gene flow between them through the study and analysis of21
the F-statistics.22
23

Anexos
176
Materials and methods1
Breeds studied and DNA collection2
Genomic DNA was prepared from whole blood according to standard methods3
involving lysates of the washed white cells and phenol-cloroform-isoamylalcohol4
(25:24:1) extraction. The sample size and breeds involved were: 87 Andaluza (AND),5
140 Catalana (CAT), 104 Mallorquina (MALL), 74 Encartaciones (ENC) and 1086
Zamorano-Leonesa (ZAM) breeds. The area of main distribution of these indigenous7
Spanish breeds is shown in Figure 1. In addition, 9 Moroccan asses were used as8
genuine members of the E. asinus africanus, and 24 horses of the Merens breed (E.9
caballus) were used as an outgroup. To perform the intraracial analysis of the10
populations, the breeds were divided into 16 subpopulations, according to geographical11
criteria and/or areas of influence of certain breeders (Figure 1).12
13
Microsatellite markers14
The 15 equine microsatellite markers chosen for analysis were: AHT4, AHT5,15
ASB2, HMS1, HMS2, HMS3, HMS5, HMS6, HMS7, HTG4, HTG6, HTG7, HTG10,16
HTG15 and VHL20. Primer sequences, reaction conditions and data collections17
(available from the authors on request) have been described previously by Aranguren-18
Méndez et al. (2001).19
20
Statistical analyses21
Population structure was analysed by means of F-statistics using Weir &22
Cockerham methods (1984), implemented in the FSTAT computer programme (Goudet,23
2000). A hierarchical FST analysis was performed to determine the amount of variance24
Anexos
177
attributable to subpopulation substructure (Wrigth, 1978; Johannesen & Loeschcke,1
1996). The hierarchical analysis was carried out using analysis of molecular variance2
(AMOVA) in the ARLEQUIN 2,000 package (Schneider et al., 2000). AMOVA yields3
estimations of population structure at different levels of the specified hierarchy.4
In order to test the significance of the different statistics for the null hypothesis5
of no differentiation at the corresponding level, permutation and resampling tests (jack-6
knifing and bootstrapping) were carried out as implemented in the previous7
programmes.8
Additional Reynolds genetic distance (Reynolds et al., 1983), a measure based9
on FST values [DR= -ln(1-FST)], with neighbour–joining (NJ) method clustering (Saitou10
& Nei, 1987), was used to construct a dendrogram of breed relationships, using the11
PHYLIP package (Felsenstein, 1995). An unrooted consensus tree, evaluated by 1,00012
bootstrap replicates, was obtained. The method of Slatkin (1993), implemented in13
GENEPOP, was used to assess the genetically effective migration rate (M =Nem, the14
average number of migrants exchanged per generation).15
16
Results17
Thirteen of fifteen equine microsatellites investigated amplified well and were18
polymorphic in the donkey, except for locus ASB2, which failed to amplify, and19
HMS1, which was monomorphic (165 bp) in all breeds. The FST, FIT and FIS values,20
computed over all breeds and loci, were obtained. Levels of apparent breed21
differentiation were considerable and multilocus FST values indicate that around 4.1% of22
the total genetic variation could be explained by breed differences, the remaining 95.923
% corresponding to differences among individuals. Genetic differentiation among24
Anexos
178
breeds was highly significant (P< 0.001) for all loci. On average, individuals within1
breeds had a 17.8% (P<0.001) deficit of heterozygotes, whereas the total population had2
a 21.1% (P<0.001) deficit of heterozygotes.3
Values for the F-statistics of the Spanish donkey populations at all hierarchical4
levels are presented in Table 1. The degree of genetic differentiation among5
subpopulations was highly significant for all breeds, oscillating from 1.3% for the6
Encartaciones breed to 5.8% for the Andaluza breed (P< 0.001), indicating the existence7
of a certain reproductive substructure within them all.8
The hierarchical analysis of the Spanish donkey populations (Table 2) revealed9
that, as expected, most of the differentiation occurs among breeds with respect to the10
total population rather than among subpopulations within breeds, and within11
subpopulations; 0.064 vs 0.035, and 0.030, respectively. The differentiation among12
breeds in hierarchical analysis was 6.4%, rather than without using hierarchical analysis13
(4.1%).14
Table 3 shows the total inbreeding estimate (F≅ FIT) per breed, evaluated by15
hierarchical analysis. The whole loci showed values significantly different from zero, as16
well as the estimated average (P<0.001). The FIT average, obtained from jackknifing17
over loci, ranged between 0.112 ± 0.049 and 0.232 ± 0.058 for the Mallorquina and18
Andaluza breeds, respectively.19
The interbreed genetic distance, or FST estimates, below the diagonal, and gene20
flow (Nem) above the diagonal, between pairs of Spanish donkey breeds are shown in21
Table 4. After 1,000 permutations, performed with FSTAT, all FST calculated by22
pairwise breed combinations were significantly different from zero (P<0.001). Least23
differentiation was detected between Andaluza and Zamorano-Leonesa breeds and24
Anexos
179
Encartaciones-Mallorquina breeds (FST=0.031), and the most divergence was observed1
between Andaluza and Catalana breeds (FST=0.058). Nem represents the number of2
effective migrants exchanged per generation. The Nem values for breed pairs varied3
from 4.16 to 7.88 for the AND-CAT pair and the MALL-ENC pair, respectively.4
Figure 2 shows a NJ tree based on Reynolds genetic distance (data not shown)5
relating the five Spanish donkey breeds studied, the Moroccan ass, and the Merens6
breed used as outgroup. The numbers at the nodes are bootstrapping values for 1,0007
replicates of the 13 loci genotyped.8
9
Discussion10
Genetic differentiation among Spanish donkey breeds exists. All loci11
contributing to this differentiation with values moderately low and similar for all12
systems studied, but very significant (P<0.001), indicating a relatively high gene flow13
among the breeds studied. However, it is clear that most of the total genetic variation14
corresponds to differences among individuals (95.9%) and only less than five percent is15
due to differences among breeds. These values of total genetic differentiation (FST)16
among breeds are close to those found in other domestic species, for example: among17
river buffalo breeds (FST=0.038, Barker et al., 1997), among Spanish horse breeds18
(FST=0.078, Cañon et al., 2000), though slightly lower than those found in Norwegian19
horse breeds (FST=0.12, Bjørnstad et al., 2000), in European cattle breeds (FST=0.11,20
MacHugh et al., 1998; Kantanen et al., 2000) and among Spanish dogs (FST=0.099,21
Jordana et al., 1992).22
The results from the hierarchical analysis further show that populations of23
Spanish donkeys are substructured at different levels (Table 2). The differentiation24
Anexos
180
within breeds is only half of that between breeds (3.5% and 6.4%, respectively). This1
value was similar to that reported for other organisms: Spanish dogs (Jordana et al.,2
1992), black-tailed dogs (Chesser, 1983) and house mice (Selander & Kaufman, 1975).3
The total breed inbreeding estimate (F≅ FIT; Table 3) showed a significant deficit4
of heterozygotes (P<0.001) in all breeds. Consanguinity, which is produced by mating5
between relatives, can be one cause of loss of heterozygotes, but this deficit affects all6
or most of the loci in a similar way. AND, CAT and ZAM breeds showed 10 or 11 loci,7
of the total of 13, with a significant deficit of heterozygotes, therefore possibly being8
able to attribute this to this phenomenon (Table 3). Although in these breeds high and9
significant values of FST (Table 1) (0.058, 0.031 and 0.037, respectively), also suggest10
that a significant subpopulation structure (Wahlund’s effect) exists within these11
populations. On the other hand, MALL and ENC breeds showed single deficit of12
heterozygotes in only 5 and 6 loci, respectively, this deficit not being able to essentially13
be attributed to the consanguinity.14
We must remember that there are other factors that can also cause a lack of15
heterozygotes in the population (Nei, 1987). First, the locus can be under selection, the16
“genetic hitchhiking” effect, close to some morphological or productive trait of selective17
interest. Second, “null alleles” (non-amplifying alleles) may be present and lead to a18
false observation of excess homozygotes. Third, the presence of a population’s19
substructure within the breed may lead to Wahlund’s effect.20
The reproductive substructure within the breed, in isolated units, would be a21
very feasible explanation to understand this high deficit of heterozygotes observed in22
the Spanish donkey populations. Nevertheless, two loci exist, concretely HTG4 and23
HMS7, which show a very significant deficit of heterozygotes in all breeds (P <0.001).24

Anexos
181
The most coherent interpretation to explain this deficit in those two markers is that these1
loci can be under selection (genetic hitchhiking effect) with some trait of selective2
interest, or the possible presence, not detected, of “null alleles” in these populations.3
Previous reports have indicated the occurrence of a “null allele” present in the HMS74
locus in the Quarter-horse equine breed (Bozzini et al., 1997).5
In the context of the conservation and maintenance of animal genetic variability,6
migration values (Nem) can be interpreted as the upper limit of the number of migrants7
per generation, which would allow the maintenance of the observed genetic8
differentiation among the breeds (Cañón et al., 2000). For example, an introgression9
rate of eight individuals per generation between the ENC and MALL breeds would10
maintain the estimated degree of genetic differentiation between these breeds. Similarly,11
when we compare the CAT and AND breeds, a gene flow between them greater than12
only 4 individuals per generation could mean a real threat for both breeds. A gene-flow13
strategy, which permits a greater introgression rate between genetically close14
populations rather than in more divergent ones, should be emphasised.15
The dendrogram’s topology (Figure 2) is very similar to that obtained by16
Aranguren-Méndez et al. (2001) using the DA genetic distance (Nei, 1987) and the NJ17
algorithm. In this work, the four breeds of black coat from the North of Spain (CAT,18
ENC, MALL and ZAM) form a closed cluster (64% support), supporting the hypothesis19
of a common ancestral past from E. asinus europeus.20
In this paper, unlike Aranguren-Méndez et al. (2001), the African origin of the21
Andaluza breed is clarified, which forms a cluster with the Moroccan ass, a genuine22
representative of the ancestral trunk of E. asinus africanus. This supports the thesis23
earlier stated by other authors about its African origin (Aparicio, 1960; Epstein, 1984;24

Anexos
182
Sotillo and Serrano, 1985). However, the low bootstrap value for this cluster (43%1
support) reflects the instability of the topology, so additional studies to confirm this2
hypothesis would be necessary.3
Further investigations involving more European and African donkey4
populations, as well as the analysis of genetic variability of mtDNA, could look for a5
possible introgression of mtDNA haplotypes of African origin in these populations.6
This variability is not reflected in the nuclear genome, and it would be useful to clarify7
this point.8
Nevertheless, this study contributes to the knowledge of genetic structure and9
molecular characterisation of endangered and small populations, such as the Spanish10
donkey breeds. It also shows how microsatellites can be used to establish the genetic11
relationships between donkey populations, and help to establish the planning for their12
conservation (Jordana & Folch, 1998; Jordana et al., 2001), as well as in order to13
integrate this information into the FAO Global Data Bank on Domestic Animal14
Diversity (DAD-IS).15
16
Acknowledgements17
This study was made possible by the financial support of the CICYT (project AGF98-18
0503) and the DARP (Generalitat de Catalunya); we are also grateful to the Breed19
Associations of the Spanish donkeys for their helpful co-operation and assistance during20
the sample collection. Also, we would like to thank Rosa Avellanet for his valuable21
comments on the manuscript, and Chuck Simmons for the English revision. The22
suggestions of the two referees were greatly appreciated.23

Anexos
183
References1
APARICIO, G. 1960. Zootecnia Especial. Etnología compendiada. Imprenta Moderna2
Córdoba.3
ARANGUREN-MENDEZ, J. A., JORDANA, J. AND GOMEZ, M. 2001. Genetic4
diversity in Spanish donkey breeds using microsatellite DNA markers. Genet. Sel.5
Evol., 33, 433-442.6
BARKER, J. S. F., MOORE, S. S., HETZEL, D. J. S., EVANS, S., TAN, S. G. AND7
BYRNE, K. 1997. Genetic diversity of Asian water buffalo (Bubalus bubalis):8
microsatellite variation and a comparison with protein-coding loci. Anim.Genet., 28,9
103-115.10
BELLONE, R. R., COTHRAN, E.G. AND KETCHUM, M. S. 1998. Genetic variation11
in the rare donkey breed, Baudet du Poitou. Anim. Genet., 29, (Suppl. 1), 17.12
BJØRNSTAD, G., GUNBY, E. AND RØED, K. H. 2000. Genetic structure of13
Norwegian horse breeds. J. Anim. Breed. Genet., 117, 307-317.14
BOZZINI, M., EGGLESTON-STOTT, M., DEL VALLE, A. AND ZIEGLE, Y. 1997.15
Addition of degenerate primer in multiplex PCRs corrects the equine microsatellite16
locus HMS7 null allele in the Quarter horse. Abstracts P50. Plant & Animal Genome17
V Conference.18
BREEN, M., DOWNS, P., IRVIN, Z. AND BELL, K. 1994. Intrageneric amplification19
of horse microsatellite markers with emphasis on the Przewalski’s horse (E.20
przewalskii). Anim. Genet., 25, 401-405.21
CAÑON, J., CHECA, M. L., CARLEOS, C., VEGA-PLA, J. L., VALLEJO, M. AND22
DUNNER S. 2000. The genetic structure of Spanish Celtic horse breeds inferred23
from microsatellite data. Anim. Genet., 31, 39-48.24

Anexos
184
CHESSER, R. K. 1983. Genetic variability within and among populations of the black-1
tailed prairie dog. Evolution, 37, 320-331.2
EPSTEIN, H. 1984. Ass, mule and onager. In: Mason, I. L. (ed.) Evolution of3
domesticated animals. pp 174-184. Longman, London and New York.4
FELSENSTEIN, J. 1995. PHYLIP (Phylogeny inference package) version 3.57c.5
Department of Genetics, University of Eashington, Seattle.6
GOUDET, J. 2000. FSTAT Ver. 2.9.1. Computer package for PCs. Institute of Ecology,7
Biology Building, UNIL, CH-1015 Lausanne, Switzerland.8
JOHANNESEN, J. AND LOESCHCKE, V. 1996. A hierarchical analysis of genetic9
structure and variability in patchily distributed coexisting Chiastocheta species10
(Diptera: Anthomyiidae). Heredity, 76, 437-448.11
JORDANA, J., PIEDRAFITA, J., SANCHEZ, A. AND PUIG, P. 1992. Comparative F12
statistics analysis of the genetic structure of ten Spanish dog breeds. J. Hered., 83,13
367-374.14
JORDANA, J. AND FOLCH, P. 1998. The Catalonian donkey breed: program of15
conservation and improvement of an endangered breed. Arch. Zootec. 47, 403-409.16
JORDANA, J., FOLCH, P. AND SANCHEZ, A. 1999. Genetic variation (protein17
markers and microsatellites) in endangered Catalonian donkeys. Bioch. Syst. Ecol.,18
27, 791-798.19
JORDANA, J., FOLCH, P. AND ARANGUREN, J. A. 2001. Microsatellite analysis of20
genetic diversity in the Catalonian donkey breed. J. Anim. Breed. Genet., 118, 57-6321
KANTANEN, J., OLSAKER, I., HOLM, L.-E., LIEN, S., VIKKI, J., BRUSGAARD,22
K., EYTHORSDOTTIR, E., DANELL, B. AND ADALSTEINSSON, S. 2000.23

Anexos
185
Genetic diversity and population structure of 20 North European cattle breeds. J.1
Hered., 91, 446-457.2
LITTAUER, M. A. AND CROUWEL, J. H. 1979. Wheeled vehicles and ridden animals3
in the ancient near east. Brill, Leiden and Köln.4
MACHUGH, D. E., LOFTUS, R. T., CUNNINGHAM, P. AND BRADLEY, D. G.5
1998. Genetic structure of seven European cattle breeds assessed using 206
microsatellite markers. Anim. Genet., 29, 333-340.7
NEI, M. 1977. F-statistics and analysis of gene diversity in subdivided populations.8
Ann. Hum. Genet., 41, 225-233.9
NEI, M. 1987. Molecular evolutionary genetics. Columbia University Press. New York.10
REYNOLDS, J., WEIR, B. S. AND COCKERHAM, C. C. 1983. Estimation of the11
coancestry coefficient: Basis for a short-term genetic distance. Genetics, 105, 767-12
769.13
SAITOU, N. AND NEI, M. 1987. The neighbor-joining method: a new method for14
reconstructing phylogenetic trees. Mol. Biol. Evol., 4, 406-425.15
SCHNEIDER, S., ROESSLI, D. AND EXCOFFIER, L. 2000. Arlequin ver. 2000: A16
software for population genetics data analysis. Genetics and Biometry Laboratory,17
University of Geneva, Switzerland.18
SELANDER, R. B. AND KAUFMAN, D. W. 1975. Genetic structure of populations of19
the brown snail (Helix apersa): I. Microgeographic variation. Evolution, 29, 385-401.20
SLATKIN, M. 1993. Isolation by distance in equilibrium and non-equilibrium21
populations. Evolution, 47, 264-279.22
SOTILLO, J. L. AND SERRANO, V. 1985. Producción Animal 1, Etnología23
Zootécnica, Tebar-Flores, Madrid24

Anexos
186
WEIR, B. S. AND COCKERHAM, C. C: 1984. Estimating F-statistics for the analysis1
of population structure. Evolution, 38, 1358-1370.2
WRIGHT, S. 1965. Interpretation of population structure by F-statistics with special3
regard to system of mating. Evolution, 19, 395-420.4
WRIGHT, S. 1978. Evolution and the genetics of populations: Vol. 4. Variability within5
and among natural populations. University of Chicago Press, Chicago.6

Anexos
187
Legends to tables and figures1
Table 1. Genetic structure of the Spanish donkey breeds through an analysis of their2subpopulations.3
4
Table 2. Hierarchical F-statistics and variance components for Spanish donkey breeds5with two subdivision levels.6
7
Table 3. Total breed inbreeding estimated (F ≅ FIT) by hierarchical analysis in the8Spanish donkey breeds.9
10
Table 4. FST estimates (below the diagonal) as a measure of genetic distance between11donkey breeds and the number of effective migrants per generation (Nem) (above the12diagonal).13
14
Figure 1. Geographical location of the Spanish donkey subpopulations and their15reference codes (n is the sample size).16
17
Figure 2. Neighbour-Joining dendrogram showing the genetic relationships among the18Spanish donkey breeds, inferred through microsatellite data. This tree is based on19Reynolds’ genetic distance. The numbers at the nodes are values for 1,000 bootstrap20resamplings of the 13 loci genotyped.21
222324
25
26
27
28
29
30
31
32
33

Anexos
188
Breeds FIS≅f FIT≅F FST≅θ
Andaluza 0.184 (0.058)*** 0.232 (0.058)*** 0.058(0.009)***
† (0.084-0.306) (0.132-0.352) (0.040-0.075)
Catalana 0.189 (0.053)*** 0.214 (0.052)*** 0.031(0.007)***
(0.102-0.303) (0.127-0.324) (0.018-0.044)
Mallorquina 0.091 (0.045)*** 0.112 (0.049)*** 0.022(0.007)***
(0.016-0.193) (0.032-0.221) (0.010-0.038)
Encartaciones 0.118 (0.040)*** 0.130 (0.041)*** 0.013(0.006)***
(0.053-0.210) (0.062-0.224) (0.003-0.026)
Zamorano-Leonesa 0.193 (0.053)*** 0.223 (0.061)*** 0.037(0.014)***
(0.099-0.307) (0.116-0.353) (0.014-0.068)
f, within-population inbreeding estimate; F, total inbreeding estimate; θ, measure ofpopulation differentiationStandard deviation in parentheses estimate from jackknife over loci *** P<0.001, from permutation tests in FSTAT programme† 95% Confidence Interval

Anexos
189
Sources of variationVariance
component
Percentage ofvariation
FixationIndices (%)
Among breeds 0.133 2.96 6.4
Among subpopulationswithin breeds
0.153 3.41 3.5
Within subpopulations 4.208 93.63 3.0

Anexos
190
Locus Andaluza Catalana Mallorquina Encartaciones Zam-Leonesa
AHT4 0.147 *** 0.129** -0.038 0.146 ** 0.151 **
AHT5 0.080 ** 0.220 *** 0.138 *** 0.098* 0.253 ***
HMS2 0.250 *** 0.106 * 0.195 *** 0.065 0.223 ***
HMS3 0.144 ** 0.117 * -0.085 0.017 -0.030
HMS5 -0.095 -0.037 -0.105 0.133 -0.015
HMS6 0.479 *** 0.271 *** 0.033 0.141 * 0.315 ***
HMS7 0.661 *** 0.357 *** 0.336 *** 0.478 *** 0.577 ***
HTG4 0.695 *** 0.823 *** 0.782 *** 0.604 *** 0.944 ***
HTG6 0.177 *** 0.364 *** 0.052 0.153 *** 0.206 ***
HTG7 0.224 *** 0.067 ** 0.048 0.082 0.246 ***
HTG10 0.144 ** 0.125 *** 0.076 ** -0.013 0.139 ***
HTG15 0.138 ** -0.000 0.036 0.093 0.111 *
VHL20 -0.015 0.193 *** 0.031 -0.061 -0.105
Mean 0.232*** 0.214*** 0.112*** 0.130*** 0.223***(0.058) (0.052) (0.049) (0.041) (0.058)
*P< 0.05, ** P<0.01, ***P<0.001 from permutation tests in FSTAT programme
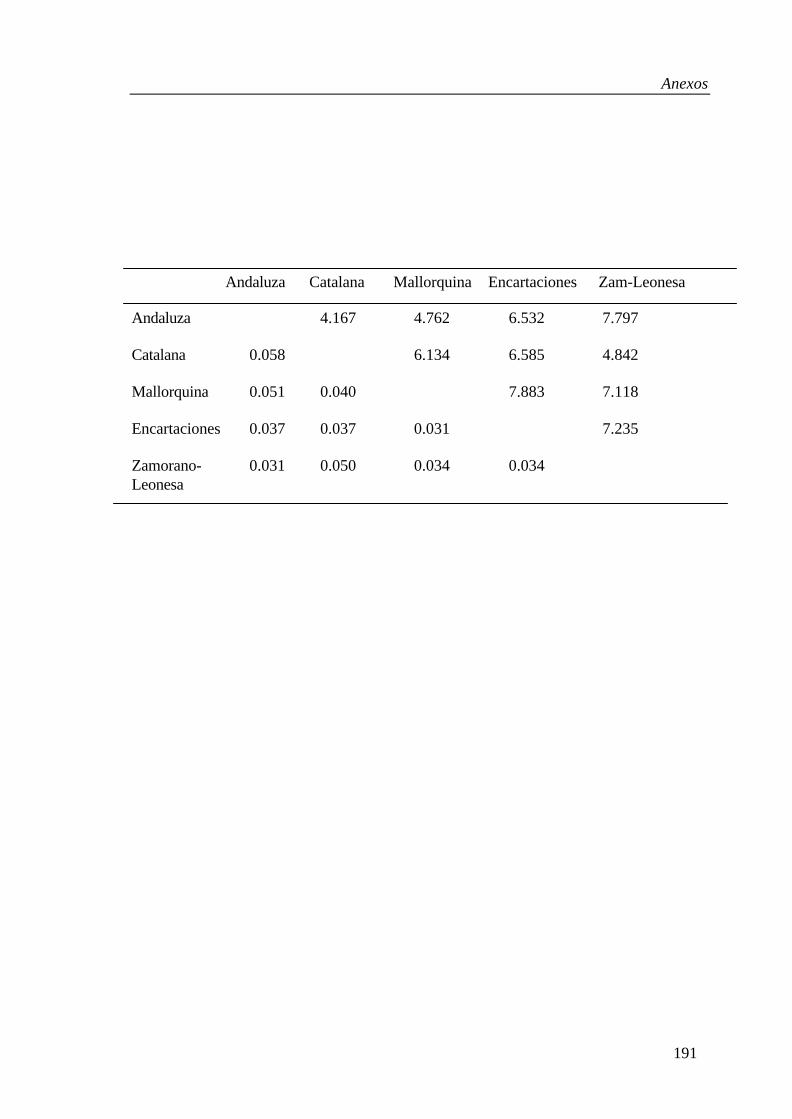
Anexos
191
Andaluza Catalana Mallorquina Encartaciones Zam-Leonesa
Andaluza 4.167 4.762 6.532 7.797
Catalana 0.058 6.134 6.585 4.842
Mallorquina 0.051 0.040 7.883 7.118
Encartaciones 0.037 0.037 0.031 7.235
Zamorano- 0.031 0.050 0.034 0.034Leonesa
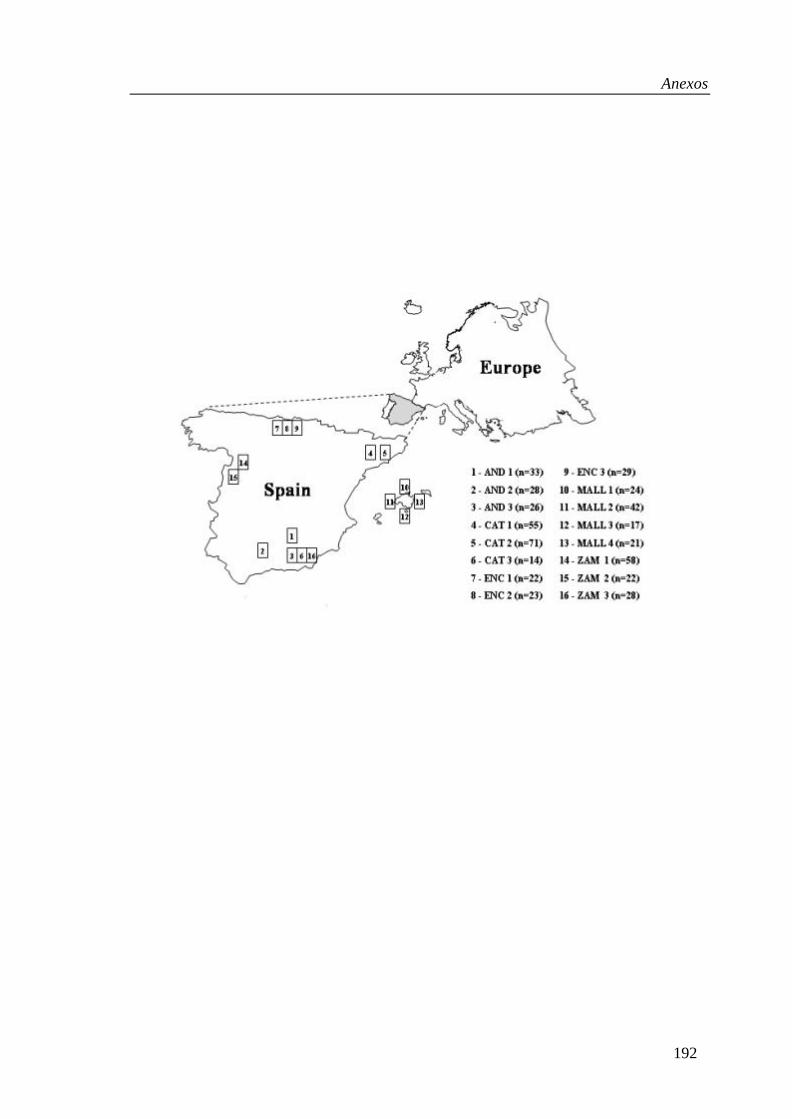
Anexos
192
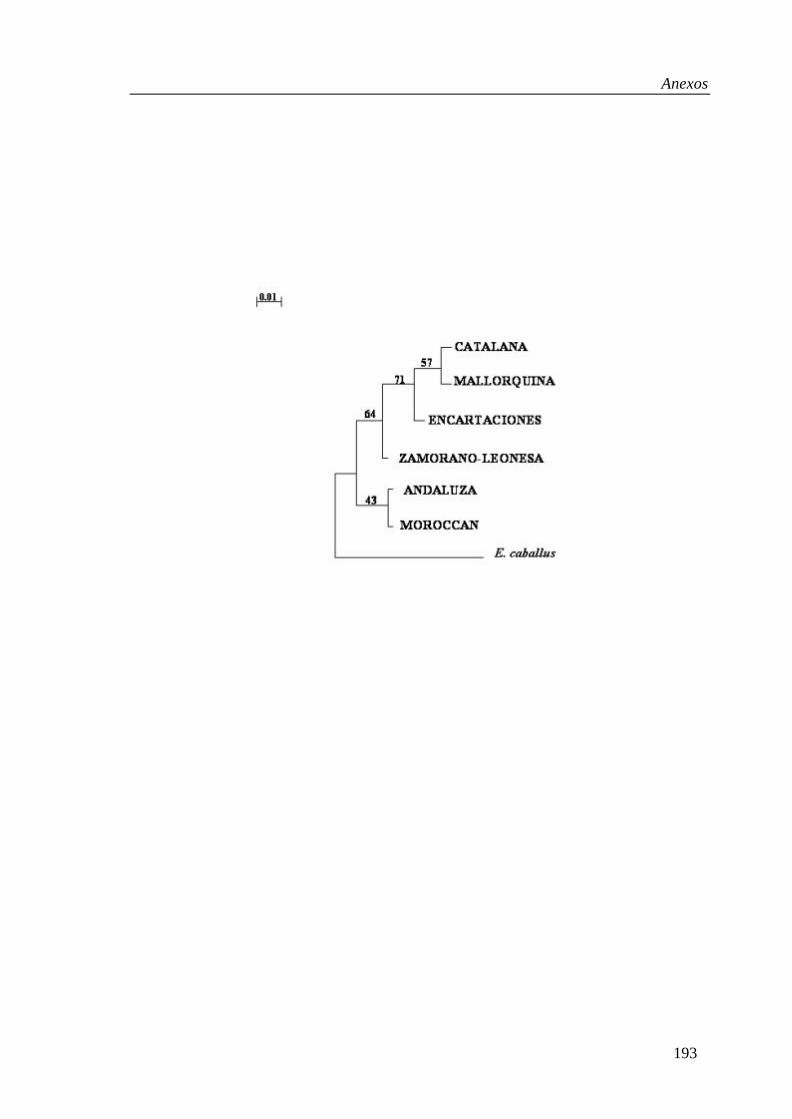
Anexos
193

Anexos
194
ANEXO 61
2
Genetic conservation of five endangered Spanish donkey3breeds.4
5
Manuscrito enviado a publicar a la revista Journal of Animal Breeding6and Genetics.7
8
9
10
11
12
13
14
15
16
17
18
19
20
21
22
23
24
25
26
27
28
29
30
31
32
33
34
Anexos
195
Departament de Ciència Animal i dels Aliments. Facultat de Veterinària, Universitat1Autònoma de Barcelona, 08193-Bellaterra, Barcelona, Spain.2
3
4
GENETIC CONSERVATION OF FIVE ENDANGERED SPANISH5
DONKEY BREEDS6
7
By J. ARANGUREN-MENDEZ1,2 J. JORDANA1 M. GOMEZ38
9
10
11
Summary12
The genetic diversity of most livestock species is being reduced, and it is not possible to13
preserve all of these livestock breeds. In order to preserve as much of the genetic14
diversity as possible, we must first have a robust method of measuring genetic diversity15
among breeds. Three different methods of study that graphically represent relationships16
among breeds are presented; Weitzman’s method, principal component analysis (PCA)17
and a neighbor-joining tree with allele-sharing. Diversity was evaluated on the basis of18
15 microsatellite markers typed over a total de 513 DNA samples collected from five19
Spanish donkey breeds. Breed differentiation was confirmed by the clustering based on20
the genetic distances between individuals, which essentially grouped all individuals in21
discrete clusters. The genetic distance among breeds was used to measure the global22
diversity of the set in breeds considered, and to evaluate the marginal loss of diversity23
attached to each breed. The Catalana breed appeared to be the most “unique” in the set24
considered. In addition to this, the usefulness of global evaluations of diversity using25
molecular markers to choose breeds is worthy of conservation.26
27

Anexos
196
Resumen1
La diversidad genética en la mayoría de especies domésticas se está reduciendo, no2
siendo posible poder conservar todas esas razas domésticas. Para intentar preservar la3
máxima cantidad de diversidad genética, deberíamos disponer, en primer lugar, de un4
método preciso que nos midiera dicha diversidad entre razas. Presentamos aquí, tres5
diferentes métodos de estudio que representan gráficamente las relaciones existentes6
entre las razas; el método de Weitzman, el análisis de componentes principales (PCA) y7
el árbol “neighbor-joining” con alelos compartidos. La diversidad se evaluó a partir del8
análisis de 15 marcadores genéticos, de tipo microsatélite, sobre un total de 5139
muestras de DNA obtenidas de cinco razas asnales españolas. La diferenciación entre10
razas se confirmó por el agrupamiento individual obtenido, basado en las distancias11
genéticas entre los individuos, que agrupó esencialmente a todos los animals de la12
misma raza en grupos discretos. La distancia genética entre las razas se utilizó para13
medir la diversidad global de todas ellas, y para evaluar la pérdida marginal de14
diversidad asociada a cada una. La raza Catalana aparece cómo la más “única” en el15
conjunto considerado. Las evaluaciones globales de diversidad, utilizando marcadores16
moleculares, resultan muy útiles para la elección de las posibles razas a conservar.17

Anexos
197
Introduction1
In genetic conservation the main objective consists of preserving variability2
within populations under the hypothesis of correlation between genetic variation and the3
population’s viability. When economic resources are scarce, it is important to prioritise4
populations for preservation, decisions of where to allocate resources or to establish5
preservation plans should be based on information that ensures, to the greatest degree6
possible, the future viability and success of the preserved populations and of the species7
(Falk, 1991).8
Consequently, one of the first stages in the conservation programme of species9
consists of the evaluation of their genetic variability, their distribution among their10
populations, and the possible detection of rare alleles, as an indicator of populations11
with unique genetic variants (González-Candelas and Montolío, 2000).12
The Food and Agriculture Organization of the United Nations (FAO) has been13
mandated by its member nations to manage global animal genetics resources, and much14
important progress has been made in the last few years (http://www.fao.org/dad-is/).15
However, resources are limited, and priorities will have to be set for breed conservation,16
for breed development programmes and for evaluation studies (Barker, 1999).17
This article presents the results of the analysis of microsatellite variability in five18
endangered Spanish donkey breeds (Andaluza, Catalana, Mallorquina, Encartaciones19
and Zamorano-Leonesa breeds). Our main goals consist of studying the genetic20
diversity of the five populations of donkeys, through the analysis of three methods21
which study genetic variability, based on microsatellite data: Weitzman’s diversity, the22
principal components analysis (PCA) and the allele-shared analysis.23
Anexos
198
Materials and methods1
Population samples2
Currently, the 5 Spanish donkey breed figures fit in the category of endangered3
breeds, proposed by the FAO Expert Consultation (FAO, DAD-IS http://fao.org/dad-is),4
as well as general information on those breeds, which may be found here. The number5
of individuals sampled was as follows: 87 Andaluza (AND), 140 Catalana (CAT), 1046
Mallorquina (MALL), 74 Encartaciones (ENC) and 108 Zamorano-Leonesa (ZAM). In7
addition, 9 Moroccan asses (MOR) were included as a reference population. Donkey8
DNA was prepared from whole blood according to standard methods involving lysates9
of the washed white-cells and phenol-chloroform-isoamylalcohol (25:24:1) extraction10
(Ausubel et al. 1987).11
12
Microsatellite markers13
Out of the 15 equine microsatellite markers used, 12 (ASB2, AHT4, AHT5,14
HMS2, HMS3, HMS6, HMS7, HTG4, HTG6, HTG7, HTG10, and VHL20) were15
included in a kit (Stock-Marks for horses, Equine Paternity PCR Typing kit, PE16
Applied Biosystems Division; Foster City, CA), which was used with slight17
modifications in some PCR conditions. The other 3 markers (HMS1, HMS5 and18
HTG15) were obtained from the literature of equine markers (Breen et al. 1994).19
Primer sequences, reaction conditions and data collections have been described20
previously (Aranguren-Méndez et al. 2001).21
22
23

Anexos
199
Statistical analyses1
Genetic distances can also be used to measure diversity, as proposed by2
Weitzman (1992, 1993). This approach has been implemented here to provide a further3
upward hierarchical representation of the breeds and to evaluate marginal losses of4
diversity due to various patterns of breed extinction, as advocated by Thaon d’ Arnoldi5
et al. (1998).6
Genetic distances between breeds were calculated based on allelic frequencies in7
each breed (available from the authors on request). Two measures of distances were8
used, namely the Reynolds’ (Reynolds et al. 1983) and the standard Nei distances (Nei,9
1972), taking into account the corrections needed for a small sample size (Nei, 1978).10
Principal components analysis (PCA) was performed using the SAS procedure11
PRINCOMP (SAS, 1990) according to the recommendation of Cavalli-Sforza et al.12
(1994). A neighbor-joining (NJ) tree (Saitou and Nei, 1987), using individual animals13
as operational taxonomic units (OTUs), was constructed with a distance matrix derived14
from the simple allele-sharing statistic (Bowcock et al. 1994). The distance was15
obtained using the MICROSAT computer programme (Minch et al. 1995). The PHYLIP16
package (Felsenstein, 1995) was then used to construct the tree from the distance17
matrix.18
19
Results20
Table 1 gives the Reynolds and Nei standard genetic distances. The smallest21
values were obtained for the AND-ZAM and MALL-ENC pairs by Reynolds and Nei22
distances, respectively. The largest were between AND-CAT for both distances.23

Anexos
200
Weitzman’s representation, based on Nei’s standard distance, is shown in Figure1
1, where the branch length for each breed can be read, approximately, measuring its2
relative contribution to the corresponding diversity function. A clear discrimination is3
observed between two groups, i.e., a) a first group constituted only of the Andaluza4
breed (South of Spain), and b) another group involving all breeds of black coat of the5
North of Spain (Catalana, Encartaciones, Mallorquina, and Zamorano-Leonesa breeds).6
The marginal losses of diversity attached to each breed, which may be taken as a7
measure of their “uniqueness”, are shown in Table 2, based on the two distances8
considered. On average, the highest and lowest losses of diversity are incurred with the9
extinction of the Catalana and the Encartaciones breeds, respectively. It can also be10
seen, in Table 2, that the loss of the Andaluza + Catalana + Encartaciones breeds11
induces a markedly higher loss than the sum of the corresponding individual breeds12
losses.13
The first three principal factors in the principal components (PCs) analysis are14
plotted in Figure 2. The first PC accounts for 52.0% of the underlying variation, the15
second PC condenses 15.0% and the third PC accounts for 13.8% of the variation. The16
first component, which explain more than the half of the existent variation, clearly17
separates the Spanish donkey breeds from the Moroccan ass population, and within the18
Spaniards, grouping closely the Catalana and Mallorquina breeds, in a similar way to19
the obtained in other studies (Aranguren-Méndez et al. 2001).20
Figure 3 shows a NJ phylogenetic tree, constructed from the simple allele-21
sharing distance between 109 individuals, 20 animals taken at random from each22
population of Spanish donkeys, except for the Moroccan ass population in which all 923
individuals were used. Of the 100 Spanish donkeys represented in the tree, only 11 were24

Anexos
201
not clustered with animals from the same population, and some of the breeds are very1
closely clustered. For example, all AND and ENC animals are found in discrete2
clusters. The other breeds showed a comparable level of clustering, as do the CAT and3
MALL breeds. The ZAM and Moroccan animals show a more fragmented pattern of4
clustering, with animals from these two populations split into a number of distinct5
groups spread over the tree.6
7
Discussion8
Three different methods of study and its graphic representation of breed genetic9
diversity are presented: Weitzman´s method, the principal component analysis (PCA)10
and the neighbor-joining tree with allele-sharing.11
Weitzman’s diversity defines the diversity expected after a given period of time12
based on the extinction probability of each element of the set considered. If n elements13
are endangered, 2nd survival-extinction patterns may occur with given probabilities, and14
for each pattern the resulting diversity may be calculated (Thaon d’ Arnoldi et al. 1998).15
Knowing the pairwise genetic distances and the risk status of a given set endangered16
breeds, as expressed through their respective probabilities of extinction, an order of17
priority for a cryopreservation programme could thus be established.18
In this study an opportunity is given for evaluating the global diversity in the set19
of breeds considered, using Weitzman’s approach (1992, 1993). Table 2 clearly shows20
the wide range of contributions of each breed to overall diversity, ranging from about21
19.19% (Encartaciones breed) to 29.11% (Catalana breed). Based on these distances22
(Reynolds and Nei distances), the AND, CAT and ENC breeds altogether account for23

Anexos
202
80% of the total diversity, which is an indicator for the potential value to preserve these1
local endangered breeds in the maintenance of biodiversity. The loss of diversity caused2
by extinction in a set of breeds can be estimated by the sum of the ordinates in the3
nodes, which would disappear from the tree if the extinct breeds were to be removed,4
without any other change. Thus, just by looking at the table, it is obvious that the loss of5
the Catalana breed would cause the decrease of diversity three or four times greater than6
the loss of the Mallorquina or Encartaciones breeds. Although the microsatellite-based7
phylogeny and the Weitzman diversity tree (Fig. 1) showed some identical clusters, it8
should not be expected that they will give the same information (Barker et al. 2001).9
However, the results and the conservation decisions that one could take of the10
Weitzman’s diversity analysis based on genetic distances should be taken with caution,11
as recent studies seem to indicate that these methods could be inappropriate for within-12
species breed conservation, because they ignore within-breed variation (Caballero and13
Toro, 2002).14
Multivariate analysis of microsatellite allele frequencies (PCA) has previously15
been shown to be a powerful tool to reveal the underlying evolutionary history and16
admixture among distantly related populations (Schmid et al. 1999; Stahlberger-17
Saitbekova et al. 2001). However, its use as a technique to discern relationships among18
closely related populations is questionable (MacHugh et al. 1998).19
The used markers did not show any breed specific allele allowing simple20
identification of the breed and allocation of each one of the individuals as to its breed21
origin. However, the NJ tree of individuals is in very good agreement with its22
population’s structure (Fig. 3). Of the 100 Spanish donkeys examined, 89 (89.0%) form23
discrete clusters that coincide with the breed of origin of the sample. The position of24
Anexos
203
eleven individuals (11.0%) is not clearly defined in the tree, and the Moroccan ass1
shows a more fragmented pattern of clustering. Within-breed, these samples tend to2
form subclusters and they correspond to their source subpopulations to a very high3
degree (data not shown). Previous studies, which have used a microsatellite allele-4
sharing distance among individual organisms, have revealed a similar level of clustering5
within a population to that observed in Fig. 3 (MacHugh et al. 1998; Laval et al. 2000).6
More precisely, using breed allelic frequencies to calculate the likelihood that an animal7
belongs to a given breed and then assigning the animal to the breed showing the largest8
likelihood (using Bayesian methods as proposed by Rannala and Mountain, 1997)9
allowed at 90.64% the animals to be correctly assigned (data not shown).10
The apparent taxonomic distinctiveness of a breed may not necessarily mean that11
it carries genes that are adaptively unique, as forces other than selection may have been12
operating. For example, random drift can affect the genetic distances among13
populations. When we are selecting breeds for conservation it may be important not just14
to consider taxonomic distinctiveness or between-population variation, but also to take15
measures within population diversity (Blott et al. 1998; Caballero and Toro 2002). Such16
measures could be included into a diversity index and population selected for17
conservation on the basis of this index. On the other hand, there is a need for measuring18
the overall diversity of a set breeds, since prospective evaluations of diversity are19
required for defining appropriate conservation policies, as advocated by Weitzman20
(1993). In addition to this, the usefulness of global evaluations of diversity using21
molecular markers for the choice of breeds is worthy of conservation. We hope that this22
information and that reported previously (Aranguren-Méndez et al. 2001; Jordana et al.23

Anexos
204
2001) will significantly contribute to the establishment of a sensible preservation1
strategy for these populations.2
3
Acknowledgements4
We gratefully acknowledge Professor J.L. Foulley (INRA, Quantitative & Applied5
Genetics) for his advice on the approach for the Weitzman analysis. This study was6
made possible by the financial support of the CICYT (project AGF98-0503) and the7
DARP (Generalitat de Catalunya). We are also grateful to the Breed Associations of the8
Spanish donkeys for their helpful co-operation and assistance during the sample9
collection, and we would like to thank Chuck Simmons for the English revision.10
11
References12
Aranguren-Méndez J.; Jordana J.; Gómez, M., 2001: Genetic diversity in Spanish13
donkey breeds using microsatellite DNA markers. Genet. Sel. Evol. 33: 433-442.14
Ausubel, F.M.; Brent, R.; Kingston, R.E.; Moore, D.D.; Seidman, G.G.; Smith, J.A.;15
Struhl, K., 1987. Current Protocols in Molecular Biology, Green Publishing16
Associates and Wiley-Interscience, New York.17
Barker, J.S.F., 1999: Conservation of livestock diversity. AGRI. 25: 33-43.18
Barker, J.S.F.; Tan, S.G.;Moore, S.S.; Mukherjee, T.K.; Matheson, J.-L.; Selvaraj, O.S.19
2001: Genetic variation within and relationships among populations of Asian goats20
(Capra hircus). J. Anim. Breed. Genet. 118: 213-233.21

Anexos
205
Blott, S.C.; Williams, J.L.; Haley, C.S., 1998: Genetics relationships among European1
cattle breeds. Anim. Genet. 29: 273-282.2
Breen, M.; Downs, P.; Irvin, Z.; Bell, K., 1994: Intrageneric amplification of horse3
microsatellite markers with emphasis on the Przewalski’s horse (E. przewalskii).4
Anim. Genet. 25: 401-405.5
Bowcock, A.M.; Ruiz-Linares, A.; Tomfohrde, J.; Minch, E.; Kidd, J.R.; Cavalli-6
Sforza, L.L., 1994: High resolution of human evolutionary trees with polymorphic7
microsatellites. Nature 368: 455-457.8
Caballero, A.; Toro, M.A., 2002: Analysis of genetic diversity for the management of9
conserved subdivided populations. Conserv. Genet. (In Press).10
Cavalli-Sforza, L.L.; Menozzi, P.; Piazza, A., 1994: The history and geography of11
human genes, Princeton University Press, Princeton, NJ.12
Falk, D.A., 1991: Joining biological and economic models for conserving plant genetic13
diversity. In: Falk, D.A.; Holsinger, K.E. (eds), Genetics and conservation of rare14
plants. pp 209-224. Oxford University Press, New York.15
Felsenstein, J., 1995: PHYLIP (Phylogeny Inference package), Version 3.57c.16
University of Washington, Seattle, WA.17
González-Candelas, F.; Montolío, A., 2000: Genetic differentiation and structure of18
Hippocrepis valentina (Leguminosae) populations. J. Hered. 91: 134-141.19
Jordana, J.; Folch, P.; Aranguren, J.A., 2001: Microsatellite analysis of genetic diversity20
in the Catalonian donkey breed. J. Anim. Breed. Genet. 118: 57-63.21
Laval, G., Iannuccelli N, Legault C.; Milan, D.; Groenen, M.; Guiffra, E.; Anderson, L.;22
Nissen, P.; Jorgensen, C. Beeckmann, P.; Geldermann, H.; Foulley, J.L.; Chevalet,23

Anexos
206
C.; Olliver, L., 2000: Genetic diversity of eleven European pig breeds. Genet. Sel.1
Evol. 32: 187-203.2
MacHugh, D.E.; Loftus, R.T.; Cunningham, P.; Bradley, D.G., 1998: Genetic structure3
of seven European cattle breeds assessed using 20 microsatellites markers. Anim.4
Genet. 29: 333-340.5
Minch, E.; Ruiz-Linares, A.; Goldstein, D.B.; Feldman, M.W.; Cavalli-Sforza, L.L.,6
1995: MICROSAT (version 1.4): a computer program for calculating various7
statistics on microsatellite allele data. WWW: http://lotka.stanford.edu/research.8
Nei, M., 1972: Genetic distances between populations. Amer. Nat. 106: 283-292.9
Nei, M., 1978: Estimation of average heterozygosity and genetic distance from a small10
number of individuals. Genetics 89: 583-590.11
Rannala, B.; Mountain, J.L. 1997. Detecting immigration by using multilocus12
genotypes. Proc. Natl. Acad. Sci. USA. 94: 9197-9221.13
Reynolds, J.; Weir, B.S.; Cockerham, C.C., 1983: Estimation of the coancestry14
coefficient: Basis for a short-term genetic distance. Genetics 105: 767-769.15
Saitou, N.; Nei, M., 1987: The neighbor-joining method: a new method for16
reconstructing phylogenetic trees. Mol. Biol. Evol. 4:406-425.17
SAS., 1990: SAS/Stat User’s guide, version 6, 4th edn. SAS Institute Inc. Cary, NC.18
Schmid, M.; Saitbekova, N.; Gaillard, C.; Dolf, G. 1999. Genetic diversity in Swiss19
cattle breeds. J. Anim. Breed. Genet. 116: 1-8.20

Anexos
207
Stahlberger-Saitbekova, N.; Schläpfer, J.; Dolf, G. Gaillard, C. 2001. Genetic1
relationships in Swiss sheep breeds based on microsatellite analysis. J. Anim.2
Breed. Genet. 118: 379-387.3
Thaon d’Arnoldi, C.; Foulley, J.L.; Olliver, L., 1998: An overview of the Weitzman4
approach to diversity. Genet. Sel. Evol. 30: 149-161.5
Weitzman, M.L., 1992: On diversity. Quart. J. Econ. 107: 363-405.6
Weitzman, M.L., 1993: What to preserve? An application of diversity theory to crane7
conservation. Quart. J. Econ. 108: 157-183.8
9
10
Authors’ Addreses:11
1Unitat de Genètica i Millora Animal. Departament de Ciència Animal i dels Aliments.12
Facultat de Veterinària, Universitat Autònoma de Barcelona, 08193-Bellaterra,13
Barcelona, Spain.14
2Universidad del Zulia. Facultad de Ciencias Veterinarias. Departamento de Producción15
Animal. Maracaibo 4001-A. Venezuela.16
3Servicio de Ganadería. Diputación Foral de Bizkaia. Avda. Lehendakari Aguirre, 9, 2º,17
48014 Bilbao. Spain.18
19
Corresponding author: Jordi Jordana20
(Fax: +34-935812006; e-mail: [email protected])21

Anexos
208
Legends to tables and figures1
2
Table 1. Reynolds’ distance estimate (below the diagonal) and standard Nei genetic3distance (above the diagonal) among five Spanish donkey breeds.4
5
Table 2. Marginal losses of Weitzman’s diversity in Spanish donkey breeds.6
7
Figure 1. Dendrogram of relationships established by Weitzman’s method using8standard Nei distance among five Spanish donkey breeds.9
10
Figure 2. Principal components analysis of allele frequencies from 13 microsatellite11loci typed in seven populations from five Spanish donkey breeds, and one Moroccan ass12breed. The first PC accounts for 52.0%, second PC condenses 15.0% and the third PC13condenses 13.8% of the variation.14
15
Figure 3. Neighbor-joining dendrogram constructed from allele-sharing distance among16109 individuals from five Spanish donkey breeds, and one Moroccan ass breed.17Numbers to the right indicate the fraction of individuals of the breed.18
19
20
21
22
23
24
25
26
27
28

Anexos
209
Andaluza Catalana Mallorquina Encartaciones Zam-Leonesa
Andaluza
Catalana
Mallorquina
Encartaciones
Zamorano-Leonesa
--------
0.0618
0.0561
0.0452
0.0372
0.1324
--------
0.0441
0.0413
0.0537
0.1074
0.0801
--------
0.0379
0.0393
0.0797
0.0767
0.0597
--------
0.0407
0.0737
0.1140
0.0702
0.0723
--------
(greatest distances in bold; smallest distances in italics)

Anexos
210
Reynolds distance Nei standard distance Average
Breed loss
(Q)
Diversity
V(S\Q)
Absolute loss
∆∆V ∆∆V/V (%)
Relative loss
∆∆V/V (%)
Diversity
V(S\Q)
Absolute loss
∆∆V
Relative loss
∆∆V/V (%)
None (0)
Andaluza (1)
Catalana (2)
Mallorquina (3)
Encartaciones (4)
Zamorano-Leonesa (5)
(1) + (2)
(2) + (4)
(1) + (4)
(1) + (2) + (4)
(2) + (3) + (5)
1810
1323
1312
1403
1431
1438
786
824
944
407
452
0
487
498
407
379
372
1024
986
866
1403
1358
0.00
27.53
29.11
20.16
19.19
20.53
59.01
55.05
46.72
78.20
75.88
0.00
26.91
27.51
22.49
20.94
20.55
56.57
54.48
47.85
77.51
75.03
3424
2460
2373
2814
2827
2722
1320
1520
1863
723
797
0
934
1051
610
597
702
2104
1904
1561
2701
2627
0.00
28.15
30.70
17.82
17.44
20.50
61.45
55.61
45.59
78.88
76.72
V(S\Q) = diversity after dropping Q from S; ∆V = V(S) - V(S\Q) = absolute value.∆V/V = relative value (distance multiplied by 10,000)

Anexos
211

Anexos
212

Anexos
213