Embed Size (px)
Citation preview
8/6/2019 Ratio Final Presntn 97 2003
http://slidepdf.com/reader/full/ratio-final-presntn-97-2003 1/48
8/6/2019 Ratio Final Presntn 97 2003
http://slidepdf.com/reader/full/ratio-final-presntn-97-2003 2/48
PARTICIPANTS
� Nitin Joisor (38)
� Arun Kamat (40)
� Ravindra Korde(06).� Pratik Chheda (02).
� Shreya Vaidya(50).
� Biju kr (20).
� Deepak Sharma(24).
� Manu Sadashivan (22)
8/6/2019 Ratio Final Presntn 97 2003
http://slidepdf.com/reader/full/ratio-final-presntn-97-2003 3/48
AGENDA
1. WHY RATIO ANALYSIS ??????
2. What is Ratio Analysis.
3. Ratio and its calculation.
4.Conclusion based on the calculations.

8/6/2019 Ratio Final Presntn 97 2003
http://slidepdf.com/reader/full/ratio-final-presntn-97-2003 4/48
WHY & WHAT ?????????????
????????????????????

8/6/2019 Ratio Final Presntn 97 2003
http://slidepdf.com/reader/full/ratio-final-presntn-97-2003 5/48
8/6/2019 Ratio Final Presntn 97 2003
http://slidepdf.com/reader/full/ratio-final-presntn-97-2003 6/48

8/6/2019 Ratio Final Presntn 97 2003
http://slidepdf.com/reader/full/ratio-final-presntn-97-2003 7/48
8/6/2019 Ratio Final Presntn 97 2003
http://slidepdf.com/reader/full/ratio-final-presntn-97-2003 8/48
COMPLEXITY Jargons
LARGE ,SCARY ,MISLEADING,BEWILDERING NUMBERS
Eg. In 000 or millions / billions and so on..
Highly intimidating
TOO much to read , understand and
finally to decide
upon.
LOOKING AT ONE REPORT DOESNOT TELL THE WHOLE
STORY
PROBLEMS / ISSUES
8/6/2019 Ratio Final Presntn 97 2003
http://slidepdf.com/reader/full/ratio-final-presntn-97-2003 9/48
SOLUTION:
However, through financial ratio analysis, you will be able to
work with these numbers in an organized fashion.
While earnings are important, they don't tell the whole story.
When it comes to investing, analyzing financial statement
information (also known as quantitative analysis), is one of, if not the most important element in the fundamental analysis
process.
Easy to understand and to evaluate

8/6/2019 Ratio Final Presntn 97 2003
http://slidepdf.com/reader/full/ratio-final-presntn-97-2003 10/48
EASY investment evaluators.
Quick investment decision
making.Helps Mgmnt, Investors
:::::::::::::::::::::::::::::::::CONCLUSION : :::::::::::::::::::::::::::::::::::::::::::::::::::
8/6/2019 Ratio Final Presntn 97 2003
http://slidepdf.com/reader/full/ratio-final-presntn-97-2003 11/48
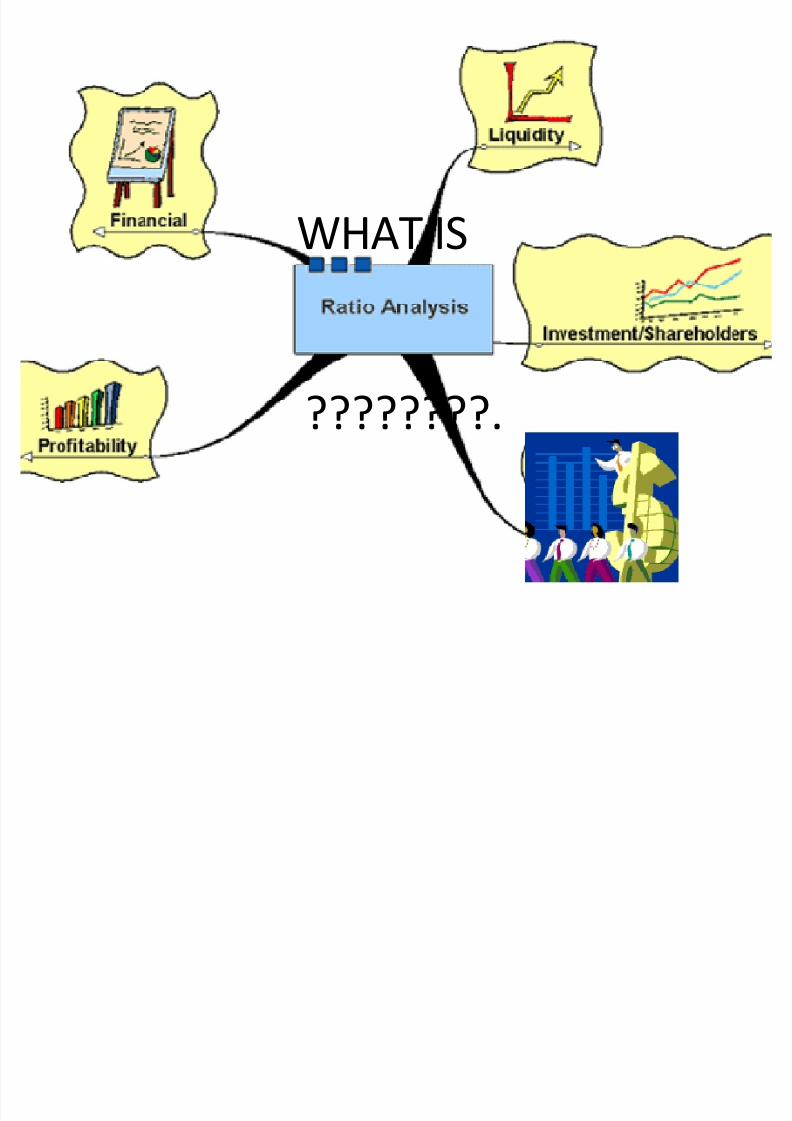
WHAT IS
????????.
8/6/2019 Ratio Final Presntn 97 2003
http://slidepdf.com/reader/full/ratio-final-presntn-97-2003 12/48
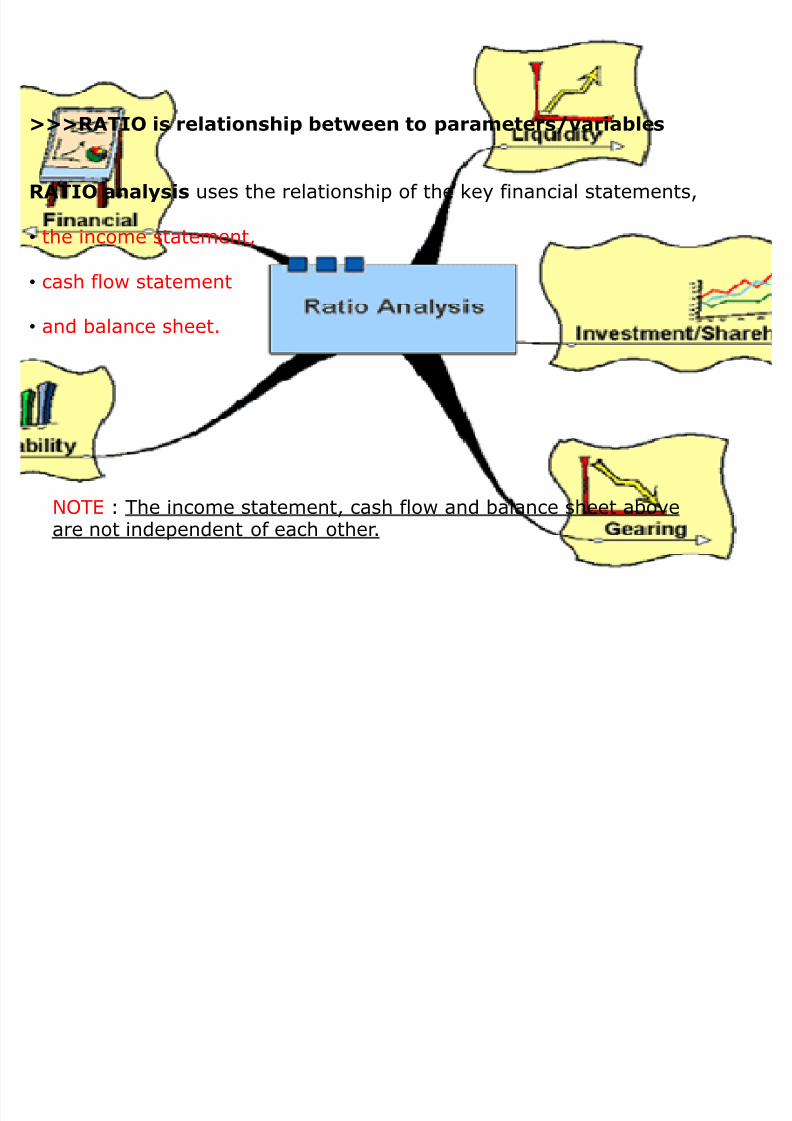
>>>RATIO is relationship between to parameters/variables
RATIO analysis uses the relationship of the key financial statements,
� the income statement,
� cash flow statement
� and balance sheet.
NOTE : The income statement, cash flow and balance sheet aboveare not independent of each other.

8/6/2019 Ratio Final Presntn 97 2003
http://slidepdf.com/reader/full/ratio-final-presntn-97-2003 13/48
WHAT ARE 3 FINANCIAL STATEMENTS????????????????????
8/6/2019 Ratio Final Presntn 97 2003
http://slidepdf.com/reader/full/ratio-final-presntn-97-2003 14/48
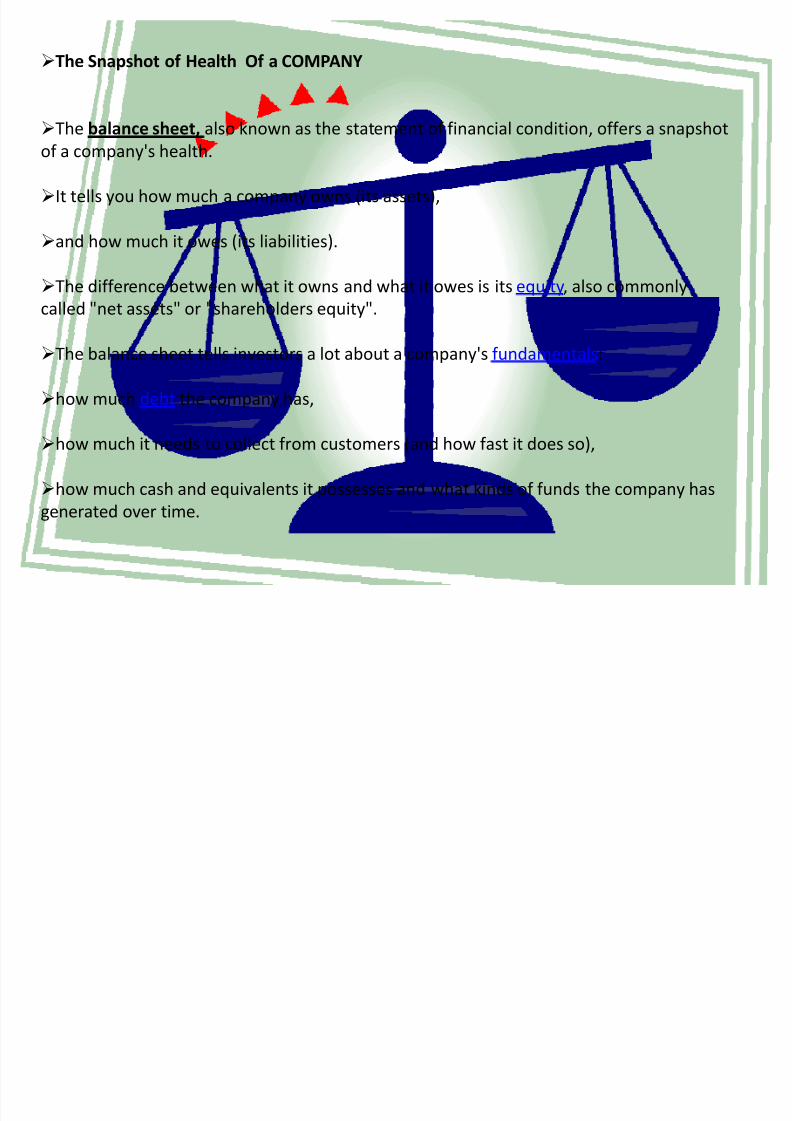
The Snapshot of Health Of a COMPANY
The balance sheet, also known as the statement of financial condition, offers a snapshot
of a company's health.
It tells you how much a company owns (its assets),
and how much it owes (its liabilities).
The difference between what it owns and what it owes is its equity, also commonly
called "net assets" or "shareholders equity".
The balance sheet tells investors a lot about a company's fundamentals:
how much debt the company has,
how much it needs to collect from customers (and how fast it does so),
how much cash and equivalents it possesses and what kinds of funds the company has
generated over time.
8/6/2019 Ratio Final Presntn 97 2003
http://slidepdf.com/reader/full/ratio-final-presntn-97-2003 15/48

8/6/2019 Ratio Final Presntn 97 2003
http://slidepdf.com/reader/full/ratio-final-presntn-97-2003 16/48
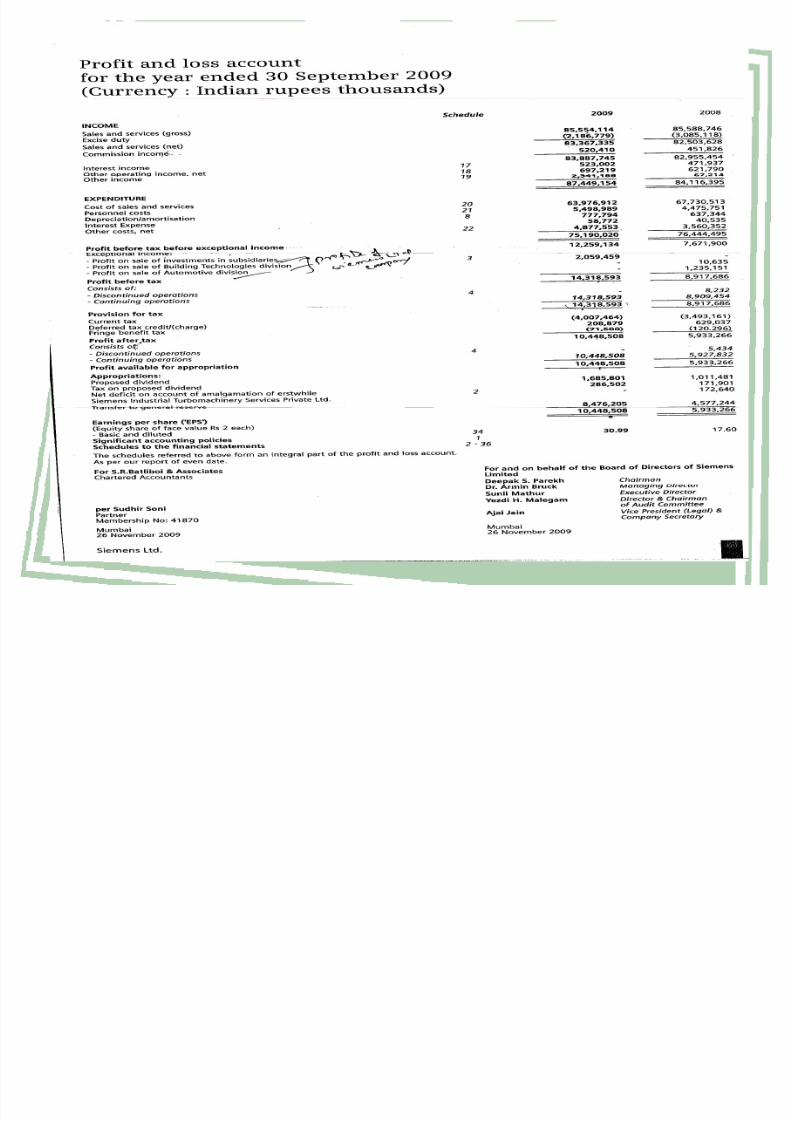
Income statement
The income statement (or profit and loss) shows revenue, cost of sales, expenses, interest and tax, but does not show the cash flow fora business.
C ash flow
The cash flow statement shows the cash flows for the business. Herewe see the operating cash flows, financing cash flows and investingcash flows.
The income statement, cash flow and balance sheet above are notindependent of each other.
8/6/2019 Ratio Final Presntn 97 2003
http://slidepdf.com/reader/full/ratio-final-presntn-97-2003 17/48

8/6/2019 Ratio Final Presntn 97 2003
http://slidepdf.com/reader/full/ratio-final-presntn-97-2003 18/48
8/6/2019 Ratio Final Presntn 97 2003
http://slidepdf.com/reader/full/ratio-final-presntn-97-2003 19/48
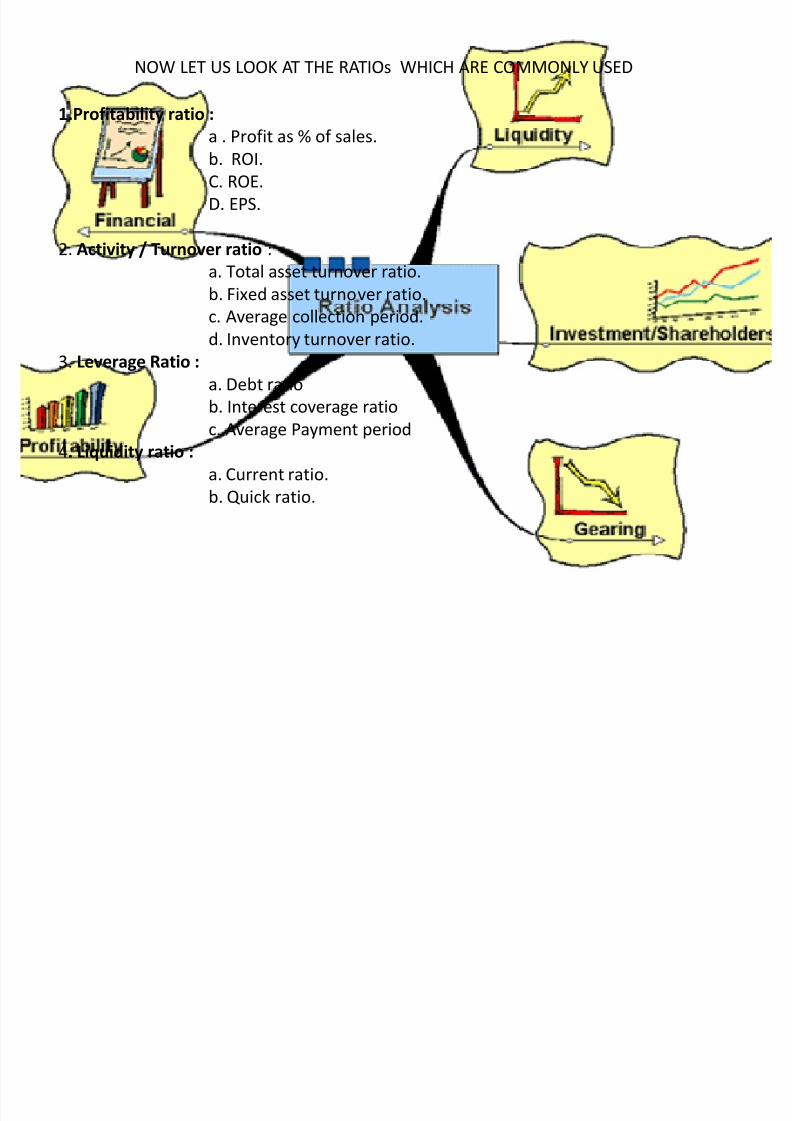
NOW LET US LOOK AT THE RATIOs WHICH ARE COMMONLY USED
1.Profitability ratio :
a . Profit as % of sales.b. ROI.
C. ROE.
D. EPS.
2. Activity / Turnover ratio :
a. Total asset turnover ratio.b. Fixed asset turnover ratio.
c. Average collection period.
d. Inventory turnover ratio.
3. Leverage Ratio :
a. Debt ratio
b. Interest coverage ratio
c. Average Payment period
4. Liquidity ratio :
a. Current ratio.
b. Quick ratio.
8/6/2019 Ratio Final Presntn 97 2003
http://slidepdf.com/reader/full/ratio-final-presntn-97-2003 20/48
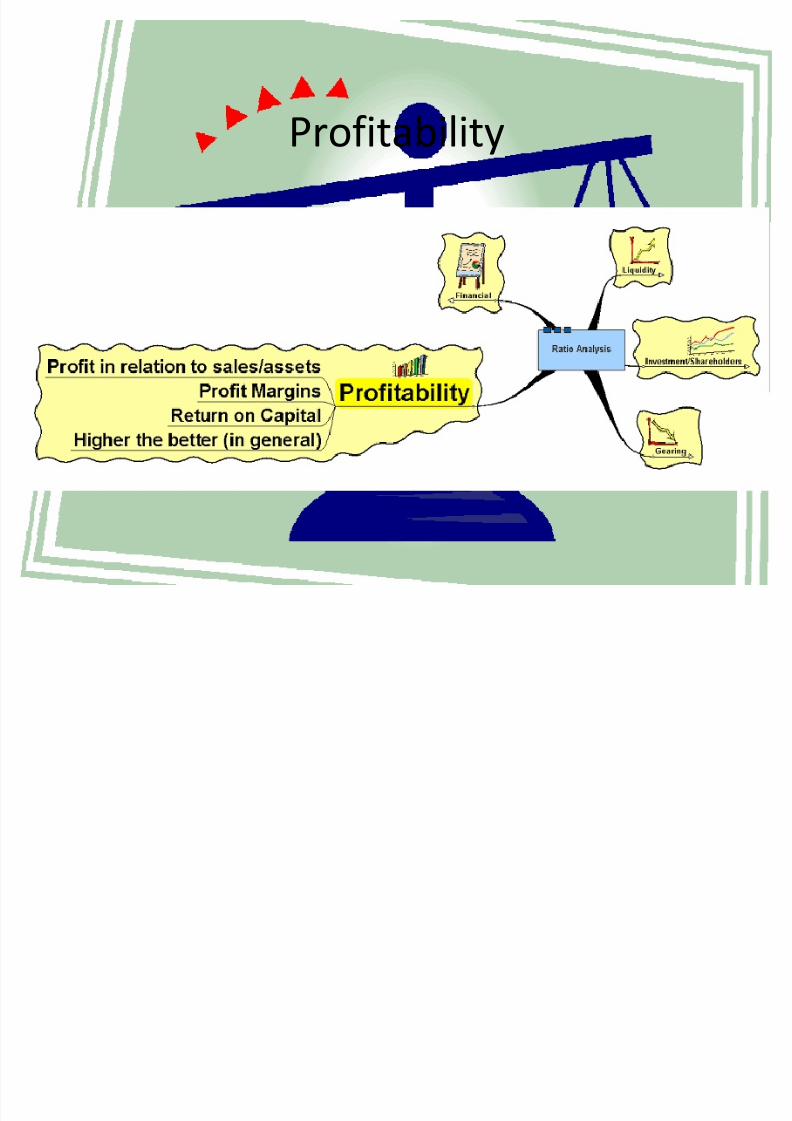
Profitability
8/6/2019 Ratio Final Presntn 97 2003
http://slidepdf.com/reader/full/ratio-final-presntn-97-2003 21/48
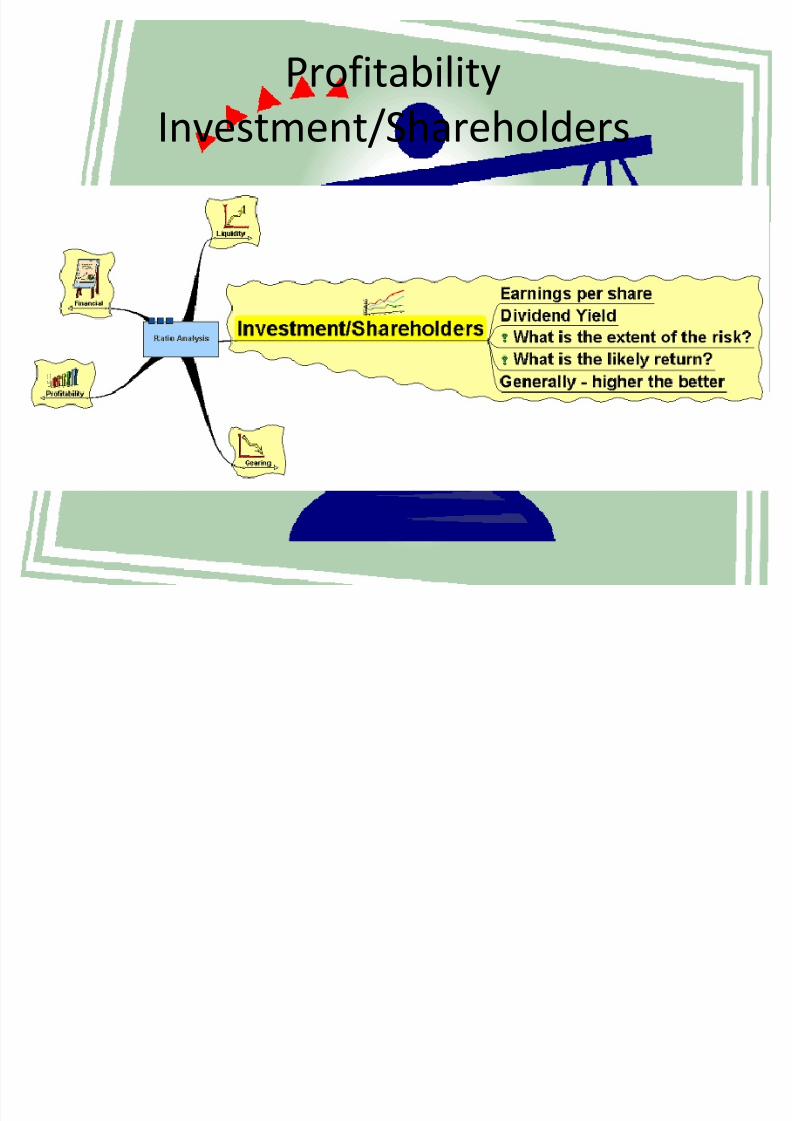
Profitability
Investment/Shareholders
8/6/2019 Ratio Final Presntn 97 2003
http://slidepdf.com/reader/full/ratio-final-presntn-97-2003 22/48
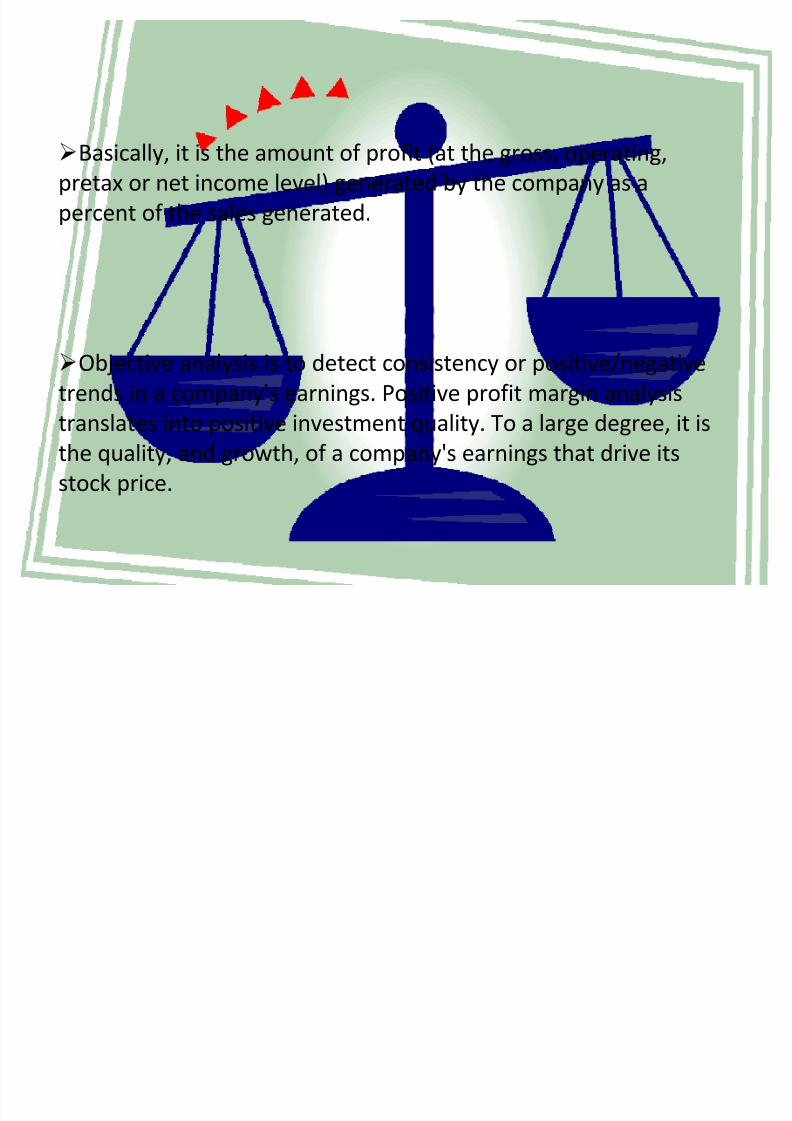
Basically, it is the amount of profit (at the gross, operating,
pretax or net income level) generated by the company as a
percent of the sales generated.
Objective analysis is to detect consistency or positive/negative
trends in a company's earnings. Positive profit margin analysis
translates into positive investment quality. To a large degree, it isthe quality, and growth, of a company's earnings that drive its
stock price.

8/6/2019 Ratio Final Presntn 97 2003
http://slidepdf.com/reader/full/ratio-final-presntn-97-2003 23/48
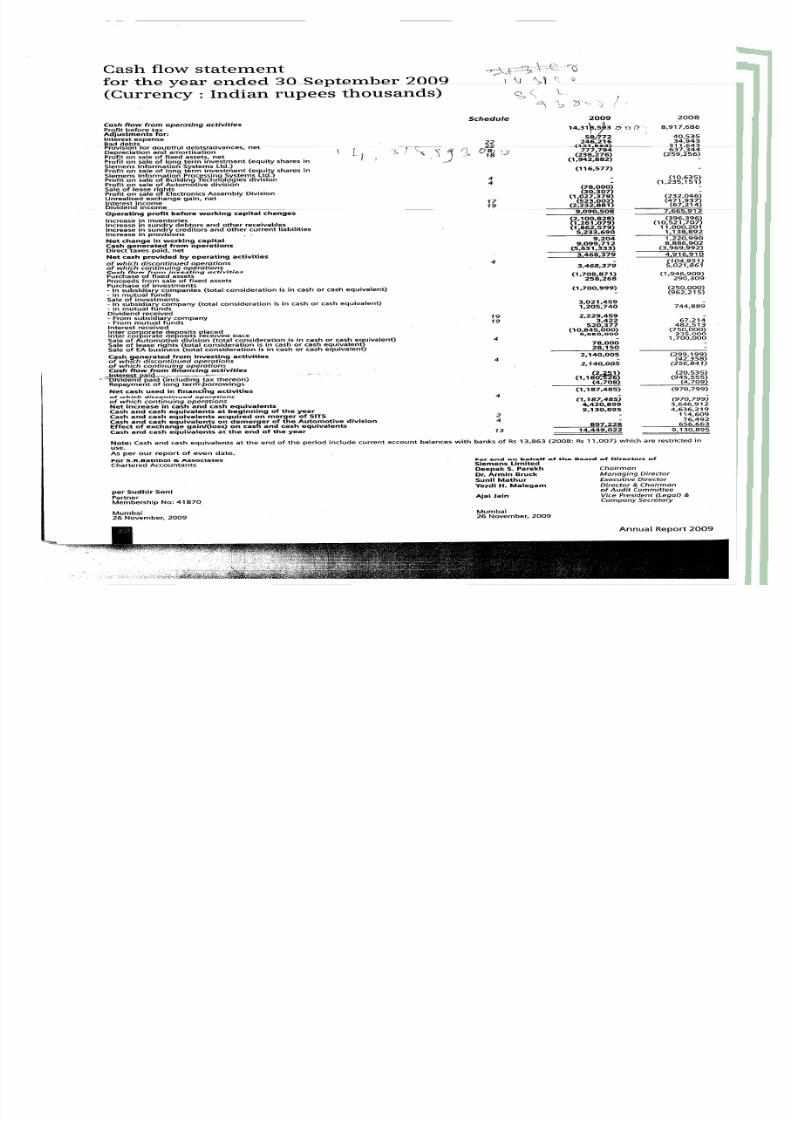
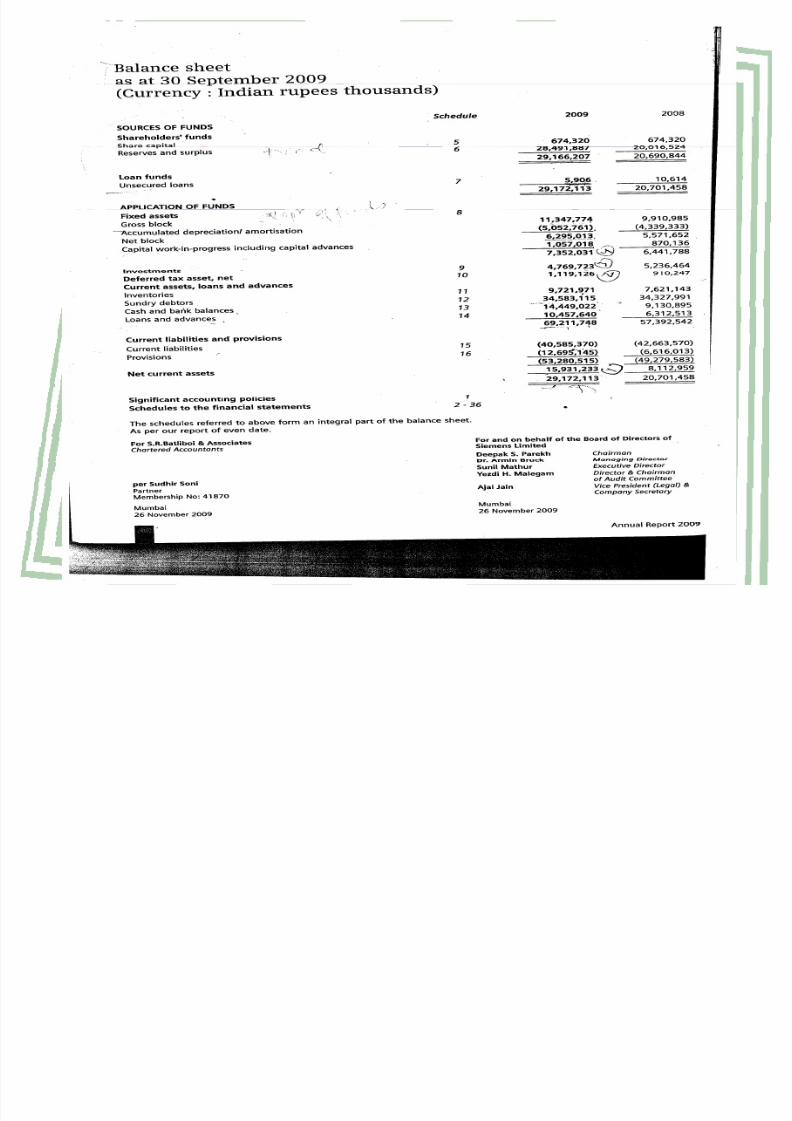
Working for SIEMENS ANNUAL REPORT -
2009

8/6/2019 Ratio Final Presntn 97 2003
http://slidepdf.com/reader/full/ratio-final-presntn-97-2003 24/48
a) Profit as % of sales = Net Profit after taxes X 100
Net Salesfor the Year 2009 :- (Refer P/L A/c Report ) P961
Profit as % of sales (2009) = 10,448,508
83,367,335
: Profit as % of sale (2009) = 12.53% of Sales
for the year 2008 :- = Net Profit after taxes X100
Net Sales
Profit as % of sales (2008) = 5,933,266
82,503,628: Profit as % of sale (2008) = 7.19 % of sales
* Higher the better
8/6/2019 Ratio Final Presntn 97 2003
http://slidepdf.com/reader/full/ratio-final-presntn-97-2003 25/48
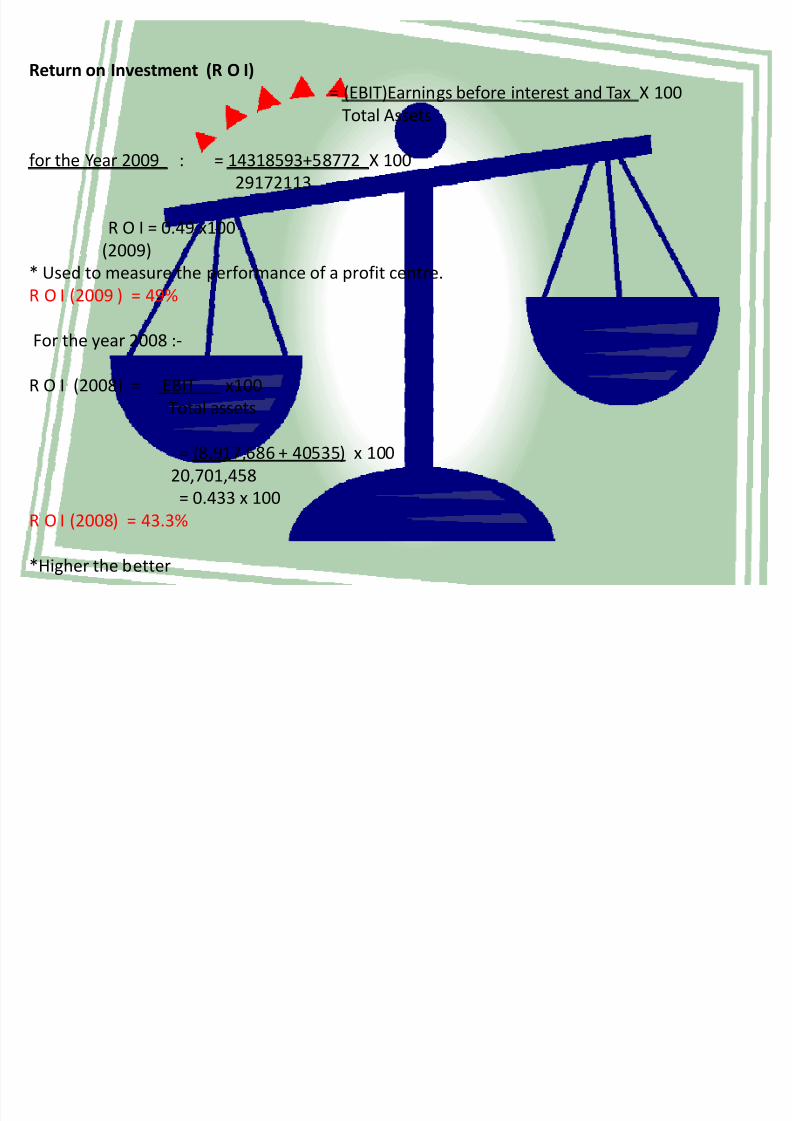
Return on Investment (R O I)
= (EBIT)Earnings before interest and Tax X 100
Total Assets
for the Year 2009 : = 14318593+58772 X 100
29172113
R O I = 0.49 x100
(2009)
* Used to measure the performance of a profit centre.R O I (2009 ) = 49%
For the year 2008 :-
R O I (2008) = EBIT x100
Total assets
= (8,917,686 + 40535) x 100
20,701,458
= 0.433 x 100
R O I (2008) = 43.3%
*Higher the better
8/6/2019 Ratio Final Presntn 97 2003
http://slidepdf.com/reader/full/ratio-final-presntn-97-2003 26/48
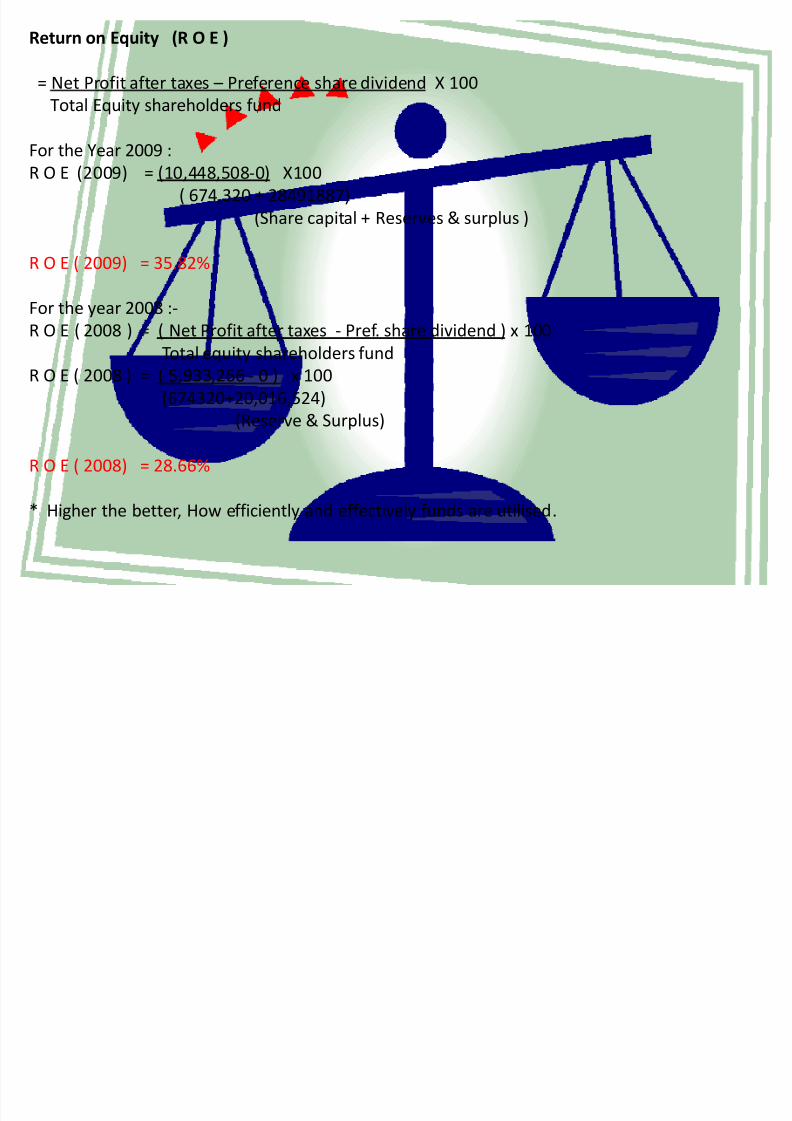
Return on Equity (R O E )
= Net Profit after taxes Preference share dividend X 100
Total Equity shareholders fund
For the Year 2009 :
R O E (2009) = (10,448,508-0) X100
( 674,320 + 28491887)
(Share capital + Reserves & surplus )
R O E ( 2009) = 35.82%
For the year 2008 :-
R O E ( 2008 ) = ( Net Profit after taxes - Pref. share dividend ) x 100
Total equity shareholders fund
R O E ( 2008 ) = ( 5,933,266 - 0 ) x 100
(674320+20,016,524)
(Reserve & Surplus)
R O E ( 2008) = 28.66%
* Higher the better, How efficiently and effectively funds are utilised.
8/6/2019 Ratio Final Presntn 97 2003
http://slidepdf.com/reader/full/ratio-final-presntn-97-2003 27/48
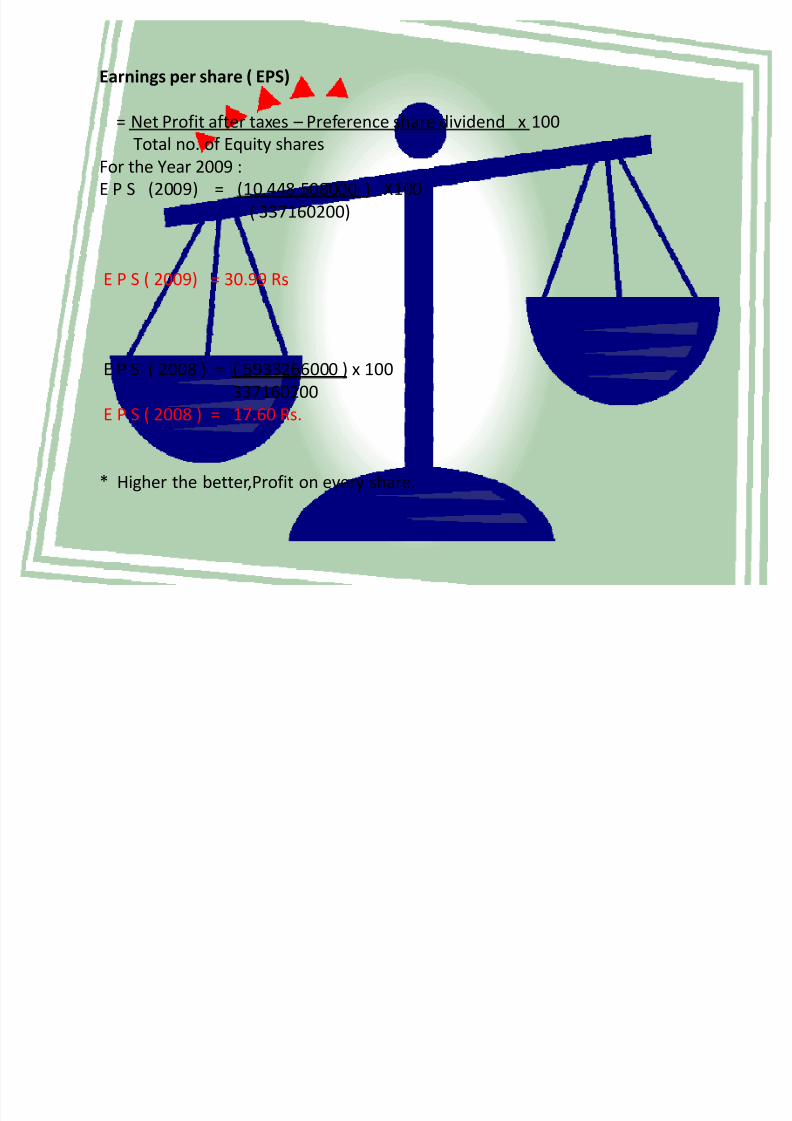
Earnings per share ( EPS)
= Net Profit after taxes Preference share dividend x 100
Total no. of Equity sharesFor the Year 2009 :
E P S (2009) = (10,448,508000 ) X100
( 337160200)
E P S ( 2009) = 30.99 Rs
E P S ( 2008 ) = ( 5933266000 ) x 100
337160200
E P S ( 2008 ) = 17.60 Rs.
* Higher the better,Profit on every share.

8/6/2019 Ratio Final Presntn 97 2003
http://slidepdf.com/reader/full/ratio-final-presntn-97-2003 28/48
ACTIVITY / TURNOVER RATIO
*********used to find out Hidden Problems

8/6/2019 Ratio Final Presntn 97 2003
http://slidepdf.com/reader/full/ratio-final-presntn-97-2003 29/48
a) Total Asset Turnover ratio = Net Sales
Total assets
: Total asset turnover ratio (2009) = 83367335
29172113
Total Asset turnover ratio (2009) = 2.85
Total Asset Turnover ratio(2008) = Net Sales
Total assets
: Total asset turnover ratio (2008) = 82503628
29172113
Total Asset turnover ratio (2008) = 2.83
* Higher the better,How efficiently and effectively assets are utilised.

8/6/2019 Ratio Final Presntn 97 2003
http://slidepdf.com/reader/full/ratio-final-presntn-97-2003 30/48
Fixed Asset Turnover ratio = Net Sales
Net fixed assets
For year 2009 :-
Fixed asset turnover ratio (2009) = 83367335
( Gross block depreciation)
= 83367335
6295013
Fixed Asset turnover ration (2009) = 13.24
Fixed Asset turnover ration (2008) = 82503628
5571652
Fixed Asset turnover ration (2008) = 14.81
* Higher the better,How efficiently and effectively fixed assets are utilised.
8/6/2019 Ratio Final Presntn 97 2003
http://slidepdf.com/reader/full/ratio-final-presntn-97-2003 31/48
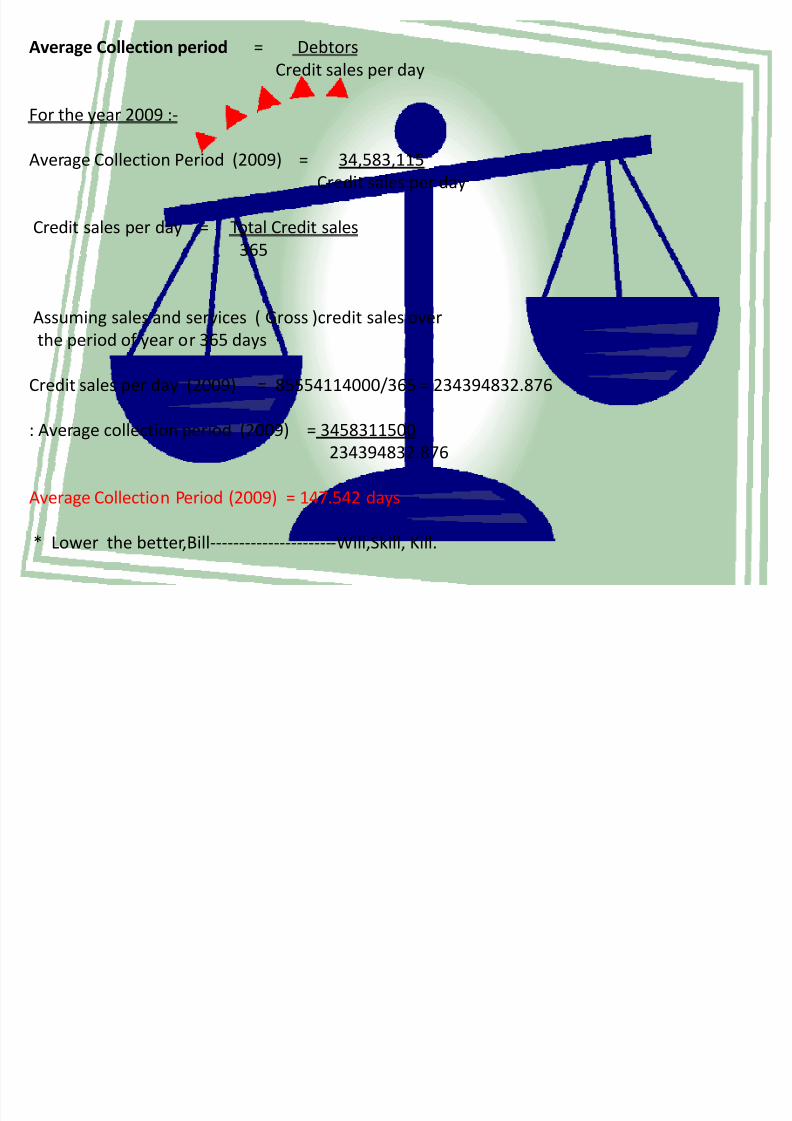
Average Collection period = Debtors
Credit sales per day
For the year 2009 :-
Average Collection Period (2009) = 34,583,115
Credit sales per day
Credit sales per day = Total Credit sales
365
Assuming sales and services ( Gross )credit sales over
the period of year or 365 days
Credit sales per day (2009) = 85554114000/365 = 234394832.876
: Average collection period (2009) = 3458311500
234394832.876
Average Collection Period (2009) = 147.542 days
* Lower the better,Bill----------------------Will,Skill, Kill.
8/6/2019 Ratio Final Presntn 97 2003
http://slidepdf.com/reader/full/ratio-final-presntn-97-2003 32/48
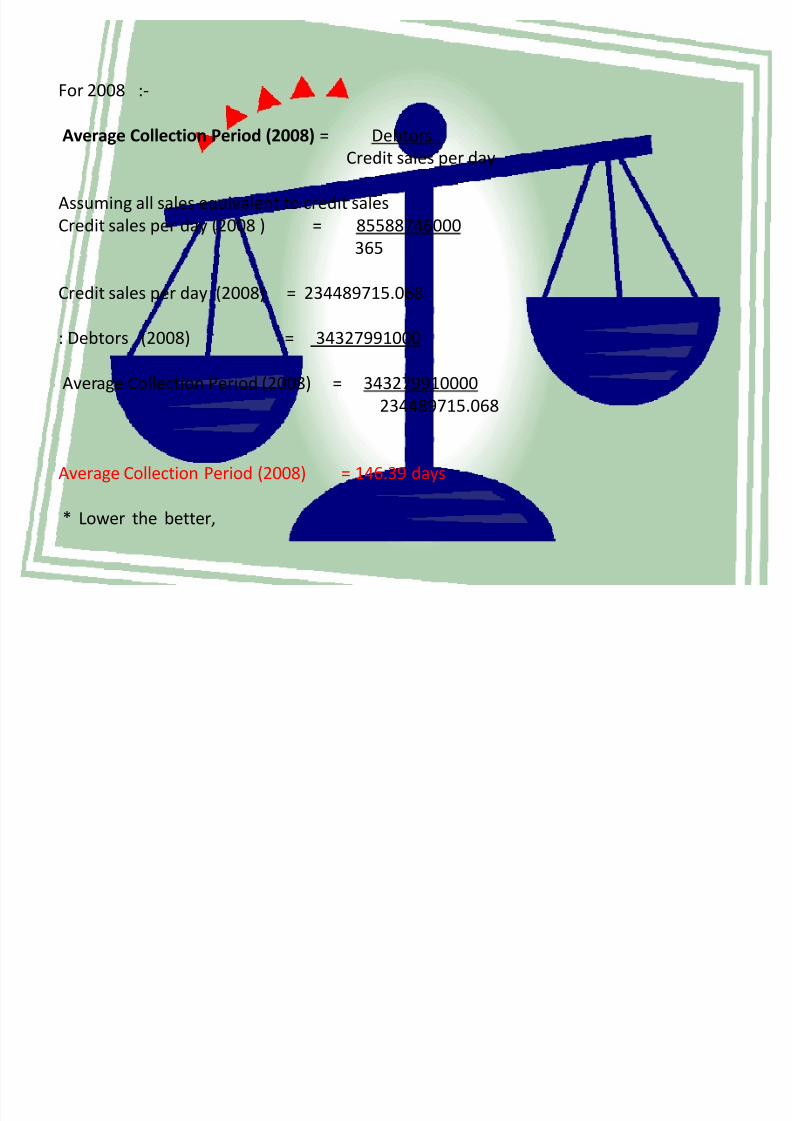
For 2008 :-
Average Collection Period (2008) = DebtorsCredit sales per day
Assuming all sales equivalent to credit sales
Credit sales per day (2008 ) = 85588746000
365
Credit sales per day (2008) = 234489715.068
: Debtors (2008) = 34327991000
Average Collection Period (2008) = 343279910000
234489715.068
Average Collection Period (2008) = 146.39 days
* Lower the better,
8/6/2019 Ratio Final Presntn 97 2003
http://slidepdf.com/reader/full/ratio-final-presntn-97-2003 33/48
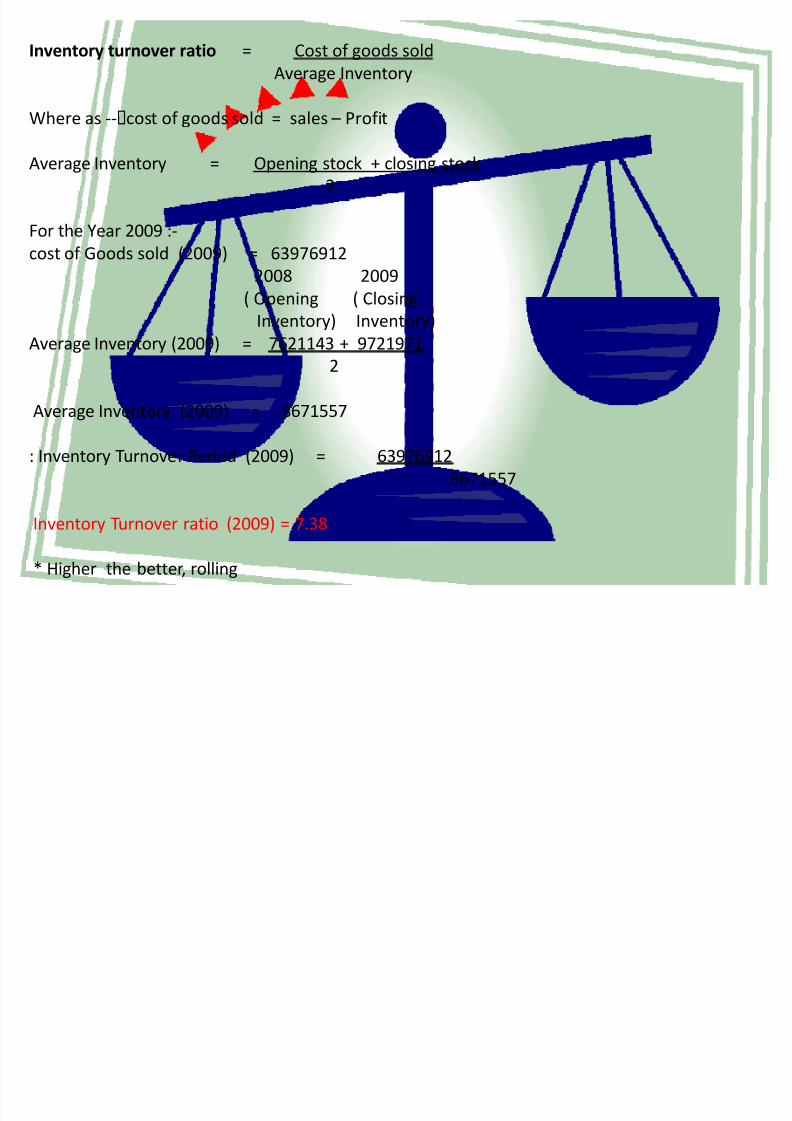
Inventory turnover ratio = Cost of goods sold
Average Inventory
Where as --cost of goods sold = sales Profit
Average Inventory = Opening stock + closing stock
2
For the Year 2009 :-
cost of Goods sold (2009) = 63976912
2008 2009( Opening ( Closing
Inventory) Inventory)
Average Inventory (2009) = 7621143 + 9721971
2
Average Inventory (2009) = 8671557
: Inventory Turnover Period (2009) = 63976912
8671557
Inventory Turnover ratio (2009) = 7.38
* Higher the better, rolling

8/6/2019 Ratio Final Presntn 97 2003
http://slidepdf.com/reader/full/ratio-final-presntn-97-2003 34/48
For ( 2008 )
cost of Goods sold (2009) = 67730513
Assuming opening & closing Inventory same for 2008 & 2007
Average Inventory (2008) = 7621143
Inventory turnover ration (2008) = cost of goods sold
Average Inventory
: = 67730513
7621143
Inventory Turnover ratio (2008) = 8.89
* Higher the better
8/6/2019 Ratio Final Presntn 97 2003
http://slidepdf.com/reader/full/ratio-final-presntn-97-2003 35/48
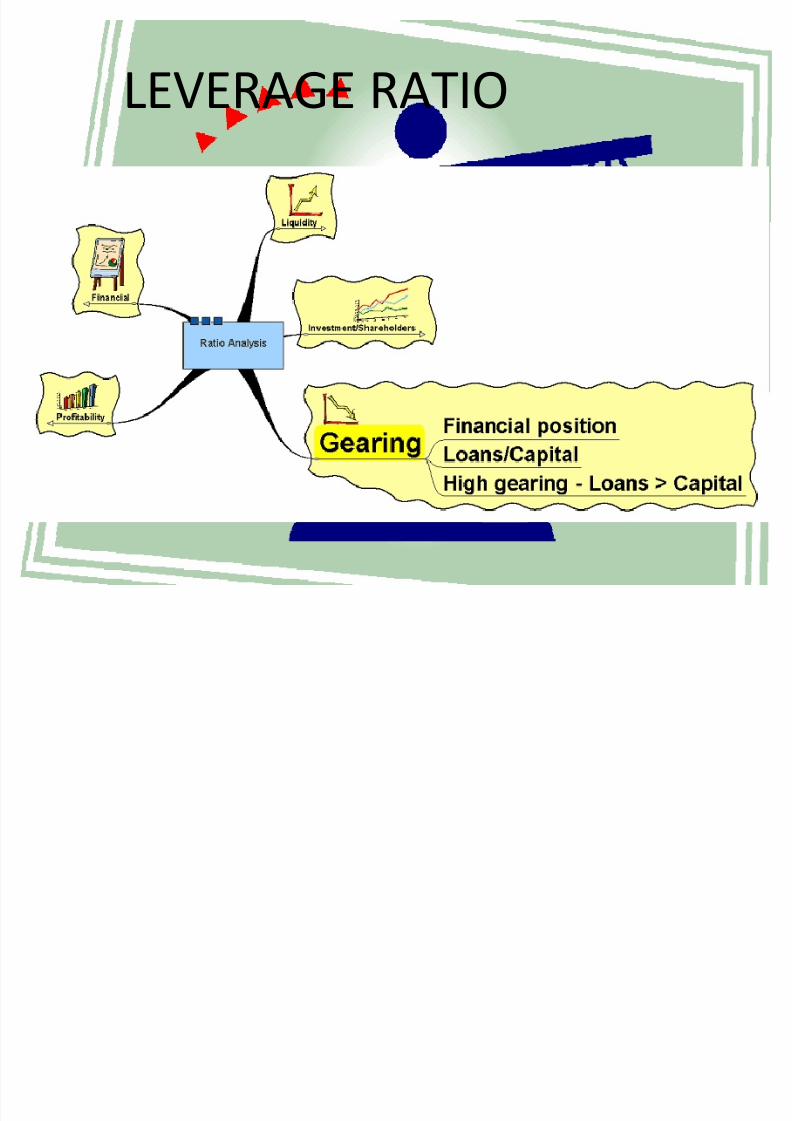
LEVERAGE RATIO
8/6/2019 Ratio Final Presntn 97 2003
http://slidepdf.com/reader/full/ratio-final-presntn-97-2003 36/48
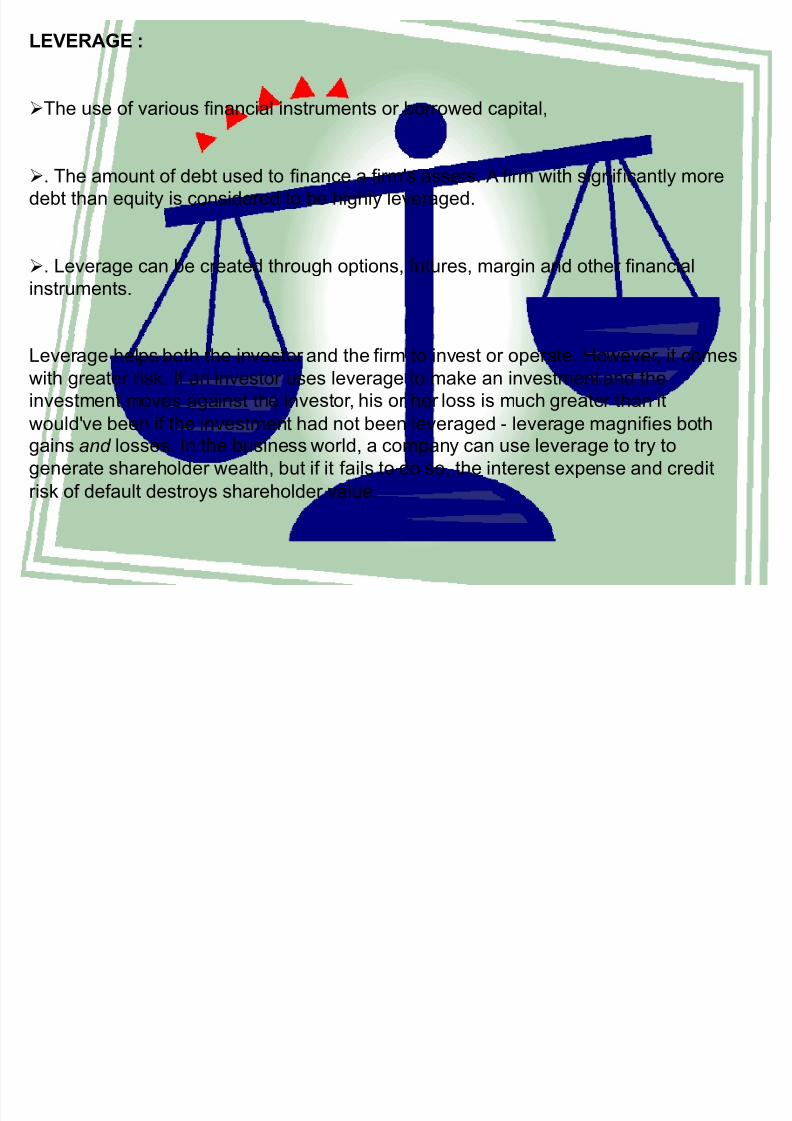
LEVERAGE :
The use of various financial instruments or borrowed capital,
. The amount of debt used to finance a firm's assets. A firm with significantly more
debt than equity is considered to be highly leveraged.
. Leverage can be created through options, futures, margin and other financial
instruments.
Leverage helps both the investor and the firm to invest or operate. However, it comes
with greater risk. If an investor uses leverage to make an investment and the
investment moves against the investor, his or her loss is much greater than it
would've been if the investment had not been leveraged - leverage magnifies bothgains and losses. In the business world, a company can use leverage to try to
generate shareholder wealth, but if it fails to do so, the interest expense and credit
risk of default destroys shareholder value.

8/6/2019 Ratio Final Presntn 97 2003
http://slidepdf.com/reader/full/ratio-final-presntn-97-2003 37/48
Leverage ratios :-
Tells us About how the business is financially sound.
a) Debt ratio = Total Debt x 100
Total Asset
:Debt ratio (2009) = 5906 x 100
29172113
Debt ratio (2009) = 0.02%
Debt ratio (2008) = 10614 x 100
20701458
: Debt ratio (2008) = 0.05%
* lower the better ,Borrowings.

8/6/2019 Ratio Final Presntn 97 2003
http://slidepdf.com/reader/full/ratio-final-presntn-97-2003 38/48
Interest Coverage ratio = E B I T
Interest payments
Interest coverage ratio (2009) = 14318593 + ( 58772)
58772
: Interest coverage ratio (2009) = 244.63
Interest Coverage ratio (2008) = 8917686 + (40535)
40535
Interest coverage ratio (2008) = 221
* Higher the better

8/6/2019 Ratio Final Presntn 97 2003
http://slidepdf.com/reader/full/ratio-final-presntn-97-2003 39/48
Average Payment period = Creditors
Credit purchases per day
Average Payment period (2009)
Creditors = 654274 + 33142 + 23769726 = 24456142
Assuming all purchase to be credit
Credit Purchase per day = Total Purchases
365= 63976912000 = 175279210
365
Credit purchase period (2009) = 24456142000
175279210
Average payment period (2009) = 139.52 days
* lower the better
8/6/2019 Ratio Final Presntn 97 2003
http://slidepdf.com/reader/full/ratio-final-presntn-97-2003 40/48
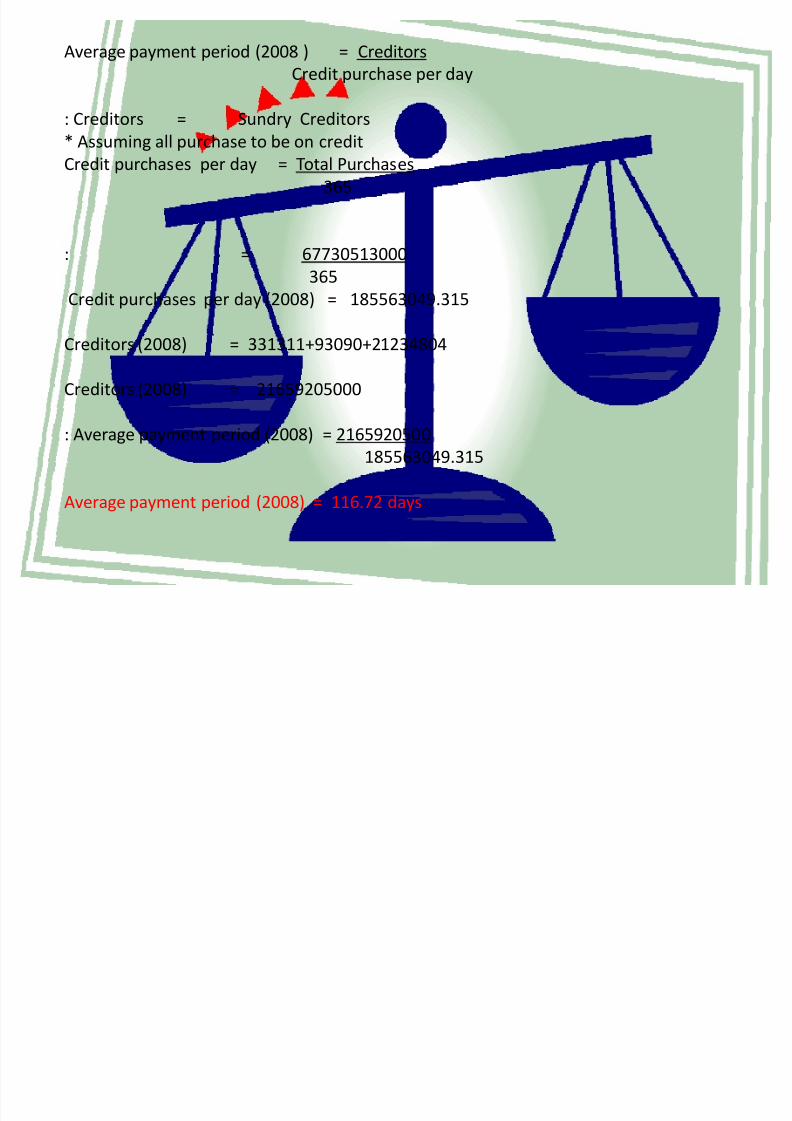
Average payment period (2008 ) = Creditors
Credit purchase per day
: Creditors = Sundry Creditors
* Assuming all purchase to be on creditCredit purchases per day = Total Purchases
365
: = 67730513000
365Credit purchases per day (2008) = 185563049.315
Creditors (2008) = 331311+93090+21234804
Creditors (2008) = 21659205000
: Average payment period (2008) = 2165920500
185563049.315
Average payment period (2008) = 116.72 days

8/6/2019 Ratio Final Presntn 97 2003
http://slidepdf.com/reader/full/ratio-final-presntn-97-2003 41/48
Liquidity

8/6/2019 Ratio Final Presntn 97 2003
http://slidepdf.com/reader/full/ratio-final-presntn-97-2003 42/48
LIQUIDITY RATIOS.
Liquidity ratios attempt to measure a company's ability to pay off its short-term debt
obligations.
This is done by comparing a company's most liquid assets (or, those that can be easily
converted to cash), its short-term liabilities.
In general, the greater the coverage of liquid assets to short-term liabilities the better
as it is a clear signal that a company can pay its debts that are coming due in the near
future and still fund its ongoing operations. On the other hand, a company with a low
coverage rate should raise a red flag for investors as it may be a sign that the company
will have difficulty meeting running its operations, as well as meeting its obligations.

8/6/2019 Ratio Final Presntn 97 2003
http://slidepdf.com/reader/full/ratio-final-presntn-97-2003 43/48
Liquidity ratio
1) current ratio = Current assets
Current Liabilities
: current ratio (2009) = 69211748
53280515
current ratio (2009) = 1.3
(current ratio (2008) = 57392542
49279583
: current ratio (2009) = 1.16
* Higher the better

8/6/2019 Ratio Final Presntn 97 2003
http://slidepdf.com/reader/full/ratio-final-presntn-97-2003 44/48
Quick ratio : / Acid test ratio
= Current assets Inventories
Current liabilities
Quick ratio (2009) = (69211748 9721971)
53280515
= 59489777
53280515
Quick ratio (2009) = 1.12
Quick ratio (2008) = 57392542 7621143
9279583
Quick ratio (2008) = 1.01
* Higher the better
8/6/2019 Ratio Final Presntn 97 2003
http://slidepdf.com/reader/full/ratio-final-presntn-97-2003 45/48
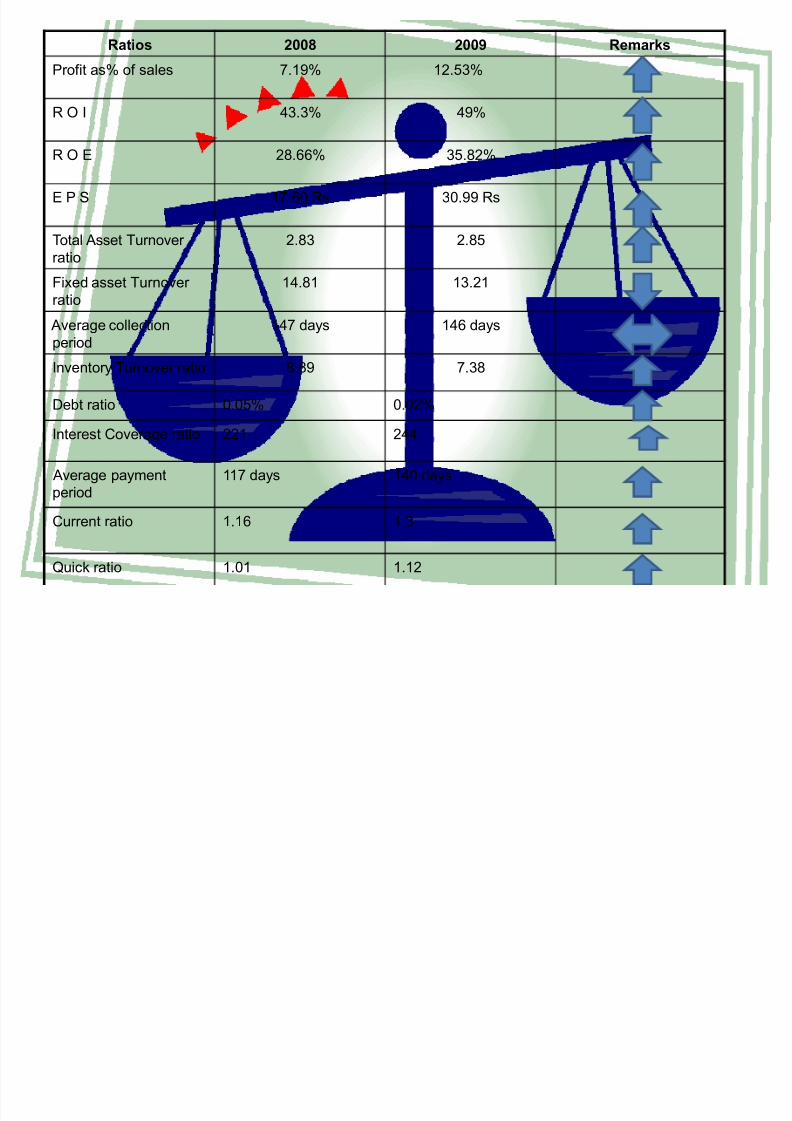
Ratios 2008 2009 Remarks
Profit as% of sales 7.19% 12.53%
R O I 43.3% 49%
R O E 28.66% 35.82%
E P S 17.60 Rs 30.99 Rs
Total Asset Turnover
ratio
2.83 2.85
Fixed asset Turnover ratio
14.81 13.21
Average collection
period
147 days 146 days
Inventory Turnover ratio 8.89 7.38
Debt ratio 0.05% 0.02%
Interest Coverage ratio 221 244
Average payment
period
117 days 140 days
Current ratio 1.16 1.3
Quick ratio 1.01 1.12
8/6/2019 Ratio Final Presntn 97 2003
http://slidepdf.com/reader/full/ratio-final-presntn-97-2003 46/48
CONCLUSION :
After looking at the ratios calaculated in the previous
Slides , we can conclude upon
That ,The over all performance of the company has
been improved and shown consistency in the
performance for the period 2008 and 2009.

8/6/2019 Ratio Final Presntn 97 2003
http://slidepdf.com/reader/full/ratio-final-presntn-97-2003 47/48

8/6/2019 Ratio Final Presntn 97 2003
http://slidepdf.com/reader/full/ratio-final-presntn-97-2003 48/48
THANK YOU