Embed Size (px)
Citation preview

Revista Mexicana de Ingeniería
Biomédica
ISSN: 0188-9532
Sociedad Mexicana de Ingeniería
Biomédica
México
Sifuentes, E.; Cota-Ruiz, J.; González-Landaeta, R.
Respiratory Rate Detection by a Time-Based Measurement System
Revista Mexicana de Ingeniería Biomédica, vol. 37, núm. 2, mayo-agosto, 2016, pp. 1-9
Sociedad Mexicana de Ingeniería Biomédica
Distrito Federal, México
Available in: http://www.redalyc.org/articulo.oa?id=61945281003
How to cite
Complete issue
More information about this article
Journal's homepage in redalyc.org
Scientific Information System
Network of Scientific Journals from Latin America, the Caribbean, Spain and Portugal
Non-profit academic project, developed under the open access initiative

ARTÍCULO DE INVESTIGACIÓN REVISTA MEXICANA DE
INGENIERÍA BIOMÉDICAibVol. 37, No. 2, May-Ago 2016, pp. xx-xx
dx.doi.org/10.17488/RMIB.37.2.3
Respiratory Rate Detection by a Time-BasedMeasurement System
E. Sifuentes, J. Cota-Ruiz, R. González-Landaeta
Departamento de Ingeniería Eléctrica y Computación, Universidad Autónoma de Ciudad Juárez, Chihuahua-México.
ABSTRACTThis paper proposes a system that converts a time-modulated signal from a resistive sensor into a digital signal
with the goal to estimate the respiratory rate of a subject. To detect breathing, a known method based on a nasalthermistor, which detects temperature changes near the nostrils, is used. In this work, the thermistor mountedin a Wheatstone bridge, forms a RC circuit which is connected directly to a microcontroller, without using anyanalog circuit or analog-digital converter. Thus, whenever the subject breathes, it causes a fractional change inresistance x (∆R/R0) on the thermistor, and this produces a time-modulated signal that is directly digitized withthe microcontroller. Measurements were made on 23 volunteers, obtaining changes of x > 0.01. The temperatureresolution was 0.2 C, and the time response was 0.8 s, mainly limited by the thermistor properties; these featureswere enough to obtain a well-defined waveform of the breathing, from which was easy to estimate the respiratoryrate by a compact, low cost and low power consumption system. Unlike interface circuits based on voltage or currentamplitude, with this kind of interface, the self-heating of the sensor is avoided since the thermistor does not requireany voltage or bias current.Keywords: time-based measurements, Wheatstone bridge sensors, respiratory rate, temperaturemeasurement, nasal thermistor.
Correspondencia:Rafael González LandaetaInstituto de Ingeniería y Tecnología, Departamento de IngenieríaEléctrica y Computación, Universidad Autónoma de Ciudad Juárez,Av. del Charro 450 nte., C.P.32310, Ciudad Juárez, Chihuahua,México.Correo electrónico: [email protected]
Fecha de recepción:16 de diciembre de 2015
Fecha de aceptación:7 de marzo de 2016

2 Revista Mexicana de Ingeniería Biomédica · volumen 37 · número 2 · May-Ago, 2016
RESUMENEste trabajo propone un sistema que convierte una señal modulada en tiempo, proveniente de un sensor resistivo,
en una señal digital con el fin de estimar la frecuencia respiratoria de un sujeto. Para detectar la respiración se utilizóel método basado en un termistor nasal, el cual detecta los cambios de temperatura cerca de las fosas nasales. En estetrabajo, el termistor, montado en un puente de Wheatstone, forma un circuito RC que se conecta directamente a unmicrocontrolador, sin necesidad de usar ningún circuito analógico, ni conversor analógico-digital. Así, cada vez queel sujeto respire, provoca un cambio fraccional de resistencia x (∆R/R0) en el termistor, y esto produce una señalmodulada en tiempo que se digitaliza directamente con el microcontrolador. Se hicieron medidas en 23 voluntarios,obteniendo cambios de x > 0.01. Se obtuvo una resolución en temperatura de 0.2 C y un tiempo de respuestade 0.8 s, limitado principalmente por las propiedades del termistor utilizado. Estas características demostraron sersuficientes para obtener una forma de onda de la respiración bien definida, de la cual es sencillo estimar la frecuenciarespiratoria mediante un sistema compacto, de bajo costo y bajo consumo de energía. A diferencia de los circuitosde interfaz basado en la amplitud de tensión o corriente, con este tipo de interfaz se evita el autocalentamiento delsensor, ya que el termistor no requiere ningún voltaje o corriente de polarización.Palabras clave: medidas basadas en el tiempo, sensores en puente de Wheatstone, frecuenciarespiratoria, medida de temperatura, termistor nasal.
INTRODUCTION
Respiratory rate (RR) is one of thebasic physiological parameters that canhelp to assess the health condition ofa subject. Several works have proposeddifferent methods for detecting the breathingwaveform and have estimated parametersof interest related to the ventilation of thesubject [1-3]. Nasal thermistor is a well-known and accurate method for recording therespiratory phase, which reacts to variationsin air temperature [4]. Formerly, this methodwas used for assessing respiratory patternsand nocturnal events in studies aimed todiagnose sleep disorders [5]. Nowadays, it isstill a reference in several polysomnographicstudies in the diagnosis of obstructive sleepapnea [6, 7].
Resistive sensors, as thermistors,conveniently are set in voltage dividers orin a Wheatstone bridge, which are suited forsensors with large resistance variations andnonlinear response [8]. With an appropriate
configuration, it is possible to linearize theresponse of such sensors with circuits thatprovides an output voltage (or current) thatdepends on both the resistance variationsof the sensor and the supply voltage (orcurrent). In these conventional circuits, itis necessary some analog signal processingstages to adapt the voltage range to thatof the analog-to-digital converter (ADC).Furthermore, the polarization stage cancause a self-heating problem, increasing theuncertainty of the measurement process. Toenhance resolution, it has been proposedsynchronous demodulation, which adds extraprocessing stages on the measurement system[9].
This paper proposes a novel systembased on a direct sensor-to-microcontroller(µC) interface circuit (time-modulatedcircuit). The system is implemented by athermistor in a Wheatstone quarter-bridgetopology directly connected to a µC withoutany analog processing circuits, nor ADC;which results in a compact solution to

Sifuentes et al. Respiratory Rate Detection by a Time-Based Measurement System 3
detect temperature variations. Such a directinterface circuit relies on measuring thedischarging time of a RC network thatincludes the resistances of the sensor bridge,and by means of a time-based equation, it ispossible to estimate the fractional resistancechange x (∆R/R0) of the sensor [10].
In order to demonstrate the feasibilityof the proposed method, we used the well-known nasal thermistor technique to detectthe breathing by measuring the thermalfluctuations near the nostrils of severalsubjects. Although the proposed method hasbeen successfully applied to piezoresistiveand magnetoresistive sensors in full andhalf-bridge topologies [11, 12] to detect DCor quasi-DC signals, at the best of ourknowledge, such method has not been usedto sense AC magnitudes (such as respiratoryrate), which could be extended to othermedical applications.
SENSING APPROACH
Thermistor description
In order to detect the temperature variationsnear the nostrils, it is necessary to know thethermistor characteristics (e.g., sensitivityand time response). Commonly, a normalbreathing of an adult subject is between12 and 15 breaths per minute, that is, abandwidth up of 0.25 Hz [13]. Temperaturefluctuations (∆T ) due to the subject breathdepend on the environmental temperature,and it rarely exceeds 20 C if the surroundingtemperature is 13 C [14, 15]. In order toobtain a breathing waveform to estimate theRR, we considered that the system must beable, in principle, to have a resolution of0.5 C.
The thermistor used in this study isthe NTCLE305E4202SB (VISHAY). It has anegative temperature coefficient (NTC), andthe resistance RT at any temperature T (overa 50 C span) can be determined by an
exponential law [8]:
RT = R0eB
(1T
− 1T0
), (1)
where B is the characteristic temperatureof the material, R0 is the resistance ofthe thermistor at a reference temperatureT0, usually 25 C. Here, we considereda temperature span of 25 C (15 C -40 C) where the relative sensitivity of thethermistor (α) has a nonlinear dependence onT :
α = − B
T 2 (2)
From (2), α15 = -4.23 %/K, α25 = -3.95%/K α40 = - 3.58 %/K, which corresponds toa maximal relative non-linearity error of 15% (calculated from the best-fit straight line).Theoretically, for a temperature resolutionof 0.5 C, the fractional resistance changeof the thermistor must be 2 % (x = 0.02),which implies an effective resolution of 6bit. According to [10], the method used tomeasure x has an effective resolution of 8 bitfor a measuring time of 10 ms, and it hasa theoretical resolution of 0.1 C. Nonlinearerrors modify the shape of the temperaturevariations, but not the estimation of the RR[16]. A thermistor behaves as low-pass filter,and the bandwidth depends on the thermalconstant τs. Thus, a high value in τs canproduce a time delay in the estimation of theRR. Commonly, τs is often provided by themanufacturer, but under specific conditions;nevertheless, we can estimate τs from a simpleexperimental setup in order to assert thisvalue. Table 1 shows the basic characteristicsgiven by the manufacturer of the thermistorused.
Fundamentals of the interface circuit
Wheatstone bridges with resistive sensors(quarter-bridge, half-bridge, and full-bridge)can be directly connected to a µC by usingtime-based measurement circuits that yielda digital output that is proportional to thechange of x.

4 Revista Mexicana de Ingeniería Biomédica · volumen 37 · número 2 · May-Ago, 2016
Table 1: Basics characteristic of the thermistorNTCLE305E4202SB.
Parameter Value UnitResistance value 2060 Ωat 25 C (R0)Tolerance on R25− value ±1.92 %B 3511 KOperating Range -40 to +125 CResponse time(in stirred air) ≈ 3 s(in oil) ≈ 0.7Weight ≈ 0.05 g
thermistor characteristics (e.g., sensitivity and time response). Commonly, a normal breathing of an adult subject is between 12 and 15 breaths per minute, that is, a bandwidth up of 0.25 Hz [13]. Temperature fluctuations (ΔT) due to the subject breath depend on the environmental temperature, and it rarely exceeds 20 °C if the surrounding temperature is 13 °C [14, 15]. In order to obtain a breathing waveform to estimate the RR, we considered that the system must be able, in principle, to have a resolution of 0.5 °C.
The thermistor used in this study is the NTCLE305E4202SB (VISHAY). It has a negative temperature coefficient (NTC), and the resistance RT at any temperature $T$ (over a 50 °C span) can be determined by an exponential law [8]:
𝑅! = 𝑅!𝑒! !
!!!!! , (1)
where $B$ is the characteristic temperature of the material, $R_0$ is the resistance of the thermistor at a reference temperature $T_0$, usually 25°C. Here, we considered a temperature span of 25°C (15 °C - 40 °C) where the relative sensitivity of the thermistor ($\alpha$) has a nonlinear dependence on $T$: 𝛼 = − !
!! (2)
From (2), $\alpha_15$ = -4.23 \%/K, $\alpha_25$ = -3.95 \%/K $\alpha_40$ = - 3.58 \%/K, which corresponds to a maximal relative non-linearity error of 15 \% (calculated from the best-fit straight line). Theoretically, for a temperature resolution of 0.5 °C, the fractional resistance change of the thermistor must be 2 \% ($x =$ 0.02), which implies an effective resolution of 6 bit. According to [10], the method used to measure x has an effective resolution of 8 bit for a measuring time of 10 ms, and it has a theoretical resolution of 0.1 °C. Nonlinear errors modify the shape of the temperature variations, but not the estimation of the RR [16]. A thermistor behaves as low-pass filter, and the bandwidth depends on the thermal constant $\tau_s$. Thus, a high value in $\tau_s$ can produce a time delay in the estimation of the RR. Commonly, $\tau_s$ is often provided by the manufacturer, but under specific conditions; nevertheless, we can estimate $\tau_s$ from a simple experimental setup in order to assert this value. Table 1 shows the basic characteristics given by the manufacturer of the thermistor used.
Fundamentals of the interface circuit
Wheatstone bridges with resistive sensors (quarter-bridge, half-bridge, and full-bridge) can be directly connected to a $\mu C$ by using time-based measurement circuits that yield a digital output that is proportional to the change of $x$. Figure 1 shows a direct interface circuit for resistive bridge sensors, previously analysed in [10, 17]. In this kind of interface, the resistive bridge is considered a network with one input terminal and three output terminals. To estimate the changes on $x$, the direct interface circuit performs four discharging times measurements ($t_d1$, $t_d2$, $t_d3$ and $t_d4$) and applies a time-based equation accordingly with the bridge topology [10].
Table 1: Basics characteristic of the thermistor NTCLE305E4202SB.
Parameter Value Unit
Resistance value at 25 °C (R0) 2060 Ω Tolerance on R25- value $\pm$1.92 \%
B 3511 K Operating Range -40 to +125 °C Response time (in stirred air) (in oil)
≈ 3 ≈ 0.7
s
Weight ≈ 0.05 g
Figure 1: Direct sensor-to-$\mu C$ interface circuit for resistive bridge sensors.
The measurement of each discharging time, $t_d$, involves two stages: (a) charging and (b) discharging and time measurement. First, $C$ is charged through $R_p$ (at least $5R_pC$) towards $V_DD$. Then $C$ is discharged towards $V_SS$ (ground reference) through each equivalent resistance, $R_eqi$, between node A and pins P2-P5, respectively, which results in a
µC
VDD
R1 R2
R3 R4
CRp
P1
P2
P3
P4
A
I1O2
O3
Req1
Req2
Req3
O1 Roff
P5
Figure 1: Direct sensor-to-µC interface circuit forresistive bridge sensors.
Figure 1 shows a direct interface circuit forresistive bridge sensors, previously analyzedin [10, 17]. In this kind of interface, theresistive bridge is considered a networkwith one input terminal and three outputterminals. To estimate the changes on x,the direct interface circuit performs fourdischarging times measurements (td1, td2, td3and td4) and applies a time-based equationaccordingly with the bridge topology [10].
The measurement of each dischargingtime, td, involves two stages: (a) chargingand (b) discharging and time measurement.First, C is charged through Rp (at least5RpC) towards VDD. Then C is dischargedtowards VSS (ground reference) through eachequivalent resistance, Reqi, between node A
and pins P2-P5, respectively, which resultsin a RC circuit with a time constant τ =ReqiC. During the discharging time, when thevoltage across C reaches VTL (low thresholdvoltage of the Schmitt Trigger (ST) input)on pin P1, the timing process stops. Thecount of the embedded timer is the digitalequivalent to the discharging time td. Figure2 shows the voltage waveform across C duringthe measurement, which is accomplished ineight steps. Table 2 summarizes the µCpins configuration during the measurementsequence.
A quarter-bridge topology is consideredwhen R1 = R2 = R3 = R0 and R4 = R0(1 −x), such a NTC thermistor (Figure 1). Inthis case, the respective equivalent resistancesseen from pins P2-P5 and node A (when theinternal resistance Rini of each µC pin areconsidered) are:
Req1 = R0(3 − 3x)4 − x
+Roff +Rin2 (3a)
Req2 = R0(4 − 2x)4 − x
+Roff +Rin3 (3b)
Req3 = R0(3 − x)4 − x
+Roff +Rin4 (3c)
Req4 = Roff +Rin5 (3d)
In such conditions, the respectivedischarging time through each equivalentresistance is:
tdi = ReqiC ln(VDD
VTL
)(4)
The time-based equation, originallyproposed in [10] and improved in [17], toestimate x in a quarter-bridge topology is:
$RC$ circuit with a time constant $\tau = R_eqiC$. During the discharging time, when the voltage across $C$ reaches $V_TL$ (low threshold voltage of the Schmitt Trigger (ST) input) on pin P1, the timing process stops. The count of the embedded timer is the digital equivalent to the discharging time $t_d$. Figure 2 shows the voltage waveform across C during the measurement, which is accomplished in eight steps. Table 2 summarizes the $\mu C$ pins configuration during the measurement sequence.
A quarter-bridge topology is considered when $R_1 = R_2 = R_3 = R_0$ and $R_4 = R_0(1 - x)$, such a NTC thermistor (Figure 1). In this case, the respective equivalent resistances seen from pins P2-P5 and node A (when the internal resistance $R_ini$ of each $\mu C$ pin are considered) are:
𝑅!"! =
!!(!!!!)!!!
+ 𝑅!"" + 𝑅!"! (3a)
𝑅!"# =!!(!!!!)!!!
+ 𝑅!"" + 𝑅!"! (3b)
𝑅!"! =!!(!!!)!!!
+ 𝑅!"" + 𝑅!"! (3c)
𝑅!"! = 𝑅!"" + 𝑅!"! (3d)
Figure 2: Voltage waveform across $C$ during a full measurement sequence.
Table 2: Configuration of the $\mu C$ pins during the measurement sequence.
Step P1 P2 P3 P4 P5
1,3 5,7
Output “1” Input Input Input Input
2 Capture Output “0” Input Input Input
4 Capture Input Output “0” Input Input
6 Capture Input Input Output “0” Input
8 Capture Input Input Input Output “0”
In such conditions, the respective discharging time
through each equivalent resistance is:
𝑡!! = 𝑅!"! 𝐶 ln(!!! !!"
) (4)
The time-based equation, originally proposed in [10] and improved in [17], to estimate x in a quarter-bridge topology is:
𝑥∗ = !(!!!!!!!)
!!!!!!!!!!!!!!! (5)
Replacing (3) in (4), and subsequently in (5), yields: 𝑥∗ = !!
!!!∆!!"#$ !∆!!"#$ 𝑥 + !∆!!"#$
!!!∆!!"#$ !∆!!"#$ (6)
Gain and offset errors are small because they depend on the differences between $R_ini$ of the $\mu C$. For instance, if the internal resistances are equals, the errors will be zero. On the other hand, those errors can be corrected by calibration. The resistance $R_p$ in Figure 1 is included to improve the rejection of power supply interferences in the charging stage [18, 19]. $R_off$ was included to reduce the effects of $R_ini$ [17], also this resistance limits the maximal current sunk by each pin during the discharging and time measurement. In [18, 19], there are some design guidelines to improve the performance of the direct interface circuits and therefore the measurement.
DESIGN AND IMPLEMENTATION
Design of the measurement system
Figure 3 shows the proposed circuit for detecting the breathing. It was implemented by the microcontroller MSP430F123 (Texas Instruments) running at 8 MHz (quartz oscillator clock). So, the embedded 16-bit timer/counter counts the discharge time by incrementing its value each 125 ns. The supply voltage of the $\mu C$ was $V_DD$ = 3.0 V, provided by a dedicated voltage regulator (LF30CV) to reduce power supply interference, which may result in trigger noise [19]. The function of P1-P5 (Figure 1) was implemented by P1.2, P3.7, P3.6, P3.3, and P3.2, respectively. A quarter-bridge topology was implemented by $R_1 = R_2 = R_3 = R_0 =$ 2.2 k$\Omega$ resistances (with 1 \% of tolerance and 50 ppm). The resistance of the NTC at 25 °C was close to 2.06 k$\Omega$ (see Table 1). The thermistor was placed on $R_4 = R_0 (1-x)$.
To reduce the effects of the internal trigger noise,
VDD
VTL
VSS
1,3,5,7 Charging stage2,4,6,8 Discharging and time measurement stage
Timer starts
Timer stops
1 2 3 4 5 6
td1 td2 td3
8
td4
7
Figure 2: Voltage waveform across C during a fullmeasurement sequence.

Sifuentes et al. Respiratory Rate Detection by a Time-Based Measurement System 5
Table 2: Configuration of the µC pins during themeasurement sequence.
Step P1 P2 P3 P4 P51,3 Output “1” Input Input Input Input5,72 Capture Output “0” Input Input Input4 Capture Input Output “0” Input Input6 Capture Input Input Output “0” Input8 Capture Input Input Input Output “0”
x∗ = 2(td1 − td3)td2 + td3 − td1 − td4
(5)
Replacing (3) in (4), and subsequently in(5), yields:
x∗ = R0
R0 + ∆Rin35 + ∆Rin42x
+ 2∆Rin24
R0 + ∆Rin35 + ∆Rin42(6)
Gain and offset errors are small becausethey depend on the differences between Rini
of the µC. For instance, if the internalresistances are equals, the errors will bezero. On the other hand, those errors canbe corrected by calibration. The resistanceRp in Figure 1 is included to improve therejection of power supply interferences in thecharging stage [18, 19]. Roff was includedto reduce the effects of Rini [17], also thisresistance limits the maximal current sunkby each pin during the discharging and timemeasurement. In [18, 19], there are somedesign guidelines to improve the performanceof the direct interface circuits and thereforethe measurement.
DESIGN AND IMPLEMENTATION
Design of the measurement system
Figure 3 shows the proposed circuit fordetecting the breathing. It was implementedby the microcontroller MSP430F123 (TexasInstruments) running at 8 MHz (quartzoscillator clock). So, the embedded 16-bittimer/counter counts the discharge timeby incrementing its value each 125 ns.The supply voltage of the µC wasVDD = 3.0 V, provided by a dedicated voltageregulator (LF30CV) to reduce power supply
interference, which may result in trigger noise[19]. The function of P1-P5 (Figure 1) wasimplemented by P1.2, P3.7, P3.6, P3.3, andP3.2, respectively. A quarter-bridge topologywas implemented by R1 = R2 = R3 = R0 =2.2 kΩ resistances (with 1 % of tolerance and50 ppm). The resistance of the NTC at 25C was close to 2.06 kΩ (see Table 1). Thethermistor was placed on R4 = R0(1 − x).
To reduce the effects of the internal triggernoise, the µC was set in LPM2 mode. Thisoption disables the CPU but remains inactive mode timers and interrupts, whilethe discharging times are being measuredas suggested in [19]. The pin P1.2 (externalinterrupt with ST buffer, capture mode) wasconfigured to interrupt the µC on falling edgeevery time the discharging C voltage reachesthe VTL value. The µC program was written inC language; however, to increase precision intime measurements, the sequences shown inTable 2 were written in assembler language.C was selected to obtain a suitable timeconstant, τ = ReqiC, for the dischargingand time measurement stage. A large τ valueimplies a slow slew rate of the exponentialvoltage waveform at the trigger point, whichmakes the triggering process more susceptibleto noise, increasing the count dispersion andthe standard deviation of the measurement.In contrast, a too small value of τ yieldsfew counts, giving a large quantizationerror. Thus, the optimal time constant valuewas experimentally determined, and it wasbetween 2 and 3 ms [10, 19]. Therefore, weselected C = 1 µF, with ±5 % of toleranceand 100 ppm/C of temperature coefficient.We chose Rp = 100 Ω that results in chargingtimes (5RpC) of 500 µs.
The discharging times td1, td2, td3 andtd4 were measured, and x was estimatedby (5). Then, this value was sent toa PC via RS-232 by a control programin LabVIEWTM. The serial communicationinterface was implemented by a MAX3223supplied by a separated voltage regulator(and was set in shutdown mode during

6 Revista Mexicana de Ingeniería Biomédica · volumen 37 · número 2 · May-Ago, 2016
the $\mu C$ was set in LPM2 mode. This option disables the CPU but remains in active mode timers and interrupts, while the discharging times are being measured as suggested in [19]. The pin P1.2 (external interrupt with ST buffer, capture mode) was configured to interrupt the $\mu C$ on falling edge every time the discharging $C$ voltage reaches the $V_TL$ value. The $\mu C$ program was written in C language; however, to increase precision in time measurements, the sequences shown in Table 2 were written in assembler language. $C$ was selected to obtain a suitable time constant, $\tau = R_eqiC$, for the discharging and time measurement stage. A large $\tau$ value implies a slow slew rate of the exponential voltage waveform at the trigger point, which makes the triggering process more susceptible to noise, increasing the count dispersion and the standard deviation of the measurement. In contrast, a too small value of $\tau$ yields few counts, giving a large quantization error. Thus, the optimal time constant value was experimentally determined, and it was between 2 and 3 ms [10, 19]. Therefore, we selected $C = 1 \mu$F, with $\pm$5 \% of tolerance and 100 ppm/°C of temperature coefficient. We chose $R_p = 100 \Omega$ that results in charging times ($5R_pC$) of 500 $\mu$s.
The discharging times $t_d1$, $t_d2$, $t_d3$ and $t_d4$ were measured, and $x$ was estimated by (5). Then, this value was sent to a PC via RS-232 by a control program in LabVIEW$^TM$. The serial communication interface was implemented by a MAX3223 supplied by a separated voltage regulator (and was set in shutdown mode during the measuring process) to prevent induced transients in the power supply that could affect the discharging process [19].
Figure 3: Time-based measurement system for detecting respiratory rate. Measurement protocol
The process to validate the proposed method was done over 23 volunteers (8 women and 15 men), all with distinct physical characteristics: (mean $\pm$ SD: age = (27 $\pm$ 8) years; weight = (77 $\pm$ 15) kg; height (1.72 $\pm$ 0.09) m. We measured thermal fluctuations by placing the thermistor near to the nostrils of each subject. As a reference signal, a piezoelectric sensor LDT1-028K from Measurement Specialties [20], was attached to the chest of each volunteer in order to detect the movements of the thorax on each breathing. Figure 4 depicts the location of each sensor on the subject (a) and the position of the thermistor near the nostrils (b). The signal of the piezoelectric sensor was processed by a charge amplifier with a sensitivity of -212 mV/pC and filtered by a first-order low-pass filter with a corner frequency of 1 Hz.
The measurements were obtained by two procedures. In the first procedure called ``Controlled Breathing”, every subject was asked to breathe following a baseline of an oscilloscope that showed a sinusoidal signal with 1 V peak-to-peak and 0.25 Hz. In the second procedure called ``Free Breathing”, the tests were performed while the subjects were breathing at their own rhythm. On each subject, the test was repeated three times with a measurement time of 30 s each test. The signal obtained from nasal thermistor was compared with that obtained from a piezoelectric
Figure 3. Time-based measurement system fordetecting respiratory rate.
the measuring process) to prevent inducedtransients in the power supply that couldaffect the discharging process [19].
Measurement protocol
The process to validate the proposed methodwas done over 23 volunteers (8 womenand 15 men), all with distinct physicalcharacteristics: (mean ± SD: age = (27 ±8) years; weight = (77 ± 15) kg; height(1.72 ± 0.09) m. We measured thermalfluctuations by placing the thermistor nearto the nostrils of each subject. As areference signal, a piezoelectric sensor LDT1-028K from Measurement Specialties [20], wasattached to the chest of each volunteer inorder to detect the movements of the thoraxon each breathing. Figure 4 depicts thelocation of each sensor on the subject (a)and the position of the thermistor near thenostrils (b). The signal of the piezoelectricsensor was processed by a charge amplifierwith a sensitivity of -212 mV/pC and filteredby a first-order low-pass filter with a cornerfrequency of 1 Hz.
sensor.
Figure 4: (a) Location of the sensors on the body during the measurement protocol and (b) position of the thermistor near the nostrils.
RESULTS AND DISCUSSION
In the proposed system, the low-pass response is
limited by the time response of the thermistor. Figure 5 depicts the fractional resistance of the thermistor as a response to a thermal step input, which was between 23 °C and 9 °C. We obtained $\tau_s$ = 0.8 s, which is suitable for detecting the RR. The nonlinear errors of the thermistor were not considered because we were only interested on the detection of an AC magnitude (temperature fluctuations).
Figure 6 shows the signals obtained with the proposed system and with the piezoelectric sensor. Both signals match in the number of breaths and also coincide with the 0.25 Hz of the \it Controlled Breathing measured during the 30 s.
Figure 5: Experimental time response of the thermistor NTCLE305E4202SB for a thermal step between 23 °C and 9 °C. The sensor is able to respond in 0.8 s, enough for detecting the breathing-related thermal fluctuations.
Figure 6: Controlled Breathing waveform obtained from a nasal thermistor directly connected to a $\mu C$ (top) and from a piezoelectric film sensor attached to the chest of a volunteer (bottom).
Figures 7 and 8 show the frequency spectrum of the breathing waveforms of two subjects who were asked to breathe at their own rhythm. The signals were obtained with the direct interface circuit. As can be seen, both figures presented remarkable differences. For example, Figure 7 shows a clear peak at 0.3 Hz (18 breaths per minute) while Figure 8 shows a clear peak at 0.16 Hz (10 breath per minute). These results demonstrate that the proposed system is able to detect RR breath-by-breath, and it is also able to detect different breathing rates. Moreover, the frequency spectrum of both signals shows a negligible contribution of noise.
The sensitivity of the proposed method relies on the sensor sensitivity. Since the thermistor is not supplied by any constant voltage or current, self-heating problems are avoided and the sensitivity does not depends on any polarization source, as usually happens in conventional signal conditioning systems.
Figure 7: Free Breathing waveform obtained from a nasal thermistor directly connected to a $\mu C$ (top) and the frequency spectrum showing a clear peak at 0.3 Hz.
Nasal thermistor
Piezoelectric sensor
(a) (b)
Thermistor
0 0.5 1 1.5 2 2.5 3 3.5 40
0.2
0.4
0.6
0.8
x
t/s
0 5 10 15 20 25 30-0.35
-0.3
-0.25
-0.2
-0.15
0 5 10 15 20 25 30
1
0.5
0
-0.5
-1
t/s
t/s
Voltage/V
x0 5 10 15 20 25 30-0.3
-0.25
-0.2
xt/s
0 0.5 1 1.5 2 2.5 3
10
20
Ampl
itude
/V/H
z
f/Hz
sensor.
Figure 4: (a) Location of the sensors on the body during the measurement protocol and (b) position of the thermistor near the nostrils.
RESULTS AND DISCUSSION
In the proposed system, the low-pass response is
limited by the time response of the thermistor. Figure 5 depicts the fractional resistance of the thermistor as a response to a thermal step input, which was between 23 °C and 9 °C. We obtained $\tau_s$ = 0.8 s, which is suitable for detecting the RR. The nonlinear errors of the thermistor were not considered because we were only interested on the detection of an AC magnitude (temperature fluctuations).
Figure 6 shows the signals obtained with the proposed system and with the piezoelectric sensor. Both signals match in the number of breaths and also coincide with the 0.25 Hz of the \it Controlled Breathing measured during the 30 s.
Figure 5: Experimental time response of the thermistor NTCLE305E4202SB for a thermal step between 23 °C and 9 °C. The sensor is able to respond in 0.8 s, enough for detecting the breathing-related thermal fluctuations.
Figure 6: Controlled Breathing waveform obtained from a nasal thermistor directly connected to a $\mu C$ (top) and from a piezoelectric film sensor attached to the chest of a volunteer (bottom).
Figures 7 and 8 show the frequency spectrum of the breathing waveforms of two subjects who were asked to breathe at their own rhythm. The signals were obtained with the direct interface circuit. As can be seen, both figures presented remarkable differences. For example, Figure 7 shows a clear peak at 0.3 Hz (18 breaths per minute) while Figure 8 shows a clear peak at 0.16 Hz (10 breath per minute). These results demonstrate that the proposed system is able to detect RR breath-by-breath, and it is also able to detect different breathing rates. Moreover, the frequency spectrum of both signals shows a negligible contribution of noise.
The sensitivity of the proposed method relies on the sensor sensitivity. Since the thermistor is not supplied by any constant voltage or current, self-heating problems are avoided and the sensitivity does not depends on any polarization source, as usually happens in conventional signal conditioning systems.
Figure 7: Free Breathing waveform obtained from a nasal thermistor directly connected to a $\mu C$ (top) and the frequency spectrum showing a clear peak at 0.3 Hz.
Nasal thermistor
Piezoelectric sensor
(a) (b)
Thermistor
0 0.5 1 1.5 2 2.5 3 3.5 40
0.2
0.4
0.6
0.8
x
t/s
0 5 10 15 20 25 30-0.35
-0.3
-0.25
-0.2
-0.15
0 5 10 15 20 25 30
1
0.5
0
-0.5
-1
t/s
t/s
Voltage/V
x
0 5 10 15 20 25 30-0.3
-0.25
-0.2
xt/s
0 0.5 1 1.5 2 2.5 3
10
20Am
plitu
de/V
/Hz
f/Hz
a) b)Figure 4. (a) Location of the sensors on the bodyduring the measurement protocol and (b) position ofthe thermistor near the nostrils.
The measurements were obtained by twoprocedures. In the first procedure called“Controlled Breathing”, every subject wasasked to breathe following a baseline of anoscilloscope that showed a sinusoidal signalwith 1 V peak-to-peak and 0.25 Hz. In thesecond procedure called “Free Breathing”,the tests were performed while the subjectswere breathing at their own rhythm. On eachsubject, the test was repeated three timeswith a measurement time of 30 s each test.The signal obtained from nasal thermistorwas compared with that obtained from apiezoelectric sensor.
RESULTS AND DISCUSSION
In the proposed system, the low-pass responseis limited by the time response of thethermistor. Figure 5 depicts the fractionalresistance of the thermistor as a response toa thermal step input, which was between 23C and 9 C. We obtained τs = 0.8 s, which issuitable for detecting the RR. The nonlinearerrors of the thermistor were not consideredbecause we were only interested on thedetection of an AC magnitude (temperaturefluctuations).

Sifuentes et al. Respiratory Rate Detection by a Time-Based Measurement System 7
sensor.
Figure 4: (a) Location of the sensors on the body during the measurement protocol and (b) position of the thermistor near the nostrils.
RESULTS AND DISCUSSION
In the proposed system, the low-pass response is
limited by the time response of the thermistor. Figure 5 depicts the fractional resistance of the thermistor as a response to a thermal step input, which was between 23 °C and 9 °C. We obtained $\tau_s$ = 0.8 s, which is suitable for detecting the RR. The nonlinear errors of the thermistor were not considered because we were only interested on the detection of an AC magnitude (temperature fluctuations).
Figure 6 shows the signals obtained with the proposed system and with the piezoelectric sensor. Both signals match in the number of breaths and also coincide with the 0.25 Hz of the \it Controlled Breathing measured during the 30 s.
Figure 5: Experimental time response of the thermistor NTCLE305E4202SB for a thermal step between 23 °C and 9 °C. The sensor is able to respond in 0.8 s, enough for detecting the breathing-related thermal fluctuations.
Figure 6: Controlled Breathing waveform obtained from a nasal thermistor directly connected to a $\mu C$ (top) and from a piezoelectric film sensor attached to the chest of a volunteer (bottom).
Figures 7 and 8 show the frequency spectrum of the breathing waveforms of two subjects who were asked to breathe at their own rhythm. The signals were obtained with the direct interface circuit. As can be seen, both figures presented remarkable differences. For example, Figure 7 shows a clear peak at 0.3 Hz (18 breaths per minute) while Figure 8 shows a clear peak at 0.16 Hz (10 breath per minute). These results demonstrate that the proposed system is able to detect RR breath-by-breath, and it is also able to detect different breathing rates. Moreover, the frequency spectrum of both signals shows a negligible contribution of noise.
The sensitivity of the proposed method relies on the sensor sensitivity. Since the thermistor is not supplied by any constant voltage or current, self-heating problems are avoided and the sensitivity does not depends on any polarization source, as usually happens in conventional signal conditioning systems.
Figure 7: Free Breathing waveform obtained from a nasal thermistor directly connected to a $\mu C$ (top) and the frequency spectrum showing a clear peak at 0.3 Hz.
Nasal thermistor
Piezoelectric sensor
(a) (b)
Thermistor
0 0.5 1 1.5 2 2.5 3 3.5 40
0.2
0.4
0.6
0.8x
t/s
0 5 10 15 20 25 30-0.35
-0.3
-0.25
-0.2
-0.15
0 5 10 15 20 25 30
1
0.5
0
-0.5
-1
t/s
t/s
Voltage/V
x
0 5 10 15 20 25 30-0.3
-0.25
-0.2
x
t/s
0 0.5 1 1.5 2 2.5 3
10
20
Ampl
itude
/V/H
z
f/Hz
Figure 5. Experimental time response of thethermistor NTCLE305E4202SB for a thermal stepbetween 23 C and 9 C. The sensor is able to respondin 0.8 s, enough for detecting the breathing-relatedthermal fluctuations.
sensor.
Figure 4: (a) Location of the sensors on the body during the measurement protocol and (b) position of the thermistor near the nostrils.
RESULTS AND DISCUSSION
In the proposed system, the low-pass response is
limited by the time response of the thermistor. Figure 5 depicts the fractional resistance of the thermistor as a response to a thermal step input, which was between 23 °C and 9 °C. We obtained $\tau_s$ = 0.8 s, which is suitable for detecting the RR. The nonlinear errors of the thermistor were not considered because we were only interested on the detection of an AC magnitude (temperature fluctuations).
Figure 6 shows the signals obtained with the proposed system and with the piezoelectric sensor. Both signals match in the number of breaths and also coincide with the 0.25 Hz of the \it Controlled Breathing measured during the 30 s.
Figure 5: Experimental time response of the thermistor NTCLE305E4202SB for a thermal step between 23 °C and 9 °C. The sensor is able to respond in 0.8 s, enough for detecting the breathing-related thermal fluctuations.
Figure 6: Controlled Breathing waveform obtained from a nasal thermistor directly connected to a $\mu C$ (top) and from a piezoelectric film sensor attached to the chest of a volunteer (bottom).
Figures 7 and 8 show the frequency spectrum of the breathing waveforms of two subjects who were asked to breathe at their own rhythm. The signals were obtained with the direct interface circuit. As can be seen, both figures presented remarkable differences. For example, Figure 7 shows a clear peak at 0.3 Hz (18 breaths per minute) while Figure 8 shows a clear peak at 0.16 Hz (10 breath per minute). These results demonstrate that the proposed system is able to detect RR breath-by-breath, and it is also able to detect different breathing rates. Moreover, the frequency spectrum of both signals shows a negligible contribution of noise.
The sensitivity of the proposed method relies on the sensor sensitivity. Since the thermistor is not supplied by any constant voltage or current, self-heating problems are avoided and the sensitivity does not depends on any polarization source, as usually happens in conventional signal conditioning systems.
Figure 7: Free Breathing waveform obtained from a nasal thermistor directly connected to a $\mu C$ (top) and the frequency spectrum showing a clear peak at 0.3 Hz.
Nasal thermistor
Piezoelectric sensor
(a) (b)
Thermistor
0 0.5 1 1.5 2 2.5 3 3.5 40
0.2
0.4
0.6
0.8
x
t/s
0 5 10 15 20 25 30-0.35
-0.3
-0.25
-0.2
-0.15
0 5 10 15 20 25 30
1
0.5
0
-0.5
-1
t/s
t/s
Voltage/V
x
0 5 10 15 20 25 30-0.3
-0.25
-0.2
x
t/s
0 0.5 1 1.5 2 2.5 3
10
20
Ampl
itude
/V/H
z
f/Hz
Figure 6. Controlled Breathing waveform obtainedfrom a nasal thermistor directly connected to a µC(top) and from a piezoelectric film sensor attached tothe chest of a volunteer (bottom).
Figure 6 shows the signals obtainedwith the proposed system and with thepiezoelectric sensor. Both signals match inthe number of breaths and also coincidewith the 0.25 Hz of the Controlled Breathingmeasured during the 30 s.
Figures 7 and 8 show the frequencyspectrum of the breathing waveforms of twosubjects who were asked to breathe at theirown rhythm. The signals were obtained withthe direct interface circuit. As can be seen,both figures presented remarkable differences.For example, Figure 7 shows a clear peak at0.3 Hz (18 breaths per minute) while Figure8 shows a clear peak at 0.16 Hz (10 breathper minute). These results demonstrate thatthe proposed system is able to detect RRbreath-by-breath, and it is also able todetect different breathing rates. Moreover,the frequency spectrum of both signals showsa negligible contribution of noise.
sensor.
Figure 4: (a) Location of the sensors on the body during the measurement protocol and (b) position of the thermistor near the nostrils.
RESULTS AND DISCUSSION
In the proposed system, the low-pass response is
limited by the time response of the thermistor. Figure 5 depicts the fractional resistance of the thermistor as a response to a thermal step input, which was between 23 °C and 9 °C. We obtained $\tau_s$ = 0.8 s, which is suitable for detecting the RR. The nonlinear errors of the thermistor were not considered because we were only interested on the detection of an AC magnitude (temperature fluctuations).
Figure 6 shows the signals obtained with the proposed system and with the piezoelectric sensor. Both signals match in the number of breaths and also coincide with the 0.25 Hz of the \it Controlled Breathing measured during the 30 s.
Figure 5: Experimental time response of the thermistor NTCLE305E4202SB for a thermal step between 23 °C and 9 °C. The sensor is able to respond in 0.8 s, enough for detecting the breathing-related thermal fluctuations.
Figure 6: Controlled Breathing waveform obtained from a nasal thermistor directly connected to a $\mu C$ (top) and from a piezoelectric film sensor attached to the chest of a volunteer (bottom).
Figures 7 and 8 show the frequency spectrum of the breathing waveforms of two subjects who were asked to breathe at their own rhythm. The signals were obtained with the direct interface circuit. As can be seen, both figures presented remarkable differences. For example, Figure 7 shows a clear peak at 0.3 Hz (18 breaths per minute) while Figure 8 shows a clear peak at 0.16 Hz (10 breath per minute). These results demonstrate that the proposed system is able to detect RR breath-by-breath, and it is also able to detect different breathing rates. Moreover, the frequency spectrum of both signals shows a negligible contribution of noise.
The sensitivity of the proposed method relies on the sensor sensitivity. Since the thermistor is not supplied by any constant voltage or current, self-heating problems are avoided and the sensitivity does not depends on any polarization source, as usually happens in conventional signal conditioning systems.
Figure 7: Free Breathing waveform obtained from a nasal thermistor directly connected to a $\mu C$ (top) and the frequency spectrum showing a clear peak at 0.3 Hz.
Nasal thermistor
Piezoelectric sensor
(a) (b)
Thermistor
0 0.5 1 1.5 2 2.5 3 3.5 40
0.2
0.4
0.6
0.8
x
t/s
0 5 10 15 20 25 30-0.35
-0.3
-0.25
-0.2
-0.15
0 5 10 15 20 25 30
1
0.5
0
-0.5
-1
t/s
t/s
Voltage/V
x
0 5 10 15 20 25 30-0.3
-0.25
-0.2
x
t/s
0 0.5 1 1.5 2 2.5 3
10
20
Ampl
itude
/V/H
z
f/Hz
Figure 7. Free Breathing waveform obtained from anasal thermistor directly connected to a µC (top) andthe frequency spectrum showing a clear peak at 0.3Hz.
Figure 8: Free Breathing waveform obtained from a nasal thermistor directly connected to a $\mu C$ (top) and the frequency spectrum showing a clear peak at 0.16 Hz.
Figure 9 shows a Bland-Altman plot that compares the RR time interval of the breathing signals, detected from the 23 volunteers with the proposed method and with the piezoelectric sensor. The mean bias was 17 ms and the dispersion (with a 95 \% confidence interval) was about 303 ms, which is practically negligible. Figure 10 shows the scatter plot and the correlation coefficient for the RR time interval, where both were estimated from signals detected with the proposed method and with the piezoelectric sensor. The correlation coefficient for the data on the 23 volunteers was 0.95, which is a statistically significant correlation.
Figure 9: Bland-Altman plot of each RR time interval detected from the signal obtained with the thermistor and with the piezoelectric sensor of the 23 volunteers.
Figure 10: Correlation analysis of the RR time interval estimated from the signal detected with the thermistor and the RR time interval estimated from the signal detected with the piezoelectric sensor.
CONCLUSIONS A simple, low-cost and compact system has been implemented for detecting the breathing using a nasal thermistor. The sensor, mounted in a Wheatstone quarter-bridge topology, was directly connected to a $\mu C$. The temperature fluctuations near the nostrils (due to breathing of the subjects) have been clearly detected. The proposed system did not require the use of any analog processing circuits, nor ADC. The proposed circuit could detect fractional changes in resistance of $x >$ 0.01, which resulted in a resolution of 0.2 °C, enough to follow the breathing-related temperature fluctuations. This achieved well-shaped breathing waveforms, with a negligible noise contribution, from which it is easy to estimate the RR. The system was able to detect the respiration breath-by-breath, just by measuring the discharging time in a capacitor. It was not necessary to supply any voltage or current to the thermistor, so the self-heating was avoided. The methodology proposed in this research can be considered in other medical applications, where the temperature measurement (e.g., the body temperature) could be obtained by a resistive sensor. Bland-Altman and Scatter plots were used to compare de RR time interval between the signal detected with the thermistor and that detected with the piezoelectric sensor. The calculated mean bias was less than 17 ms, and the dispersion was lower than 303 ms, and correlation coefficient was 0.95, which is statistically significant.
ACKNOWLEDGMENTS
This work has been funded by PRODEP (Programa para el Desarrollo Profesional Docente) and UACJ (Universidad Autónoma de Ciudad Juárez) México, project UACJ-PTC-327.
0 5 10 15 20 25 30-0.2
-0.18
-0.16
-0.14
xt/s
0 0.5 1 1.5 2 2.5 3
2Am
plitude/V/Hz
f/Hz
RR
Pie
zo-R
RN
TC (s
)
-0.8-0.6-0.4-0.2
00.20.40.60.8
2 3 4 5 6Average RR time interval from the signal detected with the piezoelectric sensor
and the NTC (in seconds)
0.017
0.320
- 0.286
2
2.5
3
3.5
4
4.5
5
5.5
2 2.5 3 3.5 4 4.5 5 5.5
RR time interval of the signal detected with the piezoelectric sensor (s)
RR
tim
e in
terv
al o
f the
sig
nal d
etec
ted
with
the
NTC
(s)
r = 0.95
Figure 8. Free Breathing waveform obtained from anasal thermistor directly connected to a µC (top) andthe frequency spectrum showing a clear peak at 0.16Hz.
The sensitivity of the proposed methodrelies on the sensor sensitivity. Since thethermistor is not supplied by any constantvoltage or current, self-heating problems areavoided and the sensitivity does not dependson any polarization source, as usuallyhappens in conventional signal conditioningsystems.
Figure 9 shows a Bland-Altman plotthat compares the RR time interval ofthe breathing signals, detected from the 23volunteers with the proposed method andwith the piezoelectric sensor. The mean biaswas 17 ms and the dispersion (with a 95 %confidence interval) was about 303 ms, whichis practically negligible. Figure 10 shows thescatter plot and the correlation coefficientfor the RR time interval, where both wereestimated from signals detected with the

8 Revista Mexicana de Ingeniería Biomédica · volumen 37 · número 2 · May-Ago, 2016
Figure 8: Free Breathing waveform obtained from a nasal thermistor directly connected to a $\mu C$ (top) and the frequency spectrum showing a clear peak at 0.16 Hz.
Figure 9 shows a Bland-Altman plot that compares the RR time interval of the breathing signals, detected from the 23 volunteers with the proposed method and with the piezoelectric sensor. The mean bias was 17 ms and the dispersion (with a 95 \% confidence interval) was about 303 ms, which is practically negligible. Figure 10 shows the scatter plot and the correlation coefficient for the RR time interval, where both were estimated from signals detected with the proposed method and with the piezoelectric sensor. The correlation coefficient for the data on the 23 volunteers was 0.95, which is a statistically significant correlation.
Figure 9: Bland-Altman plot of each RR time interval detected from the signal obtained with the thermistor and with the piezoelectric sensor of the 23 volunteers.
Figure 10: Correlation analysis of the RR time interval estimated from the signal detected with the thermistor and the RR time interval estimated from the signal detected with the piezoelectric sensor.
CONCLUSIONS A simple, low-cost and compact system has been implemented for detecting the breathing using a nasal thermistor. The sensor, mounted in a Wheatstone quarter-bridge topology, was directly connected to a $\mu C$. The temperature fluctuations near the nostrils (due to breathing of the subjects) have been clearly detected. The proposed system did not require the use of any analog processing circuits, nor ADC. The proposed circuit could detect fractional changes in resistance of $x >$ 0.01, which resulted in a resolution of 0.2 °C, enough to follow the breathing-related temperature fluctuations. This achieved well-shaped breathing waveforms, with a negligible noise contribution, from which it is easy to estimate the RR. The system was able to detect the respiration breath-by-breath, just by measuring the discharging time in a capacitor. It was not necessary to supply any voltage or current to the thermistor, so the self-heating was avoided. The methodology proposed in this research can be considered in other medical applications, where the temperature measurement (e.g., the body temperature) could be obtained by a resistive sensor. Bland-Altman and Scatter plots were used to compare de RR time interval between the signal detected with the thermistor and that detected with the piezoelectric sensor. The calculated mean bias was less than 17 ms, and the dispersion was lower than 303 ms, and correlation coefficient was 0.95, which is statistically significant.
ACKNOWLEDGMENTS
This work has been funded by PRODEP (Programa para el Desarrollo Profesional Docente) and UACJ (Universidad Autónoma de Ciudad Juárez) México, project UACJ-PTC-327.
0 5 10 15 20 25 30-0.2
-0.18
-0.16
-0.14
x
t/s
0 0.5 1 1.5 2 2.5 3
2
Amplitude/V/Hz
f/Hz
RR
Pie
zo-R
RN
TC (s
)
-0.8-0.6-0.4-0.2
00.20.40.60.8
2 3 4 5 6Average RR time interval from the signal detected with the piezoelectric sensor
and the NTC (in seconds)
0.017
0.320
- 0.286
2
2.5
3
3.5
4
4.5
5
5.5
2 2.5 3 3.5 4 4.5 5 5.5
RR time interval of the signal detected with the piezoelectric sensor (s)
RR
tim
e in
terv
al o
f the
sig
nal d
etec
ted
with
the
NTC
(s)
r = 0.95
Figure 9. Bland-Altman plot of each RR timeinterval detected from the signal obtained with thethermistor and with the piezoelectric sensor of the 23volunteers.
Figure 8: Free Breathing waveform obtained from a nasal thermistor directly connected to a $\mu C$ (top) and the frequency spectrum showing a clear peak at 0.16 Hz.
Figure 9 shows a Bland-Altman plot that compares the RR time interval of the breathing signals, detected from the 23 volunteers with the proposed method and with the piezoelectric sensor. The mean bias was 17 ms and the dispersion (with a 95 \% confidence interval) was about 303 ms, which is practically negligible. Figure 10 shows the scatter plot and the correlation coefficient for the RR time interval, where both were estimated from signals detected with the proposed method and with the piezoelectric sensor. The correlation coefficient for the data on the 23 volunteers was 0.95, which is a statistically significant correlation.
Figure 9: Bland-Altman plot of each RR time interval detected from the signal obtained with the thermistor and with the piezoelectric sensor of the 23 volunteers.
Figure 10: Correlation analysis of the RR time interval estimated from the signal detected with the thermistor and the RR time interval estimated from the signal detected with the piezoelectric sensor.
CONCLUSIONS A simple, low-cost and compact system has been implemented for detecting the breathing using a nasal thermistor. The sensor, mounted in a Wheatstone quarter-bridge topology, was directly connected to a $\mu C$. The temperature fluctuations near the nostrils (due to breathing of the subjects) have been clearly detected. The proposed system did not require the use of any analog processing circuits, nor ADC. The proposed circuit could detect fractional changes in resistance of $x >$ 0.01, which resulted in a resolution of 0.2 °C, enough to follow the breathing-related temperature fluctuations. This achieved well-shaped breathing waveforms, with a negligible noise contribution, from which it is easy to estimate the RR. The system was able to detect the respiration breath-by-breath, just by measuring the discharging time in a capacitor. It was not necessary to supply any voltage or current to the thermistor, so the self-heating was avoided. The methodology proposed in this research can be considered in other medical applications, where the temperature measurement (e.g., the body temperature) could be obtained by a resistive sensor. Bland-Altman and Scatter plots were used to compare de RR time interval between the signal detected with the thermistor and that detected with the piezoelectric sensor. The calculated mean bias was less than 17 ms, and the dispersion was lower than 303 ms, and correlation coefficient was 0.95, which is statistically significant.
ACKNOWLEDGMENTS
This work has been funded by PRODEP (Programa para el Desarrollo Profesional Docente) and UACJ (Universidad Autónoma de Ciudad Juárez) México, project UACJ-PTC-327.
0 5 10 15 20 25 30-0.2
-0.18
-0.16
-0.14
x
t/s
0 0.5 1 1.5 2 2.5 3
2
Amplitude/V/Hz
f/Hz
RR
Pie
zo-R
RN
TC (s
)
-0.8-0.6-0.4-0.2
00.20.40.60.8
2 3 4 5 6Average RR time interval from the signal detected with the piezoelectric sensor
and the NTC (in seconds)
0.017
0.320
- 0.286
2
2.5
3
3.5
4
4.5
5
5.5
2 2.5 3 3.5 4 4.5 5 5.5
RR time interval of the signal detected with the piezoelectric sensor (s)
RR
tim
e in
terv
al o
f the
sig
nal d
etec
ted
with
the
NTC
(s)
r = 0.95
Figure 10. Correlation analysis of the RR timeinterval estimated from the signal detected with thethermistor and the RR time interval estimated fromthe signal detected with the piezoelectric sensor.
proposed method and with the piezoelectricsensor. The correlation coefficient for the dataon the 23 volunteers was 0.95, which is astatistically significant correlation.
CONCLUSIONS
A simple, low-cost and compact system hasbeen implemented for detecting the breathingusing a nasal thermistor. The sensor,mounted in a Wheatstone quarter-bridgetopology, was directly connected to a µC. Thetemperature fluctuations near the nostrils(due to breathing of the subjects) have beenclearly detected. The proposed system didnot require the use of any analog processingcircuits, nor ADC. The proposed circuit could
detect fractional changes in resistance ofx > 0.01, which resulted in a resolution of0.2 C, enough to follow the breathing-relatedtemperature fluctuations. This achievedwell-shaped breathing waveforms, with anegligible noise contribution, from which it iseasy to estimate the RR. The system was ableto detect the respiration breath-by-breath,just by measuring the discharging time in acapacitor. It was not necessary to supply anyvoltage or current to the thermistor, so theself-heating was avoided. The methodologyproposed in this research can be consideredin other medical applications, where thetemperature measurement (e.g., the bodytemperature) could be obtained by a resistivesensor. Bland-Altman and Scatter plots wereused to compare de RR time interval betweenthe signal detected with the thermistor andthat detected with the piezoelectric sensor.The calculated mean bias was less than 17ms, and the dispersion was lower than 303 ms,and correlation coefficient was 0.95, which isstatistically significant.
ACKNOWLEDGMENTS
This work has been funded by PRODEP(Programa para el Desarrollo ProfesionalDocente) and UACJ (Universidad Autónomade Ciudad Juárez) México, project UACJ-PTC-327.
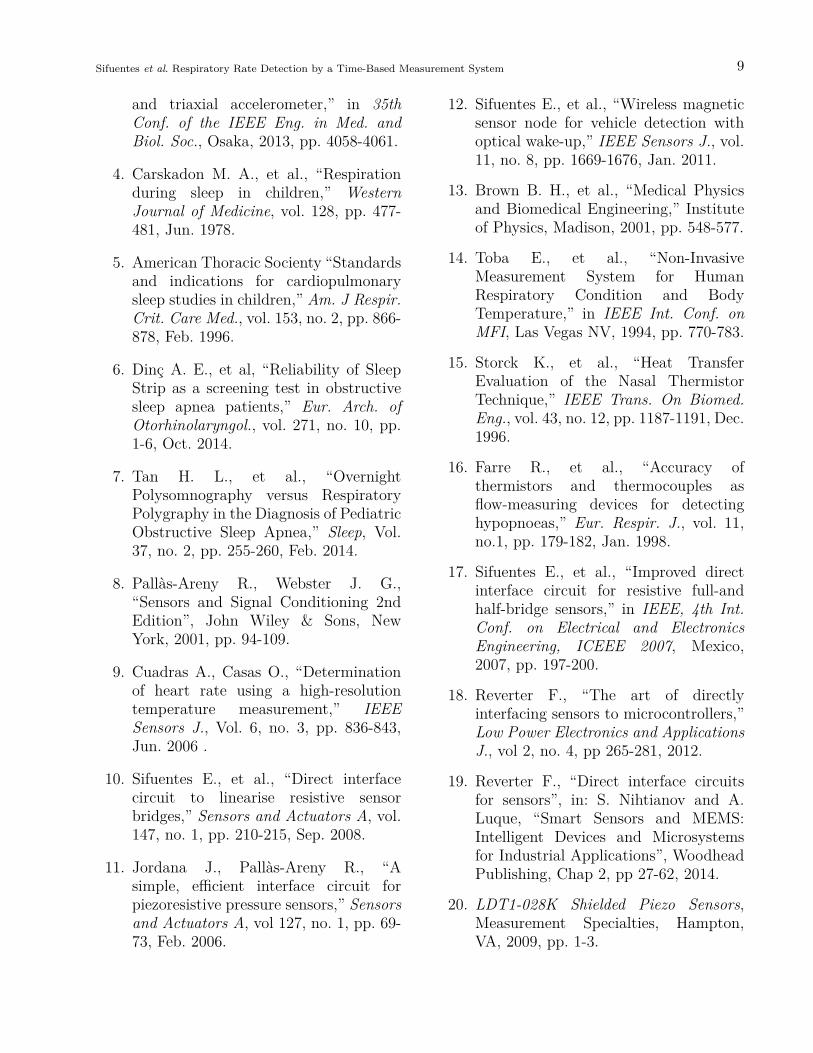
REFERENCES
1. Schäfer A., et al., “Estimation ofbreathing rate from respiratory sinusarrhythmia: comparison of variousmethods,” Ann. of Biomed. Eng., vol.36, no 3, pp. 476-485, Jan. 2008.
2. Karlen W., et al., “Multiparameterrespiratory rate estimation from thephotoplethysmogram,” IEEE Trans. onBiomed. Eng., vol. 60, no 7, pp. 1946-1953, Feb. 2013.
3. Chan A. M., et al., “Ambulatoryrespiratory rate detection using ECG
Sifuentes et al. Respiratory Rate Detection by a Time-Based Measurement System 9
and triaxial accelerometer,” in 35thConf. of the IEEE Eng. in Med. andBiol. Soc., Osaka, 2013, pp. 4058-4061.
4. Carskadon M. A., et al., “Respirationduring sleep in children,” WesternJournal of Medicine, vol. 128, pp. 477-481, Jun. 1978.
5. American Thoracic Socienty “Standardsand indications for cardiopulmonarysleep studies in children,” Am. J Respir.Crit. Care Med., vol. 153, no. 2, pp. 866-878, Feb. 1996.
6. Dinç A. E., et al, “Reliability of SleepStrip as a screening test in obstructivesleep apnea patients,” Eur. Arch. ofOtorhinolaryngol., vol. 271, no. 10, pp.1-6, Oct. 2014.
7. Tan H. L., et al., “OvernightPolysomnography versus RespiratoryPolygraphy in the Diagnosis of PediatricObstructive Sleep Apnea,” Sleep, Vol.37, no. 2, pp. 255-260, Feb. 2014.
8. Pallàs-Areny R., Webster J. G.,“Sensors and Signal Conditioning 2ndEdition”, John Wiley & Sons, NewYork, 2001, pp. 94-109.
9. Cuadras A., Casas O., “Determinationof heart rate using a high-resolutiontemperature measurement,” IEEESensors J., Vol. 6, no. 3, pp. 836-843,Jun. 2006 .
10. Sifuentes E., et al., “Direct interfacecircuit to linearise resistive sensorbridges,” Sensors and Actuators A, vol.147, no. 1, pp. 210-215, Sep. 2008.
11. Jordana J., Pallàs-Areny R., “Asimple, efficient interface circuit forpiezoresistive pressure sensors,” Sensorsand Actuators A, vol 127, no. 1, pp. 69-73, Feb. 2006.
12. Sifuentes E., et al., “Wireless magneticsensor node for vehicle detection withoptical wake-up,” IEEE Sensors J., vol.11, no. 8, pp. 1669-1676, Jan. 2011.
13. Brown B. H., et al., “Medical Physicsand Biomedical Engineering,” Instituteof Physics, Madison, 2001, pp. 548-577.
14. Toba E., et al., “Non-InvasiveMeasurement System for HumanRespiratory Condition and BodyTemperature,” in IEEE Int. Conf. onMFI, Las Vegas NV, 1994, pp. 770-783.
15. Storck K., et al., “Heat TransferEvaluation of the Nasal ThermistorTechnique,” IEEE Trans. On Biomed.Eng., vol. 43, no. 12, pp. 1187-1191, Dec.1996.
16. Farre R., et al., “Accuracy ofthermistors and thermocouples asflow-measuring devices for detectinghypopnoeas,” Eur. Respir. J., vol. 11,no.1, pp. 179-182, Jan. 1998.
17. Sifuentes E., et al., “Improved directinterface circuit for resistive full-andhalf-bridge sensors,” in IEEE, 4th Int.Conf. on Electrical and ElectronicsEngineering, ICEEE 2007, Mexico,2007, pp. 197-200.
18. Reverter F., “The art of directlyinterfacing sensors to microcontrollers,”Low Power Electronics and ApplicationsJ., vol 2, no. 4, pp 265-281, 2012.
19. Reverter F., “Direct interface circuitsfor sensors”, in: S. Nihtianov and A.Luque, “Smart Sensors and MEMS:Intelligent Devices and Microsystemsfor Industrial Applications”, WoodheadPublishing, Chap 2, pp 27-62, 2014.
20. LDT1-028K Shielded Piezo Sensors,Measurement Specialties, Hampton,VA, 2009, pp. 1-3.

10 Revista Mexicana de Ingeniería Biomédica · volumen 37 · número 2 · May-Ago, 2016
ib