Embed Size (px)
Citation preview
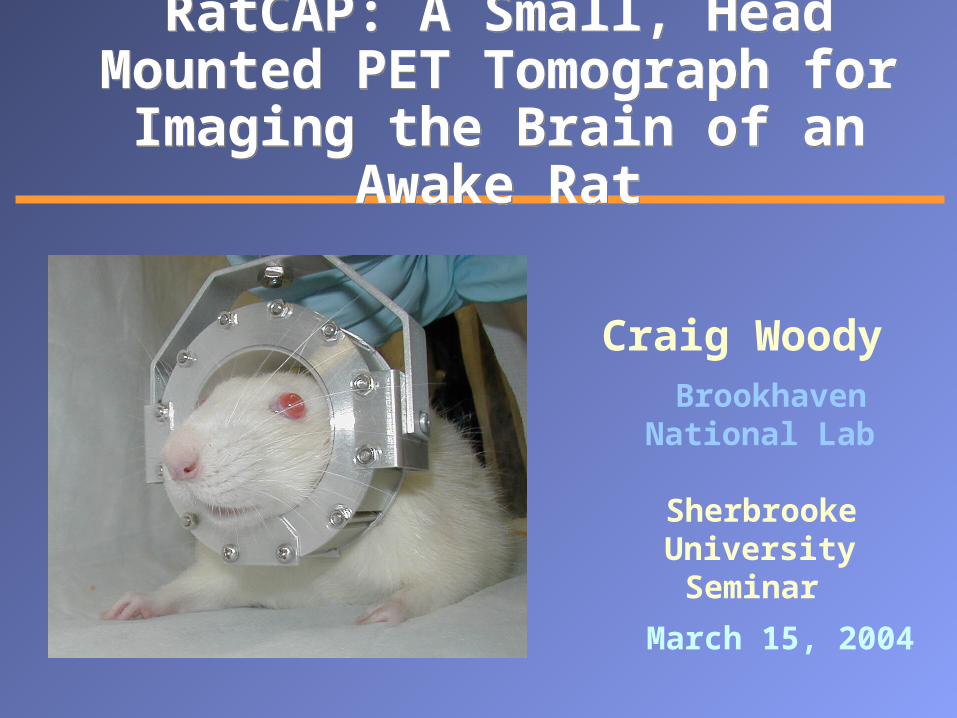
RatCAP: A Small, Head Mounted PET Tomograph for Imaging the
Brain of an Awake Rat
RatCAP: A Small, Head Mounted PET Tomograph for Imaging the
Brain of an Awake Rat
Craig Woody Brookhaven National Lab
Sherbrooke University Seminar
March 15, 2004

C.Woody, Sherbrooke University Seminar, 3/15/04 2
The Collaboration The Collaboration
Part of a larger project for Imaging The Awake Animalalso involving motion tracking in both PET and MRI
SUNY
BNL

C.Woody, Sherbrooke University Seminar, 3/15/04 3
The PeopleThe People
BNL Physics: C. Woody, S. Stoll, M. Purschke, W.Lenz, M. Lenz, S.Boose
Chemistry: D. Schlyer, A. Villanueva, J. Fowler
Medical: P. Vaska, N. Volkow* (now at NIH)
Instrumentation: P. O’Connor, V. Radeka, J.-F. Pratte*, S. Junnakar, G. DeGeronimo, B.Yu, A.Kandasamy, K.Wolniewicz , S. Rescia Stony Brook S. Shokouhi, A. Kriplani, S.Krishnamoorthy, S.Southekal (BME students) I. Rampil, C.Page, A.Bell (Dept. of Anesthesiology)
Sherbrooke* R.Lecomte, R.Fontaine, S. Robert

C.Woody, Sherbrooke University Seminar, 3/15/04 4
The Problem The Problem
• Anesthesia can greatly depress brain functions and affect the neurochemistry that one is trying to study• Cannot study animal behavior while under anesthesia
One wants to use PET to study the neurophysiological activity and behavior in laboratory animals in order to understand and treat these effects in humans.However, animals currently need to be anesthetized during PET imaging.

C.Woody, Sherbrooke University Seminar, 3/15/04 5
Neurotransmitter Activity in the Brain Neurotransmitter Activity in the Brain
Drugs like cocaine can block the re-uptake sites for neurotransmitters like dopamine which upsets the normal equilibrium and can cause effects of addiction
DA
DA
DA
DA DA
MAO A
DA
DA
signal
DA
DA
DA
DADADA DA
DA
DA DA
DA
DA
DA
11C-Cocaine

C.Woody, Sherbrooke University Seminar, 3/15/04 6
Effects of AnesthesiaEffects of Anesthesia
The effect of anesthesia on the uptake of β-CFT on dopamine transporters in the monkey brain.
H.Hideo et.al., Synapse 42 (2001) 273-280
Reduction in glucose metabolism with isoflurane in humans
Similar effects are seen in the rat
D.B. Stout et al, UCLA 1998

C.Woody, Sherbrooke University Seminar, 3/15/04 7
RatCAP: Rat Concious Animal PETRatCAP: Rat Concious Animal PET
Mockup of the portable ring on the head of a rat
A septa-less, full-ring tomograph with a diameter of 4 cm and an axial extent of 2 cm, suspended by a tether, which will allow nearly free movement of the awake animal
Harderian gland (at eye position)
microPET images
RatCAP mounting position superimposed on Concorde R4 MicroPET image of a rat brain

C.Woody, Sherbrooke University Seminar, 3/15/04 8
Design RequirementsDesign Requirements
• The tomograph ring must be light enough to be supported by the rat and allow reasonable freedom of movement
• Light weight detectors (~ 150 g total weight)• Light weight electronics with low power dissipation New custom ASIC • High data rates and large singles background• Small field of view and large parallax effects• Limited sampling due to space and weight requirements• Must be rugged enough withstand activity of the rat

C.Woody, Sherbrooke University Seminar, 3/15/04 9
Freedom of MovementFreedom of Movement
Similar support structures are used in microdialysis experiments
“Ratturn Bowl”Tether support system allows reasonable freedom of movement

C.Woody, Sherbrooke University Seminar, 3/15/04 10
RatCAP Support SystemRatCAP Support System
Gimbal ring allows head movement
Weight is completely
counterbalanced(animal only feels inertia)

C.Woody, Sherbrooke University Seminar, 3/15/04 11
Tomograph RingTomograph Ring
Ring containing 12 block detectors of 2x2 mm2 x 5 mm deep LSO crystals with APDs and integrated readout electronics
Readout chip
APD
LSO
Socket LSO APD

C.Woody, Sherbrooke University Seminar, 3/15/04 12
SensitivitySensitivity
Comparison of sensitivity with other small animal PET scanners
BNL RatCAP4 cm Ø x 2 cm~ 150 cps/Ci
(0.41%)
Concord mPET R4 15 cm Ø x 8 cm
(1.86%)
UCLA mPET 17 cm Ø x 2 cm
• Intrinsic detector sensitivities are essentially the same• Coincidence sensitivities are proportional to axial acceptance

C.Woody, Sherbrooke University Seminar, 3/15/04 13
Parallax EffectsParallax Effects
Due to the small diameter of the ring, the parallax error is a major factor in determining the spatial resolution
2 cm

C.Woody, Sherbrooke University Seminar, 3/15/04 14
Spatial Resolution and Field of ViewSpatial Resolution and Field of View
Resolution at theedge of the rat brain
Single layer - 10 mm ~ 2.5 mmDouble layer - 5 mm ~ 2.0 mm
First prototype will be a single layer of 5 mm crystalsWill sacrifice sensitivity for improved spatial resolution
SimSet Simulation

C.Woody, Sherbrooke University Seminar, 3/15/04 15
LSO Crystal ArraysLSO Crystal Arrays
Studying different types of crystal arrays to optimize light output and
energy resolution
CTI white powder reflector
Proteus unbonded 3M reflector
Proteus single crystals

C.Woody, Sherbrooke University Seminar, 3/15/04 16
Optimization of Light CollectionOptimization of Light Collection
crystal length (mm)
0 5 10 15 20 25
pe/M
eV
500
1000
1500
2000
2500
3000
unwrapped air
unwrapped cookie
wrapped cookie
wrapped air
Dashed = Measured Solid = Opticad
OPTICAD
Ray Tracing Program
2x2 mm2 single crystals wrapped in 3M reflector and coupled with a silicone
cookie to a calibrated PMT
Npe/MeV = N/MeV x x QE
2400 = 25,000 x 0.4 x 0.24
10 mm crystal (wrapped with cookie)
0.2
0.25
0.3
0.35
0.4
0.45
0.5
0.55
0.6
0 1 2 3 4 5 6 7 8 9 10
Distance along crystal
Ligh
t Col
lect
ion
Effic
ienc
y

C.Woody, Sherbrooke University Seminar, 3/15/04 17
Comparison of Light Output and Energy Resolution of Different CrystalsComparison of Light Output and Energy Resolution of Different Crystals
Prototype LSO arrays measured with Hamamatsu 4x8 APD
Conclusion: Crystals wrapped with 3M reflector and air gap give the highest light output and best energy resolution
manufacturer length note <pe/MeV> <resolution> CTI 8mm slotted block 2918 0.25
Proteus 5mm glued 1513 0.2010mm glued 2356 0.19
Proteus 5mm no glue 3113 0.1910mm no glue 2455 0.17
Proteus 5mm end glued - no mask 4491 0.165mm end glued - mask 2962 0.17
With Silicone cookie

C.Woody, Sherbrooke University Seminar, 3/15/04 18
Light Output and Uniformity of Crystal ArraysLight Output and Uniformity of Crystal Arrays
Proteus cutting, polishing and assembly process
• Average light yield ~ 5300 p.e./MeV (~ 18% higher than prototype)• Spread of average from array to array ~ 5 %• Average spread within an array ~ 18%• Total spread within an array up to ± 50 %

C.Woody, Sherbrooke University Seminar, 3/15/04 19
Avalanche PhotodiodesAvalanche Photodiodes
4x8 array 1.6 x 1.6 mm2
active pixel area
Hamamatsu S8550Npe ~ 2700
Typical G ~ 50 ~ 135K signal e’s
Common voltage for each 16 channels
Dark current < 40 nA(~ 1.2 nA/ch)
Expected noise in final ASIC ~ 1100 e’s
(CT~ 10 pF)
APDs (101-115)Average gains (32 ch each)
0 100 200 300 400
Ga
in
1
10
100
Reverse bias (volts)
Measured APD dark currents (each curve represents the summed dark current for all 32 channels)
Reverse bias (volts)
320 330 340 350 360 370 380 390 400 410 420
Dar
k cu
rren
t (n
A)
10
100
1000
apd 101 apd 102 apd 103 apd 104 apd 105 apd 106 apd 107 apd 109 apd 110 apd 111 apd 112 apd 113 apd 114 apd 115
G ~ 50

C.Woody, Sherbrooke University Seminar, 3/15/04 20
APD Gain and Quantum Efficiency VariationAPD Gain and Quantum Efficiency Variation
Measured with N2 laser + optical fiber
1.01 1.08 1.14 1.18
1.00 1.00 1.14 1.12
1.00 1.02 1.07 1.04
0.97 0.96 1.02 0.99
0.92 0.94 1.01 0.99
0.94 0.96 1.00 0.98
0.95 1.00 0.94 0.95
0.92 0.93 0.90 0.93
Gain + Quantum Efficiency variationTotal spread ~ ± 20 %
Channel to channel differences dominated by
quantum efficiency variation
ADC channels
5000 6000 7000 8000 9000 10000 11000 12000
Co
un
ts0
2
4
6
8
10
12
14
Sigma/mean = 6.4%Average gain = 50

C.Woody, Sherbrooke University Seminar, 3/15/04 21
Electronics & Readout SystemElectronics & Readout System
Tomograph ring with detectors and front end readout electronics are mounted to the head of
the rat
Tether carries signals, high and low voltage power to a Control Module
Data collection module
Control Module
CM communicates with a VME based Data Collection Module that adds
time stamp information and reads out the data

C.Woody, Sherbrooke University Seminar, 3/15/04 22
Electronics & Readout SystemElectronics & Readout System
No analog information Pixel address is encoded
and data is transmitted by individual serial line for each block to the Data Collection Module
Single ZCD per channel generates time information
DCM adds time stamp to each event and does
coincidence timing or list mode processing of singles data
• Singles rates up to 100 kHz/block• 1 byte/block 1.2 MB/sec off ring• DCM produces 64 bits (43 bit time stamp) ~ 10 MB/sec to PC
Block 1
Block 2
Block …
Block 12
DCMCM
PC
VME
Time Stamp
500 MHz
HVLV
DAC
Serial data 100 MHz
x12
8 bits

C.Woody, Sherbrooke University Seminar, 3/15/04 23
Custom Front End Readout ChipCustom Front End Readout Chip
Custom ASIC in 0.18 μm CMOS 4 mW per channel
32 channels 125 mW per chip~ 1.5 W total on ring
Final size: 4.2 x 1.7 mm
Prototype 2
J.-F. Pratte

C.Woody, Sherbrooke University Seminar, 3/15/04 24
Custom Front End Readout ChipCustom Front End Readout Chip
A 0 A 1 A 2 A 3 A 4
A 0 A 1 A 2 A 3 A 4
C L O C K
C F D
T IMINGE D G E
C HA NA D D R E S S
E D G E +A D D R E S S
T se rial
T c lk
• Discriminator pulse is encoded to give 5 bit address • Leading edge of encoded serial pulse train gives time information• 100 MHz clock• Maximum 100 KHz/block 0.7% deadtime
CSP gain 3.3 mV/fC
Overall gain 15 mV/fC
Digital Output (P.O’Connor)
Preamp/Shaper/ZCD

C.Woody, Sherbrooke University Seminar, 3/15/04 25
ASIC PerformanceASIC Performance
0
0.1
0.2
0.3
0.4
0.5
0.6
0 50000 100000 150000 200000 250000 300000
Input charge (electron)
Ou
tpu
t si
gn
al (
V)
Slope = 15.2 mV/fCENC = 902 29 e’s rms
Linearity Energy Resolution
Peaking Time Measurements
CinMeasurement Simulation
0 pF 73.2 ± 1.4 ns 74.0 ns
12 pF 80.4 ± 1.8 ns 80.0 ns
FWHM = 18%

C.Woody, Sherbrooke University Seminar, 3/15/04 26
ASIC PerformanceASIC Performance
Noise
ENCmin= 1117 @ 100 nsCintot = 20 pF
Timing (ZCD)
Noise is dominated by photostatistics contributionExpect ~ 2.4 ns rms total
ENC
elec
tr ons
( RM
S)
C.Woody, Sherbrooke University Seminar, 3/15/04 27
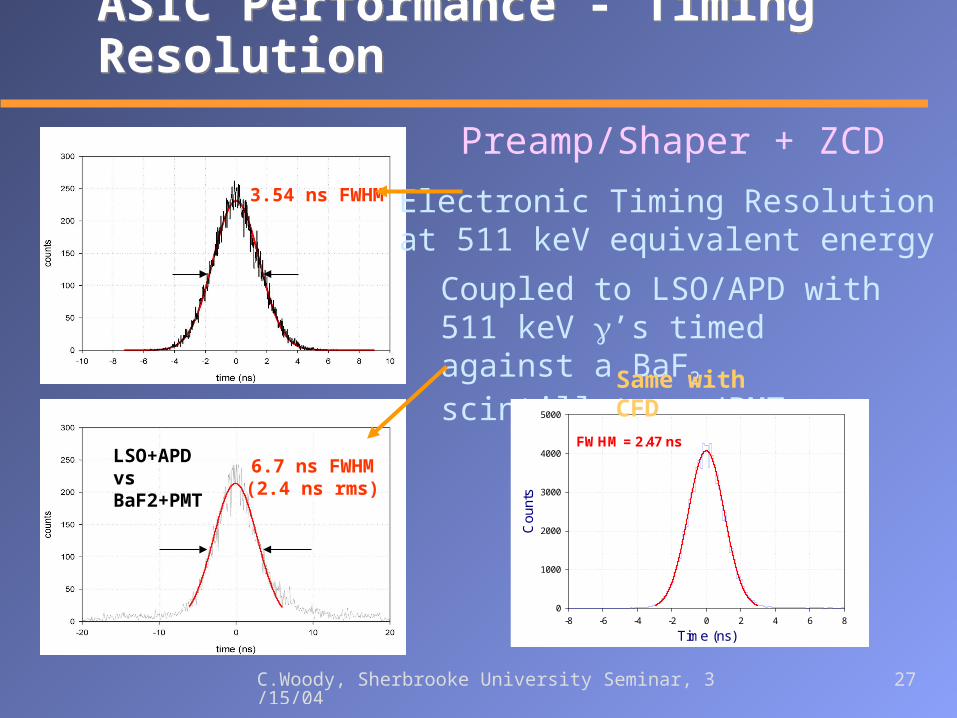
ASIC Performance - Timing ResolutionASIC Performance - Timing Resolution
3.54 ns FWHM
6.7 ns FWHM(2.4 ns rms)
LSO+APD vs BaF2+PMT
Electronic Timing Resolutionat 511 keV equivalent energy
Coupled to LSO/APD with 511 keV ’s timed against a BaF2 scintillator w/PMT
Time (ns)-8 -6 -4 -2 0 2 4 6 8
Cou
nts
0
1000
2000
3000
4000
5000
FWHM = 2.47 ns
Same with CFD
Preamp/Shaper + ZCD

C.Woody, Sherbrooke University Seminar, 3/15/04 28
Rotatable Stage for Obtaining Partial Tomographic DataRotatable Stage for Obtaining Partial Tomographic Data
Source phantoms mounted on rotatable stage to simulate full
tomographic ring

C.Woody, Sherbrooke University Seminar, 3/15/04 29
Point Source ResolutionPoint Source Resolution
1 mm dia 68Ge point sourceat R=1.6 mm in rotation stage
profile axis (mm)2 4 60
im ag e int
en sit
y (ar
b)
0
2
4FWHM = 2.1 mm
Intrinsic spatial resolution measured with 22Na point source (< 1 mm dia)
Average peak FWHM = 1.28 mmConcorde P4 MicroPET = 1.75 mm
UCLA MicroPET = 1.58 mm

C.Woody, Sherbrooke University Seminar, 3/15/04 30
Source ImagesSource Images
Single 1 mm dia. 68Ge point source 1.6 mm off axis
2 mm
Multiple 68Ge point sources (~ 2mm) spaced ~ 4 mm
4 mm
4 mm

C.Woody, Sherbrooke University Seminar, 3/15/04 31
Modeled Reconstructed ImagesModeled Reconstructed Images
Monte Carlo simulations using SimSet Reconstruction using Filtered Back Projection
Fully sampled image of four
phantom sources
Image reconstructed
using incomplete data set with interpolation
Image reconstructed
using incomplete data set
Test Phantom
S.Shokouhi
C.Woody, Sherbrooke University Seminar, 3/15/04 32
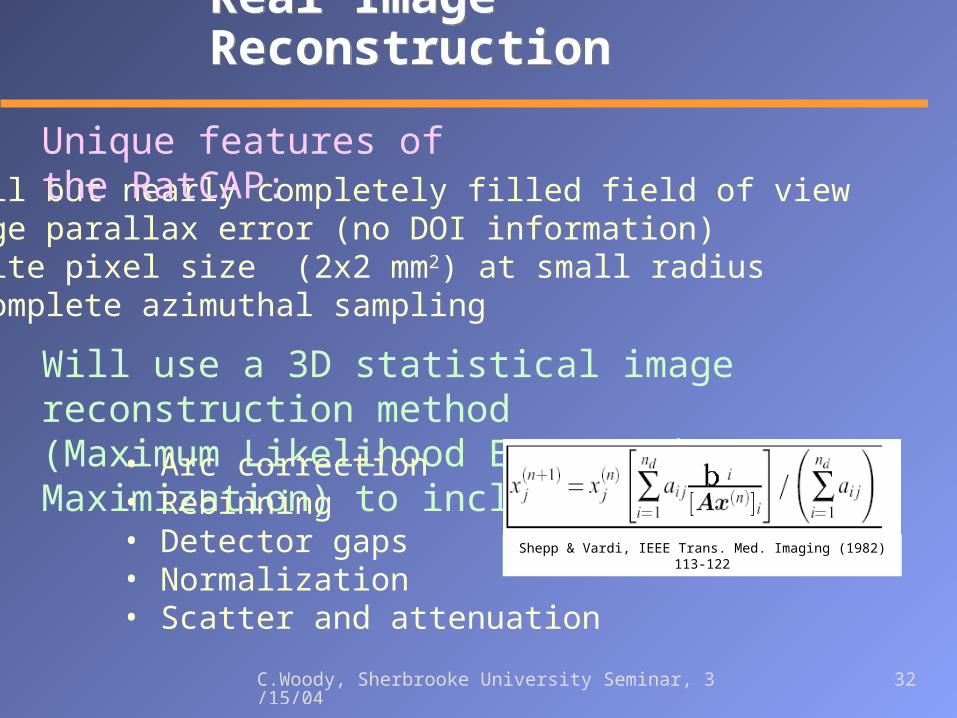
Real Image Reconstruction Real Image Reconstruction
• Small but nearly completely filled field of view • Large parallax error (no DOI information)• Finite pixel size (2x2 mm2) at small radius• Incomplete azimuthal sampling
Will use a 3D statistical image reconstruction method (Maximum Likelihood Expectation Maximization) to include effects of:
Unique features of the RatCAP:
• Arc correction• Rebinning• Detector gaps• Normalization• Scatter and attenuation
Shepp & Vardi, IEEE Trans. Med. Imaging (1982) 113-122

C.Woody, Sherbrooke University Seminar, 3/15/04 33
Preliminary Studies using MLEM MethodPreliminary Studies using MLEM Method
• 221 voxels (1 mm3) over 17 mm dia image field• 552 sinograms (23 x 24 R)• 121,992 system matrix• 107 photons generated per voxel
Discrete approximations to the RatCAP used with SimSET
Spatial resolution already improved over FBP
1.05
1.1
0 0.2 0.4 0.6
point source distance from the center [cm]
rad
ial
reso
luti
on
[m
m]
Since RatCAP is small, can ultimately handle full system matrix
1.09 mm

C.Woody, Sherbrooke University Seminar, 3/15/04 34
Other ApplicationsOther Applications
• A wide range of quantitative PET studies using tracer kinetic modeling demand accurately measured radiotracer concentration in arterial blood as a function of time after injection (Arterial Input Function).
• The common method of measuring the input function is the invasive withdrawal of blood from a wrist artery. However, because of its health risks for both patients and hospital personnel, it is not compatible with clinical studies.
• A small ring tomograph similar to the RatCAP can be used to image the artery and measure the input function
Non-Invasive Wrist MonitorNon-Invasive Wrist Monitor

C.Woody, Sherbrooke University Seminar, 3/15/04 35
Wrist Monitor for Measuring the Arterial Input Function Wrist Monitor for Measuring the Arterial Input Function
For human studies, the input function is taken from the radial artery in the wrist.
Activity in the surrounding veins produce a significant background which can be rejected using the good spatial resolution of the wrist monitor.
Planar image of a 1 mm diameter 68Ge line source
A.VillaneuvaWrist Phantom

C.Woody, Sherbrooke University Seminar, 3/15/04 36
Simulated Input Function Measurement Simulated Input Function Measurement
Measure activity as an aqueous solution of a 11C - labeled radioisotope passes between two block detectors
0
10
20
30
40
50
60
70
80
0 100 200 300 400 500 600 700 800
Scatter Evaluation
Time (seconds)
w/scatter w/o scatter
0
1
2
3
4
5
6
7
8
0 0.5 1 1.5 2 2.5
Measured Input Function
Time (minutes)
Expected input function resolution using Wrist Monitor

C.Woody, Sherbrooke University Seminar, 3/15/04 37
SummarySummary
The ability to carry out PET imaging studies in live, awake animals would provide valuable new information on the neurophysiological behavior in both animals and humans
The RatCAP will provide a new tool for carrying out these studies in laboratory rats.
Preliminary studies have shown that the design parameters of the RatCAP have been met and we are proceeding to complete the design and construct the actual detector.
A small imaging tomograph such as this may have other useful applications in nuclear medicine