Embed Size (px)
Citation preview

Rapid Quantification of Soilborne Pathogen Communities in Wheat-BasedLong-Term Field Experiments
Richard W. Smiley, Emeritus Plant Pathologist, Stephen Machado, Agronomist, and Karl E. L. Rhinhart, Farm Manager, Oregon StateUniversity, Columbia Basin Agricultural Research Center, Pendleton 97801; and Catherine L. Reardon, Soil Microbiologist, and StewartB. Wuest, Soil Scientist, United States Department of Agriculture–Agricultural Research Service, Columbia Plateau Conservation ResearchCenter, Pendleton, OR 97801
Abstract
Smiley, R. W., Machado, S., Rhinhart, K. E. L., Reardon, C. L., and Wuest, S. B. 2016. Rapid quantification of soilborne pathogen communities inwheat-based long-term field experiments. Plant Dis. 100:1692-1708.
Rainfed experiments operated continuously for up to 84 years in semiarideastern Oregon are among the oldest agronomic trials in North America.Disease incidence and severity had been quantified visually but quantifi-cation of inoculum density had not been attempted. Natural inoculum of17 fungal and nematode pathogens were quantified for each of 2 years oneight trials using DNA extracts from soil. Crop type, tillage, rotation, soilfertility, year, and their interactions had large effects on the pathogens.Fusarium culmorum and Pratylenchus thornei were more dominant thanF. pseudograminearum and P. neglectuswhere spring crops were grown,and the opposite species dominances occurred where winter wheat wasthe only crop. Bipolaris sorokiniana and Phoma pinodella were re-stricted to the presence of spring cereals and pulse crops, respectively.
Helgardia spp. occurred in winter wheat-fallow rotations but not in an-nual winter wheat. Gaeumannomyces graminis var. tritici was moreprevalent in cultivated than noncultivated soils and the opposite generallyoccurred for Rhizoctonia solani AG-8. Densities of Pythium spp. clade Fwere high but were also influenced by treatments. Significant treatment ef-fects and interactions were more prevalent in two long-standing (>50-year)annually cropped experiments (29%) than two long-standing 2-year wheat-fallow rotations (14%). Associations among pathogens occurred mostly inan 84-year-old annual cereals experiment. This survey provided guidancefor research on dynamics of root-infecting pathogens of rainfed field cropsand identified two pathogens (Drechslera tritici-repentis and P. pinodella)not previously identified at the location.
Most information on the effects of crop and soil management prac-tices on diseases of wheat (Triticum aestivum L.) and other rainfedfield crops have been developed from short-term (<5 years) experi-ments. Few studies have defined comparative effects of managementtreatments in long-term (>30 years) experiments, where multiplepathogens are thought to have attained equilibrium within a specificlocality and cropping system. Long-term experiments provide valu-able insights into agronomic practices for sustainable crop production(Mitchell et al. 1991), and sometimes reveal apparent reversals of diseaserelationships reported for shorter-term experiments (Yarham 1981).Three long-term experiments near Pendleton, OR have been operated
continuously for 84 years and are among the oldest active long-termagronomic studies in North America (Mitchell et al. 1991; Rasmussenand Smiley 1994). These nonirrigated experiments in a semiarid region(<400 mm precipitation annually) have provided unique insights intoagricultural sustainability, soil health, and the productivity and econom-ics of crop production (Collins et al. 1992; Duff et al. 1995; Machado2011; Machado et al. 2007, 2008; Pikul and Allmaras 1986; Rasmussenand Smiley 1996). Findings have included relationships betweendiseases caused by soilborne plant-pathogenic fungi and effects oflong-term management variables on soil chemical, physical, and micro-biological parameters. For example, Rhizoctonia root rot was inverselycorrelated with soil microbial biomass, Fusarium crown rot was in-versely correlated with soil pH and directly correlated with organiccarbon (C) and organic nitrogen (N), and disease-decline phenomenawere detected for Rhizoctonia root rot and take-all (Lucas et al. 1993;Smiley et al. 1996a).A survey of diseases in long-term experiments at Pendleton (Smiley
et al. 1996a) was based upon assessments of disease symptoms and
pathogen signs before quantitative polymerase chain reaction (qPCR)procedures became available and before it became known that root-lesion nematodes (Pratylenchus spp.) are important components of ce-real root diseases in semiarid regions of the Pacific Northwest (PNW)(Smiley 2009a; Smiley et al. 2004, 2005a,b). A high-throughput methodto quantify DNA simultaneously for most of the soilborne pathogensimportant to small grain production in the PNWwas developed in Aus-tralia. The assay produces quantitative data that closely approximatethe densities of living pathogens in soil (McKay et al. 2008; Ophel-Keller et al. 2008). When used in combination with environmental fac-tors, the DNA assay has been successfully applied to the prediction ofdisease severity for take-all (Bithell et al. 2012) and Rhizoctonia rootrot (Poole et al. 2015). The assay is named PreDicta B and is availablethrough the Root Disease Testing Service of the South Australia Re-search and Development Institute (http://pir.sa.gov.au/research/services/molecular_diagnostics/predicta_b). This service is being used as acommercial service and for research on soilborne pathogens (Bithellet al. 2012; Evans and McKay 2012; Paulitz et al. 2010; Smiley et al.2013a,b). The assay included 10 pathogens commonly isolated fromsmall grain fields in the PNW: Bipolaris sorokiniana (Sacc.) Shoemaker(common root rot), Fusarium culmorum (Wm. G. Sm.) Sacc. (crownrot), F. pseudograminearum O’Donnell & T. Aoki (crown rot), Gaeu-mannomyces graminis var. tritici J. Walker (take-all), Helgardia herpo-trichoides (Fron) Crous & W. Gams plus H. acuformis (Nirenberg)Crous & W. Gams (eyespot), Heterodera avenae Wollenweber (cerealcyst nematode),Pratylenchus neglectus (Rensch) Filipjev&SchuurmansSteckhoven and P. thornei Sher & Allen (root-lesion nematodes),Pythium Pringsh. spp. (Pythium damping-off and root rot), and Rhizoc-tonia solani J. G. Kuhn AG-8 (Rhizoctonia root rot). Also included inthe assay were pathogens not known to occur in the long-term experi-ments at Pendleton, including Botryosphaeria Ces. & De Not. species(black rot, frogeye leaf spot, canker, or dead arm of woody plants;and ear rot of wheat and corn), Ditylenchus dipsaci (Kuhn) Filipjev(stem nematode), Drechslera tritici-repentis (Died.) Shoemaker (tanspot or yellow leaf spot), G. graminis var. avenae (E. M. Turner)Dennis (take-all of oats and grasses), Phoma koolunga J. A. Davidson,D. Hartley, Priest, S. Kaczm., Herdina, A.McKay&E. S. Scott (leaf and
Corresponding author: R. Smiley; E-mail: [email protected]
Accepted for publication 23 March 2016.
http://dx.doi.org/10.1094/PDIS-09-15-1020-RE© 2016 The American Phytopathological Society
1692 Plant Disease /Vol. 100 No. 8

stem chlorotic and necrotic spots of pea and clover), P. pinodella (L. K.Jones)Morgan-Jones&K.B. Burch (leaf spots, stem lesions and foot rotof pea and clover), Phytophthora medicaginis E. M. Hansen & D. P.Maxwell (root rot of alfalfa and chickpea), and Pratylenchus teresKhan& Singh (root-lesion nematode).Smiley et al. (2013a,b) utilized the PreDicta B service to examine
effects of diversified crop rotations on inoculum density (picogramsof DNA per gram of soil) of 14 species or groups of pathogens at alow-rainfall (280 mm annually) site at Moro, OR. The assaysrevealed that winter wheat had selected for a greater density of theroot-lesion nematode P. neglectus and spring wheat had selectedfor a greater density of P. thornei (Smiley et al. 2013a). A shift froma dominance of P. neglectus to P. thornei was then subsequently de-tected when the cropping system in a commercial field near Pendletonwas changed from winter wheat to spring wheat (Smiley et al.2014a). Likewise, in the crop experiment at Moro, it was noted thatwinter wheat selected for F. pseudograminearum and treatments thatincluded spring barley (Hordeum vulgare L.) contained nearly equalinoculum densities of F. culmorum and F. pseudograminearum. In-oculum densities also differed significantly among cropping systemsfor G. graminis var. tritici and Pythium spp. but not for R. solaniAG-8 (Smiley et al. 2013b). Finally, the qPCR assay also revealeda previously unknown presence of Phoma pinodella but only on atreatment where winter pea (Pisum sativum L.) was rotated with win-ter wheat.The primary objective of this 2-year survey was to assess inoculum
densities of pathogens in five long-term experiments to provide focusfor future research on disease complexes and pathogen dynamics inwheat-based cropping systems. Our hypothesis was that croppingsystems would have differential influences on inoculum densitiesof individual pathogens and, thereby, are likely to alter the balancesamong pathogens that are potential components of disease com-plexes. Three additional shorter-term (10 to 13 years) experimentswere included to expand the value of this research.
Materials and MethodsThe long-term experimental plots are at an agricultural research
center located 13 km northeast of Pendleton, in Umatilla County,OR (45°43.158¢ N, 119°37.656¢ W). The center is composed ofcollaborating units of Oregon State University’s Columbia Basin
Agricultural Research Center and the United States Department ofAgriculture–Agricultural Research Service’s Columbia Plateau Conser-vation Research Center.The climate is temperate, with warm, dry summers (21°C) and
cool, wet winters (1°C). About 75% of the 397 mm of mean annualprecipitation (averaged over 84 years) occurs from November toMay. Evaporation exceeds precipitation from March through Octo-ber. Agriculture at the research center lies within an area of transitionbetween land managed as a 2-year rotation of winter wheat (10-month growing season) and fallow (14 months), and land plantedannually as a 2-year rotation of winter wheat and a pulse cropsuch as spring pea, lentil (Lens culinarisMedik.), or chickpea (Cicerarietinum L.). The soil is a deep (>90 cm), well-drained Walla Wallasilt loam; a coarse-silty, mixed, superactive, mesic Typic Haploxeroll.The topography is nearly level and the upper 10 cm of soil on this70-ha research center has a range of chemical, physical, and biolog-ical characteristics which vary depending upon historical treatments.Examples include: soil pH = 4.4 to 6.4 (in 0.01 M CaCl2), soil or-ganic matter = 1.8 to 2.7%, organic, N at 0.7 to 1.4 g/kg, organicC at 10 to 18 g/kg, bulk density = 1.1 to 1.3 Mg/m3, and microbialbiomass = C at 255 to 1,158 mg/kg (Collins et al. 1992; Machado2011; Pikul and Allmaras, 1986; Rasmussen and Collins, 1991;Rasmussen and Rohde 1988, 1989; Rasmussen and Smiley 1994,1996). One experiment contained a location factor in which identicaltillage treatments were located at the research center and at a farm(the Reese site) 32 km west of the research center (45°43.432¢ N,119°2.911¢ W). The soil at the Reese site is a deep (>100 cm),well-drained Ritzville silt loam (a coarse-silty, mixed, superactive,mesic Calcidic Haploxeroll) and the mean annual precipitation is290 mm.Experiments. Key features of eight experiments sampled during
this research are shown in Table 1. Soil samples were collected from109 individual plots or small fields on 13 to 14 March 2013. Thesame plots plus six others were resampled on 9 to 10 March 2015.Each sample consisted of a composite of 20 soil cores (2.5 cm in di-ameter by 20 cm deep) from plots of the sizes shown in Table 1.Cores were centered on rows of young winter wheat seedlings oron rows of wheat stubble from a previous wheat crop, in accordancewith procedures recommended for analysis of pathogen DNA (Evansand McKay 2012; McKay et al. 2008). Unless stated otherwise, all
Table 1. Primary features of eight long-term experiments at the research center near Pendleton, OR
Plots sampled
Experiment number, name Dater Age (years) Systs Cropt Expu Treatmentsv Repsw Nx Size (ha) Cores/ha
1. Fertility management 1931 84 CT WW/CuF SSP 2P,6F,2Y 2 24 0.5 402. Tillage-fertility 1940 75 CT WW/CuF SSP 3T,3F,2Y 3 27 0.2 1003. Wheat-pea rotation 1963 52 CT WW/SP SSP 2C,2T,2Y 3 12 0.3 674. Annual cerealsy 1932 84 CT AW, AS, or AB SSP 2T,3C,2Y 2 12 1.0 20
1997 18 NT AW, AS, or AB SSP 2T,3C,2Y 2 12 1.0 205. Pasture versus wheatz 1931 84 NT PG, or AW RCB 2C,2Y 2 4 0.5 406. Three-year rotations 2004 11 CT+NT WW/SW/ChF SSP 2T,3P,2Y 2 12 1.4–1.7 12–147. Organic wheat 2005 10 CT WC/CuF, WM/CuF SP 2S,2C 2 8 0.02 1,0008. Winter wheat tillage 2002 13 CT+NT WW/CuF, WW/ChF RCB 2 L,2T,2Y 4 16 0.2–0.4 50–100
r Date of inception.s Tillage systems were cultivated (CT), not cultivated (no-till; NT), or comparisons of both tillage systems (CT+NT).t Crops andmanagement. Rotation included crops of winter wheat (WW), springwheat (SW), spring barley (SB), spring pea (SP), spring wheat plus clover (WC),or spring wheat plus medic (WM). Crops grown without rotation included annual winter wheat (AW), annual spring wheat (AS), annual spring barley (AB), orperennial grasses (PG). Some rotations also included cultivated fallow (CuF) or chemical fallow (no-till; ChF).
u Experimental designs used for analysis included randomized complete blocks (RCB), split plot (SP), or split-split plot (SSP).v Experimental treatments, described in the Methods section, are abbreviated as the number of treatments for crop (C), fertility (F), physical location (L), rotationphase (P), cropping system (S), tillage (T), or year (Y). Treatments are listed in the order in which they were applied for analysis; for example, 2P,6F,2Y in-dicates that rotation phase was the whole plot, fertility treatment was the subplot, and year was the sub-subplot.
w Number of replicates sampled in each experiment.x Number of plots per year.y Annual cereals were grown in a cultivated block since 1931, with winter wheat grown until the main block was divided into three subblocks during 1982 andthen planted to either toWW, SW, or SB on the same subblock every year thereafter. An adjacent main block with the same three crops being produced annuallyon subblocks without cultivation was initiated in 1997.
z Perennial pasture and annual winter wheat blocks were first planted during 1931. The winter wheat block was cultivated between crops until 1998 and was notcultivated thereafter.
Plant Disease /August 2016 1693
plantings were of ‘ORCF 102’ winter wheat, ‘Louise’ spring wheat,‘Champion’ spring barley, or ‘Banner’ spring pea. Primary featuresof each experiment are shown in Table 1. Additional details are asfollows.Experiment 1: Fertility management. The experimental design
was a split plot in a randomized complete block arrangement. A2-year winter wheat-fallow rotation experiment contained duplicate,offset rotation phases (main plots), which allowed a crop to be har-vested each year since 1931. Eachmain plot consisted of nine fertilitytreatments (subplots) replicated two times. Repeated sampling during2 years was treated as the sub-subplot level for analysis.Historically, this experiment has been known as the ‘residue man-
agement trial.’ Six of the nine treatments were sampled for this re-search: (i) no added fertilizer since 1931 (0 N), (ii) application ofN at 45 kg/ha before each wheat crop (45 N, ammonium nitratebroadcast from 1967 to 1988, and urea-ammonium nitrate banded15 cm deep with 25-cm shank spacing from 1989 to present), (iii) ap-plication of N at 90 kg/ha (90 N) before each wheat crop, (iv) treat-ment iii repeated, except that the wheat stubble was burned in thespring (90 N + burn), (v) application of cow manure (22.4 Mg/ha bi-ennially, averaging N at 111 kg/ha to each crop) several days prior toplowing the wheat stubble (manure), and (vi) pea vines (2.24 Mg/habiennially, averaging N at 34 kg/ha to each crop) applied several daysprior to plowing wheat stubble (pea).All treatments were moldboard plowed in the spring after the res-
idue amendments had been added or the stubble had been burned.Repeated shallow secondary tillage with a rod-weeder was used toconserve moisture and control weeds during fallow. Soil was col-lected from both replicates of each rotation phase. Half of the sampleswere taken from soil under stubble remaining from the wheat harvestthe previous year, and the other half were from soil where wheatplants had been planted into cultivated fallow 6months earlier. Whensampled during April, the winter wheat was still small due to a near-dormant state from November through February.Experiment 2: Tillage-fertility. The experimental design was a split
plot in three randomized complete blocks. A 2-year winter wheat-fallowexperiment contained three tillage treatments (main plots) and six N ap-plication rate treatments (subplots). Repeated samplings over 2 yearswere analyzed as the sub-subplot level.Historically, this experiment has been known as the ‘Ballenger trial.’
A crop was harvested during alternate years since 1940 and young win-ter wheat plants were growing each year when samples were collectedfor this survey. Tillage treatments included moldboard plow (95% ofcrop residue buried), offset disk (60% of residue buried), and 30-cm sub-surface sweeps (35% of residue buried). Three N treatments were sam-pled for this research: applications of N at 45, 90, or 135 kg/ha usingurea-ammonium nitrate banded at a 15-cm depth since 1989.Experiment 3: Wheat-pea rotation. The experimental design was a
split plot in a randomized complete block arrangement with four rep-lications. A 2-year winter wheat-spring pea rotation contained fourreplicate blocks of each crop (main plot). There were four tillagetreatments randomized within each crop block (subplot). We sam-pled three replicates of two tillage treatments (conventional andconservation tillage) in both crop phases of the rotation. Repeatedsamplings over 2 years were analyzed as the sub-subplot level.Conventional tillage consisted of moldboard plowing in the spring
before planting pea and again in autumn before planting wheat. Con-servation tillage consisted of no tillage before planting pea and shal-low sweep tillage before wheat. Wheat and pea were fertilized withammonium nitrate (N at 90 kg/ha) and ammonium phosphate sulfate(N at 23 kg/ha), respectively.Experiment 4: Annual cereals. The experiment consisted of two
main plots (cultivated and noncultivated). Within each main plotwere three randomized subplots where winter wheat, spring wheat,or spring barley were grown annually without rotation. Each of thesix subplots was sampled in two places to provide replicate sampleseach of the 2 years. Repeated samplings over 2 years were analyzedas the sub-subplot level.From 1931 to 1982, the field was planted annually to winter wheat
and managed using a conventional tillage system consisting of a
moldboard plow followed by disking. In 1982, the plot was dividedinto three subplots that were planted annually to either winter wheat(84 years), spring wheat (33 years), or spring barley (33 years) on thesame subplot each year. Soil in each subplot continued to be culti-vated as it was from 1931 to 1982, except that tillage occurred duringthe autumn in the winter wheat subplot and during the spring in thesubplots planted to spring cereals. One sample was collected fromeach half of each cereal subplot each year, and the experiment wasanalyzed using the two samples as replicates.An identical series of the three cereal subplots was established dur-
ing 1997 on an adjacent field that is not tilled between crops. Prior to1997, the main plot had been used for a winter wheat-cultivated fal-low rotation. Subplots in the noncultivated main plot were sampledas described for the cultivated main plot of annual cereals.Experiment 5: Pasture versus wheat. The experimental design was
a randomized complete block containing two crops (first factor).Repeated samplings over 2 years were analyzed as a second factor.A perennial grass pasture first planted in 1931 was used to approx-
imate virgin grassland. The pasture received limited grazing by cattleuntil 1985 and was not grazed after 1985. The pasture was occasion-ally overseeded with introduced grasses and, at the time of sampling,was dominated by tall fescue (Festuca arundinacea Schreb.) and hadlesser amounts of bulbous bluegrass (Poa bulbosa L.) and foxtail(Setaria viridis (L.) Beauv. and S. pumila (Poir.) Roem. & Schult.).As a comparison with the pasture, we also sampled a nearby block ofwinter wheat that had been planted each year since 1931. It was cul-tivated between harvest and planting each year from inception until1998. After 1998, the block had been managed without tillage (19years). Two samples collected from separate halves of each of thetwo plots each year were analyzed as “replicates” within these non-replicated plots (Table 1).Experiment 6: Three-year rotations. The experimental design was
a split plot arranged in randomized complete blocks with two repli-cations. Fields either cultivated by moldboard plow or noncultivated(no-till) were the main plots, in which two replications of each phaseof a 3-year rotation (subplots of winter wheat, spring wheat, or fal-low) occurred each year (Table 1). Sampling during each of 2 yearswas analyzed at the sub-subplot level.Experiment 7: Organic wheat. The experimental design was a
five-level factorial experiment that included three replicates of fivetreatments: (i) two 2-year cropping systems (cover crop or intercrop),(ii) two phases of each cropping system (planted or fallow), (iii) twospring wheat cultivars, (iv) two types of legume mixtures (cloveror medic), and (v) four N application rates (N at 0, 13, 27, or31 kg/ha/year from an organic 4-4-4 fertilizer), for a total of 192plots. The cover crop options included spring wheat alternated witha mixture of either nine dryland clover species (Trifolium L. spp.) orsix dryland medic species (Medicago L. spp.). The intercrop optionsincluded spring wheat planted simultaneously with either the cloveror the medic mixture. The cover crop and intercrop systems wereeach a 2-year rotation with a planted and a fallow phase. Both sys-tems were tilled between crops using a sweep cultivator.During 2015, we sampled two replicates of each pulse mixture
(clover versus medic) in each cropping system (cover crop versus in-tercrop), sampling from only one wheat cultivar (Louise) and oneN-rate treatment (N at 31 kg/kg/year). Samples were collected fol-lowing the spring wheat phase of the rotation. Data were analyzedas a split-plot experiment, with cropping system as the main plotand pulse mixture as the subplot. During 2013, we collected prelim-inary samples from the same plots but combined the pulse crop treat-ments into a single composite sample which contained a mixture ofthe clover and medic treatments within each cropping system. Thetwo preliminary samples were not included in the statistical analysisbut were used as a comparison with the more comprehensive sam-pling conducted during 2015.Experiment 8: Winter wheat tillage. The experiment was a ran-
domized complete block with four replications. Two tillage systemswere compared at two locations (first factor): the research center andthe Reese site. At both locations, annual winter wheat was managedwith either minimum tillage or without tillage from 2002 to 2008
1694 Plant Disease /Vol. 100 No. 8

(second factor). During 2008, the tillage systems were maintainedbut the crop management at each location was changed to planting‘Bobtail’ winter wheat during alternate years. The minimum-tillagefallow was created by a low-disturbance sweep during late spring,which was the only tillage unless rod weeding became necessaryto control weeds during the summer. Noncultivated rotations weremanaged using herbicides to control weeds. Repeated samplingsover 2 years were treated as the third factor for analysis.Pathogen identification and inoculum density. Soil samples
were stored at 4°C for up to 2 days at field moisture level. They werethen dried in an oven at 40°C for 48 h to stabilize the pathogen DNA(McKay et al. 2008). A well-mixed subsample of dried soil (500 g in2013 and 400 g in 2015) from each replicate was processed by theRoot Disease Testing Service (RDTS), South Australia Researchand Development Institute, Adelaide, Australia. The RDTS used aproprietary procedure (PreDicta B; http://pir.sa.gov.au/research/services/molecular_diagnostics/predicta_b) to extract DNA fromthe entire sample (Ophel-Keller et al. 2008). DNA was then trans-ferred to an analytical laboratory where robotic pipetting stations pre-pared subsamples for a series of qPCR assays in 384-well plates(Ophel-Keller et al. 2008). The developers of the assays reported thatDNA of fungi and nematodes became mostly undetectable within aweek after the organism had died, meaning that results of the assaysclosely approximated the DNA density in soil for living organisms(Ophel-Keller et al. 2008). Fungal inoculum concentrations in picto-grams of DNA per gram of soil was reported during both samplingyears for B. sorokiniana, F. culmorum, F. pseudograminearum,G. graminis var. avenae, G. graminis var. tritici, Phoma pinodella,Pythium spp. clade F (LeVesque and De Cock 2004), Phytophthoramedicaginis, and R. solani AG-8. Separate DNA assays were per-formed to differentiate between two haplotypes (numbers 1 and 2)of F. pseudograminearum that occur in Australia (Bentley et al.2008). Additionally, during 2015, inoculum densities of Botryos-phaeria spp. clade 2, D. tritici-repentis, and Helgardia spp. werereported by RDTS as copies of DNA per g of soil. Inoculum densitydata for several of these pathogens have been associated with levelsof disease risk in Australia and New Zealand (Bithell et al. 2012;McKay et al. 2008; Ophel-Keller et al. 2008; Poole et al. 2015) butno such correlations have been reported in North America. Nema-todes were reported as nematodes per gram of soil based on standardcurves that correlated DNA concentration with nematode number.Each life stage (egg, juvenile, and adult) yields an approximatelyequal amount of DNA (Yan et al. 2013). Nematode species reportedin each sampling year includedDitylenchus dipsaci,Heterodera ave-nae, Pratylenchus neglectus, P. thornei, and P. teres.Weather.Weather at the research center was monitored by an of-
ficial U.S. NationalWeather Service recording station, located within0.5 km of the experiments we sampled (http://w2.weather.gov/climate/xmacis.php?wfo=pdt).Statistical analyses.Effects of cropmanagement factors and years
on individual pathogens within each experiment were analyzed usingthe designs shown in Table 1; six experiments were split-split plots,one was a split plot, and two were randomized complete blocks. Thetable indicates the order of treatment effects used for analysis; wholeplot or first factor, subplot or second factor, and sub-subplot or thirdfactor. Replicates were treated as blocks. Analyses were performedusing the generalized linear model program in CoStat (CoStat Statis-tical Software v. 6.400; CoHort Software, Monterey, CA). Effects ofcrop, fertility, location, rotation phase, cropping system, and tillagewere treated as fixed effects and year as a random effect. When treat-ment means were significant at P < 0.05, means were separated usingthe Tukey’s honestly significant difference test (HSD). Nine patho-gens were evaluated during both years in seven experiments. Be-cause only 14% (9 of 63) of main treatment effects for year weresignificant and only 20 of a possible 189 interactions between yearand one or more other treatments were significant, data were groupedover years within individual experiments and were reanalyzed with-out year as a variable. Potential associations between pairs of patho-gens were examined by regressing DNA concentrations of all pairsof individual pathogens within individual experiments, using either
linear or polynomial regression analyses. Similar regressions of path-ogen DNAwere evaluated for selected other subsets of whole-plot orsubplot treatments, such as data restricted by year, tillage system,crop type, or phase of a rotation. Highly significant Pearson correla-tion coefficients (R2 > 0.7, with an associated P < 0.0001) were se-lected for plotting of regressions. These limits were arbitrarilyassigned to identify the most important of the many significant cor-relations in the data set.
ResultsMean monthly temperatures at a 5-cm depth were nearly equal each
year: 0, 4, and 8°C in January, February, and March, respectively. Pre-cipitation was variable over the 6-month period prior to sampling duringMarch 2013 and 2015: 168 and 276mm, respectively, representing 32%less and 11% more than the 84-year mean (248 mm) for that interval.Although precipitation varied over years, the main effect of year differedsignificantly (P < 0.05) for only 9 of 63 observations (Table 2) in theseapparently well-stabilized long-term experiments.A summary of pathogenic fungi and parasitic nematodes detected
in this research is presented in Table 3. With one exception, the tablereports 2-year mean minimum and maximum inoculum densities foreach pathogen averaged across replicates for individual treatmentswithin each experiment. Data for experiment 7 is from a single yearof comprehensive sampling during 2015. Inoculum densities for 6 ofthe 11 pathogens shown in Table 3 were significantly affected by oneor more treatment effects or treatment interactions in at least five ofthe eight experiments. The pathogens that were frequently influencedby experimental variables included the fungi F. culmorum,G. grami-nis var. tritici, Pythium spp. clade F, and R. solani AG-8, and thenematodes P. neglectus and P. thornei.During the course of this research, in eight experiments, we eval-
uated a total of 225 possible main treatment effects (Table 2) for ninepathogens that were present at the experimental location (Table 3).Significant main effects were revealed for 24% (53 of 225) of possi-ble combinations of main effects and individual pathogens (Table 2).Likewise, we evaluated 270 possible interactions and determined that16% (42 of 270) were significant (Table 2). In four older experiments(experiments 1 to 4), the significant main effects and interactionswere each more prevalent in the two annually cropped experiments(experiments 3 and 4; 29% of possible main effects and interactions)compared with two wheat-fallow rotations (experiments 1 and 2;14%). Significantly positive and negative associations among patho-gens were revealed, with most of them occurring in the 84-year-oldannual cereals experiment (experiment 4, as described later).Maximum inoculum densities of F. pseudograminearum were nu-
merically greater than for F. culmorum in five experiments (Table 3).The haplotype of F. pseudograminearum detected in these studieswas entirely of the haplotype detected by the PreDicta B “FusariumTest 1”. The dominant species of root-lesion nematode wasP. neglectus where winter wheat was the only crop grown (Table 3).A dominance of P. thorneiwas favored when spring wheat and pulsecrops were grown in experiment 7 (Table 3). Pathogens included inthe PreDicta B assay but not detected in this survey were Botryos-phaeria spp. clade 2, Phoma koolunga, Phytophthora medicaginis,D. dipsaci, Pratylenchus teres, and H. avenae.Experiment 1: Fertility management. Pathogens for which sig-
nificant treatment differences were detected included G. graminisvar. tritici, Phoma pinodella, Pythium spp., and Pratylenchus neglectus(Table 2). The only significant interaction among treatments for the threefungal pathogens was the interaction of rotation phase–fertility treatmentforG. graminis var. tritici. That interaction indicated that inoculum con-centration did not differ greatly between the planted and fallow phasesfor the 0 N and pea vine treatments but did differ greatly between thetwo rotational phases for each of the other four fertility treatments. Ineach treatment, a much lower inoculum concentration occurred duringthe year following fallow compared with the year following wheat. In-oculum density of G. graminis var. tritici was significantly affected bymain fertility treatments, with greater DNA densities in the 90 N+burntreatment than in the 0 N or 90 N treatments: 8.8, 0.4, and 0.2 pg/g ofsoil, respectively (HSD0.05 = 5.3). The 90 N+burn treatment following
Plant Disease /August 2016 1695
wheat had significantly more DNA ofG. graminis var. tritici than in the0 N, 90 N, and pea treatments following wheat and in all treatments fol-lowing the fallow phase (Table 4). Inoculum of Phoma pinodella wasalso significantly affected by the main effect of treatment (Table 2); thispathogen of pulse crops was detected only in the pea vine treatment ofeach rotational phase (Table 4).The density of Pythium spp. was also significantly affected by
fertility treatment (Table 2), with 38.9, 25.8, 15.9, 15.6, 12.9, and
12.5 pg/g in the manure, pea, 90 N, 45 N, 0 N, and 90 N+burn treat-ments, respectively (HSD0.05 = 17.3). The density of Pythium spp.was especially high in both rotational phases of the manure treatment(Table 4).The density of Pratylenchus neglectus was influenced by signifi-
cant fertility treatment–rotation phase and fertility–year interactions(Table 2). The fertility–phase interaction indicated nearly equal den-sities of P. neglectus in the pea treatment of each phase but higher
Table 2. Table of significant (P > F) treatment effects for treatment main effects and for interactions of inoculum densities of pathogens detected in eight exper-iments at the research center near Pendleton, ORw
Main effectsx
Experiment, treatments, pathogensy Whole Sub Sub-sub Interactions
1. Fertility management; 2P,6F,2Y P F Y P × F P × Y F × Y P × F × YGaeumannomyces graminis var. tritici 0.3281 0.0365 0.5834 0.0279 0.6937 0.7311 0.8084Phoma pinodella 0.5862 0.0130 0.8266 0.8841 0.2712 0.9980 0.3174Pythium spp. clade F 0.4459 0.0416 0.4000 0.1199 0.2499 0.5511 0.2992Pratylenchus neglectus 0.1708 <0.0001 0.0007 0.0454 0.6672 0.0500 0.6972
2. Tillage-fertility; 3T,3F,2Y T F Y T × F T × Y F × Y T × F × YFusarium culmorum 0.1443 0.0004 0.6312 0.7473 0.2836 0.0806 0.0116G. graminis var. tritici 0.0223 0.7833 0.4039 0.2472 0.1655 0.2489 0.2028Pythium spp. clade F 0.0004 0.0073 <0.0001 0.1457 0.0010 0.1475 0.5601Pratylenchus neglectus 0.2325 0.0002 0.0007 0.3276 0.1942 0.0008 0.4907
3. Wheat-pea rotation; 2C,2T,2Y C T Y C × T C × Y T × Y C × T × YF. culmorum 0.3757 0.2832 0.3549 0.5408 0.6988 0.4729 0.0390G. graminis var. tritici 0.1007 0.1940 0.1364 0.4568 0.1364 0.0414 0.2279Phoma pinodella 0.0201 0.0054 0.0034 0.0037 0.2583 0.2252 0.1990Pythium spp. clade F 0.0566 0.6715 0.2440 0.0218 0.0061 0.0008 0.3441Rhizoctonia solani AG-8 0.1388 0.0407 0.2168 0.0492 0.1728 0.2054 0.1635Pratylenchus neglectus 0.0065 0.0005 0.7731 0.0018 0.7565 0.4743 0.6757P. thornei 0.0049 0.0001 0.0638 0.0106 0.3627 0.0025 0.0823
4. Annual cereals; 2T,3C,2Y T C Y T × C T × Y C × Y T × C × YBipolaris sorokiniana 0.3736 0.0026 0.9596 0.0064 0.7683 0.1231 0.0978F. culmorum 0.1830 0.0158 0.0062 0.0023 0.0144 0.0147 0.0083F. pseudograminearum 0.0866 0.0294 0.0626 0.0133 0.5583 0.4145 0.1972G. graminis var. tritici 0.0035 0.0012 <0.0001 0.0012 <0.0001 <0.0001 <0.0001Pythium spp. clade F 0.1078 0.0021 0.3186 0.0340 0.1013 0.2592 0.0138P. neglectus 0.9324 0.0046 0.0007 0.1347 0.0015 0.0006 0.0012P. thornei 0.3432 0.0044 0.0145 0.0040 0.0202 0.0016 0.0116
5. Pasture versus wheat; 2C,2Yz C Y … C × Y … … …
F. culmorum 0.0491 0.9415 … 0.9747 … … …
G. graminis var. tritici 0.0503 0.0164 … 0.0425 … … …
R. solani AG-8 0.1510 0.0386 … 0.0753 … … …
6. Three-year rotations; 2T,3P,2Y T P Y T × P T × Y P × Y T × P × YF. pseudograminearum 0.0775 0.0470 0.3158 0.1921 0.7067 0.7104 0.2643Helgardia spp. 0.2054 0.0490 … 0.0490 … … …
R. solani AG-8 0.0049 0.4805 0.2075 0.4591 0.2826 0.4031 0.4071P. neglectus 0.0101 0.0002 0.1662 0.0031 0.5042 0.0771 0.2041P. thornei 0.0458 0.0479 0.3138 0.0104 0.1328 0.6432 0.3697
7. Organic wheat; 2S,2C S C … S × C … … …
F. culmorum 0.2208 0.0005 … 0.0001 … … …
Pythium spp. clade F 0.0341 0.2414 … 0.9070 … … …
R. solani AG-8 0.0403 0.1229 … 0.0578 … … …
P. thornei 0.0493 0.3015 … 0.7330 … … …
8. Winter wheat tillage; 2 L,2T,2Yz L T Y L × T L × Y T × Y L × T × YF. culmorum 0.0262 0.2435 0.8484 0.2519 0.9521 0.5776 0.4571F. pseudograminearum 0.0025 0.0117 0.6825 0.2476 0.8122 0.8604 0.2786Pythium spp. clade F 0.7040 0.5386 0.0147 0.1564 0.7980 0.4278 0.0636R. solani AG-8 0.0001 0.0030 0.1370 0.0038 0.0901 0.0365 0.0963P. thornei <0.0001 0.3304 0.6249 0.9119 0.9944 0.9969 0.9465
w Analyses are for data grouped over 2 years of sampling (2013 and 2015) for all experiments except experiment 7, which was comprehensively sampled onlyduring 2015; … indicates comprehensive sampling data were collected only during 2015.
x Whole plot (Whole), subplot (Sub), and sub-subplot (Sub-sub).y Experiment number, name, treatments, and pathogens. Experimental treatments are described in theMethods section. Treatments are abbreviated as the numberof treatments for crop (C), fertility (F), physical location (L), rotation phase (P), cropping system (S), tillage (T), or year (Y). Treatments are listed in the order inwhich they were applied for analysis (e.g., 2P,6F,2Y indicates that rotation phase was the whole plot, fertility treatment was the subplot, and year was the sub-subplot). Pathogens reported in this table are restricted to those for which at least one main treatment effect or one interaction was significant at P < 0.05, asdetermined by analysis of variance.
z Two experiments (number 5 and number 8) were analyzed as randomized complete blocks. Therefore, main effects, from left to right, are first factor, secondfactor, and third factor.
1696 Plant Disease /Vol. 100 No. 8

densities following wheat than fallow for all other management treat-ments (Table 4). The fertility–year interaction indicated a strong pos-itive response to higher rainfall during 2015 compared with 2013 inthe 0 N treatment (0.4 versus 3.4 nematodes/g) and smaller differ-ences between years for all other treatments. The main treatment ef-fects for fertility and year were also significant for P. neglectus(Table 2). Treatments had mean DNA densities of 19.8, 7.9, 5.5,4.1, 3.8, and 1.9 pg/g in the manure, 90 N+burn, 45 N, 90 N, pea,and 0 N treatments, respectively (HSD0.05 = 4.5). The density wasgreater in the manure treatment following wheat than in all othertreatments (Table 4). The density of P. neglectus was greater duringthe wetter (2015) than the drier (2013) year: 8.6 and 5.7 nematodes/gof soil, respectively (HSD0.05 = 1.4).There were no strong significant correlations (R2 > 0.7 and P <
0.0001) among pathogens when the analyses included data fromall treatments from each rotational phase and both years (n = 48).When data from individual years were evaluated there was a signif-icant positive correlation between G. graminis var. tritici andP. neglectus during 2013 (Fig. 1). Therefore, this association be-tween a fungal and nematode pathogen was detected in a mixtureof samples taken from standing stubble following winter wheat plussoil that had been plowed prior to planting winter wheat during theprevious autumn. The association was not improved when data werefurther restricted to include only the samplings made following thewheat phase of the rotation (n = 12).Experiment 2: Tillage-fertility. Pathogens for which significant
treatment differences were detected included F. culmorum,G. grami-nis var. tritici, Pythium spp., and P. neglectus (Table 2). For two ofthose pathogens, F. culmorum and G. graminis var. tritici, the inoc-ulum densities were very low. For F. culmorum, there were no signif-icant interactions among main effects but the fertility treatmentsignificantly affected inoculum density (Table 2). The DNA concen-tration increased with increasing rates of N application: 0.3, 1.0, and1.5 pg/g for the 45 N, 90 N, and 135 N treatments, respectively(HSD0.05 = 0.3). For G. graminis var. tritici, there were also no signifi-cant interactions among main effects but the tillage treatment signifi-cantly affected inoculum density (Table 2). The DNA concentrationincreased with increasing levels of straw retention at the soil surface:0.1, 0.2, and 0.3 pg/g for the plow, disk, and sweep treatments, respec-tively (HSD0.05 = 0.1).
Inoculum density of Pythium spp. was significantly affected by thetillage–year interaction (Table 2). The interaction reflected higher in-oculum densities during the wettest year (2015), with the differencebeing much more pronounced in the disk and sweep treatments thanin the plow treatment. Inoculum density for Pythium spp. was sig-nificantly affected by each of the three main variables (Table 2).Inoculum was greatest at the lowest N rates: 33, 34, and 21 pg/g(HSD0.05 = 2) for the 45 N, 90 N, and 135 N treatments, which
Table 3. Soilborne pathogens and the range of inoculum densities per gram of soil detected by quantitative polymerase chain reaction assays on extracts from soilscollected from various treatments of eight long-term experiments at the research center near Pendleton, ORu
Fungi (pg DNA/g)v Fungi (cp/g)w Nema (n/g)x
Experimenty Bs Fc Fp Gg Pp Py Rs Dtz Hez Pn Pt
1. Fertility nd 0–2 0–10 0–18* 0–8* 9–38* 0–12 nd 0–29 1–27* 0–12. Tillage nd 0–2* tr 0–1* nd 6–54* 0–7 nd 0–1 0–4* nd3. Wheat–pea nd 0–3* 0–2 1–2* 97–579* 47–111* 0–27* 0–3 0–7 0–13* 1–5*4. Annual 0–33* 0–170* 2–60* 1–73* nd 26–92* 0–4 0–52 nd 0–27* 0–27*5. Pasture 0 7–12* 17–70 9–31* nd 20–49 16–34* 35–163 12 13–16 0–16. Three-year nd 2–11 0–20* 1–33 nd 41–87 0–44* nd 0–578* 0–12* 4–19*7. Organicz 14–287 1–4* 0–1 6–10 10–45 145–295* 17–210* nd nd 1–7 3–17*8. Winter nd 0–3* 1–19* 0–1 nd 18–24* 0–79* nd 0–3 1–4 0–1*
u With the few exceptions noted in the table, data are the ranges among means of replicates for individual treatments averaged over both years of sampling (2013and 2015), with each 2-year mean rounded to the nearest whole unit for individual treatments within each experiment; nd = not detected; * = significant dif-ferences occurred among treatments; and tr = trace, indicating that the pathogen was detected in at least one treatment but at a concentration of DNA at less than0.5 pg/g of soil.
v Fungal pathogens included Bipolaris sorokiniana (Bs), Fusarium culmorum (Fc), F. pseudograminearum (Fp), Gaeumannomyces graminis var. tritici (Gg),Phoma pinodella (Pp), Pythium spp. clade F (Py), Rhizoctonia solani AG-8 (Rs), Drechslera tritici-repentis (Dt), and Helgardia acuformis plus H. herpotri-choides (He).
w Units for Dt and He were reported as copies of DNA per gram (cp/g) and were rounded to the nearest thousand for reporting in this table (1,000 copies ofDNA/g).
x Parasitic nematodes (Nema; n = number per gram) included Pratylenchus neglectus (Pn) and P. thornei (Pt).y Crops produced in each experiment included winter wheat (WW), spring wheat (SW), spring barley (SB), spring pea (SP), perennial grasses (PG), and mixturesof wheat with either clover (WC) or medic (WM). Rotational management phases sampled included cultivated fallow (CuF) and noncultivated chemical fallow(no-till, ChF). Experiment crop or management phase prior to sampling were 1, fertility management (WW & CuF); 2, tillage-fertility (WW); 3, wheat-pearotation (WW & SP); 4, annual cereals (WW, SW & SB); 5, pasture versus wheat (PG & WW); 6, 3-year rotation (WW, SW & ChF); 7, organic wheat(WC, WM); and 8, winter wheat tillage (WW).
z Data for Dt and Hewere reported only during 2015. Data for the organic wheat experiment are also for 2015 only because clover andmedic treatments in the twocropping systems were composited during 2013.
Table 4. Influence of fertility management variables on inoculum densities offour soilborne pathogens in a winter wheat-cultivated fallow rotation man-aged since 1931 (experiment 1)x
DNA (pg/g)
Treatmenty Phasez Gg Pp Py Pn (n/g)
0 N Fallow 0 b 0 b 10 b 1 c45 N Fallow 0 b 0 b 14 b 3 c90 N Fallow 0 b 0 b 15 b 1 c90 N+burn Fallow 0 b 0 b 9 b 2 cManure Fallow 1 b 0 b 54 a 13 bPea Fallow 1 b 5 a 38 b 4 c0 N Wheat 0 b 0 b 16 b 3 c45 N Wheat 5 ab 0 b 17 ab 8 bc90 N Wheat 1 b 0 b 17 ab 7 bc90 N+burn Wheat 18 a 0 b 17 ab 14 bManure Wheat 8 ab 0 b 24 b 27 aPea Wheat 2 b 8 a 14 b 4 c
x Data are 2-year means rounded to the nearest whole unit. Pathogens in-clude Gaeumannomyces graminis var. tritici (Gg), Phoma pinodella (Pp),Pythium spp. clade F (Py), and Pratylenchus neglectus (Pn; n = nematodesper gram). Numbers followed by the same letter within a column are notsignificantly different at P = 0.05 according to Tukey’s honestly significantdifferent test.
y Treatments prior to planting wheat were no fertilizer (0 N), nitrogen (N) at45 kg/ha (45 N) or 90 kg/ha (90 N), 90 N plus burning the wheat stubblebefore plowing (90 N+burn), application of N at 111 kg/ha as cow manure(Manure), or application of N at 34 kg/ha as pea vines (Pea), all since 1931.
z Rotational phase (fallow or wheat) preceding the date of sampling. Fallowwas sampled during a 5-month-old seedling winter wheat crop planted aftera 14-month fallow and Wheat was sampled midway into the fallow phasefollowing a wheat crop harvested 7 months earlier.
Plant Disease /August 2016 1697

was particularly evident in the sweep treatment (Table 5). Inoculum ofPythium spp. also increased with increasing amounts of surface residue:7, 36, and 45 pg/g for the plow, disk, and sweep treatments, respectively(HSD0.05 = 6). As noted earlier, the inoculum density was greater duringthe wetter than the drier year: 35.3 versus 23.2 pg/g during 2015 and2013, respectively (HSD0.05 = 5.0).Inoculum of P. neglectus was significantly influenced by the fer-
tility–year interaction (Table 2), which reflected the elevation ofnematode density during the wetter year (2015), particularly at thelowest N rate (45 N) compared with the higher N rates. Althoughthe densities of P. neglectus were rather low throughout this experi-ment (Table 3), there were significant differences for the main treat-ment effects of fertility and year (Table 2). Densities were greater atthe lowest N rate: 2.5, 0.9, and 0.2 nematodes/g of soil for the 45 N,90 N, and 135 N treatments, respectively (HSD0.05 = 0.9). The highestdensities of P. neglectus occurred in the 45 N fertility rates in the sweepand disk tillage blocks (Table 5). The nematode density was higher dur-ing the wetter than the drier year: 1.8 versus 0.7 nematodes/g of soil dur-ing 2015 and 2013, respectively (HSD0.05 = 0.7).There were no strong significant correlations (R2 > 0.7 and P <
0.0001) among pathogens when the analyses included data fromall fertility and tillage treatments during both years (n = 54) or whendata were analyzed by individual tillage treatments and years (n = 9).
Experiment 3: Wheat-pea rotation. Significant interactionsamong main treatment variables were common (10 of 28 possibleinteractions; 36%) and occurred for seven pathogens: F. culmorum,G. graminis var. tritici, Phoma pinodella, Pythium spp. clade F,R. solani AG-8, Pratylenchus neglectus, and P. thornei (Table 2). In-oculum concentrations for both F. culmorum and G. graminis var. tri-tici were very low (Table 3), as had also occurred in experiment 2.For F. culmorum, the significant crop–tillage–year interaction
reflected complex effects of main treatment variables. The inoculumdensity was greater during the wetter than the drier year in two treat-ments: following pea in the conservation tillage (4.6 versus 0.5 pg/gfor 2015 and 2013, respectively) and following wheat in the plowtreatment (5.1 versus 0 pg/g for 2015 and 2013, respectively). Theopposite relationship (e.g., greater inoculum density during the drierthan the wetter year) occurred following wheat in the conservationtillage (5.0 versus1.5 pg/g for 2013 and 2015, respectively) and fol-lowing pea in the plow treatment (0.4 versus 0 pg/g for 2013 and2015, respectively). There were no significant differences amongmain treatments for F. culmorum (Table 2).A significant tillage–year interaction for G. graminis var. tritici
(Table 2) indicated that inoculum density was greater during the drieryear than the wetter year in the conservation tillage treatment (1.8versus 1.3 pg/g for 2013 and 2015, respectively) and was greater dur-ing the wetter than the drier year in the plow treatment (4.7 versus 3.2pg/g for 2015 and 2013, respectively). There were no significant dif-ferences among main treatments forG. graminis var. tritici (Table 2).Inoculum of Phoma pinodella was significantly influenced by the
crop–tillage interaction and by each of the main treatment effects(Table 2). The interaction showed that differences in inoculum den-sity were much greater following pea than following wheat in theconservation tillage treatment (579 versus 96 pg/g, respectively) ascompared with the plow treatment (160 versus 119 pg/g, respec-tively). Inoculum levels were higher during the wetter than the driersampling period (321 versus 156 pg/g, respectively; HSD0.05 = 83).The concentration was also greater in the conservation than in theplow treatment (338 versus 139 pg/g, respectively; HSD0.05 = 83)and was greater following pea than wheat (369 versus 108 pg/g, re-spectively; HSD0.05 = 83). The inoculum concentration of P. pino-della was significantly higher in the conservation tillage systemfollowing pea than for any of the other combinations of treatments(Table 6).Pythium spp. clade F was significantly influenced by three interac-
tions: crop–tillage, crop–year, and tillage–year (Table 2). Thecrop–tillage interaction indicated that inoculum density was greaterfollowing pea than wheat in the conservation tillage treatment (111versus 47 pg/g, respectively) and was greater following wheat thanpea in the plow treatment (93 versus 75 pg/g, respectively). The
Fig. 1. Association between Gaeumannomyces graminis var. tritici and Pratylenchusneglectus following the winter wheat rotational phase of the fertility managementexperiment (experiment 1) during 2013.
Table 5. Influence of fertility–tillage variables on inoculum densities of threesoilborne pathogens in a winter wheat-cultivated fallow rotation managedsince 1940 (experiment 2)x
DNA (pg/g)
Treatmenty Tillagez Fc Py Pn (n/g)
45 N Plow 0 c 6 d 1 cd90 N Plow 1 b 8 cd 0 d135 N Plow 1 b 6 d 0 d45 N Disk 0 c 39 ab 4 a90 N Disk 1 b 44 ab 2 bc135 N Disk 2 a 26 bcd 0 d45 N Sweep 0 c 54 a 3 ab90 N Sweep 1 b 49 ab 1 cd135 N Sweep 2 a 31 abc 0 d
x Data are 2-year means rounded to the nearest whole unit. Pathogens includeFusarium culmorum (Fc), Pythium spp. clade F (Py), and Pratylenchusneglectus (Pn; n = nematodes per gram). Numbers followed by the same let-ter within a column are not significantly different at P = 0.05 according toTukey’s honestly significant different test.
y Treatments were nitrogen (N) at 45 kg/ha (45 N), 90 kg/ha (90 N), or 135kg/ha (135 N), since 1940, applied during the fallow year before plantingwinter wheat.
z Tillage consisted of moldboard plowing (Plow), offset disking (Disk), orsubsurface sweeps (Sweep) conducted during the spring of the fallow yearof the 2-year winter wheat-fallow rotation. Samples were collected in thespring when winter wheat seedlings were 5 months old, following a14-month fallow period since the last wheat crop had been harvested.
Table 6. Influence of previous crop and tillage system on inoculum densitiesof seven soilborne pathogens in a winter wheat-spring pea rotation managedsince 1963 (experiment 3)x
DNA (pg/g) Nema (n/g)
Cropy Tillz Fc Gg Pp Py Rs Pn Pt
Pea Cons 3 a 2 a 579 a 111 a 0 b 0 c 1 cWheat Cons 3 a 1 a 97 b 47 a 0 b 2 b 2 bcPea Plow 0 a 1 a 160 b 75 a 2 b 2 b 3 bWheat Plow 3 a 1 a 119 b 93 a 27 a 13 a 5 a
x Data are 2-year means rounded to the nearest whole unit. Pathogens includeFusarium culmorum (Fc), Gaeumannomyces graminis var. tritici (Gg),Phoma pinodella (Pp), Pythium spp. clade F (Py), Rhizoctonia solani AG-8(Rs), Pratylenchus neglectus (Pn), and P. thornei (Pt); nema = nematodes(n = number per gram). Numbers followed by the same letter within a col-umn are not significantly different at P = 0.05 according to Tukey’s honestlysignificant different test.
y The previous crop before sampling was either spring pea (Pea) or winterwheat (Wheat).
z Tillage (Till) was either by sweep tillage before wheat and no tillage beforepea (conservation [Cons]) or by moldboard plowing before each crop(Plow).
1698 Plant Disease /Vol. 100 No. 8

crop–year interaction indicated that inoculum density was greaterduring the wetter than the drier year following pea (110 versus 76pg/g for 2015 and 2013, respectively) and was greater during thedrier year than the wetter year following wheat (106 versus 34pg/g for 2013 and 2015, respectively). The tillage–year interactionindicated that inoculum density was greater during the wetter yearthan the drier year in the conservation tillage treatment (108 versus50 pg/g for 2015 and 2013, respectively) and was greater duringthe drier than the wetter year in the plow treatment (131 versus 37pg/g for 2013 and 2015, respectively). None of the main treatmenteffects were significant for Pythium spp. but the nearly significant ef-fect of crop (Table 2) indicated a trend for Pythium spp. to be moreprevalent following pea than wheat (93 versus 70 pg/g, respectively;HSD0.05 = 24).For R. solaniAG-8, the crop–tillage interaction and the main effect
of tillage were significant (Table 2). The crop–tillage interaction wasdue to a great variability in inoculum density between tillage treat-ments following wheat but not following pea. In the plow and con-servation treatments, the inoculum densities were 27 versus 0.2pg/g, respectively, following wheat and 2.1 versus 0.0 pg/g, respec-tively, following pea (Table 6). Inoculum of R. solani AG-8 wasgreater in the plow than in the conservation treatment (17.2 and0.1 pg/g, respectively; HSD0.05 = 11).Densities of both Pratylenchus neglectus and P. thornei were sig-
nificantly affected by crop–tillage interactions, and the tillage–yearinteraction was also significant for P. thornei (Table 2). The crop–tillage interactions indicated that nematode densities were greaterin the plow than in the conservation treatments following wheat(13.1 versus 2.3 nematodes/g for P. neglectus and 5.1 versus 2.0nematodes/g for P. thornei), whereas the densities were not asstrongly influenced by tillage treatments following pea (1.8 versus0.1 nematodes/g for P. neglectus and 2.8 versus 1.1 nematodes/gfor P. thornei). The tillage–year interaction occurred because the in-oculum densities differed more and in opposite manners over yearsin the plow treatment (4.7 versus 3.2 nematodes/g during 2015and 2013) than in the conservation treatment (1.3 versus 1.8nematodes/g during 2015 and 2013). The significant main treatmenteffect of crop for each pathogen (Table 2) showed that there wasgreater inoculum density following wheat than pea: 7.8 versus 0.9nematodes/g, respectively, for P. neglectus (HSD0.05 = 1.0) and 3.5versus 2.5 nematodes/g, respectively, for P. thornei (HSD0.05 =0.4). The significant treatment effect of tillage for both speciesshowed that the inoculum density was greater in the plow than inthe conservation treatment: 7.5 versus 1.2 nematodes/g, respectively,for P. neglectus (HSD0.05 = 1.0) and 4.0 versus 1.5 nematodes/g, re-spectively, for P. thornei (HSD0.05 = 0.4). In particular, the densitywas higher following wheat in the plow treatment than in any ofthe other combinations of tillage and crop treatments (Table 6).D. tritici-repentis was detected in this experiment but was found
only in the conservation tillage treatment following a crop of winterwheat during 2015; this pathogen was not included among assaysreported during 2013 (Table 3).When all data for the experiment were compared (n = 24), there
were strong, significantly positive correlations (R2 > 0.7 and P <0.0001) between P. neglectus and P. thornei and also between R.solani AG-8 and each of the Pratylenchus spp. The latter associationwas also strong for the total density of Pratylenchus spp. in the plowtreatment following the wheat phase of the rotation (Fig. 2). Thestrong positive associations between the two Pratylenchus spp. andbetween R. solani AG-8 and Pratylenchus spp. also occurred acrosstillage and rotational phase treatments during each year of testing,and also across tillage treatments and years following wheat crops.When analyzed across all combinations of tillage and rotationalphase treatments, associations between Pythium spp. clade F andeach of the Pratylenchus spp. were significantly positive duringthe drier year of 2013 and significantly negative during the wetteryear of 2015. These correlations were strongest when the twoPratylenchus spp. were added together and logn-transformed be-fore the inoculum density of Pythium spp. was regressed againstthe nematode density (Fig. 2). As explained for the association
reported for experiment 1, the association between Pythium spp.and Pratylenchus spp. in experiment 3 resulted from a mixtureof samples collected from standing stubble and soil plowed prior toplanting winter wheat.Experiment 4: Annual cereals. Treatment interactions (19 of 28
possible; 68%) were significant and occurred for seven pathogens:B. sorokiniana, F. culmorum, F. pseudograminearum, G. graminisvar. tritici, Pythium spp. clade F, P. neglectus, and P. thornei(Table 2). Ranges of inoculum density included substantially highconcentrations for each of the pathogens in this experiment (Table 3).The tillage–crop interaction for B. sorokiniana indicated that the
inoculum density was greater in the no-till than in cultivated springbarley (11.7 versus 1.0 pg/g), greater in cultivated than in no-tillspring wheat (33.1 versus 9.8 pg/g), and not detected at any timein winter wheat (Table 7). The significant treatment effect of cropreflected a far greater DNA density in spring wheat than in springbarley, and the absence of detection in winter wheat: 21.5, 6.4, and0.0 pg/g, respectively (HSD0.05 = 7.1). When all tillage and croptreatment combinations were compared, inoculum of B. sorokinianawas significantly greater in spring wheat of the plowed treatmentthan in all other combinations (Table 7).Inoculum density of F. culmorum differed significantly for all pos-
sible interactions of main treatments as well as for the main treatmentvariables of crop and year (Table 2). The tillage–crop interaction in-dicated that cultivated soil contained more inoculum of F. culmorumthan no-till soil for spring wheat (95 versus 3 pg/g) and the oppositeoccurred for spring barley (0 versus 170 pg/g) and winter wheat(1 versus 14 pg/g). The tillage–year interaction indicated that inoculumdensity was greater in the no-till than cultivated block during the wet-ter year (116 versus 37 pg/g) and the opposite occurred during thedrier year (9 versus 27 pg/g). The crop–year interaction indicated thatinoculum of F. culmorumwas greater during the wetter than the drieryear for each crop but differences were greater across years for springbarley (157 versus 13 pg/g during 2015 and 2013, respectively) than
Fig. 2. Associations between the concentration of fungal DNA and the density of totalPratylenchus spp. (Pratylenchus neglectus plus P. thornei) in the winter wheat-springpea experiment (experiment 3): (top) Rhizoctonia solani AG-8 in the plow tillagetreatment following the wheat phase of the rotation and (bottom) Pythium spp.clade F in all tillage–crop phase combinations during individual years (2013 and2015) of sampling.
Plant Disease /August 2016 1699

for spring wheat (58 versus 40 pg/g) or winter wheat (14 versus1 pg/g). A tillage–crop–year interaction reflected that the inoculumconcentration during 2013 was high only in the cultivated springwheat, in contrast to high concentrations in both cultivated springwheat and no-till spring barley during 2015 and an intermediate con-centration in the no-till winter wheat during 2015. A significant maineffect of crop indicated that inoculum of F. culmorum was greater inspring barley than in spring wheat and was greater in spring wheatthan in winter wheat: 85, 49, and 8 pg/g, respectively (HSD0.05 =35). The significant main effect of year indicated that inoculum den-sity of F. culmorum was greater during the wetter than the drier year(77 versus 18 pg/g; HSD0.05 = 29). When all tillage and crop treat-ment combinations were compared, inoculum of F. culmorum wassignificantly greater in spring barley of the plowed treatment thanin all except one other combination (Table 7); the exception wasan intermediate concentration of inoculum occurring in the winterwheat of the no-till treatment.For F. pseudograminearum, the significant tillage–crop interac-
tion (Table 2) indicated that inoculum was much greater in cultivatedthan no-till soils for spring wheat (60 versus 2 pg/g) but did not varygreatly among tillage treatments for spring barley (4 versus 6 pg/g)and winter wheat (5 versus 11 pg/g). The significant effect of previ-ous crop indicated that inoculum was greater after spring wheat thanafter winter wheat or spring barley: 31, 8, and 5 pg/g, respectively(HSD0.05 = 18). Although the main effects of year and tillage werenot significant (Table 2), there was a strong trend for inoculum ofF. pseudograminearum to be higher during the drier than the wetteryear (21 versus 8 pg/g during 2013 and 2015, respectively).All possible interactions and main treatments were significant for
G. graminis var. tritici (Table 2). The tillage–crop interaction indi-cated that inoculum was greater in cultivated than no-till soils foreach crop but the magnitude of difference varied for winter wheat(73 versus 1 pg/g), spring wheat (15 versus 1 pg/g), and spring barley(10 versus 1 pg/g). The tillage–year interaction indicated that inocu-lum density was higher in the cultivated than in the no-till block dur-ing both years but the difference was greater during the drier year (49versus 0 pg/g during 2013) than during the wetter year (17 versus 2pg/g during 2015). The crop–year interaction indicated that inoculumin winter wheat was considerably greater during 2013 than 2015 (61versus 12 pg/g) but did not differ across years for spring wheat (7 ver-sus 9 pg/g) or spring barley (4 versus 7 pg/g). The tillage–crop–yearinteraction occurred because the inoculum density was always higherin cultivated than in no-till blocks but the magnitude of that differ-ence was especially pronounced in winter wheat during 2013. Thesignificant main treatment effect of crop (Table 2) indicated that win-ter wheat had far greater inoculum than spring wheat or spring barley:
37, 8, and 5 pg/g, respectively (HSD0.05 = 5). Inoculum density ofG. graminis var. tritici was also greater in the cultivated block thanin the no-till block (32 versus 1 pg/g; HSD0.05 = 4), and was greaterduring the drier than the wetter year (24 versus 9 pg/g; HSD0.05 = 4).When all tillage and crop treatment combinations were compared, in-oculum of G. graminis var. tritici was significantly greater in winterwheat of the plowed treatment than in all other combinations(Table 7).Inoculum density of Pythium spp. was significantly affected by
tillage–crop and tillage–crop–year interactions, and also by the maineffect of crop (Table 2). The tillage–crop interaction showed that theinoculum density was greater in cultivated than in no-till spring bar-ley (92 versus 44 pg/g) and spring wheat (90 versus 57 pg/g) but didnot differ among tillage treatments for winter wheat (28 versus 26pg/g). The tillage–crop–year interaction indicated that the DNA con-centration was greater in cultivated than in no-till blocks during bothyears for spring barley but inoculum in spring wheat was greater inno-till than cultivated blocks during 2013 and the opposite occurredduring 2015. In contrast, in winter wheat, the inoculum density ofPythium spp. was greater in no-till than cultivated blocks during2015 and the opposite occurred during 2013. Inoculum density ofPythium spp. was also greater in spring wheat and spring barley thanin winter wheat (74, 68, and 27 pg/g, respectively; HSD0.05 = 18).When all crop and tillage treatment combinations were compared,inoculum of Pythium spp. clade F was significantly greater in springbarley of the plowed treatment than in winter wheat of the no-tilltreatment, and all other treatment combinations had intermediateconcentrations of inoculum (Table 7).The density of P. neglectuswas significantly affected by the tillage–
year, crop–year, and tillage–crop–year interactions and by the maineffects of crop and year (Table 2). The tillage–year interaction in-dicated that inoculum density was greater in cultivated than no-tillblocks during the drier year (9.2 versus 8.1 nematodes/g during2013) and was greater in no-till than cultivated blocks during the wet-ter year (10.7 versus 9.4 nematodes/g during 2015). The crop–yearinteraction indicated that inoculum density was greater in the wetterthan the drier year for winter wheat (23 versus 21 nematodes/g) andspring wheat (5 versus 2 nematodes/g) but the opposite occurred forspring barley (2 versus 3 nematodes/g). The tillage–crop–year inter-action indicated near equal numbers of P. neglectus each year in eachof the three cultivated crops and different densities each year in eachof the no-till cereals, with densities being high during the wetter yearfor spring wheat and spring barley, and lower during the wetter yearfor spring barley. The significant main treatment effects for cropand year indicated that a far higher density of P. neglectus occurredin winter wheat than in spring wheat or spring barley: 22, 4, and2 nematodes/g of soil, respectively (HSD0.05 = 8); and that the den-sity was higher during 2015 than during 2013: 10.1 versus 8.7nematodes/g, respectively (HSD0.05 = 0.5). When all tillage and croptreatment combinations were compared, the density of P. neglectuswas significantly greater in winter wheat of the plowed treatmentthan in all other combinations, and was also higher in the winterwheat of the no-till treatment than for all treatments that includedspring wheat or spring barley (Table 7).Inoculum density of P. thornei was significantly affected by all
possible interactions as well as by the main effects of crop and year(Table 2). The tillage–crop interaction indicated that inoculum wasgreater in cultivated than in no-till blocks for spring barley (27 versus8 nematodes/g of soil) and the opposite occurred for spring wheat(5 versus 19 nematodes/g of soil) and winter wheat (0 versus 3nematodes/g of soil). The tillage–year interaction indicated that inoc-ulum density was unaffected by the year in cultivated soil (11 and 11nematodes/g of soil) but, in the no-till block, the density was greaterduring the wetter than the drier year (13 versus 7 nematodes/g of soilduring 2015 and 2013, respectively). The crop–year interaction indi-cated that inoculum densities differed between 2013 and 2015 forspring wheat (5 versus 19 nematodes/g of soil) but not for springbarley (18 versus 17 nematodes/g of soil) or winter wheat (2 versus1 nematodes/g of soil). The crop–tillage–year interaction suggestedthat the density of P. thornei was higher in the cultivated than
Table 7. Influence of cereals planted annually without rotation into either cul-tivated or noncultivated soils on inoculum densities of seven soilborne path-ogens (experiment 4)x
DNA (pg/g) Nema (n/g)
Cropy Tillagez Bs Fc Fp Gg Py Pn Pt
SB Plow 1 b 0 b 4 b 10 b 92 a 0 c 27 aSW Plow 33 a 1 b 60 a 15 b 90 ab 1 c 5 cWW Plow 0 b 95 ab 5 b 76 a 28 ab 27 a 0 cSB No-till 12 b 170 a 6 b 1 b 44 ab 4 c 8 bcSW No-till 10 b 3 b 2 b 1 b 57 ab 6 c 19 abWW No-till 0 b 14 b 11 b 1 b 26 b 18 b 3 c
x Data are 2-year means rounded to the nearest whole unit. Pathogens includeBipolaris sorokiniana (Bs), Fusarium culmorum (Fc), F. pseudograminea-rum (Fp),Gaeumannomyces graminis var. tritici (Gg), Pythium spp. clade F(Py), Pratylenchus neglectus (Pn), and P. thornei (Pt); nema = nematodes(n = number per gram). Numbers followed by the same letter within a col-umn are not significantly different at P = 0.05 according to Tukey’s honestlysignificant different test.
y Crops planted annually into separate subplots were spring barley (SB),spring wheat (SW), and winter wheat (WW).
z Blocks were managed either with inversion tillage using a moldboard plow(Plow) since 1931 or without tillage (No-till) since 1997.
1700 Plant Disease /Vol. 100 No. 8

no-till spring barley during both years and was higher in no-till thanin cultivated spring wheat and winter wheat during both years. Thesignificant main effect of crop indicated that P. thornei numbers weregreater in spring barley and spring wheat than in winter wheat: 17.7,12.0, and 1.5 nematodes/g of soil, respectively (HSD0.05 = 6.1). Themain effect of year indicated that P. thornei was more prevalent dur-ing 2015 than during 2013: 12.2 versus 8.6 nematodes/g of soil, re-spectively (HSD0.05 = 2.5). When all tillage and crop treatmentcombinations were compared, the density of P. thornei was signifi-cantly greater in spring barley of the plowed treatment than in all ex-cept one other combination, and the density was also high in thespring wheat and spring barley of the no-till treatment (Table 7).Inoculum of D. tritici-repentis was detected in this experiment
(Table 3) but it was only found in one replicate of the no-till annualspring wheat during 2015. In that replicate, the pathogen was de-tected at a high concentration (52,022 copies of DNA/g of soil). Thispathogen was not included among assays reported during 2013.When all data for the experiment were grouped (two tillage and
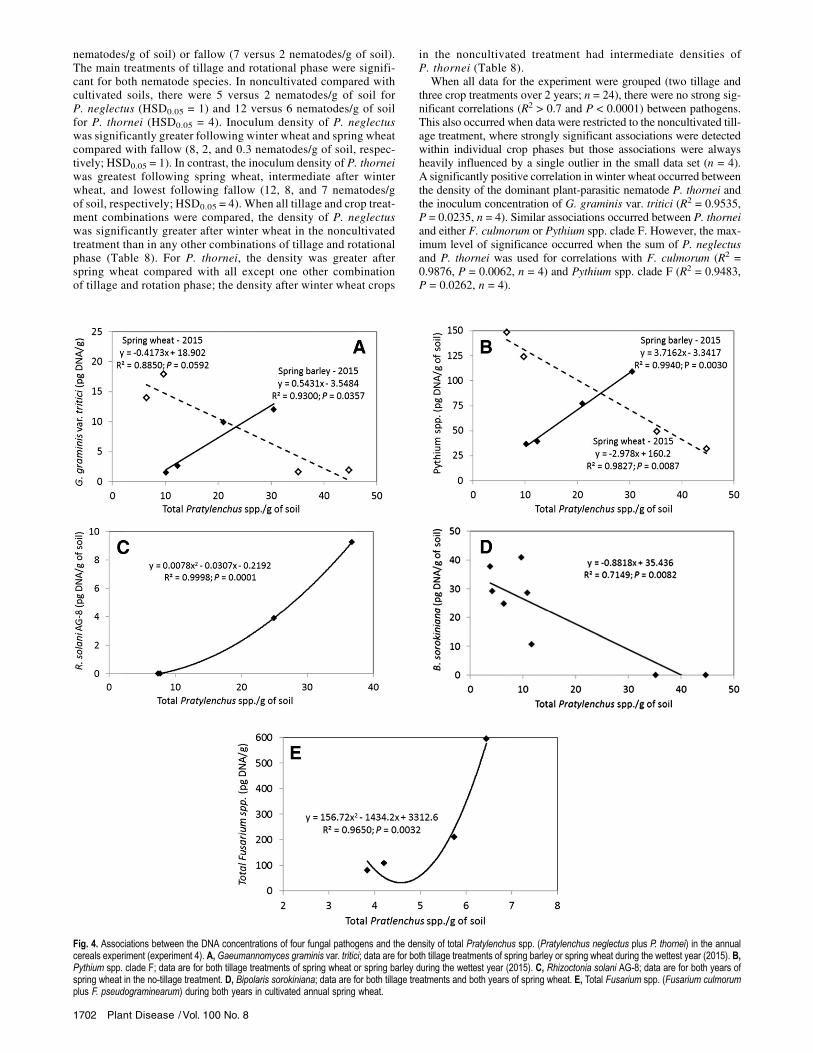
three crop treatments over 2 years; n = 24), there were no strong sig-nificant correlations (R2 > 0.7 and P < 0.0001) between pathogens.However, many potentially important associations were revealedwhen data were analyzed by crop and, particularly, when the cropwas evaluated by either tillage treatment or year. A strong positiveassociation occurred in spring wheat between F. culmorum andG. graminis var. tritici when data were grouped for both tillage treat-ments and both sampling years (Fig. 3). Samples were collected di-rectly in rows of standing stubble about 7 months after harvest.The relationship between P. neglectus and P. thornei was positivefor spring wheat and negative for spring barley (Fig. 3). Althoughnot significant, a negative trend between these pathogens was alsodetected in winter wheat. Associations commonly occurred betweenthe nematodes and the primary root-invading fungal pathogens.Examples of the most significant of these associations are shownin Figure 4. For specific combinations of crop, tillage, and year, signif-icant positive or negative associations were shown between the totalPratylenchus spp. density and the concentration of DNA ofG. graminisvar. tritici, Pythium spp. clade F, R. solani AG-8, B. sorokiniana, andtotal Fusarium spp. (F. culmorum plus F. pseudograminearum).Experiment 5: Pasture versus wheat. The crop–year interac-
tion and each of the main treatment effects were significant forG. graminis var. tritici (Table 2). The interaction indicated thatthe concentration of DNA was greater in the drier year (2013) thanin the wetter year (2015) in wheat (61 and 2 pg/g of soil, respec-tively) and was much less variable in the pasture (14 and 4 pg/g,respectively).One or both main treatment effects were significant for each of the
three pathogens shown in Table 2. For F. culmorum, the inoculumdensity was greater in winter wheat than in pasture: 70 versus 7pg/g, respectively (HSD0.05 = 61). There was a greater concentrationof G. graminis var. tritici DNA in winter wheat than in pasture (31versus 9 pg/g, respectively; HSD0.05 = 21) and the inoculum densitywas greater during 2013 than 2015 (38 versus 3 pg/g, respectively;HSD0.05 = 23). For R. solaniAG-8, the inoculum density was greaterduring the wetter than the drier year: 8 versus 42 pg/g during 2013and 2015, respectively (HSD0.05 = 31). This differential effect oc-curred in both wheat (4 and 64 pg/g, respectively) and pasture (12and 20 pg/g, respectively). There were no significant correlationsamong DNA of pathogens in this experiment.Experiment 6: Three-year rotation. Pathogens for which signif-
icant treatment differences or interactions were detected includedF. pseudograminearum, Helgardia spp., R. solani AG-8, P. neglectus,and P. thornei (Table 2). Significant interactions among treatments oc-curred for all except F. pseudograminearum and R. solani AG-8.The inoculum density of F. pseudograminearum was significantlyaffected only by the phase of the rotation (Table 2). The greatestamount of inoculum occurred following winter wheat, was interme-diate after spring wheat, and was lowest following chemical fallow:13, 9, and 1 pg/g, respectively (HSD0.05 = 10). When all tillageand crop treatment combinations were compared, inoculum ofF. pseudograminearum was significantly greater after winter wheat
in the noncultivated soil than after fallow in the cultivated treat-ment, and all other combinations contained intermediate levels ofinoculum (Table 8).A significant tillage–rotational phase interaction occurred for Hel-
gardia spp. during 2015 (Table 2), reflecting the lack of detection ofthis pathogen in noncultivated soil and the occurrence of large differ-ences among rotational phases in the cultivated block. The treatmenteffect of rotational phase was also significant. Inoculum was greaterfollowing winter wheat than following spring wheat or chemical fal-low: 288,952, 56,872, and 4,429 copies of DNA/g of soil, respec-tively (HSD0.05 = 215,740). When all tillage and crop treatmentcombinations were compared for inoculum ofHelgardia spp., the in-oculum density was significantly greater after winter wheat than afterthe other two rotational phases of the cultivated treatment (Table 8),indicating the development of inoculum on winter wheat and a rapidattrition of DNA of Helgardia spp. during subsequent phases of the3-year rotation.Inoculum of R. solaniAG-8 was significantly affected only by till-
age (Table 2). Inoculum was greater in noncultivated soil than in cul-tivated soil: 31.2 versus 0.5 pg/g of soil, respectively (HSD0.05 = 3.0).When all tillage and crop treatment combinations were compared, theinoculum density in the noncultivated treatment was significantlygreater after spring wheat than after winter wheat or fallow (Table 8).Tillage–rotational phase interactions were significant for both
nematode species (Table 2). For P. neglectus, there was considerablygreater nematode density in noncultivated than in cultivated soil fol-lowing winter wheat (12 versus 4 nematodes/g) and spring wheat(3 versus 0 nematodes/g of soil), and no difference following fallow(0 versus 0 nematodes/g of soil). For P. thornei, there was a muchgreater difference of nematode densities between noncultivatedand cultivated treatments following spring wheat (29 versus 4nematodes/g of soil) than following winter wheat (9 versus 4
Fig. 3. Associations between the DNA concentrations of two fungal and two nematodepathogens in the annual cereals experiment (experiment 4): (top) Gaeumannomycesgraminis var. tritici and Fusarium culmorum in both tillage treatments for both years ofspring wheat and (bottom) Pratylenchus neglectus and P. thornei in both tillagetreatments for both years of spring wheat, spring barley, and winter wheat.
Plant Disease /August 2016 1701
nematodes/g of soil) or fallow (7 versus 2 nematodes/g of soil).The main treatments of tillage and rotational phase were signifi-cant for both nematode species. In noncultivated compared withcultivated soils, there were 5 versus 2 nematodes/g of soil forP. neglectus (HSD0.05 = 1) and 12 versus 6 nematodes/g of soilfor P. thornei (HSD0.05 = 4). Inoculum density of P. neglectuswas significantly greater following winter wheat and spring wheatcompared with fallow (8, 2, and 0.3 nematodes/g of soil, respec-tively; HSD0.05 = 1). In contrast, the inoculum density of P. thorneiwas greatest following spring wheat, intermediate after winterwheat, and lowest following fallow (12, 8, and 7 nematodes/gof soil, respectively; HSD0.05 = 4). When all tillage and crop treat-ment combinations were compared, the density of P. neglectuswas significantly greater after winter wheat in the noncultivatedtreatment than in any other combinations of tillage and rotationalphase (Table 8). For P. thornei, the density was greater afterspring wheat compared with all except one other combinationof tillage and rotation phase; the density after winter wheat crops
in the noncultivated treatment had intermediate densities ofP. thornei (Table 8).When all data for the experiment were grouped (two tillage and
three crop treatments over 2 years; n = 24), there were no strong sig-nificant correlations (R2 > 0.7 and P < 0.0001) between pathogens.This also occurred when data were restricted to the noncultivated till-age treatment, where strongly significant associations were detectedwithin individual crop phases but those associations were alwaysheavily influenced by a single outlier in the small data set (n = 4).A significantly positive correlation in winter wheat occurred betweenthe density of the dominant plant-parasitic nematode P. thornei andthe inoculum concentration of G. graminis var. tritici (R2 = 0.9535,P = 0.0235, n = 4). Similar associations occurred between P. thorneiand either F. culmorum or Pythium spp. clade F. However, the max-imum level of significance occurred when the sum of P. neglectusand P. thornei was used for correlations with F. culmorum (R2 =0.9876, P = 0.0062, n = 4) and Pythium spp. clade F (R2 = 0.9483,P = 0.0262, n = 4).
Fig. 4. Associations between the DNA concentrations of four fungal pathogens and the density of total Pratylenchus spp. (Pratylenchus neglectus plus P. thornei) in the annualcereals experiment (experiment 4). A, Gaeumannomyces graminis var. tritici; data are for both tillage treatments of spring barley or spring wheat during the wettest year (2015). B,Pythium spp. clade F; data are for both tillage treatments of spring wheat or spring barley during the wettest year (2015). C, Rhizoctonia solani AG-8; data are for both years ofspring wheat in the no-tillage treatment. D, Bipolaris sorokiniana; data are for both tillage treatments and both years of spring wheat. E, Total Fusarium spp. (Fusarium culmorumplus F. pseudograminearum) during both years in cultivated annual spring wheat.
1702 Plant Disease /Vol. 100 No. 8

Experiment 7: Organic wheat. The highest densities of B.sorokiniana, Pythium spp. clade F, and R. solaniAG-8 encounteredduring the course of this research occurred in the organic wheat exper-iment (Table 3). Only one of four possible interactions among thecropping system and pulse crop mixture treatments was significant(Table 2). The interaction occurred for F. culmorum and indicated thatDNA concentrations were higher in clover than in medic treatments inthe cover crop system and higher in medic than clover in the intercropsystem. The main effect of crop was also significant for F. culmorum,with more inoculum occurring in the medic than in the clover (3 versus2 pg/g; HSD0.05 = 0.1). Pathogens for which significantmain treatmentdifferences were detected included Pythium spp. clade F, R. solaniAG-8, and P. thornei (Table 2). Inoculum of Pythium spp. was greaterin the cover crop than in the intercrop (267 versus 177 pg/g of soil;HSD0.05 = 62). In contrast, inoculum of R. solaniwas greater in the in-tercrop than cover crop (157 versus 28 pg/g of soil; HSD0.05 = 109).The density of P. thornei was greater in the cover crop than in theintercrop treatment; 11 versus 6 nematodes/g of soil, respectively(HSD0.05 = 5). Phoma pinodella was also detected in this experiment(Table 3) and did not differ significantly among treatments (P = 0.07).Preliminary sampling of this experiment during 2013 was per-
formed using a single composite of clover plus medic samples inthe cover crop and intercrop treatments. For each pathogen, the ear-lier sampling revealed a DNA concentration similar to that shown forthese pathogens during the more comprehensive sampling during2015 (Table 3). As during 2015, the concentration of Pythium spp.during 2013 was higher in the cover crop than the intercrop system(234 versus 176 pg/g, respectively) and the opposite relationshipwas found for R. solani (2 versus 95 pg/g). Samplings during bothyears indicated higher densities of Pratylenchus thornei than ofP. neglectus in both management systems.High densities of weeds occurred in the organic trial and may have
influenced the dynamics of pathogen populations. During 2013,there was a uniformly high density of fiddleneck tarweed (Amsinckialycopsoides Lehm.) and there were lower densities of prickly lettuce(Lactuca serriola L.) and Russian thistle (Salsola tragus L). During2015, the plot area was heavily and uniformly infested by commonlambsquarters (Chenopodium berandieri Moq.) and also had lowerdensities of prickly lettuce and Russian thistle.Experiment 8:Winter wheat tillage. Pathogens for which signif-
icant treatment differences were detected included F. culmorum,F. pseudograminearum, Pythium spp., R. solani AG-8, and P. thornei(Table 2). The only significant treatment interactions occurred forR. solani, for which the location–tillage and tillage–year interactionswere significant. The location–tillage interaction reflected a greaterdifference in inoculum density between chemical fallows at thePendleton and Reese sites (0 versus 79 pg/g, respectively) than
occurred between sweep treatments at those locations (5 versus20 pg/g, respectively). The tillage–year interaction reflected agreater difference in inoculum density between chemical fallowsduring 2013 and 2015 (27 versus 64 pg/g, respectively) than oc-curred between sweep treatments during those years (16 versus10 pg/g, respectively). Significant main treatment effects of loca-tion and tillage also occurred for R. solani. The effect of location in-dicated that inoculum concentration was greater at the Reese site thanat Pendleton: 50 versus 3 pg/g, respectively (HSD0.05 = 20). The inoc-ulum density was also higher in chemical fallow compared with culti-vated fallow (46 versus 13 pg/g; HSD0.05 = 20). The latter effectoccurred in response to a strong difference at the Reese site but notat the Pendleton site (Table 9).When all tillage and crop treatment com-binations were compared for inoculum ofR. solaniAG-8, the inoculumdensity was significantly greater in the no-till system at the Reese sitethan for all other combinations of location and tillage system (Table 9).For F. culmorum, the significant main treatment effect for location
(Table 2) indicated that, whereas inoculum was greater at Pendletonthan at the Reese site (2 versus 0 pg/g; HSD0.05 = 2), the actual con-centrations for F. culmorum were very low at both sites. In contrast,inoculum of F. pseudograminearumwas higher at the Reese site thanat Pendleton (13 versus 3 pg/g; HSD0.05 = 6). A significant treatmenteffect for tillage indicated that the density of F. pseudograminearumwas higher in the cultivated fallow compared with the chemical fal-low (12 versus 5 pg/g; HSD0.05 = 2). When all tillage and crop treat-ment combinations were compared for inoculum of F. culmorum,the inoculum density was significantly greater in the sweep till-age system at Pendleton than for all other combinations of loca-tion and tillage system (Table 9). In contrast, inoculum densityof F. pseudograminearum was greater in the sweep tillage sys-tem at the Reese site than for all other combinations of locationand tillage system (Table 9).For Pythium spp., a significant treatment effect of year (Table 2) in-
dicated that there was a slightly higher inoculum density during 2013compared with 2015 (24 versus 18 pg/g; HSD0.05 = 5). However, therewere no differences in inoculum density for Pythium spp. among anycombination of locations and tillage systems (Table 9).The signif-icant effect of location for P. thornei (Table 2) indicated that the in-oculum density was greater at Pendleton than at the Reese site: 0.7versus 0.1 nematodes/g of soil (HSD0.05 = 0.2). However, the den-sity of nematodes at each location and in each tillage systemwas con-sidered too low to have been of biological importance. There were nostrongly significant correlations among pathogens in this experiment.
DiscussionThis DNA-based survey provided unique insights into the effect of
sustained crop management systems on communities of soilborne
Table 8. Influence of cereals planted into either cultivated or noncultivated3-year rotations on inoculum densities of five soilborne pathogens (experi-ment 6)x
DNA (pg/g) Nema(n/g)
Tillagey Phasez Fp He Rs Pn Pt
No-till WW 20 a 0 b 22 ab 12 a 9 abNo-till SW 8 ab 0 b 44 a 3 b 19 aNo-till Fallow 2 ab 0 b 28 ab 0 c 7 bPlow WW 10 ab 577,904 a 0 b 4 b 6 bPlow SW 6 ab 113,743 ab 0 b 0 c 4 bPlow Fallow 0 b 8,858 b 3 b 0 c 8 b
x Data are 2-year means rounded to the nearest whole unit. Pathogens includeFusarium pseudograminearum (Fp), Helgardia spp. (He), Rhizoctoniasolani Ag-8 (Rs), Pratylenchus neglectus (Pn), and P. thornei (Pt); andnema = nematodes (n = number per gram). Numbers followed by the sameletter within a column are not significantly different at P = 0.05 according toTukey’s honestly significant different test.
y Blocks were managed since 2004 either without tillage (No-till) or with in-version tillage using a moldboard plow (Plow).
z Rotation phase indicates the management of the block prior to sampling; ei-ther crops of winter wheat (WW), spring wheat (SW), or fallow (Fallow).
Table 9. Influence of cereals planted into either cultivated or noncultivatedrotations of winter wheat and fallow at two locations on inoculum densitiesof five soilborne pathogens (experiment 8)x
DNA (pg/g)
Tillagey Locationz Fc Fp Py Rs Pt (n/g)
No-till Pendleton 1 ab 1 b 18 a 0 b 0.7 aSweep Pendleton 3 a 5 b 24 a 5 b 0.8 aNo-till Reese 0 b 8 b 22 a 79 a 0.0 bSweep Reese 0 b 19 a 20 a 20 b 0.1 b
x Data are 2-year means rounded to the nearest whole unit. Pathogens includeFusarium culmorum (Fc), Fusarium pseudograminearum (Fp), Pythiumspp. clade F (Py), Rhizoctonia solani AG-8 (Rs), and Pratylenchus thornei(Pt; n = number of nematodes per gram). Numbers followed by the sameletter within a column are not significantly different at P = 0.05 accordingto Tukey’s honestly significant different test.
y Blocks were managed since 2002 either without tillage (No-till) or with min-imum tillage using a subsurface sweep plow (Sweep).
z Locations were the United States Department of Agriculture–AgriculturalResearch Center northeast of Pendleton, OR (Pendleton) and the Reese sitewest of Pendleton (Reese).
Plant Disease /August 2016 1703

pathogens. The density of inoculum for a broad group of pathogensin these stabilized ecosystems could not have been uniformly identi-fied in any other way. Results of this survey will provide guidance forsubsequent research on pathogen dynamics and root disease com-plexes in semiarid temperate climates.As anticipated, several findings differed from those reported for
shorter-term experiments in which ecosystems were in a state of tran-sition following changes from one farming practice to another (Paulitzet al. 2010; Schroeder and Paulitz 2006). Likewise, the relative den-sities of inocula for some pathogens were sometimes poorly relatedto previous observations of root diseases in these experiments(Smiley et al. 1996a). Paulitz et al. (2010) also reported poor relation-ships between pathogen inoculum density and incidence or severityof root diseases of wheat in the PNW. The diseases caused by thesoilborne pathogens in these experiments are strongly affected by en-vironmental conditions (Okubara et al. 2014; Paulitz et al. 2010;Poole et al. 2013, 2015; Smiley 2009a; Smiley et al. 1996a). In viewof the different precipitation patterns that occurred over 2 years ofthis study, we anticipated that the main treatment effect for yearwould have been significant for far more than the 9% of cross-yearcomparisons detected in these apparently well-stabilized long-termexperiments.The sampling intensity was very high for this survey (12 to 1,000
cores/ha). The combination of high-density sampling and extractionof DNA from the entire 400- to 500-g sample was presumed to besufficient to minimize variability, which is thought to be much higherwith low sampling intensities and extraction of DNA from 0.5 g orless of each composite sample (Okubara et al. 2008, 2015; Schroederand Paulitz 2006; Yan et al. 2012).Pathogen inoculum densities reported by the PreDicta B assay
have been associated with risks of potential yield reductions fromdiseases in Australia (McKay et al. 2008). We could not directly ap-ply the risk assessments because the disease process for each patho-gen would be expected to differ in response to differences in soils,climates, and agronomic practices between Australia and the PNW.Also, our sampling procedure differed from that which was used toestablish the PreDicta B’s DNA-by-disease risk associations. Sam-ples in Australia were taken to a depth of 10 cm (Evans and McKay2012; McKay et al. 2008; Poole et al. 2015) and our samples weretaken to a depth of 20 cm based upon our knowledge of the verticaldistribution of Pratylenchus spp. in the silt loams we evaluated(Smiley et al. 2008). Because the upper 12 cm is the zone of highestconcentration of inoculum for the fungal pathogens but not for root-lesion nematodes in the fields we studied (R. W. Smiley, unpub-lished) (Smiley et al. 2008), our samplingmethod presumably dilutedthe apparent peak DNA concentrations of fungal inocula in the upperprofile. Nevertheless, the DNA concentrations reported for patho-gens in this study were comparable with those reported for shallowersamples in Australia (Poole et al. 2015) and in the PNW (Okubaraet al. 2014; Paulitz et al. 2010).The DNA assay used for this study provided important informa-
tion regarding the complexity of pathogen dynamics occurring inmultiple stabile ecosystems at a single location. That the ecosystemsare relatively stable was indicated by a relative scarcity of significantdifferences across two sampling years that had important differencesin rainfall amounts and distributions before our soil samples werecollected. Key findings specific to individual pathogens are dis-cussed below.B. sorokiniana. Common root rot was not detected during the pre-
vious survey of diseases in these long-term experiments (Smiley et al.1996a). Inoculum of B. sorokiniana in this study was not detected inany experiment in which winter wheat was the only small grain cropproduced (experiments 1, 2, 3, and 8). This pathogen was also not de-tected in the 3-year rotation of winter wheat, spring wheat, and fallow(experiment 6). Inoculum of B. sorokiniana was found at sometimeshigh densities in experiments where spring cereals were the onlysmall grain crop: the annual spring wheat (experiment 4) and the or-ganic spring wheat (experiment 7). In the annual spring cereals plant-ings, the inoculum density was greater in spring wheat than in springbarley. Because more than 90% of wheat produced in Oregon is
winter wheat, these results help to explain why common root rot iscurrently a minor component of the crown and root disease complexin the PNW (Smiley and Patterson 1996) compared with other geo-graphic regions in which spring wheat is the dominant crop (Bockuset al. 2010; Smiley et al. 2009).D. tritici-repentis. The tan spot pathogen was previously not
known to be present in the long-term experiments at Pendleton. Dur-ing 2015, this pathogen was detected in three experiments: theconservation-tillage treatment of the wheat-pea rotation (experiment3), the no-till annual spring wheat (experiment 4), and the perennialgrass pasture (experiment 5). This detection was important in that itappears to be the first formal report ofD. tritici-repentis in the regionof eastern Oregon where these experiments are located, and whereagriculture is transitioning to more sustainable cropping systems thatretain greater amounts of cereal stubble above the soil surface.Stubble-retention systems are known to favor an increasing incidenceand severity of tan spot (De Wolf et al. 1998). A heightened aware-ness of tan spot is warranted in the semiarid wheat-producing regionof the PNW.F. culmorum and F. pseudograminearum. Crown rot is wide-
spread and is economically important throughout the PNW (Cook1981; Poole et al. 2013; Smiley 2009a; Smiley and Patterson 1996;Smiley et al. 1996a, 2013b). Substantial concentrations of DNA ofFusarium spp. were detected in four experiments, with F. culmorumbeing the dominant species in experiment 4 (annual cereals) andF. pseudograminearum being the dominant specie in experiment 5(pasture versus wheat), experiment 6 (3-year rotation), and experiment8 (winter wheat tillage). In the annual cereals experiment, there werestrong tillage–crop interactions; inoculum of F. culmorum was highonly in cultivated annual spring wheat and in no-till annual springbarley, and inoculum of F. pseudograminearum was high only incultivated annual winter wheat. We previously reported similar find-ings from another long-term experiment where F. pseudograminearumwas dominant in a winter wheat-cultivated fallow sequence and inno-till annual winter wheat, whereas a more balanced density ofF. pseudograminearum and F. culmorum occurred in no-till annualspringwheat, no-till annual spring barley, and in a 3-year no-till rotationof winter wheat, spring barley, and chemical fallow (Smiley et al.2013b). Supportive evidence for the selective process for these speciesoccurred in the 3-year rotation (experiment 6), where the concentrationof F. pseudograminearum was higher following winter wheat thanspring wheat, with the density declining to very low concentrations dur-ing the fallow phase. There were no treatment effects onF. culmorum inthat experiment. It appears that winterwheat and spring cereals are exert-ing a selective influence on the dominances of Fusarium spp., whichadds complexity to climatic variables that also influence the incidenceand severity of crown rot in the PNW (Poole et al. 2013; Smiley 2009a).In the comparison with fallow management practices with the same
winter wheat cultivar (Bobtail) at two locations (experiment 8), we de-tected more F. culmorum at the cooler, wetter site (Pendleton) and moreF. pseudograminearum at the warmer, drier site (Reese), supporting pre-vious observations regarding effects of climate on these species (Cook1968; Poole et al. 2013; Smiley and Patterson 1996). At the Reese site,the concentration of F. pseudograminearumwas higher in the cultivatedfallow compared with no-till fallow. Because the greatest amount of in-oculum for theseFusarium spp. occurs in lower culm tissue (Evans et al.2012; Hogg et al. 2010), it is possible that, in our samplings, a smallerproportion of stem tissuemay have been sampled in no-till systems com-pared with samplings from soils in which tillage had buried inoculum-bearing stem tissue during previous crop years. These Fusarium spp.persist very well in buried straw (Evans 2012).We did not anticipate detection of both Fusarium spp. at only very
low concentrations in three of the eight experiments (experiments 2,3, and 7). It is not known why such low values occurred in a regionwhere crown rot is common. The low values were unlikely to havebeen a response to repeated plantings of the small grain cultivars usedin these experiments because the springwheat andwinterwheat cultivarsin these experiments are each known to be susceptible to Fusariumcrown rot, although specific differential responses toF. culmorum versusF. pseudograminearum have not been investigated. Also, a low
1704 Plant Disease /Vol. 100 No. 8

detection level of Fusarium spp. in the five experiments was unlikelyto have been due to an inability to detect one or both of these speciesusing the PreDicta B analysis, as shown by the detection of both spe-cies at relatively high inoculum densities in certain treatments of fiveexperiments (experiments 1, 4, 5, 6, and 8). For the tillage-fertilityexperiment (experiment 2), increasing densities of F. culmorum co-incided with increasing rates of N application, corresponding to asimilar trend for expression of whiteheads caused by crown rot(Smiley et al. 1996a). However, presumably because the inoculumconcentrations were too low, we did not measure differences of Fusa-rium spp. among tillage treatments, which contrasted with observationsof a direct relationship between increasing amounts of surface residueand damage by crown rot (Smiley et al. 1996a; Summerell et al. 1989).G. graminis var. tritici. Inoculum of the take-all pathogen differed
among treatments in five of eight experiments. In the annual cerealsexperiment (experiment 4), significantly higher inoculum densitieswere detected in cultivated than in the noncultivated cropping sys-tems. This is in contrast to the development of greater take-all diseasein no-till than cultivated soil in easternWashington (Cook et al. 2002;Moore and Cook 1984; Paulitz et al. 2002) but is consistent withother reports of tillage effects on take-all (Folwell et al. 1991;Schroeder and Paulitz 2006; Yarham 1981). We also noted that thegreatest inoculum density occurred in cultivated winter wheat com-pared with cultivated spring wheat or spring barley. Our sampleswere collected directly in the rows during early spring before springcrop subplots had been plowed prior to planting, and when winterwheat subplots had been plowed and planted 4 to 5 months earlier.Inoculum of G. graminis var. tritici could have become amplifiedon winter wheat subjected to slow growth rates during winter, caus-ing apparent differences that might not have been detected if all soilswere sampled at the same plant growth stage or following harvest. Inthe noncultivated treatment of the annual cereals block, we detectedvery little G. graminis var. tritici when samples were collected fol-lowing wheat and barley planted annually for 18 years. Additionalstudy is warranted to determine whether take-all decline (Shipton1975) has become established in the no-till annual cereals block.In the fertility management experiment (experiment 1), the inocu-
lum density was either nondetectable or low in all except one treat-ment, the stubble burning treatment (90 N+burn) following thewheat phase of the rotation. That burn treatment was previouslynoted for a lowmicrobial diversity and low concentrations of organicC and N (Collins et al. 1992; Rasmussen and Smiley 1996). The take-all pathogen was not detectable following the fallow phase of thattreatment. During an earlier disease survey (Smiley et al. 1996a),take-all became damaging in only that same treatment, the 90N+burn. Removal of stubble by burning typically does not enhanceor suppress the incidence or severity of take-all in short-term exper-iments (Shipton 1975; Yarham 1981). We previously speculated(Smiley et al. 1996a) that modification of the microbial biomass andthe soil chemical and physical qualities of soil by repetitive burningmay have resulted in microbe–host–parasite interactions quite differ-ent from those in short-term investigations. The inoculum densitydata reported here support the hypothesis that the pathogen is capableof rapidly colonizing wheat roots due to low levels of microbial com-petition or antagonism in this stubble-burn treatment, providing thepathogen a greater opportunity for increasing its inoculum densityduring each wheat cycle, compared with treatments where stubbleis retained and soil organic constituents and microbial diversity aremore robust. These relationships warrant further investigation.We found low concentrations of G. graminis var. tritici inoculum
in a pasture established during 1931, providing supportive evidencethat grasslands in the semiarid PNW support the survival of this path-ogen and can potentially provide inoculum when grasslands are con-verted into crop production. This has been an especially importantproblem when former semiarid grasslands were converted to produc-tion of irrigated small grains, in which take-all then became commonand particularly severe (Cook et al. 1968).Helgardia spp. The eyespot pathogens that include Helgardia
acuformis and H. herpotrichoides are also known as Oculimaculaacuformis and O. yallundae, respectively (Murray 2010). Both
pathogens occur mostly on winter wheat in the PNW (Dyer et al.2001;Murray 2010). In this research, the pathogen inoculum concen-trations were evaluated on the same winter wheat experiments inwhich we used visual symptoms to evaluate eyespot incidence andseverity two decades earlier (Smiley et al. 1996a). In the present sur-vey, we found that the pathogen was detected in but did not differamong treatments in any experiment in which winter wheat wasthe only cereal produced either during alternate years (experiments1, 2, 3, and 8) or annually (experiment 5). We did not detect the path-ogen in any of the annual winter wheat treatments (experiments 4 and5). In experiment 6, we detected the pathogen in the pasture but not inthe no-till winter wheat. The 3-year rotation (experiment 6) was theonly trial in which inoculum density of Helgardia spp. differedamong treatments: none was detected in any phase of the no-tillblock, and inoculum was high following winter wheat in the culti-vated block and diminished greatly each year during the spring wheatand chemical fallow phases of the rotation. The winter wheat culti-vars we planted were either moderately resistant (ORCF 102; exper-iments 1 to 7) or susceptible (Bobtail; experiment 8) to eyespot.Potential biological antagonisms against Helgardia spp. should beexamined to determine why these species were not detected in anyof these annual wheat plantings. This research also provided evi-dence that at least some grasslands can serve as a localized sourceof inoculum for these pathogens.Phoma pinodella. This seed- and residue-borne, soil-persistent
pathogen was detected only in plots treated with pea vines in the fer-tility management experiment (experiment 1), in all treatments of thewheat-pea rotation (experiment 3), and in the organic spring wheatexperiment that includes intercrops or cover crops of clover andmedic (experiment 7). In the wheat-pea rotation, inoculum levelswere higher following pea than wheat, were higher under conserva-tion tillage than inversion tillage, and were highest during the wettestyear. These principles are well established (Bretag and Ramsey2001) but this pathogen, which is a component of the fungal complexcausing Ascochyta blight, was not previously known to be a compo-nent of the legume foot rot complex at the experimental site. Like-wise, in a similar survey of pathogen DNA at a much lower rainfallsite in Oregon (Smiley et al. 2013b), Phoma pinodella was detectedonly in a winter wheat-winter pea rotation. Research is needed to de-termine whether this pathogen limits production of pulse crops insemiarid regions of the PNW.Pratylenchus neglectus and P. thornei. Effects of root-lesion
nematodes on small grain cereals have been studied intensively inthe PNW during the past decade (Smiley and Nicol 2009; Smileyet al. 2004, 2013a). One or both species of these Pratylenchus spp.were detected in high densities in all eight experiments (e.g., >2nematodes/g of soil). Differences in nematode density occurredamong treatments in each experiment, except the comparison of pas-ture versus no-till winter wheat. Inoculum densities for Pratylenchusneglectus, P. thornei, or both, were sufficient to indicate a potentialrisk for reduced wheat yields in at least some treatments of all eightexperiments. We recently reported inverse relationships betweenPratylenchus spp. density and yield of wheat (Smiley 2009b; Smileyand Machado 2009; Smiley et al. 2004, 2005a,b). We also reported areduced capacity of wheat roots to extract water from the soil profilein plots with the highest densities of P. neglectus (Smiley andMachado 2009), and a high correlation between densities of Praty-lenchus spp. assayed by qPCR and by traditional extraction and iden-tification methods (Smiley et al. 2013a). These results reemphasizethat Pratylenchus spp. must be considered among important diseasesthat influence yields of wheat and other crops in low-rainfall environ-ments (Smiley et al. 2014b).Results from the current survey supported our previous observa-
tions that P. neglectus is favored by winter wheat and P. thornei isfavored by spring wheat (Smiley et al. 2013a, 2014a). P. neglectuswas dominant over P. thornei in the annual winter wheat, in the cul-tivated winter wheat-spring pea rotation, and in the fertility manage-ment and tillage-fertility experiments. P. thorneiwas dominant in thespring wheat and spring barley subplots of the annual cereals exper-iments and in the organic wheat experiment which is planted to
Plant Disease /August 2016 1705

spring wheat and pulse crops. Our findings from long-term experi-ments in two contrasting precipitation zones provide potential expla-nations for reports from adjacent farms in southeast Idaho, whichhave dominance of either P. neglectus or P. thornei, with the onlyknown difference being that one farm produces only winter wheatand the other farm produces only spring wheat (R. W. Smiley, unre-ported communications with wheat producers). This aspect of Praty-lenchus spp. management requires greater investigation to minimizethe level of risk because wheat cultivars differ in resistance as well astolerance to these two Pratylenchus spp. (Smiley and Nicol 2009;Thompson et al. 2008; Vanstone et al. 2008). This also underscoresthe importance of developing cultivars with dual-species resistance(Thompson et al. 2015) and, until that is accomplished, of developingspecies-specific diagnostic methods (Yan et al. 2012, 2013) for use innematode diagnostic laboratories. Likewise, it is important to deter-mine the mechanisms of this species-specific selection pressure bycultivars of wheat and other field crops (Smiley et al. 2014b).Pythium spp. (clade F).Without treatment of planted seed with an
appropriate fungicide, Pythium seed rot, seedling damping-off, androot rot occur widely across the low-precipitation regions of thePNW (Chamswarng and Cook 1985; Ingram and Cook 1990; Paulitzet al. 2002; Smiley et al. 1996b). Therefore, nearly all wheat seed inthe PNW is treated with either metalaxyl or mefenoxam to suppressthe seed and seedling phases of Pythium diseases (Smiley et al.1996b). Species within clade F (LeVesque and De Cock 2004) thatare pathogenic to small grains and known to be present in thePNW include Pythium appressorium, P. debaryanum, P. intermedium,P. irregulare, P. paroecandrum, and P. sylvaticum (Higginbotham et al.2004; Paulitz and Adams 2003; Schroeder et al. 2006). High concentra-tions of DNA of Pythium spp. clade F were detected in at least sometreatments of most experiments, and concentrations were influencedby one or more treatments or interactions in six of eight experiments.In the fertility management experiment (experiment 1), the inocu-
lum density in the fallow which followed winter wheat was higher inthe manure and pea vine treatments than in other treatments. How-ever, the density became essentially equal in all treatments whenseedling winter wheat was sampled following the 14-month cultivatedfallow. Cook et al. (1987) reported that burning straw in a wheat-fallow rotation reduced inoculum density of Pythium spp. and increasedwheat plant growth. A reduced microbial biomass and a less diverse mi-crobial composition in long-term burn treatments (Collins et al. 1992)may have favored activity of Pythium spp. in a manner that negatedadvantages gained by reducing the Pythium population when straw isburned in shorter-term experiments.It has been reported that inoculum density of Pythium spp. was
comparable among tillage systems in shorter-term experiments (Cooket al. 1990; Schroeder and Paulitz 2006). In the tillage-fertility experi-ment (experiment 2), the inoculum density was higher at the lowest Napplication rates and in the tillage treatments having the highest amountof surface residue. Soil acidification due to application of N fertilizer inthis experiment is more intense in the higher than in the lower N treat-ments, and organic C and N are greater in the soils where acidificationis most intense (Rasmussen and Smiley 1994). Associations betweenPythium inoculum density and soil chemical and microbial propertiesshould be investigated.R. solani AG-8. Rhizoctonia root rot occurs throughout the low-
rainfall regions of the PNW (Okubara et al. 2014; Paulitz et al.2002; Smiley et al. 2009). Inoculum of this pathogen differed signif-icantly among treatments or interactions in five of eight experiments.Inoculum occurred at low concentrations in three experiments (ex-periments 1, 2, and 8), where winter wheat was alternated with a14-month fallow period. In experiment 8, the inoculum densitywas greater in the chemical fallow than the cultivated fallow in thewinter wheat-fallow rotation at the Reese site. In contrast, inoculumwas much greater in the plow than in the conservation treatment ofthe winter wheat-spring pea rotation (experiment 3) at Pendleton. Itis generally recognized that Rhizoctonia root rot becomes more dam-aging in noncultivated than in cultivated cereals (Paulitz et al. 2002;Smiley et al. 2009). In shorter-term studies, this disease typically alsobecomes more pronounced with successive cereal crops (Schroeder
and Paulitz 2006) but, at some point, begins to become moderatedthrough a disease decline phenomenon presumed to involve micro-bial processes. In this study, the effect of tillage was particularly pro-nounced in experiments 6 and 8. In experiment 6, at Pendleton, theinoculum concentration was high in the noncultivated treatmentand was barely detectable in the cultivated treatment. A similar pat-tern occurred at the Reese site in experiment 8, where the inoculumconcentration was high in the no-till treatment and much lower in thesweep-tillage treatment. The inoculum concentrations detected par-ticularly in noncultivated soils in this study were within the range re-ported for severely affected fields in the region (Okubara et al. 2008).In experiment 6, we also detected an increasing inoculum densityduring the two successive years of wheat in the 3-year rotation ofwinter wheat-spring wheat-chemical fallow. The main treatment ef-fect for year was significant for R. solani AG-8 in only one experi-ment (experiment 5). In that experiment, the concentration of DNAwas much greater during the wetter (2015) than the drier (2013) year,which is contrary to reports by Okubara et al. (2015) and Poole et al.(2015).A lack of direct relationship between inoculum concentration and
disease occurrence in noncultivated soils has been reported (Paulitzet al. 2010). Okubara et al. (2015) found no relationship between till-age and the concentration of DNA for R. solani AG-8, although sap-rophytic growth and survival of R. solani AG-8 in soil have beenshown to be reduced by tillage (Gill et al. 2001; Rovira 1986). Ourprevious assays of diseases in these experiments showed that Rhizoc-tonia root rot incidence and severity in the wheat-pea rotation wereunaffected by tillage (Smiley et al. 1996a) and that the microbial bio-mass in those treatments was inversely correlated with incidence andseverity of Rhizoctonia root rot. In the present survey, we also foundthat the DNA concentration of R. solani AG-8 was much greater fol-lowing the wheat than the pea phase of the winter wheat-pea rotation.Okubara et al. (2015) also reported that inoculum density of this path-ogen was greatly reduced following growth of all broadleaf crops.Complex interactions between suppressive microbes and R. solaniAG-8 are likely to have a strong influence on both inoculum densityand disease occurrence, and these relationships warrant comprehen-sive evaluation as cropping systems in the PNW evolve toward moresustainable production systems.Interactions of pathogens. Castillo and Vovlas (2007) summa-
rized reports of interactions between Pratylenchus spp. and eitherR. solani or G. graminis var. tritici. Occurrences of important inter-actions between Pratylenchus thornei and either F. culmorum orF. pseudograminearum were recently reported (Hajihassani et al.2013; Simpfendorfer et al. 2012).We illustrated a positive interactionbetween Pratylenchus spp. and F. culmorum + F. pseudograminea-rum, and between Pratylenchus spp. and R. solaniAG-8 (Fig. 4). Wealso detected a negative association between Pratylenchus spp. andB. sorokiniana, and both positive and negative associations betweenPratylenchus spp. and G. graminis var. tritici and between Pratylen-chus spp. and Pythium spp. clade F (Fig. 4). Poole et al. (2015) alsoevaluated pathogen DNA in soil and the associated climatic con-ditions over time to provide evidence of competitive interactionsamong soilborne plant pathogens. Roberts and Sivasithamparam(1987) suggested that combinations of fungal pathogens may bemore associated with the expression of symptoms of Rhizoctoniaroot rot than the effects of R. solani AG-8 acting alone. We detecteda positive association between F. culmorum and G. graminis var. tri-tici, and both positive and negative associations between P. neglectusand P. thornei (Fig. 3). A greater understanding of interactionsamong these soilborne pathogens and among soil ecosystems is im-perative for improving holistic management practices for diseases offield crops in the PNW.Conclusion. Results of this survey illustrated that influences of
cropping systems on densities of fungal and nematode pathogensare complex and still poorly understood. Recent use of qPCR to eval-uate pathogen inoculum densities in the PNW soils (Paulitz et al.2010; Smiley et al. 2013a,b) have begun to reveal many new findingsthat will provide additional guidance for research aimed at improvingthe efficiency of crop production. The comparative uniformity of
1706 Plant Disease /Vol. 100 No. 8

Pythium and Rhizoctonia inoculum levels we detected among vari-ous tillage and cropping systems was reported previously in areasof higher precipitation or irrigated agriculture (Paulitz et al. 2010;Schroeder and Paulitz 2006) and also in areas of low precipitation(Smiley et al. 2013b). The pathogen Phoma pinodella warrants fur-ther scrutiny as a previously unsuspected component of the diseasecomplex of food legume crops in semiarid regions of the PNW. Fur-ther observations are justified to determine whether this pathogen re-stricts yields of food legume crops in the PNW. Likewise, detectionof the previously unreported tan spot pathogen, D. tritici-repentis,provides reason to be alert for establishment of this pathogen inwheat-producing areas of the semiarid PNW.We provided additionalevidence that winter wheat and spring crops exert differential selec-tion pressures on populations of Fusarium spp. and Pratylenchusspp. Associations between fungal pathogens and between fungalpathogens and plant-parasitic nematode species must also be evalu-ated more fully in future research.
AcknowledgmentsFunding was provided by the Oregon State University Agricultural Research
Foundation, Oregon Agricultural Experiment Station, United States Departmentof Agriculture–Agricultural Research Service, and a discounted analysis fee bythe Root Disease Testing Service of the South Australian Research and Develop-ment Institute. Sampling assistance was contributed by J. Gourlie, M. Chandler,M. Baxter, G. Yan, L. Pritchett, A. Spence, E. Torres, and M. Wuest.
Literature CitedBentley, A. R., Leslie, J. F., Liew, E. C. Y., Burgess, L. W., and Summerell, B. A.
2008. Genetic structure of Fusarium pseudograminearum populations from theAustralian grain belt. Phytopathology 98:250-255.
Bithell, S. L., McKay, A., Butler, R. C., Herdina, Ophel-Keller, K., Hartley, D.,and Cromey, M. G. 2012. Predicting take-all severity in second-year wheatusing soil DNA concentrations of Gaeumannomyces graminis var. triticidetermined with qPCR. Plant Dis. 96:443-451.
Bockus, W. W., Bowden, R. L., Hunger, R. M., Morrill, W. L., Murray, T. D., andSmiley, R. W., eds. 2010. Compendium of Wheat Diseases and Pests, 3rd ed.American Phytopathological Society, St. Paul, MN.
Bretag, T. W., and Ramsey, M. 2001. Foliar diseases caused by fungi: Ascochytaspp. Pages 24-28 in: Compendium of Pea Diseases, 2nd ed. J. M. Kraft and F. L.Pfleger, eds. American Phytopathological Society, St. Paul, MN.
Castillo, P., and Vovlas, N. 2007. Pratylenchus (Nematoda, Pratylenchidae):Diagnosis, Biology, Pathogenicity and Management. American PhytopathologicalSociety, St. Paul, MN.
Chamswarng, C., and Cook, R. J. 1985. Identification and comparativepathogenicity of Pythium species from wheat roots and wheat-field soils inthe Pacific Northwest. Phytopathology 75:821-827.
Collins, H. C., Rasmussen, P. E., and Douglas, C. L., Jr. 1992. Crop residuemanagement effects on soil carbon and microbial dynamics. Soil Sci. Soc.Am. J. 56:783-788.
Cook, R. J. 1968. Fusarium root and foot rot of cereals in the Pacific Northwest.Phytopathology 58:127-131.
Cook, R. J. 1981. Fusarium diseases of wheat and other small grains in NorthAmerica. Pages 39-52 in: Fusarium: Diseases, Biology, and Taxonomy. P. E.Nelson, T. A. Toussoun, and R. J. Cook, eds. The Pennsylvania StateUniversity Press, University Park.
Cook, R. J., Chamswarng, C., and Tang, W. H. 1990. Influence of wheat chaff andtillage on Pythium populations in soil and Pythium damage to wheat. Soil Biol.Biochem. 22:939-947.
Cook, R. J., Huber, D., Powelson, R. L., and Bruehl, G. W. 1968. Occurrence oftake-all in wheat in the Pacific Northwest. Plant Dis. Rep. 52:716-718.
Cook, R. J., Schillinger, W. F., and Christensen, N. W. 2002. Rhizoctonia root rotand take-all of wheat in diverse direct-seed spring cropping systems. Can. J.Plant Pathol. 24:349-358.
Cook, R. J., Sitton, J. W., and Haglund,W. A. 1987. Influence of soil treatments ongrowth and yield of wheat and implications for control of Pythium root rot.Phytopathology 77:1192-1198.
De Wolf, E. D., Effertz, R. J., Ali, S., and Francl, L. J. 1998. Vistas of tan spotresearch. Can. J. Plant Pathol. 20:349-370.
Duff, B., Rasmussen, P. E., and Smiley, R. W. 1995. Wheat/fallow systems inthe semi-arid regions of Pacific NW America. Pages 85-111 in: AgriculturalSustainability: Economic, Environmental and Statistical Considerations.V. Barnett, R. Payne, and R. Steiner, eds. John Wiley & Sons, London.
Dyer, P. S., Furneaux, P. A., Douhan, G., and Murray, T. D. 2001. A multiplexPCR test for determination of mating type applied to the plant pathogensTapesia yallundae and Tapesia acuformis. Fungal Genet. Biol. 33:173-180.
Evans, M. L. 2012. Changes in Fusarium pseudograminearumDNA concentrations incereal residues and soil over summer and autumn. Page 28 in: Proc. First Int. Crown
Rot Workshop, Narrabri, New South Wales, Australia. R. I. S. Brettell and J. M.Nicol, eds. Grains Research and Development Corp., Canberra, Australia.
Evans, M. L., and McKay, A. 2012. Quantitative polymerase chain reaction as atool in field research. Page 78 in: Proc. First Int. Crown Rot Workshop,Narrabri, New South Wales, Australia. R. I. S. Brettell and J. M. Nicol, eds.Grains Research and Development Corp., Canberra, Australia.
Evans, M. L., Wallwork, H., and Naglis, G. 2012. Vertical distribution ofFusarium pseudograminearum and F. culmorum DNA in cereal plants. Page29 in: Proc. First Int. Crown Rot Workshop, Narrabri, New South Wales,Australia. R. I. S. Brettell and J. M. Nicol, eds. Grains Research andDevelopment Corp., Canberra, Australia.
Folwell, R. J., Cook, R. J., Heim, M. N., and Moore, D. L. 1991. Economicsignificance of take-all on winter wheat in the Pacific Northwest USA. CropProt. 10:391-395.
Gill, J. S., Sivasithamparam, K., and Smettem, K. R. J. 2001. Influence of depth ofsoil disturbance on root growth dynamics of wheat seedlings associated withRhizoctonia solani AG-8 disease severity in sandy and loamy soils of WesternAustralia. Soil Tillage Res. 62:73-83.
Hajihassani, A., Smiley, R. W., and Afshar, F. J. 2013. Effects of co-inoculationswith Pratylenchus thornei and Fusarium culmorum on growth and yield ofwinter wheat. Plant Dis. 97:1470-1477.
Higginbotham, R. W., Paulitz, T. C., and Kidwell, K. K. 2004. Virulence ofPythium species isolated from wheat fields in eastern Washington. Plant Dis.88:1021-1026.
Hogg, A. C., Kephart, K. D., Dyer, A. T., Klouser, L., Johnston, R. H., andJohnston, J. A. 2010. Monitoring Fusarium crown rot populations in springwheat residues using quantitative real-time polymerase chain reaction. Phyto-pathology 100:49-57.
Ingram, D. M., and Cook, R. J. 1990. Pathogenicity of four Pythium species towheat, barley, peas and lentils. Plant Pathol. 39:110-117.
LeVesque, C. A., and De Cock, W. A. M. 2004. Molecular phylogeny andtaxonomy of the genus Pythium. Mycol. Res. 108:1363-1383.
Lucas, P., Smiley, R. W., and Collins, H. E. 1993. Decline of Rhizoctonia root roton wheat in soils infested with Rhizoctonia solani AG-8. Phytopathology 83:260-265.
Machado, S. 2011. Soil organic carbon dynamics in the Pendleton long-termexperiments: Implications for biofuel production in Pacific Northwest.Agron. J. 103:253-260.
Machado, S., Petrie, S., Rhinhart, K., and Qu, A. 2007. Long-term continuouscropping in the Pacific Northwest: Tillage and fertilizer effects on winterwheat, spring wheat, and spring barley. Soil Tillage Res. 94:473-481.
Machado, S., Petrie, S., Rhinhart, K., and Ramig, R. E. 2008. Tillage effects onwater use and grain yield of winter wheat and green pea in rotation. Agron. J.100:154-162.
McKay, A., Roget, D., Hannam, R., and Ophel Keller, K., eds. 2008. Root DiseaseRisk Management Resource Manual. South Australian Research and Develop-ment Institute, Glen Osmond, South Australia.
Mitchell, C. C.,Westerman, R. L., Brown, J. R., and Peck, T. R. 1991. Overview oflong-term agronomic research. Agron. J. 83:24-29.
Moore, K. J., and Cook, R. J. 1984. Increased take-all of wheat with direct drillingin the Pacific Northwest. Phytopathology 74:1044-1049.
Murray, T. D. 2010. Eyespot (strawbreaker foot rot). Pages 32-34 in: Compendiumof Wheat Diseases and Pests, 3rd ed. W. W. Bockus, R. L. Bowden, R. M.Hunger, W. L. Morrill, T. D. Murray, and R. W. Smiley, eds. AmericanPhytopathological Society, St. Paul, MN.
Okubara, P. A., Schroeder, K. L., Abatzoglou, J. T., and Paulitz, T. C. 2014.Agroecological factors correlated to soil DNA concentrations of Rhizoctoniain dryland wheat production zones of Washington State, USA. Phytopathology104:683-691.
Okubara, P. A., Schroeder, K. L., and Paulitz, T. C. 2008. Identification andquantification of Rhizoctonia solani and R. oryzae using real-time polymerasechain reaction. Phytopathology 98:837-847.
Ophel-Keller, K., Hartley, D., McKay, A., Herdina, and Curran, J. 2008.Development of a routine DNA-based testing service for soilborne diseasesin Australia. Australas. Plant Pathol. 37:243-253.
Paulitz, T. C., and Adams, K. 2003. Composition and distribution of Pythiumcommunities in wheat fields in eastern Washington State. Phytopathology 93:867-873.
Paulitz, T. C., Schroeder, K. L., and Schillinger, W. F. 2010. Soilborne pathogensof cereals in an irrigated cropping system: Effects of tillage, residuemanagement, and crop rotation. Plant Dis. 94:61-68.
Paulitz, T. C., Smiley, R. W., and Cook, R. J. 2002. Insights into the prevalenceand management of soilborne cereal pathogens under direct seeding in thePacific Northwest, U.S.A. Can. J. Plant Pathol. 24:416-428.
Pikul, J. L., Jr., and Allmaras, R. R. 1986. Physical and chemical properties of ahaploxeroll after fifty years of residue management. Soil Sci. Soc. Am. J. 50:214-219.
Poole, G. J., Harries, M., Huberli, D., Miyan, S., MacLeod, W. J., Lawes, R., andMcKay, A. 2015. Predicting cereal root disease in Western Australia using soilDNA and environmental parameters. Phytopathology 105:1069-1079.
Poole, G. J., Smiley, R. W., Walker, C., Huggins, D., Rupp, R., Abatzoglou, J.,Garland-Campbell, K., and Paulitz, T. C. 2013. Effect of climate on the
Plant Disease /August 2016 1707

distribution of Fusarium spp. causing crown rot of wheat in the PacificNorthwest of the United States. Phytopathology 103:1130-1140.
Rasmussen, P. E., and Collins, H. C. 1991. Long-term impacts of tillage, fertilizer,and crop residue on soil organic matter in temperate semiarid regions. Adv.Agron. 45:93-134.
Rasmussen, P. E., and Rohde, C. R. 1988. Long-term tillage and nitrogenfertilization effects on organic nitrogen and carbon in a semiarid soil. SoilSci. Soc. Am. J. 52:1114-1117.
Rasmussen, P. E., and Rohde, C. R. 1989. Soil acidification from ammonium-nitrogen fertilization in moldboard plow and stubble-mulch wheat-fallowtillage. Soil Sci. Soc. Am. J. 53:119-122.
Rasmussen, P. E., and Smiley, R. W. 1994. Long-term management effects on soilproductivity and crop yield in semi-arid regions of eastern Oregon. OregonAgric. Exp. Stn. Bull. 675. Oregon State University, Corvallis.
Rasmussen, P. E., and Smiley, R. W. 1996. Soil carbon and nitrogen change inlong-term agricultural experiments at Pendleton, Oregon. Pages 353-360 in:Soil Organic Matter in Temperate Agroecosystems. E. A. Paul, K. Paustian,E. T. Elliot, and C. V. Cole, eds. CRC Press, Boca Raton, FL.
Roberts, F. A., and Sivasithamparam, K. 1987. Effect of interaction of Rhizoctoniaspp. with other fungi from cereal bare patches on root rot of wheat. Trans. Br.Mycol. Soc. 89:256-259.
Rovira, A. D. 1986. Influence of crop rotation and tillage on Rhizoctonia barepatch of wheat. Phytopathology 76:669-673.
Schroeder, K. L., Okubara, P. A., Tambong, J. T., Levesque, C. A., and Paulitz,T. A. 2006. Identification and quantification of pathogenic Pythium spp. fromsoils in eastern Washington using real-time polymerase chain reaction.Phytopathology 96:637-647.
Schroeder, K. L., and Paulitz, T. C. 2006. Root diseases of wheat and barley duringthe transition from conventional tillage to direct seeding. Plant Dis. 90:1247-1253.
Shipton, P. J. 1975. Take-all decline during cereal monoculture. Pages 137-144 in:Biology and Control of Soilborne Pathogens. G. W. Bruehl, ed. AmericanPhytopathological Society, St. Paul, MN.
Simpfendorfer, S., McMullen, G., and Brill, R. 2012. Interaction of crown rot withroot-lesion nematodes. Page 34 in: Proc. First Int. Crown Rot Workshop,Narrabri, New South Wales, Australia. R. I. S. Brettell and J. M. Nicol, eds.Grains Research and Development Corp., Canberra, Australia.
Smiley, R. W. 2009a. Water and temperature parameters associated with winterwheat diseases caused by soilborne pathogens. Plant Dis. 93:73-80.
Smiley, R. W. 2009b. Root-lesion nematodes reduce yield of intolerant wheat andbarley. Agron. J. 101:1322-1335.
Smiley, R. W., Backhouse, D., Lucas, P., and Paulitz, T. E. 2009. Diseases whichchallenge global wheat production – root, crown, and culm rots. Pages 125-153in: Wheat Science and Trade. B. F. Carver, ed. Wiley-Blackwell, Ames, IA.
Smiley, R. W., Collins, H. P., and Rasmussen, P. E. 1996a. Diseases of wheat inlong-term agronomic experiments at Pendleton, Oregon. Plant Dis. 80:813-820.
Smiley, R. W., Gourlie, J. A., Yan, G. P., and Rhinhart, K. E. L. 2014a. Resistanceand tolerance of landrace wheat in fields infested with Pratylenchus neglectusand P. thornei. Plant Dis. 98:797-805.
Smiley, R. W., and Machado, S. 2009. Pratylenchus neglectus reduces yield ofwinter wheat in dryland cropping systems. Plant Dis. 93:263-271.
Smiley, R. W., Machado, S., Gourlie, J. A., Pritchett, L. C., Yan, G. P., andJacobsen, E. E. 2013a. Effects of crop rotations and tillage on Pratylenchusspp. in the semiarid Pacific Northwest United States. Plant Dis. 97:537-546.
Smiley, R. W., Machado, S., Gourlie, J. A., Pritchett, L. C., Yan, G. P., andJacobsen, E. E. 2013b. Influence of semiarid cropping systems on rootdiseases and inoculum density of soilborne pathogens. Plant Dis. 97:547-555.
Smiley, R. W., Merrifield, K., Patterson, L.-M., Whittaker, R. G., Gourlie, J. A.,and Easley, S. A. 2004. Nematodes in dryland field crops in the semiaridPacific Northwest USA. J. Nematol. 36:54-68.
Smiley, R. W., and Nicol, J. M. 2009. Nematodes which challenge global wheatproduction. Pages 171-187 in: Wheat Science and Trade. B. F. Carver, ed.Wiley-Blackwell, Ames, IA.
Smiley, R. W., and Patterson, L.-M. 1996. Pathogenic fungi associated with Fusariumfoot rot of winter wheat in the semiarid Pacific Northwest. Plant Dis. 80:944-949.
Smiley, R. W., Patterson, L.-M., and Shelton, C. W. 1996b. Fungicide seed treatmentsinfluence emergence of winter wheat in cold soil. J. Prod. Agric. 9:559-563.
Smiley, R. W., Sheedy, J. G., and Easley, S. A. 2008. Vertical distribution ofPratylenchus spp. in silt loam soil and Pacific Northwest dryland crops. PlantDis. 92:1662-1668.
Smiley, R. W., Whittaker, R. G., Gourlie, J. A., and Easley, S. A. 2005a.Pratylenchus thornei associated with reduced wheat yield in Oregon. J.Nematol. 37:45-54.
Smiley, R. W., Whittaker, R. G., Gourlie, J. A., and Easley, S. A. 2005b.Suppression of wheat growth and yield by Pratylenchus neglectus in thePacific Northwest. Plant Dis. 89:958-968.
Smiley, R.W., Yan, G. P., and Gourlie, J. A. 2014b. Selected Pacific Northwest cropsas hosts of Pratylenchus neglectus and P. thornei. Plant Dis. 98:1341-1348.
Summerell, B. A., Burgess, L. W., and Klein, T. A. 1989. The impact of stubblemanagement practices on the incidence of crown rot of wheat. Aust. J. Exp.Agric. 29:91-98.
Thompson, A. L., Smiley, R. W., and Garland-Campbell, K. 2015. Registration ofthe LouAu (Louise/IWA8608077) wheat recombinant inbred line mappingpopulation. J. Plant Regist. 9:424-429.
Thompson, J. P., Owen, K. J., Stirling, G. R., and Bell, M. J. 2008. Root-lesionnematodes (Pratylenchus thornei and P. neglectus): A review of recentprogress in managing a significant pest of grain crops in northern Australia.Australas. Plant Pathol. 37:235-242.
Vanstone, V. A., Hollaway, G. J., and Stirling, G. R. 2008.Managing nematode pests inthe southern and western regions of the Australian cereal industry: Continuingprogress in a challenging environment. Australas. Plant Pathol. 37:220-234.
Yan, G. P., Smiley, R. W., and Okubara, P. A. 2012. Detection and quantificationof Pratylenchus thornei in DNA extracted from soil using real-time PCR.Phytopathology 102:14-22.
Yan, G. P., Smiley, R. W., Okubara, P. A., Skantar, A. M., and Reardon, C. L.2013. Developing a real-time PCR assay for detection and quantification ofPratylenchus neglectus in soil. Plant Dis. 979:757-764.
Yarham, D. J. 1981. Practical aspects of epidemiology and control. Pages 353-384in: Biology and Control of Take-all. M. J. C. Asher and P. J. Shipton, eds.Academic Press, London.
1708 Plant Disease /Vol. 100 No. 8