Embed Size (px)
Citation preview
Rapid Livelihood Assessment in
Damaturu, Jakusko and Bade Local
Government Areas
Yobe State
Nigeria
Rapid Livelihood Assessment in
Damaturu, Jakusko and Bade LGAs of
Stat
April 2018
i
Acknowledgements
The World Food Programme (WFP) Nigeria appreciates the efforts made by the cooperating partners
in Yobe State towards the success of this assessment. Special appreciation and acknowledgment to
the National Bureau of Statistics (NBS) for the mobilization and training of enumerators and data
collection.
WFP would like to thank community stakeholders, representatives of communities in the focus
groups discussions and households involved in this assessment.
ii
List of Acronyms
BYA Borno, Yobe & Adamawa
CH Cadre Harmonisé
DTM Displacement Tracking Matrix
EFSA Emergency Food Security Assessment
FCS Food Consumption Score
FGD Focus Group Discussion
FGN Federal Government of Nigeria
HHs Households
HNO Humanitarian Needs Overview
HRP Humanitarian Response Plan
IOM International Organization for Migration
IDPs Internally Displaced Persons
INGOs International Non-Governmental Organizations
IPC International Phase Classification
KII Key Informant Interview
LCSI Livelihood Based Coping Strategy Index
LGA Local Government Area
NBS National Bureau of Statistics
NGOs Non-Governmental Organizations
NSAGs Non-State Armed Groups
rCSI Reduced Strategy Coping Index
SME Small Medium Enterprise
VAM Vulnerability Analysis and Mapping
WASH Water, Sanitation and Hygiene
WFP World Food Programme
iii
Table of Contents Acknowledgment ................................................................................................................................... i
List of Acronyms .................................................................................................................................... ii
Executive Summary .................................................................................................................... 1
1.0. Context and Rationale ............................................................................................................... 2
2.0. Objectives and methodology ................................................................................................... 4
2.1. Specific objectives ...................................................................................................................... 4
2.2. Methodology .............................................................................................................................. 4
2.3. Training ....................................................................................................................................... 5
2.4. Data Collection, Data entry and Analysis .................................................................................. 5
2.5. Study limitation .......................................................................................................................... 6
3.0. Results ........................................................................................................................................ 7
3.1. Socio Demographics .................................................................................................................. 7
3.1.1. Gender of Head of Household ................................................................................................... 7
3.2. Livelihood Profiling .................................................................................................................... 8
3.2.1. Wealth Ranking ...................................................................................................................... 8
3.2.2. Seasonality Calendar ............................................................................................................ 11
3.2.3. Social Institutions ................................................................................................................. 13
3.2.4. Livelihood Sources ............................................................................................................... 14
3.2.5. Livelihood Constrains........................................................................................................... 16
3.2.6. Shocks ................................................................................................................................... 16
3.2.7. Livelihood Assets Categories .............................................................................................. 18
3.2.9. Household Purchasing Power ............................................................................................. 20
3.3. Household Food Security Status ............................................................................................. 21
3.3.1. Food Consumption Score .................................................................................................... 21
3.3.2. Acute and Chronic Food Insecurity Analysis. ...................................................................... 22
4.0. Conclusion & recommendations ............................................................................................ 26

1
Executive Summary
The impact of ongoing conflict in north eastern Nigeria has resulted in far reaching consequences on
the lives and livelihoods of the affected population and it continues to create urgent humanitarian
situation in the country. This situation has negatively affected household food security due to loss of
productive assets and means of livelihoods.
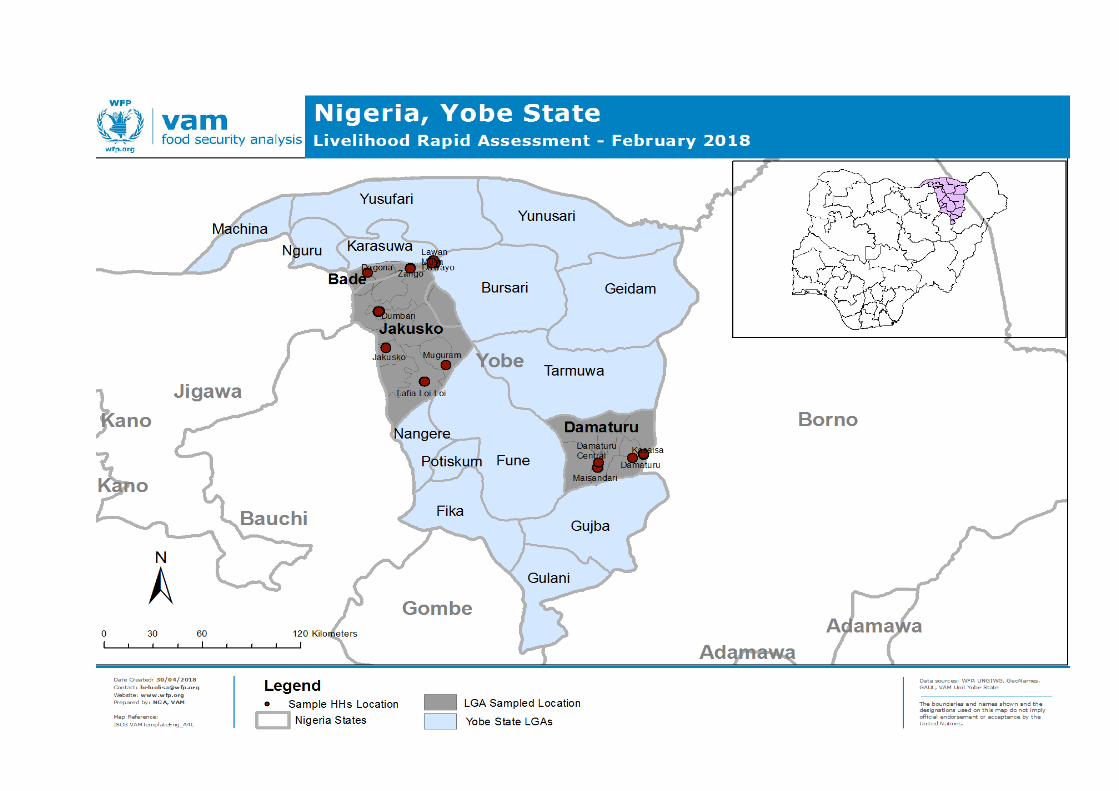
The assessment has covered three Local Government Areas (LGAs) in Yobe state (Damaturu, Bade
and Jakusko). The sample universe of the assessment was the populations who receive assistance
from WFP (World Food Programme) in these LGAs. In total, 900 households were covered distributed
in 13 communities in Damaturu, Jakusko and Bade in February 2018. The primary objective of the
assessment was to establish the livelihood profiles and describe livelihood strategies of the internally
displaced persons (IDPs), hosting communities and the returnees.
The key findings are below;
• Average households size per LGA was 5 (Damaturu), 7 (Jakusko) and 5 (Bade)
• Assessment sample average showed that female-headed household represented 30 percent.
While households with special need members counted for 10 percent.
• Farming was the major source of livelihood for majority of HHs (households), followed by casual
labour (10 percent) and petty trading (9 percent). While, around one-fourth of the sampled
household across three LGAs had no means of livelihood.
• Wealth ranking showed that one percent of households were classified as rich based on
livelihood asset categorization, 16 percent were moderate, 54 percent were poor, and 24 percent
were very poor.
• Majority of households (64 percent) rely on one or more coping strategies for livelihood.
Borrowing from friends, selling female animals were the most applied negative coping strategies
• Among the most severe shocks households faced during the last six-month of the assessment,
sickness of household member was the highest in Bade (43 percent) and Jakusko (42 percent)
while high food price was the most severe shock reported in Damaturu.
• Only 45 percent of households across all LGAs cultivated cash crops in the last farming season
(39 percent in Bade, 91 percent in Jakusko and 40 percent in Damaturu). Top reasons given by
households that did not engage in the last farming season includes; no access to land (51
percent), lack of financial resources (16 percent) and lack of farm inputs (12 percent). Insecurity
was not significant among reasons mentioned by households. Across all assessed LGAs, only 38
percent of IDPs cultivated in the last season compared to 75 percent of Residents.
• Over one fifth of sampled households had poor dietary diversity in February, and slightly above
the same portion had borderline status measured by food consumption score. Female-headed
households were likely to have poor dietary diversity compare to male-headed households.

2
1.0. Context and Rationale
Ongoing conflict in the North-Eastern Nigeria leading to precarious security situation continues to
create an urgent humanitarian situation in the region. Since May 2013, clashes between the Non-State
Armed Groups (NSAGs) in the north-eastern states of Borno, Yobe and Adamawa has led to massive
loss of lives and properties, thus leading the Federal Government of Nigeria (FGN) to declare a state
of emergency in the states.
According to the HRP 20181, an estimated 7.7 million people now depend on humanitarian assistance
for their survival. Civilians still endure conflict that has resulted in widespread displacement, lack of
protection, collapse of livelihoods, destruction of infrastructure and lack of access to basic services.
Nearly half a million homes and 700 public buildings have been destroyed by the conflict, along with
1,200 schools, nearly 800 health facilities, and 1,600 water supply sources. More than half of all
children in the north-east are out of school2.
Threats of attacks by armed groups and military restrictions related to the state of emergency –
particularly restrictions on freedom of movement – continue to have negative impact on trade,
livelihoods and markets, leaving a substantial proportion of the civilian population dependent on
humanitarian assistance. Since the start of the conflict, more than 20,000 people have been killed,
more than 4,000 people abducted, and as of February 2018, 1.7 million people remained displaced3.
The insurgency activities became prominent in Yobe State towards the end of 2013. The activities of
the insurgents over this period affected 12 out of the 17 local Government Areas in various degrees.
The affected LGAs were Gujba, Gulani, Damaturu, Potiskum, Fika, Geidam, Fune, Yunusari, Nangere,
Tarmuwa, Bade and Jakusko. Out of these 12 LGAs, Gujba, Gulani and eastern part of Geidam and
Yunusari have been the most affected as they border Borno state where insurgency activities are
intense4.
The WFP February 2018 EFSA results indicated that global food insecurity in Yobe was 27 percent of
households, an 11 percent reduction compared to EFSA results in October 2017. Similarly, there was 11
percent reduction in food insecurity among displaced households, with 38 percent being food
insecure and 9 percent being severely food insecure. The reasons for improvement in the Food
Security situation were mainly due to; ongoing humanitarian assistance and improved access to land
due improved security situation.
1 Humanitarian Response Plan, 2018 2 Humanitarian Needs Overview, 2018 3 DTM Round XXI Report, 2018 4 Yobe State Integrated Recovery Plan, 2018
3
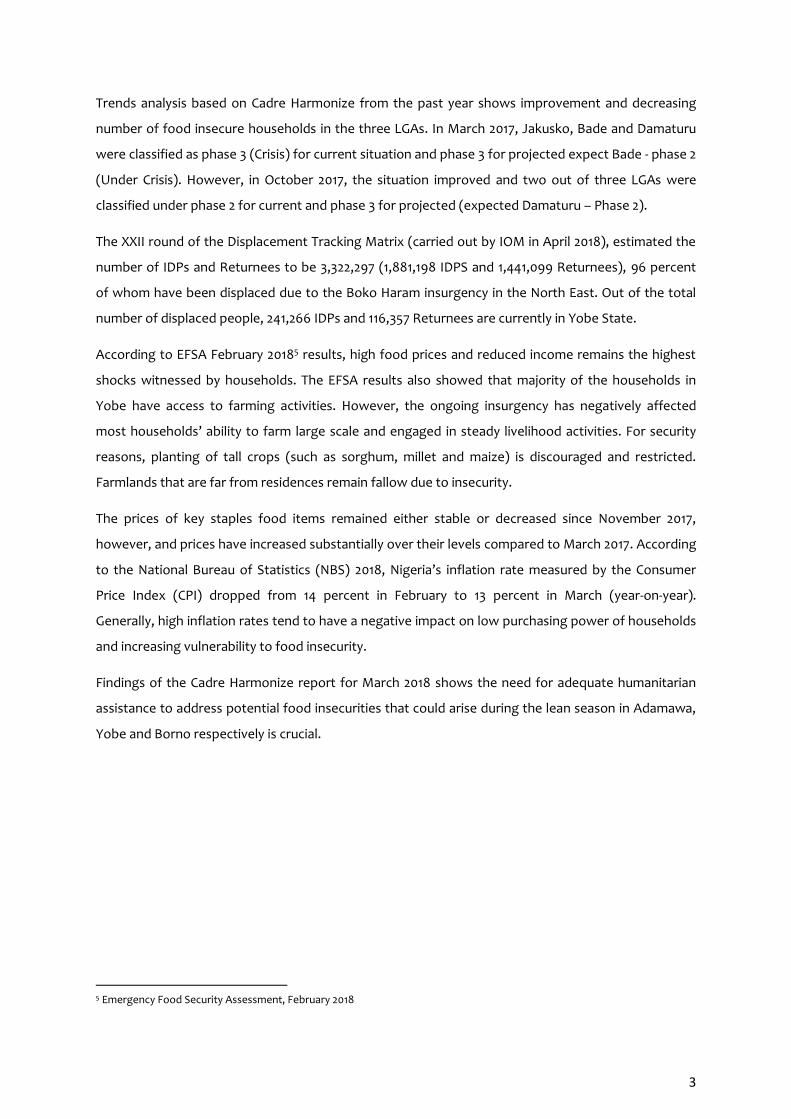
Trends analysis based on Cadre Harmonize from the past year shows improvement and decreasing
number of food insecure households in the three LGAs. In March 2017, Jakusko, Bade and Damaturu
were classified as phase 3 (Crisis) for current situation and phase 3 for projected expect Bade - phase 2
(Under Crisis). However, in October 2017, the situation improved and two out of three LGAs were
classified under phase 2 for current and phase 3 for projected (expected Damaturu – Phase 2).
The XXII round of the Displacement Tracking Matrix (carried out by IOM in April 2018), estimated the
number of IDPs and Returnees to be 3,322,297 (1,881,198 IDPS and 1,441,099 Returnees), 96 percent
of whom have been displaced due to the Boko Haram insurgency in the North East. Out of the total
number of displaced people, 241,266 IDPs and 116,357 Returnees are currently in Yobe State.
According to EFSA February 20185 results, high food prices and reduced income remains the highest
shocks witnessed by households. The EFSA results also showed that majority of the households in
Yobe have access to farming activities. However, the ongoing insurgency has negatively affected
most households’ ability to farm large scale and engaged in steady livelihood activities. For security
reasons, planting of tall crops (such as sorghum, millet and maize) is discouraged and restricted.
Farmlands that are far from residences remain fallow due to insecurity.
The prices of key staples food items remained either stable or decreased since November 2017,
however, and prices have increased substantially over their levels compared to March 2017. According
to the National Bureau of Statistics (NBS) 2018, Nigeria’s inflation rate measured by the Consumer
Price Index (CPI) dropped from 14 percent in February to 13 percent in March (year-on-year).
Generally, high inflation rates tend to have a negative impact on low purchasing power of households
and increasing vulnerability to food insecurity.
Findings of the Cadre Harmonize report for March 2018 shows the need for adequate humanitarian
assistance to address potential food insecurities that could arise during the lean season in Adamawa,
Yobe and Borno respectively is crucial.
5 Emergency Food Security Assessment, February 2018

4
2.0. Objectives and methodology
The primary objective of the assessment was to establish livelihood profile and livelihood strategies
available for displaced communities in Bade, Jakusko and Damaturu LGAs of Yobe state.
2.1. Specific objectives
I. To determine the overall livelihood status and; to estimate the proportion of the livelihood
insecure in the three LGAs.
II. To understand the immediate and underlying causes of livelihood insecurity, related
vulnerability and recommend mitigation strategies.
III. To describe the profile, location and socio-economic characteristics of livelihood insecure
households.
IV. Provide recommendations for the targeting of severely livelihood insecure household for the
purposes of informing policy formulation and programming appropriate interventions.
2.2. Methodology
The assessment was conducted in three LGAs of Yobe state (Damaturu, Bade and Jakusko). The
sample universe of the livelihood assessment was WFP current beneficiaries across the selected LGAs.
The beneficiaries’ profiles include IDP populations, resident and returnees
In all, thirteen communities/distribution centers were randomly visited, a minimum of 50 households
were randomly selected and interviewed from each communities/distribution. When selecting the
households, the teams used lists of systematically random selection of beneficiaries’ households from
the distribution lists. Community leaders in each settlement assisted in locating selected household.
The sample design considered 5 percent additional in case of missing or unallocated households.
5
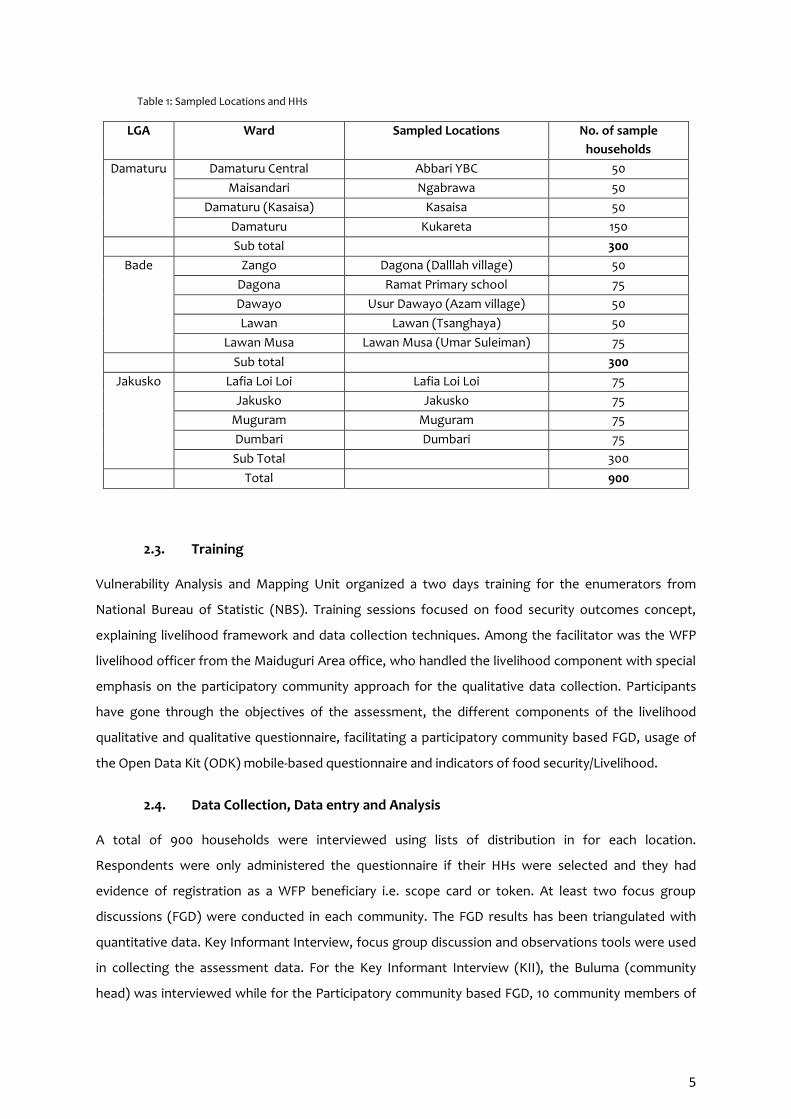
Table 1: Sampled Locations and HHs
LGA Ward Sampled Locations No. of sample
households
Damaturu Damaturu Central Abbari YBC 50
Maisandari Ngabrawa 50
Damaturu (Kasaisa) Kasaisa 50
Damaturu Kukareta 150
Sub total 300
Bade Zango Dagona (Dalllah village) 50
Dagona Ramat Primary school 75
Dawayo Usur Dawayo (Azam village) 50
Lawan Lawan (Tsanghaya) 50
Lawan Musa Lawan Musa (Umar Suleiman) 75
Sub total 300
Jakusko Lafia Loi Loi Lafia Loi Loi 75
Jakusko Jakusko 75
Muguram Muguram 75
Dumbari Dumbari 75
Sub Total 300
Total 900
2.3. Training
Vulnerability Analysis and Mapping Unit organized a two days training for the enumerators from
National Bureau of Statistic (NBS). Training sessions focused on food security outcomes concept,
explaining livelihood framework and data collection techniques. Among the facilitator was the WFP
livelihood officer from the Maiduguri Area office, who handled the livelihood component with special
emphasis on the participatory community approach for the qualitative data collection. Participants
have gone through the objectives of the assessment, the different components of the livelihood
qualitative and qualitative questionnaire, facilitating a participatory community based FGD, usage of
the Open Data Kit (ODK) mobile-based questionnaire and indicators of food security/Livelihood.
2.4. Data Collection, Data entry and Analysis
A total of 900 households were interviewed using lists of distribution in for each location.
Respondents were only administered the questionnaire if their HHs were selected and they had
evidence of registration as a WFP beneficiary i.e. scope card or token. At least two focus group
discussions (FGD) were conducted in each community. The FGD results has been triangulated with
quantitative data. Key Informant Interview, focus group discussion and observations tools were used
in collecting the assessment data. For the Key Informant Interview (KII), the Buluma (community
head) was interviewed while for the Participatory community based FGD, 10 community members of
6
gender balance within different wealth strata were selected to participate. One FGD and KII was
conducted in each of the 13 communities bring to 26 FGDs/KIIs. Data was collected during 10th -23th
February 2018.
Data entry was done using mobile tablet on ODK, SPSS 20 software used for data analysis. Data
analysis, report writing, and review was carried out in two weeks. Various secondary data sources
were used to contextualize the analysis and reporting.
2.5. Study limitation
The respondent HHs for the quantitative aspect was restricted to current WFP beneficiaries within the
LGAs. Thus, results of the assessment may not be suitable to be generalized outside the sample
universe, but for a better overview, the quantitative data was complimented with a qualitative
assessment of respondents drawn from the community but not limited to only WFP beneficiaries.
7
3.0. Results
3.1. Socio Demographics
3.1.1. Gender of Head of Household
Overall, 70 percent of the households surveyed were headed by male. Female headed households in
Damaturu (35 percent) was the highest among the others LGAs, followed by Bade 30 percent and
Jakusko 24 percent.
The profiling of beneficiaries in Jakusko revealed that about 90 percent of respondents were
residents, one percent IDPs and 9 percent returnees. While, population categories in Bade were 97
percent displaced community, two percent residents and one percent returnees. In Damaturu, the
population categories were 80 percent IDPs, 18 percent residents and two percent returnees.
Educational level of head of household have strong reflection on socio-economic status of HHs and
likelihood of the level of food security. One fourth of household head had no form of education in
Jakusko, 13 percent in Damaturu and only two percent in Bade respectively. For head of household
that have at least one form of education, Islamic education remained highest with 81 percent in Bade
and 54 percent in Jakusko. Damaturu had 78 percent of respondents to have completed tertiary
education.
The average household size is 5 in bade, 7 in Jakusko and 5 in Damaturu. Average household size
among IDPs ranges between 4-6 members, while host residents have a range of 7-9 and upwards. This
trend is understandable as most IDP HHs still have extended household members at their place of
origin or had family splited during displacement.
Around 10 percent of households assessed have at least a family member with special needs. Majority
of the special needs status are physically related. Households with special need requires constant
attention as such, HHs spend more resources caring for such individuals and this can gravely affect
the HHs income.

8
Table 2: Socio demographics
Gender of Household
Head
Residential Status Educational Level
LGA Male Female Residents IDPs Returnees No Form of
Education
Islamic Primary Secondary Tertiary
Bade 70% 30% 2% 97% 1% 2% 81% 9% 6% 2%
Jakusko 75% 25% 90% 1% 9% 25% 53% 9% 9% 4%
Damaturu 65% 35% 16% 83% 1% 13% 5% 4% 1% 77%
3.2. Livelihood Profiling
3.2.1. Wealth Ranking
Communities were ranked based on vulnerability into four categories (very poor, poor, medium and
better off) using criteria described by the community on perception of household wealth ranking.
The main criteria used by the community included; i.e. labour capability/opportunity, months of food
gap, ability to practice farming in dry season, size of land cultivated, high consumption of quality food,
ownership of a house, ownership of livestock/poultry, type of livelihood, and number of children
enrolled in school etc. Proportional pilling used to estimate populations group in each category.
Bade
The very poor ranged between 10-20 percent. Most of them engaged in casual and domestic labour
or working for the better off class own, no livestock/poultry have poor consumption of quality food.
The Poor constituted between 35-40 percent. Own very small farmland, have no cattle or sheep, they
might own between 1-2 goats, 2-3 poultry, engage in casual labour during dry season, consume all
their farm produce after two months of harvest.
The Medium class represented 30-45 percent. Own a house, cultivate more than two hectares of land,
have at least two cattle, 10 goats, 5 sheep, children are enrolled in school.
While the Better Off was counting for 10 percent of the category. Among the criteria describing
households in the groups were - ownership and cultivation of more than 8 hectares of land, owning
house, they owned more than 6 cattle, 20 goats, 20 sheep, have access to main town, consume high
quality food always.
9
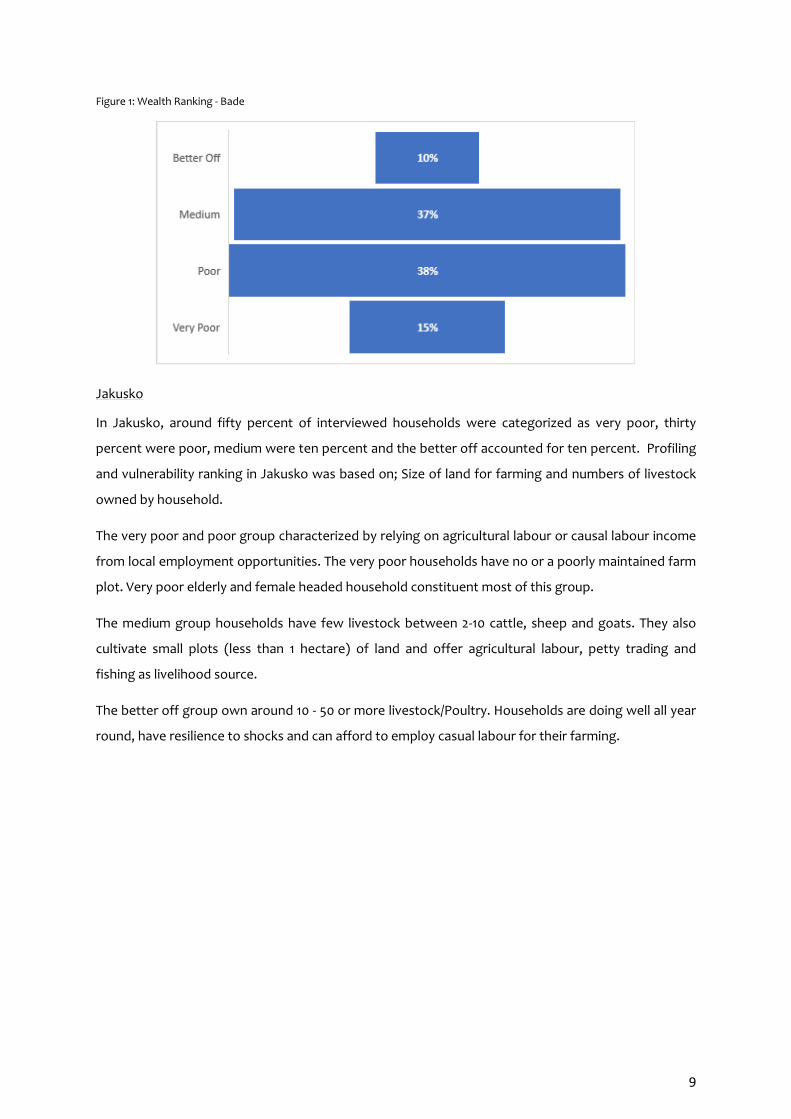
Figure 1: Wealth Ranking - Bade
Jakusko
In Jakusko, around fifty percent of interviewed households were categorized as very poor, thirty
percent were poor, medium were ten percent and the better off accounted for ten percent. Profiling
and vulnerability ranking in Jakusko was based on; Size of land for farming and numbers of livestock
owned by household.
The very poor and poor group characterized by relying on agricultural labour or causal labour income
from local employment opportunities. The very poor households have no or a poorly maintained farm
plot. Very poor elderly and female headed household constituent most of this group.
The medium group households have few livestock between 2-10 cattle, sheep and goats. They also
cultivate small plots (less than 1 hectare) of land and offer agricultural labour, petty trading and
fishing as livelihood source.
The better off group own around 10 - 50 or more livestock/Poultry. Households are doing well all year
round, have resilience to shocks and can afford to employ casual labour for their farming.

10
Figure 2: Wealth Ranking – Jakusko
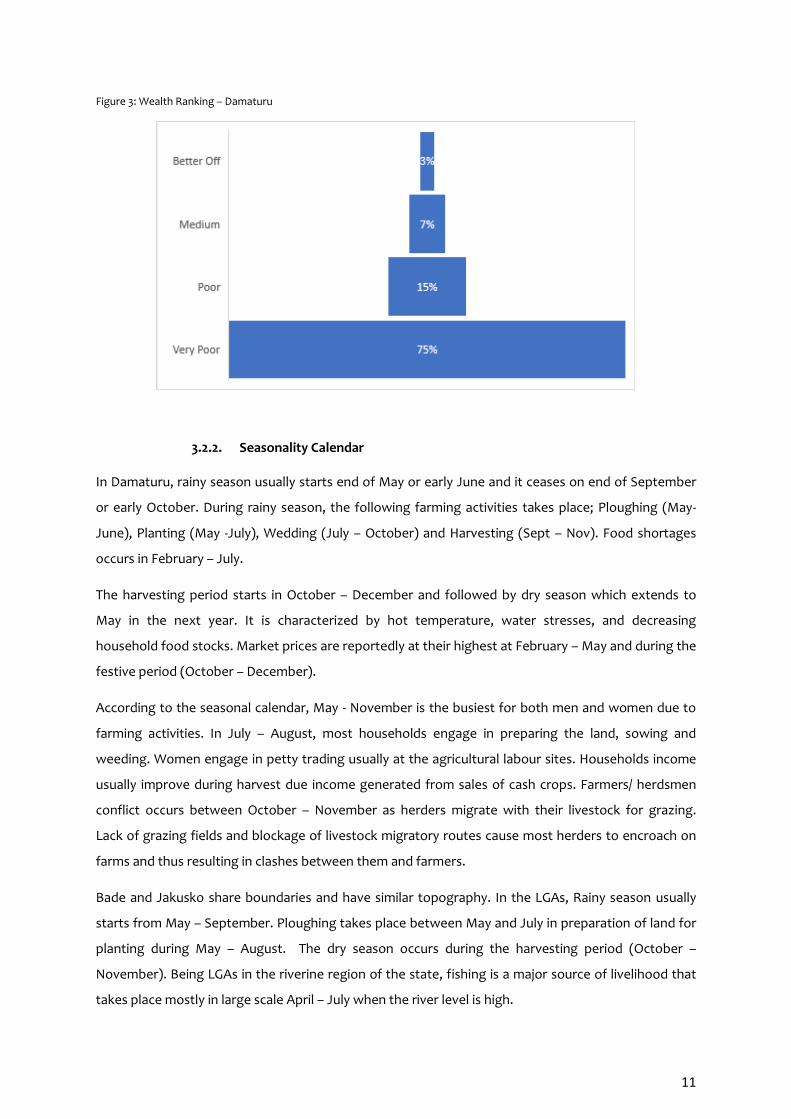
Damaturu
Majority of HHs were categorized as very poor ranging between 60 - 90 percent. The main criteria of
those households included; having few poultry or livestock mainly goat, enrollment of children in
school, owning land and household structure. The poor category ranging between 7 - 20 percent. The
characteristic of the poor households was; a) they have at least a livestock/poultry, child not enrolled
in public school, live in mud-layered house, own at least a small land for gardening. The medium
category ranged between 2-6 percent and households in the categories, own livestock of at least five
goats but no cattle, children enrolled in private school, live in rented house while the better off ranges
accounting one to four percent. They have more than one cattle, more than five goats and different
poultry, children are enrolled in private school, own a house and sizable farming land.
The very poor group largely struggle during dry season in accessing food and income. The group were
vulnerable to and their resilience capacity has reduced to minimal. Among the main characteristics
used to describe them; they own few or no livestock, have no children enrolled in school, they largely
rely on casual and agricultural labour as their main source of livelihood.
11
Figure 3: Wealth Ranking – Damaturu
3.2.2. Seasonality Calendar
In Damaturu, rainy season usually starts end of May or early June and it ceases on end of September
or early October. During rainy season, the following farming activities takes place; Ploughing (May-
June), Planting (May -July), Wedding (July – October) and Harvesting (Sept – Nov). Food shortages
occurs in February – July.
The harvesting period starts in October – December and followed by dry season which extends to
May in the next year. It is characterized by hot temperature, water stresses, and decreasing
household food stocks. Market prices are reportedly at their highest at February – May and during the
festive period (October – December).
According to the seasonal calendar, May - November is the busiest for both men and women due to
farming activities. In July – August, most households engage in preparing the land, sowing and
weeding. Women engage in petty trading usually at the agricultural labour sites. Households income
usually improve during harvest due income generated from sales of cash crops. Farmers/ herdsmen
conflict occurs between October – November as herders migrate with their livestock for grazing.
Lack of grazing fields and blockage of livestock migratory routes cause most herders to encroach on
farms and thus resulting in clashes between them and farmers.
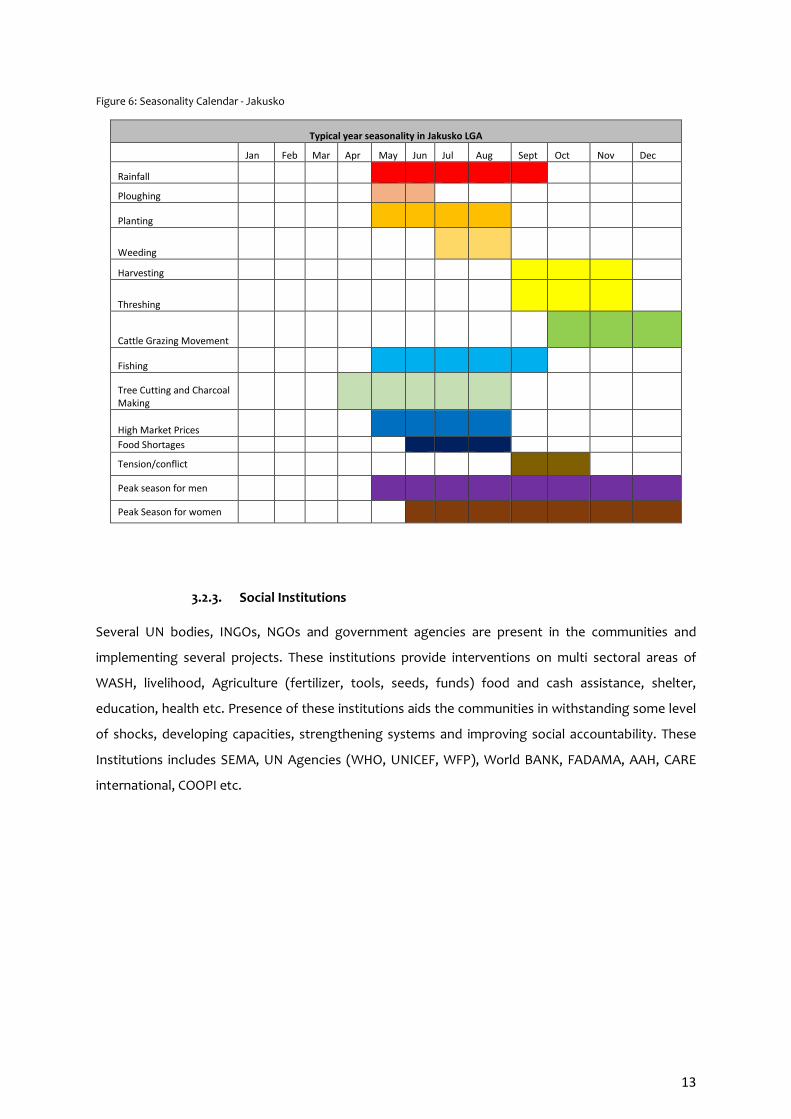
Bade and Jakusko share boundaries and have similar topography. In the LGAs, Rainy season usually
starts from May – September. Ploughing takes place between May and July in preparation of land for
planting during May – August. The dry season occurs during the harvesting period (October –
November). Being LGAs in the riverine region of the state, fishing is a major source of livelihood that
takes place mostly in large scale April – July when the river level is high.

12
Figure 4: Seasonality Calendar - Damaturu
Typical year seasonality in Damaturu LGA
Jan Feb Mar Apr May Jun Jul Aug Sept
Rainfall
Ploughing
Planting
Weeding
Harvesting
Threshing
Cattle Grazing Movement
Fishing
Tree Cutting and Charcoal Making
High Market Prices
Food Shortages
Tension/conflict
Peak season for men
Peak Season for women
Figure 5: Seasonality Calendar - Bade
Typical Year Seasonality in Bade LGA
Jan Feb Mar Apr May Jun Jul Aug Sept Oct Nov Dec
Rainfall
Planting
Weeding
Harvesting
Cattle Grazing Movement
Fishing
Tree Cutting and Charcoal Making
High Market Prices
Food Shortages
Tension/conflict
Peak season for men
Peak Season for women
13
Figure 6: Seasonality Calendar - Jakusko
Typical year seasonality in Jakusko LGA
Jan Feb Mar Apr May Jun Jul Aug Sept Oct Nov Dec
Rainfall
Ploughing
Planting
Weeding
Harvesting
Threshing
Cattle Grazing Movement
Fishing
Tree Cutting and Charcoal Making
High Market Prices
Food Shortages
Tension/conflict
Peak season for men
Peak Season for women
3.2.3. Social Institutions
Several UN bodies, INGOs, NGOs and government agencies are present in the communities and
implementing several projects. These institutions provide interventions on multi sectoral areas of
WASH, livelihood, Agriculture (fertilizer, tools, seeds, funds) food and cash assistance, shelter,
education, health etc. Presence of these institutions aids the communities in withstanding some level
of shocks, developing capacities, strengthening systems and improving social accountability. These
Institutions includes SEMA, UN Agencies (WHO, UNICEF, WFP), World BANK, FADAMA, AAH, CARE
international, COOPI etc.
14
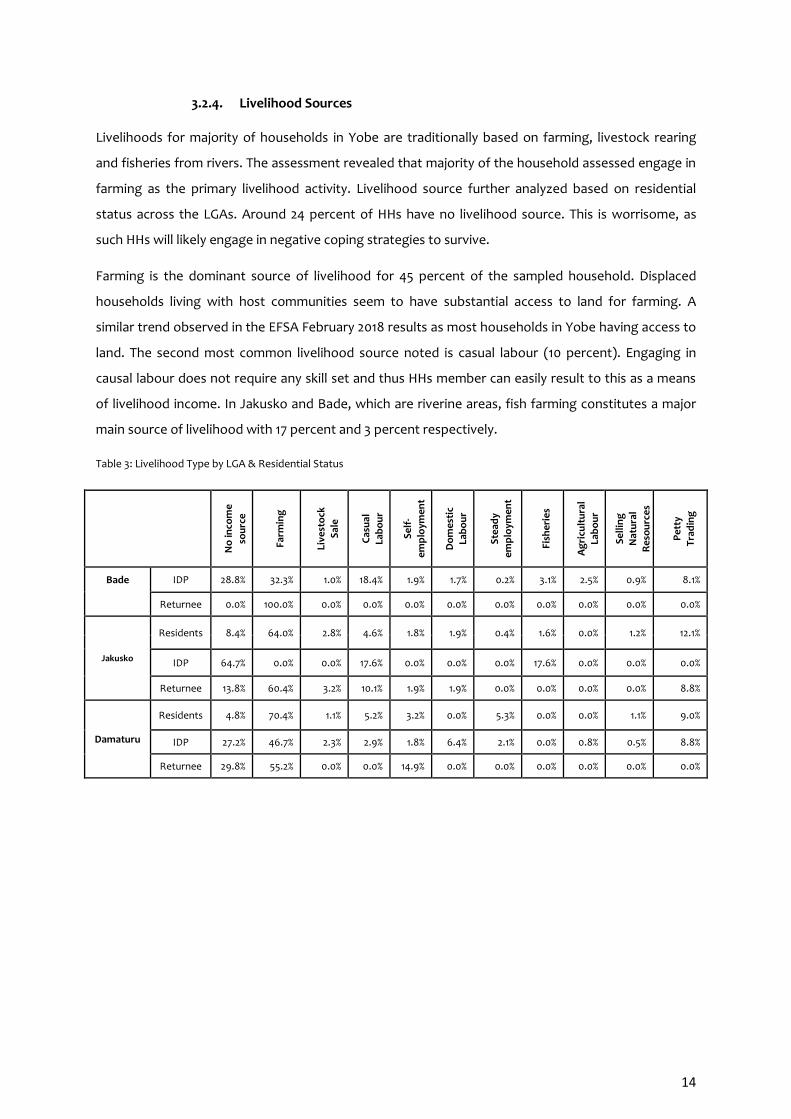
3.2.4. Livelihood Sources
Livelihoods for majority of households in Yobe are traditionally based on farming, livestock rearing
and fisheries from rivers. The assessment revealed that majority of the household assessed engage in
farming as the primary livelihood activity. Livelihood source further analyzed based on residential
status across the LGAs. Around 24 percent of HHs have no livelihood source. This is worrisome, as
such HHs will likely engage in negative coping strategies to survive.
Farming is the dominant source of livelihood for 45 percent of the sampled household. Displaced
households living with host communities seem to have substantial access to land for farming. A
similar trend observed in the EFSA February 2018 results as most households in Yobe having access to
land. The second most common livelihood source noted is casual labour (10 percent). Engaging in
causal labour does not require any skill set and thus HHs member can easily result to this as a means
of livelihood income. In Jakusko and Bade, which are riverine areas, fish farming constitutes a major
main source of livelihood with 17 percent and 3 percent respectively.
Table 3: Livelihood Type by LGA & Residential Status
No
inco
me
sou
rce
Farm
ing
Live
sto
ck
Sal
e
Cas
ual
La
bo
ur
Se
lf-
em
plo
yme
nt
Do
me
stic
La
bo
ur
Ste
ady
em
plo
yme
nt
Fish
eri
es
Ag
ricu
ltu
ral
Lab
ou
r
Se
llin
g
Nat
ura
l R
eso
urc
es
Pe
tty
Tra
din
g
Bade IDP 28.8% 32.3% 1.0% 18.4% 1.9% 1.7% 0.2% 3.1% 2.5% 0.9% 8.1%
Returnee 0.0% 100.0% 0.0% 0.0% 0.0% 0.0% 0.0% 0.0% 0.0% 0.0% 0.0%
Jakusko
Residents 8.4% 64.0% 2.8% 4.6% 1.8% 1.9% 0.4% 1.6% 0.0% 1.2% 12.1%
IDP 64.7% 0.0% 0.0% 17.6% 0.0% 0.0% 0.0% 17.6% 0.0% 0.0% 0.0%
Returnee 13.8% 60.4% 3.2% 10.1% 1.9% 1.9% 0.0% 0.0% 0.0% 0.0% 8.8%
Damaturu
Residents 4.8% 70.4% 1.1% 5.2% 3.2% 0.0% 5.3% 0.0% 0.0% 1.1% 9.0%
IDP 27.2% 46.7% 2.3% 2.9% 1.8% 6.4% 2.1% 0.0% 0.8% 0.5% 8.8%
Returnee 29.8% 55.2% 0.0% 0.0% 14.9% 0.0% 0.0% 0.0% 0.0% 0.0% 0.0%

15
Table4: House hold Main Income Source
The main income sources across all LGAs was from humanitarian agencies cash aid assistance 56
percent (50 percent Bade, 46 percent Jakusko and 60 percent for Damaturu). This is not surprising as
all participants in the assessment are WFP beneficiaries who receive monthly assistance. Sale of farm
produces (35 percent) was the second main income source. Humanitarian assistance of cash aid may
support HHs on the short term but may not be sustainable on the long term. Measures that can
support building livelihood system will help build individual, HHs and community resilience while
setting roadmap for early recovery.
The assessment found out the more members contributing to households’ income the likelihood the
household is food secure. In addition, HHs with multiple sources of income from several HH members
can easily adapt to shocks, have a relative better food security outcome and higher per capita.
Figure 7: Income Contribution by HH Members
0.0%
20.0%
40.0%
60.0%
80.0%
1-3mm
4-6mm
7-9mm
Morethan
10 mm
1-3mm
4-6mm
7-9mm
Morethan
10 mm
1-3mm
4-6mm
7-9mm
Morethan
10 mm
Bade Jakusko Damaturu
% o
f H
hs
Only HH head Between 1-2 mm 3-4 members More than 4 members
Sal
e o
f fa
rm
pro
du
ce
Sal
e o
f
live
sto
ck
pro
du
ce
Sal
e o
f an
imal
Sal
e o
f
han
dic
raft
Gif
ts f
rom
rela
tive
s/fr
ien
d
s Ag
ricu
ltu
ral
Lab
ou
r
Sal
e o
f fo
od
aid
re
ceiv
ed
fro
m N
GO
s o
r
Go
vern
me
nt
Fish
eri
es
Cas
h a
id f
rom
NG
Os
or
Go
vern
me
nt
Inco
me
fro
m
trad
ing
Do
me
stic
Lab
ou
r
Bade 37.5% .6% 0.0% .6% 1.2% .9% .2% .9% 50.2% 1.3% 6.3%
Jakusko 40.0% 0.0% .8% .4% 2.3% 4.5% 1.2% 1.4% 46.0% 1.4% 1.6%
Damaturu 29.9% 3.3% 3.0% 0.0% 1.3% .4% 0.0% 0.0% 59.6% .1% 2.4%
16
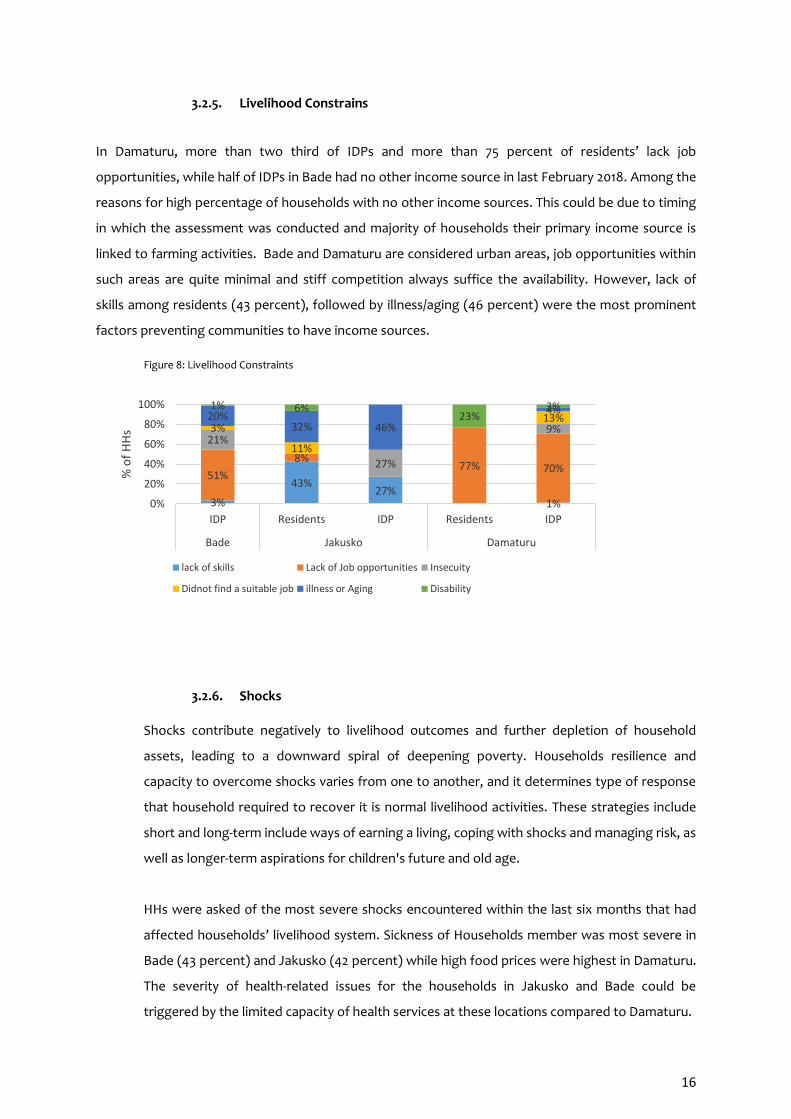
3.2.5. Livelihood Constrains
In Damaturu, more than two third of IDPs and more than 75 percent of residents’ lack job
opportunities, while half of IDPs in Bade had no other income source in last February 2018. Among the
reasons for high percentage of households with no other income sources. This could be due to timing
in which the assessment was conducted and majority of households their primary income source is
linked to farming activities. Bade and Damaturu are considered urban areas, job opportunities within
such areas are quite minimal and stiff competition always suffice the availability. However, lack of
skills among residents (43 percent), followed by illness/aging (46 percent) were the most prominent
factors preventing communities to have income sources.
Figure 8: Livelihood Constraints
3%
43%27%
1%
51%
8%77% 70%
21%
27%
9%3%
11%
13%20%32% 46%
4%1% 6%23%
3%
0%
20%
40%
60%
80%
100%
IDP Residents IDP Residents IDP
Bade Jakusko Damaturu
% o
f H
Hs
lack of skills Lack of Job opportunities Insecuity
Didnot find a suitable job illness or Aging Disability
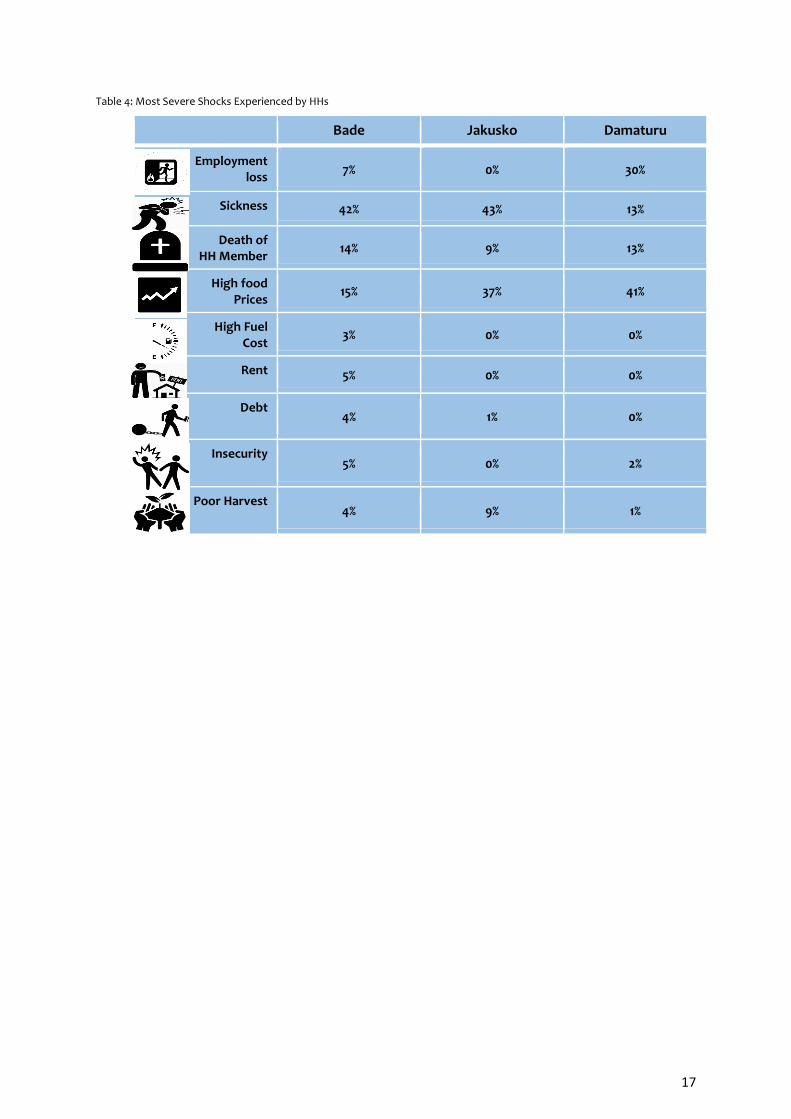
3.2.6. Shocks
Shocks contribute negatively to livelihood outcomes and further depletion of household
assets, leading to a downward spiral of deepening poverty. Households resilience and
capacity to overcome shocks varies from one to another, and it determines type of response
that household required to recover it is normal livelihood activities. These strategies include
short and long-term include ways of earning a living, coping with shocks and managing risk, as
well as longer-term aspirations for children's future and old age.
HHs were asked of the most severe shocks encountered within the last six months that had
affected households’ livelihood system. Sickness of Households member was most severe in
Bade (43 percent) and Jakusko (42 percent) while high food prices were highest in Damaturu.
The severity of health-related issues for the households in Jakusko and Bade could be
triggered by the limited capacity of health services at these locations compared to Damaturu.
17
Table 4: Most Severe Shocks Experienced by HHs
Bade Jakusko Damaturu
Employment loss
7% 0% 30%
Sickness 42% 43% 13%
Death of HH Member
14% 9% 13%
High food Prices
15% 37% 41%
High Fuel Cost
3% 0% 0%
Rent 5% 0% 0%
Debt 4% 1% 0%
Insecurity 5% 0% 2%
Poor Harvest 4% 9% 1%
18
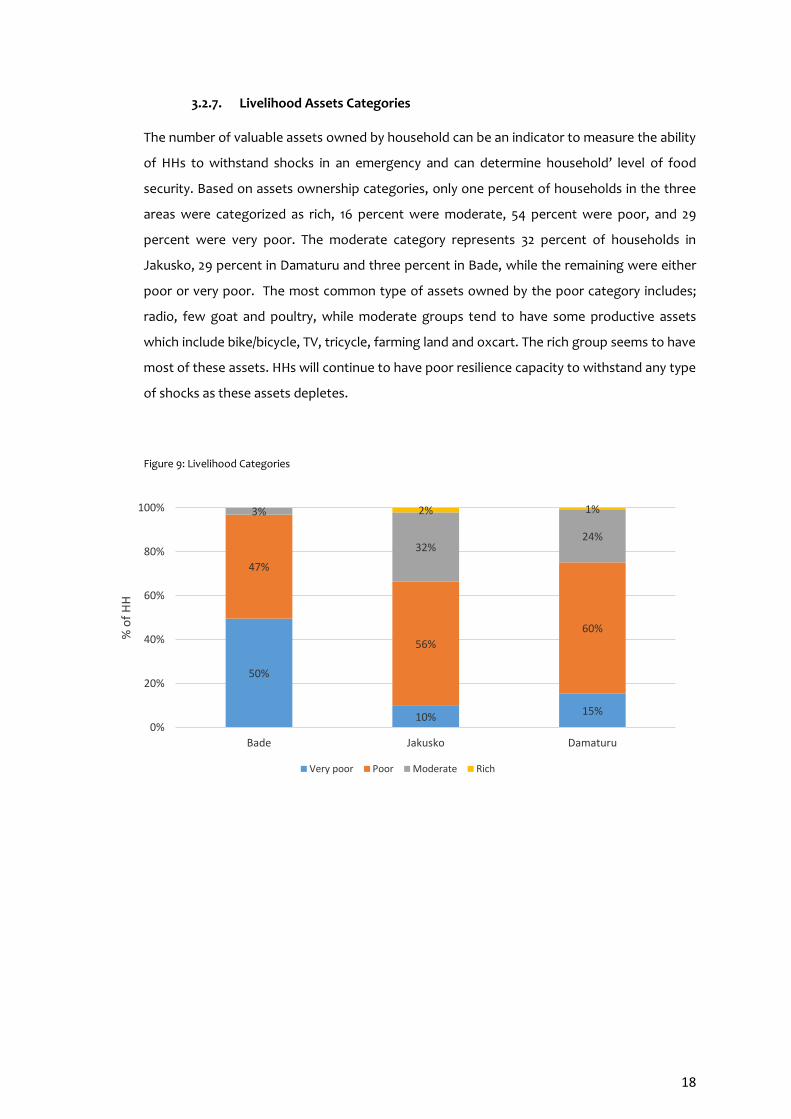
3.2.7. Livelihood Assets Categories
The number of valuable assets owned by household can be an indicator to measure the ability
of HHs to withstand shocks in an emergency and can determine household’ level of food
security. Based on assets ownership categories, only one percent of households in the three
areas were categorized as rich, 16 percent were moderate, 54 percent were poor, and 29
percent were very poor. The moderate category represents 32 percent of households in
Jakusko, 29 percent in Damaturu and three percent in Bade, while the remaining were either
poor or very poor. The most common type of assets owned by the poor category includes;
radio, few goat and poultry, while moderate groups tend to have some productive assets
which include bike/bicycle, TV, tricycle, farming land and oxcart. The rich group seems to have
most of these assets. HHs will continue to have poor resilience capacity to withstand any type
of shocks as these assets depletes.
Figure 9: Livelihood Categories
50%
10%15%
47%
56%
60%
3%
32%24%
2% 1%
0%
20%
40%
60%
80%
100%
Bade Jakusko Damaturu
% o
f H
H
Very poor Poor Moderate Rich
19
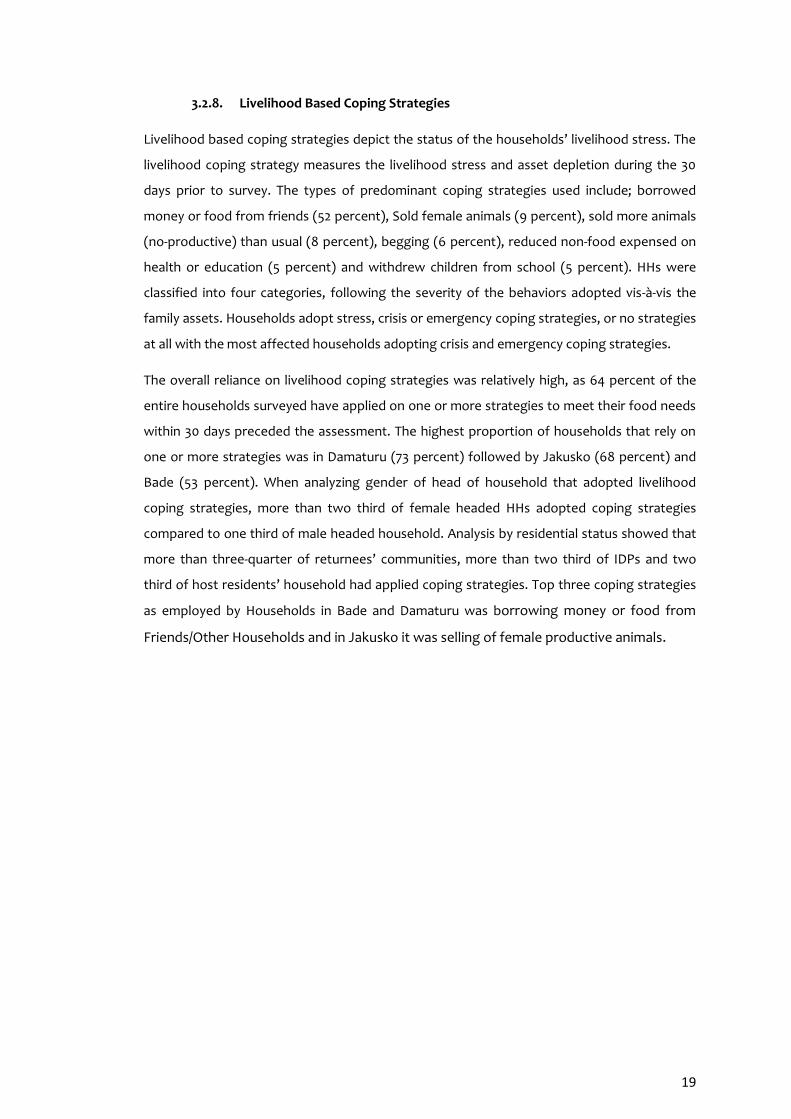
3.2.8. Livelihood Based Coping Strategies
Livelihood based coping strategies depict the status of the households’ livelihood stress. The
livelihood coping strategy measures the livelihood stress and asset depletion during the 30
days prior to survey. The types of predominant coping strategies used include; borrowed
money or food from friends (52 percent), Sold female animals (9 percent), sold more animals
(no-productive) than usual (8 percent), begging (6 percent), reduced non-food expensed on
health or education (5 percent) and withdrew children from school (5 percent). HHs were
classified into four categories, following the severity of the behaviors adopted vis-à-vis the
family assets. Households adopt stress, crisis or emergency coping strategies, or no strategies
at all with the most affected households adopting crisis and emergency coping strategies.
The overall reliance on livelihood coping strategies was relatively high, as 64 percent of the
entire households surveyed have applied on one or more strategies to meet their food needs
within 30 days preceded the assessment. The highest proportion of households that rely on
one or more strategies was in Damaturu (73 percent) followed by Jakusko (68 percent) and
Bade (53 percent). When analyzing gender of head of household that adopted livelihood
coping strategies, more than two third of female headed HHs adopted coping strategies
compared to one third of male headed household. Analysis by residential status showed that
more than three-quarter of returnees’ communities, more than two third of IDPs and two
third of host residents’ household had applied coping strategies. Top three coping strategies
as employed by Households in Bade and Damaturu was borrowing money or food from
Friends/Other Households and in Jakusko it was selling of female productive animals.
20
Figure 10: Household Livelihood Coping Strategy
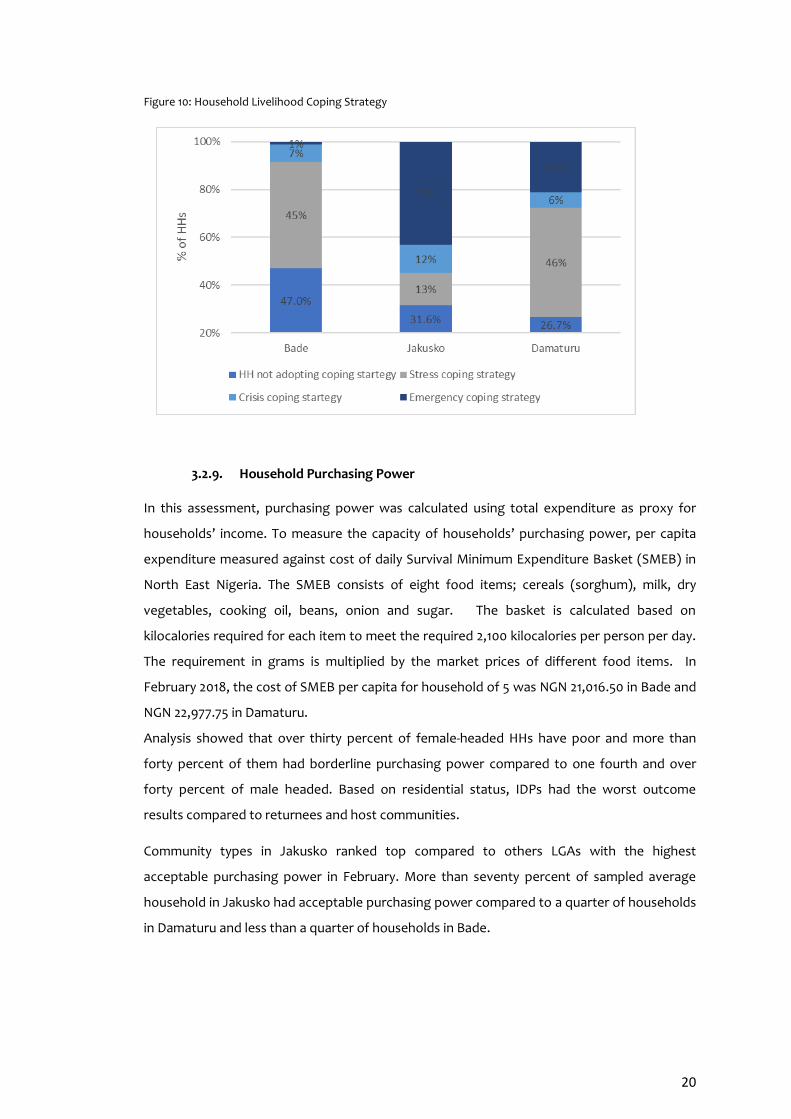
3.2.9. Household Purchasing Power
In this assessment, purchasing power was calculated using total expenditure as proxy for
households’ income. To measure the capacity of households’ purchasing power, per capita
expenditure measured against cost of daily Survival Minimum Expenditure Basket (SMEB) in
North East Nigeria. The SMEB consists of eight food items; cereals (sorghum), milk, dry
vegetables, cooking oil, beans, onion and sugar. The basket is calculated based on
kilocalories required for each item to meet the required 2,100 kilocalories per person per day.
The requirement in grams is multiplied by the market prices of different food items. In
February 2018, the cost of SMEB per capita for household of 5 was NGN 21,016.50 in Bade and
NGN 22,977.75 in Damaturu.
Analysis showed that over thirty percent of female-headed HHs have poor and more than
forty percent of them had borderline purchasing power compared to one fourth and over
forty percent of male headed. Based on residential status, IDPs had the worst outcome
results compared to returnees and host communities.
Community types in Jakusko ranked top compared to others LGAs with the highest
acceptable purchasing power in February. More than seventy percent of sampled average
household in Jakusko had acceptable purchasing power compared to a quarter of households
in Damaturu and less than a quarter of households in Bade.
21
Level of household education is likely to have a strong link to better income and hence
acceptable purchasing power. Analysis showed that more than eighty percent of households’
head had tertiary and above level of education and they had relatively better purchasing
power compared to those who did not attend any form of school (31 percent). This trend
shows there is a correlation between education level and HHs socio economic status.
Figure 11: Household Purchasing Power
31%
6%
31%
49%
23%
42%
20%
70%
28%
0% 10% 20% 30% 40% 50% 60% 70% 80%
Bade
Jakusko
Damaturu
% of HHs
Acceptable Purchasing Power Borderline Poor Purchasing power
3.3. Household Food Security Status
3.3.1. Food Consumption Score
Household food consumption is measured through the Food Consumption Score (FCS), an
indicator that measures the dietary diversity and frequency of food items consumed by
households using a 7-day recall period. Information was collected on the variety and frequency of
different foods and food groups to calculate a weighted food consumption score. Weights were
based on the nutritional density of the foods. Dietary diversity frequency is used as a proxy to
measure household food security.
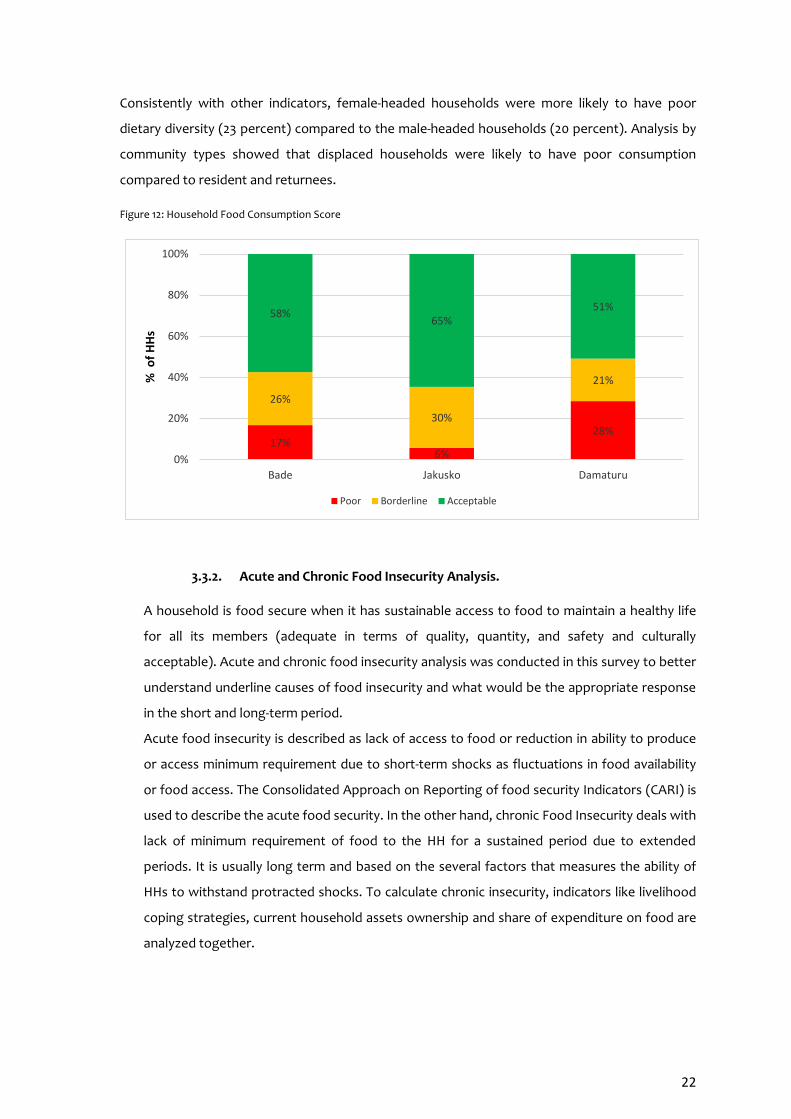
The assessment results showed that 21 percent of sampled households had poor diet across the
LGAs. The main food items consumed by the poor category were cereals, fats & oils, spices and
legumes. Moreover, around 24 percent had borderline, and more than fifty percent had
acceptable food consumption. Food consumption results by LGAs revealed that seventeen, six
and twenty eight percent had poor consumption in Bade, Jakusko and Damaturu respectively.
22
Consistently with other indicators, female-headed households were more likely to have poor
dietary diversity (23 percent) compared to the male-headed households (20 percent). Analysis by
community types showed that displaced households were likely to have poor consumption
compared to resident and returnees.
Figure 12: Household Food Consumption Score
17%6%
28%
26%
30%
21%
58%65%
51%
0%
20%
40%
60%
80%
100%
Bade Jakusko Damaturu
% o
f H
Hs
Poor Borderline Acceptable
3.3.2. Acute and Chronic Food Insecurity Analysis.
A household is food secure when it has sustainable access to food to maintain a healthy life
for all its members (adequate in terms of quality, quantity, and safety and culturally
acceptable). Acute and chronic food insecurity analysis was conducted in this survey to better
understand underline causes of food insecurity and what would be the appropriate response
in the short and long-term period.
Acute food insecurity is described as lack of access to food or reduction in ability to produce
or access minimum requirement due to short-term shocks as fluctuations in food availability
or food access. The Consolidated Approach on Reporting of food security Indicators (CARI) is
used to describe the acute food security. In the other hand, chronic Food Insecurity deals with
lack of minimum requirement of food to the HH for a sustained period due to extended
periods. It is usually long term and based on the several factors that measures the ability of
HHs to withstand protracted shocks. To calculate chronic insecurity, indicators like livelihood
coping strategies, current household assets ownership and share of expenditure on food are
analyzed together.
23
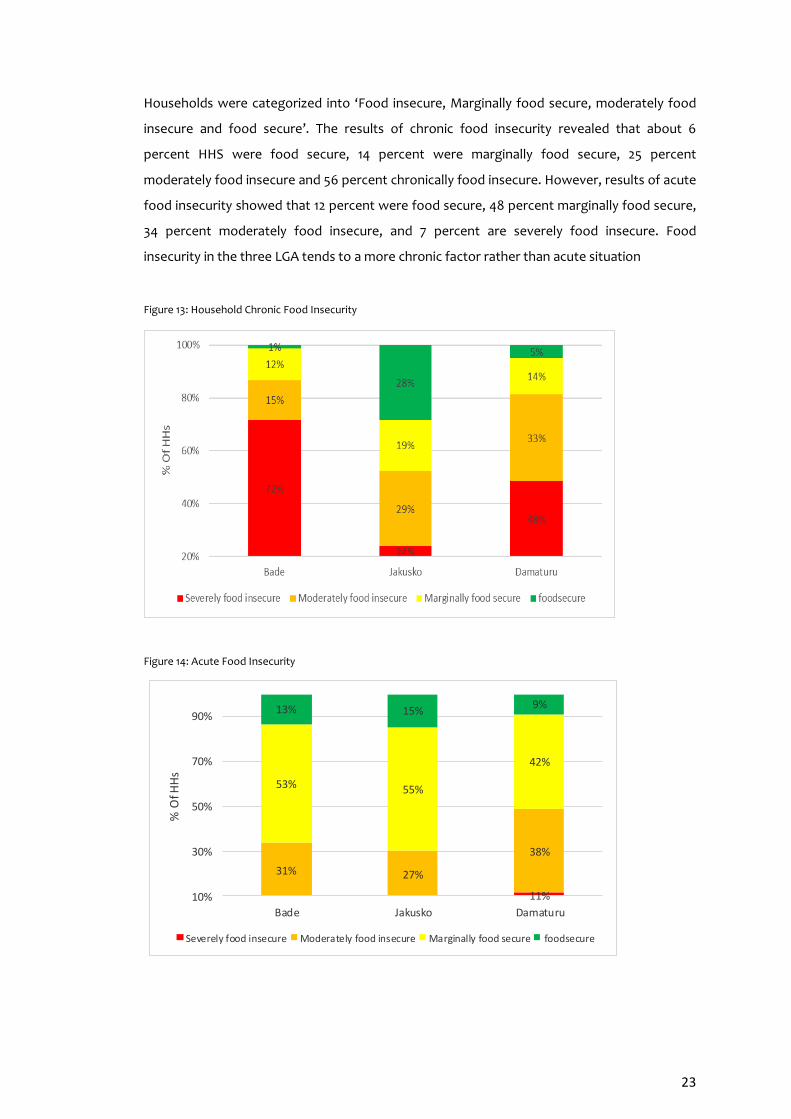
Households were categorized into ‘Food insecure, Marginally food secure, moderately food
insecure and food secure’. The results of chronic food insecurity revealed that about 6
percent HHS were food secure, 14 percent were marginally food secure, 25 percent
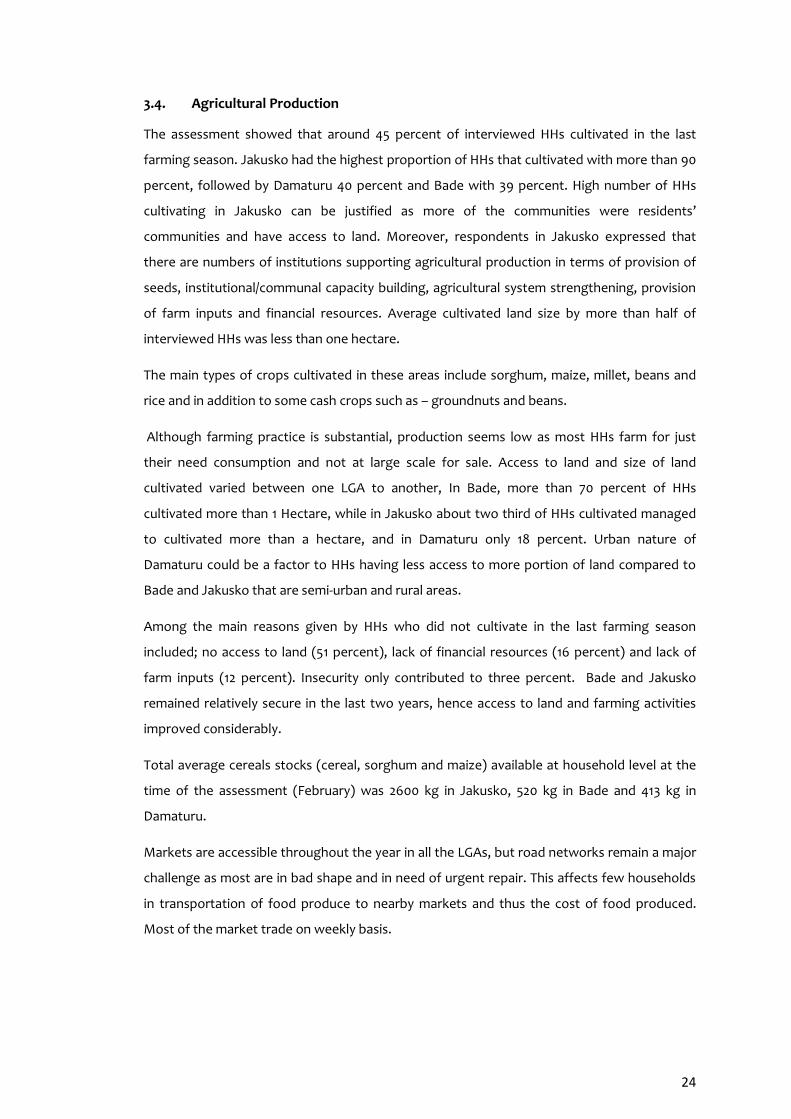
moderately food insecure and 56 percent chronically food insecure. However, results of acute
food insecurity showed that 12 percent were food secure, 48 percent marginally food secure,
34 percent moderately food insecure, and 7 percent are severely food insecure. Food
insecurity in the three LGA tends to a more chronic factor rather than acute situation
Figure 13: Household Chronic Food Insecurity
Figure 14: Acute Food Insecurity
11%
31% 27%
38%
53% 55%
42%
13% 15%9%
10%
30%
50%
70%
90%
Bade Jakusko Damaturu
% O
f HH
s
Severely food insecure Moderately food insecure Marginally food secure foodsecure
24
3.4. Agricultural Production
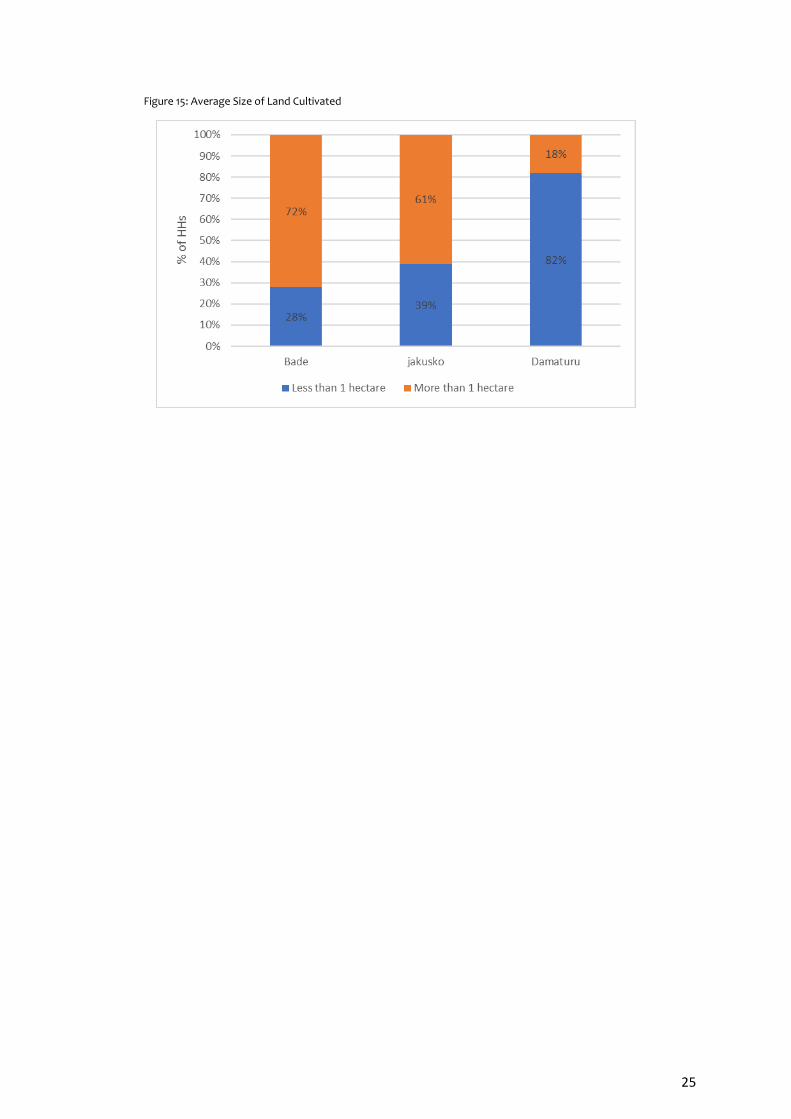
The assessment showed that around 45 percent of interviewed HHs cultivated in the last
farming season. Jakusko had the highest proportion of HHs that cultivated with more than 90
percent, followed by Damaturu 40 percent and Bade with 39 percent. High number of HHs
cultivating in Jakusko can be justified as more of the communities were residents’
communities and have access to land. Moreover, respondents in Jakusko expressed that
there are numbers of institutions supporting agricultural production in terms of provision of
seeds, institutional/communal capacity building, agricultural system strengthening, provision
of farm inputs and financial resources. Average cultivated land size by more than half of
interviewed HHs was less than one hectare.
The main types of crops cultivated in these areas include sorghum, maize, millet, beans and
rice and in addition to some cash crops such as – groundnuts and beans.
Although farming practice is substantial, production seems low as most HHs farm for just
their need consumption and not at large scale for sale. Access to land and size of land
cultivated varied between one LGA to another, In Bade, more than 70 percent of HHs
cultivated more than 1 Hectare, while in Jakusko about two third of HHs cultivated managed
to cultivated more than a hectare, and in Damaturu only 18 percent. Urban nature of
Damaturu could be a factor to HHs having less access to more portion of land compared to
Bade and Jakusko that are semi-urban and rural areas.
Among the main reasons given by HHs who did not cultivate in the last farming season
included; no access to land (51 percent), lack of financial resources (16 percent) and lack of
farm inputs (12 percent). Insecurity only contributed to three percent. Bade and Jakusko
remained relatively secure in the last two years, hence access to land and farming activities
improved considerably.
Total average cereals stocks (cereal, sorghum and maize) available at household level at the
time of the assessment (February) was 2600 kg in Jakusko, 520 kg in Bade and 413 kg in
Damaturu.
Markets are accessible throughout the year in all the LGAs, but road networks remain a major
challenge as most are in bad shape and in need of urgent repair. This affects few households
in transportation of food produce to nearby markets and thus the cost of food produced.
Most of the market trade on weekly basis.
25
Figure 15: Average Size of Land Cultivated

26
4.0. Conclusion & recommendations
The rapid Livelihood Assessment provides a snapshot overview of the livelihood situation of
households receiving food assistance in Bade, Jakusko and Damaturu LGAs in Yobe state.
The results derived from the analysis provided key livelihood and food security indicators that can
estimate the number and distribution of affected populations in the LGAs. This study used both
quantitative and qualitative research techniques for better triangulation of data results.
The main communities’ priorities identified during the exercise in Jakusko- as possible areas of
interventions- are including; Provision of capital for small scale business, seeds/fertilizer for farming,
fodder for livestock, farming inputs, borehole for irrigation farming, access to agricultural credit.
While in Bade, Provision of capital for small scale business, seeds for farming, fertilizer, capacity
building on livestock and fishing farming, Support for expansion of irrigation farming, market
construction. In Damaturu, the primary communities’ priorities included, provision of capital for small
scale business, seeds for farming and fertilizer.
The results indicate that more households are adopting negative coping strategies to sustain their
livelihood. Most HHs seem to focus on the immediate with no set plans for the long-term recovery.
Assets remains depleted as food security indicators also remains poor. This trend is worrisome as
strategies for combating chronic food insecurity seems bleak as more focus on addressing acute food
insecurity. Humanitarian agencies and partners can redesign program intervention to reflect roadmap
for recovery that strengthens the livelihood system, which reflects a positive outcome for individuals,
households and communities. Summary of the assessment indicates that;
• The livelihood condition is worse among displaced households than resident.
• The situation is more critical among the female-headed households across residential groups.
Livelihood is multi-dimensional and requires a multi sectoral approach intervention. Strategies for
livelihood should be community based and focusing on community priorities, rather than top down
approach without community consultations. The following can be considered;
• Partners and government can initiate policies that targets development of small medium
enterprises that are resilient and strategically linked to local and national value chains. Such
policy should focus mainly on enhancing the rebuilding businesses for sustainability.
• Liaise with other implementing partners on small capital for small-scale market, agricultural
tools, link farmers with government to access fertilizers at subsided rate and seeds for
livelihood protection
• Enhancing poor communities’ access to affordable improved farm inputs and information on
improved cultivation.
27
• Encourage household to have alternative income generating activities- nonagricultural- for
rural poor women and adult girls such as tailoring, weaving, embroidery, petty trading etc.
• Optimize skills building trainings, assets creation and implementation of livelihood activities in
off-season based on seasonal calendars for men and women.
• Targeting for livelihood support should be based on identified trends from this report so the
most vulnerable can be properly reached based on set criteria
• Linking partners to provide WASH interventions– Borehole for clean drinking water and
improving Hygiene practices to avoid incidence of water borne sickness and increase cases of
malnutrition.