Embed Size (px)
Citation preview

Davao
Region 11
Rapid FieldAppraisal of Decentralization

This study is made possible by the generous support of the American people through the United States Agency for International Development (USAID) through Cooperative Agreement Number AID 492-A-00-09-00031-00. The contents are the responsibility of The Asia Foundation and do not necessarily reflect the views of USAID or the United States Government.

More Responsive Local Governments
3
More Responsive Local Governments
Ed. B. Prantilla
ExEcutivE Summary
Decentralization has made the local governments more responsive to the needs of their area by passing ordinances to provide development direction, as well as by promoting investments and managing their resources. Economic activities, however, are generally centered in cities, and cities showed lesser dependence on internal revenue allotment compared to provinces and municipalities.
Results of the focused group discussions (FGDs) and key informant interviews (KIIs) also showed that decentralization weakened the connection between the provincial and municipal governments. A local chief executive (LCE) at the provincial level remarked that the provincial governor has no administrative control over the municipal government. This minimal or lack of administrative control over the municipalities made it difficult to have a unified development direction for the whole province. A retired regional executive of the Department of Interior and Local Government (DILG) said that this is especially true if the governor and the municipal mayors belong to different political parties. Decentralization also made it difficult to attain horizontal consistency among the various municipal development plans and vertical consistency of municipal and provincial development plans. This is because a municipal development plan may be formulated independent of other plans in that local government unit (LGU), even as municipal development plans may also be formulated independent of the provincial development plans.
Devolution has affected significantly the operations of the agriculture office at all levels in the region. First, the link between the province and the municipal agriculture offices has been weakened with the implementation of Republic Act (RA) 7160. Decentralization has also removed the administrative supervision of the provincial agriculture office on the municipal agriculture offices. Indeed, one municipal agriculture official said that under the present set-up they could ignore the provincial agriculture office. Second, decentralization has caused the fragmentation of agriculture programs and projects, that is, the municipalities could pursue different programs and projects based on their own priorities. Third, the research and extension functions of the local agriculture offices are now practically dependent on the priorities of the LCE. Thus, in one province, agricultural research has practically ceased while in another it is active. The same is true with agricultural extension. Because of the logistical support that agricultural extension requires, the absence of funding support for transportation and

Rapid Field Appraisal of Decentralization: Region 11
4
supplies and materials will practically bring the program to a standby mode. Fourth, devolution has brought frustrations to the devolved personnel of the Department of Agriculture (DA), especially those in-low income municipalities. This is not only because their remuneration has remained stagnant over the years, they also have to discharge the same functions with less funding support.
Yet, it should be stressed that in spite of such problems, considerable achievements have been registered by the provincial/city/municipal agricultural offices on local development. Thus, in Davao del Norte, the research conducted by the Provincial Agriculture Office (PAGRO) resulted in the establishment of planting seasons for crops to minimize the incidence of pest and diseases and as a consequence lowered the use of agricultural chemicals. The support given by PAGRO to farmers also resulted in two GAWAD SAKA (annual search for outstanding achievement in agriculture) winners. PAGRO has used the GAWAD SAKA winners as partners in disseminating modern farming technology to farmers.
At the municipal level, the Municipal Agriculture Office (MAGRO) of Sta. Cruz spearheaded replanting and rehabilitation of the town’s mangroves in collaboration with students and civil society organizations (CSOs). In Mati City, the City Agriculture Office (CAGRO) is the lead organization of the reforestation of the mayor’s upland area project to combat global warming. In addition, the agricultural production programs at the local level are invariably implemented to support the nutrition program of the local governments.
It is interesting to note that another devolved agency, such as health, is not encountering the same problems faced by agriculture.
The available quantitative data could not provide a definite answer to the question of whether decentralization or RA 7160 has improved the welfare of the people at the local level. There are evidences, of course, that availability of services has improved. Thus, the percentage of households with access to safe water has increased considerably, and solid-waste management has improved. Available data on incidence of poverty at both the provincial and the municipal/city level, though, showed no significant improvement.
introduction
The study covers three provinces of Davao Region, namely: Davao del Sur, Davao del Norte, and Davao Oriental; three component cities, and six municipalities. The three component cities are: Digos City in Davao del Sur, Tagum City in Davao del Norte, and Mati City in Davao Oriental. The six municipalities are: Sta. Cruz and Don Mariano in Davao del Sur; Asuncion and Carmen in Davao del Norte, and Caraga and San Isidro in Davao Oriental. The three component cities are the largest urban centers and a major location of commerce and industry of the provinces surveyed. The six municipalities, on the other hand, were selected to provide a range of locally generated revenues of local government units and may provide an indication on the

More Responsive Local Governments
5
implementation of RA 7160 under varying levels of local government revenues and incidence of poverty. Of the six municipalities, Don Marcelino and San Isidro are categorized as third class municipalities, the rest are first class municipalities.1
The socio-demographic profile of the local government units covered by the study is presented in Table 1. Among the three provinces, Davao del Norte has the smallest land area. This is the result of the division of the original Davao del Norte province into two, namely: the present Davao del Norte and the newly created Compostela Valley Province. The province with the largest area is Davao Oriental. Among the three component cities, Mati City has the largest land area with 682 sq. km., followed by Digos City with 318 sq. km. and Tagum City with 196 sq. km. The land area of the six municipalities, on the other hand, ranged from 187 sq. km. (Asuncion) to 554 sq. km. (Caraga).
In 2007, the most highly populated province is Davao del Norte followed closely by Davao del Sur and the least populated is Davao Oriental. Among the three component cities, Tagum City’s population in 2007 was 215,967 followed by Digos City with 145,514 and Mati City with 122,046. Among the municipalities covered by the study, Sta. Cruz has the highest population with 76,113, while the least populated is San Isidro with 32,139 (Table 1).
Table 1: Socio-demographic profile of local government units covered by the study
Province/City/Municipality
Land Area
(sq.km)
Popula-tion
Aug. 1, 2007
Annual Population
Growth Rate,
2000-2007(%)
PovertyInci-
dence, 2003
(% popu-lation)
Locally Gener-
atedRevenue(mil. PhP)
2008
Internal RevenueAllotment
(mil. PhP), 2008
Davao del Sur 3,934 822,406 1.15 28.9 52.31 636.80Davao del Norte 3,463 847,440 1.86 36.8 111.35 595.27Davao Oriental 5,164 486,104 1.22 47.9 48.87 569.18Digos City 318 145,514 2.15 18.2 123.77 286.97Tagum City 196 215,967 2.64 15.4 283.08 323.02Mati City 682 122,046 2.03 32.1 83.75 388.13Sta. Cruz, DS 335 76,113 2.40 28.7 35.25 84.55Don Marcelino, DS 449 35,166 0.07 80.7 2.03 53.29Asuncion, DN 187 50,731 - 2.49 44.9 10.475 68.127Carmen, DN 278 61,656 1.59 32.1 25.72 64.63Caraga, DO 554 34,278 0.03 57.3 1.48 63.96San Isidro, DO 205 32,139 0.02 44.6 5.84 44.41
Sources of Data: NSCB, 2004 and 2008 Philippine Statistical Yearbook NSCB, 2003 Small Area Poverty Incidence Estimates NSO, 2007 Census of Population Bureau of Local Government Finance, Davao City
1 NSCB, 2009 Regional Social and Economic Trends, Davao Region, Davao City.

Rapid Field Appraisal of Decentralization: Region 11
6
Data on the locally generated revenues of local government units in 2008 showed that among the three Davao provinces, the locally generated revenues of Davao del Norte is highest at P111.35 million, while Davao Oriental registered the lowest with P48.87 million. Among the three (3) component cities, Tagum City registered the highest locally generated revenue with P283.08 million followed by Digos City with P123.77 million and lowest was exhibited by Mati City with P83.75 million. Among the municipalities included in the study, Caraga has the lowest locally generated revenue in 2008 with only P1.48 million followed closely by Don Marcelino with P2.03 million, while the highest locally generated revenue was registered by Sta. Cruz with P35.25 million.
The National Statistical Coordination Board (NSCB) small areas poverty incidence estimates of 2003 revealed that Don Marcelino has the highest poverty incidence with 80.7 percent of its municipal population below the poverty line. The lowest poverty incidence among the municipalities covered by the study is found in Sta. Cruz, Davao del Sur with 28.7 percent of its 2003 population below the poverty threshold. Among the three cities covered by the study, Tagum City has the lowest poverty incidence with 15.4 percent, the highest is found in Mati City with 32.1 percent, while among the three provinces, Davao del Sur has the lowest poverty incidence with 28.9 percent, the highest is in Davao Oriental with 47.9 percent (Table 1).
rESuLtS OF DEcENtraLiZatiON
i. Local Governance and administration
Governance has been variously defined by various organizations. The Asian Development Bank (ADB) defined governance as “the sound exercise of political, economic and administrative authority to manage a country’s resources for development. It involves the institutionalization of a system through which citizens, institutions, organizations, and groups in a society articulate their interests, exercise their rights, and mediate their differences in pursuant of a collective good.”2 Similarly, World Bank defined governance as “the manner by which public officials and institutions acquire and exercise the authority to shape public policy and provide public goods and services.”3
Local Government Ordinances
The Sangguniang Panlalawigan, the Sangguniang Panlunsod and the Sangguniang Bayan passed ordinances to manage the province/city/municipality’s resources and regulate activities within the province/city/municipality. Information collected from the office of the legislative secretary of provinces, cities, and municipalities covered by the study
2 Asian Development Bank (1995), Governance: Sound Development Management, Manila: ADB.3 World Bank (2007), “Strengthening World Bank Group Engagement on Governance
and Anti-Corruption”, http://www.worldbank.org/html/extdr/comment/governancefeedback/gacpaper-03212007.pdf, see also: World Bank (1992), “Governance and Development”, Washington, D.C.: World Bank for an earlier definition of governance by World Bank.

More Responsive Local Governments
7
showed that these ordinances vary in scope according to the level of local government. The number of ordinances passed by the local government unit also appeared to be related to the income class of local government unit. Thus, the legislative body of a province or a component city or a 1st class municipality passes more ordinances compared to a 3rd or 4th class municipality. The subject of these ordinances range from purely local concerns to the localization of national laws.
Table 2 presents a summary of the ordinances passed by the local governments covered by the study. It should be noted that the subjects of ordinances listed by province/ city/ municipalities are not exhaustive.
The role of the province could be discerned from the ordinances it approves. Among others, the Provincial Government reviews the development plans, annual investment plans, ordinances, and resolutions passed by municipalities and component cities. The review appears to be limited to determining whether the ordinance or resolution is within the powers of the Sangguniang Panlungsod or the Sangguniang Bayan4. It is noted, however, that in the case of the Comprehensive Land Use Plan (CLUP) and Zoning and Zoning Ordinance, the Housing and Land Use Regulatory Board (HLURB) is consulted to ensure that the CLUP and the Zoning Ordinance conform to HLURB requirements.
A survey of the ordinances passed by the cities and municipalities revealed that these local government units are focused on, among others, providing development direction for their area (e.g. approving comprehensive development plans, land use plans, and zoning ordinances), consolidating and expanding their capacity to generate local revenues (e.g. approving tax revenue codes), promoting local investments (e.g. approving investment incentive codes), and development, conservation, and management of fisheries and aquatic resources. In addition, the component cities and municipalities also formulated and passed ordinances that control specific activities within their jurisdiction, such as regulating the sale of fish and fish products; iron fortification of rice sold in their area; regulating the sale of certain drugs; curfew hours for minors, entry of agricultural products, quarantine of infectious diseases and infected persons, guidelines for the operation of public markets, and regulating the fares of tricycles.
By and large, it could be concluded that the respondent LGUs are proficient in passing ordinances to effectively respond to the problems confronting them and to provide development direction for the local economy.
4 See: Section 56(b) of the Local Government Code of 1991 (RA 7160).

Rapid Field Appraisal of Decentralization: Region 11
8
Table 2: Summary of major subjects of ordinances passed by provinces, componentcities and municipalities (1992 to 2010)
Local Government Level Major Subjects Covered by Ordinances Passed
Provinces
Reviewing City and Municipal Comprehensive Development Plans (CDP); Comprehensive Land Use Plan (CLUP); Solid Waste Management (SWM) Plans; Annual Investment Plans (AIP); Realignment of funds; Environmental Ordinances of Municipalities; Rules and Regulation on Mining Activities; Annual Budgets of Municipalities; Supplementary Budgets; Provincial Investment Code; Project Proposals, and Settlement of Boundary Disputes among Municipalities. Approval of provincial development plans, annual budgets and annual investment plans.
Component Cities
Approval of: Comprehensive Development Plan; Comprehensive Land Use Plan; Solid Wastes Management Plan, Investment Incentive Code; Tax Revenue Code; City Services Handbook; Children Welfare Code (Digos City); Dog Welfare Code (Digos City); Code on Economic Enterprises; Fishing Ordinance; Zoning Ordinance; Fishery Ordinance (Digos City); Reclassification of land; Land conversion; Regulation of fares of tricycles; Public market regulation, Sanitary Regulations; Creation/Establishment of Offices; Health Ordinance (rabies control, prevention and control of STI/HIV/AIDS); curfew ordinances; business regulations; literacy and other education programs (Tagum City); environmental protection; health and sanitation; traffic and transport regulations, etc.
Municipalities
Adoption of national laws, e.g. RA 9485 (Anti-Red Tape Act of 2007), and RA 9178 (Micro Business Enterprises Act of 2002); Adopting RA 7875 as amended by RA 9241 (National Health Insurance Program, Asuncion); Approving the Municipal Comprehensive Land Use Plan; Solid Waste Management Plan; Municipal Revenue Code; Investment Incentive Code; Sanitation Code (Carmen); Cemetery Code (Carmen); Water Works Code (Asuncion); Regulation of Fishing (Carmen); Regulation of the Production of Cavendish Banana (Carmen); Operation of Public Markets; Creation of Offices/Councils; regulation of quarrying and mining; curfew for minors and adults (Don Marcelino); prohibiting sale of firecrackers; regulating fishing in municipal waters (Carmen); banning the burning of rice straw; food fortification (Carmen); and land reclassification
inter-local Government relation
This study used the term inter-local government relation to describe the relationship between the province and the municipalities, and among the municipalities with regards to programs and projects, and the relationship between the provincial level offices of devolved agencies with their municipal counterparts.

More Responsive Local Governments
9
Provincial and municipal governments. A close working relationship between LGUs is necessary because the implementation of certain development programs and projects are facilitated by teamwork and collaboration among local governments units. Examples of development programs/projects that require coordination and collaboration among LGUs include the protection and conservation of vital watersheds covering two or more municipalities, protection of common aquifer recharge areas or the protection of recharge area located in another municipality, development of common sanitary landfill, ensuring food self-sufficiency for the whole province, protection and conservation of common fishing grounds, road network system that traverse different municipalities, and many more. Traditionally, the body that coordinates the planning and implementation of programs and projects is the Provincial Government. Under RA 7160, the Provincial Government supervision on the municipal governments is weak. In fact, a respondent provincial governor said that it is difficult to integrate the development plans of the municipalities under RA 7160 when the provincial government has no administrative supervisory powers over the municipalities. A retired regional executive of DILG also said that formulating a unified development direction for the province will be difficult if the governor and some of the mayors belong to different political parties.
Coordination of development programs and projects is also facilitated if there is an overall framework plan from which the city/municipal development plans follow. In other words, there are common priority areas agreed upon by the provincial and municipal/city governments. In addition, coordination is stronger if the coordinator has some control over the budget. Unfortunately, these two factors may not be present at the local level. For example, municipal governments may have different priorities which the provincial government has no power to change, and although the Provincial Legislative Body has the mandate to review the annual investment plans of municipalities and component cities, it has no power over their budgets.
Relation between devolved agencies at the provincial and municipal level. Although the effects of decentralization among the devolved agencies vary, the consensus is that the change brought by decentralization, particularly in agriculture, is not always positive. A key informant at the provincial level remarked that the most significant change brought about by RA 7160 in agriculture is that the relationship between the provincial and municipal agricultural offices has become weak. Under RA 7160, the province has no supervisory powers on the municipal agriculture offices; the feedback mechanism is thus anemic and has no continuity with the pre-RA 7160 set-up. This observation was validated by the municipal agriculture office (MAGRO) informants who said that they could not be forced to follow the provincial agriculture office (PAGRO). In fact, the same informants said that the MAGROs could even ignore the PAGRO under certain condition, for instance, if there is a conflict of priorities between the province and the municipality, the MAGROs are likely to follow the priorities of the municipality. This is because the MAGROs are responsible to the LCE and not to the PAGRO.

Rapid Field Appraisal of Decentralization: Region 11
10
The informants, however, stressed that provincial and municipal agriculture offices still work together but following certain protocol – that is, the provincial office has to have the agreement first with the LCE of the municipal agriculture office it has to work with before it implements a project. This problem may be related to the comment advanced by the provincial-level informant that before the implementation of RA 7160, there was a unified program for agriculture in the province, but after the implementation of RA 7160, the province’s agricultural program became fragmented. This could be traced to the differing priorities of the LCEs for their municipalities vis a vis the provincial priorities, and to the fact that after the implementation of RA 7160 the reporting system that was operational before decentralization or devolution was no longer followed.
The problem encountered by agriculture does not seem to be experienced by the other devolved agencies, such as health and social welfare. An observation by one informant on the Department of Health (DOH) is that they were well-prepared with regards to RA 7160. For example, the Magna Carta of Health Workers ensured that those in the health sector will be assured of receiving the remuneration and other benefits enjoyed by their non-devolved colleagues5. In addition, medical workers could not really afford to be working independently. Secondary hospitals are located in the provincial capital and managed and administered by the provincial health office, while primary health facilities are located at the municipal level. Because primary health facilities such as clinics are not equipped with laboratory facilities to conduct diagnostic tests and have limited hospital beds or rooms to accommodate the sick, those that are beyond the capabilities of the primary health clinic to treat are referred to the provincial hospitals or to the secondary health facilities of the province. The connection among the primary and the secondary health facilities necessitates a strong relationship between the provincial and municipal health personnel. Indeed, an informant from a Municipal Health Office said that they have excellent working relationship with their Provincial Health Office in delivering health services to communities and in controlling outbreaks of diseases.
transparency
Two out of the three provinces, two out of three cities, and one out of six municipalities surveyed have official websites. Different kinds of information could be accessed from these websites. Available information from the Davao del Norte website, for example, include the socio-economic profile of the province, executive-legislative agenda (ELA), investment guide, issues and events, and executive reports. From the Tagum City official website, the development thrust and achievements of the city government are listed; full copies of the latest approved city ordinances and resolutions could also be downloaded. From the official website of Mati City, bidding documents and public offerings, among others, are accessible. San Isidro is the only sample municipality
5 It was observed during the RFA that the Magna Carta for Health Workers caused other devolved workers and other local government workers to be envious. This is because to them it is unfair for other workers to have higher benefits when all of them have the same workload and are exposed to the same risks.

More Responsive Local Governments
11
with an official website, which includes the vision, mission, goal of the municipality, investment opportunities, and the town’s tourist sites.
For all LGUs, however, the common mode of information dissemination is through an annual or a quarterly state of province/city/municipality address given by the LCE. This state of the province/city/municipality address informs people on the progress of the development programs undertaken by the local government or simply enables the LGU to keep in touch with its constituents. In addition to the state of the province/city/municipality address, the office of the LCE also issues press releases to inform the people through the media, i.e. print, radio and television. In the case of the province of Davao del Sur, the press releases issued by the Office of the Governor include the list of projects approved and implemented; financial assistance given to different municipalities for their local projects; releases from the Special Education Fund, and medical mission to certain municipalities of the province.
In all the LGUs surveyed, documents such as ordinances and resolutions passed by the local governments are open to the public. These documents, however, could be accessed only if the interested party would personally go to the particular office where the documents are located. For example, ordinances and resolutions are readily accessed at the Office of the Secretary of the Sanggunian and development plans are accessed at the local planning and development office.
Local Government transactions
Local governments prominently display the Presence of Frontline Services (PFS) in their provincial capitol/city hall/municipal hall. The display on these services is presented in tabular form and consists of the following columns: (a) The kind of service available; (b) What to do, i.e. what the individual who wants that particular service should do to obtain that service; (c) Time duration expected for each service to complete; (d) Fees of charges if needed for each service, and, (e) Person to approach. This display systematizes the procedure in obtaining a particular document or service from the concerned local government department or unit.
All LGUs surveyed have a manned information desk at the entrance of the government building. The person manning the information desk is invariably courteous and readily gives direction and the name of the head of the office one wishes to visit. This innovation greatly facilitates finding the offices one has business with, especially if it is one’s first visit to the area.
Peoples’ Participation
Key informants revealed that peoples’ participation among the LGUs covered by the study consisted of (a) membership of representatives of non-government organizations (NGOs) in local government committees and special bodies; (b) as an implementing
Rapid Field Appraisal of Decentralization: Region 11
12
partner of local government in development projects; (c) as participants in LGU-organized consultations on local development planning; and, (d) as participants during the public hearing of local ordinances.
It is observed that only qualified NGOs may have representatives to the local government committees and special bodies. Qualified NGOs and interest groups are those accredited by the LGUs. Selection of representatives from the accredited NGOs or interest groups varies among LGUs. While in most cases choosing the representatives from accredited NGOs are left to the NGOs themselves, there are times when the LCE may have a direct hand in the selection process, i.e. the representative is selected after consultation with the LCE. Or the LCE may handpick the representative from the NGO. For example, in the case of Tagum City, a key informant said that the LCE actually selects the representative from the NGO or interest group. This is done to ensure that the representative from the NGO or interest group will not oppose the LCE’s proposals.
urban Environmental management
Municipalities and cities covered by the study manage their environment by passing ordinances prohibiting the burning of agricultural wastes (e.g. rice straw), proper disposal of household wastes or garbage, and sanitation. An integrated approach to waste management is usually contained in the Solid Waste Management plan (SWMP) of the municipality or city. This is also to meet the requirement of RA 9003 (Ecological Solid Waste Management Program). Of the three cities covered by the study, however, only Digos has an approved SWMP, while only two of the six municipalities studied have a SWM plan. Not surprisingly, these two, Caraga and Don Marcelino, also have approved Solid Waste Management ordinances. However, even those with approved SWMP have some difficulty in implementing the plan because of the lack of proper facility for solid waste disposal. Accordingly, what are prevalent are open dump sites rather than sanitary landfills. Even then, only 17.3 percent of the total households in Digos City were served by an open dumpsite in 2005, followed by Sta. Cruz with about nine percent, and Don Marcelino with only 4.4 percent6. Tagum City appeared more equipped in dealing with solid waste because since 2007 the city’s garbage trucks are serving 53.2 percent of the total households, while the municipality of Carmen’s garbage trucks served only 26 percent of the municipality’s total households and Asuncion, only three percent7.
Forest and coastal resource management
Safeguarding the marine and coastal resources of cities and municipalities is a major concern of the LGUs. Thus, mangrove rehabilitation/reforestation project is found in almost all coastal municipalities and cities. The MAGRO of Sta. Cruz in particular
6 PPDO (2005), Socio-economic and Physical Profile of Davao del Sur, 2001-2005. Digos City7 Government of Davao del Norte (2009), Provincial Development and Physical Framework
Plan, op.cit.
More Responsive Local Governments
13
revealed that the municipal government has sustained the funding of the Coastal Resource Management (CRM) Project, a national project, after it ended. Sta. Cruz also has a mangrove rehabilitation project, an active Bantay Dagat; Bantay (Fish) Sanctuary; and its seaside barangays are participants of the FARMC project.
The city government of Mati, meanwhile, has an Integrated Coastal Resource Management Program to identify and address the problems and issues of the city’s coastal areas. The city projects under this program include mariculture; inland fishpond production; brackish water; fish sanctuary; seaweed farming; establishment of marine park; and, enforcement of local and national fishery laws within the city waters. The Integrated Coastal Resource Management Project and Integrated Aquaculture Development Project are also a major undertakings of Davao del Norte. Safeguarding municipal waters is also done in Don Marcelino, while Caraga has an active surveillance system for illegal fishing within its municipal waters.
Although the key informants interviewed in the provinces, cities, and municipalities mentioned some LGU projects that are related to climate change, it is only Mati City that is implementing what it said is its contribution to alleviating the problem of climate change. Mati’s project is called “Plant a Tree and Grow With Me ,” the objective of which it is to rehabilitate and reforest the city’s denuded upland areas, as well as to reforest and rehabilitate its mangrove areas.
Local Finance
The result of the key informant interviews and an analysis of the data provided by the Bureau of Local Government Finance (BLGF) showed a wide variation on the amount of tax and non-tax revenues generated by the LGUs. There appears to be a direct relationship between the amount of locally generated revenue and the level of economic development of the area. In addition, it is also observed that there is an inverse relationship between the percentage of population below poverty line and the amount of locally generated revenue.
Impact on Local Finance
Uneven effects of the Local Government Code (LGC) of 1991 on local government finance are evident in the sample LGUs covered by the study. Locally generated revenue is highest among cities. This is obviously the result of a wider taxing and revenue generation powers and opportunities available to cities compared to provinces and municipalities, as well as due to the fact that industries and business enterprises are mostly located in cities. Accordingly, the dependency of LGUs on the internal revenue allotments (IRA) measured as the percentage of IRA to the total local government revenue is higher in municipalities and provinces compared to the three component cities covered by the study (Table 3).
Rapid Field Appraisal of Decentralization: Region 11
14
The high fiscal dependency of Davao del Sur and Davao Oriental on their IRA appeared to be related to their relatively higher reliance on their tax revenue as the main source of their locally generated revenues. This is in contrast to Davao del Norte, which has about 64 percent of its total locally generated revenue coming from non-tax sources. Nevertheless, without their IRA, all three provinces covered by the study will not be able to sustain their operation. Locally generated revenues of the three provinces could cover only eight percent to nine percent of their total expenditures in the case of Davao del Sur and Davao Oriental, and about 20 percent of its total expenditure in the case of Davao del Norte.
The fiscal data of the three provinces for the period 2004 to 2008 showed that, on the average, all three have surpluses, i.e. with the percentage of total revenue to total expenditure ranging from a low of 108 percent (Davao Oriental) to a high of 115 percent (Davao del Sur). When these surpluses were verified, however, it was found out that these were not free surpluses, i.e. there are restrictions attached to these surpluses. Basically, what appeared as surpluses have minimal cash equivalent. This is because the amount appearing as surpluses were already programmed to cover the payables, trust liabilities, and mandatory obligations of the local government. According to the accounting and the treasury departments of the local governments, all the LGU’s funds are already programmed. Indeed, because the IRA is remitted regularly to the LGUs every month, the amount is programmed even before it reaches the LGU.
The three component cities covered by the study registered lower dependency on their IRAs from 2004 to 2008. The lowest fiscal dependency was registered by Tagum City, with an average percentage of its IRA to total revenue at 53 percent and a percentage of locally generated revenue to its IRA of a little over 76 percent. At the other end is Digos City whose IRA accounted for 73 percent of its total revenue and whose locally generated revenue was only 37 percent of its IRA (Table 3), while Mati City has about 66 percent of its total revenue accounted for by its IRA and whose locally generated revenue was a respectable 59 percent of its IRA.

More Responsive Local Governments
15
Table 3: Selected fiscal indicators of three provinces and three cities, Davao Region (2004-2008)
Indicator
Five Years Average, 2004-2008
Davao del Sur
Davao del
Norte
Davao Oriental
Digos City
Tagum City Mati City
Percent IRA to Total Revenue 92.98 82.42 92.16 73.02 53.29 65.59
Percent Locally Generated Revenue to IRA
7.55 21.52 8.52 37.09 76.48 59.45
Percent Tax Revenue to Local Generated Revenue
54.03 36.80 46.68 43.97 52.58 39.45
Percent Locally Generated Revenue to Total Expenditure
8.05 19.55 8.63 28.39 48.51 36.43
Percent IRA to Total Expenditure 106.91 91.68 99.38 76.86 63.64 70.23
Percent Total Revenue to Total Expenditure
114.96 111.25 108.02 105.25 112.15 106.66
Source of Basic Data: Bureau of Local Government Finance, Davao City
The relatively better fiscal performance of the three cities could be attributed to the exercise of their broader taxing powers. Cities, after all, can impose provincial and municipal taxes.8 It was observed also that Tagum City have levied more taxes and appeared to have higher efficiency in collecting real estate and other taxes and fees.
The financial data for the period 2004 to 2008 of the six municipalities covered by the study showed varying dependency on the IRA as their source of local revenue (Table 4). The highest average percentage of the IRA to total revenue was registered by Caraga, Davao Oriental with 97 percent, followed closely by Don Marcelino with 96 percent, and not far behind are the municipalities of San Isidro, Davao Oriental, and Asuncion, Davao del Norte with percent IRA to total revenue of about 88 percent. Sta. Cruz, Davao del Sur, and Carmen, Davao del Norte have 72 percent and 75 percent IRA to total revenue respectively, the lowest among the municipalities studied. These figures imply that the percentage of locally generated revenue to total revenue in these six municipalities ranged from a low 2.7 percent in the case of Caraga, Davao Oriental to a high 28.3 percent in the case of Sta. Cruz, Davao del Sur.
It was noted that while local business taxes may be a major source of revenue, there are not many business establishments located in the municipalities. Unfortunately,
8 See: Rosario G. Manasan, “Fiscal Implications of the Local Government Code of 1991”, Journal of Philippine Development, No. 34, Vol. XIX, No. 1, First Semester 1992.

Rapid Field Appraisal of Decentralization: Region 11
16
the number of business establishments in a municipality is closely related to the town’s location, the state of its infrastructure and utilities, and its natural resource endowment. In other words, municipalities located far from major urban centers and which have limited infrastructure and utilities will not attract business investors. With few business enterprises to tax, the LGUs of municipalities will depend largely on real estate taxes as the major source of their locally generated revenue. Yet not only is real estate tax “acknowledged as an expensive and difficult tax to levy,”9 landowners in poor municipalities hardly pay their real estate tax. It may not be by accident that Don Marcelino and Caraga, which have the highest poverty incidence among the municipalities studied, also have the lowest percentage of locally generated revenues compared to their IRAs (Table 4).
Table 4: Selected fiscal indicators of six municipalities, Davao Region (2004-2008)
Indicator
Five Years Average, 2004-2008Sta.
Cruz, DS
Don Marcelino,
DS
Carmen, DN
Asuncion, DN
Caraga, DO
San Isidro,
DOPercent IRA to Total Revenue 71.70 96.53 75.03 87.57 97.27 87.95
Percent Local Generated Revenue to IRA
39.65 3.60 33.39 14.21 2.82 13.72
Percent Tax Revenue to Local Generated Revenue
74.94 55.46 68.90 58.36 44.21 38.78
Percent Local Generated Revenue to Total Expenditure
30.08 3.89 29.16 11.81 3.92 12.72
Percent IRA to Total Expenditure 75.83 108.25 87.55 83.62 139.01 92.87
Percent Total Revenue to Total Expenditure
105.91 112.14 116.71 95.42 142.93 105.59
Source of Basic Data: Bureau of Local Government Finance, Davao City
Revenue Structure of Local Governments
Data from the BGLF showed that during 2004 to 2008, the average locally generated revenue accounted for seven percent of the total revenue in the case Davao del Sur and about eight percent in the case of Davao Oriental, but registered 17 percent in the case of Davao del Norte. The major source of locally generated revenues at the provincial level is non-tax revenue in Davao del Norte, while in Davao Oriental and Davao del
9 See: Milwida M. Guevarra, “The Fiscal Decentralization Process in the Philippines: Lessons From Experience”, http://www.econ.hit-u.ac.jp/~kokyo/APPPsympo04/Philippine-Guevara.pdf. Accessed: April 12, 2010

More Responsive Local Governments
17
Sur the contribution of tax revenue and non-tax revenue to locally generated revenues are almost equal (Table 5). All three provinces exhibited high dependency on the IRA as their source of their revenue.
Table 5: Average revenue generation structure of 3 provinces, and 3 component cities in Davao Region (2004-2008)
Item Davao del Sur
Davao del
Norte
Davao Oriental
Digos City
Tagum City Mati City
Total Revenue(PhP million) 558.74 553.43 498.32 356.43 484.40 223.23
Percent of TotalLocally Generated Revenue 7.04 17.29 7.83 27.29 43.43 7.83
Tax Revenue 3.84 6.04 3.62 11.99 22.52 3.62 Non-Tax Revenue 3.19 9.33 4.19 12.70 17.94 4.19Internal Revenue Allotment 92.96 82.69 92.17 72.71 56.57 92.17
Other Revenue 0.01 1.92 0.02 2.61 2.97 0.02Source of Basic Data: Bureau of Local Government Finance, Davao City
Among the three component cities, Tagum City registered the highest average locally generated revenue relative to its total revenue. Thus, for Tagum City, the percentage IRA to total revenue average only 56.57 percent during the 2004 to 2008 period, a sharp contrast to Mati City whose IRA accounted for 92 percent of its total revenue for the same period. Digos City’s IRA, by comparison, was 73 percent of its total revenue.
Among the six municipalities included in the study, the lowest locally generated revenues were registered by Caraga in Davao Oriental and Don Marcelino in Davao del Sur. Both Caraga and Don Marcelino are located far from Mati City and Digos City, and both are experiencing a sizeable out-migration10. The highest locally generated revenue was registered by Sta. Cruz, followed closely by Carmen with 25.33 percent. A far third are the municipalities of Asuncion and San Isidro whose locally generated revenues accounted for about 12 percent of their total revenues (Table 6).
10 This is inferred from the very low annual population growth of Caraga which is 0.03% and Don Marcelino which is 0.07% compared to the Philippines annual population growth of 2.04% all for the period from 2000 to 2007 (See Table 1, this report).

Rapid Field Appraisal of Decentralization: Region 11
18
Table 6: Average revenue generation structure of 6 municipalities in Davao Region (2004-2008)
Item Sta. Cruz
Don Marcelino Carmen Asuncion Caraga San
IsidroTotal Revenue(PhP million) 93.27 45.12 69.31 62.90 59.86 44.42
Percent of TotalLocally Generated Revenue 28.54 3.49 25.33 12.48 2.65 11.99
Tax Revenue 21.41 1.96 16.77 7.18 1.19 4.63 Non-Tax Revenue 6.97 1.17 8.24 5.31 1.46 7.36Internal Revenue Allotment 71.46 96.51 74.68 87.52 97.35 88.01
Other Revenue 0.17 0.00 0.32 0.00 0.00 0.00Source of Basic Data: Bureau of Local Government Finance, Davao City
Expenditure Structure of Local Governments
Expenditures of local government units are grouped into nine categories, namely: General Public Services; Health, Nutrition and Population; Education; Housing and Community Development; Social Welfare; Economic Services; Debt Service, and Other Expenses. At the provincial level, the bulk of local government expenditures are accounted for by General Public Services; Other Expenses; Health, Nutrition and Population, and Economic Services. These four expenditure categories (General Public Services; Health, Nutrition and Population; Economic Services, and Other Expenses) account for 92 to 93 percent of the average total annual expenditures of the Provinces of Davao del Sur; Davao del Norte and Davao Oriental during the period 2004 to 2008.
The same four expenditure categories account for 95 percent of the total average expenditure of Digos City and 93 percent of the average total expenditure of Mati City, while about 87 percent of the average total annual expenditure of Tagum City is accounted for by General Public Services, Economic Services, Debt Service, and Other Expenses (Table 7).
All three provinces and three component cities included in the study have spent a minimal amount or nothing on Education, Housing and Community Development, and Social Welfare. At the same time, all of them spent considerable amount on Other Expenses category11. Among the three provinces, Davao del Norte is the least indebted, paying only P13.16 million for debt service on the average annually, while Davao Oriental is paying P21.02 million and Davao del Sur is paying P20.18 million for
11 Other expenses include among others: calamity fund; interfund transfers; aids to national government agencies; aids to barangays; inter-local government transfers; aids to non-government entities; and budgetary reserves (From BLGF SRE Form No.1 (Revised 2007).

More Responsive Local Governments
19
debt amortization annually. Among the three component cities, Tagum City appears to be heavily indebted, paying an amount of P34.09 million annual amortization. By contrast, Digos City pays only an average of P1.02 million, and Mati City P8.17 million amortization annually.
Table 7: Average structure of expenditure of 3 provinces and 3 cities, Davao Region (2004-2008)
Item Davao del Sur
Davao del
Norte
Davao Oriental
Digos City
Tagum City Mati City
Total Expenditure (PhP million) 486.33 502.59 498.32 340.13 432.08 209.55
Percent of TotalGeneral Public Services 24.36 41.77 31.36 25.91 37.02 50.42
Health, Nutrition and Population 14.69 10.29 15.69 4.97 3.26 4.50
Education 1.84 2.92 2.01 2.00 6.35 2.11Housing and Community Dev. 0.00 0.14 0.00 1.41 2.71 0.00
Social Services and Welfare 2.00 2.37 1.15 1.36 1.02 1.10
Economic Services 11.44 14.89 11.90 15.34 17.16 18.91Debt Service 4.15 2.62 4.22 0.30 7.89 3.90Others 41.52 25.00 33.67 48.71 24.59 19.04
Source of Basic Data: Bureau of Local Government Finance, Davao City
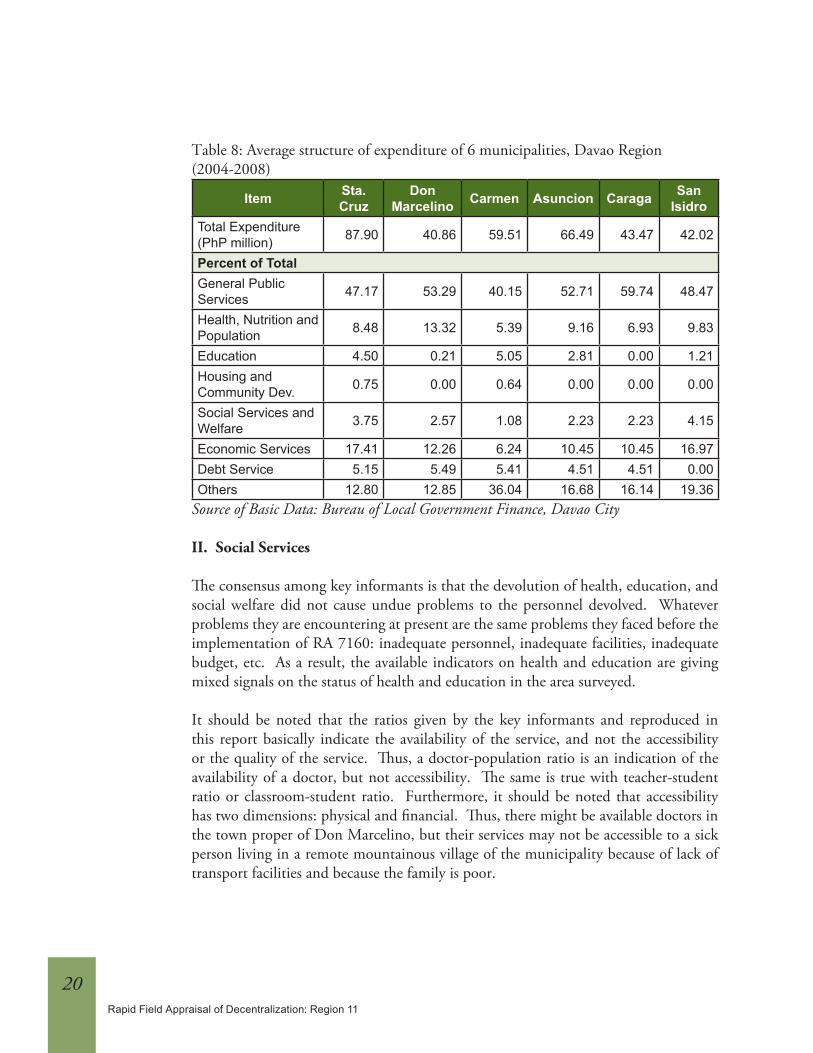
A similar trend of the average total annual expenditure is observed in the six municipalities covered by the study. General Public Services, Health, Nutrition and Population, Economic Services, and Other Expenses account for 95 percent of the average total annual expenditure of San Isidro; in Caraga, 93 percent; Don Marcelino, 92 percent; Asuncion, 89 percent; Carmen, 88 percent; and Sta. Cruz, 86 percent (Table 8). All six municipalities have either minimal or zero expenditures on Housing and Community Development, and Education. And except for San Isidro, all the municipalities surveyed spent nearly five percent to a little over five percent of their average total annual expenditure on debt service (Table 8).
Rapid Field Appraisal of Decentralization: Region 11
20
Table 8: Average structure of expenditure of 6 municipalities, Davao Region(2004-2008)
Item Sta. Cruz
Don Marcelino Carmen Asuncion Caraga San
IsidroTotal Expenditure (PhP million) 87.90 40.86 59.51 66.49 43.47 42.02
Percent of TotalGeneral Public Services 47.17 53.29 40.15 52.71 59.74 48.47
Health, Nutrition and Population 8.48 13.32 5.39 9.16 6.93 9.83
Education 4.50 0.21 5.05 2.81 0.00 1.21Housing and Community Dev. 0.75 0.00 0.64 0.00 0.00 0.00
Social Services and Welfare 3.75 2.57 1.08 2.23 2.23 4.15
Economic Services 17.41 12.26 6.24 10.45 10.45 16.97Debt Service 5.15 5.49 5.41 4.51 4.51 0.00Others 12.80 12.85 36.04 16.68 16.14 19.36
Source of Basic Data: Bureau of Local Government Finance, Davao City
ii. Social Services
The consensus among key informants is that the devolution of health, education, and social welfare did not cause undue problems to the personnel devolved. Whatever problems they are encountering at present are the same problems they faced before the implementation of RA 7160: inadequate personnel, inadequate facilities, inadequate budget, etc. As a result, the available indicators on health and education are giving mixed signals on the status of health and education in the area surveyed.
It should be noted that the ratios given by the key informants and reproduced in this report basically indicate the availability of the service, and not the accessibility or the quality of the service. Thus, a doctor-population ratio is an indication of the availability of a doctor, but not accessibility. The same is true with teacher-student ratio or classroom-student ratio. Furthermore, it should be noted that accessibility has two dimensions: physical and financial. Thus, there might be available doctors in the town proper of Don Marcelino, but their services may not be accessible to a sick person living in a remote mountainous village of the municipality because of lack of transport facilities and because the family is poor.

More Responsive Local Governments
21
Health Services
Local government expenditures on Health, Nutrition, and Population. Local government expenditures on Health, Nutrition, and Population usually ranked fourth and is considerably lower compared to the local government expenditures on General Public Services or of Other Expenses. To gauge the relative importance of health, nutrition, and population among the LGUs studied, the annual per capita expenditure of local governments on health, nutrition, and population was calculated for each province, city, and municipality included in this study.
Except in Tagum City and Carmen, Davao del Norte, all provinces, cities, and municipalities covered by the study registered increasing per capita expenditure on Health, Nutrition, and Population during the period 2004 to 2008. In 2004, per capita expenditure on Health, Nutrition, and Population ranged from a low of P58.23 in Carmen to a high of P139.95 in the province of Davao Oriental. In 2006, the lowest per capita expenditure on health, nutrition, and population was registered by Tagum City with P52.78 and the highest was exhibited by the municipality of Don Marcelino with P154.43. In 2008, the lowest per capita expenditure on health, nutrition, and population was found in Carmen, with P49.17, while the highest was in the province of Davao Oriental, with P209.62.
Interestingly, Don Marcelino, which has the highest incidence of poverty among the municipalities studied, registered a consistently higher per capita expenditure on Health, Nutrition and Population. The same is also observed in San Isidro. The province of Davao del Norte, which has a lower poverty incidence compared to Davao Oriental, exhibited a lower per capita expenditure on Health, Nutrition, and Population. Similarly, Tagum City, which has the highest income among cities, and the lowest incidence of poverty among the LGUs studied, registered a lower per capita expenditure on Health, Nutrition, and Population (Table 9).
An explanation of the lower and declining per capita expenditure on Health, Nutrition, and Population of Tagum City could only be conjectured. One possible explanation is that the relatively higher per capita income12 of the city’s residents enabled them to pay for their health care needs. Accordingly, they made more use of private health services instead of public hospital and clinics.
12 There are no available per capita income estimates for Tagum City and other cities and municipalities studied. It is logical to assume, however, that if Tagum City has the lowest poverty incidence among the LGUs studied, it must have also the highest average per capita income.

Rapid Field Appraisal of Decentralization: Region 11
22
Table 9: Annual per capita expenditure of local governments on health, population, and population in pesos (2004-2008)
Province/City/MunicipalityPer Capita Expenditure on Health, Nutrition
and Population in Philippine Peso2004 2006 2008
Davao Oriental 139.95 147.81 209.62Davao del Norte 57.25 55.90 72.13Davao del Sur 78.32 66.90 115.31Digos City 70.73 138.60 150.50Mati City 58.64 76.83 100.46Tagum City 95.10 52.78 64.24Don Marcelino, Davao del Sur 133.74 154.43 189.82Sta. Cruz, Davao del Sur 79.71 94.96 120.48Asuncion, Davao del Norte 87.93 112.51 153.64Carmen, Davao del Norte 58.23 59.22 49.17Caraga, Davao Oriental 63.84 113.89 91.87San Isidro, Davao Oriental 105.58 109.32 159.90
Source of Basic Data: Bureau of Local Government Finance, Davao City NSCB, 2009 Regional Social and Economic Trends (Davao Region), Davao City (for census population, 2000 and 2007)
Availability of health services. Public health services perform both curative and preventive medical services to the population. These health services are carried out by public and private doctors and other medical personnel. The availability of public services at the provincial level (2007) is presented in Table 10. The indicators showed that there is a shortage of public medical personnel at the provincial level. It is only with midwives that the three provinces have met the national standard ratio. And yet the Socio-Economic Profile (SEP) of Davao del Sur from 2001 to 2005 placed the doctor-population ratio of the province in 2005 at 1:15,308 – that is, indicating more than adequate public doctors in the province. Also, it listed for the same year a doctor-population ratio in Don Marcelino of 1:9,379, and Digos City’s doctor-population ratio of 1:5,312. It is only in Sta. Cruz that a shortage of public doctors is indicated, the municipality having a doctor-population ratio of 1:77,322.
Table 10: Public health services indicators, by province, Davao Region (2007)
Indicator/Province Davao del Sur
Davao del Norte
Davao Oriental
National Standard
Doctors 1:54,287 1:56,496 1:40,509 1:20,000Nurses 1:23,497 1:26,453 1:25,584 1:20,000Dentists 1:58,743 1:44,602 1:44,191 1:50,000Midwives 1:3,973 1:4,556 1:2,810 1:5,000

More Responsive Local Governments
23
Indicator/Province Davao del Sur
Davao del Norte
Davao Oriental
National Standard
Med-Tech 1:82,241 1:32,594 1:90,889 -Sanitary Inspectors 1:29,372 1:47,080 1:75,741 1:20,000
Source: Davao del Norte, Provincial Planning and Development Office and Provincial Health Office, Tagum City.
One of the major services performed by health personnel is the immunization of children and mothers. Table 11 presents the accomplishments of the provinces covered by the study for the years 2003 to 2008. During this three-year period, the percentage of fully immunized children in the provinces of Davao Oriental, Davao del Norte, and Davao del Sur exhibited a decline in the percentage of children fully immunized. The percentage, however, increased in 2008, such that they were higher than the percentage of children fully immunized in 2003. As a whole, therefore, the percentage of fully immunized children has increased from 2003 to 2008.
Table 11: Fully immunized children, by province/city (2003-2008)
Province/CityPercent Covered
2003 2004 2008Davao Oriental 72.9 67.0 76.4Davao del Norte 73.3 60.7 75.5Davao del Sur 70.6 69.9 78.7
Source: NSCB, 2009 Regional Social and Economic Trends, Davao Region. NSCB, Davao City
Available data on the three provinces’ measles immunization program for one-year old and below infants showed that the percentage of fully immunized infants rose during the period 2003 to 2008, with the highest percentage increase registered by Davao del Sur, whose percent fully immunized below one-year old infants against measles jumped from 71.5 percent in 2003 to 78.4 percent in 2008 (Table 12). Davao del Sur is also the only province among the three covered by the study that did not register a decline in the percentage of fully immunized below one-year old infants in 2004. This contrasted with Davao del Norte whose percentage of fully immunized below one-year-old infants dropped from 75.1 percent in 2003 to 59.4 percent in 2004, before increasing to 75.6 percent in 2008.
Table 12: Fully immunized below one-year old infant against measles, by province/city (2003-2008)
Province/CityPercent Covered
2003 2004 2008Davao Oriental 74.0 73.6 76.4Davao del Norte 75.1 59.4 75.6Davao del Sur 71.5 72.5 78.4
Source: NSCB, 2009 Regional Social and Economic Trends, Davao Region. NSCB, Davao City

Rapid Field Appraisal of Decentralization: Region 11
24
Available data from 2005 to 2008 showed a declining percentage of pre-school age children found to have below normal, low (BNL), and below normal, very low (BNVL) weights. In Davao Oriental the percentage of pre-school age population in the BNL and BNVL category dropped from about 18 percent in 2005 to 15 percent in 2008. In Davao del Norte the drop was from 14 percent in 2005 to 10 percent in 2008, and in Davao del Sur, from about 17 percent in 2005 to 15 percent in 2008. The same downward trend was also observed in Tagum City where the percentage of pre-school age population belonging to BNL and BNVL categories dropped from 11 percent in 2005 to a little over eight percent in 2008, and in Digos City from about 15 percent on 2005 to 11 percent in 2008 (Table 13). One explanation for the relatively good performance of the LGUs in nutrition is that their agricultural production programs are closely connected with their nutrition program. Thus, the promotion of vegetable production is not only to supplement the income of households but also for families to eat more vegetables.
Table 13: Nutritional status of pre-schoolers, by province/city, (2005 and 2008)
Province/City
2005 2008
ChildrenWeighed
Total BNL and
BNVL
Percent of BNL
and BNVL of Total Children Weighed
ChildrenWeighed
Total BNL and
BNVL
Percent of BNL
and BNVL of Total Children Weighed
Davao Oriental 64,148 11,501 17.93 70,039 10,626 15.17Davao del Norte 46,582 6,565 14.09 49,940 5,045 10.10Davao del Sur 94,399 15,813 16.75 102,981 15736 15.28Tagum City 23,598 2,602 11.03 27,078 2,282 8.43Digos City 17,780 2,596 14.60 19,901 2,264 11.38Mati City NA NA NA NA NA NA
Source: NSCB, 2009 Regional Social and Economic Trends, Davao Region. NSCB, Davao City
Note: BNL = below normal, low; BNVL = below normal, very low Safe Water Supply
Available data show that access to safe water in municipalities and cities included in the study has increased considerably in recent years. In Don Marcelino, the percentage of households with access to safe water increased from 24.3 percent in 2001 to 66.1 percent in 2005, while in Sta. Cruz, the percentage of households with access to safe water increased from 58.8 percent in 2001 to 79.4 percent in 2005. Similarly in Digos City the percentage of households with access to safe water increased from 84.8 percent in 2001 to 91.7 percent in 2005.13 The percentage of households with access
13 PPDO (2005), Socio-economic and Physical Profile of Davao del Sur, 2001-2005. Digos City, 2005

More Responsive Local Governments
25
to safe or potable water in Tagum City was reported at 100 percent, while Asuncion’s comparative figure was 94 percent, and in Carmen 68 percent, all in 200714. In Mati City, the percentage of households with access to safe water was 88 percent in 200715 and for the whole province of Davao Oriental, 86 percent16. It is noted that the most effective way to control water borne diseases is to ensure that households have access to safe water supply.
All local governments included in the survey indicated that they considered it high priority to provide safe water to households in their area. Funding for water supply projects is not only sourced from local funds, but also from national government agencies. Thus, in Sta. Cruz, the Municipal Agriculture Office (MAO) reported that the water systems of the town’s three barangays were funded through the Department of Agriculture (DA). Recently, the water system of one of the barangays in Mati City was constructed and completed with funding from the Mindanao Rural Development Project (MRDP).
Sanitary toilets
Data on the percentage of households with sanitary toilets in the covered cities and municipalities are not of the same years, hence making comparisons difficult. In any case, the trend was observed to be uneven in some areas. In Digos City, the percentage of households with sanitary toilets declined from 94.9 percent in 2002 to 72.6 percent in 2005. A similar trend was noted in Sta. Cruz, where the percentage of households with sanitary toilets dropped from 76.5 percent in 2001 to 49.1 percent in 2005. In contrast, Don Marcelino, which had only 62.9 percent of its total households with sanitary toilets in 2001, reported that 90.2 percent of its total households had sanitary toilets by 200517.
A higher percentage of total households with sanitary toilets were reported by sample local governments units included in the survey in Davao del Norte. Tagum City reported that 99 percent of its households had sanitary toilets in 2007; followed by Carmen with 96 percent, and Asuncion with 89 percent. The province of Davao del Norte, as a whole, reported that 85.65 percent of its total households have sanitary toilets in 200718. Mati City, meanwhile, reported that 80 percent of its total households had sanitary toilets in 200719. For the whole province of Davao Oriental, 75.4 percent of the total households had sanitary toilets by 200720.
14 Government of Davao del Norte (2009), Provincial Development and Physical Framework Plan, Davao del Norte, 2008-2013.
15 This data was provided by the City Planning and Development Office of Mati City16 Government of Davao Oriental (2010), Provincial Development and Physical Framework
Plan of Davao Oriental. 2010-2020.17 PPDO (2005), Socio-economic and Physical Profile of Davao del Sur, 2001-2005. Digos City18 Government of Davao del Norte (2008), Provincial Development and Physical Framework
Plan, Davao del Norte, 2008-201319 City Planning and Development Office, Mati City20 Government of Davao Oriental (2010), Provincial Development and Physical Framework
Plan of Davao Oriental, 2010-2020.

Rapid Field Appraisal of Decentralization: Region 11
26
Education
Annual per capita expenditures of LGUs on education vary widely during the years 2004, 2006, and 2008. For the three provinces, per capita expenditure on education range from a low of P8.36 (Davao del Sur) in 2004 to a high of P28.11 (Davao Oriental) in 2006. In contrast, the lowest per capita expenditure on education in the three cities was exhibited by Tagum City in 2004, with P17.34 and the highest per capita expenditure was registered by Mati City in 2008, with P143.32. Among the six municipalities, Caraga did not register any expenditure on education during the period 2004 to 2008, while the highest per capita expenditure on education was registered by Carmen, with P57.24 in 2006 (Table 14).
Per capita expenditure of local governments on education expresses more the priority of the local governments rather than the operational state of the education sector at the local level. This is because salaries and operating expenses of public schools at the local level are provided by the national government, i.e. by the Department of Education (DepEd). Similarly, school buildings, textbooks, and other school facilities are generally the responsibility of the national government.
Table 14: Annual per capita expenditure of local governments on education in pesos (2004-2008)
Province/City/MunicipalityPer Capita Expenditure on Education in
Philippine Pesos2004 2006 2008
Davao Oriental 14.28 28.11 27.76Davao del Norte 16.59 20.03 20.95Davao del Sur 8.36 9.36 12.87Digos City 39.40 41.14 56.65Mati City 89.84 142.25 143.32Tagum City 17.34 27.03 70.11Don Marcelino, Davao del Sur 2.39 2.38 3.13Sta. Cruz, Davao del Sur 37.70 38.14 91.61Asuncion, Davao del Norte 20.52 32.37 47.30Carmen, Davao del Norte 44.95 57.24 49.33Caraga, Davao Oriental 0.00 0.00 0.00San Isidro, Davao Oriental 14.81 7.25 24.58
Source of Basic Data: Bureau of Local Government Finance, Davao City NSCB, 2009 Regional Social and Economic Trends Davao Region, Davao City (for census population, 2000 and 2007).
On average, the teacher-pupils ratio and the classroom-pupils ratio in public elementary schools in the three provinces covered by the study meet the standard set by the DepEd (Table 15). Tagum City’s teacher-pupils ratio and classroom-pupils ratio are slightly

More Responsive Local Governments
27
over the standard ratio of 1:40. In some public elementary schools, however, the teacher-pupils ratio may be higher or lower than the provincial average. These ratios, by and large, indicate the availability of the service or facilities and not the quality of education.
Table 15: Adequacy of teachers and classrooms in public elementary schools, by province/city, Davao Region (2002-2003 and 2008-2009)
Province/City2002-2003 2008-2009
Teacher-Pupil Ratio
Classroom-Pupil Ratio
Teacher-Pupil Ratio
Classroom-Pupil Ratio
Davao Oriental 1:34 1:35 1:33 1:36Davao del Norte 1:38 1:41 1:37 1:38Davao del Sur 1:34 1:35 1:32 1:34Digos City 1:34 1:43 1:33 1:34Tagum City 1:41 1:49 1:41 1:47
Source: Department of Education, Region 11 NSCB, 2009 Regional Social and Economic Trends, Davao Region. NSCB, Davao City
Performance indicators in both public elementary and secondary schools at the provincial level showed a relatively high gross participation rate, retention rate and graduation rate in all three provinces and two cities where data are available. There was also a considerable drop in the drop-out rate, in the case of Davao Oriental from 16.3 percent in SY 2002-03 to 0.8 percent in SY2008-09, and in the case of Davao del Sur from 13.2 percent in SY 2002-03 to 0.3 percent in SY 2008-09 (Table 16). The same phenomenon is observed in Davao del Norte, as well as in the cities of Digos and Tagum. What is disturbing, however, is that in spite of the high retention rate and low drop-out rate, all three provinces registered a survival rate that ranged only from 51 percent to 63 percent in SY 2008-09. Tagum City exhibited the highest survival rate of 71 percent in SY 2008-09.
Table 16: Performance indicators in public elementary schools, by province/city (2002-2003 and 2008-2009)
Province/City/Indicator
Year Province/City/Indicator
Year2002-03 2008-09 2002-03 2008-09
Davao Oriental Davao del NorteGraduation Rate 91.4 96.5 Graduation Rate 97.8 97.1Retention Rate 86.9 87.7 Retention Rate 93.0 90.1Drop-out Rate 16.3 0.8 Drop-out Rate 8.1 1.3Transition Rate 92.9 96.9 Transition Rate 98.0 95.0Gross Participation Rate 97.3 100.9 Gross Participation
Rate 88.1 89.0
Survival Rate 50.3 50.5 Survival Rate 66.8 53.4

Rapid Field Appraisal of Decentralization: Region 11
28
Province/City/Indicator
Year Province/City/Indicator
Year2002-03 2008-09 2002-03 2008-09
Davao del Sur Digos CityGraduation Rate 99.3 99.0 Graduation Rate 98.8 99.1Retention Rate 86.9 91.7 Retention Rate 93.2 93.3Drop-out Rate 13.2 0.3 Drop-out Rate 7.1 0.3Transition Rate 92.8 94.8 Transition Rate 98.3 97.6Gross Participation Rate 87.2 86.4 Gross Participation
Rate 89.6 82.1
Survival Rate 51.0 62.9 Survival Rate 66.9 56.3Tagum City 2003-04 Source: Department of Education,
Region 11 NSCB, 2009 Regional Social and
Economic Trends, Davao Region. NSCB, Davao City
Graduation Rate 99.6 99.7Retention Rate 94.7 98.0Drop-out Rate 6.1 0.1Transition Rate 99.7 101.4Gross Participation Rate 84.0 85.2
Survival Rate 80.6 70.7
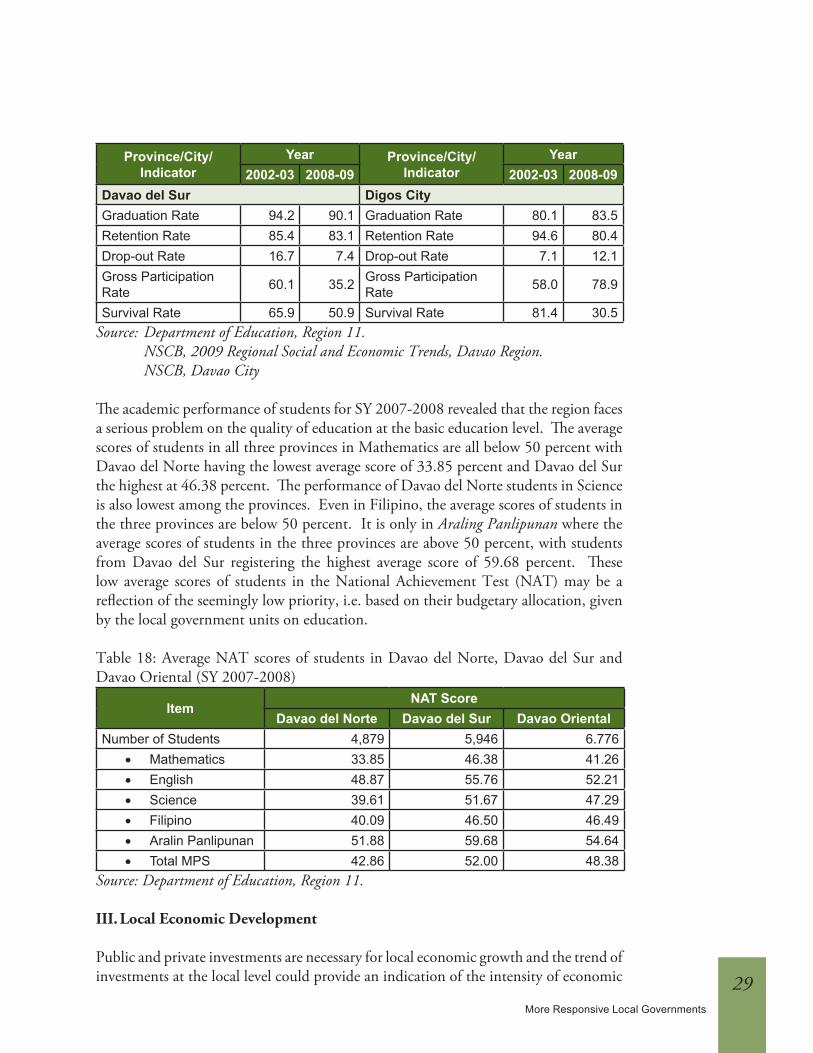
The performance indicators in public secondary schools also revealed a high graduation rate, and a declining drop-out rate, except for Digos City. The gross participation rate of the public secondary schools, however, is declining slightly in Davao Oriental and Davao del Norte, while alarmingly so in Davao del Sur. In SY 2008-09, only 35.2 percent of the school-age population for secondary level were in school there, compared to 60.1 percent in Davao Oriental and 52.6 percent in Davao del Norte (Table 17).
Table 17: Performance indicators in public secondary schools, by province/city, DavaoRegion (2002-2003 and 2008-2009)
Province/City/Indicator
Year Province/City/Indicator
Year2002-03 2008-09 2002-03 2008-09
Davao Oriental Davao del NorteGraduation Rate 94.4 94.5 Graduation Rate 88.3 91.0Retention Rate 86.4 86.7 Retention Rate 90.5 85.0Drop-out Rate 16.3 5.2 Drop-out Rate 10.8 5.2Gross Participation Rate 64.8 56.3 Gross Participation
Rate 68.3 52.6
Survival Rate 63.0 60.1 Survival Rate 70.6 53.1
More Responsive Local Governments
29
Province/City/Indicator
Year Province/City/Indicator
Year2002-03 2008-09 2002-03 2008-09
Davao del Sur Digos CityGraduation Rate 94.2 90.1 Graduation Rate 80.1 83.5Retention Rate 85.4 83.1 Retention Rate 94.6 80.4Drop-out Rate 16.7 7.4 Drop-out Rate 7.1 12.1Gross Participation Rate 60.1 35.2 Gross Participation
Rate 58.0 78.9
Survival Rate 65.9 50.9 Survival Rate 81.4 30.5Source: Department of Education, Region 11. NSCB, 2009 Regional Social and Economic Trends, Davao Region. NSCB, Davao City
The academic performance of students for SY 2007-2008 revealed that the region faces a serious problem on the quality of education at the basic education level. The average scores of students in all three provinces in Mathematics are all below 50 percent with Davao del Norte having the lowest average score of 33.85 percent and Davao del Sur the highest at 46.38 percent. The performance of Davao del Norte students in Science is also lowest among the provinces. Even in Filipino, the average scores of students in the three provinces are below 50 percent. It is only in Araling Panlipunan where the average scores of students in the three provinces are above 50 percent, with students from Davao del Sur registering the highest average score of 59.68 percent. These low average scores of students in the National Achievement Test (NAT) may be a reflection of the seemingly low priority, i.e. based on their budgetary allocation, given by the local government units on education.
Table 18: Average NAT scores of students in Davao del Norte, Davao del Sur and Davao Oriental (SY 2007-2008)
ItemNAT Score
Davao del Norte Davao del Sur Davao OrientalNumber of Students 4,879 5,946 6.776
• Mathematics 33.85 46.38 41.26• English 48.87 55.76 52.21• Science 39.61 51.67 47.29• Filipino 40.09 46.50 46.49• Aralin Panlipunan 51.88 59.68 54.64• Total MPS 42.86 52.00 48.38
Source: Department of Education, Region 11.
iii. Local Economic Development
Public and private investments are necessary for local economic growth and the trend of investments at the local level could provide an indication of the intensity of economic

Rapid Field Appraisal of Decentralization: Region 11
30
activities in a province, city or municipality. Data on private investments at the local level, however, were not available for this study, and so data on local government expenditures on economic services were used21. Table 19 shows the per capita local government expenditures for the years 2004, 2006, and 2008 of 12 LGUs surveyed. The data show that the component cities have the highest per capita expenditure on economic services, followed by municipalities with good location and access to markets. The provinces did not exhibit high per capita expenditure on economic services, partly because the population base is the whole province, which includes cities and municipalities. Nevertheless, the increasing per capita expenditures on economic services in the three cities and the relatively high per capita expenditures on economic services exhibited by the municipalities surveyed showed the commitment of the LGUs to launch their local economies to a higher growth path.
Table 19: Annual per capita expenditure of local governments on economic services in pesos (2004-2008)
Province/City/MunicipalityPer Capita Expenditure on Economic
Services in Philippine Pesos2004 2006 2008
Davao Oriental 163.91 91.76 134.42Davao del Norte 78.07 98.59 90.56Davao del Sur 68.89 47.53 85.23Digos City 274.86 365.02 413.48Mati City 74.15 550.80 450.04Tagum City 235.73 345.10 508.33Don Marcelino, Davao del Sur 138.22 136.54 154.02Sta. Cruz, Davao del Sur 186.58 163.77 218.76Asuncion, Davao del Norte 143.98 163.18 195.68Carmen, Davao del Norte 69.29 75.39 37.04Caraga, Davao Oriental 100.53 177.10 128.91San Isidro, Davao Oriental 168.29 282.90 212.47
Source of Basic Data: Bureau of Local Government Finance, Davao City NSCB, 2009 Regional Social and Economic Trends Davao Region, Davao City (for census population, 2000 and 2007).
Business and industry
A major objective of the LGUs is to develop their manufacturing sectors. To achieve this, key informants from the three cities and six municipalities surveyed reported that promotion of business and industries was done through their investment incentive
21 Expenditures on economic services include: the operation of agriculture office, extension services, demonstration /farm nurseries, operation of farm equipment pool, irrigation system, quality control of agricultural products, operation of tourism office, and operation of economic enterprises (public markets, slaughterhouse, water system, hospitals, agricultural development projects, tourism projects, industrial development projects, etc.)

More Responsive Local Governments
31
codes and zoning ordinances, as well as by providing assistance to prospective investors to their area. What appears to be a most crucial factor in attracting investments, besides providing assistance to prospective investors, is the presence of adequate infrastructure and utilities. Thus, an investment code that provides incentives will not attract investors if there are no roads, power supply, and water supply in the area. Location is also important. For example, Sta. Cruz is adjacent to Davao City and is at present attracting investors because the price of land in the municipality is relatively lower, and the local government is actively enticing industries to move to Sta. Cruz.
Partnerships between the LGUs and private investors and entrepreneurs are critical to the development of local industries. At the city level, this partnership is expressed by regular consultations between the local government and the local chamber of commerce and industries. But at the municipal level, where there are few business establishments, this partnership between the industry and the LGUs may take a more active form. For example, in Caraga, the LGU is actively promoting the development of the abaca industry by supporting the town’s indigenous abaca cloth weavers.
agriculture and Fisheries at the Provincial Level
By and large, the economies of the LGUs surveyed are agriculture-based. The development of agriculture and fisheries sector should be considered as a major objective of the LGUs. RA 7160, however, has an uneven effect at the local level, both on the administrative side and on the program aspect of agriculture and fisheries sector. On the organizational side, the key informants at the provincial level reported that the implementation of RA 7160 or the LGC caused intergovernmental coordination to become weak. While before devolution the province has administrative control on the agricultural office of municipalities, after devolution, that administrative control was no longer present. This lack of administrative control by the province on the municipal programs makes it difficult to implement a coordinated agriculture and fisheries program for the province. It was reported also that after decentralization, the feedback mechanism became weak and has no continuity with the old set-up22.
The effect of RA 7160 on the agriculture and fisheries programs varies according to the priority of the LCE. In the two provinces where the LCE has given agriculture top priority, the performance of the provincial agriculture office (PAGRO) may be considered exemplary. Thus, in Davao del Norte, the extension program of the province was not affected by devolution because agriculture is given top priority by the LCE of the province. Similarly, the high priority given by the Davao Oriental governor on agriculture and fisheries has made the PAGRO more dynamic. The same however could not be said for Davao del Sur.
22 This observation was validated by the MAGROs. The MAGROs said they could not be forced to follow the PAGRO. In fact, they could even ignore the PAGRO in certain instances. This may occur if there is a conflict of priorities between the province and the municipalities.

Rapid Field Appraisal of Decentralization: Region 11
32
In provinces where agriculture is one of the LCE’s top priorities, there is an active research program at the provincial agriculture office. In Davao del Norte where the two major thrusts of the province are food security and environmental protection in the upland areas, two research outputs of the PAGRO resulted in the establishment of planting season for crops to minimize the infestation of pest and diseases. This in turn minimized the use of pesticides and related agri-chemicals. The PAGRO has also conducted research on the application of fertilizer on rice plants to minimize the incidence of blight.
By comparison, key informants in Davao del Sur, where the LCE’s priority is not on agriculture, said that there was a significant downgrading of PAGRO research and extension programs. Agricultural researchers of the provincial agriculture office are working on different programs, and their expertise is not optimally used. Nevertheless, the provincial agriculture office is usually utilized by the DA to assist it in its research projects. Currently, the provincial agriculture office is assisting the DA conduct an ACIAR-funded research project on integrated pest management (IPM) on mango.
Insufficient funds for extension programs reduced significantly the mobility of extension workers and the supplies and materials they need. In addition, the change in the LCE priorities away from agricultural extension also shifts both manpower and limited financial resources of the provincial agriculture office to other programs of the local government. The problem was aggravated by the broken line connecting the provincial and the municipal agriculture offices. Accordingly, the provincial agriculture office could not communicate directly to its municipal counterparts. Activities of the provincial agriculture office at the municipal level have to pass the LCE’s approval. This may not create a problem if the priorities of the province and the municipality are convergent, and financial resources at the local level are not a constraint. However, the province and the municipalities usually differ in terms of priorities and financial resources, thus creating a bottleneck on the implementation of agricultural extension programs.
agriculture and Fisheries at the component city Level
Devolution has no significant effect on the remuneration and benefits of the devolved personnel of the component cities since they have adequate revenues. In fact, a key informant in Mati City said that the devolved personnel received more benefits now than before devolution.
Key informants, however, said that the working relationship between the provincial and the city agriculture offices has also changed. Before, there was a regular monthly meeting between the provincial and the city agriculture office; now the meeting is irregular. The PAGRO and CAGRO still work and collaborate on programs, but it is based more on previous personal relationship between the two offices.

More Responsive Local Governments
33
In addition, planning is now not based on the provincial plan, but on city needs and resources. The province now has to fit in the activities of the city and municipalities. There has been less coordination between the province and the city and municipalities after the implementation of RA 7160.
agriculture and Fisheries at the municipal Level
There is unanimity among the key informants interviewed at the municipal level that their relationship with the PAGRO has changed with decentralization or with the implementation of RA 7160. They said that under RA 7160, MAGRO is no longer under PAGRO. MAGRO, however, still provides the province with their reports, but it is not anymore compulsory.
The MAGROs also reported that the programs/projects of agriculture and fisheries sector before the implementation of LGC were continued after the implementation of the LGC. They said, though, that local funding for agriculture and fisheries activities became limited. In fact, it was reported that in some cases only about 50 percent of the projects proposed by the MAGROs were funded, and those that were funded essentially followed the LCE’s priorities. What the MAGROs usually did therefore is to inquire first how much the allocation for agriculture and fisheries would be, and then base their project proposals on this amount.
The common complaint of the MAGROs is their remuneration. MAGROs in lower class municipalities said that they have not received increases in remuneration enjoyed by their non-devolved colleagues in the DA. They also said that in some cases the salaries and benefits of devolved personnel in those municipalities were made to stay at the same level so that the salaries and benefits of non-devolved personnel could catch up.
Decentralization and incidence of Poverty
The goal level impact of development policies or programs is generally measured by the effects of the said policies or programs on the incidence of poverty in a given area. The LGC is one of the policies of the government that specifically declares that “territorial and political subdivisions of the State shall enjoy genuine and meaningful autonomy to enable them to attain their fullest development as self-reliant communities and make them more effective partners in the attainment of national goals” (LGC 1991, Section 2). The LGC’s scope provides the LGUs with enormous potential to develop their area of responsibility. Basically, this is because with the LGC, the LGUs could harness local and non-local resources to implement their development programs and projects. In other words, the LGC, among others, enables the LGUs to plan, implement, and coordinate all development activities in their area. Because of this broad coverage of the LGC, this study used the incidence of poverty and related indicators to measure the overall impact of decentralization at the local level.

Rapid Field Appraisal of Decentralization: Region 11
34
Estimates on incidence of poverty at the sub-national level are available only at the regional level before and after 1991. The estimates of poverty incidence at the provincial level are available for 2003 and 2006 and for the municipal level only for 2003.
incidence of Poverty at the Provincial and municipal Level Estimates on poverty incidence at the provincial level for the years 2003 and 2006 showed that incidence of poverty among families and among population have increased considerably in Davao del Norte, with poverty incidence among families increasing from 30.3 percent in 2003 to 37.7 percent in 2006, while poverty incidence among population increased from 36.8 percent in 2003 to 44.8 percent in 2006. In contrast, the incidence of poverty among families has declined slightly in Davao del Sur, from 24.2 percent in 2003 to 23 percent in 2006, and on poverty among population from 28.9 percent in 2003 to 27.4 percent in 2006 (Table 20). Note, however, that Davao City was included in Davao del Sur in the computation for incidence of poverty; hence, it is possible that the decline of poverty incidence in Davao del Sur could be due to the influence of Davao City.
Poverty incidence among families in Davao Oriental also registered a slight increase, from 37.2 percent in 2003 to 40.8 percent in 2006, and on incidence of poverty among population from 47.9 percent in 2003 to 48.8 percent in 2006. Poverty incidence in Davao Oriental is highest among the three provinces studied. The lowest poverty incidence figure was posted by Davao del Sur.
Table 20: Incidence of poverty at the provincial level, Davao Region (2003 and 2006)
Region/ProvincePoverty Incidence Among
Families (%)Poverty Incidence Among
Population (%)2003 2006 2003 2006
Davao Region 28.5 30.6 34.7 36.6Davao del Norte 30.3 37.7 36.8 44.8Davao del Sur 24.2 23.0 28.9 27.4Davao Oriental 37.2 40.8 47.9 48.8Compostela Valley 34.4 39.8 41.9 47.1
Source: NSCB, Philippine Statistical Yearbook 2008
At present, the only available estimate of the incidence of poverty at the municipal level is for 2003. Table 21 presents the poverty incidence among population, poverty gap, and the severity of poverty23 in the municipalities and component cities covered
23 Poverty among population is a head-count index that simply measures the proportion of the population that is counted as poor. Poverty gap is the extent to which individuals on the average fall below the poverty line and expresses it as a percentage of the poverty line. Severity of poverty is simply a weighted sum of poverty gaps (as a proportion of the poverty line), where the weights are the proportionate poverty gaps themselves. This is in contrast with the poverty gap index where they are weighted equally. See: World Bank Institute (2005), Introduction to Poverty Analysis. World Bank, Washington, D.C.

More Responsive Local Governments
35
by the study. The data show Don Marcelino as having the highest poverty incidence among population, with 80.75 percent in 2003, which translates to about 81 out of 100 people there having an income below the poverty threshold.24 Next is Caraga, with 57.31 percent, followed by Asuncion (44.94 percent) and San Isidro (44.57 percent). The lowest poverty incidence is found in Tagum City, with 15.4 percent, followed by Digos City with 18.22 percent. Incidentally, Don Marcelino has also the highest poverty gap index and severity of poverty index among the municipalities and cities covered by the study.
A key informant interviewed in Don Marcelino said that segments of the town’s population whose incomes are below poverty level are those living inland – that is, those living in the mountainous areas of the municipality and are mainly composed of indigenous people. Interestingly, the paved road to Don Marcelino ends a short distance from the poblacion of the town of Malita. From Malita to Don Marcelino it is all rough road. Don Marcelino is about 95 kilometers from Digos City. Coincidentally, Caraga, which has the second highest poverty incidence among the municipalities and cities studied, is also mountainous and about 70 kilometers from Mati City, the capital of Davao Oriental. The road from Mati City to Caraga is all paved. The major crop of Don Marcelino and Caraga is coconut. They are also shoreline municipalities, hence fishing is an alternative livelihood of most families.
Table 21: Incidence of poverty at the municipal level, Davao Region (2003)
Municipality Poverty Incidence Among Population (%)
Poverty Gap (%)
Severity of Poverty (%)
Digos City, Davao del Sur 18.22 4.53 1.64Don Marcelino, Davao del Sur 80.75 34.10 17.47Sta. Cruz, Davao del Sur 28.69 7.97 3.17Tagum City, Davao del Norte 15.40 3.60 1.25Carmen, Davao del Norte 32.07 8.29 3.06Asuncion, Davao del Norte 44.94 13.08 5.22Mati City, Davao Oriental 32.14 9.07 3.62San Isidro, Davao Oriental 44.57 14.10 6.06Caraga, Davao Oriental 57.31 18.95 8.25
Source: NSCB, Small Area Poverty Estimates, 2003
Among the municipalities that registered a relatively high poverty incidence, only Asuncion is located inland. It is also located adjacent to Tagum City. The major crops of Asuncion are bananas and rice. Key informants from MAGRO said that there has been some conversion of rice farms to bananas recently.
24 The 2003 poverty threshold for the Province of Davao del Sur is P11,470; for Davao del Norte, P11,833; and for Davao Oriental P10,580. See: NSCB, 2008 Philippine Statistical Yearbook. NSCB, Makati City, Philippines.

Rapid Field Appraisal of Decentralization: Region 11
36
cONcLuSiON
Although the prevailing opinion among policy makers at the local level is that RA 7160 or decentralization has a positive effect at the local level development, the result of this study showed that the effects of decentralization has been mixed and uneven. On the positive side, local autonomy has developed leaders at the local level to become more innovative in exploring the advantages of devolution. Accordingly, local legislators and officials are generally open to learn from their colleagues, i.e. from other provinces/cities/ municipalities about successful projects or of new technologies their colleagues have successfully applied to find out whether those new innovations could be replicated in their area25.
It is noted, however, that the resource endowment of provinces/cities/municipalities was not equal to begin with, that is, some are rich in resources and some have the advantages of location or designation (i.e. city) or class (i.e. first class, second class or third class municipality). Unfortunately, what came out from the study is that the rich province/city/municipality has a greater opportunity to become richer, while the poor province/city/municipality may remain poor or become poorer. The major reason for this appears to be the present formula for the sharing of the IRA. The present formula for the IRA does not take into consideration the varying capacity of the local government units to generate local revenues. For example, Don Marcelino has very little potential to generate local revenues because there are very few businesses there. This in turn is because of its location and the state of its infrastructure and utilities. By comparison, Tagum City could generate more local revenues because its strategic location and the presence of adequate infrastructure and utilities attract businesses. At the same time, because employment and the amenities of urban centers attract migrants, the population growth differentials of cities and municipalities indicate that the poor municipalities are experiencing rapid out-migration and the cities are absorbing these migrants. This will tend to further increase the IRA of cities, while lessening those for poor municipalities.
A close examination of the structure of local government expenditures revealed that, in general, a large portion of the LGU budgets were spent on systems maintenance. It is also apparent that based only on per capita expenditure, the LGUs placed lower priority on education, housing, and community development. The low priority on education may be related to the low performance of students in the NAT. Because quality education is critical to the development of the region’s human capital, the long-term effects of the neglect of education may take some time to reverse.
25 To facilitate and promote the transfer of these best practices, the DILG published Kaban Galing: The Philippine case Bank on innovation and Exemplary Practices in Local Governance and encourage the study visits of local executives to cities and municipalities which implemented those programs.

More Responsive Local Governments
37
Although RA 7160 could have a positive impact on LGU management capacity, it poses difficulties in the management of inter-local government bodies specifically when the desire is to have horizontal and vertical consistency of development policies. This is because local governments may have different or divergent priorities. One LCE even said that it is now difficult to have a unified development direction for the province. In fact, the situation may be even more difficult when the governor and the mayors belong to different political parties.
A similar problem surfaced in one of the devolved national agencies. Decentralization has made the municipal agriculture offices practically autonomous from the provincial agriculture office. As a result, the agriculture programs of a province have become fragmented. Basically, this is because the LCEs of municipalities may have different priorities from that of the province or even the region and therefore will have different resource allocations compared to what is desired by, say, those at the provincial level. The lack of convergence on common priorities like food security, watershed protection and conservation, marine resources management, among others, may have an untoward effects on the over all welfare of a province or region.
It is obvious that decentralization, in spite of its promise, is never a panacea for development problems at the local level. Yet it is never too late to make some adjustments so that it could accomplish what it aims to attain.

Rapid Field Appraisal of Decentralization: Region 11
38
GOOD PRACTICESSta. Cruz, Davao del Sur
Mangrove Forest Replanting andCoastal Clean-up through Multi-sectoral Collaboration
The mangrove forest replanting and coastal clean-up was initiated by the municipality of Sta. Cruz in 2005 to reverse the destruction of the town’s mangrove areas, which was compromising the sustainability of its fish and marine resources. In consultation with the Bureau of Fisheries and Aquatic Resources (BFAR) and the Department of Environment and Natural Resources (DENR), the local government formulated a project to replant the mangrove area and solicited the participation of students, business enterprises, national government agencies, and the barangays to implement the project.
The stakeholders that actively participated in the project were the barangay local governments of Barangay Zone 2, Barangay Zone 3, and Barangay Bato; the Municipal Environment and Natural Resources Office (MENRO); Sta. Cruz National High School; and, San Miguel Corporation. Both the Municipal Agriculture Office (MAGRO) and the MENRO provided technical assistance and planting materials while San Miguel Corporation contributed food during the planting of mangrove seedlings and coastal clean-up. All organizations contributed manpower.
The total annual budget of MAGRO for the implementation of the project is P15,000. The project’s annual cost, however, may increase considerably if the man-days or man-hours contributed by students, the employees of San Miguel Corporation, and the community members who participate in the regular coastal clean-up and the planting of mangrove seedling are added up. Because the MAGRO is the lead agency, it is the one that organizes the coastal clean-up and planting activities.
The project is a success. Its most important output was the mobilization of stakeholders to address a problem that is affecting one of the main livelihoods of a number of households in the community. It also mobilized the community to confront the problem of pollution of the municipal beaches. At present, an estimated five hectares of mangrove areas have been replanted. But it was observed that some of the mangrove seedlings died. The major causes why the seedlings did not thrive are: (a) there are households near the shore line that dispose their garbage on the newly planted mangrove area, and (b) some fishermen land their boats on portions of the newly planted mangrove areas, thereby killing some of the mangrove seedlings. The MAGRO, however, is optimistic that these could be controlled by educating and informing the fisherfolk and the families living on the shore line on the role of the mangrove forest in increasing the fish population, preventing soil erosion, and acting as a barrier to tidal surges.
A number of lessons could be derived from the project. First, it is possible to mobilize the community and private business enterprises to participate actively

More Responsive Local Governments
39
in projects that have no direct monetary benefits to most of the stakeholders. Second, the participation of students is highly significant, since this will ensure a long term ownership of the project. Third, the incidence of households disposing their garbage on the newly planted mangrove areas underlined the importance of massive community information drives on the importance and the role of the project on the food supply of the community.
GOOD PRACTICEAsuncion, Davao del Norte
Community Blood Letting Project
The incidence of dengue hemorrhagic fever (DHF) in the Davao region increases during the rainy season. Asuncion, which has a large lowland area, provides an excellent breeding ground for mosquitoes that carry the dengue virus. Medical literature notes that the cure for dengue is essentially symptomatic, i.e. medicines to relieve pain and fever are usually the ones administered. DHF, however, could become fatal especially among children. In most cases, patients need blood transfusion to overcome the virus. Usually, though, it is very difficult to obtain blood. The municipality of Asuncion resolved to build up a safe blood supply, encouraging municipal officials and employees to donate blood for the project. The donated blood is stored in a blood bank.
The project did not cost the local government any money. In fact there is no budget for the project, which has since been credited for having helped save a number of patients, especially those who got sick with dengue hemorrhagic fever. The municipality has received a national award for its Community Blood Letting Project.
For municipalities, even those which have no incidence of dengue hemorrhagic fever, a community blood-letting project is an attractive and highly beneficial project to replicate. It entails minimal cost to implement while providing an assurance that if someone in the community needs blood transfusion, there is a ready supply to depend on.
GOOD PRACTICEDavao del Norte
Establishment of Planting Season forCrops to Minimize Infestation of Pest and Diseases
Application of agrichemicals to control crop pest and diseases not only reduces the profit of farmers by increasing their cost of production, it is also considered dangerous to health because of chemical residues on farm produce.

Rapid Field Appraisal of Decentralization: Region 11
40
Research conducted by the PAGRO of Davao del Norte showed that the use of agrichemicals on crops could be minimized by establishing planting seasons for a particular crop.
The province is now advising rice farmers on the proper planting season to follow to minimize the use of pesticides and related agrichemicals. PAGRO has also advised farmers on the proper application of fertilizers to rice plants to minimize the incidence of blight.
Local governments in the region should take note of the lead of the Davao del Norte PAGRO on establishing planting seasons for crops to minimize the use of agrichemicals. This will not only reduce the cost of production of crops, it will also make safer the food that people consume.
It needs verification, however, if the planting seasons established by PAGRO in Davao del Norte apply to other provinces in the region. It may be necessary therefore to pilot the planting seasons in a municipality of another province to verify its applicability.
The establishment of planting seasons for agricultural crops in a province underlines the importance of research to solve production problems. It also highlights the importance of translating the results of research into programs that will benefit the community.

More Responsive Local Governments
41
rEFErENcES:
Asian Development Bank. 1995. Governance: Sound Development Management, Manila: ADB.
Department of Interior and Local Government. 2002. Kaban Galing: The Philippine Case Bank on Innovation and Exemplary Practices in Local Governance, (2001 Edition), Manila.
Government of Davao del Norte. 2009. Provincial Development and Physical Framework Plan 2008-2013. Tagum City.
Government of Davao Oriental. 2010. Provincial Development and Physical Framework Plan of Davao Oriental 2010-2020. Mati City.
Milwida M. Guevarra, “The Fiscal Decentralization Process in the Philippines: Lessons from Experience.” Accessed: April 12, 2010. http://www.econ.hit-u.ac.jp/~kokyo/APPPsympo04/Philippine-Guevara.pdf
National Statistical Coordination Board, 2009 Regional Social and Economic Trends, Davao Region, Davao City.
National Statistical Coordination Board, 2004 Philippine Statistical Yearbook.
National Statistical Coordination Board, 2008 Philippine Statistical Yearbook.
National Statistical Coordination Board. 2003. Small Area Poverty Incidence Estimates (soft copy).
National Statistics Office, 2007 Census of Population.
Provincial Planning and Development Office. 2005. Socio-economic and Physical Profile of Davao del Sur, 2001-2005. Digos City
Rosario G. Manasan, “Fiscal Implications of the Local Government Code of 1991,” Journal of Philippine Development, No. 34, Vol. XIX, No. 1, First Semester 1992.
World Bank Institute. 2005. Introduction to Poverty Analysis. World Bank, Washington, D.C.
World Bank. 2007. “Strengthening World Bank Group Engagement on Governance and Anti-Corruption.” http://www.worldbank.org/html/extdr/comment/governancefeedback/gacpaper-03212007.pdf

Rapid Field Appraisal of Decentralization: Region 11
42

About the WriterDr. Edmund B. Prantilla is an economist by education and profession.
He earned his Ph.D. in Economics from Iowa State University, USA, and Master of Science in Agricultural Economics from the University
of the Philippines in Los Baños. He has broad experience working with local and international organizations in the areas of policy and planning
for agriculture, rural development, local development and regional development. He held the position of Regional Executive Director of the National Economic and Development Authority for Southern Mindanao
Region from 1974 to 1979. With his vast knowledge, he led many foreign-funded studies in Mindanao including an impact assessment study of the Transparent Accountable Governance program in 2007. Currently,
he devotes his time teaching as a Professorial Lecturer at the University of Southeastern Philippines in Davao City, where he also served as the
University President from 1993 to 2001.